Abstract
The past few years have witnessed a wider adoption of Internet of Things (IoT) devices. Since IoT devices are usually deployed in an open and uncertain environment, device authentication is of great importance. However, traditional device fingerprint (DF) extraction methods have several disadvantages. First, existing DF extraction methods need private information from devices to compute DFs, which puts the privacy of devices at stake. Second, the manually designing features-based methods suffer from poor performance. To tackle these limitations, we propose a Linear Residual Neural Network-based DF extraction method, Res-DFNN, which utilizes network packet data in the pcap file to generate DF. The key block is designed according to symmetry, and it is verified by simulation that our method achieves better performance in both non-private and privacy-preserving scenarios.
1. Introduction
The Internet of Things (IoT) is an emerging technology that utilizes network connectivity to link physical objects, providing users with real-time monitoring, control, and management services [1]. In recent years, the development of IoT has accelerated, leading to widespread adoption worldwide. According to the latest statistics, the global count of IoT devices has surpassed 1.5 billion, with active deployments in commercial, industrial, government, and various other sectors [2]. Notably, some IoT applications are critical in sectors such as military, healthcare, transportation, and manufacturing, raising significant security concerns [3].
IoT Device Fingerprint (DF) identification technology aims to improve the identification and tracking capabilities of IoT devices by assigning them unique fingerprints. This enhancement ensures secure and reliable network connections and effective system management. Due to its potential to assist enterprises in establishing robust security systems and mitigating security risks, DF extraction technology has gained significant attention as a research hotspot in recent times [4].
In this paper, we introduce a novel method for extracting DF, known as Res-DFNN. It plays a crucial role in identifying devices based on their network packet data, serving as the initial and essential step in the detection of anomalous behaviors. This method classifies device behaviors at the individual packet level by utilizing generalizable features. Consequently, it possesses the capability to detect various types of devices without encountering transfer-related challenges [5]. The key contributions of this work are as follows:
- We propose a novel DF extraction method, Res-DFNN, which utilizes network packet data to uniquely identify IoT devices. Our method does not depend on a MAC/IP address, which means it is more generalizable. As demonstrated in Section 5, Res-DFNN achieves better performance compared to previous DF extraction methods. The feature extraction block of RES-DFNN embodies the concept of symmetry, a crucial aspect as demonstrated in Section 5.6;
- We construct a system model with two scenarios based on the presence of private data and conduct experiments for each scenario. The results consistently show that Res-DFNN outperforms other methods in both scenarios, indicating its ability to maintain device privacy while delivering excellent performance;
- Due to the well-designed residual connections, Res-DFNN offers highly customizable model depth. This adaptability allows for a more generalized model structure, making Res-DFNN better suited to accommodate changes in feature sets and datasets;
- We rigorously evaluate the effectiveness of Res-DFNN through a series of diverse experiments. We strictly segregate the training and test datasets and repeat the experiments 20 times. Consequently, the results presented in this paper are realistic and precise.
2. Related Work
With the rapid development of Internet of Things (IoT) technology and the continuous expansion in the adoption of IoT devices, device fingerprinting (DF) technology has garnered significant attention from both the research and industrial communities. This section will review existing methods for generating DF, primarily categorizing them into behavior-based DF extraction methods and non-behavior-based DF extraction methods.
Behavior-based DF extraction methods employ information from the header and payload data of network packets to simulate device behavior, thereby achieving DF extraction. In contrast, non-behavior-based DF extraction methods distinguish between devices by exploiting variations in various attributes within network traffic. This paper falls into the former category, but with some distinctions. The method proposed in this paper is tested in two different scenarios, depending on whether payload information is utilized, as described in Section 4.1. In the Semi-knowledge scenario, device privacy is well preserved. Meanwhile, our method uses only a single network packet to extract DF, which is suitable for data scarcity in practical applications
2.1. Behavior-Based DF Extraction Methods
Mazhar et al. [6] comprehensively describe IoT traffic, considering time patterns, quantities, and destination endpoints, while addressing security and privacy concerns to extract DF. Miettinen et al.’s IoTSentinel system [4] identifies vulnerable devices through network traffic analysis, creating unique fingerprints for each device based on 23 features extracted from the initial 12 data packets of 31 devices, resulting in 276-value fingerprints used for device recognition. Bezawada et al. introduced the IoTSense [7] model, which incorporated 17 protocol-based features from IoTSentinel research and added three payload-related features. This model forms fingerprints with 100 members by applying this feature list to five data packets for each device. More recently, Kostas et al. [5] presented a machine learning-based IoT device identification method known as IoTDevID. They employed a rigorous ensemble of feature selection techniques and a genetic algorithm to eliminate redundant features and select the most relevant feature set. From a broader and more practical perspective, IoTDevID achieves high identification accuracy for IoT devices at the packet level.
2.2. Non-Behavior-Based DF Extraction Methods
Aneja et al. [8] collected data packets using a packet sniffer application and generated Inter-Arrival Time (IAT) graphs for each packet. They extracted features from these IAT graphs using convolutional neural networks to create DF. Noguchi et al. [9] introduced an automatic device recognition architecture that identifies devices based on time-varying patterns of feature quantities extracted from device-transmitted signals, serving as identifiers for individual data packets. Guo et al. [10] identified devices of the same type from network traffic by observing server IP addresses or server names in DNS requests from specific IoT devices. Samuel et al.’s AuDI method [11] initially extracted periodic features from device network traffic and then employed K-nearest neighbors (KNN) for IoT device classification. Sivanathan et al. [12] used a multi-stage classifier for IoT device classification, training the classifier with data from 28 IoT devices over 1 to 16 days. Fan et al.’s AutoIoT [13] employed a semi-supervised learning approach to design a classifier, creating compact clusters for each class with limited labeled data. They updated the model based on traffic features of new device types for self-updating in an open environment. Franklin et al. [14] proposed a passive fingerprint recognition technique that generated fingerprints based on the statistical analysis of the rate of common 802.11 data link layer frames transmitted by wireless devices. Charyyev et al. [15] introduced a device fingerprint generation method using Nilsimsa hashing to produce a hashed output for network data packets. Aksoy et al.’s SysID method [16] determined significant feature subsets in device fingerprints for device identification. They used a genetic algorithm based on a single data packet from the device, followed by deploying various machine learning algorithms for host device type classification through feature selection using an analytical genetic algorithm.
3. Background
3.1. Behavior Data
Device behavior data can be collected through various methods. Depending on whether there is an external device to monitor the device’s behavior, we can categorize the sources of behavior into two main categories: externally collected behavior data and in-device behavior data [17]. Our work falls into the former category. More specifically, network communications and emitted electromagnetic signals are the primary sources that are utilized as externally collected behavior data. Our primary focus is on network communication data, particularly packet capture (pcap) files.
From the network communications perspective, a wide range of behavioral features can be extracted through the monitoring of network packets. These features depend on the granularity of traffic inspection and the TCP/IP layers that are collected. The primary advantage of this approach lies in its universality, as nearly every device is equipped with network interfaces, and it offers the potential to monitor multiple devices through a single gateway.
Another essential feature is payload information. Following [5], payload information could be introduced by two features: payload length and payload entropy. Payload length represents the length of the payload carried within a TCP/UDP message. This feature varies significantly between different devices and is more distinctive than packet length. Payload entropy provides an indication of the information carried within a packet, which correlates with message types and sizes. It is defined using Shannon entropy, where the payload entropy of an m-byte sequence with a symbol length of 8 bits is calculated using the following formula:
Here, represents the probability of the occurrence of byte value i in the m bytes, i.e., . This feature characterizes the nature of the data rather than the data itself. Nevertheless, payload information is linked to device privacy and is typically safeguarded through encryption methods.
MAC/IP address: A MAC address is a unique identifier assigned to a network interface controller for communications at the data link layer of a network segment, also known as a hardware address or physical address. An IP address, on the other hand, is a numerical label assigned to each device connected to a computer network that uses the Internet Protocol for communication. While they serve as unique identifiers for devices, there are some inherent issues with them [5]:
- In practical applications, IoT devices utilizing low-energy protocols (e.g., Bluetooth, ZigBee, or ZWave.) often connect to a gateway where data are collected through other devices. Consequently, these devices lack individual identifying features such as their own MAC/IP addresses, instead utilizing the IP/MAC addresses of the devices they communicate through. Thus, MAC/IP addresses are no longer able to identify these devices.
- MAC/IP addresses function as source-destination-based identifying features. Although they uniquely identify the source and destination devices, they are not predictable and generalizable. They do not provide information about device behaviors. For instance, two devices exhibiting the same behavior may possess different MAC and IP addresses.
As a result, recent research in DF [5] has excluded MAC/IP addresses from their feature sets. Subsequent analysis has revealed additional benefits to excluding MAC/IP addresses from the behavior feature set:
- By analyzing deeper behavioral characteristics beyond MAC/IP addresses, DF methods can help detect and mitigate risks associated with spoofed or cloned devices in the network.
- MAC/IP addresses are subject to change due to network reconfigurations, dynamic IP assignment, or network address translation. DF techniques that do not rely on these identifiers offer more robust and persistent device identification, even in dynamic network environments.
- Removing IP and MAC information from DF processes enhances user privacy and data security, ensuring compliance with privacy regulations like GDPR [18]. This is particularly important in environments where user consent and data protection are paramount.
Excluding MAC/IP addresses will thus result in a more generalized DF method. Moreover, in scenarios where MAC/IP addresses can uniquely identify devices, our method can still effectively detect whether those devices have been spoofed or cloned.
3.2. Residual Network
The task of fingerprint extraction necessitates a model with robust feature extraction capabilities. Deeper networks tend to outperform shallow ones, but they also face issues such as gradient vanishing and gradient explosion. To address these challenges, the concept of residual connections was introduced.
Residual connections were first proposed by He et al. [19]. Each residual block consists of a convolutional layer followed by batch normalization, a ReLU activation, a second convolutional layer, and a second batch normalization. Subsequently, a second ReLU function is applied after adding this block back to the primary representation. This architecture is referred to as ResNet v1. He et al. [20] explored various variations of residual architectures, including options where processing could be applied along the skip connection or after the two branches had recombined. Their findings indicated that neither of these variations were necessary, resulting in the development of the pre-activation residual block, which forms the backbone of ResNet v2. Over time, new techniques for regularization, optimization, and data augmentation have emerged, and Wightman et al. [21] incorporated these advancements into a more contemporary training pipeline for the ResNet architecture.
Residual networks undoubtedly enable the training of deeper networks, presumably by mitigating the issue of shattered gradients [22] at the outset of training and creating a smoother loss surface near the minima. Residual connections alone (i.e., without batch normalization) approximately double a network’s trainable depth [23]. When combined with batch normalization, it becomes feasible to train extremely deep networks. One possible explanation for this phenomenon is that residual connections can eliminate singularities, which are locations on the loss surface where the Hessian matrix becomes degenerate [24].
In our work, we leverage residual connections to construct a deep network; the details will be discussed in Section 4.
3.3. Deep Embedding
Many research areas leverage deep embedding techniques to create fingerprints, such as voiceprints [25,26,27] in speaker verification and faceprints [28,29] in face recognition. Typically, the general workflow involves the development of a feature extractor and a classifier. Subsequently, a suitable objective function is designed to classify samples of different types. After extensive training, the network becomes proficient at correctly classifying samples, and the embedding obtained before the classifier serves as the fingerprint.
The effectiveness of a neural network is heavily reliant on the chosen objective function (loss function). Fingerprint extraction systems typically employ classification-based objective functions. Before delving into these objective functions, it is helpful to conceptualize the fingerprint extraction system as a multi-class classification problem, which can be summarized as follows:
Let represent the training samples within a batch, where denotes the input at the last fully connected layer, denotes the class label of , with J representing the number of class labels in the training set, and N indicating the batch size. Additionally, and denote the weight matrix and bias vector of the last fully connected layer, respectively.
The softmax loss [30] is the most commonly used objective function for multi-class classification and can be defined as follows:
However, the softmax loss is primarily focused on maximizing the between-class distance and lacks an explicit constraint on minimizing within-class variance [31]. This limitation makes it suboptimal for fingerprint extraction systems. To address this issue, the additive angular margin (AAM) loss [32] has been proposed, which explicitly increases the distance between classes.
In our work, we follow a similar workflow to develop device fingerprints. The detailed model structure and objective function will be discussed in Section 4.
4. Materials and Methods
4.1. System Model
We assume that the detector is presented with a single network packet and aims to derive a unique Device Fingerprint (DF) from it, which can assist in identifying the brand and model of the sender. Since payload information is typically protected using encryption methods, we will investigate the following two scenarios separately, taking into account the varying capabilities of the detector:
- Full-knowledge. In this scenario, the detector has complete access to the network packet and can extract information from the payload data.
- Semi-knowledge. In this scenario, the detector does not have access to the payload data. Instead, they can only extract a DF based on the information available in the packet header. This approach ensures the sender’s private data remains intact.
4.2. IoT Dataset
The UNSW IoT Traffic Traces dataset [12] continually logs the network activities of 28 IoT devices over a span of 26 weeks. However, it is important to note that the current open-source version of this dataset only includes logs spanning 60 days. To create a more realistic representation of real-world IoT scenarios, we have expanded the device categories by incorporating data from another study [33] recorded in a similar manner. The resulting dataset, which we refer to as the UNSW dataset, comprises a total of thirty-two IoT devices and seven non-IoT devices. This dataset serves as the basis for evaluating and comparing our DF extraction methods. Consistent with previous research [5,12], we have grouped these non-IoT devices into a single category. Consequently, the dataset now encompasses a total of 33 labels.
4.3. Model Structure
4.3.1. Overview
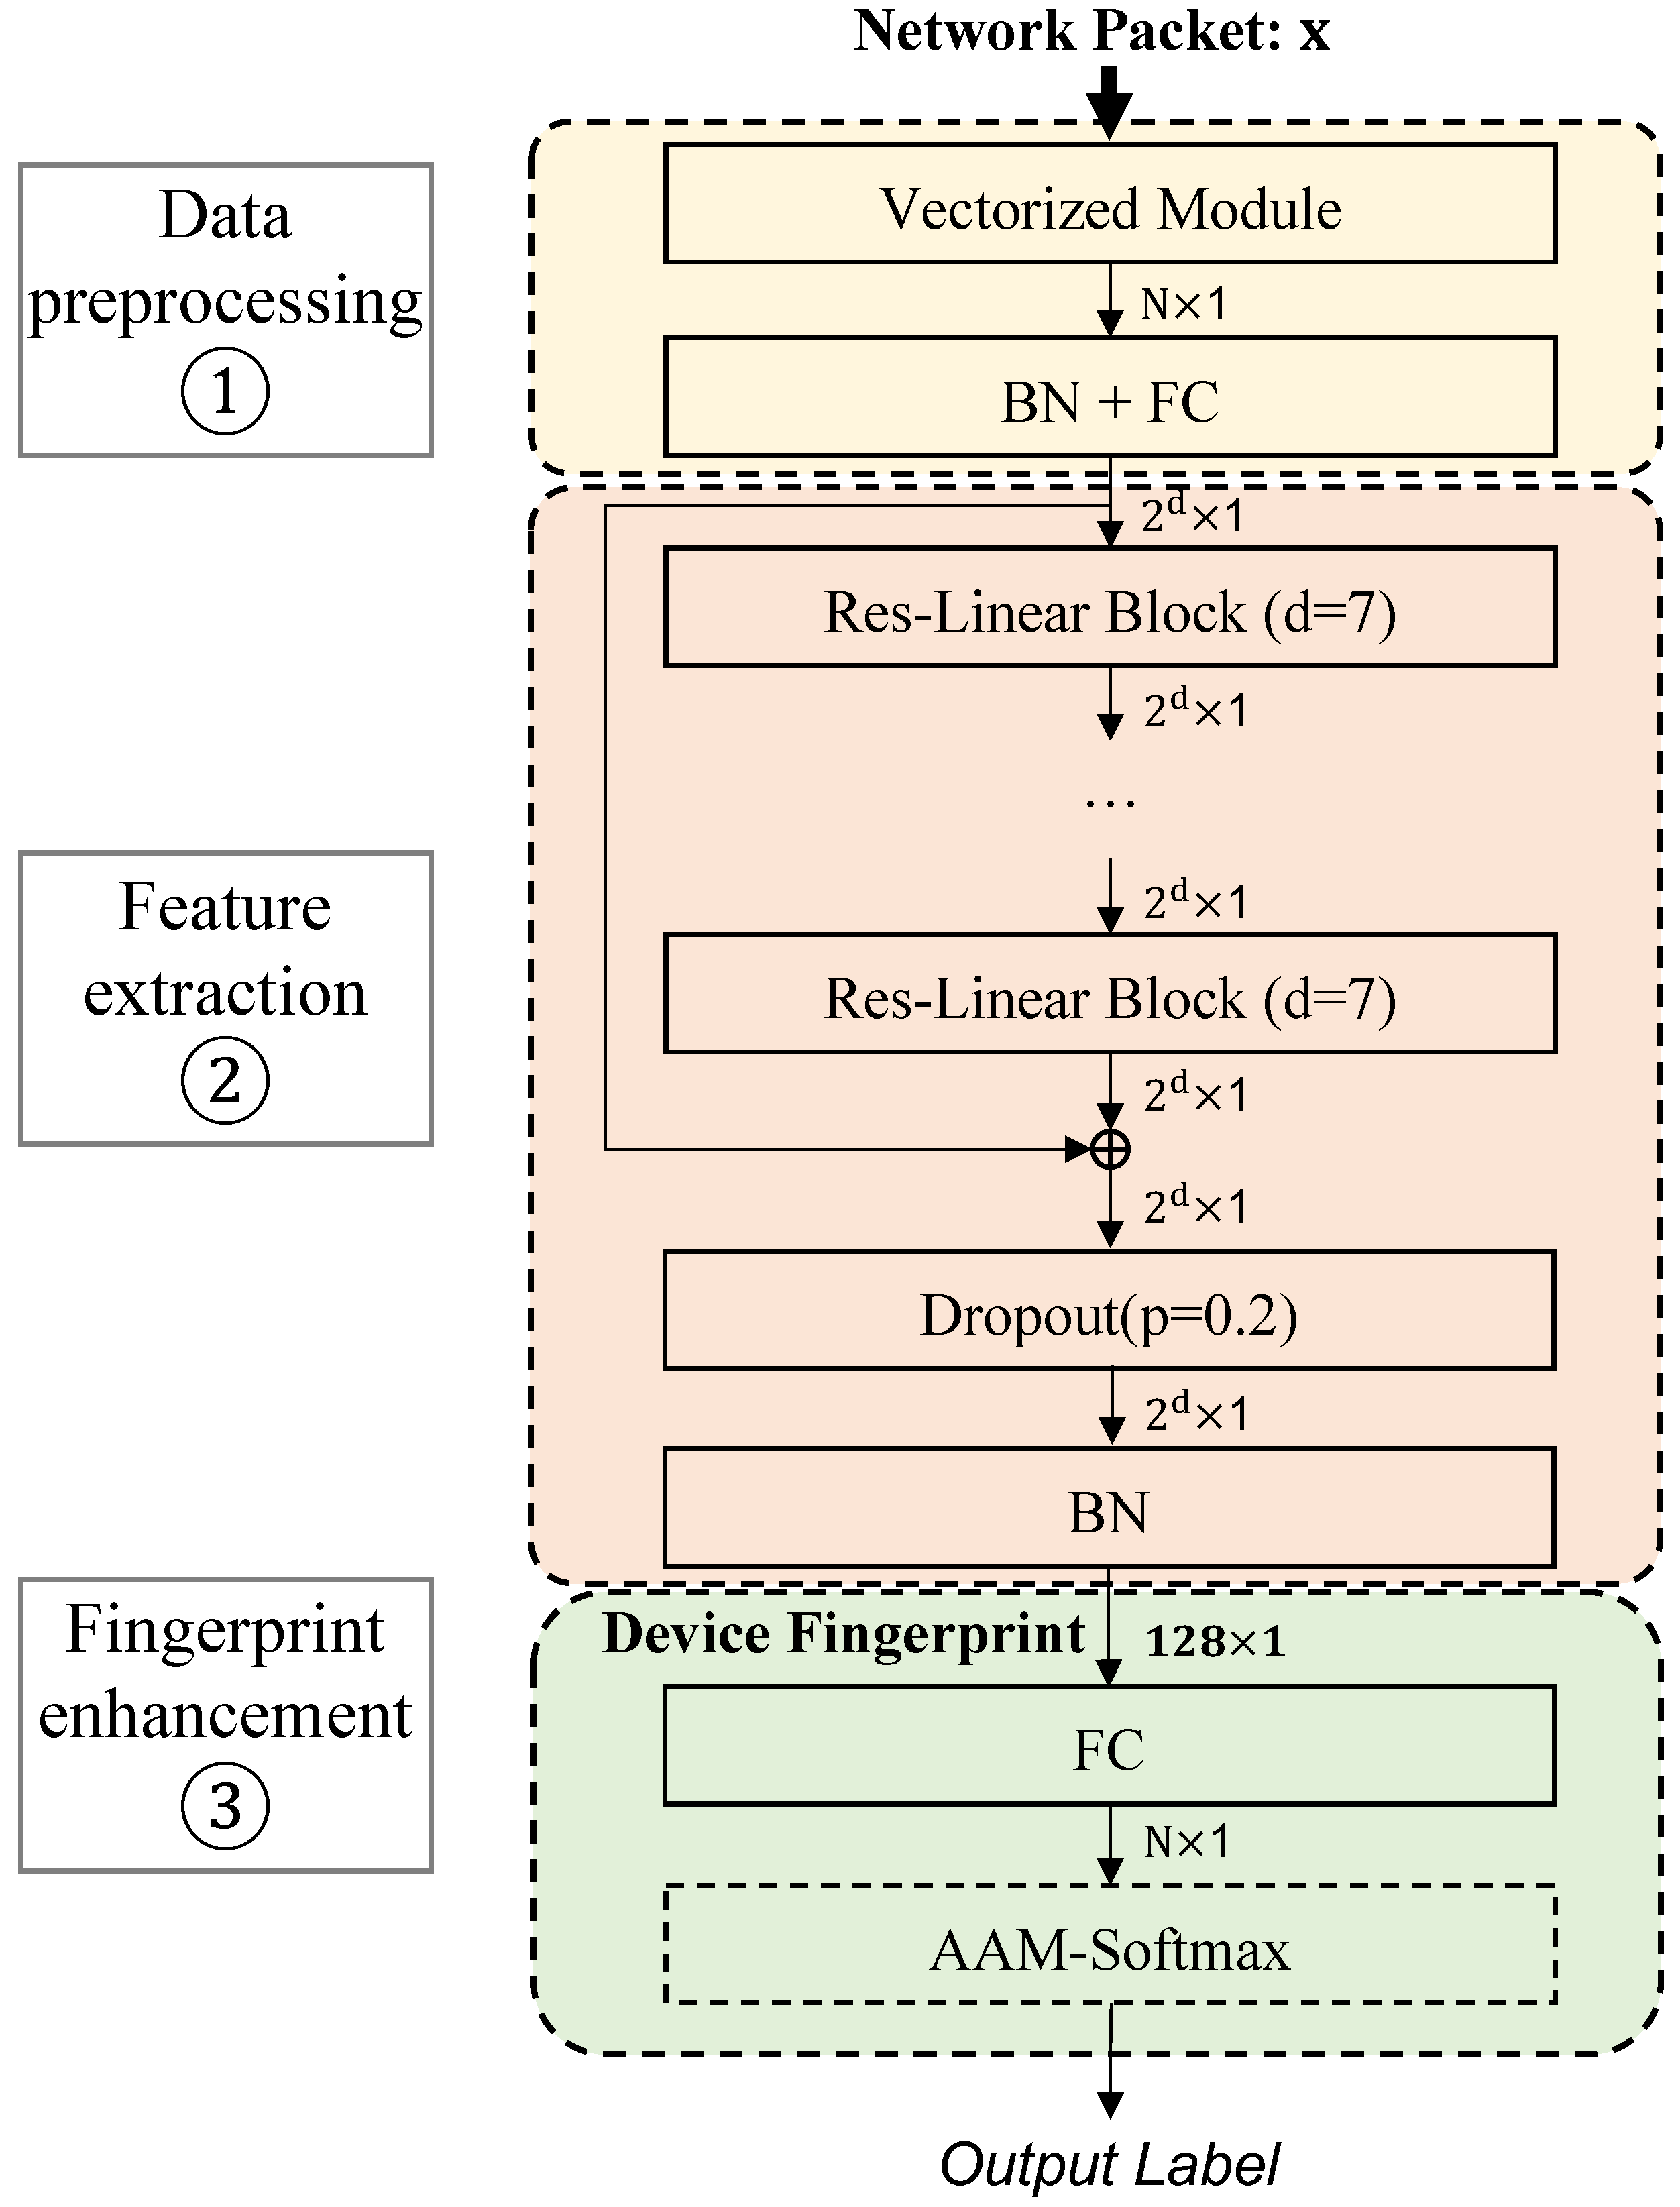
As shown in Figure 1, the Device Fingerprint Extraction model, Res-DFNN, is comprised of three key blocks:
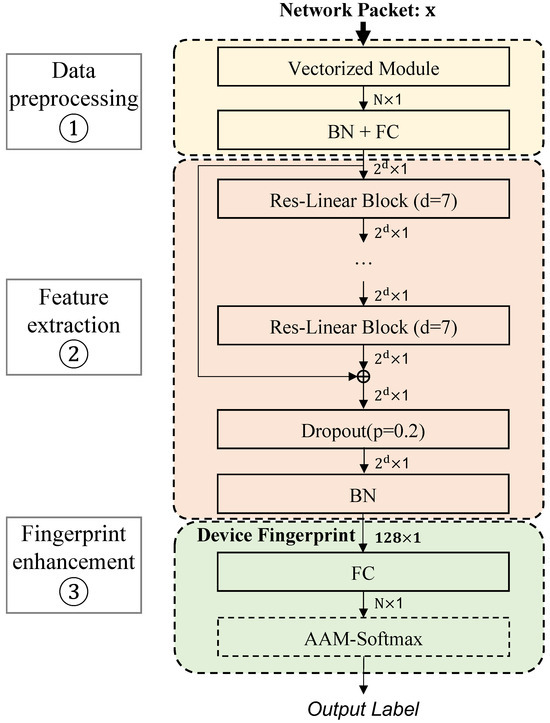
Figure 1.
An overview of Res-DFNN model structure (BN is short for Batch Normalization layer, and FC is short for Fully Connected layer).
- Data preprocessing ➀. The data preprocessing block takes a single network flow packet file as input. It extracts relevant information for subsequent processing and then converts it into a vectorized form.
- Feature extraction ➁. The feature extraction block harnesses the advantages of a residual network structure to extract a Device Fingerprint (DF) representation from the input vector.
- Fingerprint enhancement ➂. The fingerprint enhancement block plays a crucial role in reducing the gap between the generated DF and the ground-truth DF, while simultaneously increasing the dissimilarity between the generated DF and other DFs. This enhancement process enhances the discriminative capability of device fingerprint extraction systems.
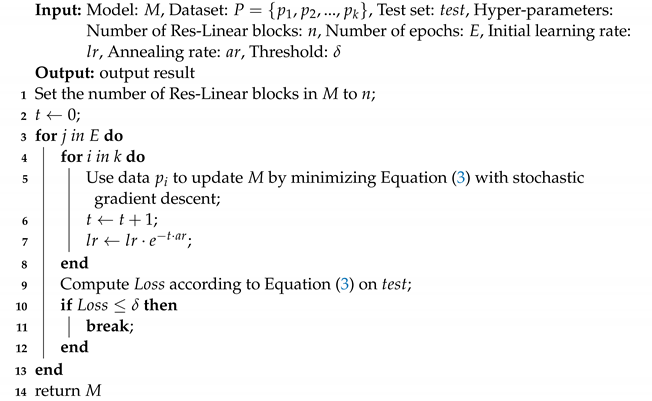
The training algorithm of Res-DFNN is presented in Algorithm 1.
| Algorithm 1: Training algorithm of Res-DFNN |
 |
4.3.2. Data Preprocessing
The data preprocessing block is responsible for extracting a normalized feature vector from pcap files.
The initial component of this block is the vectorized module, designed to extract essential features from network packet headers. We have successfully extracted a total of 92 features, encompassing aspects such as packet size, IP flags, ICMP length, and more—all of which can be commonly found in packet headers. As discussed in Section 3.1, MAC and IP addresses serve as distinctive identifiers based on source and destination. While they excel at uniquely identifying the source and destination devices, they fall short in providing insights into device behaviors; we have made a deliberate choice to exclude them from our feature set. In addition to the packet header information, in the Full-knowledge scenario, we also include payload data.
The second component of this block comprises a batch normalization (BN) layer and a fully connected (FC) layer. The purpose of this design is to standardize the vector for subsequent blocks. This is particularly crucial because the ranges of different features can vary significantly. For instance, while the IP flags fall within the range of , TCP sequence numbers span a range of . These substantial variations in range can inadvertently bias the network towards features with larger ranges, prompting the need for normalization at this stage.
4.3.3. Feature Extraction
This block has been crafted to extract a valuable feature representation from the data vector. After training, its output will serve as the DF. As elucidated in Section 3.2, we commence by employing a sequence of Res-Linear blocks, incorporating a residual skip connection. Subsequently, we introduce a dropout layer to prevent model overfitting, and ultimately, a BN layer is applied to obtain a standardized DF.
The design details of the Res-Linear block are illustrated in Figure 2, which is a pre-activation residual structure. Additionally, a BN layer is positioned before the ReLU activation to ensure that the vector is rescaled to a magnitude of 1 before proceeding to the functional components of this block, thereby averting gradient explosions. For example, when , the input data has a size of . It will be processed sequentially by the BN, ReLU, and FC layer. Subsequently, the input itself will be added to the results to obtain the output, which also has a size of .
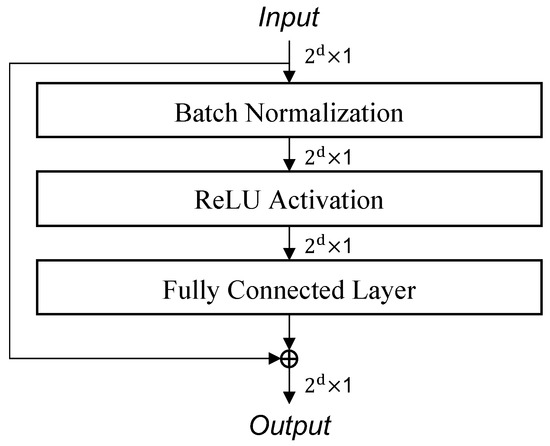
Figure 2.
Res-Linear Block model structure.
The overall block structure is built on the principle of symmetry, where the micro- structure of the Res-Linear block mirrors the macro-structure of the feature extraction block. As for the hyperparameter, we have set the exact number of Res-Linear blocks to 10, and we will provide a rationale for this choice later in our discussion.
4.3.4. Device Fingerprint Enhancement
As discussed in Section 3.3, it has been established that training using the conventional softmax loss alone cannot generate distinct embeddings, i.e., fingerprints of different IoT devices should be as different as possible. This limitation hinders the deep learning model’s ability to effectively distinguish between various classes. Inspired by ArcFace [32] and ECAPA-TDNN [25], we choose to employ the additive angular margin (AAM) loss instead of the softmax loss as the output layer. This decision is motivated by the explicit aim of making devices from the same class exhibit similar fingerprints, while ensuring that devices from different classes have significantly different fingerprints. The objective function is defined as follows:
where represents the angle between the weight and the input , with s serving as the rescaling parameter, and m acting as the angular margin penalty.
5. Results and Discussions
5.1. Setup
5.1.1. Prototype
We have implemented a prototype of the Res-DFNN using Pytorch [34] and trained it according to the Algorithm 1, utilizing four NVIDIA 3090 GPUs. The model was configured with a depth of 10, resulting in a total of 10 Res-Linear Blocks within the feature extraction block. Further investigation into the impact of varying the model depth will be presented in Section 5.5 to demonstrate the optimality of this particular setup. The specific parameters of the model’s blocks can be found in Table 1.

Table 1.
The detailed implementation of Res-DFNN in the Full-knowledge scenario.
During the training phase, we employed an Adam optimizer [35] to update the model’s parameters until achieving a satisfactory validation loss or reaching a point where the loss no longer decreases. Our initial learning rate was set to 1 × 10⁻³ and a batch size of 256. To prevent the model from getting stuck in local optima, we utilized an annealing algorithm to dynamically adjust the learning rate, with an annealing rate of 0.3.
5.1.2. Evaluation Metrics
According to different classification situations, samples can be divided into four categories:
- True Positive (TP): samples that are correctly judged to be positive;
- True Negative (TN): samples that are correctly judged to be negative;
- False Positive (FP): samples that are judged to be positive but are actually negative;
- False Negative (FN): samples that are judged to be negative but are actually positive.
Based on the categories above, we have four metrics that are used to evaluate the extracted DF of Res-DFNN:
- Accuracy (Acc) is the proportion of the number of truly correct results returned after retrieval to the total result;
- Precision (P) describes how many of the predicted positive examples are actually positive;
- Recall (R) describes the percentage of all positive cases that can be detected;
- F1 Score (F1) is the harmonic mean of P and R, which is high only when both Acc and R are high.
The four metrics are defined as follows:
5.1.3. Baseline
To ensure a fair and comprehensive comparison, we have selected as baselines three of the most advanced DF extraction methods available, namely IoTSentinel [4], IoTSense [7] and IoTDevID [5].
- IoTSentinel [4] was among the pioneering studies to employ network packet data for creating DFs for devices. In this approach, they extracted 23 distinct features from each packet, with none of them relying on packet payload;
- IoTSense [7] took a further step by building upon IoTSentinel’s work. They selected 17 features from IoTSentinel’s approach based on their own design assessment and introduced payload-related features, particularly payload length and payload entropy;
- IoTDevID [5] employed 30 features from network packets to identify IoT devices, with the inclusion of payload information;
In the Semi-knowledge scenario, it is important to note that the payload information will be excluded from the input data.
5.2. Overall Effectiveness
In this section, we assess the effectiveness of Res-DFNN in generating DFs for device identification purpose according to Equation (4). To enhance the robustness and precision of our results, we employ 10-fold cross validation. Meanwhile, to ensure consistency in our evaluations, we applied identical dataset segmentation and optimized model parameters across all methods and folds during the training phase. The outcomes of the cross validation process are illustrated in Table A1 and Table A2, while the comprehensive effectiveness is summarized in Table 2. The results demonstrate that Res-DFNN consistently outperforms the other methods across various scenarios. In both scenarios evaluated, Res-DFNN exhibits superior performance, underscoring its effectiveness and potential as a leading choice for DF generation.
Table 2.
Overall effectiveness of Res-DFNN and other baselines.
In the Full-knowledge scenario, Res-DFNN attains an average Acc of , surpassing IoTDevID by and showcasing remarkable superiority over other available alternatives. This satisfactory performance can be attributed to our method’s inherent ability to autonomously discern valuable information from a wide array of features and assign them greater significance. This autonomy effectively circumvents the shortcomings associated with manual feature selection, further reinforcing the effectiveness and promise of Res-DFNN.
In the Semi-knowledge scenario, as a result of limited payload information, the average Acc of Res-DFNN has slightly declined to . However, it still maintains its position as the top-performing method compared to others. Moreover, the performance gap between our approach and alternative methods has widened, with a substantial lead over IoTDevID. These results suggest that Res-DFNN is still trustworthy in privacy-limited situation.
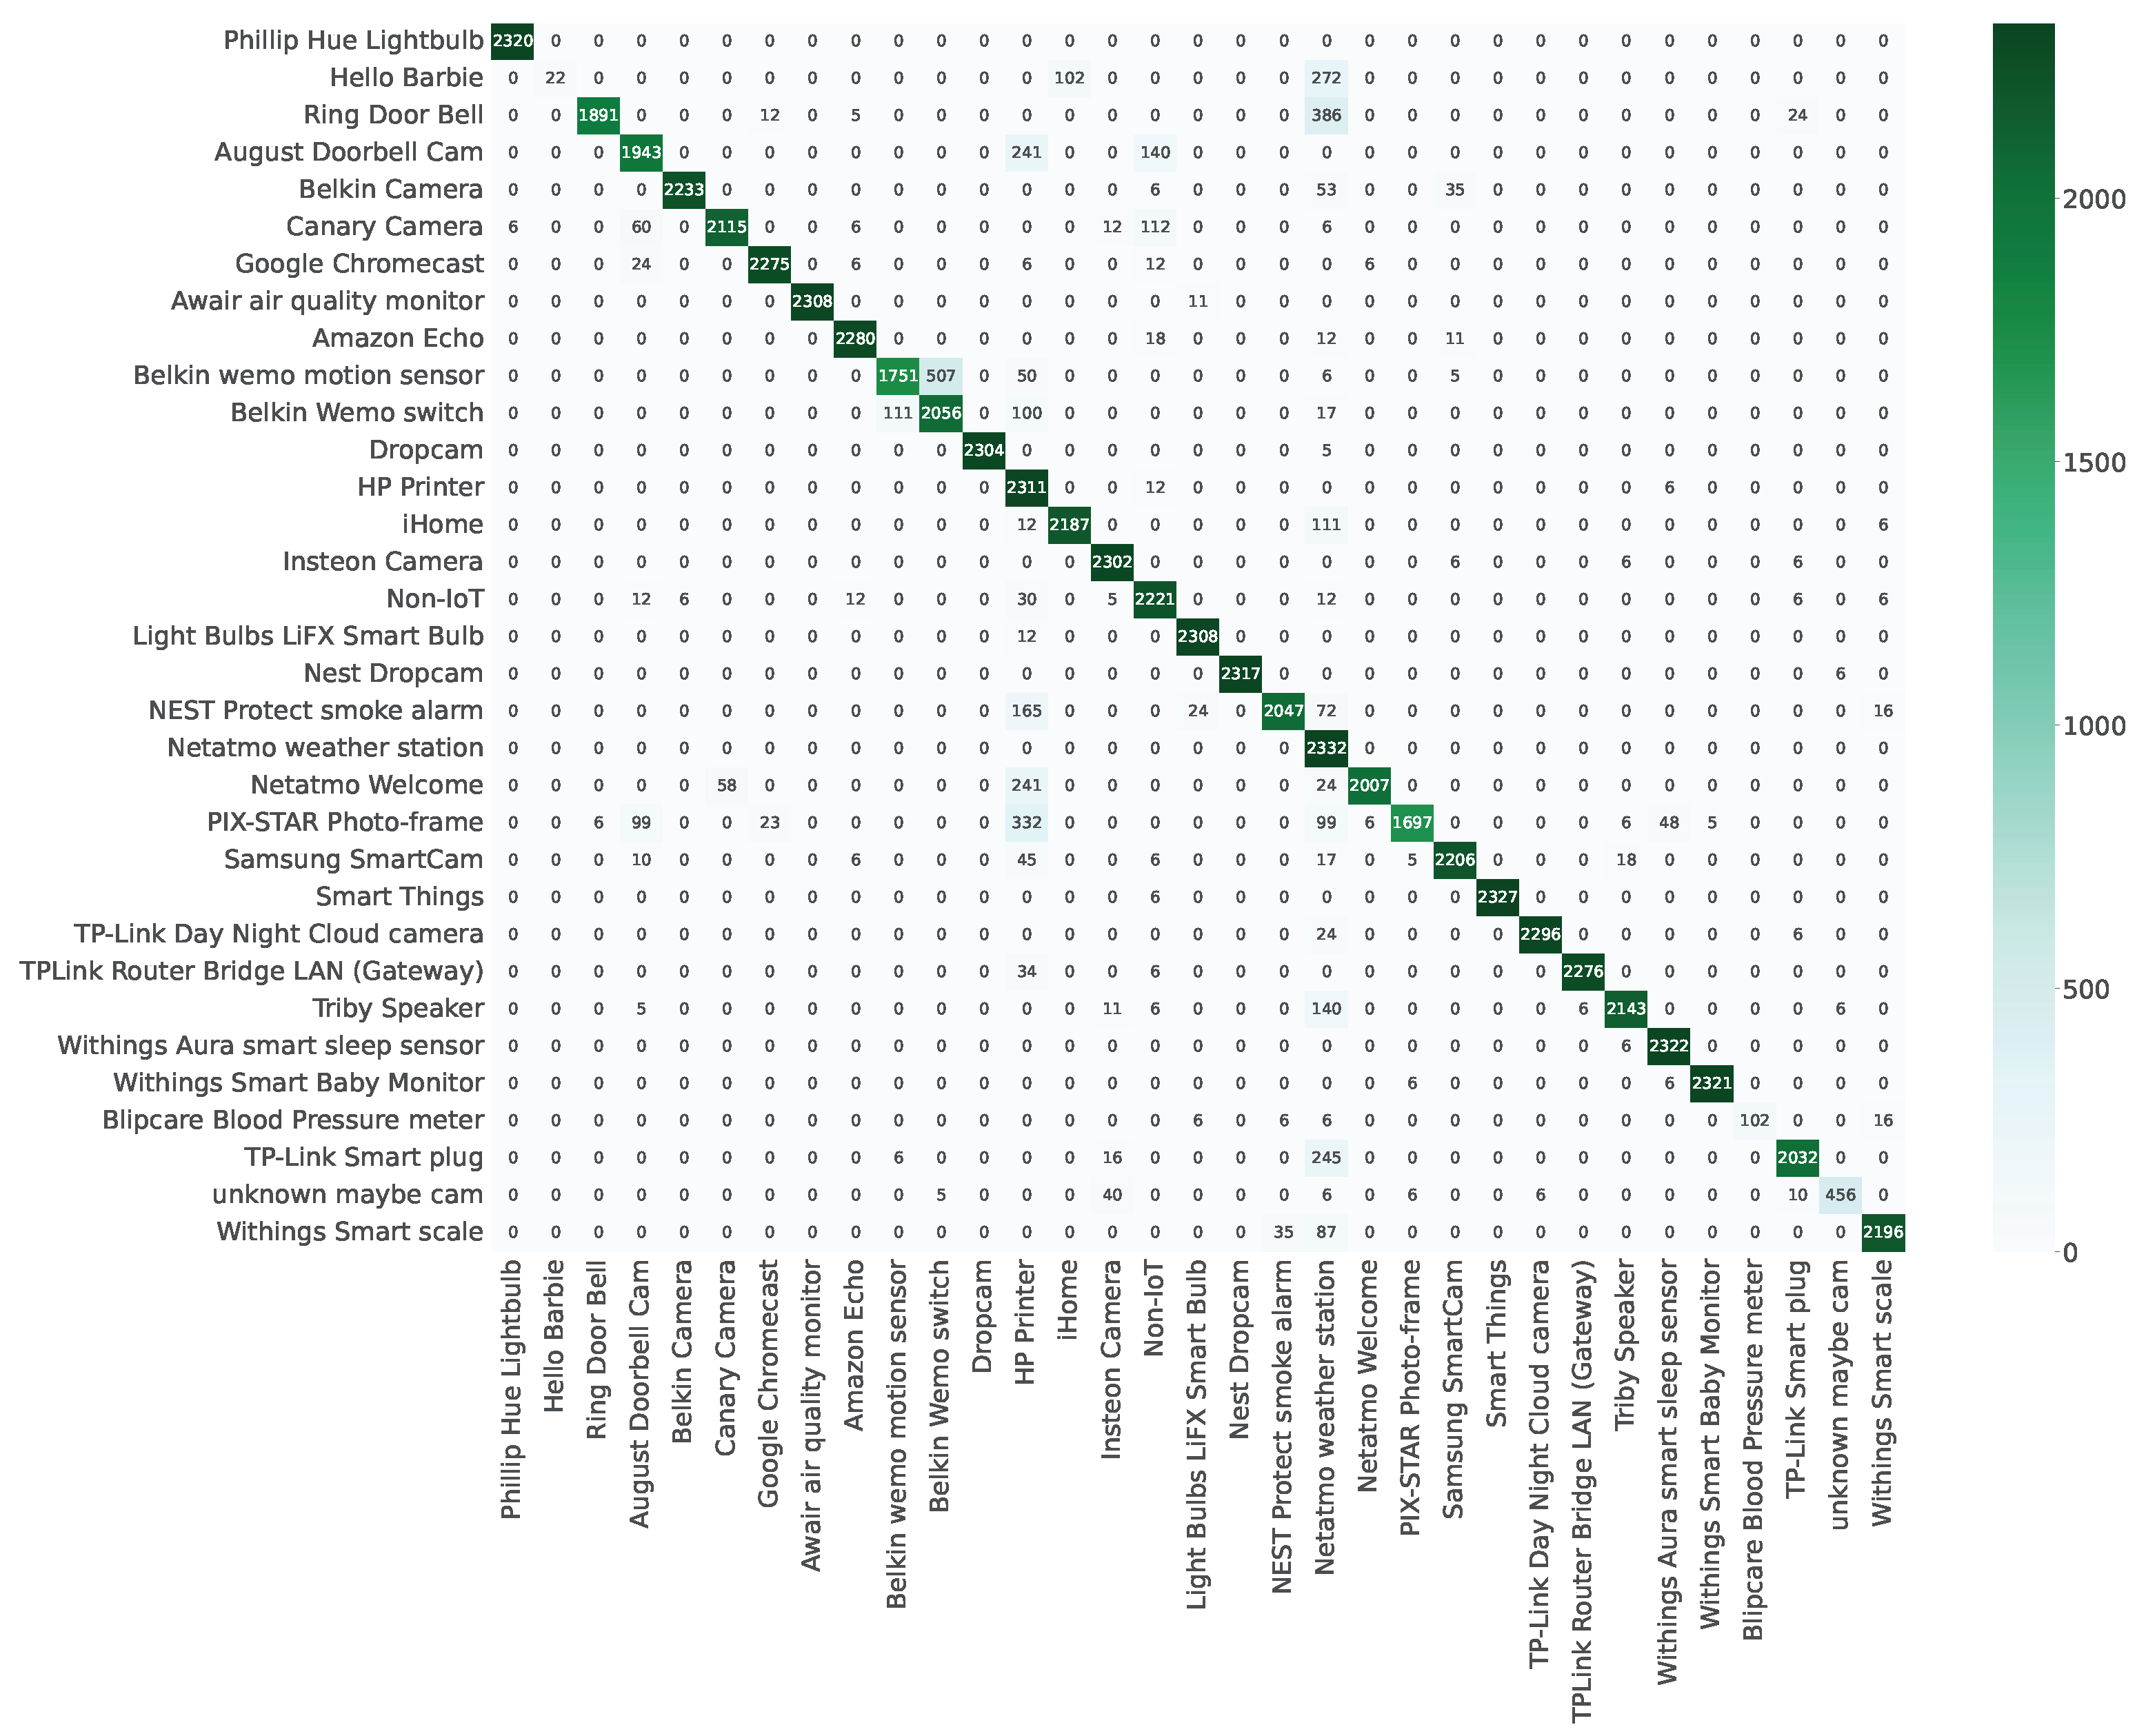
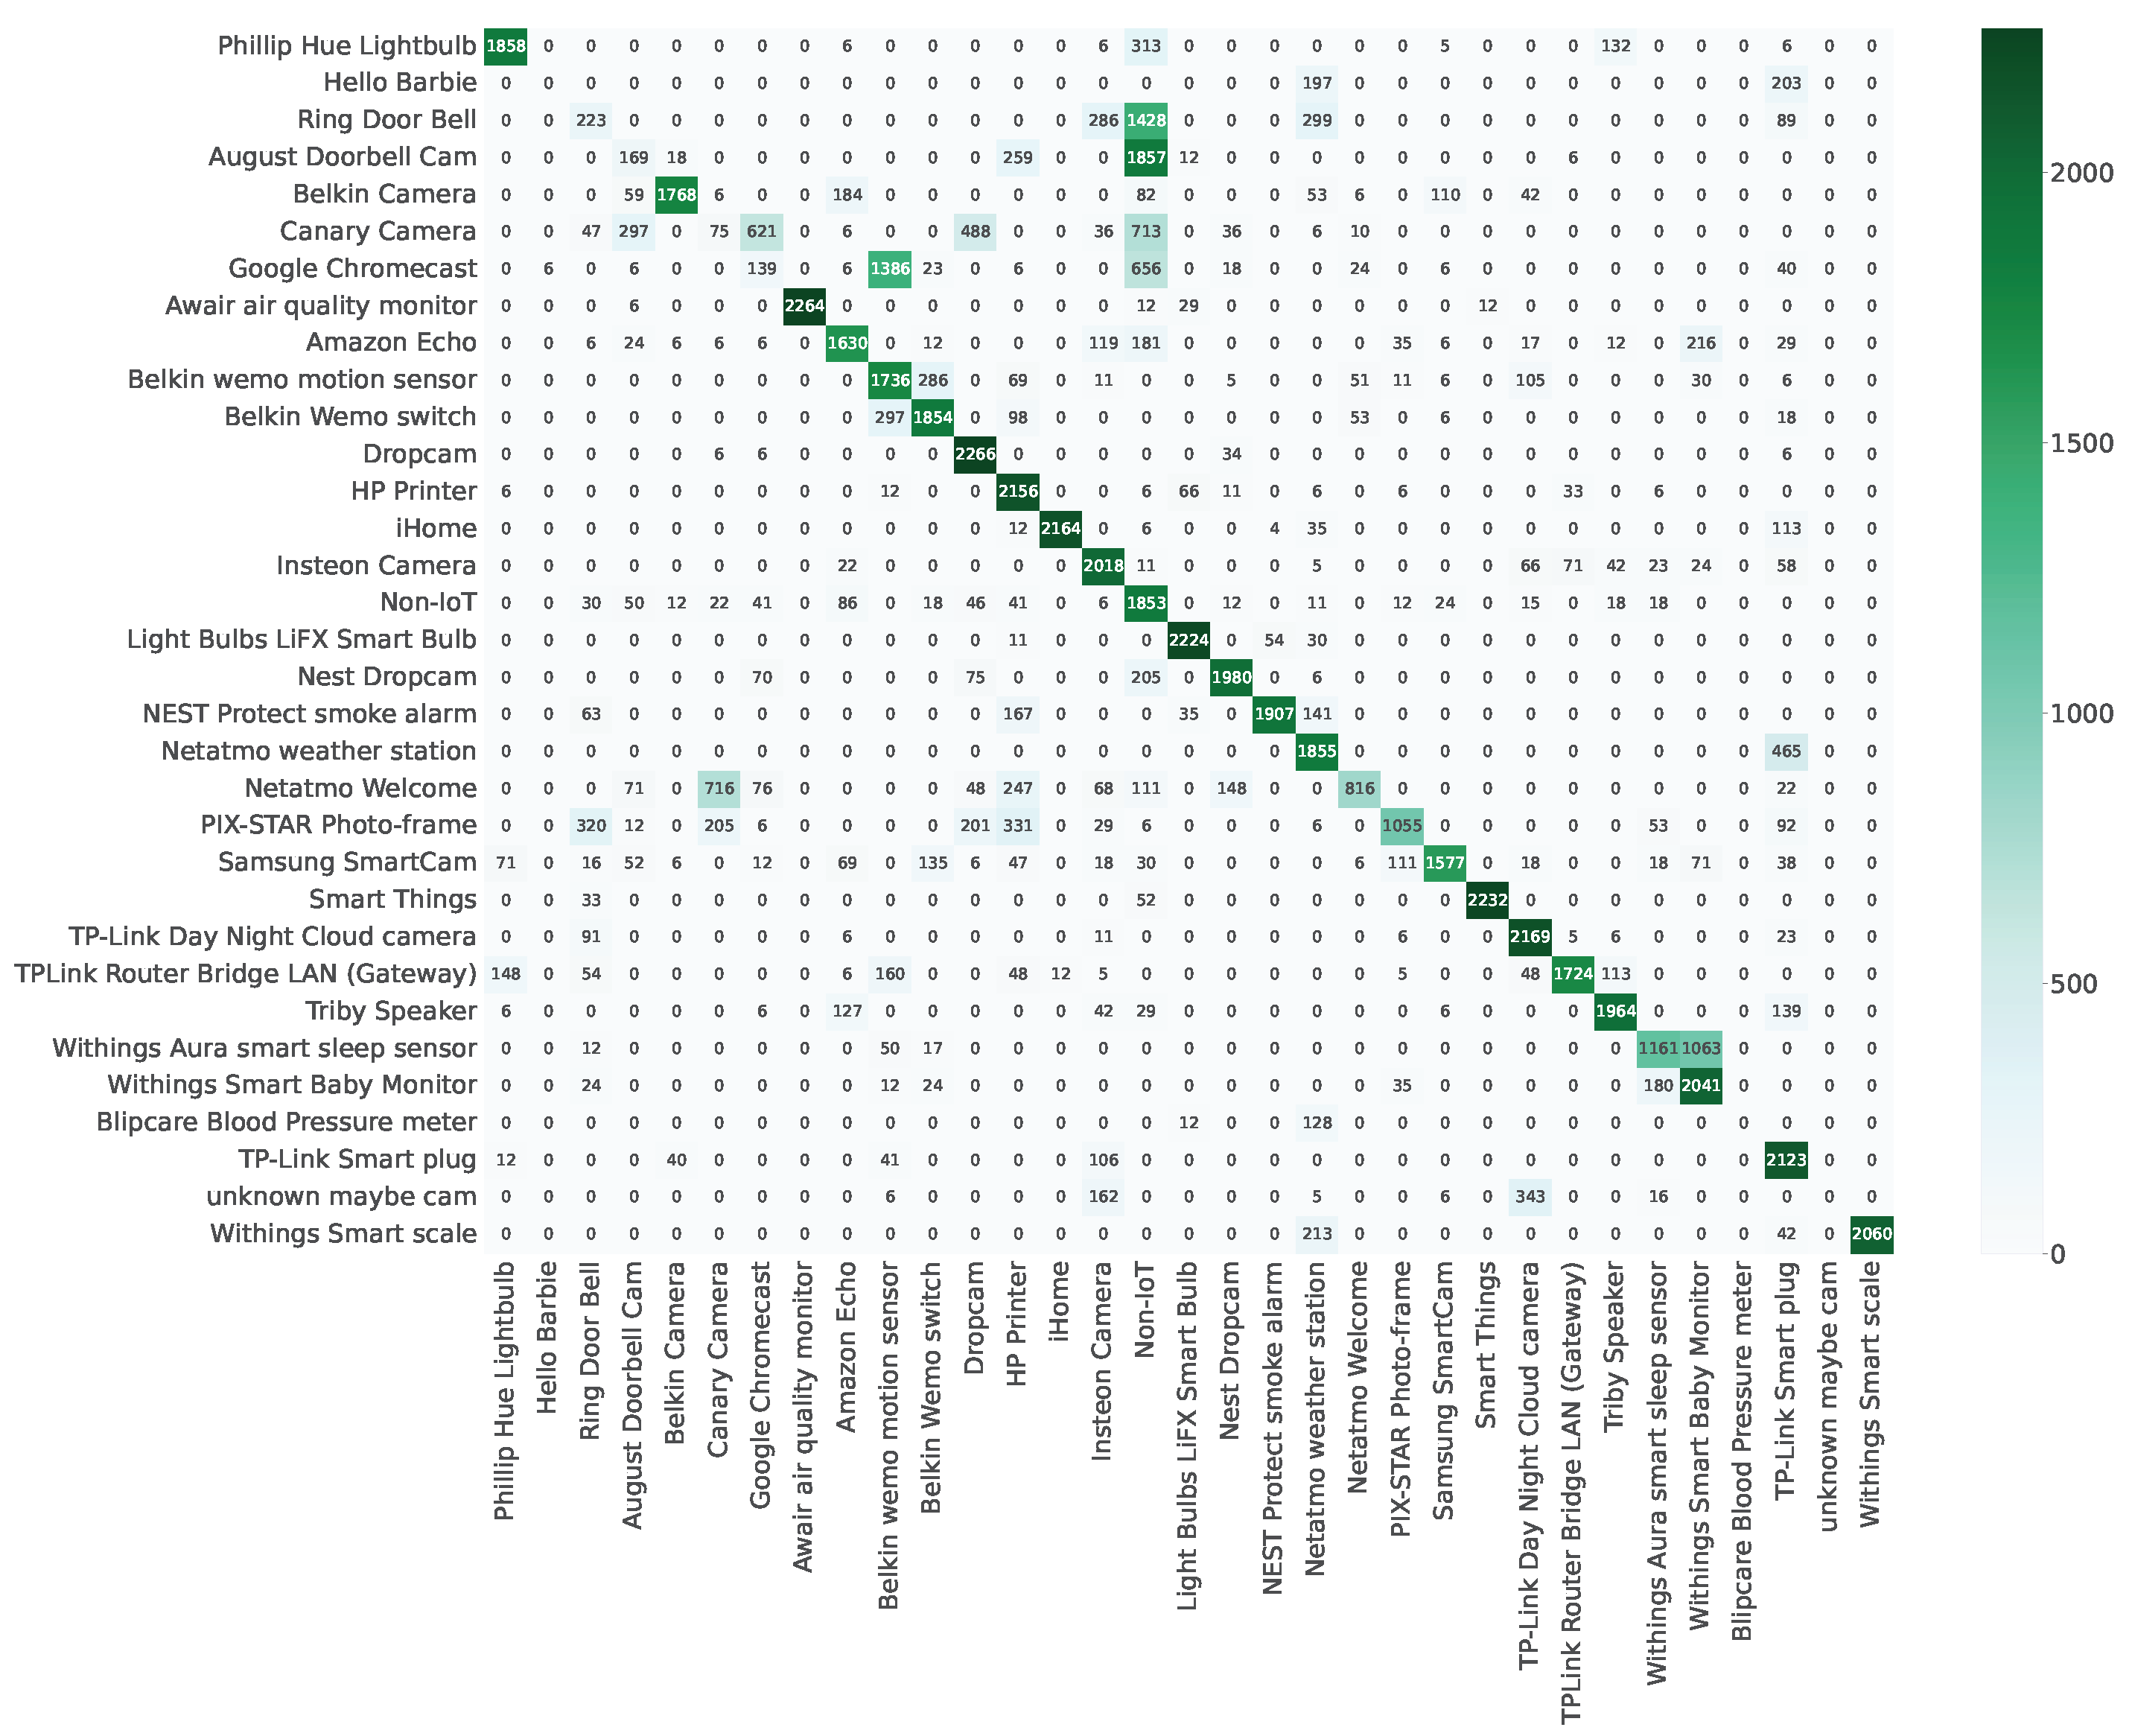
If not explicitly mentioned, the remainder of the evaluation will be conducted on fold in the Full-knowledge scenario. As depicted in Figure 3 and Figure A1, we have included confusion matrices to enhance the clarity of Res-DFNN’s performance assessment. In these visual representations, the intensity of color corresponds to the proportion of devices classified into specific labels, with squares along the diagonal signifying correct classifications. A closer examination of the results reveals that the majority of devices have been accurately categorized.
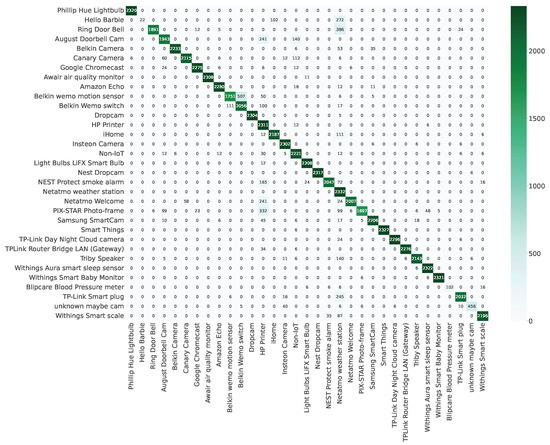
Figure 3.
Confusion matrix of devices in the Full-knowledge scenario.
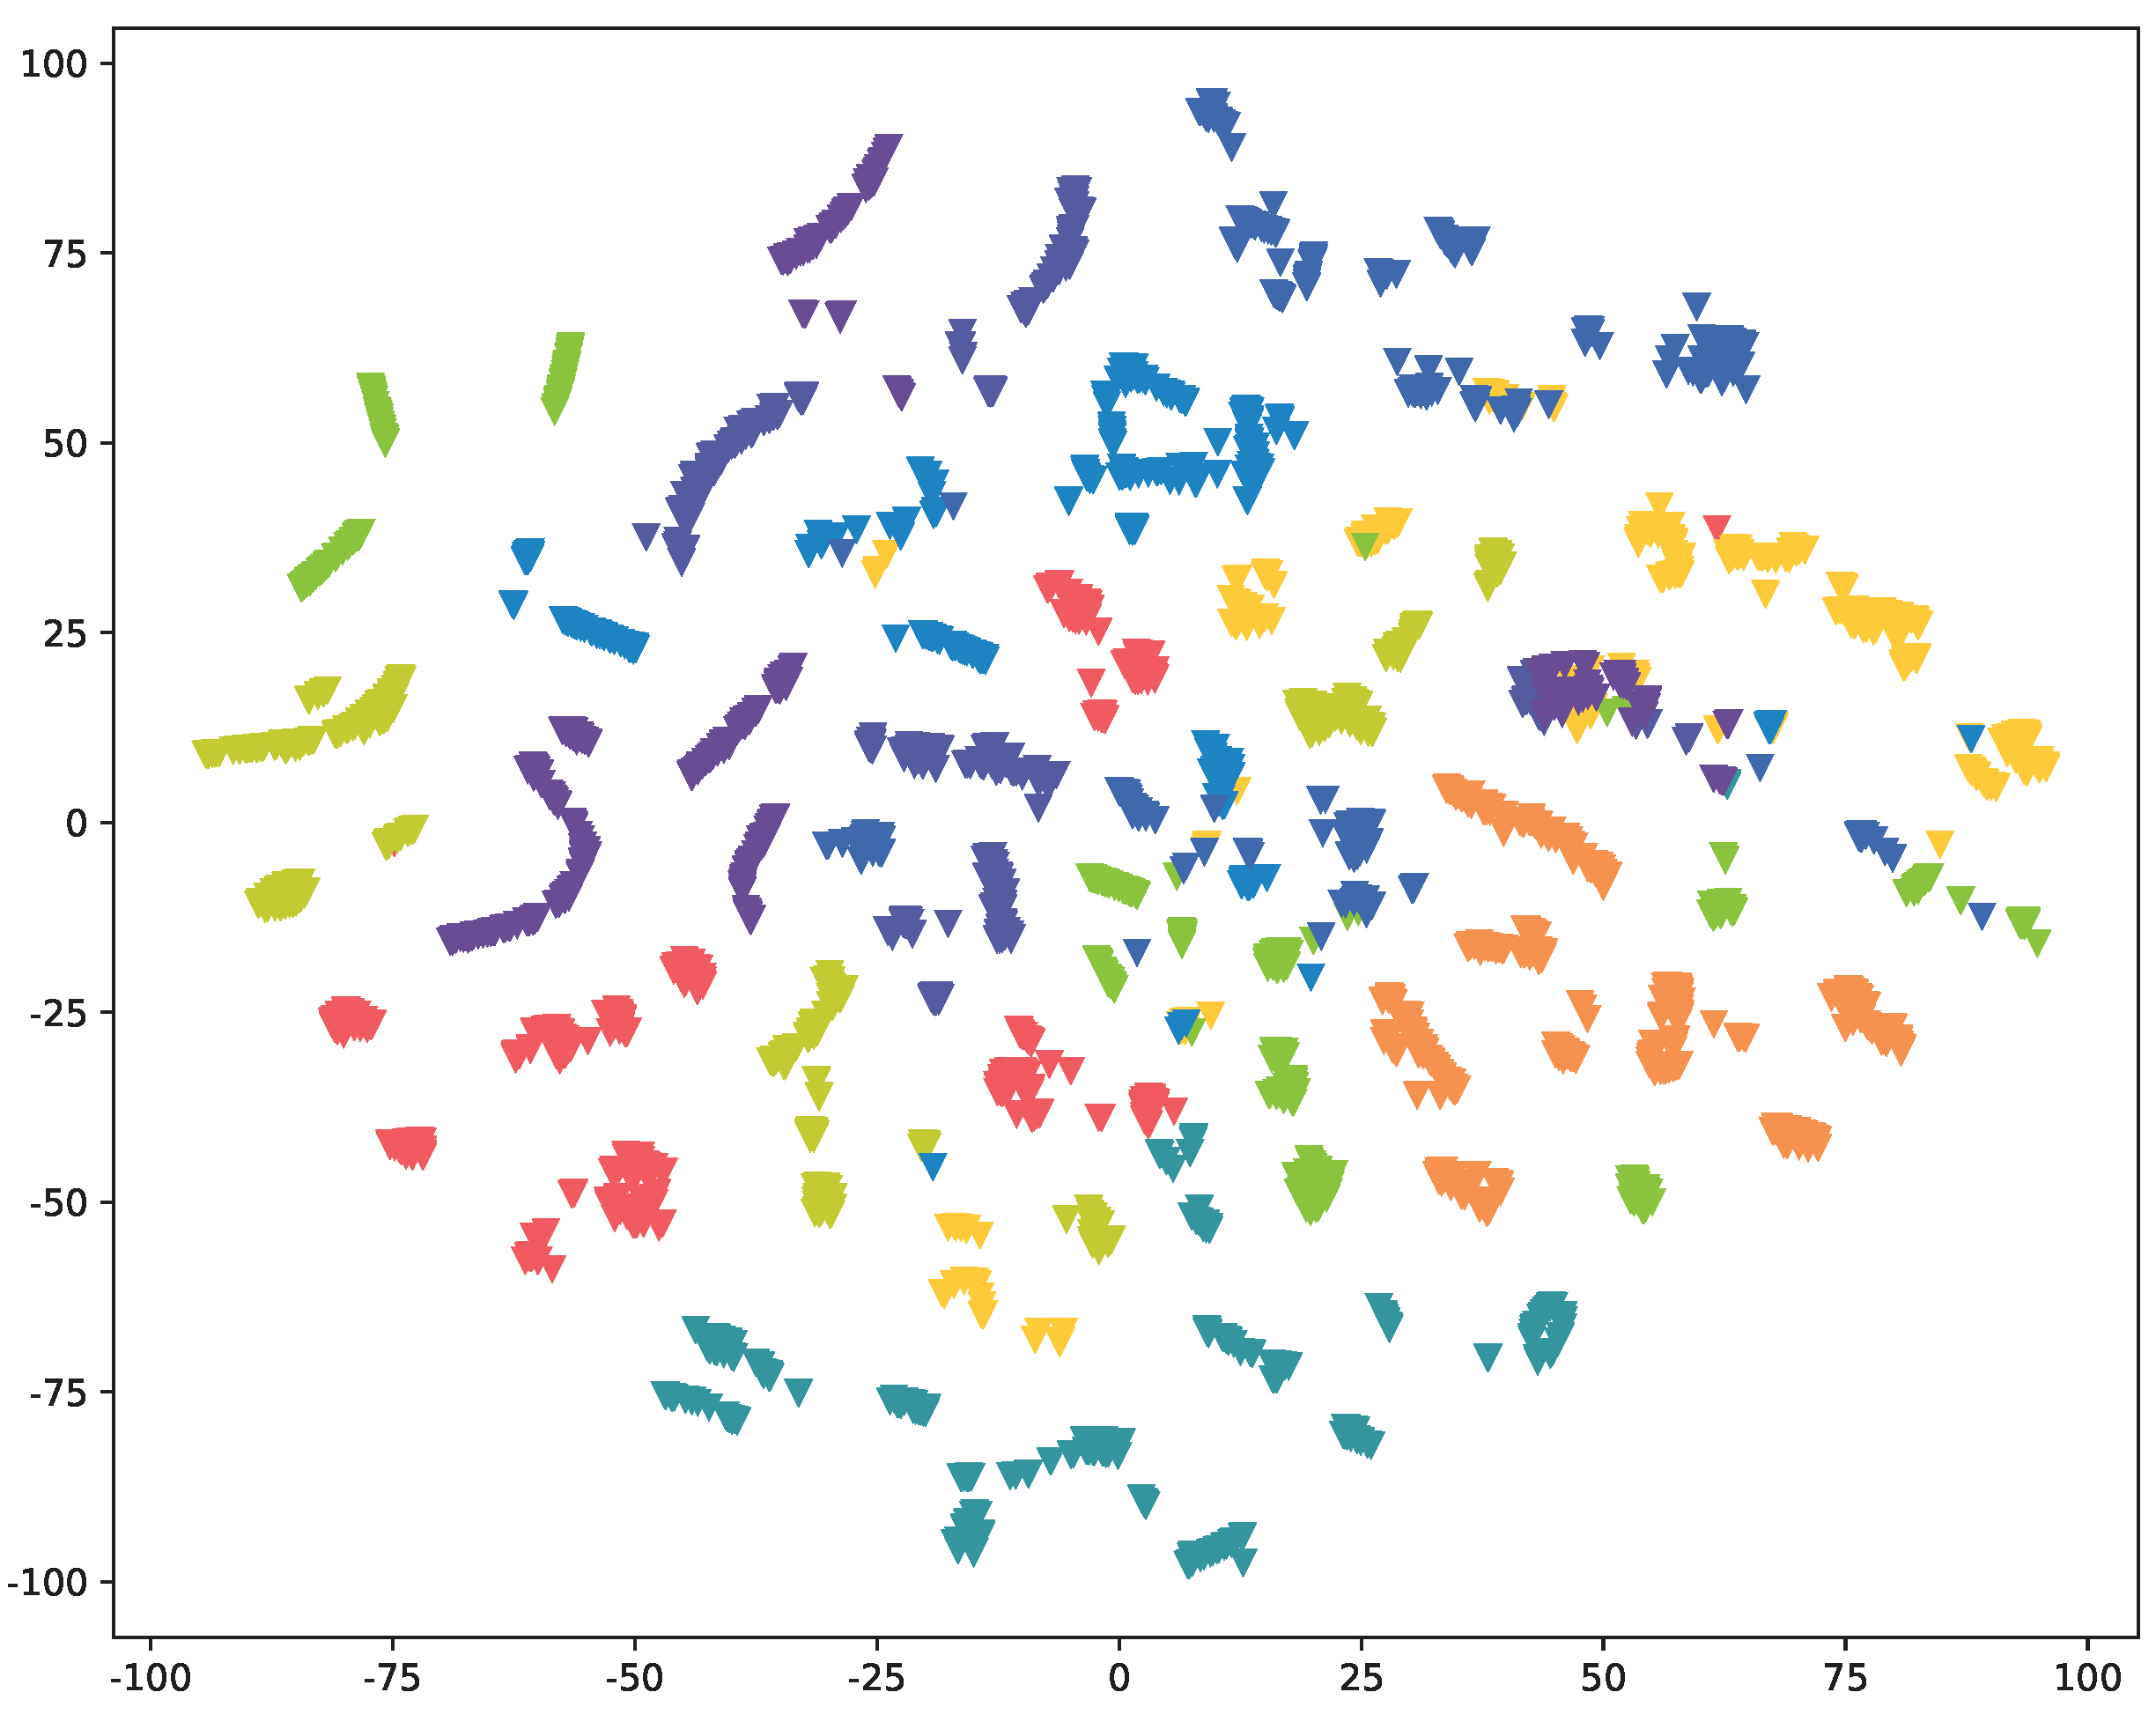
5.3. Visualization
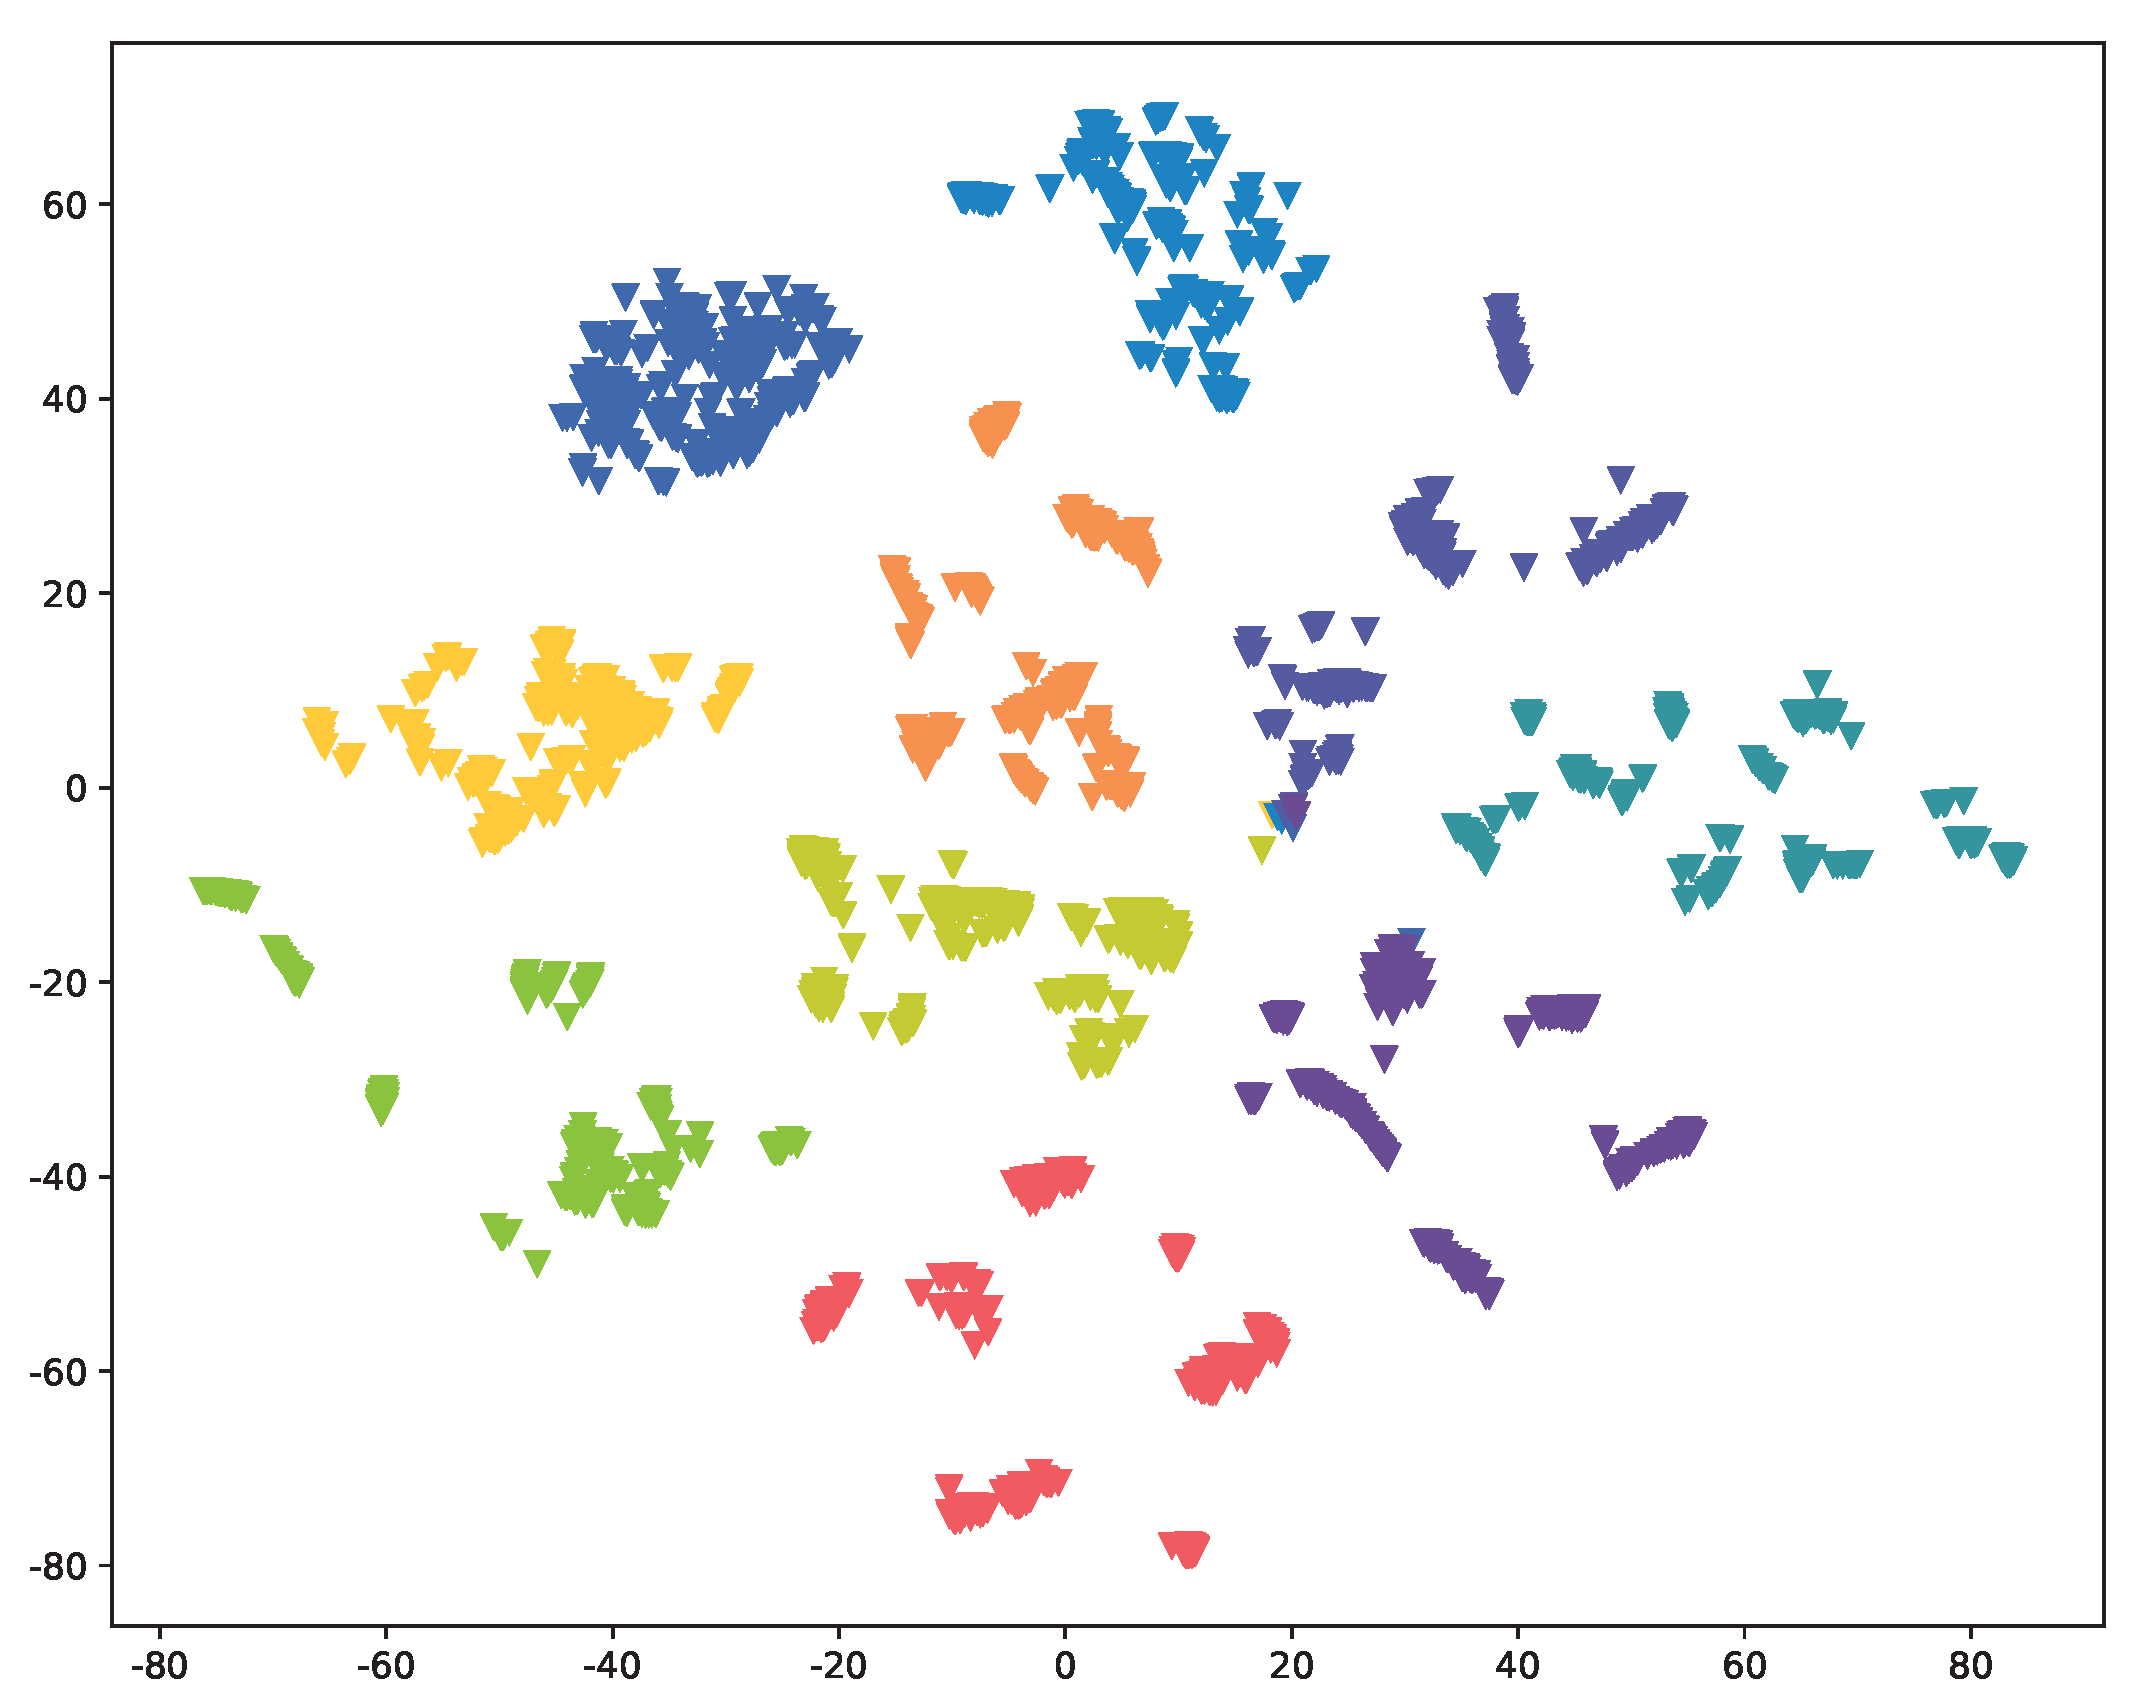
As illustrated in both Figure 4 and Figure A2, we have reduced the original 128-dimensional Device Fingerprint (DF) to a 2-dimensional representation using t-SNE [36]. This enables us to visually examine the distribution of DFs extracted by Res-DFNN under various scenarios, with IoT devices of each class represented by distinct colors. The results clearly demonstrate that data samples from different classes form tight clusters and exhibit well-defined boundaries between them. This observation underscores the model’s ability to effectively extract a distinguish DF of various IoT devices, thus providing strong validation for our proposed approach.
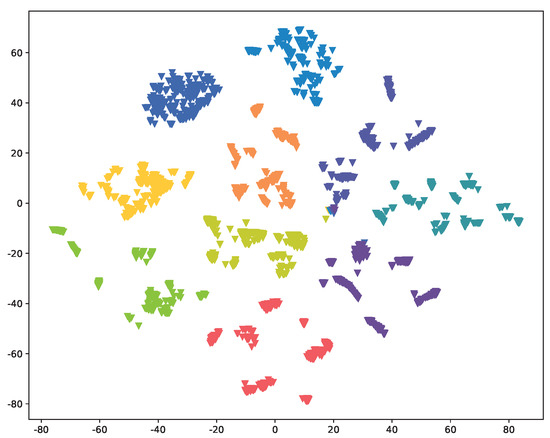
Figure 4.
Distribution (visualized using t-SNE) of the device fingerprint extracted by Res-DFNN in the Full-knowledge scenario.
Comparing the outcomes of two distinct scenarios, namely, Full-knowledge and Semi-knowledge, we observe a slight drop in performance when payload information is missing. This finding aligns with the results presented in Table 2.
5.4. Data Proportions
During the evaluation phase, we have observed that Res-DFNN tends to make incorrect predictions, particularly on specific devices. To gain a deeper understanding of this issue, we conducted a thorough analysis of the training dataset. As shown in Table 3, it is evident that the majority of devices have approximately 9601 packets, accounting for approximately of the dataset. The Non-IoT class constitutes of the dataset but includes seven different devices. Therefore, we do not consider this to be an imbalance. However, there are instances where the proportion is considerably lower, as low as and , as observed in devices such as the Blipcare Blood Pressure Meter with 78 packets and Hello Barbie with 98 packets.
Table 3.
The effect of the data proportion on the classification results.
Our investigation revealed that the dataset suffers from a natural imbalance in data proportions, where the number of packets varies significantly across different devices. Consequently, we conducted an experiment to assess the impact of this data proportion disparity.
The experimental results are presented in Table 3. It is noteworthy that devices with lower data proportions tend to exhibit poorer performance, e.g., Blipcare Blood Pressure Meter with an Acc of and Hello Barbie with an Acc of . This outcome is expected since models generally perform better when they have more training data to understand the class distribution. However, there are exceptions, such as the Belkin Motion Sensor, which has a data proportion of yet achieves an Acc of only . We attribute this discrepancy to certain devices with highly entangled network flow characteristics, which can influence the model’s ability to make accurate predictions for these particular devices.
5.5. Model Depth
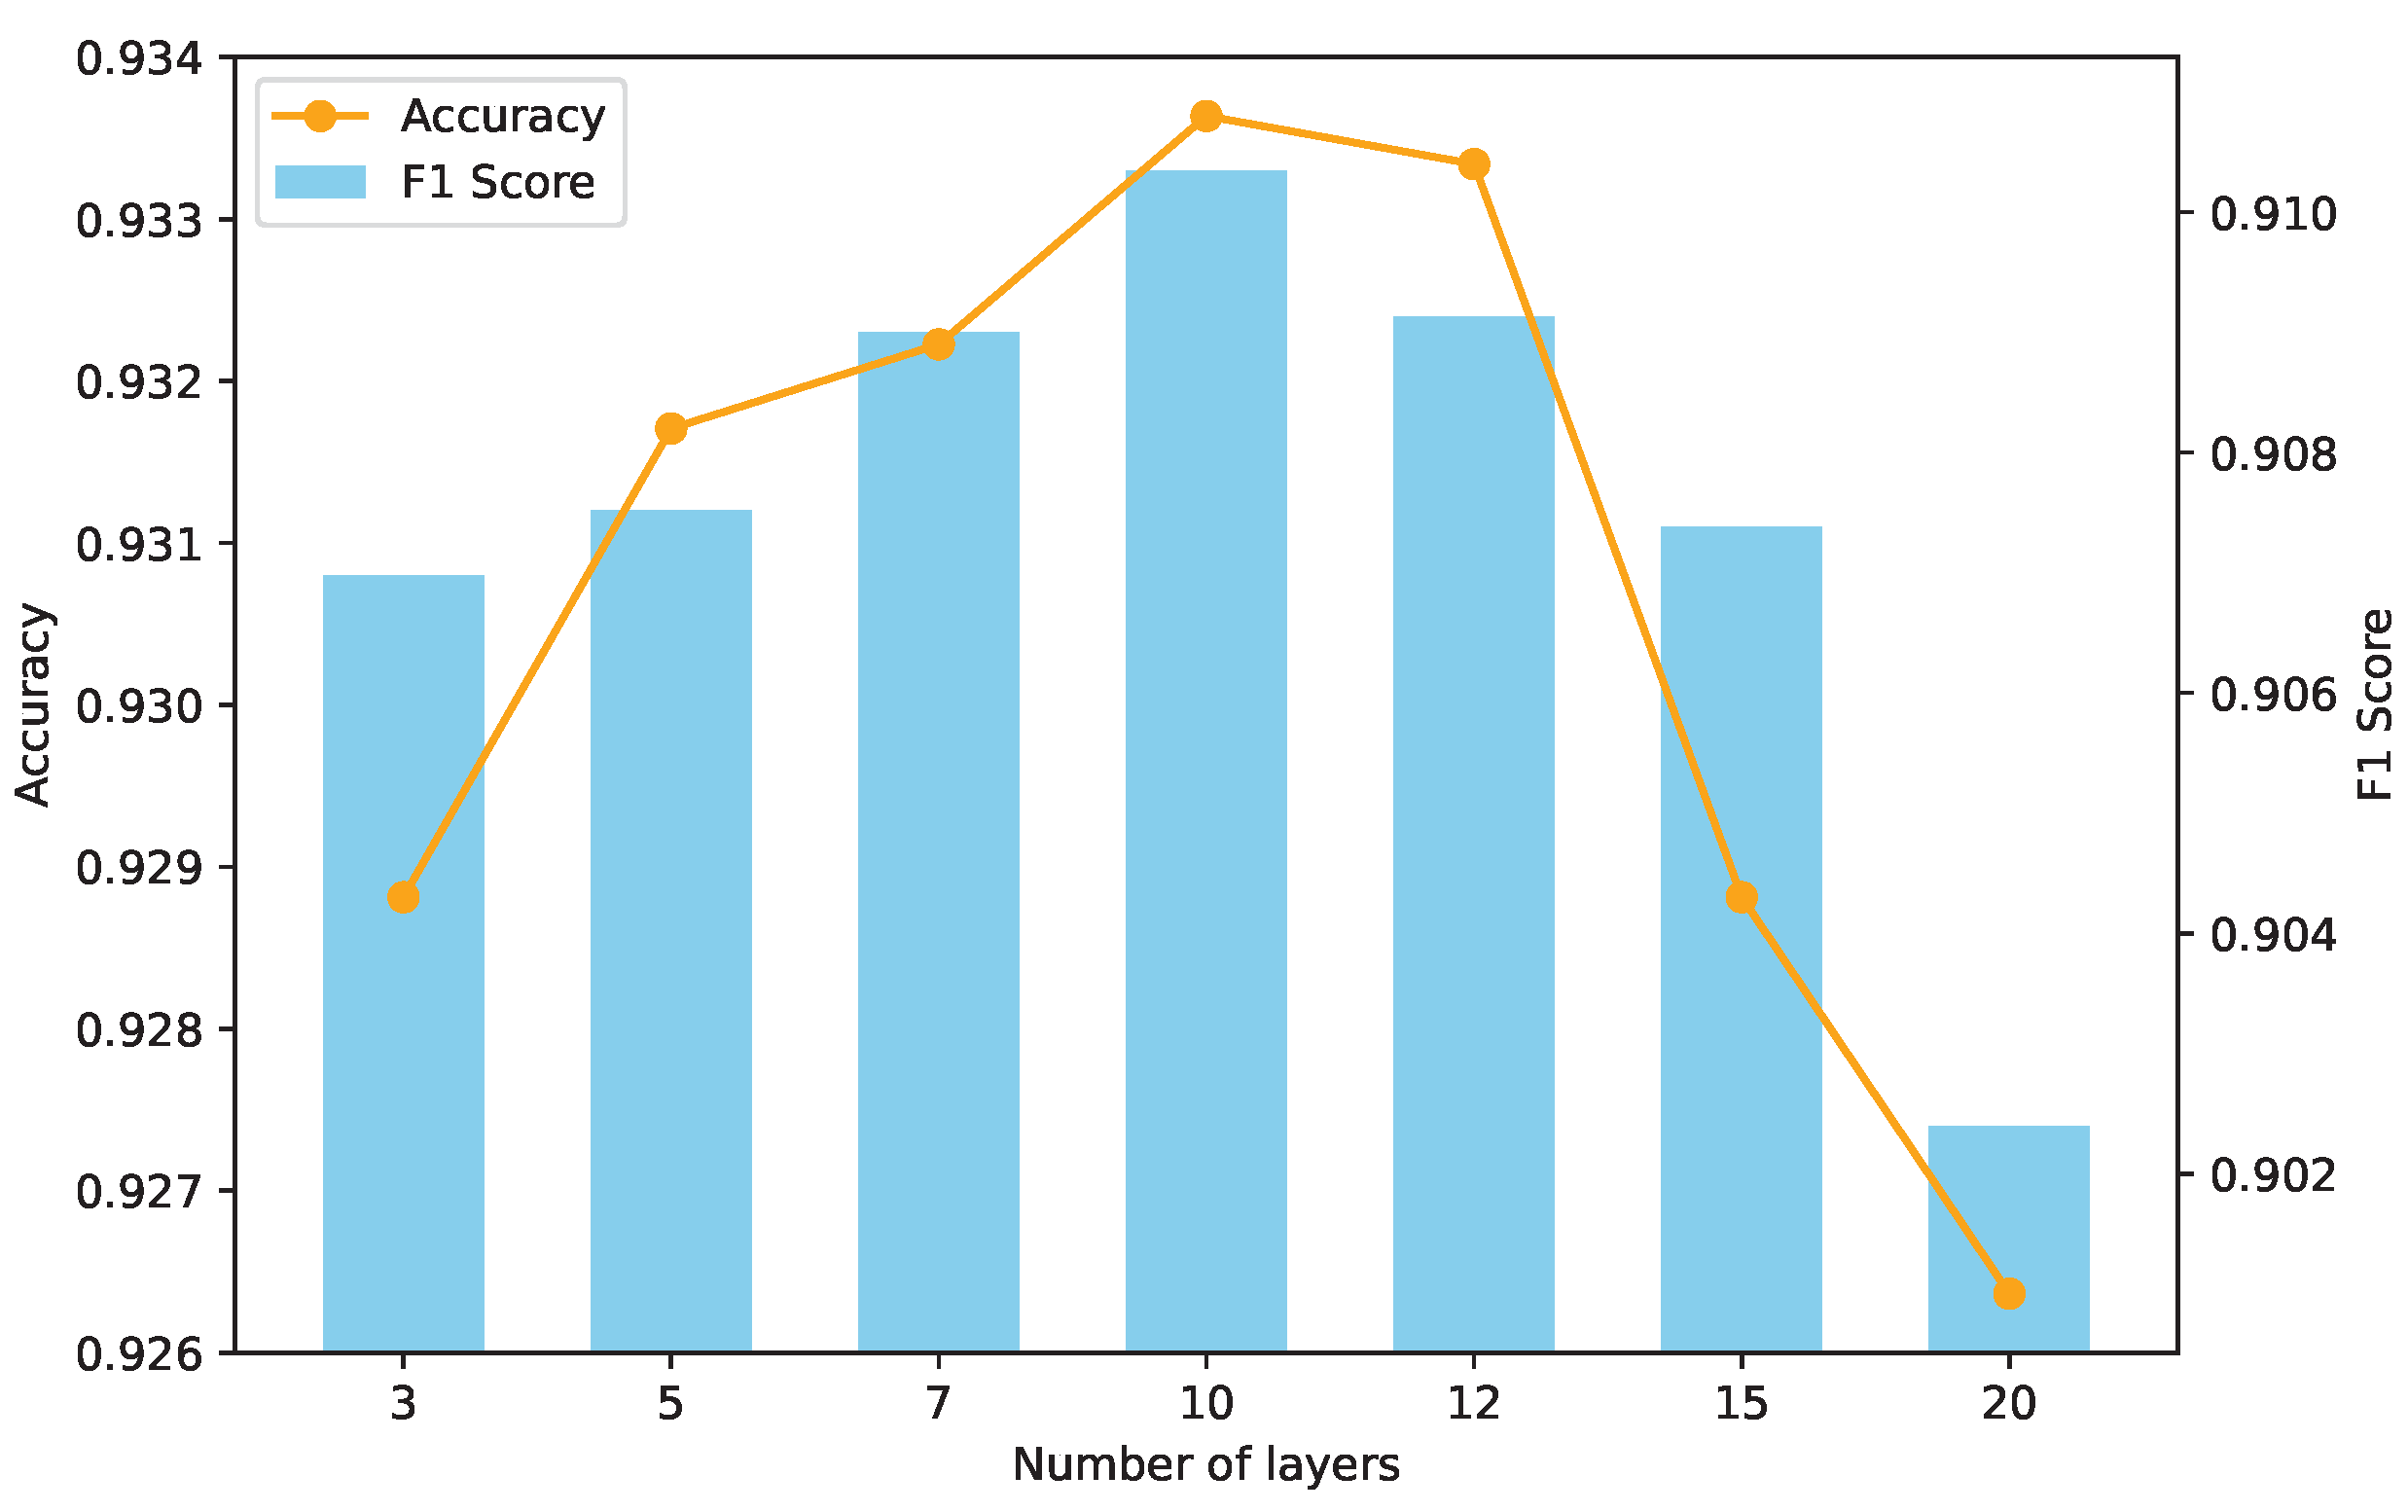
In this section, we will discuss how model depth affects performance. In our experiments, we varied the number of Res-Linear Blocks from 3 to 20. It is worth mentioning that the overall feature extraction block architecture remains unchanged—only the number of Res-Linear Blocks varies. The results are presented in Figure 5, and we can observe that as the depth increases, the performance initially improves and then starts to decline.

Figure 5.
Effect of model depth.
This phenomenon is reasonable. Initially, the Res-Linear Blocks we designed are similar to ResNet. As analyzed in Section 3.2, deeper models tend to perform better. The reason why deep models work is due to the presence of residual connections. However, since the dataset contains a limited amount of data, a model with too many parameters may struggle to fit the data adequately.
The best performance is achieved when the depth is set to 10, resulting in an Acc of 0.9333 and an F1 Score of . For the remainder of this paper, we will use a model depth of 10 for our evaluations.
5.6. Ablation Study
In this section, we perform ablation experiments to demonstrate the effectiveness of every component in the Res-DFNN design. To be specific, we systematically eliminate the feature extraction block and residual connections, one at a time, to assess their impact on performance. The experimental results are presented in Table 4.
Table 4.
Results of ablation study.
We observe a significant drop in performance when the feature extraction component is omitted. The Acc plunges to a mere , rendering it unacceptable as the device fingerprint can no longer be effectively discerned. To vividly illustrate the subpar results, we have included visual representations in Figure 6 and Figure 7. The confusion matrix reveals that the hot spot is not predominantly on the diagonal, indicating a considerable number of samples being misclassified. Simultaneously, the distributions of the device fingerprints fail to form a distinct boundary line and instead appear jumbled, signifying inadequate feature extraction.

Figure 6.
Distribution (visualized using t-SNE) of the device fingerprint extracted by Res-DFNN (without feature extraction block).
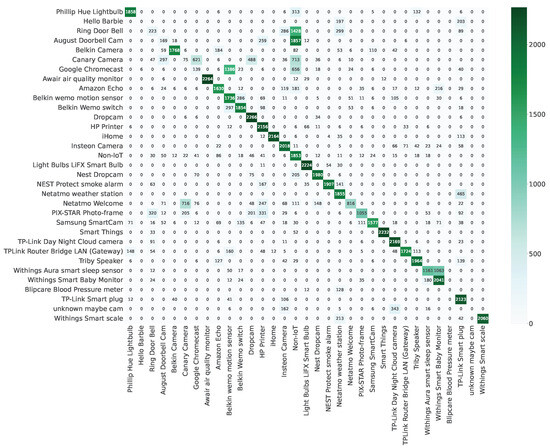
Figure 7.
Confusion matrix of devices (without feature extraction block).
On the other hand, in the absence of residual connections, we observed a slight decrease in Acc, specifically by . This decline can be attributed to the crucial role that residual connections play in deep neural networks. Their primary function is to address the issues of gradient vanishing and exploding, which are common challenges in training deep networks. Additionally, they facilitate faster convergence of the model. Notably, as the neural network becomes deeper, the impact of residual connections becomes even more pronounced. Furthermore, without residual connections, the structure no longer satisfies the concept of symmetry, leading to a notable performance drop, thus proving the effectiveness of symmetry.To further illustrate this point, we have included visualization results in Figure A3 and Figure A4. These visualizations clearly demonstrate that residual connections significantly contribute to the overall effectiveness of the RES-DFNN design.
6. Conclusions
In this paper, we introduce Res-DFNN, a Device Fingerprint (DF) extraction method based on neural networks using network packet data. Res-DFNN consists of three key blocks: a data preprocessing block, a feature extraction block, and a fingerprint enhancement block. After training with AAM loss, Res-DFNN is capable of extracting DF through a single pacp file, enabling the unique identification of the sender’s brand and model.
We utilize cross validation to validate the effectiveness of Res-DFNN on the UNSW dataset in both non-private and privacy-preserving scenarios, yielding Acc of 0.9354 and 0.9279, respectively. Notably, Res-DFNN consistently outperforms all baseline methods, demonstrating advancements compared to previous studies. Particularly, Res-DFNN exhibits a lead of and over the state-of-the-art DF work [5]. Moreover, we visually represent the distribution of DF and conduct experiments revealing a positive correlation between performance and data proportions.
Additionally, we establish the model depth as 10 based on experiments indicating its superiority over other depths. Nevertheless, optimal model depth may vary due to discrepancies in dataset size and feature sets. To address this, we carefully design the residual connections of Res-DFNN, providing a highly customizable model structure. Finally, we perform an ablation study to emphasize the significance of the feature extraction block and residual connections, revealing a decrease in Acc of and , respectively, when these components are omitted.
In future work, our plan is to explore the possibility of using DF to further identify individual IoT devices. We aim to enhance the efficiency of fingerprint generation and identification, particularly when dealing with a large number of connected IoT devices. Additionally, we plan to improve the robustness of Res-DFNN in open environments.
Author Contributions
Conceptualization, Y.Z., W.X. and Y.C.; methodology, formal analysis and investigation, Y.Z. and W.X.; software, Y.Z.; writing—original draft, Y.Z.; writing review and editing, Y.Z., M.P. and Y.C.; supervision and project administration, M.P., Y.C. and W.X.; validation and visualization, Y.Z. and M.P. All authors have read and agreed to the published version of the manuscript.
Funding
This research was funded by the science and technology project of State Grid Corporation of China: “Research on Key Technologies of Multi-agent Trusted Interaction and Monitoring Response for New-type Power System User Side Business” (Grand No. 5108-202218280A-2-405-XG).
Data Availability Statement
The data that support the findings of this study are available from the corresponding author upon reasonable request.
Conflicts of Interest
The authors declare no conflicts of interest.
Abbreviations
The following abbreviations are used in this manuscript:
| pcap | packet capture |
| IoT | Internet of Things |
| DF | Device Fingerprint |
| BN | Batch Normalization |
| FC | Fully Connected |
| ReLU | Rectified Linear Unit |
| MAC | Media Access Control |
| IP | Internet Protocol |
| GDPR | General Data Protection Regulation |
Appendix A
Table A1.
10-fold cross validation results in the Full-knowledge scenario.
Table A1.
10-fold cross validation results in the Full-knowledge scenario.
| Fold Number | Study | Acc | P | R | F1 |
|---|---|---|---|---|---|
| 1 | IoTSentinel [4] | 0.8068 | 0.8068 | 0.7837 | 0.7866 |
| IoTSense [7] | 0.8428 | 0.8653 | 0.8291 | 0.8370 | |
| IoTDevID [5] | 0.9158 | 0.9304 | 0.8894 | 0.8994 | |
| Ours | 0.9333 | 0.9522 | 0.9046 | 0.9108 | |
| 2 | IoTSentinel [4] | 0.8172 | 0.8083 | 0.7851 | 0.7873 |
| IoTSense [7] | 0.8514 | 0.8775 | 0.8363 | 0.8453 | |
| IoTDevID [5] | 0.9306 | 0.9433 | 0.9087 | 0.9200 | |
| Ours | 0.9404 | 0.9607 | 0.9097 | 0.9178 | |
| 3 | IoTSentinel [4] | 0.8178 | 0.8166 | 0.7947 | 0.7820 |
| IoTSense [7] | 0.8581 | 0.8807 | 0.8425 | 0.8507 | |
| IoTDevID [5] | 0.9349 | 0.9452 | 0.9137 | 0.9243 | |
| Ours | 0.9475 | 0.9618 | 0.9139 | 0.9201 | |
| 4 | IoTSentinel [4] | 0.8150 | 0.8111 | 0.7929 | 0.7830 |
| IoTSense [7] | 0.8501 | 0.8712 | 0.8381 | 0.8469 | |
| IoTDevID [5] | 0.9288 | 0.9375 | 0.9010 | 0.9125 | |
| Ours | 0.9371 | 0.9557 | 0.9086 | 0.9149 | |
| 5 | IoTSentinel [4] | 0.7870 | 0.7865 | 0.7636 | 0.7664 |
| IoTSense [7] | 0.8223 | 0.8437 | 0.8087 | 0.8162 | |
| IoTDevID [5] | 0.9063 | 0.9205 | 0.8801 | 0.8797 | |
| Ours | 0.9336 | 0.9722 | 0.9052 | 0.9112 | |
| 6 | IoTSentinel [4] | 0.7966 | 0.7963 | 0.7714 | 0.7723 |
| IoTSense [7] | 0.8322 | 0.8567 | 0.8203 | 0.8270 | |
| IoTDevID [5] | 0.8955 | 0.9127 | 0.8692 | 0.8684 | |
| Ours | 0.9177 | 0.9422 | 0.8932 | 0.8994 | |
| 7 | IoTSentinel [4] | 0.8122 | 0.8116 | 0.7899 | 0.7953 |
| IoTSense [7] | 0.8478 | 0.8689 | 0.8333 | 0.8411 | |
| IoTDevID [5] | 0.9259 | 0.9406 | 0.8993 | 0.9090 | |
| Ours | 0.9405 | 0.9576 | 0.9142 | 0.9197 | |
| 8 | IoTSentinel [4] | 0.7981 | 0.7984 | 0.7754 | 0.7780 |
| IoTSense [7] | 0.8405 | 0.8635 | 0.8262 | 0.8345 | |
| IoTDevID [5] | 0.9144 | 0.9294 | 0.8882 | 0.8982 | |
| Ours | 0.9322 | 0.9514 | 0.9035 | 0.9097 | |
| 9 | IoTSentinel [4] | 0.8017 | 0.8006 | 0.7787 | 0.7808 |
| IoTSense [7] | 0.8391 | 0.8575 | 0.8136 | 0.8244 | |
| IoTDevID [5] | 0.9049 | 0.9198 | 0.8887 | 0.8987 | |
| Ours | 0.9327 | 0.9518 | 0.9041 | 0.9103 | |
| 10 | IoTSentinel [4] | 0.8074 | 0.8071 | 0.7840 | 0.7869 |
| IoTSense [7] | 0.8425 | 0.8650 | 0.8281 | 0.8359 | |
| IoTDevID [5] | 0.9166 | 0.9308 | 0.8897 | 0.8899 | |
| Ours | 0.9388 | 0.9526 | 0.9049 | 0.9113 | |
| Average | IoTSentinel [4] | 0.8058 | 0.8040 | 0.7817 | 0.7813 |
| IoTSense [7] | 0.8427 | 0.8650 | 0.8276 | 0.8359 | |
| IoTDevID [5] | 0.9175 | 0.9310 | 0.8931 | 0.9011 | |
| Ours | 0.9354 | 0.9539 | 0.9062 | 0.9125 |
The above experimental results are obtained by averaging 20 repetitions. The bold and underline indicate the best performance.
Table A2.
10-fold cross validation results in the Semi-knowledge scenario.
Table A2.
10-fold cross validation results in the Semi-knowledge scenario.
| Fold Number | Study | Acc | P | R | F1 |
|---|---|---|---|---|---|
| 1 | IoTSentinel [4] | 0.8046 | 0.8036 | 0.7813 | 0.7837 |
| IoTSense [7] | 0.7018 | 0.7176 | 0.6651 | 0.6625 | |
| IoTDevID [5] | 0.8977 | 0.8886 | 0.8600 | 0.8654 | |
| Ours | 0.9275 | 0.9169 | 0.8956 | 0.9014 | |
| 2 | IoTSentinel [4] | 0.8155 | 0.8143 | 0.7922 | 0.7946 |
| IoTSense [7] | 0.7055 | 0.7210 | 0.6683 | 0.6685 | |
| IoTDevID [5] | 0.9116 | 0.9298 | 0.8799 | 0.8923 | |
| Ours | 0.9331 | 0.9235 | 0.9043 | 0.9088 | |
| 3 | IoTSentinel [4] | 0.8110 | 0.8122 | 0.7880 | 0.7912 |
| IoTSense [7] | 0.7054 | 0.7228 | 0.6667 | 0.6701 | |
| IoTDevID [5] | 0.9167 | 0.9347 | 0.8848 | 0.8978 | |
| Ours | 0.9373 | 0.9263 | 0.9077 | 0.9112 | |
| 4 | IoTSentinel [4] | 0.8078 | 0.8039 | 0.7816 | 0.7836 |
| IoTSense [7] | 0.7033 | 0.7198 | 0.6658 | 0.6679 | |
| IoTDevID [5] | 0.9111 | 0.9241 | 0.8763 | 0.8887 | |
| Ours | 0.9309 | 0.9237 | 0.9012 | 0.9009 | |
| 5 | IoTSentinel [4] | 0.7829 | 0.7833 | 0.7601 | 0.7627 |
| IoTSense [7] | 0.6878 | 0.7077 | 0.6574 | 0.6514 | |
| IoTDevID [5] | 0.8875 | 0.8784 | 0.8498 | 0.8553 | |
| Ours | 0.9276 | 0.9170 | 0.8959 | 0.9015 | |
| 6 | IoTSentinel [4] | 0.7965 | 0.7980 | 0.7638 | 0.7668 |
| IoTSense [7] | 0.6664 | 0.6897 | 0.6443 | 0.6437 | |
| IoTDevID [5] | 0.8767 | 0.8676 | 0.8391 | 0.8445 | |
| Ours | 0.9121 | 0.8964 | 0.8752 | 0.8809 | |
| 7 | IoTSentinel [4] | 0.8024 | 0.8025 | 0.7790 | 0.7820 |
| IoTSense [7] | 0.7033 | 0.7208 | 0.6683 | 0.6706 | |
| IoTDevID [5] | 0.8974 | 0.8880 | 0.8597 | 0.8652 | |
| Ours | 0.9339 | 0.9272 | 0.9103 | 0.9146 | |
| 8 | IoTSentinel [4] | 0.7973 | 0.7962 | 0.7736 | 0.7762 |
| IoTSense [7] | 0.6999 | 0.7153 | 0.6623 | 0.6637 | |
| IoTDevID [5] | 0.8983 | 0.8891 | 0.8605 | 0.8660 | |
| Ours | 0.9284 | 0.9176 | 0.8969 | 0.9026 | |
| 9 | IoTSentinel [4] | 0.7955 | 0.7952 | 0.7716 | 0.7704 |
| IoTSense [7] | 0.6877 | 0.7074 | 0.6588 | 0.6573 | |
| IoTDevID [5] | 0.8879 | 0.8788 | 0.8502 | 0.8557 | |
| Ours | 0.9206 | 0.9068 | 0.8865 | 0.8919 | |
| 10 | IoTSentinel [4] | 0.7979 | 0.7975 | 0.7754 | 0.7780 |
| IoTSense [7] | 0.7022 | 0.7169 | 0.6684 | 0.6681 | |
| IoTDevID [5] | 0.8970 | 0.8880 | 0.8594 | 0.8648 | |
| Ours | 0.9272 | 0.9168 | 0.8957 | 0.9013 | |
| Average | IoTSentinel [4] | 0.8011 | 0.8007 | 0.7767 | 0.7789 |
| IoTSense [7] | 0.6963 | 0.7139 | 0.6625 | 0.6624 | |
| IoTDevID [5] | 0.8982 | 0.8967 | 0.8620 | 0.8696 | |
| Ours | 0.9279 | 0.9172 | 0.8957 | 0.9015 |
The above experimental results are obtained by averaging 20 repetitions. The bold and underline indicate the best performance.
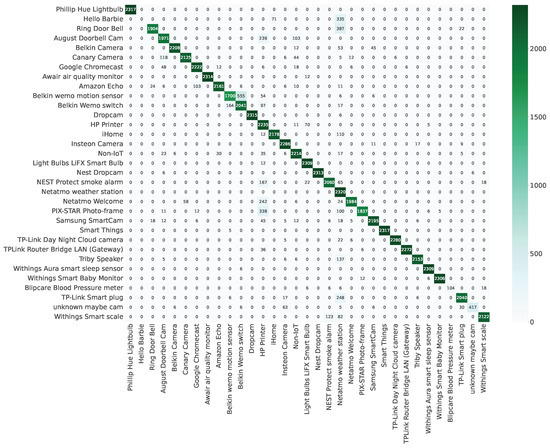
Figure A1.
Confusion matrix of devices in the Semi-knowledge scenario.
Figure A1.
Confusion matrix of devices in the Semi-knowledge scenario.
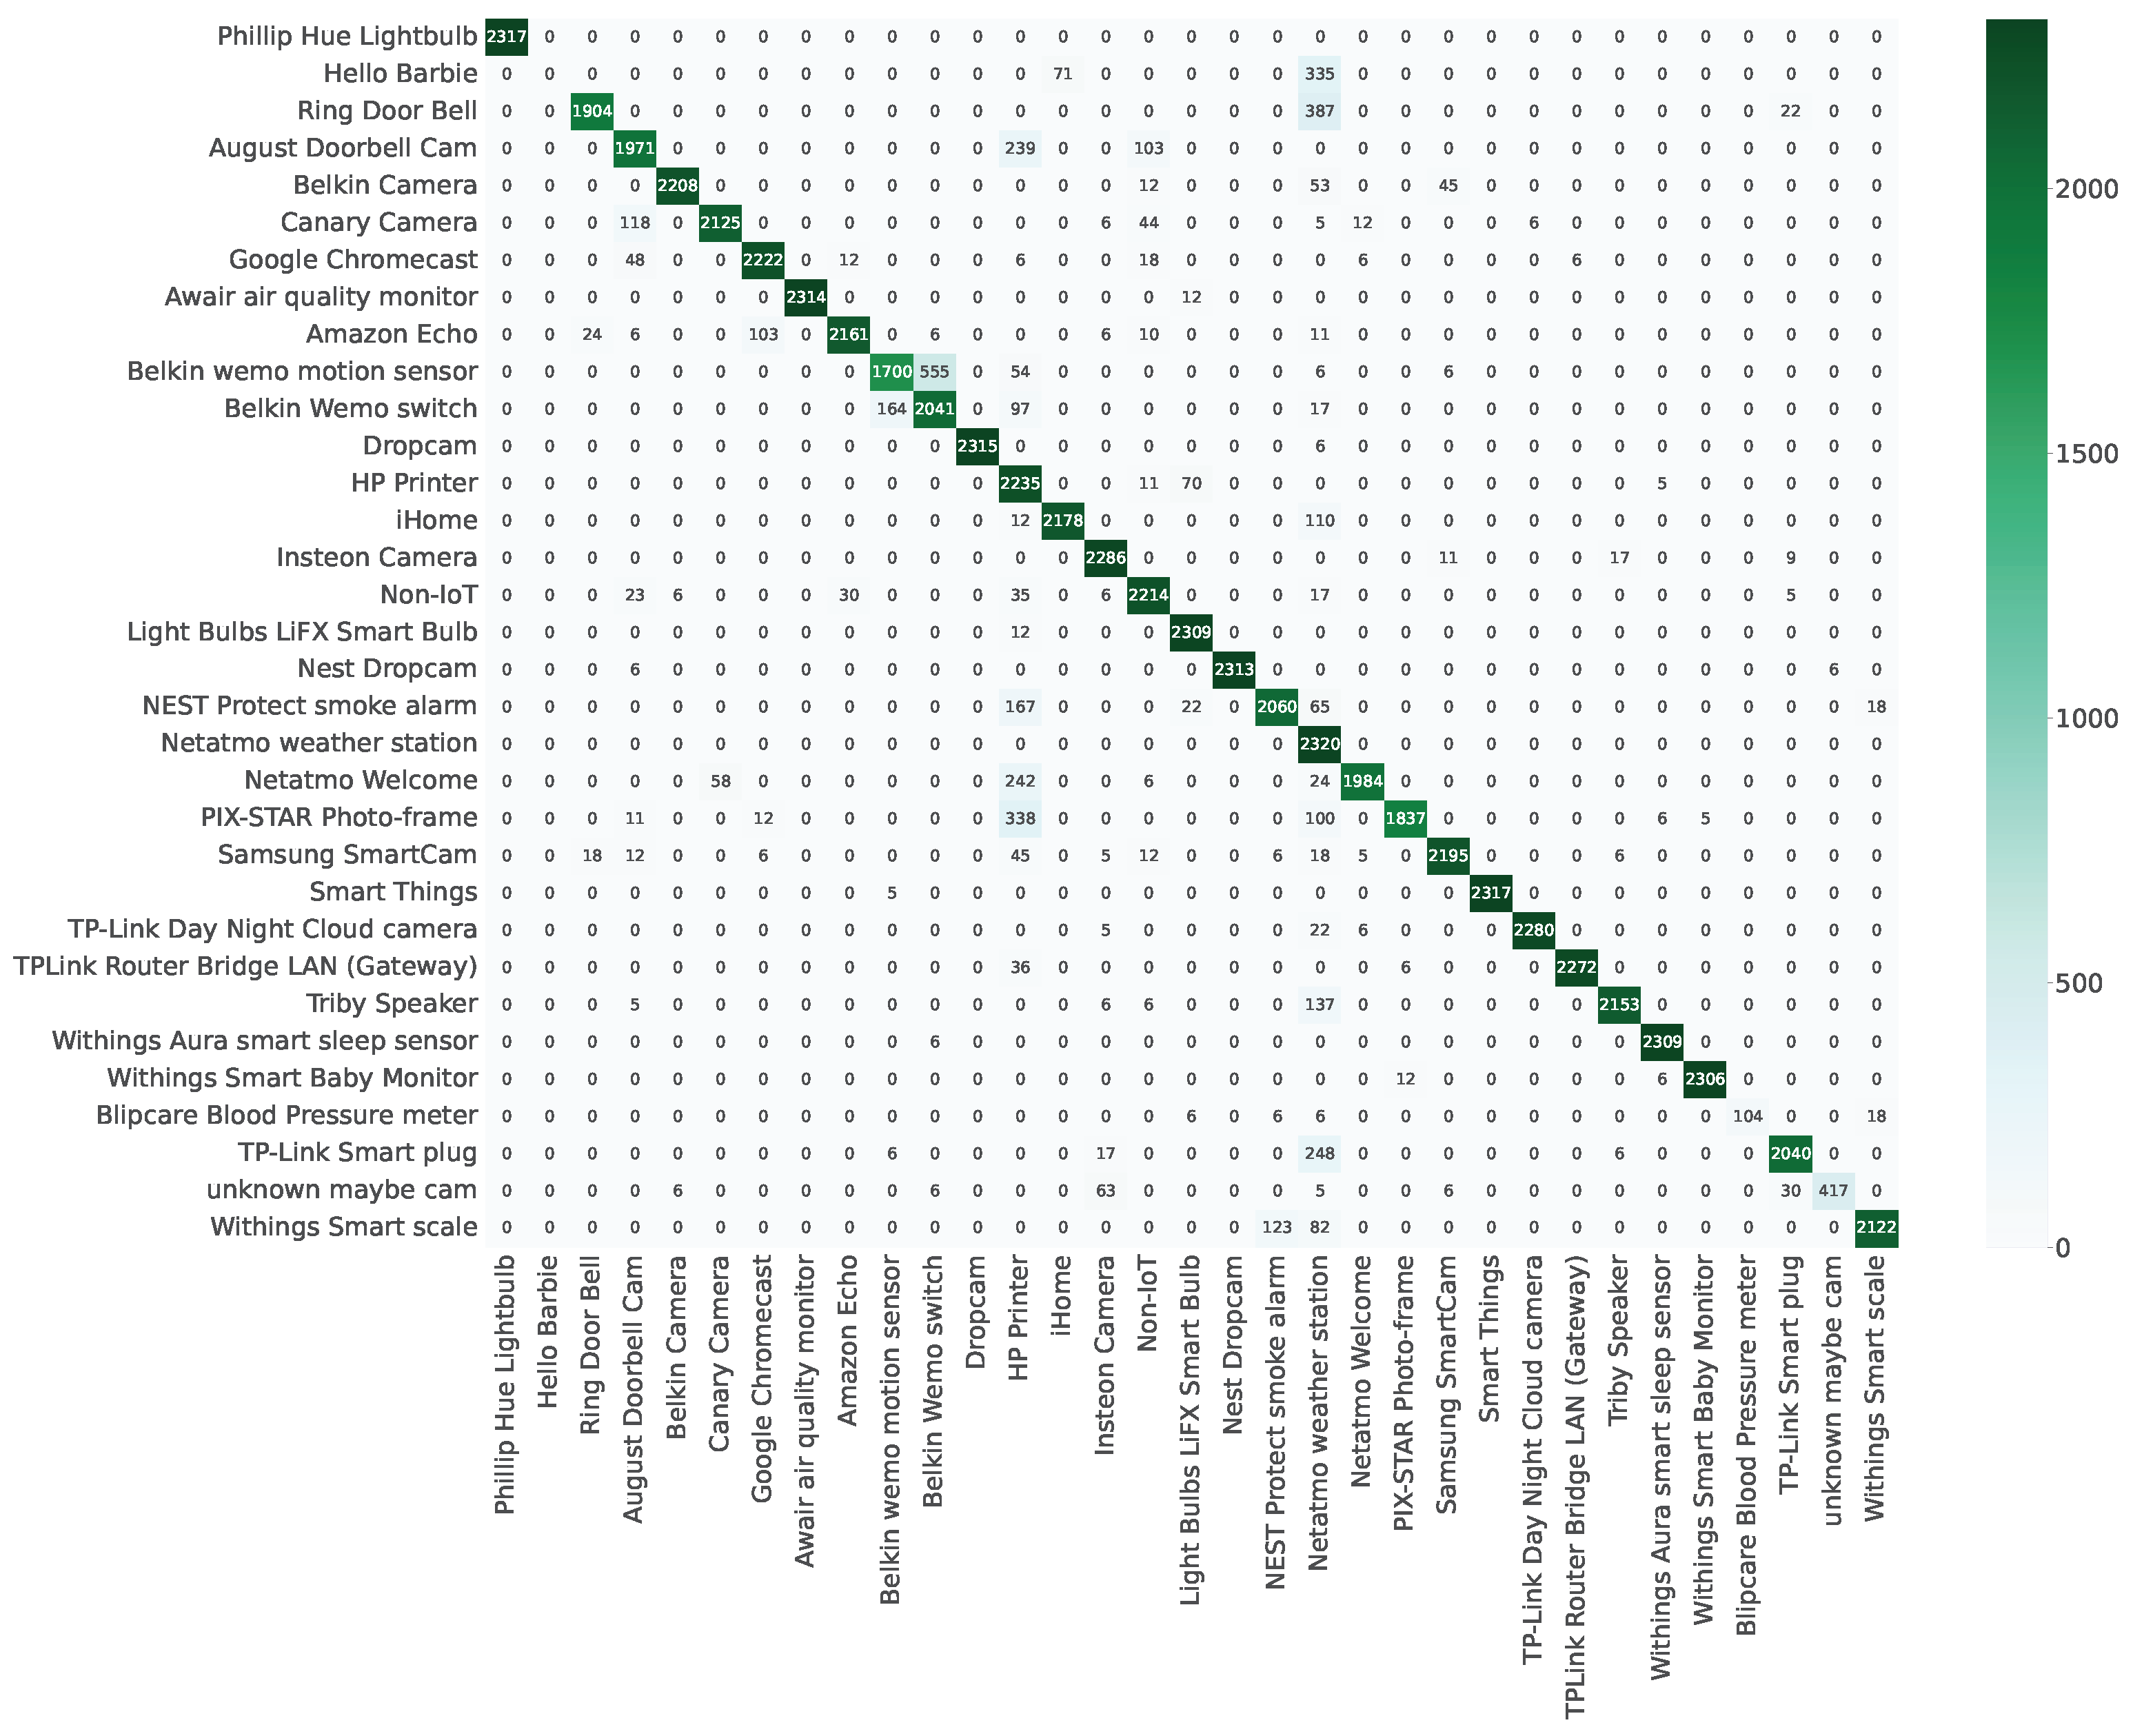
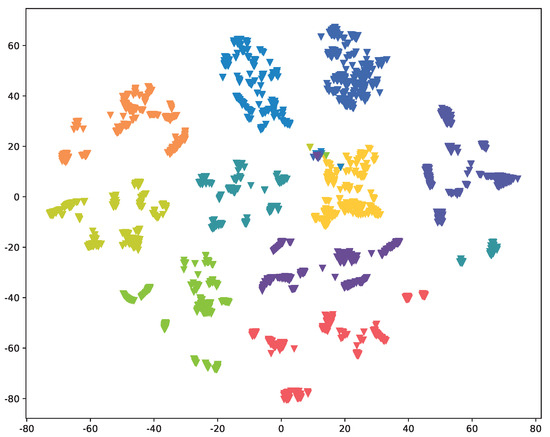
Figure A2.
Distribution (visualized using t-SNE) of the device fingerprint extracted by Res-DFNN in the Semi-knowledge scenario.
Figure A2.
Distribution (visualized using t-SNE) of the device fingerprint extracted by Res-DFNN in the Semi-knowledge scenario.
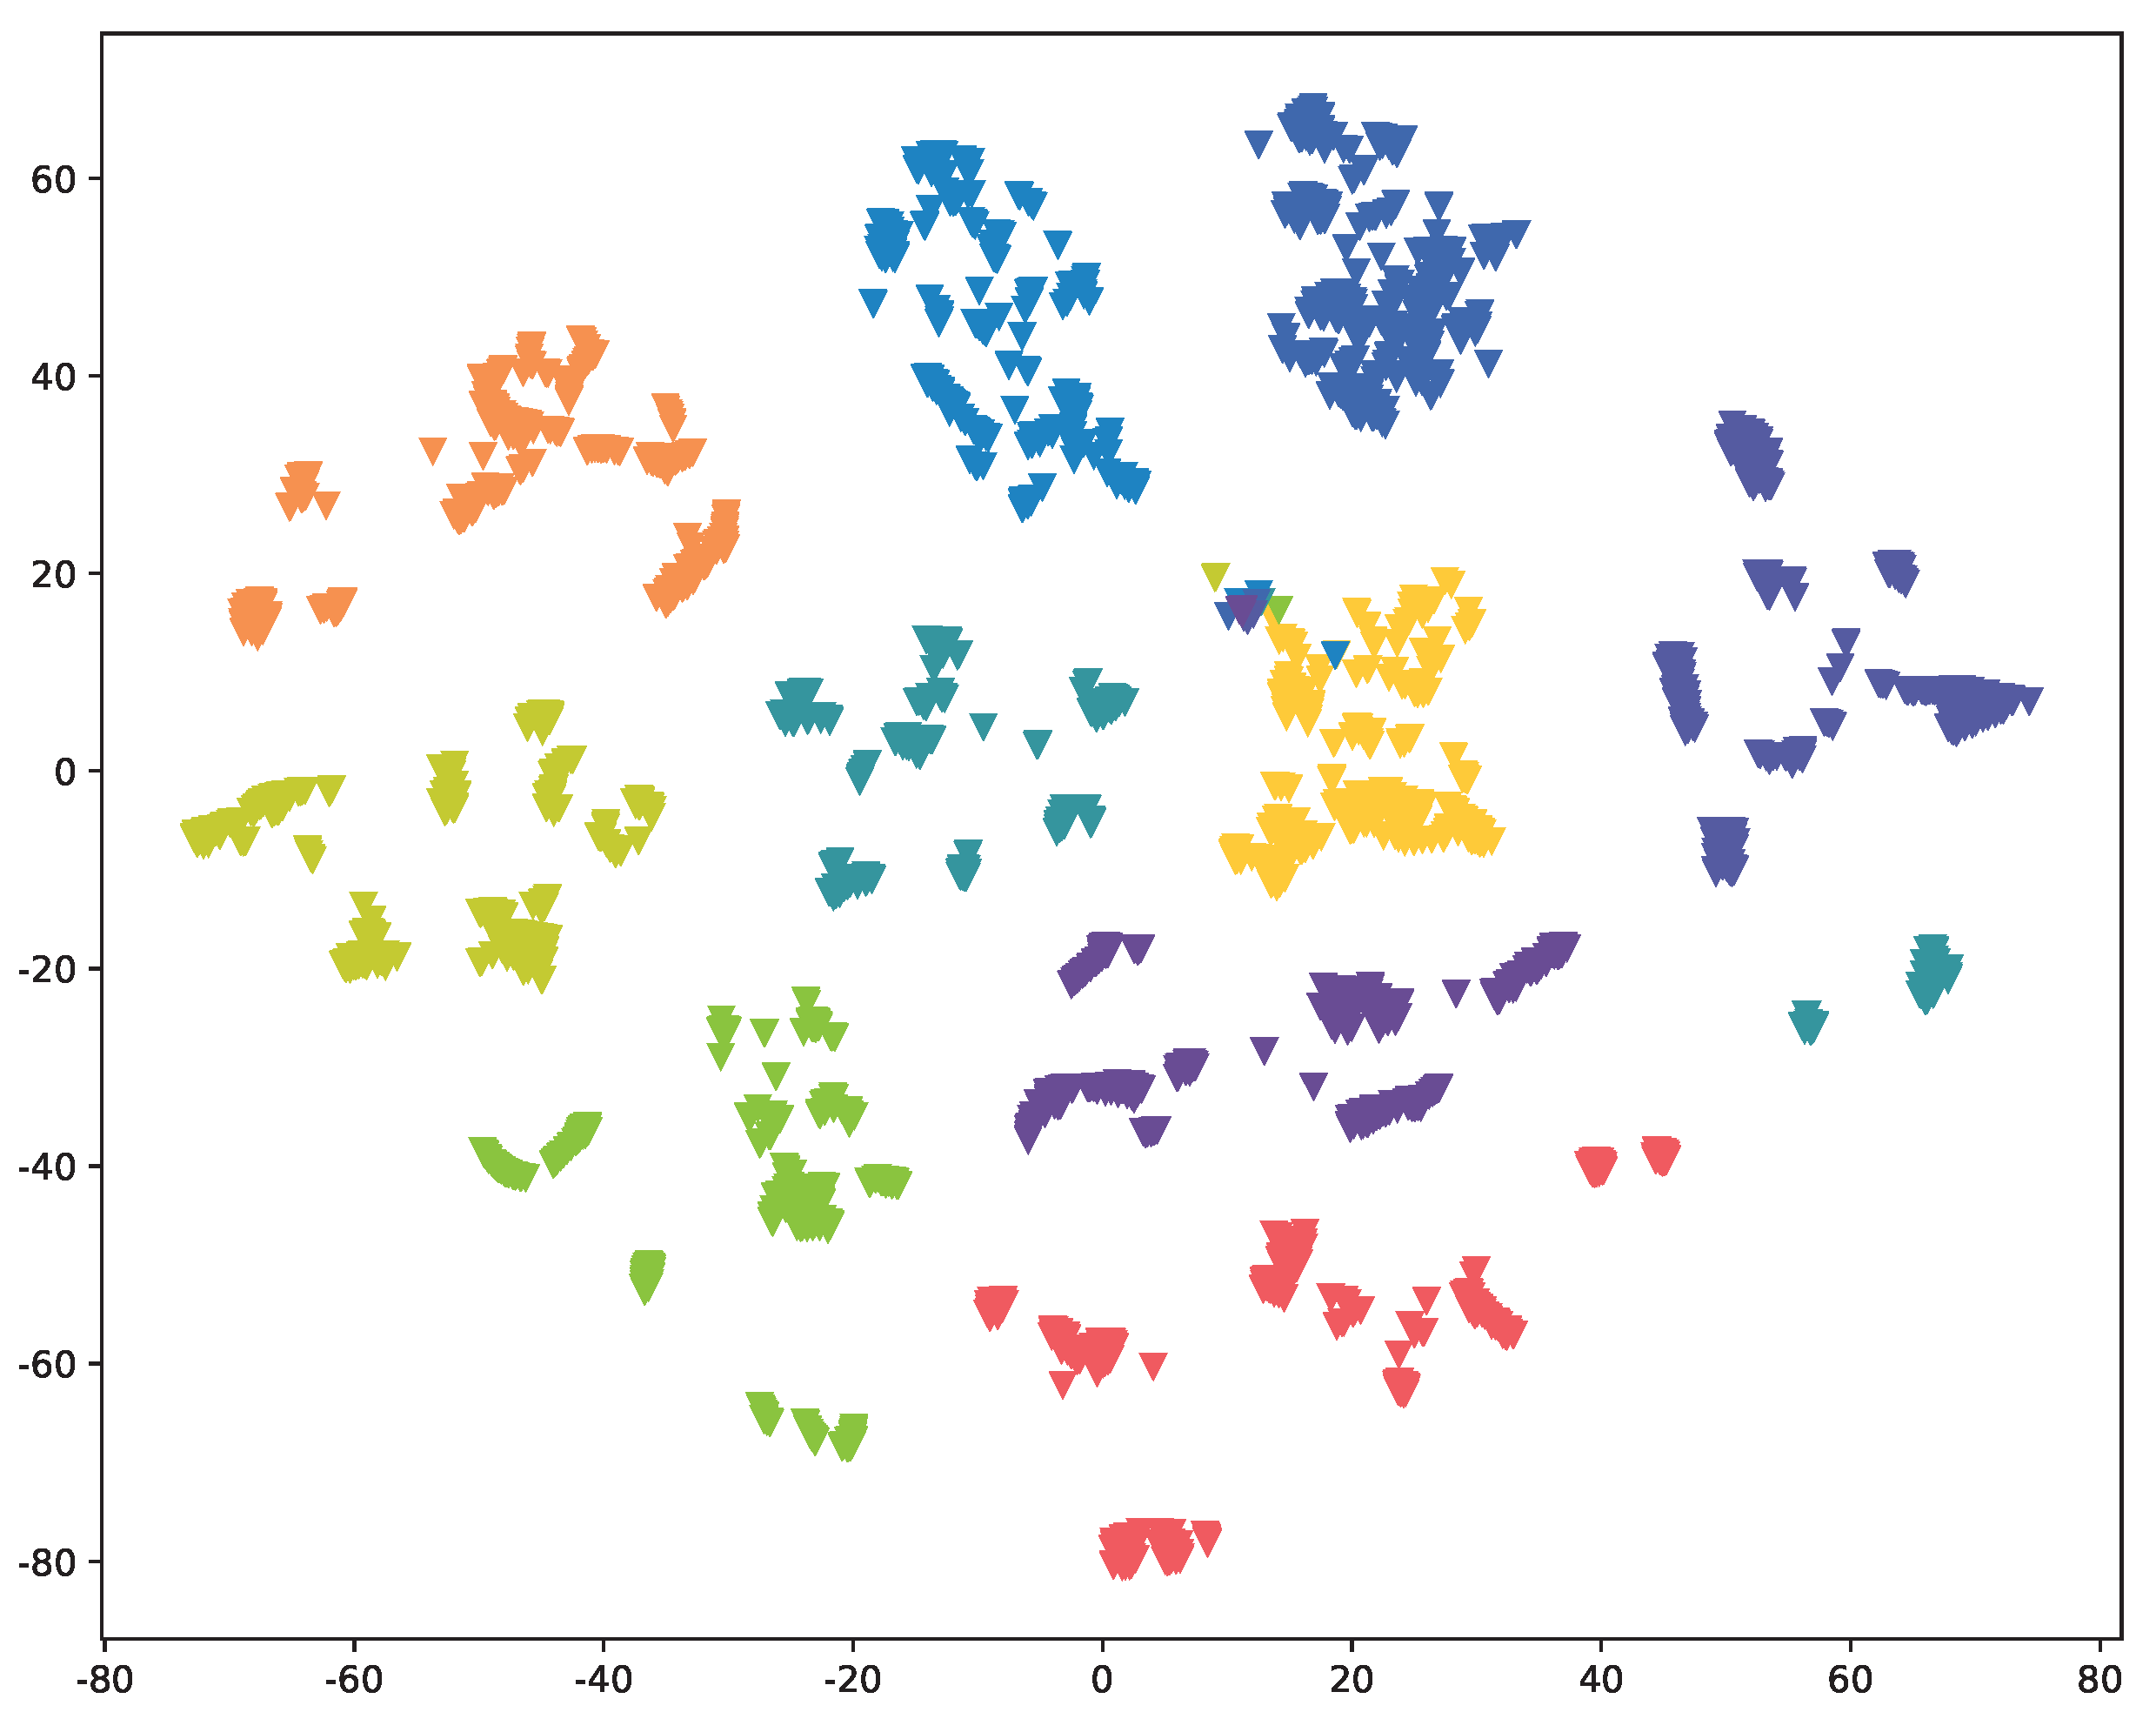

Figure A3.
Distribution (visualized using t-SNE) of the device fingerprint extracted by Res-DFNN (without residual connections).
Figure A3.
Distribution (visualized using t-SNE) of the device fingerprint extracted by Res-DFNN (without residual connections).
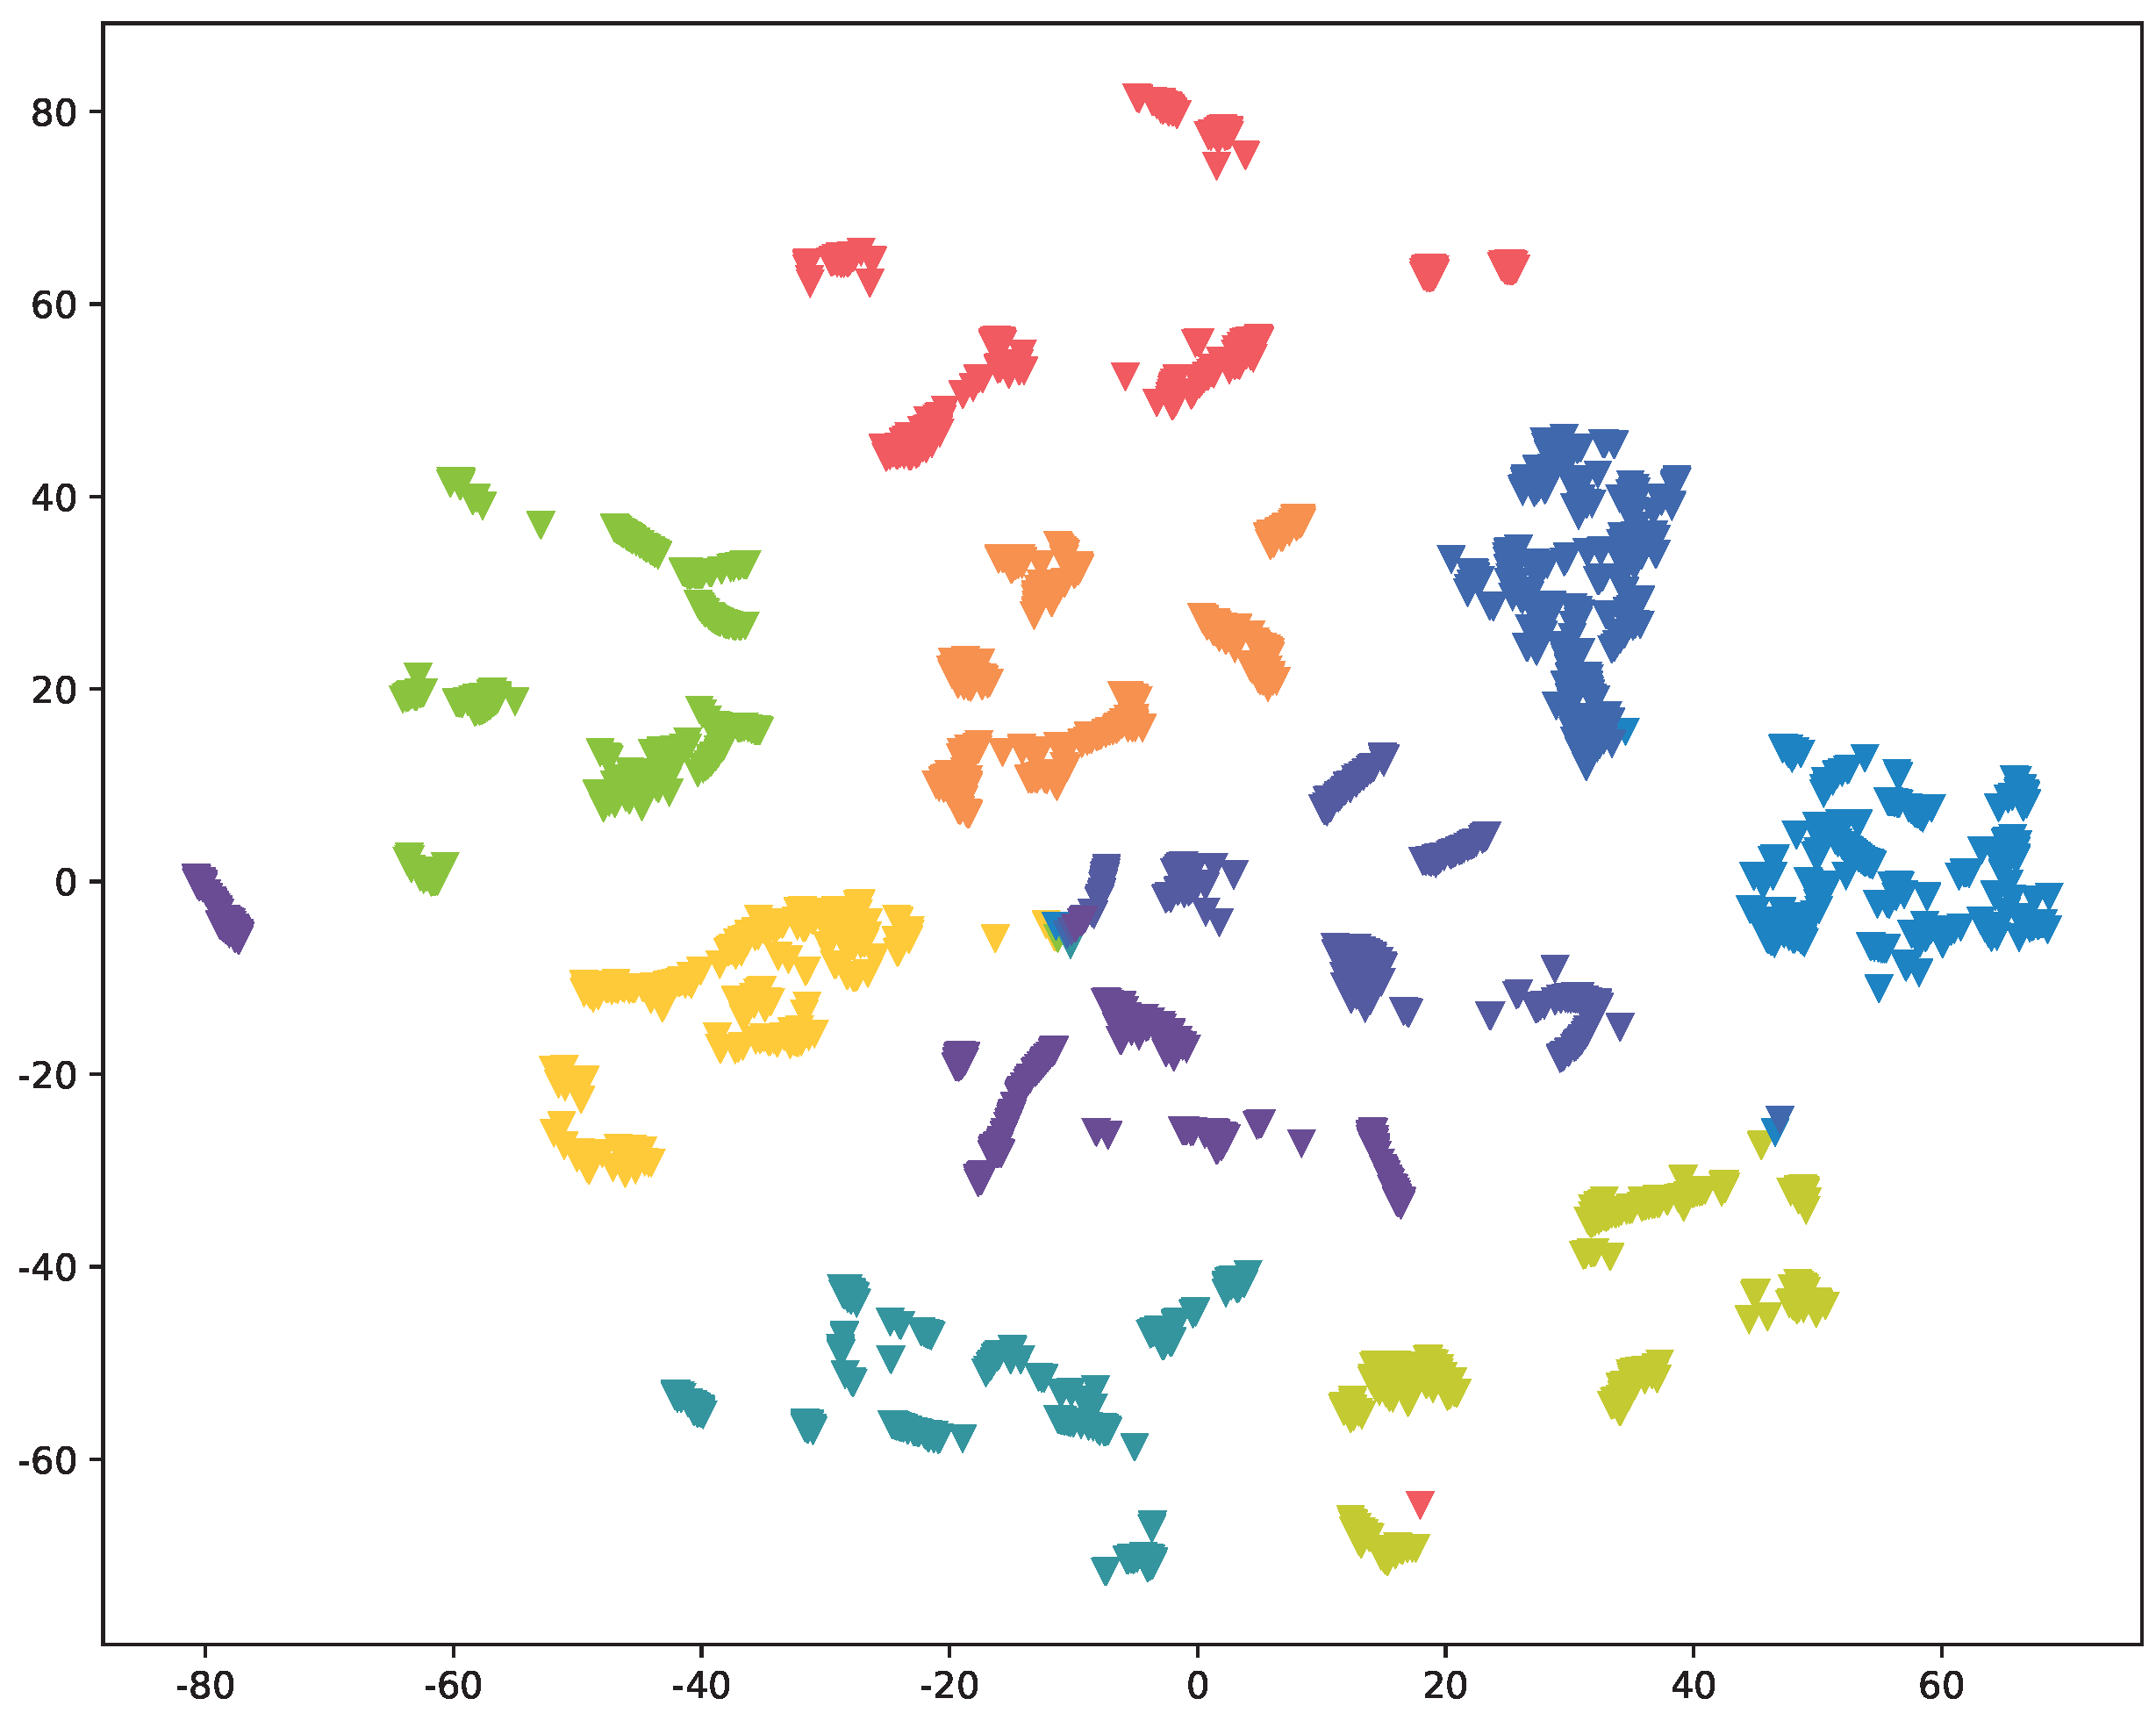
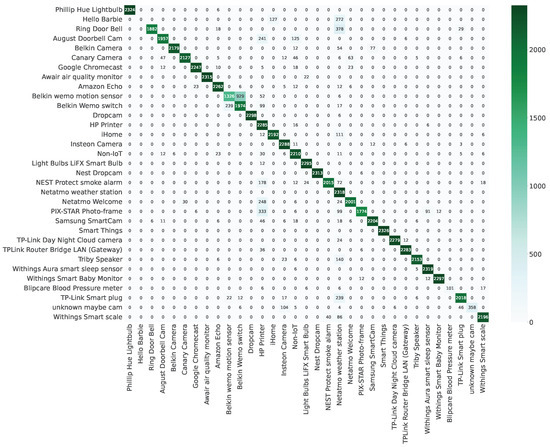
Figure A4.
Confusion matrix of devices (without residual connections).
Figure A4.
Confusion matrix of devices (without residual connections).

References
- Xie, N.; Leung, H. Internet of Things (IoT) in Canadian Smart Cities: An Overview. IEEE Instrum. Meas. Mag. 2021, 24, 68–77. [Google Scholar] [CrossRef]
- Kolias, C.; Kambourakis, G.; Stavrou, A.; Voas, J. DDoS in the IoT: Mirai and other botnets. Computer 2017, 50, 80–84. [Google Scholar] [CrossRef]
- Kouicem, D.E.; Bouabdallah, A.; Lakhlef, H. Internet of things security: A top-down survey. Comput. Netw. 2018, 141, 199–221. [Google Scholar] [CrossRef]
- Miettinen, M.; Marchal, S.; Hafeez, I.; Asokan, N.; Sadeghi, A.R.; Tarkoma, S. Iot sentinel: Automated device-type identification for security enforcement in iot. In Proceedings of the 2017 IEEE 37th International Conference on Distributed Computing Systems (ICDCS), Atlanta, GA, USA, 5–8 June 2017; pp. 2177–2184. [Google Scholar]
- Kostas, K.; Just, M.; Lones, M.A. IoTDevID: A behavior-based device identification method for the IoT. IEEE Internet Things J. 2022, 9, 23741–23749. [Google Scholar] [CrossRef]
- Mazhar, M.H.; Shafiq, Z. Characterizing smart home iot traffic in the wild. In Proceedings of the 2020 IEEE/ACM Fifth International Conference on Internet-of-Things Design and Implementation (IoTDI), Sydney, NSW, Australia, 21–24 April 2020; pp. 203–215. [Google Scholar]
- Bezawada, B.; Bachani, M.; Peterson, J.; Shirazi, H.; Ray, I.; Ray, I. Behavioral fingerprinting of iot devices. In Proceedings of the 2018 Workshop on Attacks and Solutions in Hardware Security, Toronto, ON, Canada, 15–19 October 2018; pp. 41–50. [Google Scholar]
- Aneja, S.; Aneja, N.; Islam, M.S. IoT device fingerprint using deep learning. In Proceedings of the 2018 IEEE International Conference on Internet of Things and Intelligence System (IOTAIS), Bali, Indonesia, 1–3 November 2018; pp. 174–179. [Google Scholar]
- Noguchi, H.; Demizu, T.; Hoshikawa, N.; Kataoka, M.; Yamato, Y. Autonomous device identification architecture for Internet of Things. In Proceedings of the 2018 IEEE 4th World Forum on Internet of Things (WF-IoT), Singapore, 5–8 February 2018; pp. 407–411. [Google Scholar]
- Guo, H.; Heidemann, J. Detecting iot devices in the internet. IEEE/ACM Trans. Netw. 2020, 28, 2323–2336. [Google Scholar] [CrossRef]
- Marchal, S.; Miettinen, M.; Nguyen, T.D.; Sadeghi, A.R.; Asokan, N. Audi: Toward autonomous iot device-type identification using periodic communication. IEEE J. Sel. Areas Commun. 2019, 37, 1402–1412. [Google Scholar] [CrossRef]
- Sivanathan, A.; Gharakheili, H.H.; Loi, F.; Radford, A.; Wijenayake, C.; Vishwanath, A.; Sivaraman, V. Classifying IoT devices in smart environments using network traffic characteristics. IEEE Trans. Mob. Comput. 2018, 18, 1745–1759. [Google Scholar] [CrossRef]
- Fan, L.; He, L.; Wu, Y.; Zhang, S.; Wang, Z.; Li, J.; Yang, J.; Xiang, C.; Ma, X. AutoIoT: Automatically Updated IoT Device Identification With Semi-Supervised Learning. IEEE Trans. Mob. Comput. 2022, 22, 5769–5786. [Google Scholar] [CrossRef]
- Van Randwyk, J.A.; Franklin, J.; McCoy, D.; Tabriz, P.; Neagoe, V.; Sicker, D. Passive Data Link Layer 802.11 Wireless Device Driver Fingerprinting; Technical Report; Sandia National Lab. (SNL-CA): Livermore, CA, USA, 2006. [Google Scholar]
- Charyyev, B.; Gunes, M.H. IoT traffic flow identification using locality sensitive hashes. In Proceedings of the 2020 IEEE International Conference on Communications (ICC 2020), Dublin, Ireland, 7–11 June 2020; pp. 1–6. [Google Scholar]
- Aksoy, A.; Gunes, M.H. Automated iot device identification using network traffic. In Proceedings of the 2019 IEEE International Conference on Communications (ICC 2019), Shanghai, China, 20–24 May 2019; pp. 1–7. [Google Scholar]
- Sánchez, P.M.S.; Valero, J.M.J.; Celdrán, A.H.; Bovet, G.; Pérez, M.G.; Pérez, G.M. A survey on device behavior fingerprinting: Data sources, techniques, application scenarios, and datasets. IEEE Commun. Surv. Tutor. 2021, 23, 1048–1077. [Google Scholar] [CrossRef]
- European Parliament; Council of the European Union. Regulation (EU) 2016/679 of the European Parliament and of the Council; European Parliament: Strasbourg, France, 2016. [Google Scholar]
- He, K.; Zhang, X.; Ren, S.; Sun, J. Deep residual learning for image recognition. In Proceedings of the IEEE Conference on Computer Vision and Pattern Recognition, Las Vegas, NV, USA, 27–30 June 2016; pp. 770–778. [Google Scholar]
- He, K.; Zhang, X.; Ren, S.; Sun, J. Identity mappings in deep residual networks. In Proceedings of the 14th European Conference, Amsterdam, The Netherlands, 11–14 October 2016; pp. 630–645. [Google Scholar]
- Wightman, R.; Touvron, H.; Jégou, H. Resnet strikes back: An improved training procedure in timm. arXiv 2021, arXiv:2110.00476. [Google Scholar]
- Balduzzi, D.; Frean, M.; Leary, L.; Lewis, J.; Ma, K.W.D.; McWilliams, B. The shattered gradients problem: If resnets are the answer, then what is the question? Proc. Mach. Learn. Res. 2017, 70, 342–350. [Google Scholar]
- Sankararaman, K.A.; De, S.; Xu, Z.; Huang, W.R.; Goldstein, T. The impact of neural network overparameterization on gradient confusion and stochastic gradient descent. Proc. Mach. Learn. Res. 2020, 119, 8469–8479. [Google Scholar]
- Orhan, A.E.; Pitkow, X. Skip connections eliminate singularities. arXiv 2017, arXiv:1701.09175. [Google Scholar]
- Desplanques, B.; Thienpondt, J.; Demuynck, K. Ecapa-tdnn: Emphasized channel attention, propagation and aggregation in tdnn based speaker verification. arXiv 2020, arXiv:2005.07143. [Google Scholar]
- He, Y.; Yingyan, D.; Peng, W. Voiceprint recognition based on CNN-LSTM network. Comput. Appl. Softw. 2019, 4, 166–170. [Google Scholar]
- Lingfei, Y.; Qiang, L. Research and application of deep recurrent neural networks based voiceprint recognition. Appl. Res. Comput. 2019, 1, 153–158. [Google Scholar]
- Dauvergne, P. Introducing facial recognition technology. In Identified, Tracked, and Profiled; Edward Elgar Publishing: Cheltenham, UK, 2022; pp. 2–9. [Google Scholar]
- Sharma, R.; Sharma, V.K.; Singh, A. A Review Paper on Facial Recognition Techniques. In Proceedings of the 2021 Fifth International Conference on I-SMAC (IoT in Social, Mobile, Analytics and Cloud) (I-SMAC), Palladam, India, 11–13 November 2021; pp. 617–621. [Google Scholar]
- Liu, W.; Wen, Y.; Yu, Z.; Yang, M. Large-margin softmax loss for convolutional neural networks. arXiv 2016, arXiv:1612.02295. [Google Scholar]
- Bai, Z.; Zhang, X.L. Speaker recognition based on deep learning: An overview. Neural Netw. 2021, 140, 65–99. [Google Scholar] [CrossRef]
- Deng, J.; Guo, J.; Xue, N.; Zafeiriou, S. Arcface: Additive angular margin loss for deep face recognition. In Proceedings of the IEEE/CVF Conference on Computer Vision and Pattern Recognition, Long Beach, CA, USA, 15–20 June 2019; pp. 4690–4699. [Google Scholar]
- Hamza, A.; Gharakheili, H.H.; Benson, T.A.; Sivaraman, V. Detecting volumetric attacks on lot devices via sdn-based monitoring of mud activity. In Proceedings of the 2019 ACM Symposium on SDN Research, San Jose, CA, USA, 3–4 April 2019; pp. 36–48. [Google Scholar]
- Paszke, A.; Gross, S.; Massa, F.; Lerer, A.; Bradbury, J.; Chanan, G.; Killeen, T.; Lin, Z.; Gimelshein, N.; Antiga, L.; et al. Pytorch: An imperative style, high-performance deep learning library. Adv. Neural Inf. Process. Syst. 2019, 32, 1–12. [Google Scholar]
- Kingma, D.P.; Ba, J. Adam: A Method for Stochastic Optimization. arXiv 2015, arXiv:1412.6980. [Google Scholar]
- van der Maaten, L.; Hinton, G. Visualizing Data using t-SNE. J. Mach. Learn. Res. 2008, 9, 2579–2605. [Google Scholar]

Disclaimer/Publisher’s Note: The statements, opinions and data contained in all publications are solely those of the individual author(s) and contributor(s) and not of MDPI and/or the editor(s). MDPI and/or the editor(s) disclaim responsibility for any injury to people or property resulting from any ideas, methods, instructions or products referred to in the content. |
© 2024 by the authors. Licensee MDPI, Basel, Switzerland. This article is an open access article distributed under the terms and conditions of the Creative Commons Attribution (CC BY) license (https://creativecommons.org/licenses/by/4.0/).