Review

Nanoframes as a Resilient Candidate for a Broader Spectra of Catalysis Challenges

by
Fawad Ahmad
1,*,
Qurat ul Ain
1,
Shafaq Zahid
1 and
Takashiro Akitsu
2,*
1
Department of Chemistry, University of Wah, Quaid Avenue, Wah Cantt 47040, Pakistan
2
Department of Chemistry, Faculty of Science, Tokyo University of Science, Tokyo 162-8601, Japan
*
Authors to whom correspondence should be addressed.
Symmetry 2024, 16(4), 452; https://doi.org/10.3390/sym16040452
Submission received: 29 January 2024 / Revised: 5 March 2024 / Accepted: 11 March 2024 / Published: 8 April 2024

Abstract

:
Metal nanoframes have gained tremendous attention in the domain of modern research and development due to their distinctive 3D spatial structure, efficient physiochemical properties, and comparatively good activity. Different strategies have been implicated by the researchers to design nanoframes of varying chemical natures and shapes. Most of the synthetic protocols being adopted to design nanoframes consist of two main steps: nucleation and the growth of solid particles and, secondly, excavation of the interiors. In this context, many synthetic methods are overviewed. To show their unprecedented performance or activity, a few applications in catalysis, biomedicine, theranostics, SERS, the sensing of different materials, the reduction of CO2, etc., are also discussed.

1. Introduction

Different nanostructures have been synthesized previously by many research groups, including nanostars [1,2], nanobowls [3], nanorings [4], nanohexagons [5], nanopeapods [6], nanowalls [7], nanotubes [8], nanowires [9], and nanorods [10]. Various vacant nanostructures have been synthesized, i.e., nanoboxes [11,12,13], nanocages [14,15,16], nanoshells [17,18,19], and nanoframes [20,21]. Among all of these nanomaterials, hollow structures have garnered much attention because of their distinctive physical, chemical, catalytic, magnetic, electronic, and optical characteristics when compared to their bulk material [22,23]. Among all of the above-discussed vacant nanomaterials, the appreciable open structure is possessed by nanoframes. They are defined as nanocrystals that only consist of ridges lacking faces. Nanoframes of different shapes are reported in the literature, i.e., cubic, octahedral, dodecahedral, icosahedral, and plasmonic tripod [24,25,26,27,28]. Various synthetic strategies have been used to synthesize nanoframes. Regardless of the synthetic technique that is employed, there are two main steps that are always followed [23]. Initially, nucleation and the growth of primary particles take place and then the excavation of the interior happens [29,30]. In addition to the most commonly used synthetic strategies like the galvanic replacement reaction, one-pot synthesis, and etching, some other methods have also been used by researchers, i.e., thermal reductions, template-assisted synthesis [31], the self-assembly of nanoparticles [32], and solvothermal methods [33,34]. Metallic nanoframes have a distinctive morphology, which makes them most suitable for use in the catalytic domain [35,36,37]. When considering the stability of these metal nanoframe-like structures in comparison to other heterogenous catalysts, the former is the most stable one. The reason is that a high surface area to volume ratio in the latter is achieved by decreasing the catalyst size, which in turn threatens its stability. However, in the former case, the excavation of material from the interior of the catalyst takes place, creating more room for the catalytic reaction to proceed. Apart from their efficient catalytic activity in the ORR (oxygen reduction reaction), EOR (ethanol oxidation reaction), MOR (methanol oxidation reaction), HER (hydrogen evaluation reaction), and biomass upgrading, many efforts have been made to use them in other domains as well. Their shape, size and composition can be customized [38] according to the demand.
This review explains how nanoframes could become a strong choice for solving many of the problems faced during large-scale catalysis. We aimed to summarize the various synthetic methods used to create nanoframes with the goal of refining their synthesis and conducting a comparative analysis among different approaches to enhance their efficiency in addressing catalysis challenges. These synthetic methods encompass the GRR (galvanic replacement reaction), one-pot synthesis, oxidative etching, the photocatalytic template-assisted method, the solvothermal technique, the self-assembly of nanoparticles, thermal reductions, the de-alloying of alloy nanocrystals, the edge-selected deposition of different metals on the template, and the face-selected carving of the solid nanocrystals. This review investigates various classifications of nanoframes based on their composition, including metal NFs, alloy metal NFs, and doped metal NFs. It explores their synthetic procedures and specific catalytic applications. Given the significant role of nanoframes in addressing catalytic challenges, this article focuses extensively on their applications, highlighting their catalytic potential. It discusses the mechanisms underlying the action of nanoframes and explores their application in various fields, including biomedicine, theranostics, surface-enhanced Raman spectroscopy (SERS), carbon dioxide reduction, the sensing of volatile organic compounds (VOCs), hydrogen sulfide gas, cobalt ion detection, dye detection, the electrochemical production of hydrogen peroxide in acidic conditions, and as materials in lithium-ion battery anodes.

2. Synthetic Approaches

There are different synthetic procedures which are used now a days to synthesize Nano frames. A summary showing the different synthetic protocols that have been used to design different Nano frames are provided in Table 1 and the detailed of each of procedure is given below

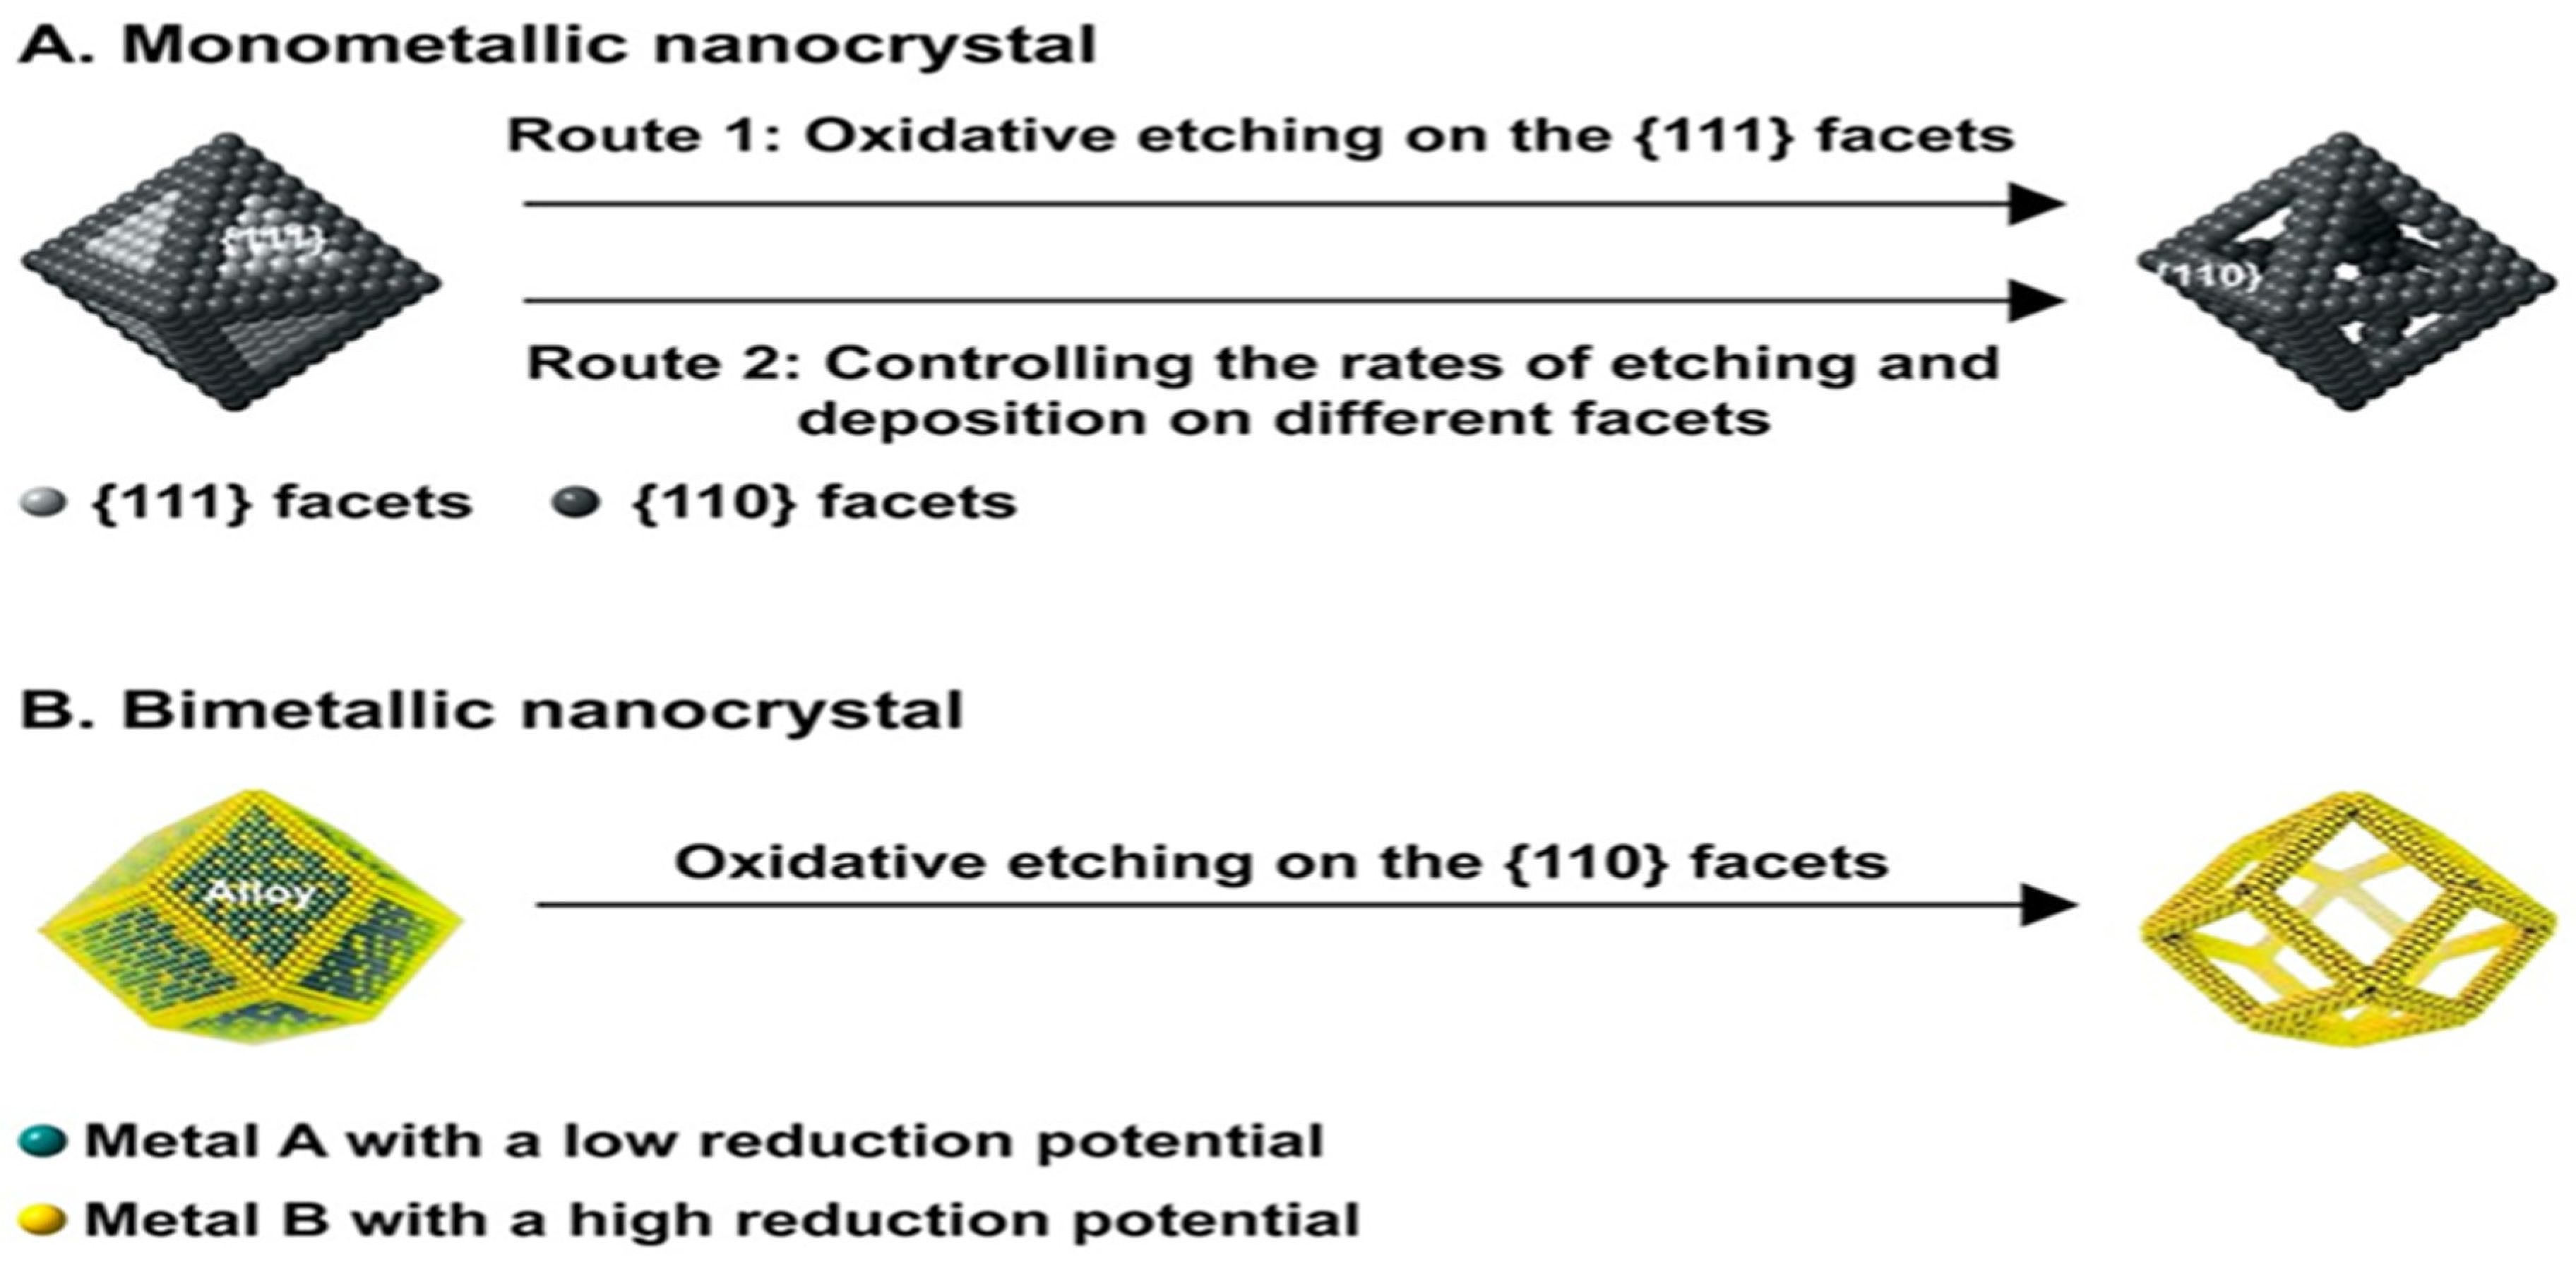
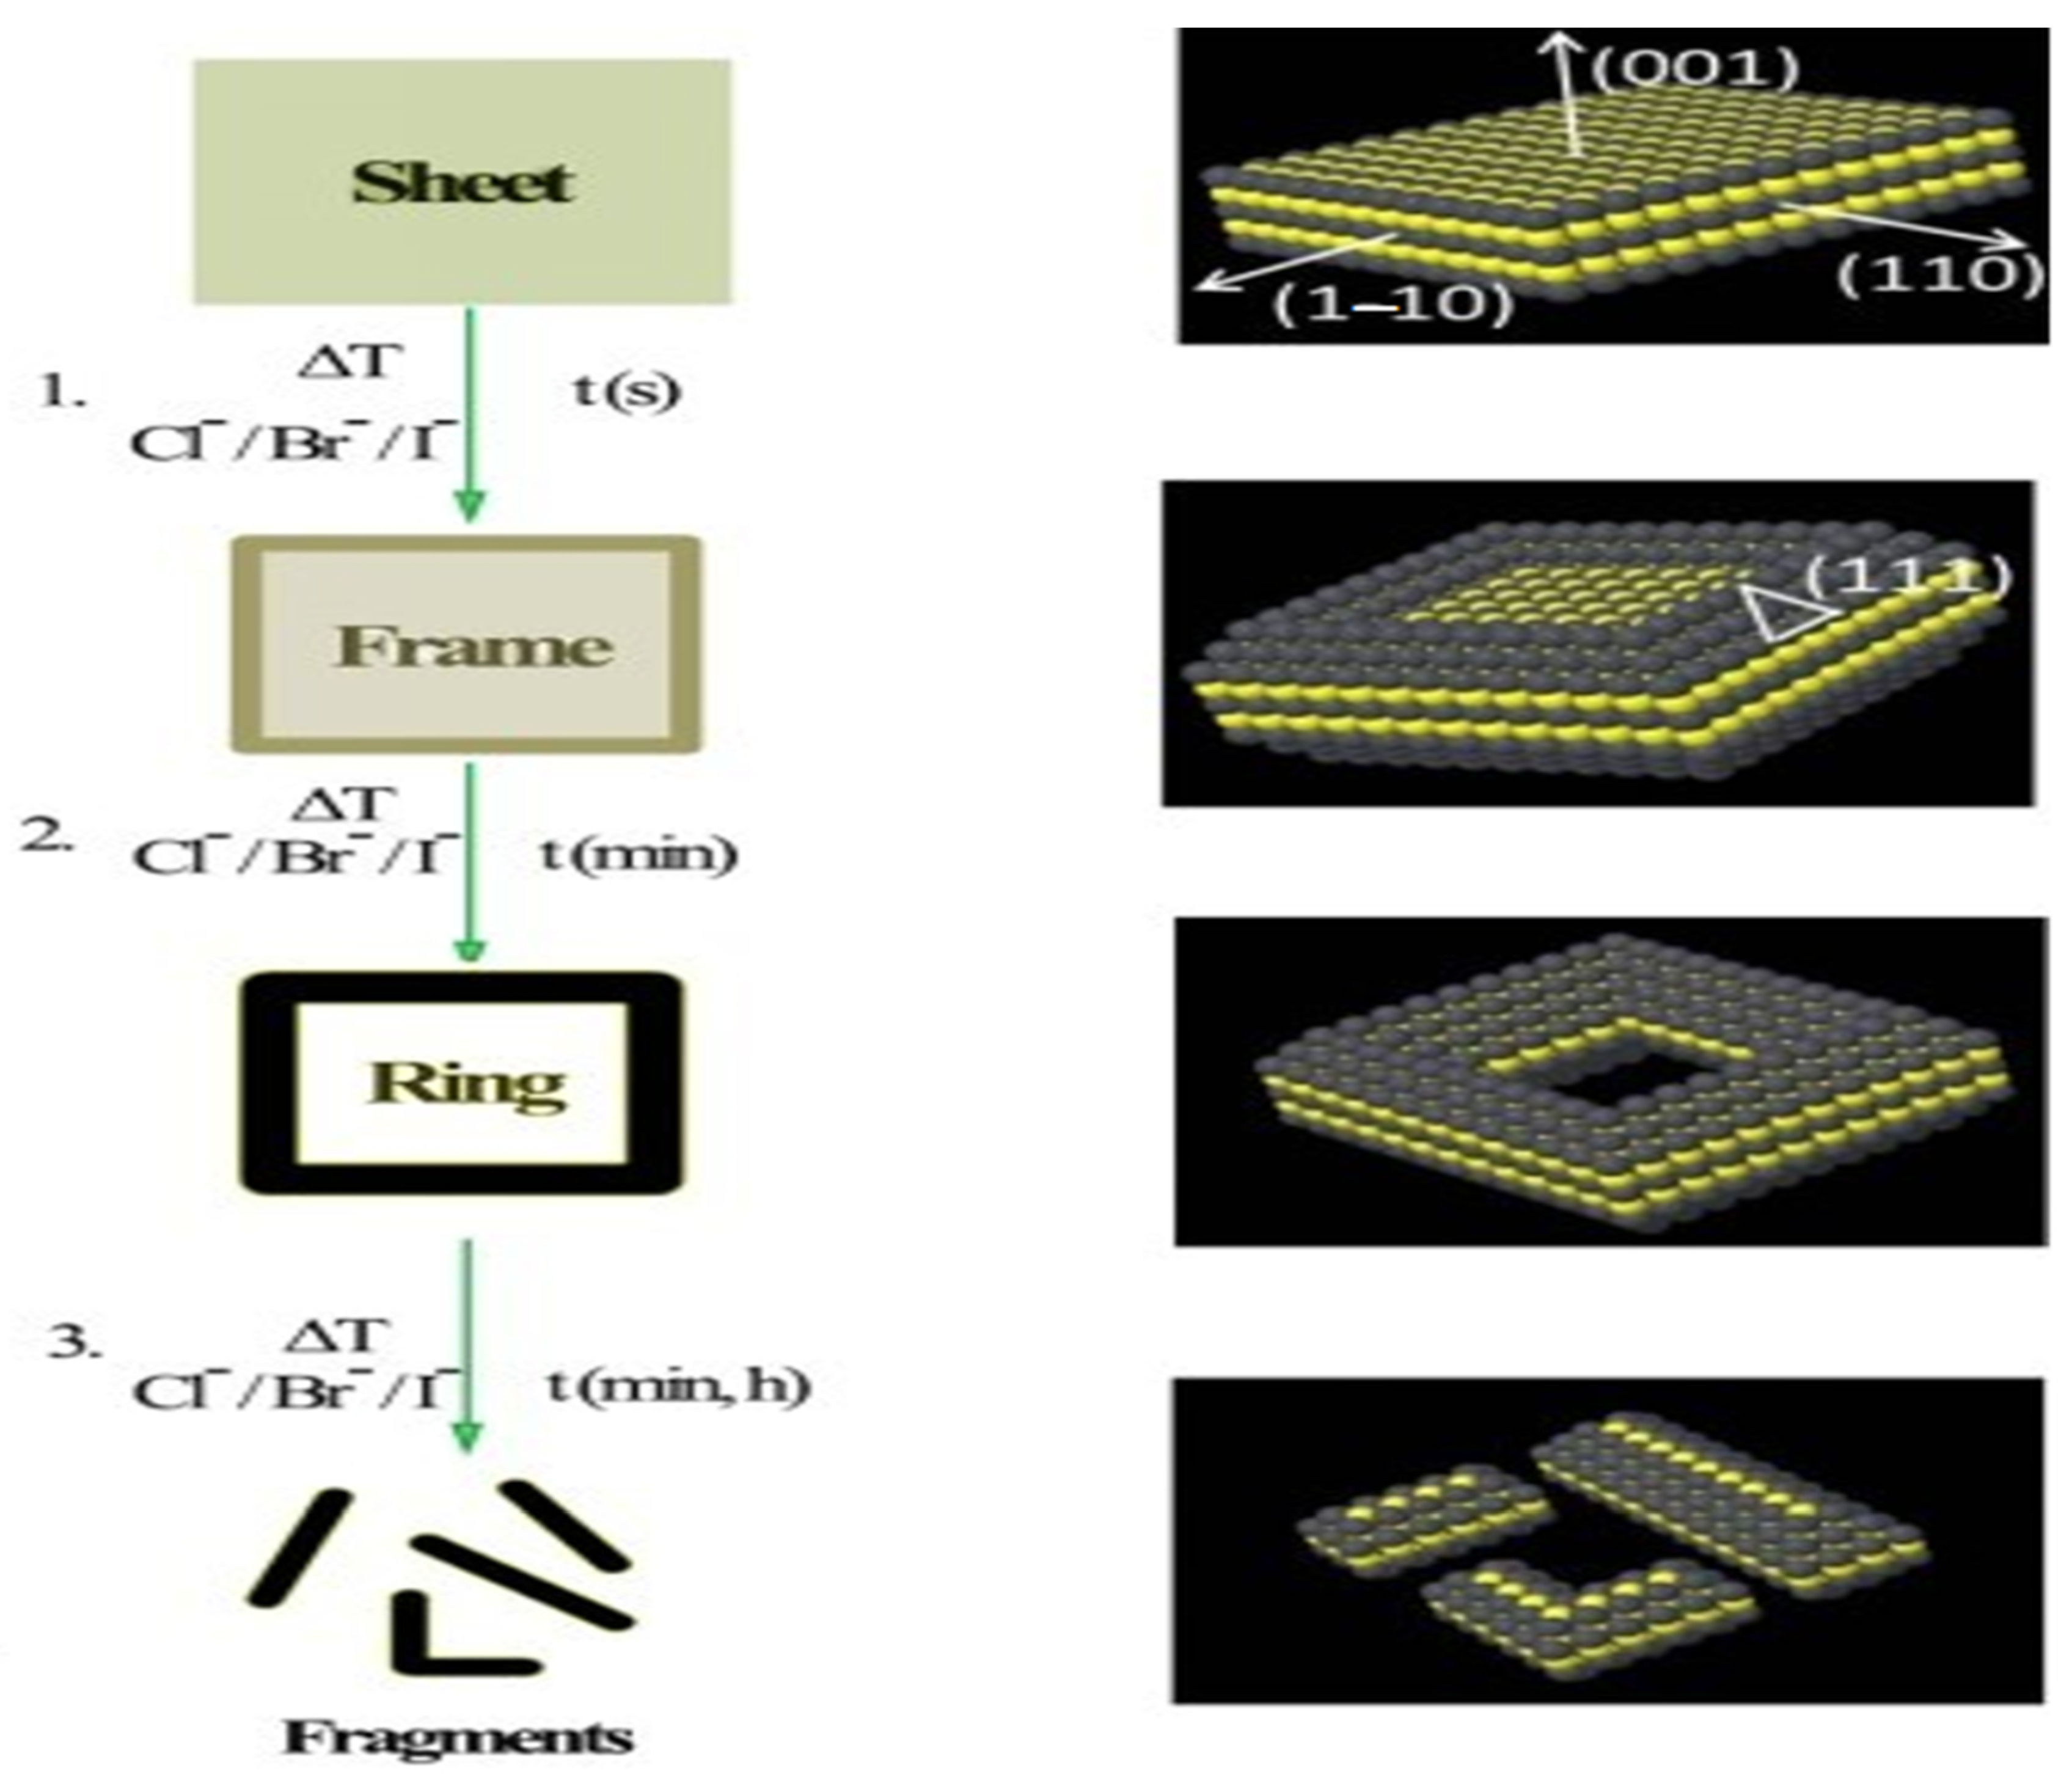
2.1. Face Selected Carving of Solid Nanocrystals

This approach involves dissolving specific solid nanocrystal surfaces to create nanoframes [39]. The monometallic nanocrystals exhibit surface inhomogeneity due to different factors like crystallographic defects, grain boundary, vacancy, dislocation, etc. Octahedral nanocrystals can be converted into octahedral nanoframes by using this method (Figure 1A). However, it is not always the case that the nanoframe formed has the same thickness at all the edges. This problem can be resolved by the use of a reducing agent during the chemical reaction to supplement the carving process with deposition [40]. The reducing agent should have a profound reduction power so that by tuning the rate of deposition and the rate of etching, one can control the thickness of the edges. In the case of bimetallic nanocrystals, if one metal at the faces has a low reduction potential and the other metal at the vertices and edges has a high reduction potential, then the one at the faces will be easily dissolved by the etching agent and the one at the edges will remain there (Figure 1B). Due to the difference in the diffusing rate between two metallic species in an alloy (Kirkendall effect) [41], a rhombic dodecahedron can be synthesized.
Bimetallic nanocrystals, specifically Pt–Ni nanoframes, have been created from Pt-Ni nanocrystals using a method called phase segregation at a very tiny scale [42]. The chemicals used to make these nanocrystals included Pt(acetylacetonate)2, Ni(acetylacetonate)2, stearic acid, octadecylamine (ODA), and carbon monoxide (CO). The reaction conditions maintained were 1 atm, at 170 °C. CO performed the dual function of surface stabilizer and reducing agent. After 1 h, a Pt–Ni core-shell octahedral nanocrystal was formed, and after 5 h, the concentration of Pt at the edges of the octahedral increased due to the diffusion of Pt atoms. Afterwards, this octahedral was immersed in acetic acid at 100 °C for 1 h to preferably remove the Ni component, and the Pt-Ni nanoframe was synthesized. A generalized overview of the synthesis of the Pt-Ni nanoframe using the aforementioned synthetic protocol can be taken from (Figure 2). TEM images are shown in Figure 3A–D. There is no doubt that this is a remarkable synthetic method for nanoframe synthesis. However, understanding its mechanism is difficult as it offers no information regarding the intermediate species.

2.2. Edge Selected Deposition of Different Metals on Template

For cubic nanocrystals, the surface energy is higher compared to the vertices and edges as the faces are made less active by the use of a capping agent [43]; thus, instead of using an approach involving the direct carving of atoms from nanocrystals, we can perform a deposition of another metal on the edges and vertices of the nanocrystal. The second metal is selectively deposited at the edges and vertices. Eventually, the core is removed either by oxidative etching [44] or by the galvanic replacement reaction. The formation of a cubic nanoframe is shown when metal B (deposited) is more reactive than metal A [45]. After the etching of metal A from the core, the resultant nanoframe formed will only contain metal B at the vertices and edges, as shown in Figure 4.
Despite it being a spectacular synthetic technique for the synthesis of a nanoframe with clear morphology, there exists inter-diffusion between the atoms of the core and frame during the deposition or etching process [46]. Consequently, more undesired elements will exist in the end product.

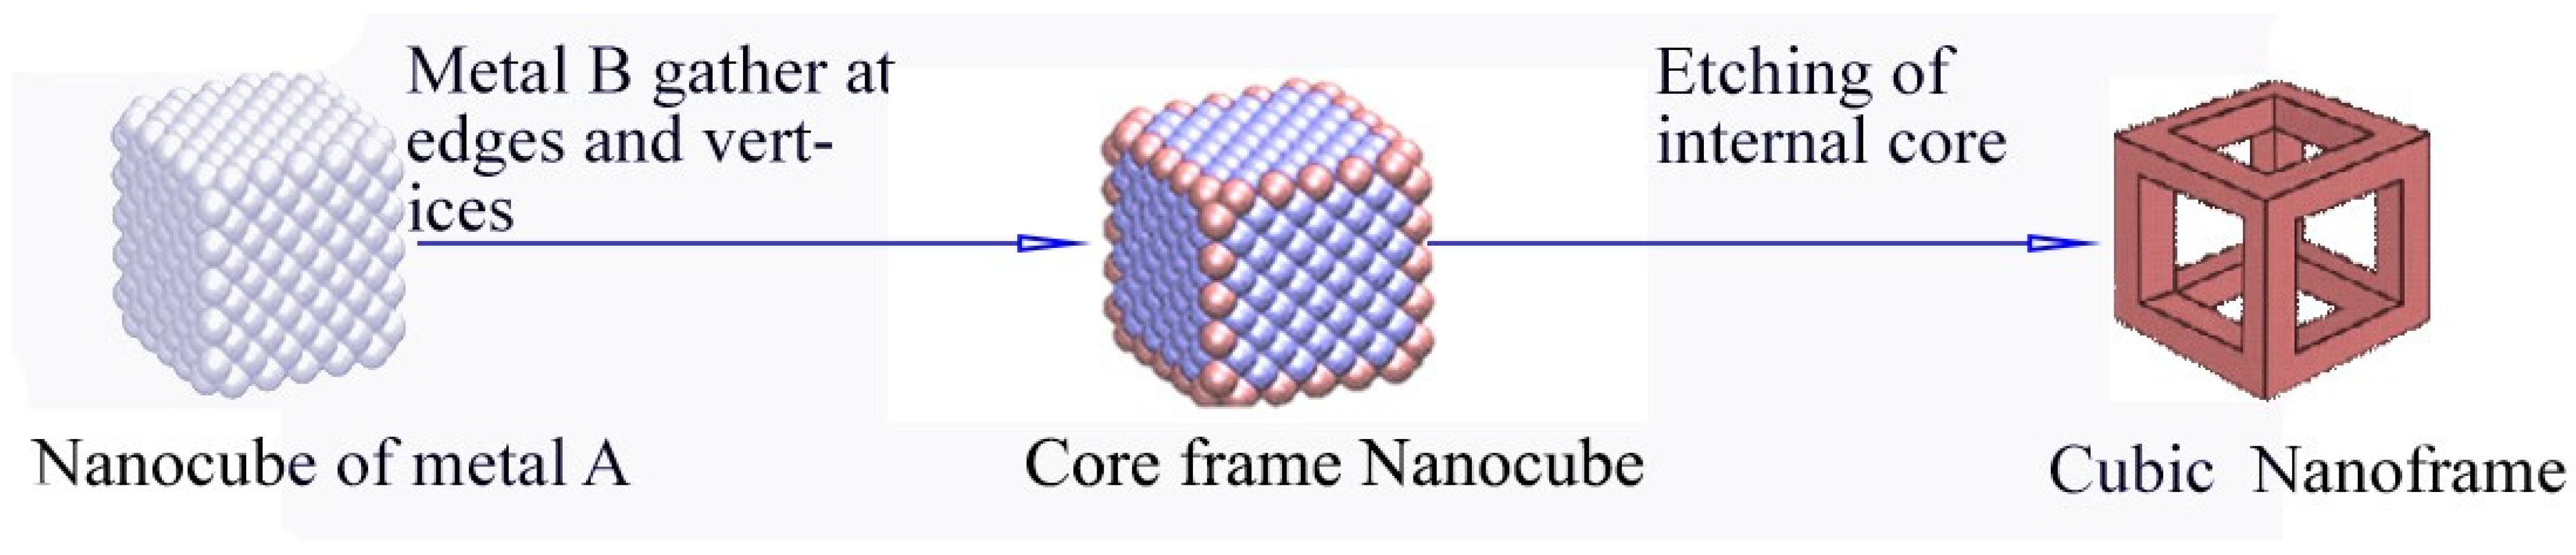
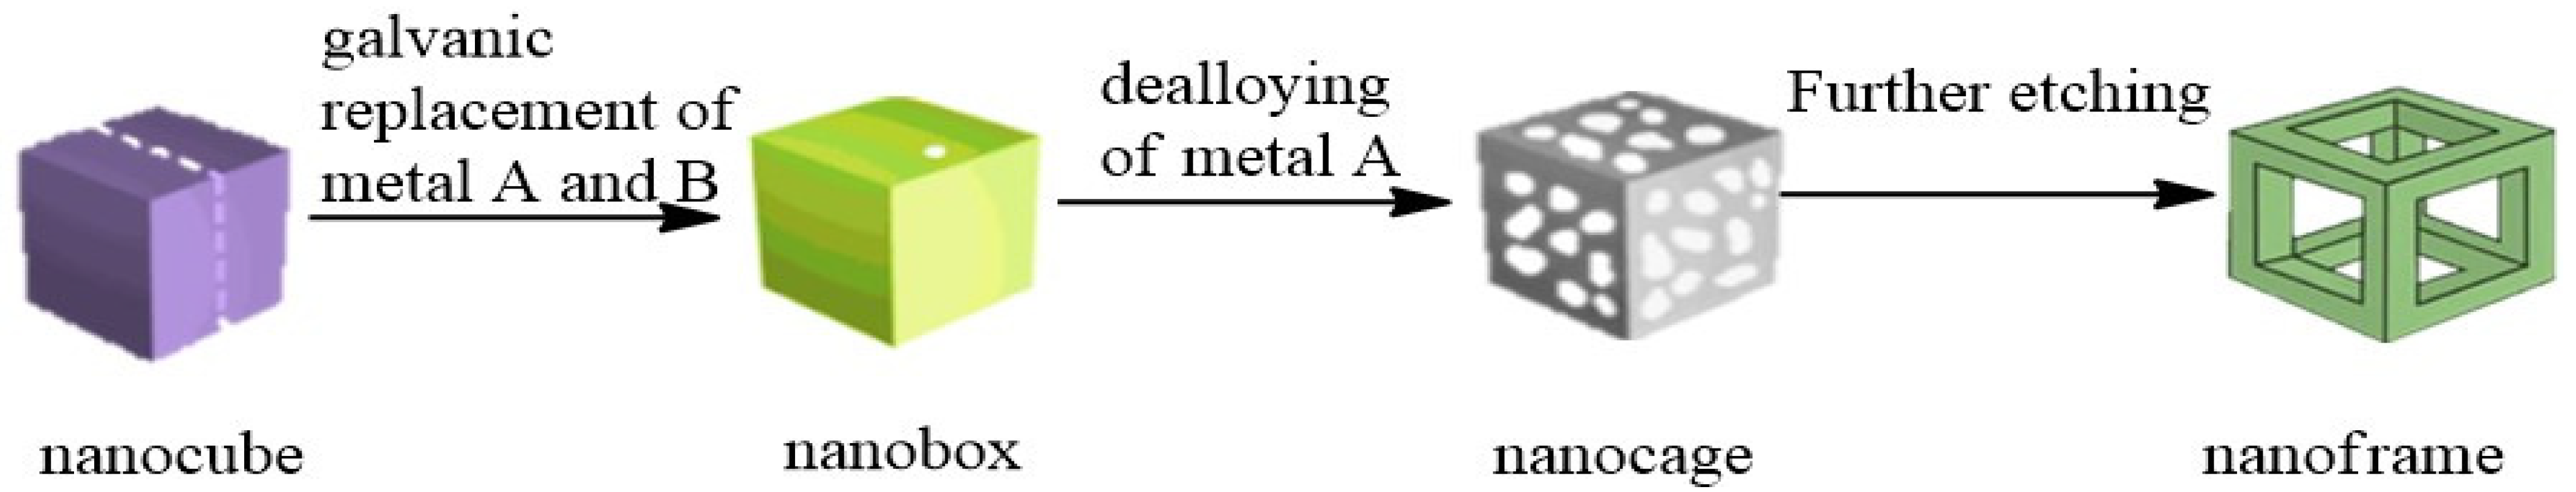
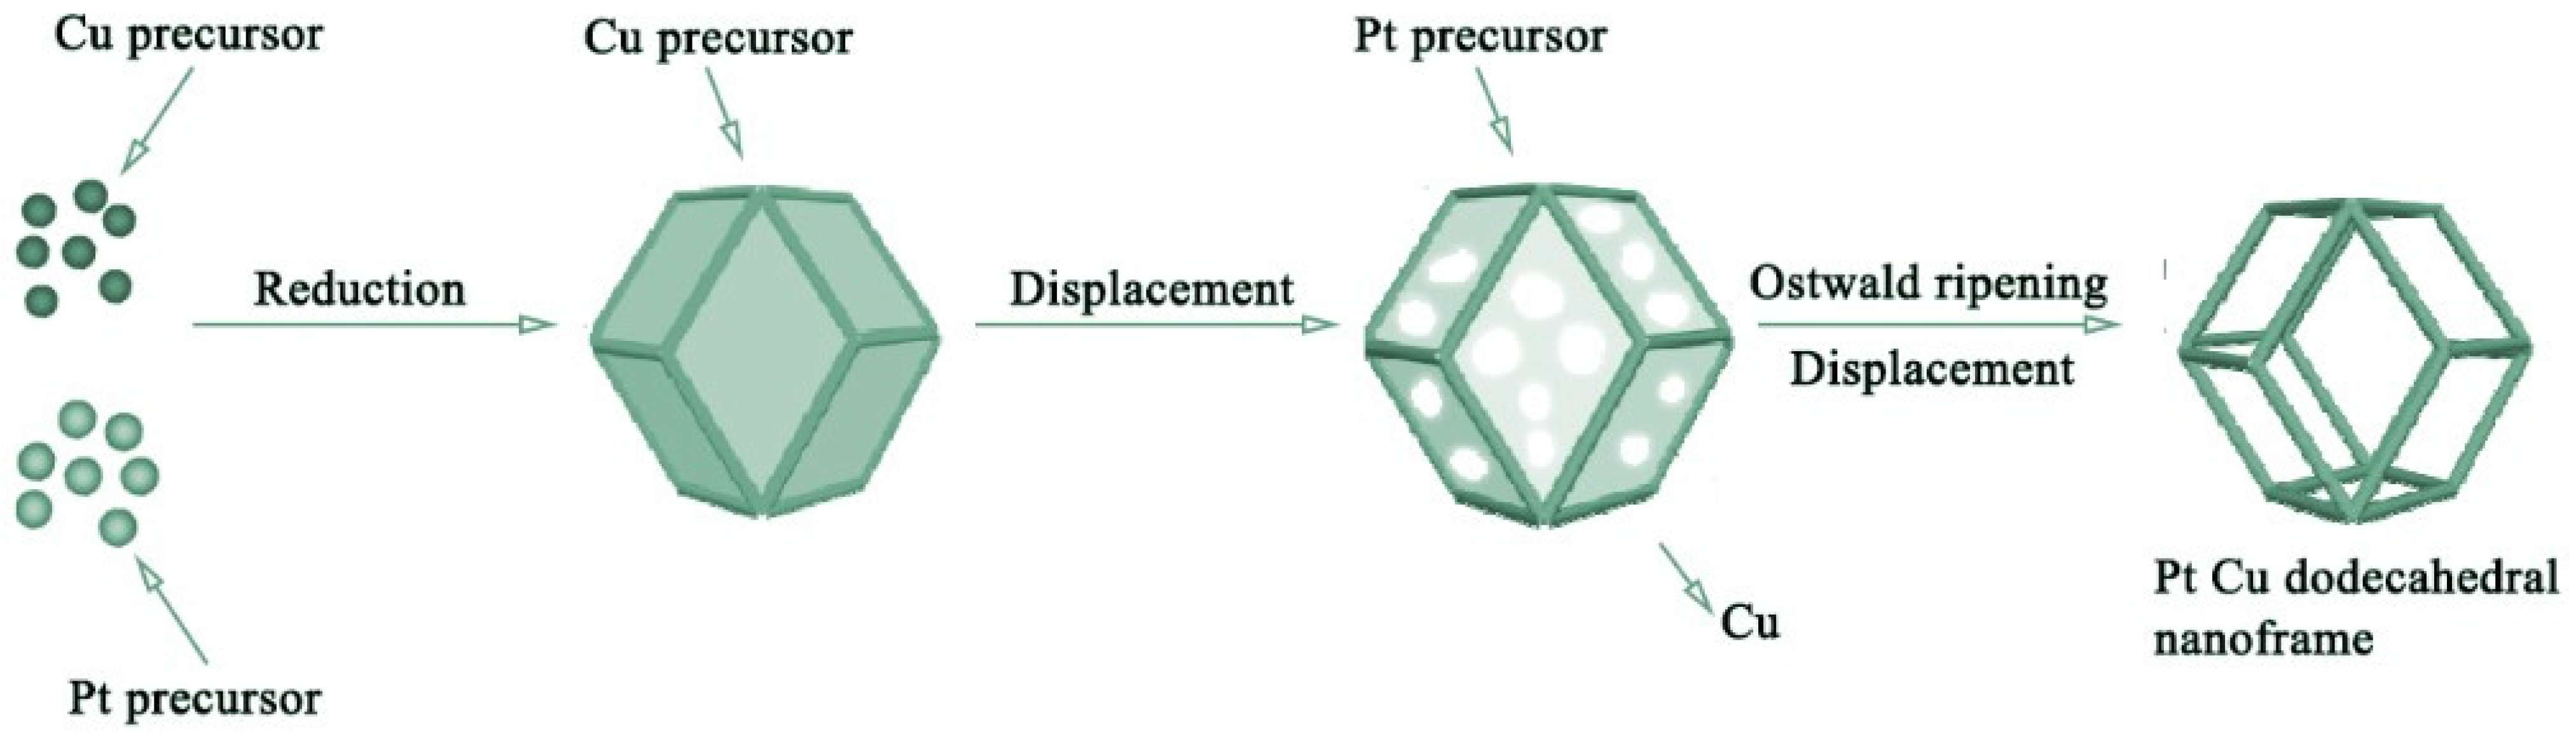
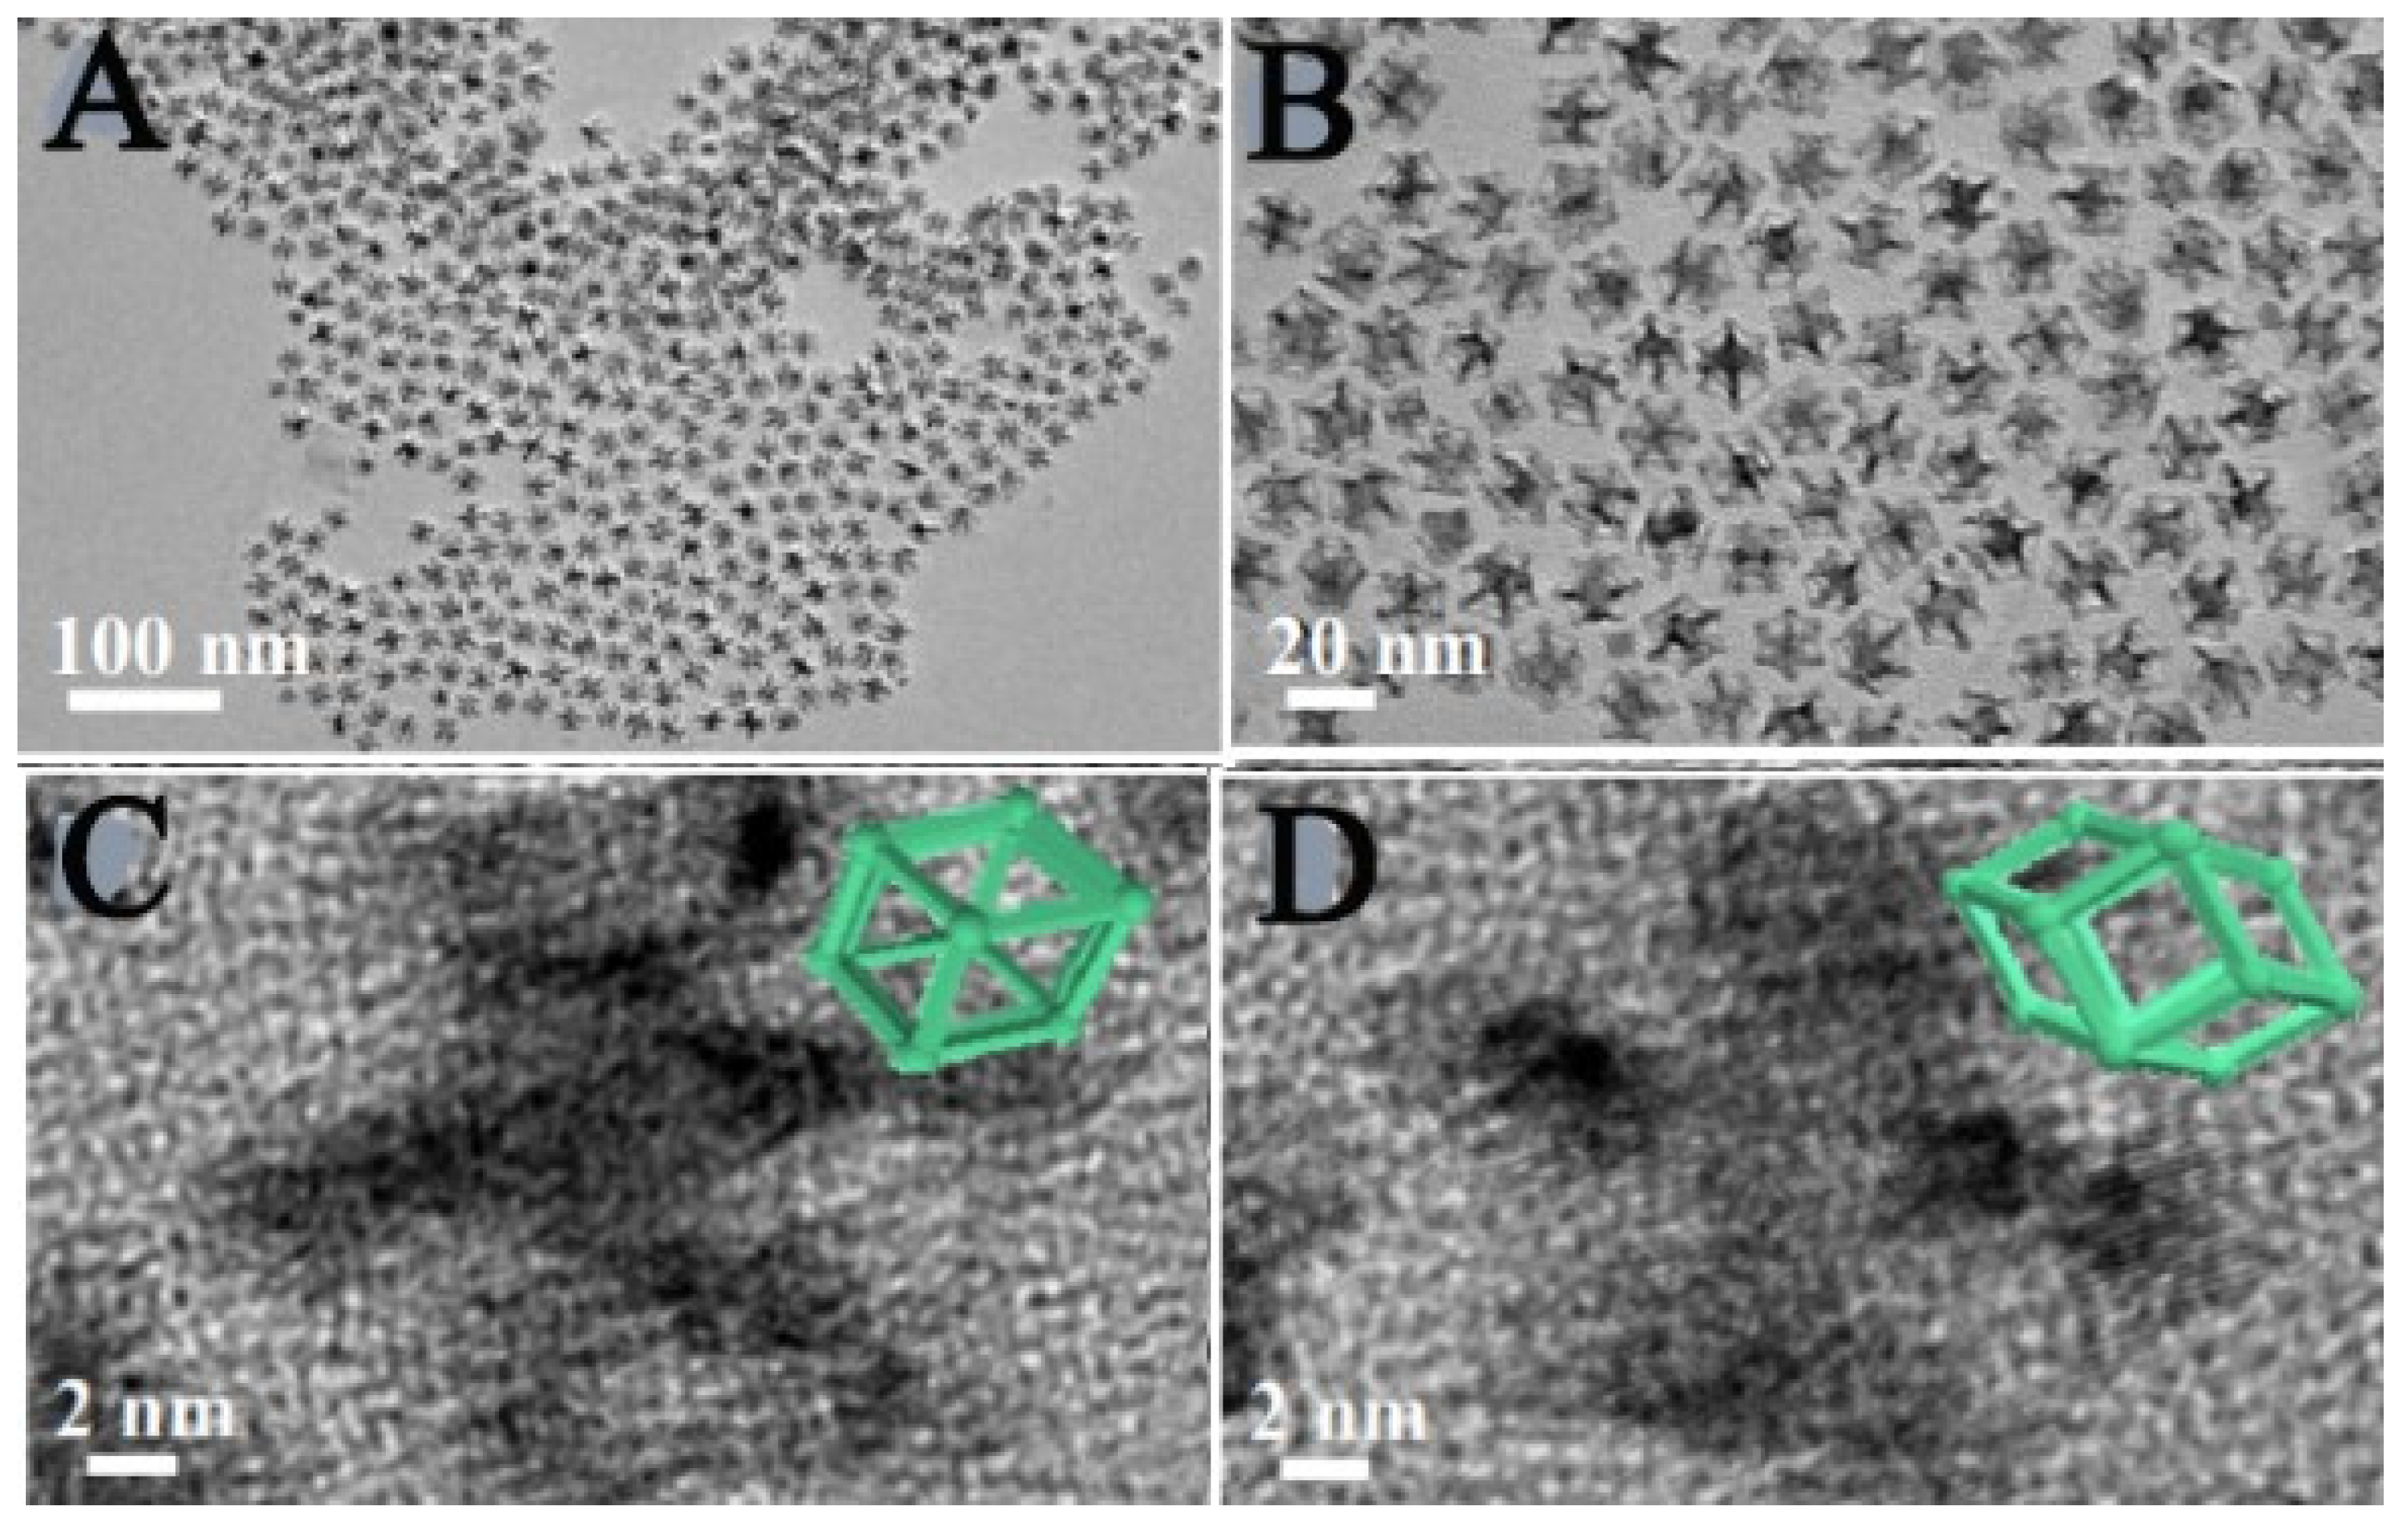
2.3. De-Alloying of Hollow Alloy Nanocrystals

In this method, galvanic replacement is initiated between metal A and metal B at the faces of the nanocube to generate pinholes in it [47]. After that, metal A is continuously carved and a hollow nanostructure is formed. Finally, a nanobox with walls made up of the A–B alloy and that is free of pores is obtained. Then, the dealloying of metal A takes place using a chemical etchant and the nanobox is converted into a nanoframe made up of pure metal B, as shown in Figure 5.

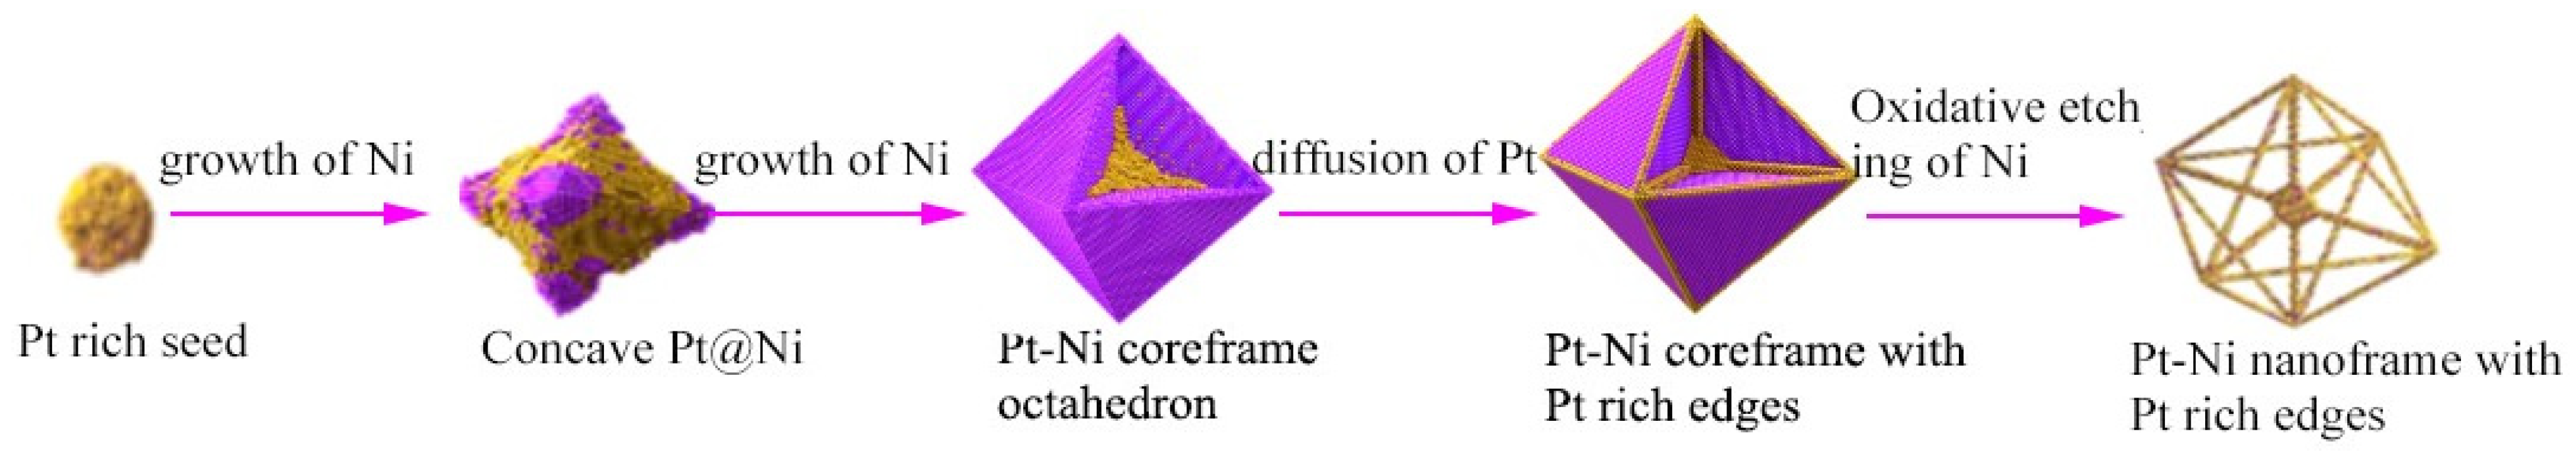
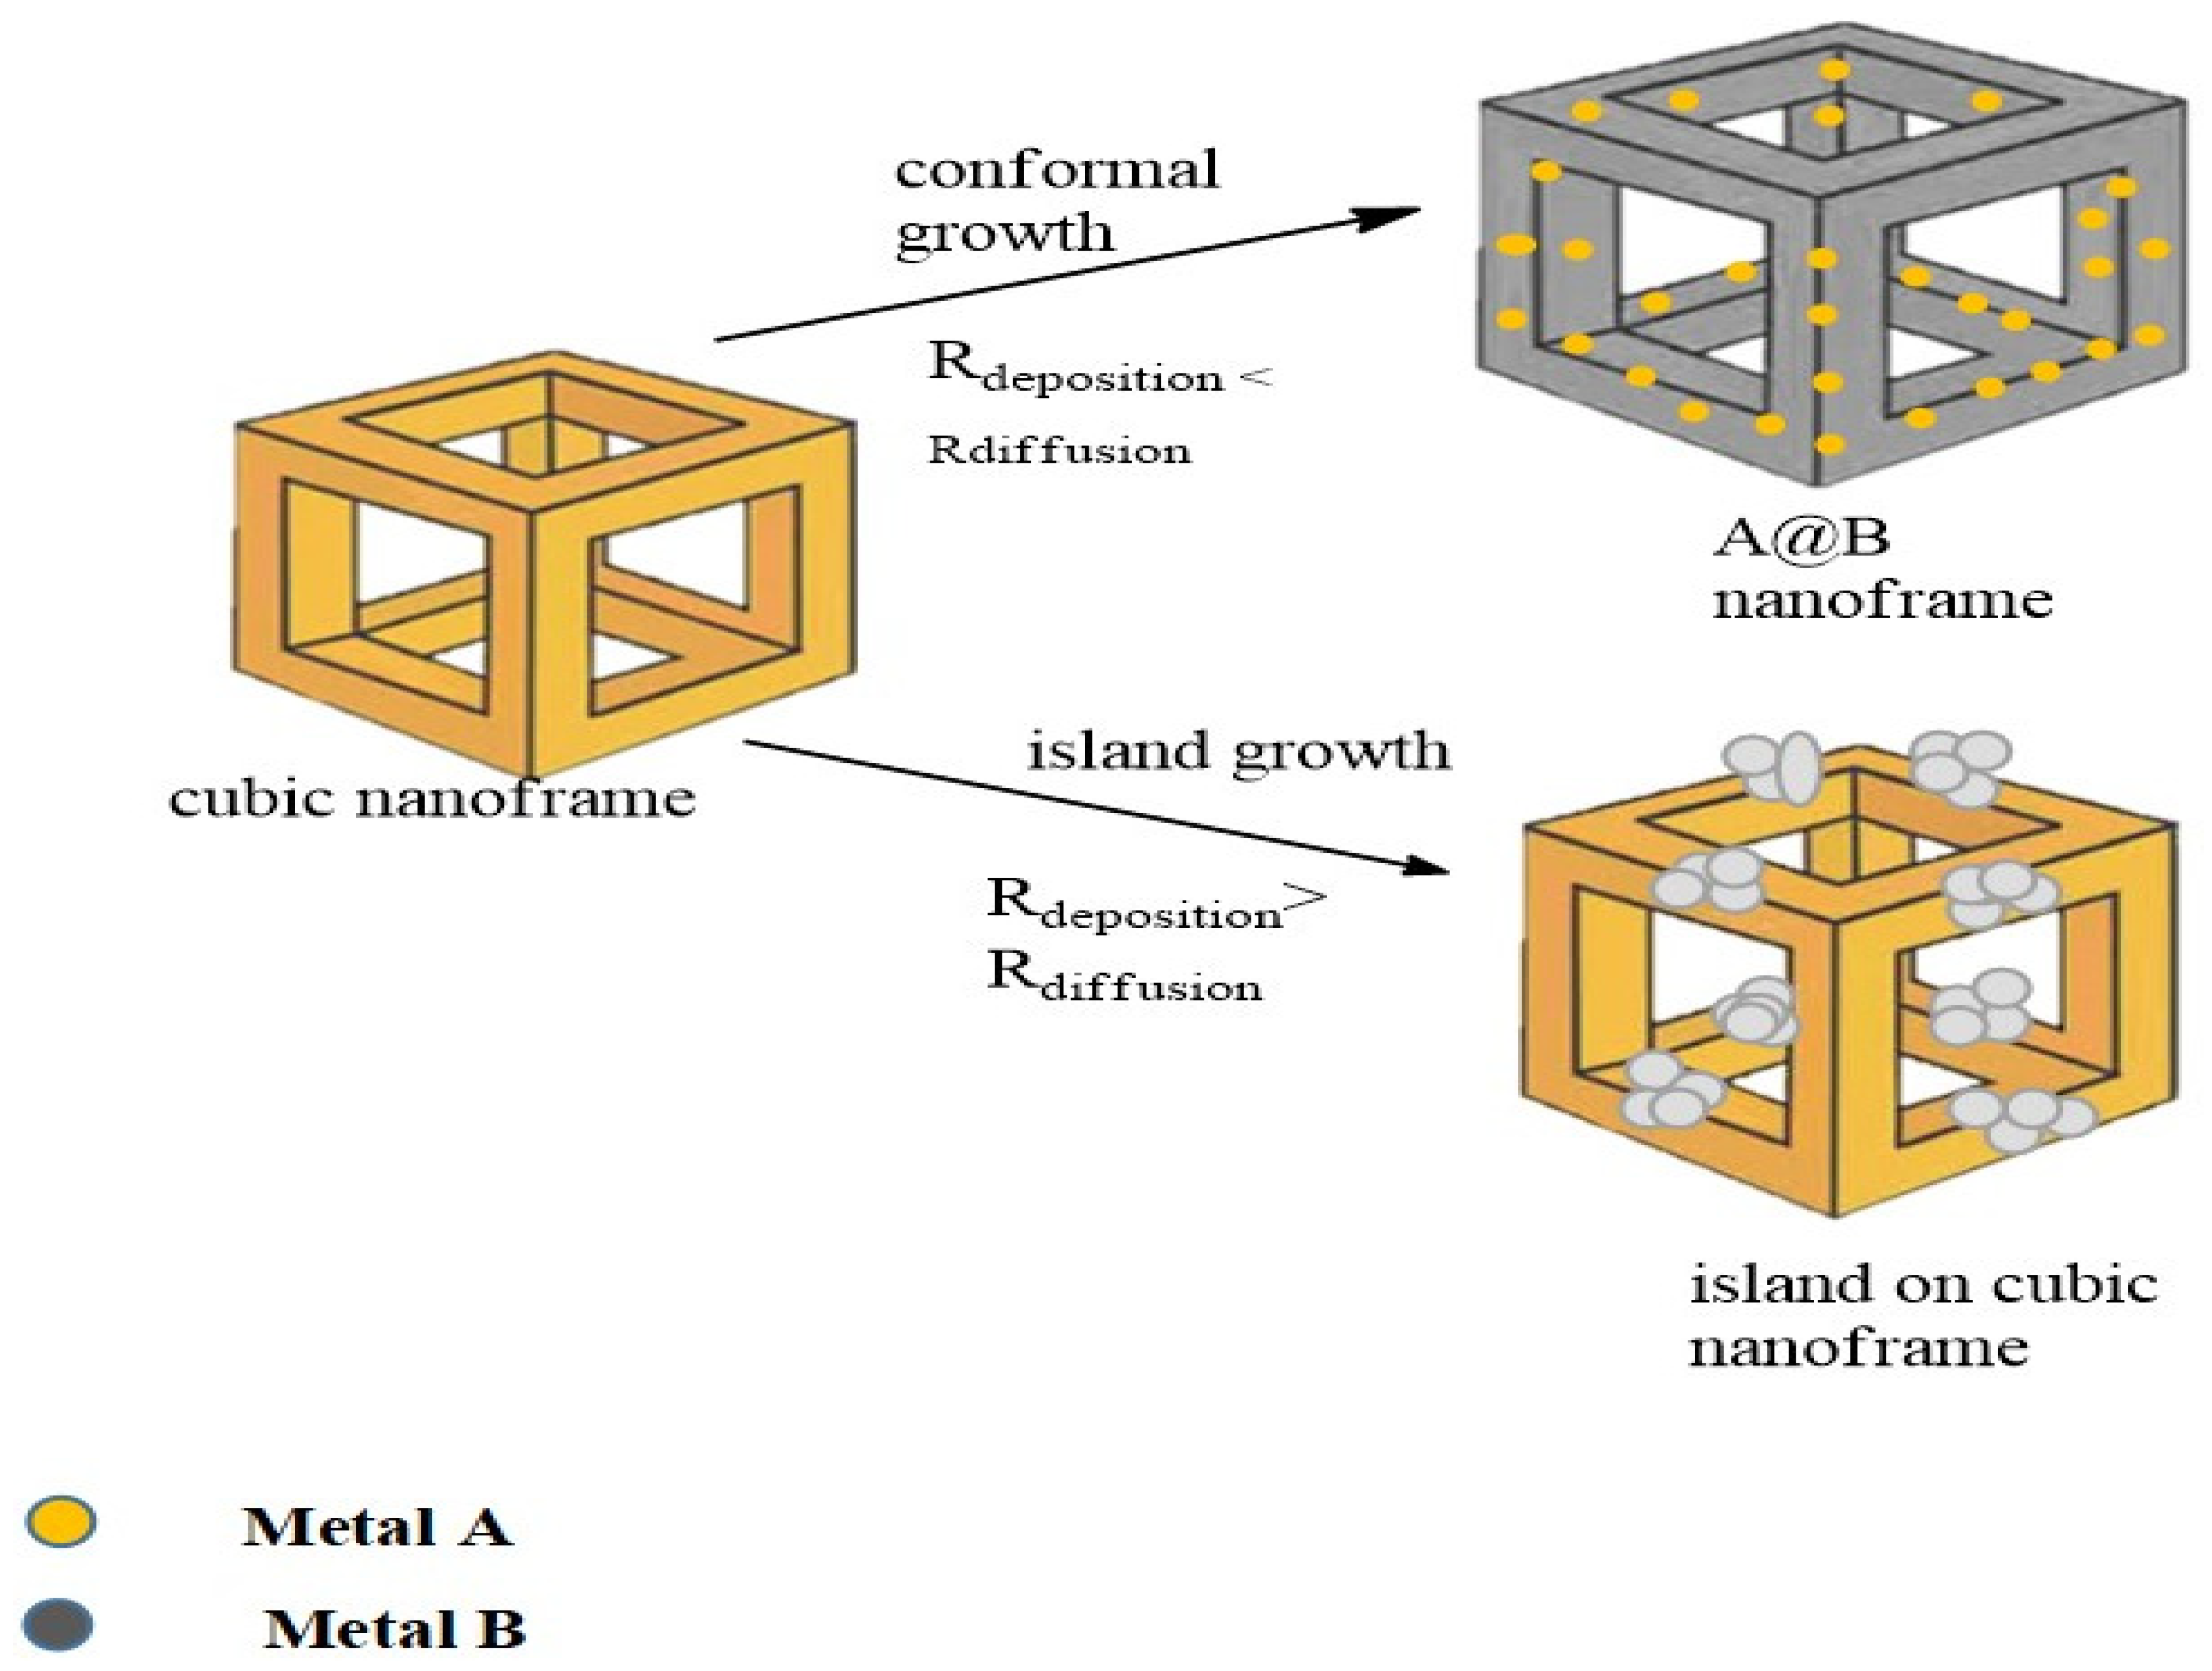
2.4. Nanoframe-Directed Deposition

In this synthetic approach, the nanoframe acts as a template, and the deposition of other metals takes place on it, hence augmenting the mechanical strength of the nanoframe [48]. Whether the deposited metal will create a complete shell on the nanoframe or will be randomly distributed on the nanoframe depends upon the growth mode [49]. The ratio between the rate of deposition and the rate of surface diffusion of the atoms present on the surface is responsible for maintaining the final morphology of the nanoframe. When the rate of diffusion is greater than the rate of deposition Rdiffusion > Rdeposition, it is said to be conformal growth and vice versa (Rdiffusion < Rdeposition would be called as island growth), as shown in Figure 6.
This strategy can be used to deposit useful materials onto the surface of the nanoframe [50]. However, this approach has not been practically applied due to certain limitations, i.e., the lower quantity of nanoframes formed and their structural delicacy.

2.5. One-Pot Synthesis

Cu-enriched Ir-Cu nanoframes have been synthesized using a one-pot synthesis strategy [51]. In the context of the OER (Oxygen Evaluation Reaction), they were found to have higher electro-catalytic activity. The main strategy behind Ir-Cu nanoframe synthesis is galvanic replacement. IrCl3·3H2O and Cu (acac)2 were dissolved in a solution of olylamine (surfactant, reductant), oleic acid (emulsifier), and octylamine (soft template reagent and solvent) under magnetic stirring. The resultant dark-blue-colored solution was homogenous and transferred to a Teflon-lined stainless steel autoclave for 30 min. The reaction conditions were maintained at 170 °C for 24 h. Ir-Cu nanoparticles were synthesized. Scanning electron microscopy (SEM), high-resolution transmission electron microscopy (HRTEM), and high-angle annular dark-field scanning transmission electron microscopy (HAADF-STEM) analysis were used for the morphology assessment of the prepared Ir-Cu nanoframes. X-Ray diffraction (XRD) analysis was used to determine the face-centered cubic (fcc) shape of bimetallic nanoframes. Elemental analysis was performed via energy-dispersive X-ray (EDX). Lead sulfide nanoframes can be synthesized by the one-pot synthesis method [52]. Lead acetate trihydrate, oleic acid, and diphenyl ether were all mixed in a round-bottomed flask and degassed at 7 °C for 2 h. During heating at 22 °C (lithium chloride dimethylformamide), LiCl-DMF solution was added. TMA-DMF [thioacetamide dimethylformaldehyde] was then added to the mixture when the desired temperature was attained. If the solution turned black immediately, this was an indication of PbS nanoframe formation, as shown in Figure 7.
Table 1. A summary showing the different synthetic protocols that have been used to design different nanoframes.
Synthetic Approach Used MetalMorphologyReferences
Nanocrystal face selected carving Pt-Cu-CoRhombic dodecahedron[30]
Pt-Ni-SnRhombic dodecahedron[53]
Au@Pdcubical[54]
Deposition of different metals on the template by preferential edge selectionRu-PdOctahedron
cuboctahedron
[55]
Ir-CuRhombic dodecahedron[51]
Ag-Au-Ptcube[56]
Hollow nanocrystal’s dealloyingIr-Cu-AuRhombic dodecahedron[51]
Pd-AuCube truncated octahedron[57]
Pt-AuCube truncated octahedron[57]
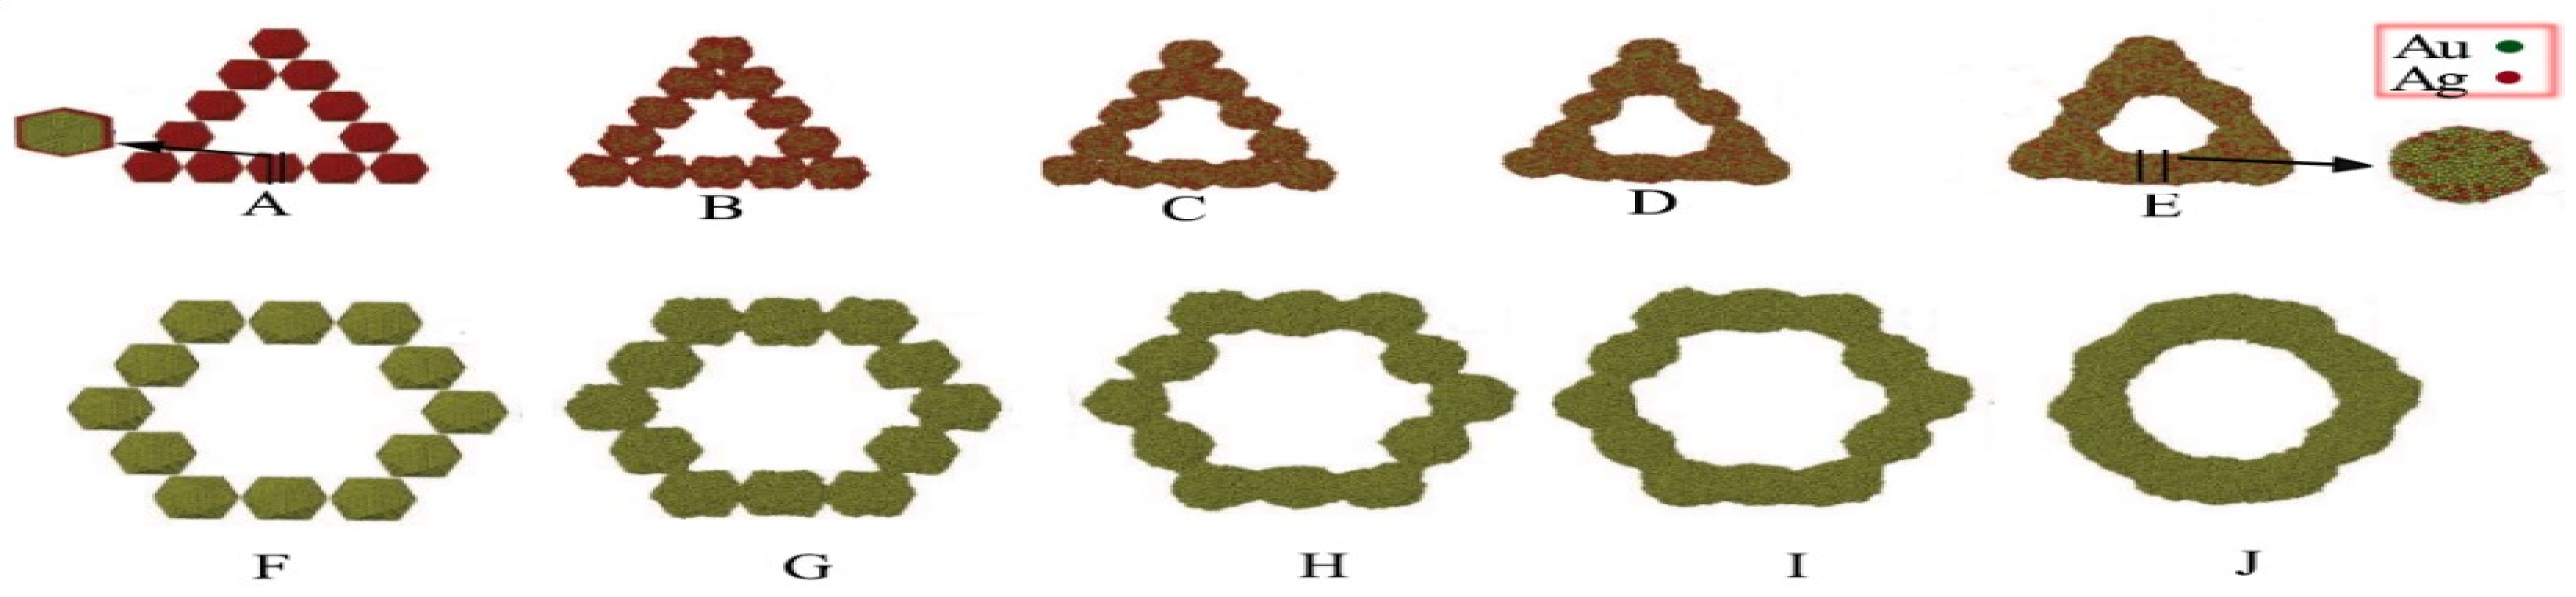
Template-assisted arrangement of nanoscale building blocksAu Triangle, tripod [58]
Directed deposition of nanoframePt-Au@AuDouble-layered triangle, ring, hexagon[48]
Pt-Ni@MOF Rhombic dodecahedron[50]

2.6. Thermal Reductions

Two-dimensional nanoframes of (Ni-Pt) have been prepared by controlling the temperature during the deposition of platinum on nickel hydroxide sheets [59]. Ni-Ir 2D nanoframes were synthesized in various steps, including those outlined in [60]: first is the formation of nickel hydroxide nanosheets; second is temperature-controlled treatments to synthesize nickel oxide nanosheets; third is the deposition of Ir onto the previous nanosheets; and fourth is thermal treatments (200/300 °C). Lastly, chemical leaching was performed under certain conditions to form a Ni-Ir nanoframe, as shown in Figure 8.

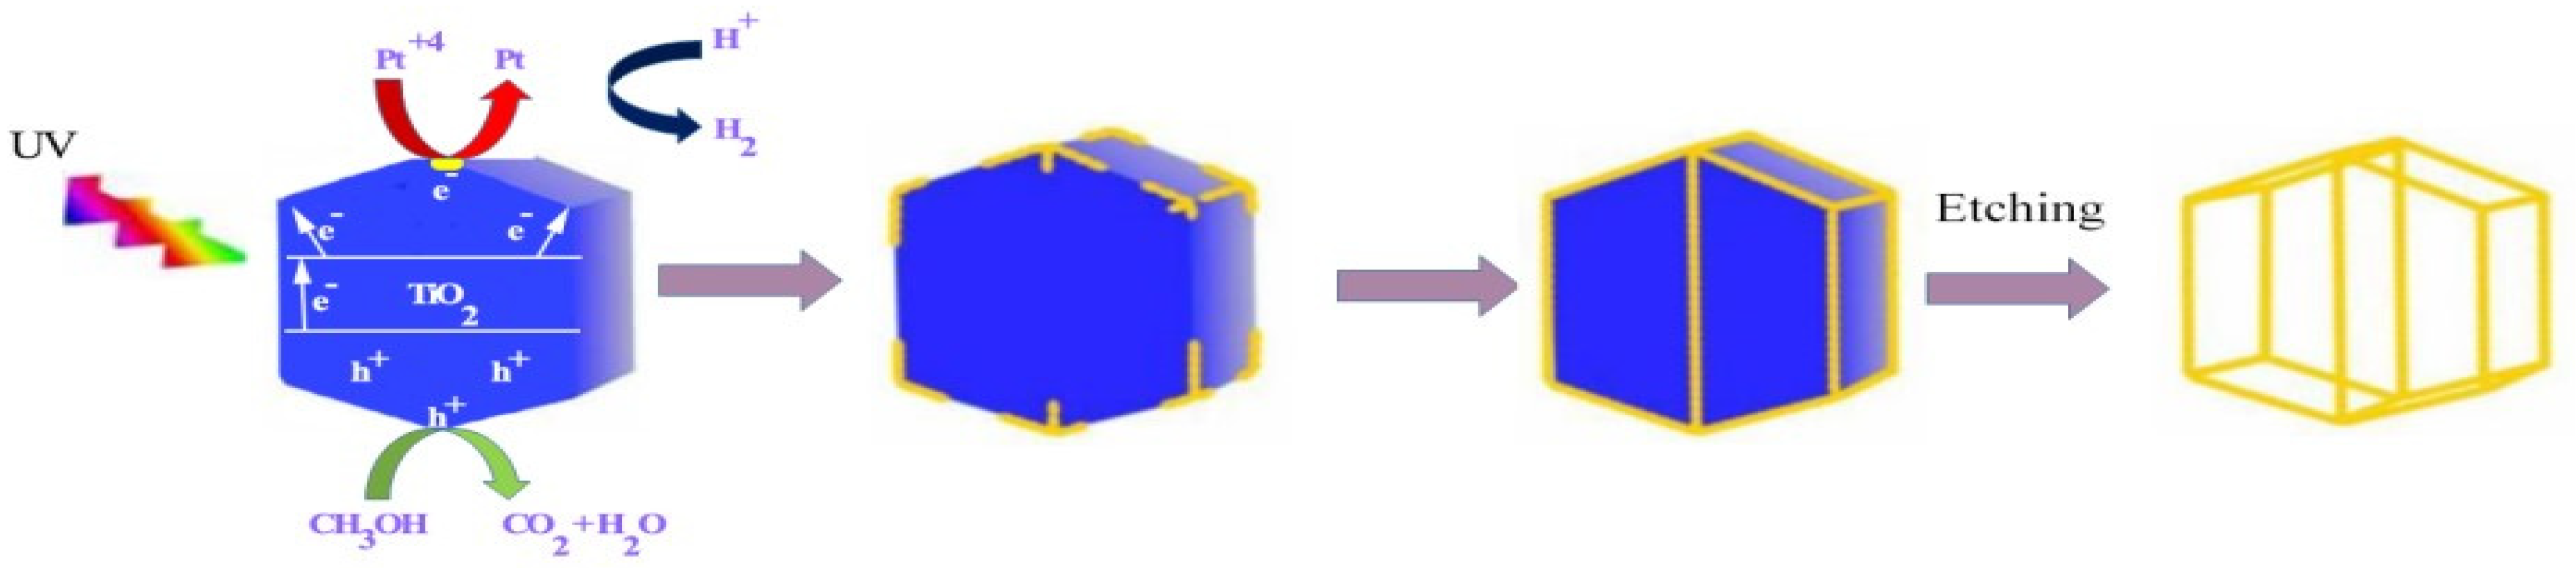
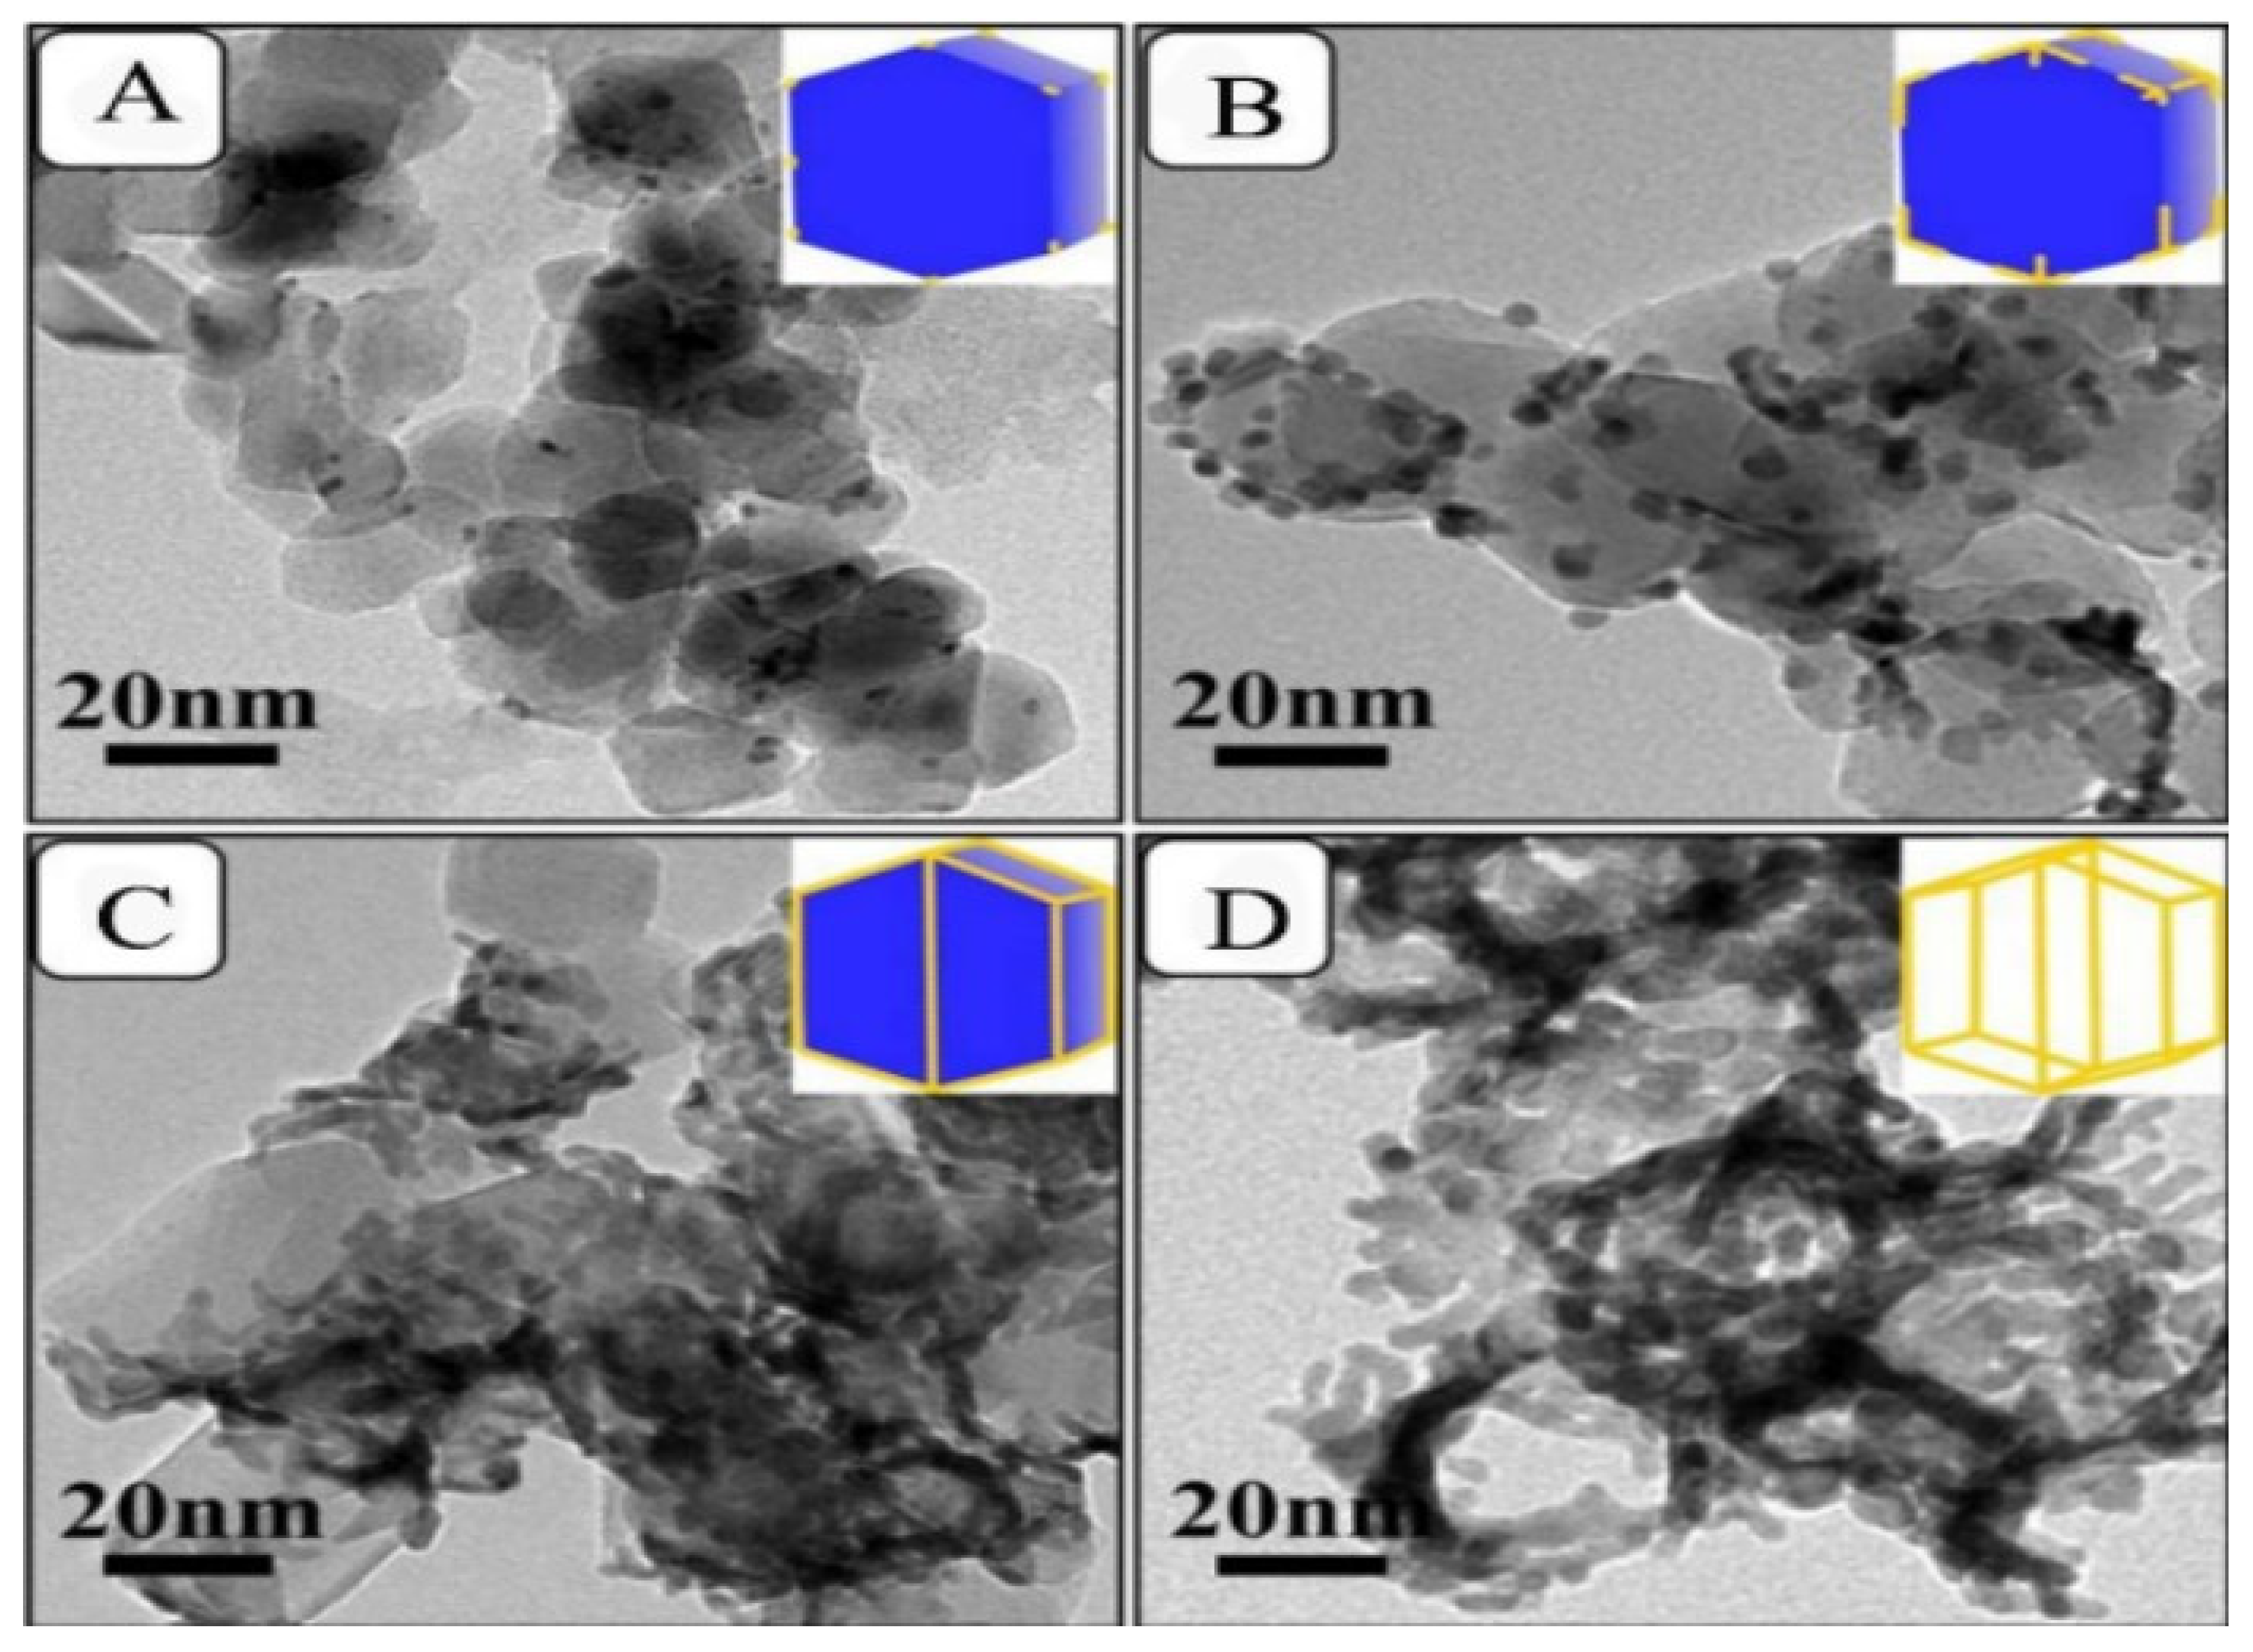
2.7. Oxidative Etching

Oxidative etching is one of the most important methods used to control the shape or stability of nanomaterials with the help of an etchant. First of all, Pd-Ru nanocrystals were formed by firstly preparing Pd seeds of 10 nm followed by the mixing of Polyvinylpyrrolidone (PVP), potassium bromide (KBr), and an Ru [III] precursor in Triethylene glycol (TEG); this was then heated further to initiate a reaction. TEM analysis showed the monodispersity and octahedral shape of these nanocrystals, as shown in Figure 9a [61]. To determine the spatial distribution of both metals in the Pd-Ru cuboctahedra, EDX analysis was performed (Figure 9c). This showed that within the core of the nanocrystal, there were Pd atoms. Meanwhile, at the corners and edges, Ru atoms were distributed. When these nanoframes were subjected to oxidative etching in the presence of Br ions, the etching of Pd resulted, as Ru is more resistant to oxidative etching. The inductively coupled plasma mass spectrometry (ICP-MS) analysis confirmed that the weight percentage of Pd decreases from 69.1% in the octahedral to 6.6% in the nanoframe, whereas Ru increases from 30.9% to 93.4%.
Other metal nanoframes can be synthesized in the same way as PtNi [62] by this oxidative etching method. The metal precursors used were H2PtCl6·6H2O, Ni(acac)2, and Hexadecylamine (HDA), serving as reducing agents, surface ligands, and solvents. Initially, the platinum metal precursor was mixed with HDA at 20 °C. After that, the Ni precursor was added to a solution containing Pt seeds, and the solution was heated at 20 °C for 25 min to form PtNi nanoparticles of rhombic dodecahedral shape. EDS shows that on the corner and edges, Pt was in more proportion, while Ni was in the bulk. Using acetic acid as an etchant, these nanoparticles were converted into PtNi dodecahedral nanoframes (Figure 10), as confirmed by TEM analysis in Figure 11.

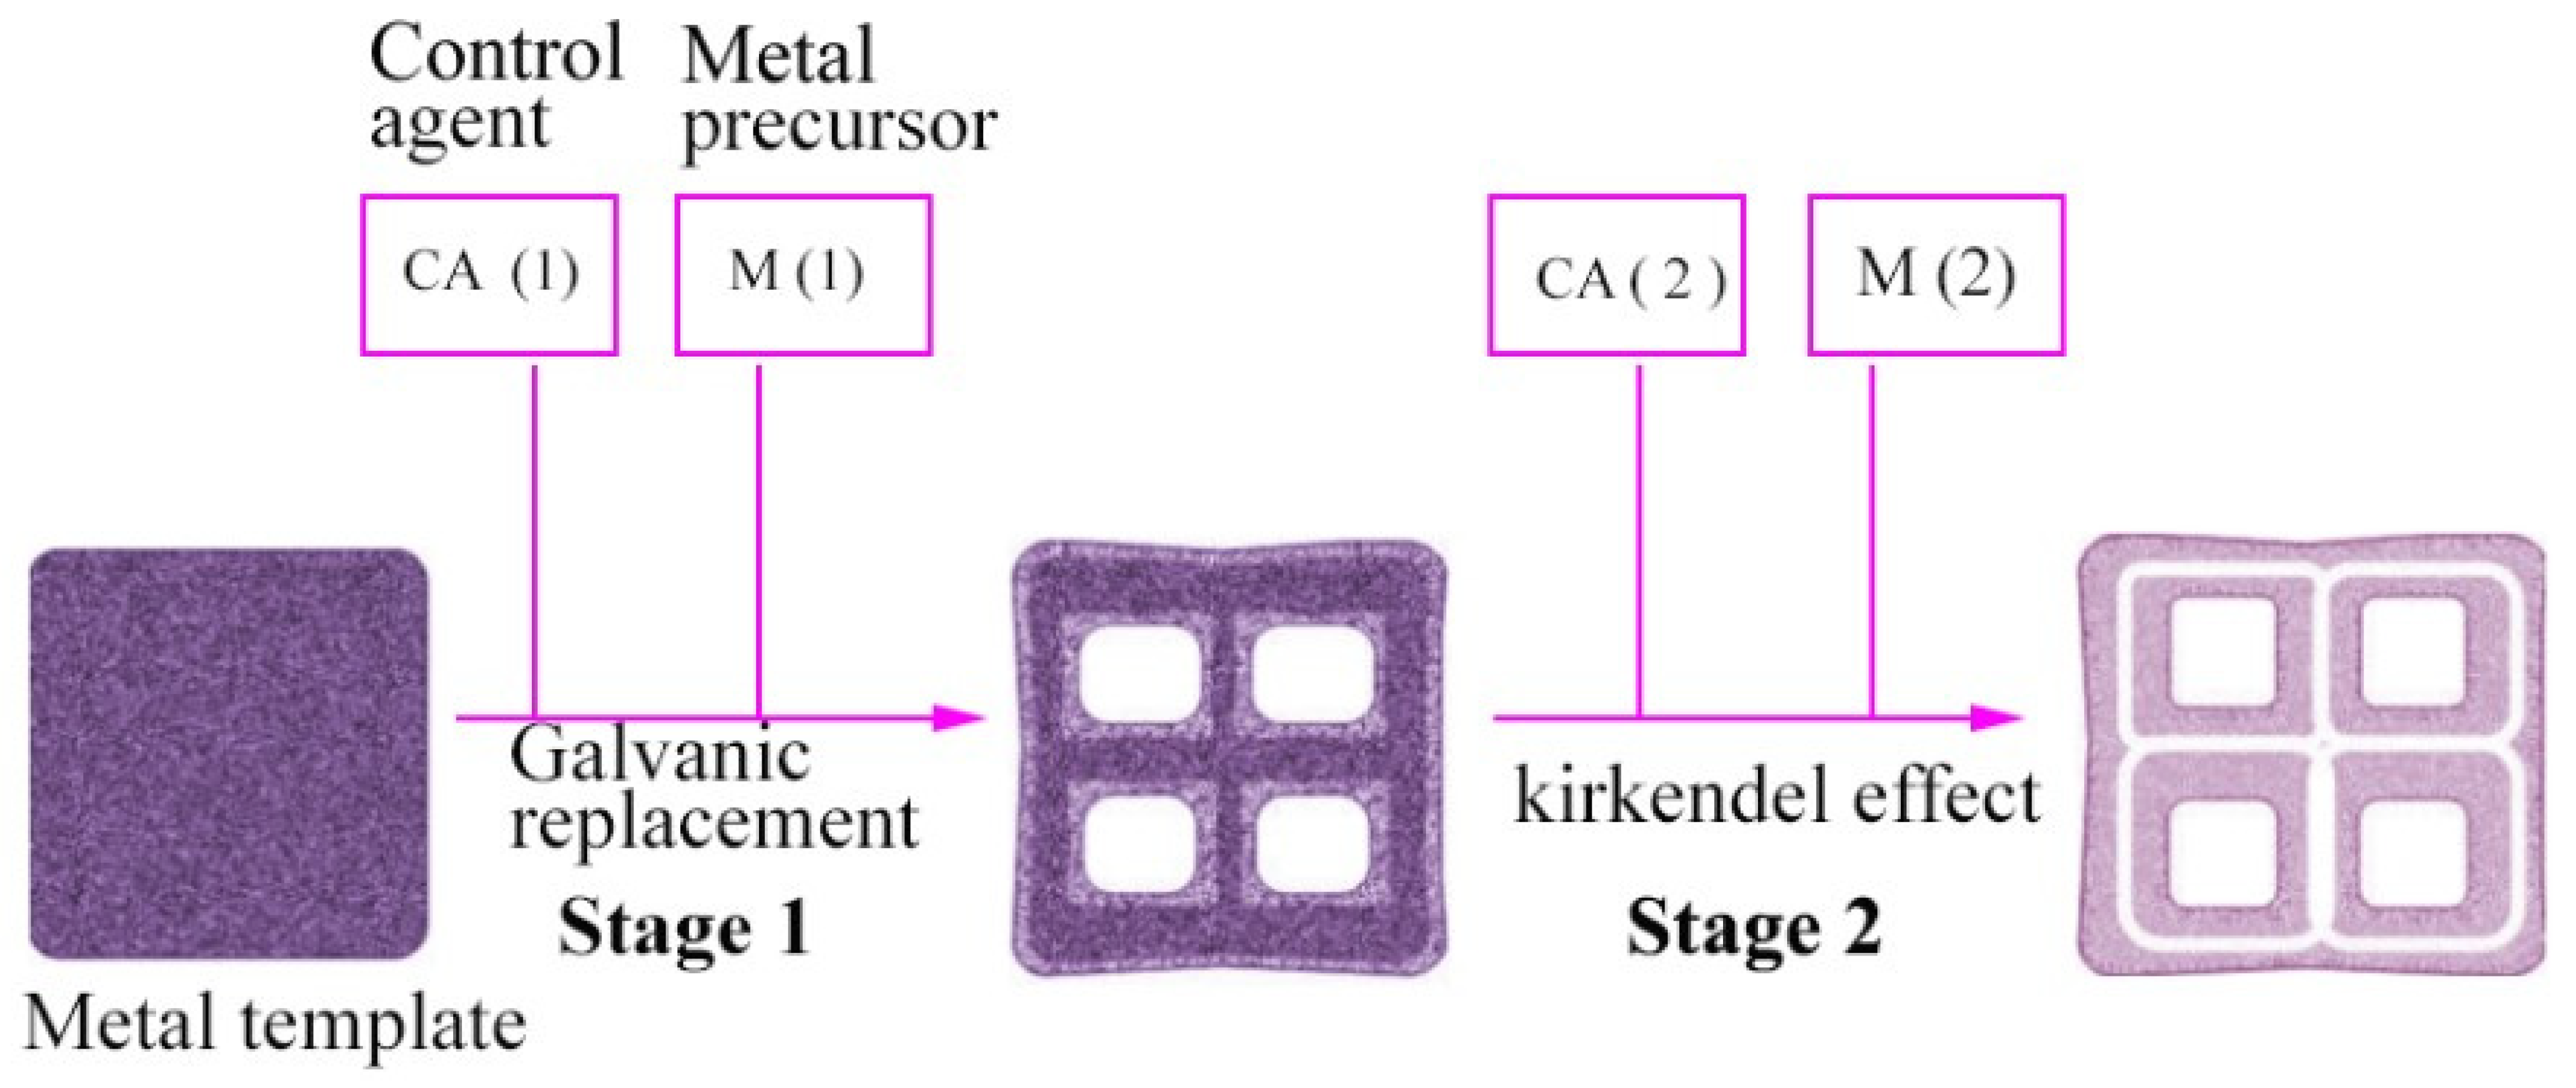
2.8. Galvanic Replacement Reaction

Galvanic replacement occurs between two metals with different values of standard reduction potential. The one present in the metal template has a low reduction potential and is hence oxidized; meanwhile, the one present in the solution has a high reduction potential and hence it gets reduced and deposited on the template metal surface [53]. For example, Pt@Ru dodecahedral nanoframes can be synthesized by galvanic replacement reactions. Initially, the Pt@Ni dodecahedral [precursor] is taken, and Ru is deposited on the Pt edges by the replacement of Ni via the addition of Rucl3, and the etching of Ni is performed by using HCl as an etchant. Consequently, hollow Pt@Ru dodecahedra are formed, as shown in Figure 12 [63]. TEM and SEM images are shown in Figure 13.

2.9. Kirkendall Effect

The Kirkendall is a technique mediated by vacancies in which the flow of species that diffuse faster is stabilized by the antagonistic flow of vacancies [64]. This method is not usually used to synthesize metal alloy nanoframes. However, the nanoframes synthesized by this method and reported in the literature include Cu3Pt NFs and some trimetallic nanoboxes, like a Pd-Au-Ag nanobox [65]. Successive galvanic replacement and the Kirkendall effect can be performed to design complex hollow nanostructures, i.e., a Pd-Au-Ag hollow nanobox. In this context, two stages are required (Figure 14). In the first stage, a metal precursor with a high reduction potential (Pd) is needed to create cavities in the metal nanoparticle (Ag). Cetyl Trimethyl Ammonium Bromide (CTAB) can be used as the controlling agent. In the second stage, the already designed hollow structure is used as a support for the second carving by using gold as a metal precursor to create further strained cavities. Ascorbic acid is then used as a controlling agent.

2.10. Photocatalytic Template Synthesis

Three-dimensional Pt nanocages have been successfully prepared by the photocatalytic template synthetic protocol (Figure 15). First of all, platinum nanobranches were deposited on titanium oxide NPs in the presence of UV radiation (UV-340A) for almost one and a half hours under non-stop magnetic stirring. When the templates were removed, platinum nanocages [NCs] were acquired. These NCs were found to have good electrocatalytic stabilities in the case of the methanol oxidation reaction when assessed by chronoamperometric analysis [66]. TEM images at different growth stages are shown in Figure 16.

2.11. Self-Assembly of Nanoparticles

Molecular Dynamic (MD) simulations were used to explain this synthetic protocol, in which nanoparticles acting as building blocks were first annealed at a high temperature and the metal nanostructures obtained at the end were cooled at 10 K. Silver–gold nanoframes were synthesized by the self-gathering of almost 12 similar 5083-atoms of Ag-Au NPs. At 1000 K, an annealing MD simulation was performed. At 50 ps, the gathering of NPs into a triangular Ag-Au nanoframe took place, and finally at 100 ps, a triangular nanoframe was formed Hexagonal gold NFs (Figure 17) and cubic Fe NFs were also synthesized by the same method [22].

2.12. Solvo-Thermal Synthesis

Solvo-thermal synthesis is a technique in which the precursor material is mixed in a proper solvent and then heated to a temperature greater than its boiling point after sealing it in an autoclave. The synthesis of ptCu dodecahedral NFs using this method has been reported. The solution containing cetyltrimethyl ammonium chloride (CTAC), olylamine, copper chloride (CuCl2), and allantoin was first stirred and then ultrasonicated for 40 min; this was followed by the transference of the mixture to an autoclave at 180 °C for 10 h. It was then allowed to cool down naturally [67]. Afterward, centrifugation, washing, and drying at 60 °C were performed. A schematic illustration of the dPtCu nanoframes is shown in Figure 18. TEM images are shown in Figure 19.
Rhombic dodecahedral ptCu NFs synthesis via this method using CTAC and L-proline has also been reported [68]. PtCu octopod nanoframe architectures (OFAs) were also synthesized by this method [69].

3. Different Metal Nano-Frames

3.1. Metal Nanoframe

A novel structure containing Au films deposited by Ag nanoframes was checked for the surface-enhanced Raman (SER) effect [70]. It was reported that intense surface-enhanced Raman scattering (SERS) signals were shown by Ag nanoframes and the Au film sample (Figure 20C), whereas no such response was observed for the Au film without Ag nanoframes. This substrate was found to be a suitable material for the identification of material in the biological domain.

3.2. Alloy Metal Nanoframe

For the electro-oxidation catalytic performance of pt-Cu, nanoframes were investigated using two different morphologies named (PtCu2 CONFs) and (PtCu UONFs); these are abbreviated as PtCu2 concaved octopod nanoframes and PtCu2 ultrathin octopod nanoframes, respectively [29]. The electrochemically active surface area (ECSA) of concaved octopod nanoframes (CONFs), ultrathin octopod nanoframes (UONFs), the platinum on carbon catalyst (pt/C), and Pt black were found to be 44.5 m2/g, 52.1 m2/g, 46.1 m2/g, and 41.4 m2/g, respectively. Due to its small size and greater access to the inner area of the nanoframes, platinum–copper ultrathin octopod nanoframes (PtCu UONFs) exhibited a comparatively superb electrochemical performance. PtNi dodecahedral nanoframes have been prepared by the oxidative etching method from already designed precursors like ptNi rhombic dodecahedron nanoparticles. The specific activity of these nanoframes in the ORR was found to be 1.9 mAcm−2, which is greater than the commercially available Pt/C-specific activity, i.e., 0.19 A·mg−1 [62]. Ni-Pt nanoframes (2D) were also synthesized from Pt containing Ni(OH)2 nanosheets. The ORR-specific activity for these nanoframes was found to be (5.8 mA cmPt−2), which is much greater than the Pt/C catalyst [71] icosahedral Pd-Ru nanoframes [72]. Ru octahedral nanoframes were prepared from the octahedral structure of the Pd-Ru core frame by the preferential etching of Pd cores. Compared to Ru nanowires, their fcc nanoframe morphology was found to be most suitable for the degradation of p-nitrophenol [73]. Another category of nanoframes includes porous metal oxide nanoframes like manganese tin oxide nanoframes, which have been analyzed for their capacity to enhance Li-ion storage abilities. Their initial capacity was found to be 1620.6 mA h g−1 at 0.05 A g−1 and their durability was so high that they were capable of transporting a capacity of 547.3 mA h g−1 at 2 A g−1 even after one thousand cycles [74]. Some yolk–shell nanoframes like Ag@mSiO2, with Ag NPs as yolk and glucose oxidase conjugated mesoporous silica as shell, have been prepared to investigate their role in cancer treatment. The experimental results showed that glucose oxidase is a basic component of nanocarriers, which were mainly responsible for triggering the entire approach. These NFs exhibited marvelous results regarding their cancer-killing effect and efficient cellular-uptake ability [75].

3.3. Doped Metal Nanoframes

Copper nanoframes were found to have a much better performance in the ORR. It was reported that the half-wave potential for Cu ISs/NC-1000 (copper isolated sites anchored on nitrogen-doped carbon material) was 0.92 V, which is much more efficient compared to commercially available Pt/C [76]. Fe-N-doped 3D carbon nanoframes exhibited outstanding ORR activity. The catalyst had a more positive half-wave potential, which was 0.70 V in alkaline medium; similarly, Pt3Ni RDH nanoframes yielded a high ORR mass activity of 5.7 A mgPt−1 at 0.9 VRHE, which is 22 times higher than that of commercial Pt/C [37].

4. Applications

4.1. Electro Catalytic Performance

Nanoframes have garnered significant attention as electrocatalysts because of their inherently high active surface areas [77]. The nanoframe structure offers an extensively porous framework, increasing both interior and exterior catalytic surface areas [37,78]. Furthermore, nanoframe electrocatalysts exhibit high surface-to-volume ratios and extensive surface areas [79]. Within the confined nanospace, reactants readily collide on the catalytic surface, facilitated by the nanoframe structure [78].

4.1.1. Methanol Oxidation Reaction (MOR)

The nanoframes named d-Pt@Ru and h-Pt@Ru were analyzed for their efficient electrocatalytic activity during methanol oxidation [63]. For this purpose, these hollow nanoframes were carried on multi-walled carbon nanotubes (MWCNTs) with their 20wt% loading. Their activity for methanol oxidation was checked for different Pt-Ru nano-samples by using sulfuric acid (H2SO4) and methanol (CH3OH). Their catalytic efficiency was detected initially by ECSA, which in turn was estimated from the hydrogen desorption region of CV curves (Figure 20A). Among all the samples analyzed, the highest mass activity was possessed by d-Pt@Ru dodecahedra, i.e., 0.80 A mgPt−1, and the specific activity was found to be 1.61 mA cmpt−2 (Figure 20B). In comparison to commercial Pt/C, the mass activity and specific activity of the d-Pt@Ru dodecahedra were found to be 5.25 and 7.78 times more efficient. The d-Pt@Ru and h-Pt@Ru were also tested for their anti-poisoning ability, which ensures their enhanced electro catalytic ability. In addition to this material, the cyclic voltammogram (CV) curves of PtCuRh RDND (ptCuRh-rhombohedral dodecahedron nanoframe with nanodentrites), PtCuRh RDN (rhombic dodecahedron nanoframe), PtCu NC and commercial Pt/C catalysts were analyzed and their peak current densities were found to be 56.9 mA cm−2, 56.0 mA cm−2, 32.3 mA cm−2, and 25.76 mA cm−2, respectively. To find the durability of this material, a durability test was performed. For Pt/C and PtCu NC, the durability was reduced up to 44% and 49%, and PtCuRh RDND and PtCuRh RDN were able to maintain 73.2% and 60.6% of their original activity [80].

4.1.2. Ethanol Oxidation Reaction (EOR)

For the EOR, CV plots for PtCuRh RDND, PtCuRh RDN, PtCu NC, and Pt/C are compared (Figure 21A). It was estimated that PtCuRh RDND exhibited a maximum current density of 29.9 mA cm−2, which is 2.3 times higher than commercial Pt/C catalysts. Regarding the mass activity, it was calculated as 0.98 A mg−1Pt for the former compared to 0.48 A mgPt−1 for the latter [80]. A 44% and 49% decrease in the mass activity of Pt/C and PtCuNc was found compared to PtCuRh RDND and PtCuRh RDN, which were quite durable and maintained their mass activity up to 73.2% and 60.6% of the original value even after 1000 cycles of the stability test (Figure 21B). In addition to that, Pt nanoframes with incorporated Bi(OH)3 exhibited a marvelous EOR performance, with a mass activity of 6.87 A mg-1pt, which is 13.5 times higher than commercial platinum [81].

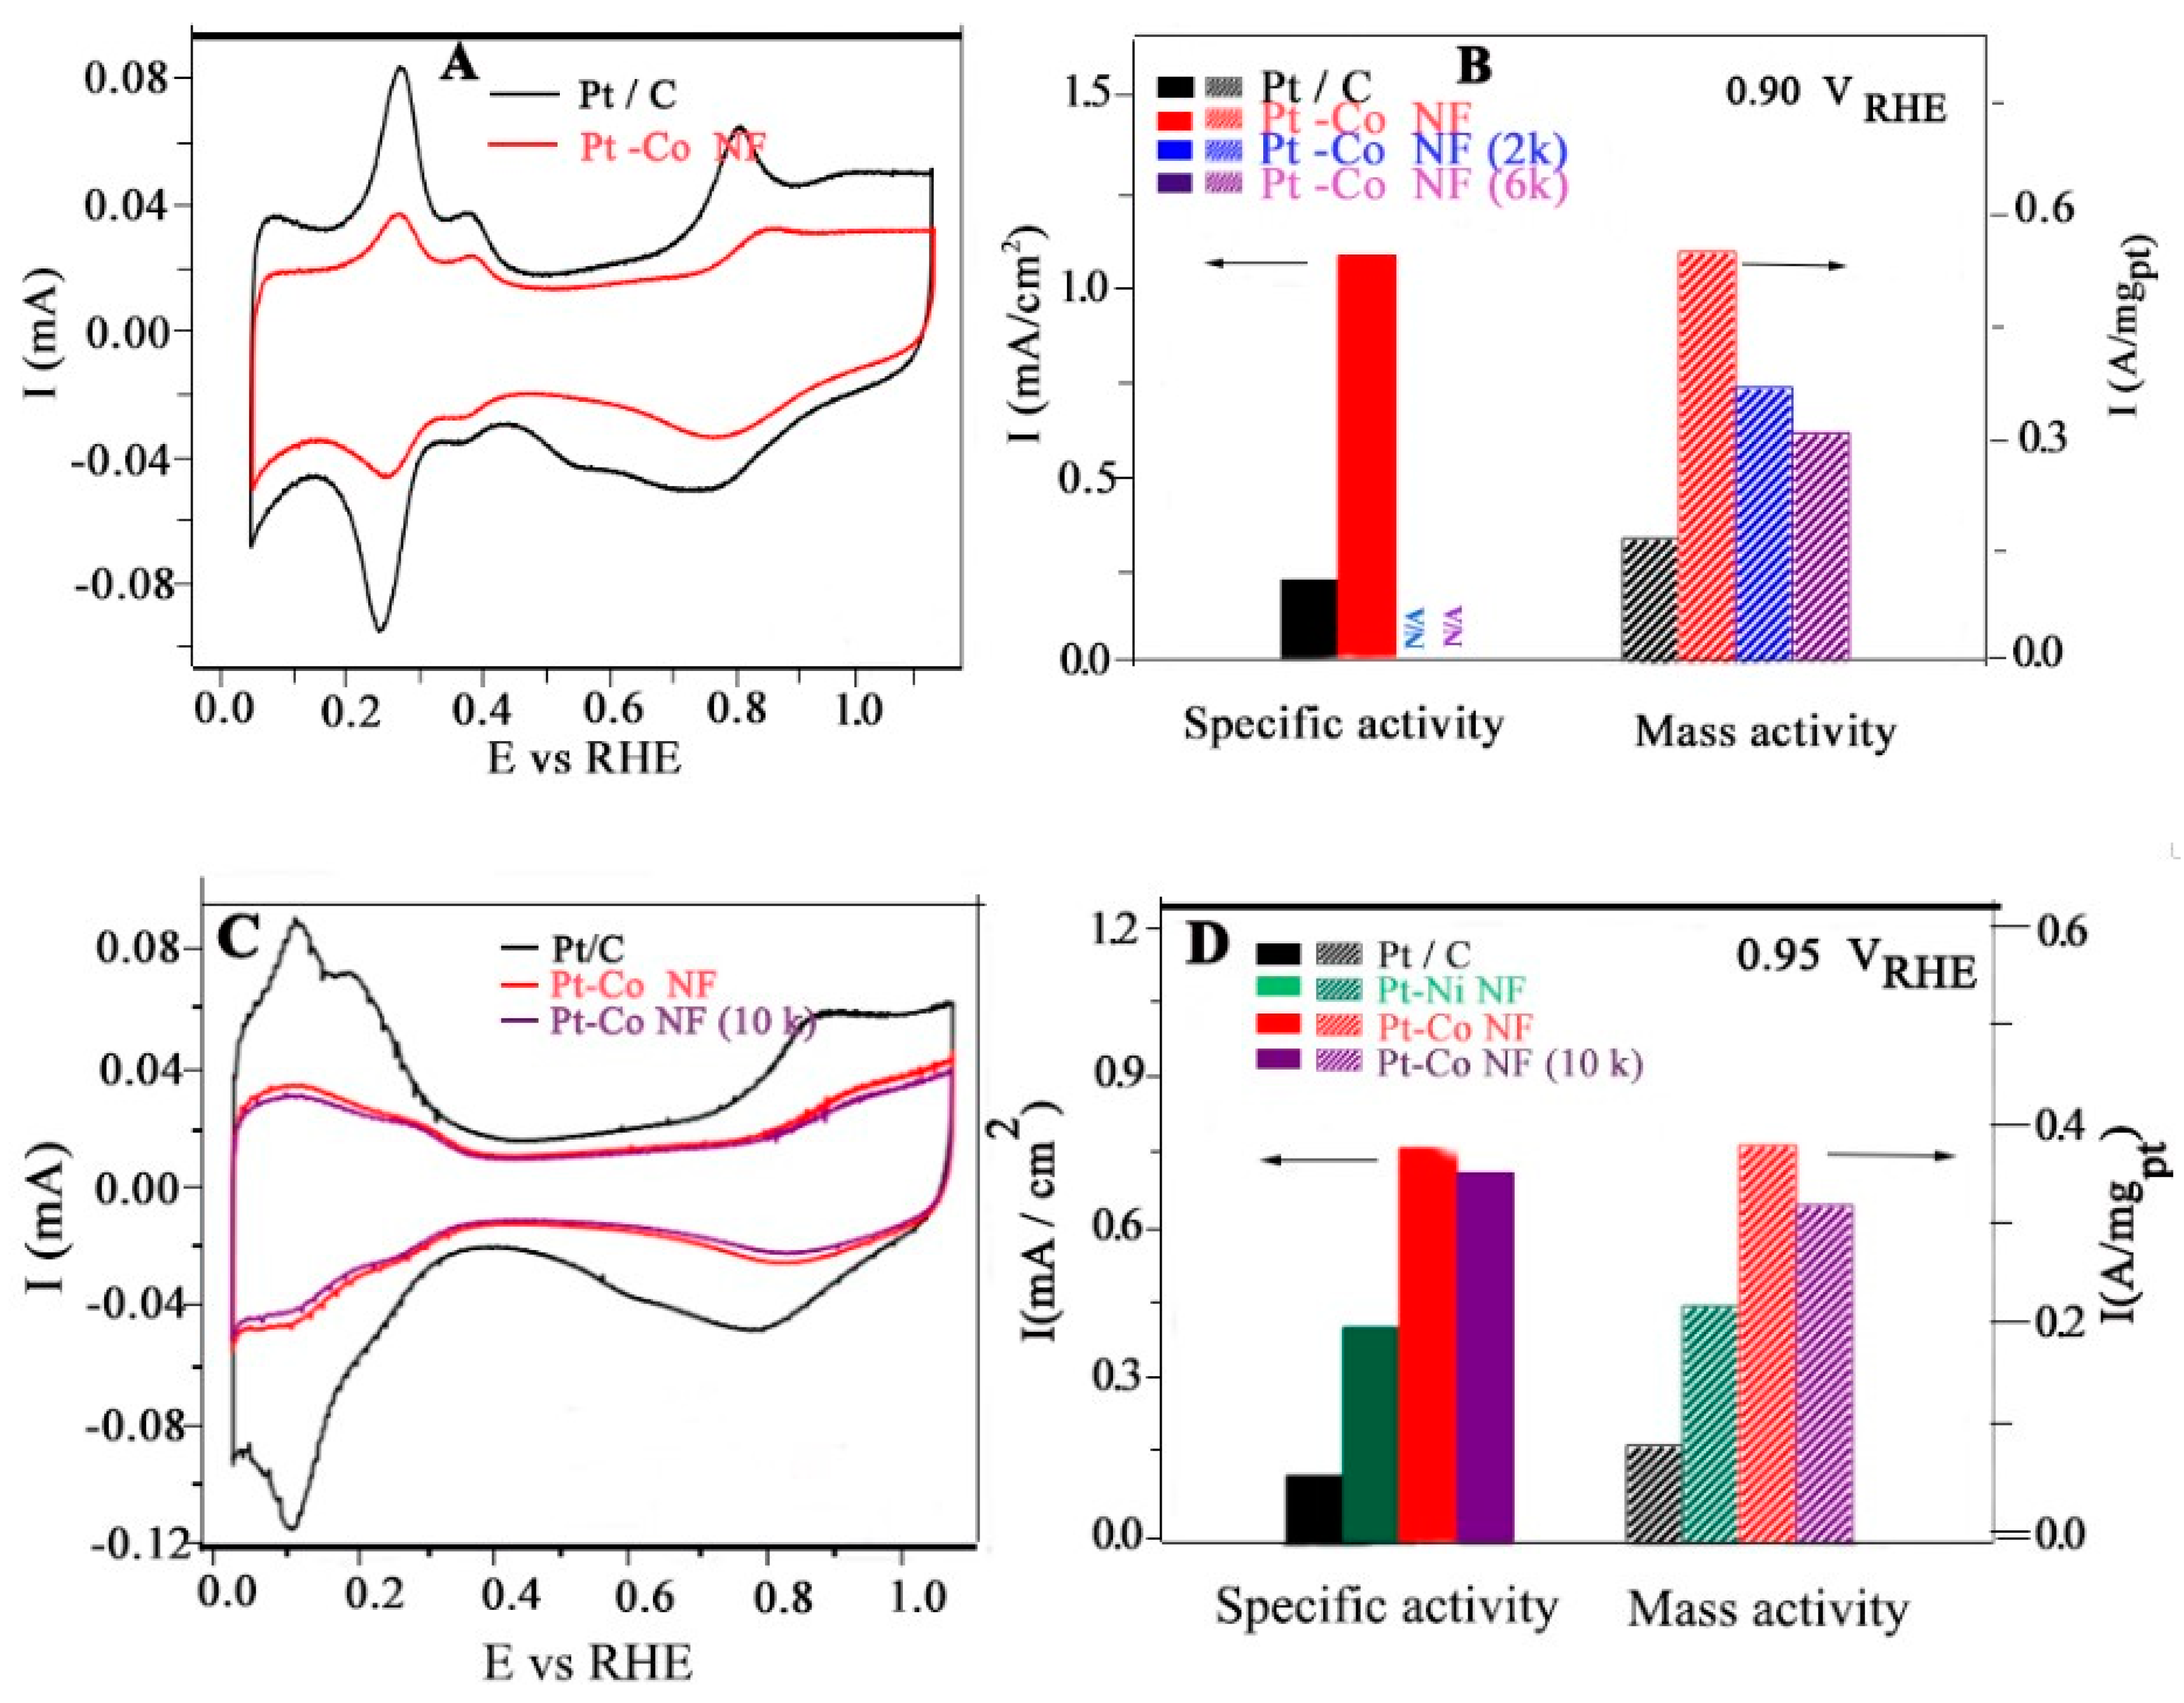
4.1.3. Oxygen Reduction Reaction (ORR)

The ORR activity of Ni(OH)2@Pt was detected by using a rotating disc electrode (RDE). In the NiPt-200 and NiPt-300 nanoframes [71], the half-wave potential was found to be 70 mv more positive than Pt/C. Their CV plots are shown in Figure 22A. The specific activity was found to be 3.2 ± 0.6 and 5.8 ± 2.4 mA cmPt−2, respectively, which shows that the NiPt-300 nanoframe was found to be 10.2 times more efficient than Pt/C (0.57 ± 0.03 mA cmPt−2) in terms of its specific activity (Figure 20B). The increased specific activity of NiPt-300 compared to NiPt-200 might be due to many factors, like the complete transformation of Ni (OH)2 that took place in its structure and the presence of micropores. The decreased mass activity of the NiPt-300 and NiPt-200 nanoframes in comparison to Pt/C is because the ECSA of Pt is lower in NiPt nanoframes.

4.1.4. Hydrogen Evaluation Reaction (HER)

Different metal nanoframes like PtCu DNFs (dodecahedral nanoframes) have been investigated for use in the enhanced HER. To analyze their electrocatalytic performance, CV graphs of different samples like PtCu DNFs, PtCu NPHs, Pt/C, and Pt black catalysts were studied (Figure 23A) [67]. The onset potential determined through the Tafel slope shows that it is more positive (0 mV) for PtCu DNFs when compared to −20 mV, −21 mV, and −36 mV for Pt/C, PtCu NPHs, and Pt black, respectively, which is a clear manifestation of the increased HER performance of the former (Figure 23B). The over potential values for all the above-mentioned catalyst structures were found to be 27 mV, 37 mV, 66 mV, and 78 mV, depicting very efficient electron transfer in the dodecahedral nanoframe structure.

4.1.5. Formic Acid Oxidation Reaction (FAOR)

Palladium nanoframes were found to be an efficient catalyst for formic acid oxidation. Formic acid can be used as fuel in fuel cell technology. CV graphs of two catalysts were analyzed for their electro-oxidation of formic acid, and Pd NFs showed 7.5 times more activity in comparison to the Pd octahedral catalyst (Figure 24A) [40]. When the electrochemical durability after 1000 cycles was checked, it was found to be 6.5 times higher for the Pd nanoframe compared to the Pd octahedral (Figure 24B).

4.1.6. Overall Water Splitting

CoP nanoframes were found to possess the best catalytic activities for the HER and OER [82]. Besides this, they also had both water reduction and oxidation properties or, in short, water splitting capacities [82]. The linear sweep voltammogram (LSV) curves for the CoP NFs and CoP nanocubes (CoP NCs) showed that cell voltages of 1.65 and 1.75 V were required to acquire a current density of 10 mAcm−2 for water splitting (Figure 25A). As far as durability is concerned, the water splitting capacity remained constant even after 30 h (Figure 25B). Transition metal phosphide (TMP) 3D nanoframes were found to be the best material for overall water splitting [83]. Another metal nanoframe (Ni, CO)2PNF) was used as both an anodic and cathodic material for overall efficient water splitting [84].

4.1.7. Glycerol Oxidation Reaction (GOR)

PtCu HCNFs were declared to be the best catalyst for the GOR compared to the other catalysts observed under the same conditions in Ref. [85]. It was demonstrated that a diffusion-controlled process occurred on the surface of the catalyst for the GOR. The slope values of the CV plots for the Pt-HCNFs (PtCu alloyed hollow cubic nanoframes), Pt-NCs (Pt nanocubes), and Pt/C were calculated as 12.8, 6.2, 2, and 2.6, respectively. The ECSA of the PtCu-HCNFs, Pt black, and PtCu NPs was calculated as 23.4 m2 g−1 Pt, 12.04 m2 g−1 Pt, and 15 m2 g−1 Pt, respectively (Figure 26A). Moreover, the ORR polarization curve depicts the enhanced stability and activity towards the ORR (Figure 26B); the PtCu-HCNFs were considered to possess an enhanced electrochemical performance in the GOR [86].

4.2. Biomedical Applications

Nanostructures are liked because they have interesting properties related to light (plasmonic), and because we can easily add things onto their surfaces. Also, tiny bits of gold called nanostructures are very proficient at helping us detect and take pictures of biological things. For example, they make techniques like super-powered Raman spectroscopy, better-looking fluorescence, special biosensors, and using sound to make images inside the body possible [87]. Nanoframes have been introduced in biomedical fields due to their heightened LSPR shift towards NIR. Furthermore, their empty architectures are highly compatible with drug delivery and systems for controlled drug release.

4.2.1. Healing of Liver Injury

Gold nanoframes have been analyzed for in vivo biomedical applications due to their increased physiological stability and efficient biocompatibility [87]. C57BL/6 female mice were used as a model to evaluate liver injury via the intravenous injection of different nanostructures like GNSs (Gold nanoshells) and GNFs (Gold nanoframes). The portion of the liver treated with GNSs showed the existence of inflammation. The causative agent responsible for this inflammatory response was oxidative stress due to the enhanced assembling of GNSs, which in turn increases.
In contrast, the same concentration of GNFs did not cause any unusual biological changes in the portion of the liver in which they were inducted. In addition to the liver, the experiment was also conducted on the spleen, kidney, and lungs by performing a 24 h post-injection of GNFs, and no unusual changes were observed. In comparison to GNSs, GNFs not only have excellent physiological stability but also efficient stability (Figure 27). Hence, GNFs can be suggested as the best material in the future for in vivo utilizations like cancer detection, etc.

4.2.2. Detection of Tumor Cells

To achieve excellent sensitivity and the detection of cancerous cells, there is a need to further amplify the detection signals. For this purpose, detection signals were converted into temperature and pressure signals by using novel (NIR-II) responsive gold nanoframes (Au-NFs) [88]. The Near-Infrared Spectroscopy (NIR) absorption spectra of different Au-NFs systems are shown in (Figure 28A). The production of CO2, NH3 and O2 as a result of the disintegration of H2O2 and the photo thermal conversion of NH4HCO3 enhances pressure signals, and its peroxidase activity converting to TMB (3,3 5,5 tetramethylµ benzidine) to TMB oxide (oxTMB) further improves its photo thermal response. The pressure and temperature signals were found to be linearly correlated with the Au-NF concentration. The system containing Au NF, TMB and H2O2 showed improved signals with temperature changes (Figure 28B). To investigate its clinical applications, Hela cells were introduced into human serum and blood samples; Au-NFs were found to have good biocompatibility, as the hemolysis rate calculated was only 5%. The limit of detection (LOD) determined for both the temperature and pressure signals through this nanoframe was found to be very low compared to the other methods already reported, i.e., electrochemistry [89,90], mass spectrometry [91,92], and optics [93]. Au@Au–Ag DCFs (Au@Au–Ag dot in cubic nanoframes) have also been reported for asymptomatic surface-enhanced Raman spectroscopy (SERS) and the photoacoustic detection of tumors with a detection depth of up to 4 mm [94]. The SERS images become brighter with an increasing Au@Au–Ag DCF concentration (Figure 29(A1)). Moreover, the SERS intensity increases with its increased concentration (Figure 29(A2)). The fact that SERS images become darker with increasing depth was analyzed, and the SERS intensity was found to be decreased with an increasing depth (tissue mimicking thickness) of detection (Figure 29(B1,2)).

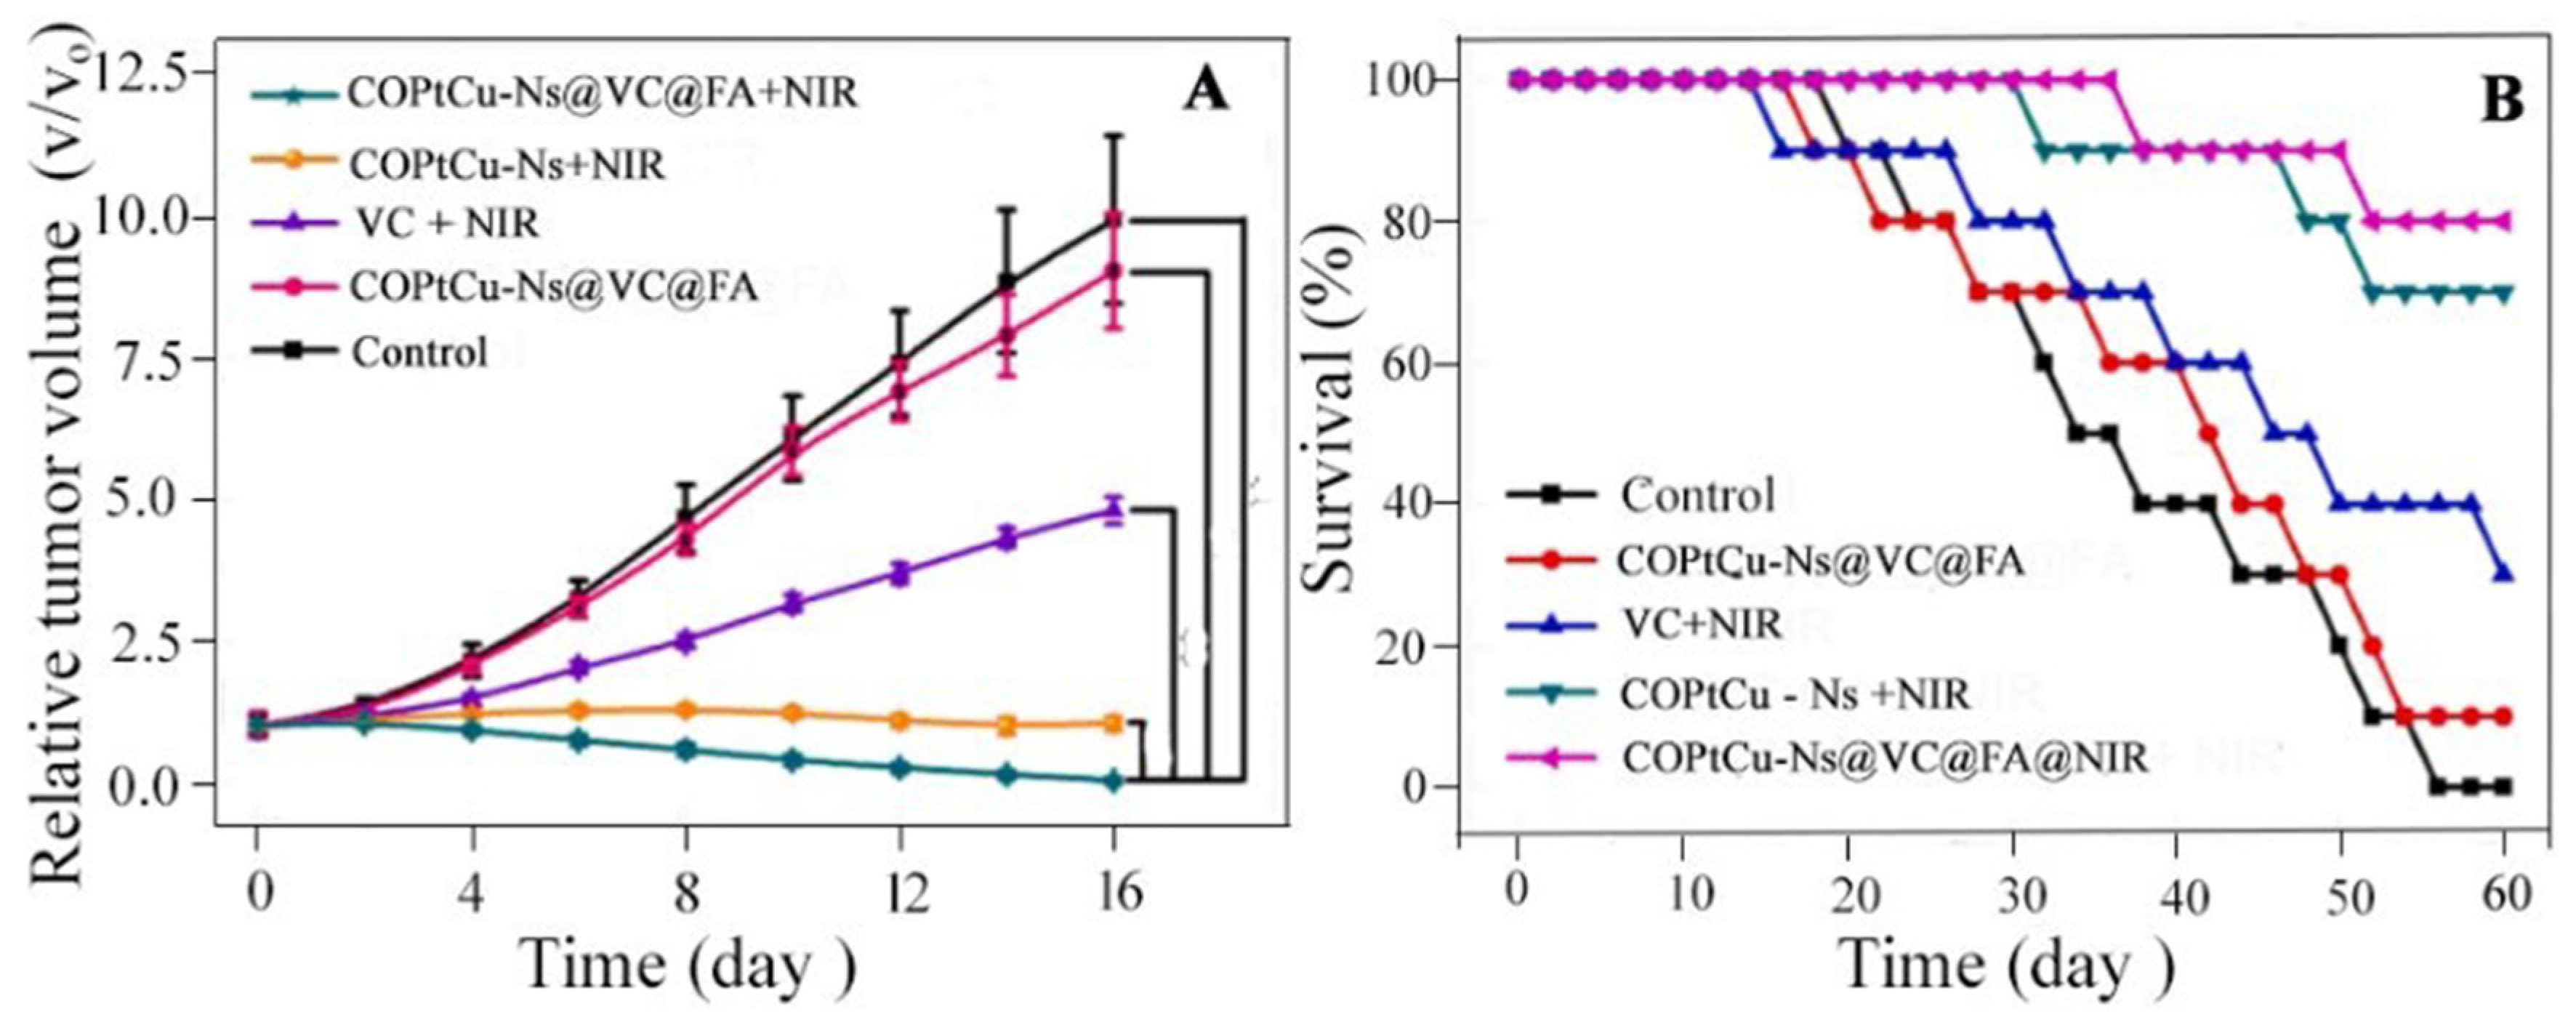
4.2.3. Synergistic Photo Thermal and Chemo Dynamic Therapy

Concave octahedral PtCu nanoframes were loaded with vitamin C to form CoPtCU-nfs@VC as an anti-tumor nanoagent. They were also modified with tumor-targeting folic acid to form CoPtCU-nfs@VC@FA [95], which can easily deliver Vitamin C VC to cancerous cell targets. These NFs were related to the generation of OH radicals and H2O2 production, which cause serious toxicity and damage to tumor cells. Its photo thermal conversion (PC) efficiency was found to be 68.4%, with heat loss of only 2% after performing six thermogenesis cycles. NIR laser irradiation at 880 nm showed the quick release of model drugs (methylene blue and hydrophobic rhodamine) compared to when no laser radiations were used. These NFs in combination with NIR showed better tumor volume reduction (Figure 30A) and a better survival rate of mice in comparison to other samples or combinations; this is shown in Figure 30B.

4.3. Theranostic Application

The combined strategy of therapeutic and diagnostic capabilities comes under the umbrella of theranostic applications [96]. The combination of the experimental and theoretical analysis showed that on the surface of Au NFs and throughout their interior structure, intense plasmonic surface field effects occur in comparison to other solid nanostructures [97]. Nanoframe can have different dimensions: (L) edge length; (W) edge thickness (Figure 31). Due to the distinctive framework of NFs, their localized surface plasmon resonance (LSPR) can be modulated to NIR from the visible region by changing the dimensions of NFs during synthesis, and this property makes them a promising candidate for in vivo applications. In addition to that, they have appreciable sensitivity factors and hence serve as the best material for nanosensors in NIR. The optical response of nanoframes was investigated as a function of the aspect ratio (R) and length (L). It is estimated that nanoframes with better absorbance in NIR are best for theranostic applications. When the L value increases, LSPR absorption also increases from 690 to 1060 nm (Figure 32A). As the R value increases, the LSPR peak wavelength also increases from 600 nm to 1090 nm as R = L/W; L is kept constant (Figure 32B).

4.4. Industrial Applications (Dye Removal)
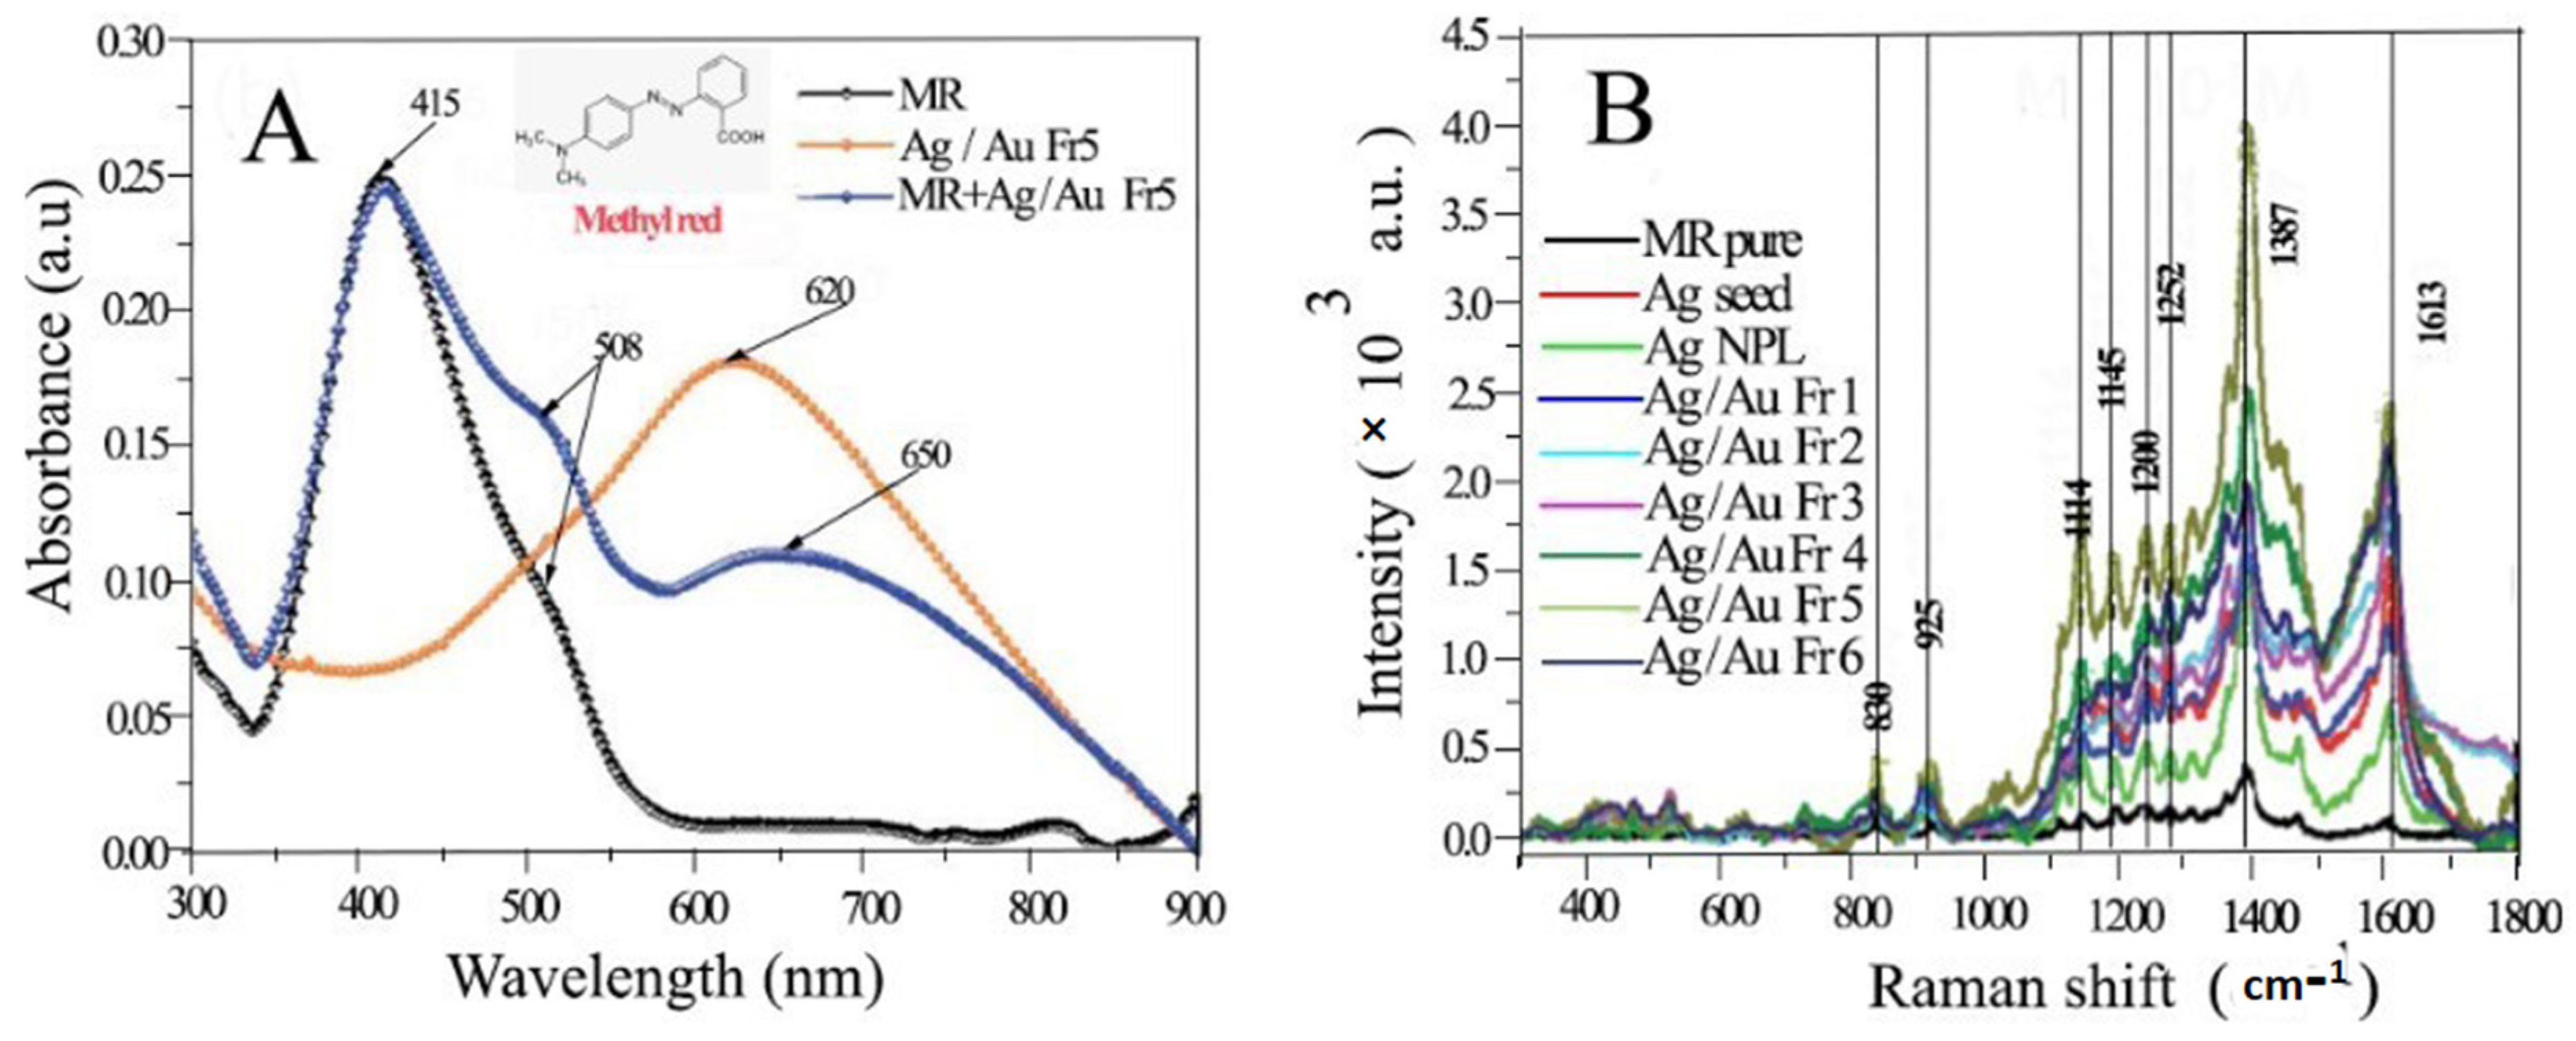
4.4.1. Methyl Red

Metal nanoframes have been used in the past for the detection of dyes [98]. The UV–visible absorption spectra showed that MR+Ag/Au Fr5 possesses more intense absorption peaks at 415,508,650 nm (Figure 33A). By analyzing the SERS spectra of Ag/Au NFs, the absorption peak intensity of these NFs was found to be more intense compared to the silver nanoplate structure. This is because the active surfaces on the nanoframe structure are efficient due to its intense edges and vertices, which in turn hold the responsibility of enhancing the resonance signal. Ethanol-diluted methyl red dye was excited by a laser signal of 532 nm. This NF material served as the best SERS podium to detect methyl red dye as it was found to be stable and reproducible, with a high enhancement factor and low limit of detection (10−5) compared to its nanoplate structure. The SERS spectra showed that the Ag/Au Fr5 sample possessed a precise and distinct SERS signal (Figure 33B). The Relative Standard Deviation (RSD) value for the SERS signal at 1613 cm−1 was found to be 2.3%, which shows the superb reproducibility of NFs. In comparison to methylene blue, the rhodamine 6G SERS signal intensity for methyl red was stronger and more intense.

4.4.2. Methylene Blue

The use of photo-electro Fenton electro catalysts like concave octopus-like Pt-Cu nanoframes (COPC-NFs) has been reported to improve wastewater treatment and eliminate dyes [99]. In comparison to the previous Fenton processes reported, the photo-electro Fenton method has shown better results due to its self-production of hydrogen peroxide [99] and also due to the use of copper instead of iron in the Fenton catalyst, which shows enhanced efficiency in a neutral environment. Fenton’s degradation can be enhanced by considering NIR signals [100,101]. Methylene blue was used as a sample dye. The degradation performance of these COPC-NFs and the previously reported photocatalysts was compared with COPC-NFs and is summarized in Table 2 and Table 3 and the COPC-NFs was found to be the best one. As far as durability is concerned, after 10 cycles of reuse, they still showed excellent activity of about 95% (Figure 34A). When treated with 10 mA DC, additional electro catalytic activity for H2O2 generation was observed (Figure 34B).

4.4.3. 4-Nitro Phenol

AuAgPd polyhedral nanoframes have been reported for their efficient catalytic reduction of 4-nitrophenol in the presence of UV–visible light [107]. The catalytic reduction of these NFs was found to be greater than AuAgPd NPs due to the Plasmon enhancement effect. The rate constant value determined for the aforementioned reaction was found to be 1.7 times greater in the presence of light when compared to the light-off reaction condition (Figure 35A,B). The UV–visible spectra showed that the absorption peak for nitrophenol obtained at 400 nm started to become less intense slowly and gradually, depicting its reduction [108].

4.5. Electro Fenton Application: H2O2 Production in Acids

PdAu-NFs have been analyzed as efficient catalysts for the electrochemical generation of H2O2 [109], which reacts with ferrous ions (Fenton’s reaction) to produce OH, which is responsible for the rapid degeneration of contaminants. The organic dye Rhodamine B (RhB) was used as a sample dye. PdAu-NFs cause the very fast disintegration of dye in a very short period. UV-visible analysis showed that almost 90% of the RhB was degraded in just the initial 5 min of reaction as shown in Figure 36A and decay of RhB concentration over time during electro-Fenton reaction at 0.3 V by Pd Au-NF and Au/C is shown in Figure 36B.

4.6. Electrical Batteries

4.6.1. Lithium-Ion Battery Anodes

Porous manganese tin oxide nanoframes (PMNs) were investigated as the best material for use as the anode in lithium-ion batteries. They were found to possess excellent durability, capacity, and reversibility [74]. Different samples were checked for their reaction rates at different current densities, including PMNs, bulk MnSnO3, and SnO2. The one that could produce better capacitance either at low or higher current densities was the PMN anode due to its shorter grain size (Figure 37A). In addition to that, due to their smaller diameter, PMNs offer less resistance and as a result, they enhanced the interface charge transfer, which further augmented their rate properties when compared to bulk MnSnO3. As far as durability is concerned, even after 100 cycles, the PMNs were able to transfer a stable capacity of 912.0 mA h g−1; meanwhile, other samples (Bulk MnSnO3, and SnO2) could only transfer a stable capacity of 383.2 and 223.1 mA h g−1, respectively. Due to their shorter grain size and porous structure, PMN samples have shown higher capacities at different voltage ranges (Figure 37B). Hierarchical multilayered bipyramid nanoframes (HMBNFs) made up of ZnO/CoO were also found to possess a very efficient cycling capacity and better electrochemical performance [110] when they were analyzed as an anodic material for Li-ion batteries.

4.6.2. Na-Ion Batteries

Na-ion batteries (NIBs) are considered to be better than Li-ion batteries due to their natural reserves and low cost [111,112]. Copper-doped CoSe2 nanoframe cubes (Cu-CoSe2-NFCs) have been reported as the best electrodic materials for NIBs [113]. The charging capacities of these NFs doped with copper and without copper were found to be 470 mAh g−1 and 420 mAh g−1, respectively. The rate performance of Cu-CoSe2-NFC electrodes at different current densities has confirmed their superb specific activity (Figure 38A). The presence of copper has also increased the electrical conductance of these NFs, as depicted by the EIS (Figure 38B). Moreover, Cu-CoSe2-NFCs were able to retain a 90% charging capacity even after 100 cycles.

4.7. Energy Storage Devices

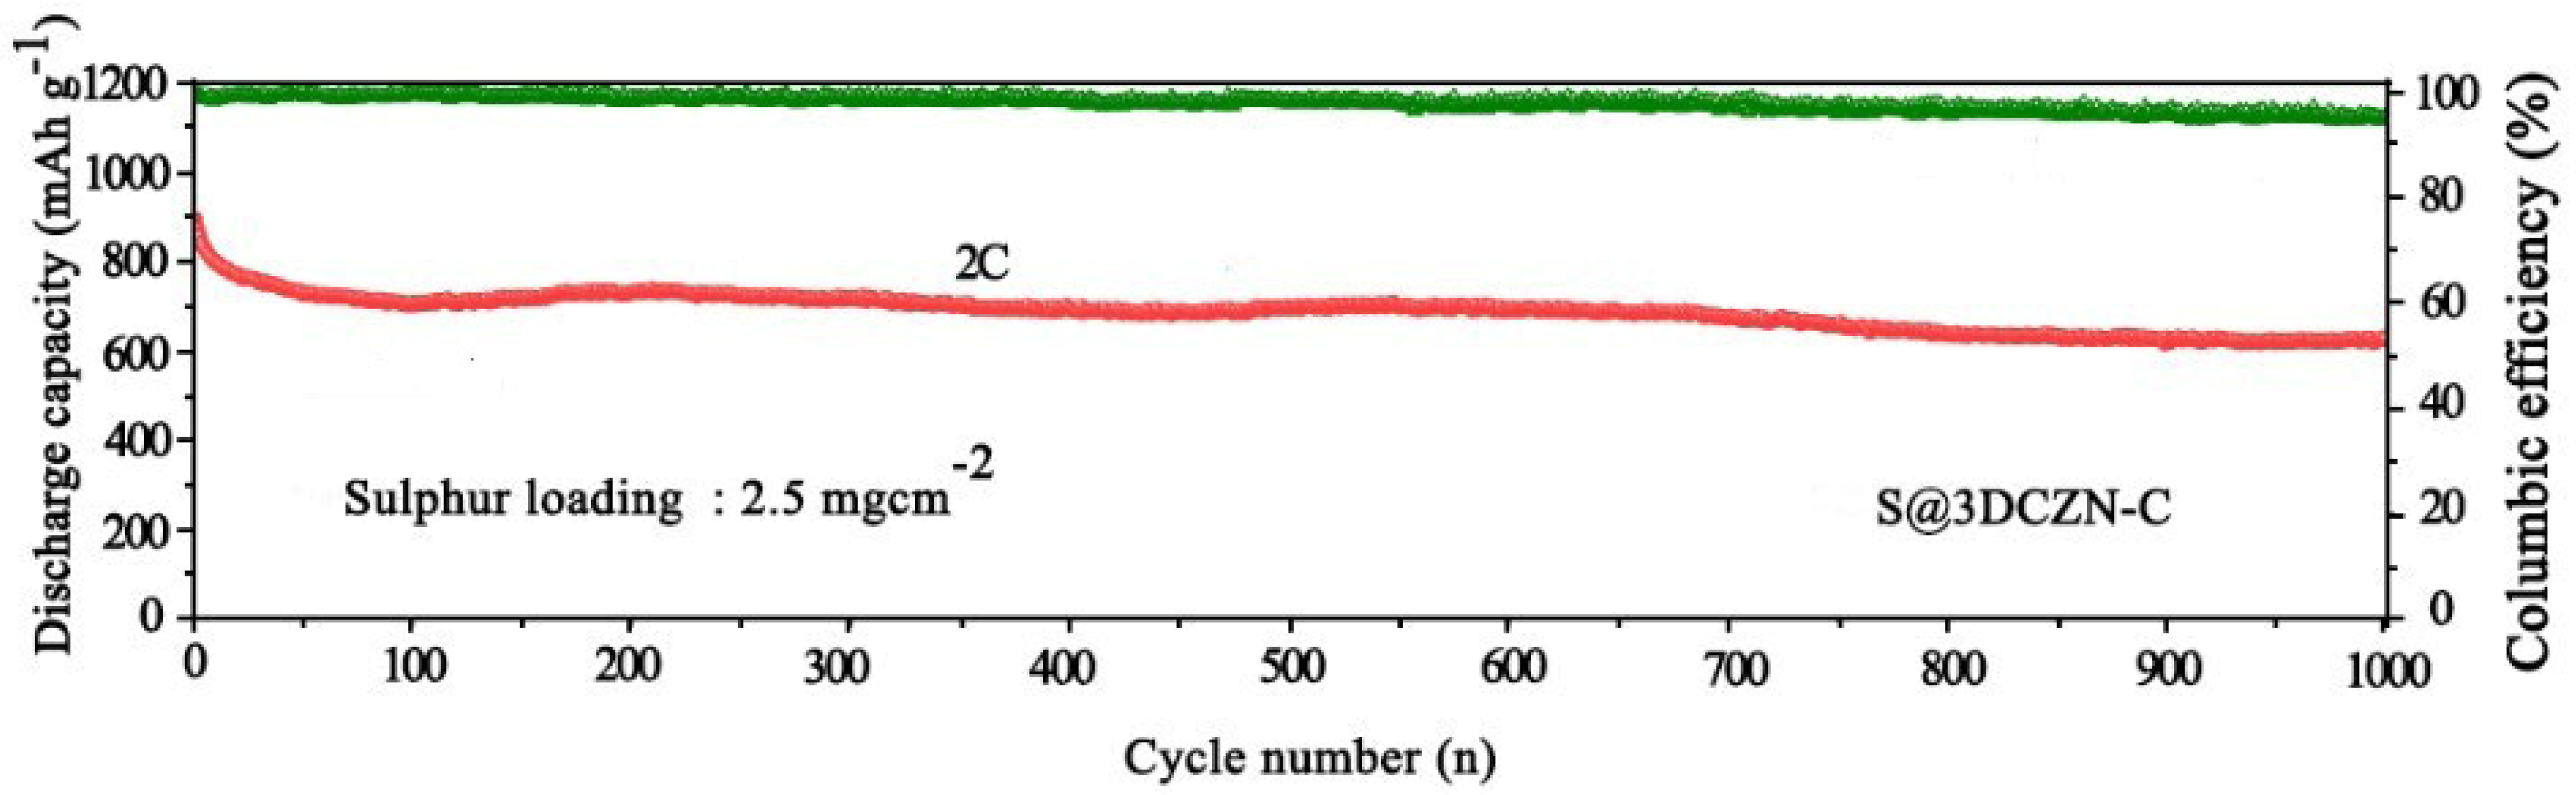
4.7.1. Lithium–Sulfur Li-S Cells

Lithium–sulfur pouch cells are considered to be the best energy storage devices due to their high energy density and specific activity [114,115]. The use of 3D ZnCoN co-doped carbon NFs (3DZCN-C) as a cathodic material for these cells has been reported due to their best activity being presented when inhibiting the shuttling effect of lithium polysulfides (LiPS), with superb cyclability and durability [116]. Moreover, the discharge capacity of these cells comprising 3DZCN-C reaches up to 975.6 mAh−1 at 0.5C, and the decay rate even after 1000 cycles is very low, i.e., 0.03% (Figure 39). The 3D structure of these nanoframes offers a highly porous structure and the availability of nitrogen vacancies enhances the Li-ion diffusion coefficient, thus improving the electrochemical properties.

4.7.2. Supercapacitor Electrodes

An asymmetric supercapacitor system has been designed by using 3D nanoframes such as sulfurized Ni-Al as a positive electrodic material and Bi-Ce-S as a negative electrodic material [117]. Instead of conventional carbon-based negative electrodic material, Bi-based material is preferable due to its high capacitance and easy manufacture [118,119]. The capacitance of sulfurized electrodic material is high, i.e., 1230.6 F g−1, compared to the material without substitutional sulfur present, i.e., 896 Fg−1, at a current density of 1 A g−1 (Figure 40A). The capacitive retention values at 20 Ag−1 were determined to be 69.8% and 59.3%, respectively. This electrode was found to possess 81.4% capacitive retention even after 4000 cycles (Figure 40B). Moreover, the specific capacitance of Bi-Ce-S was high compared to Bi-S when the current was increased from 1 to 10 A g−1. The capacitive retention was 92.2% at a current density of 10 Ag−1 for the Bi-Ce-S electrode. The capacitive retention for the whole device was 80.6% at 10 Ag−1, with a coulombic efficiency of 96.9% even after 8000 cycles (Figure 40C). For device fabrication, the mass ratio of the material required for both electrodes was determined through charge–balance theory [120,121].

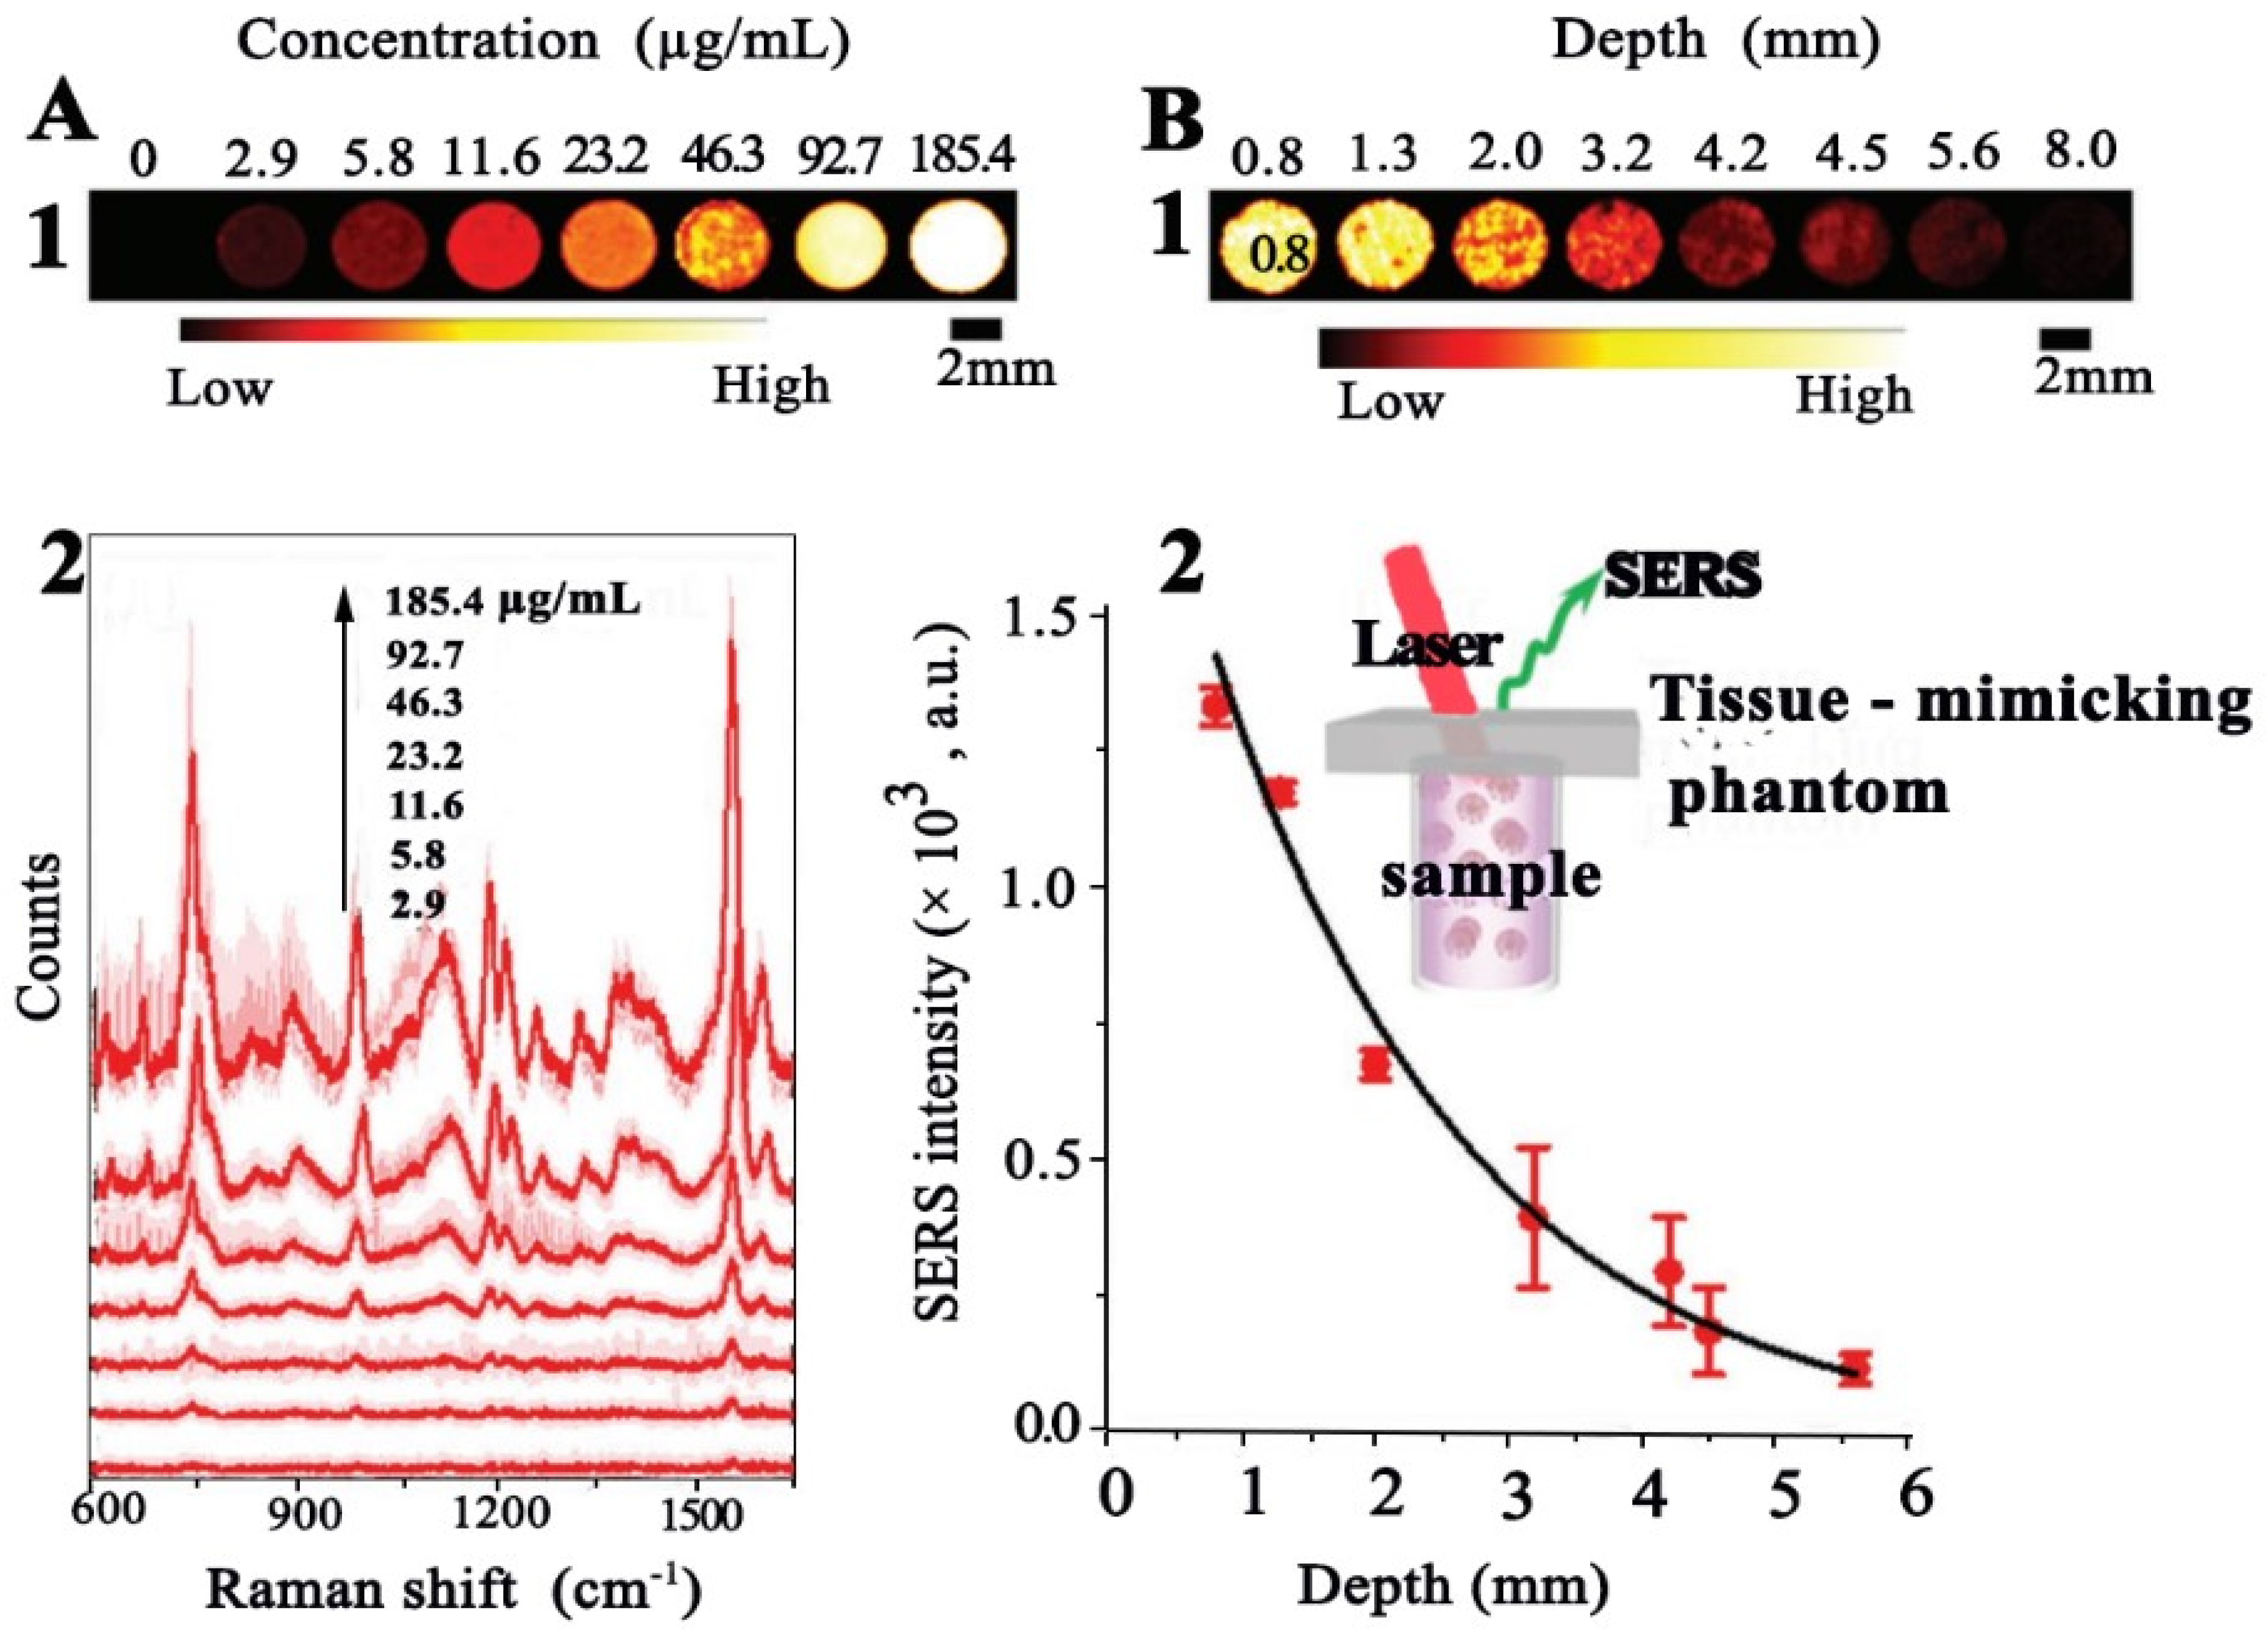
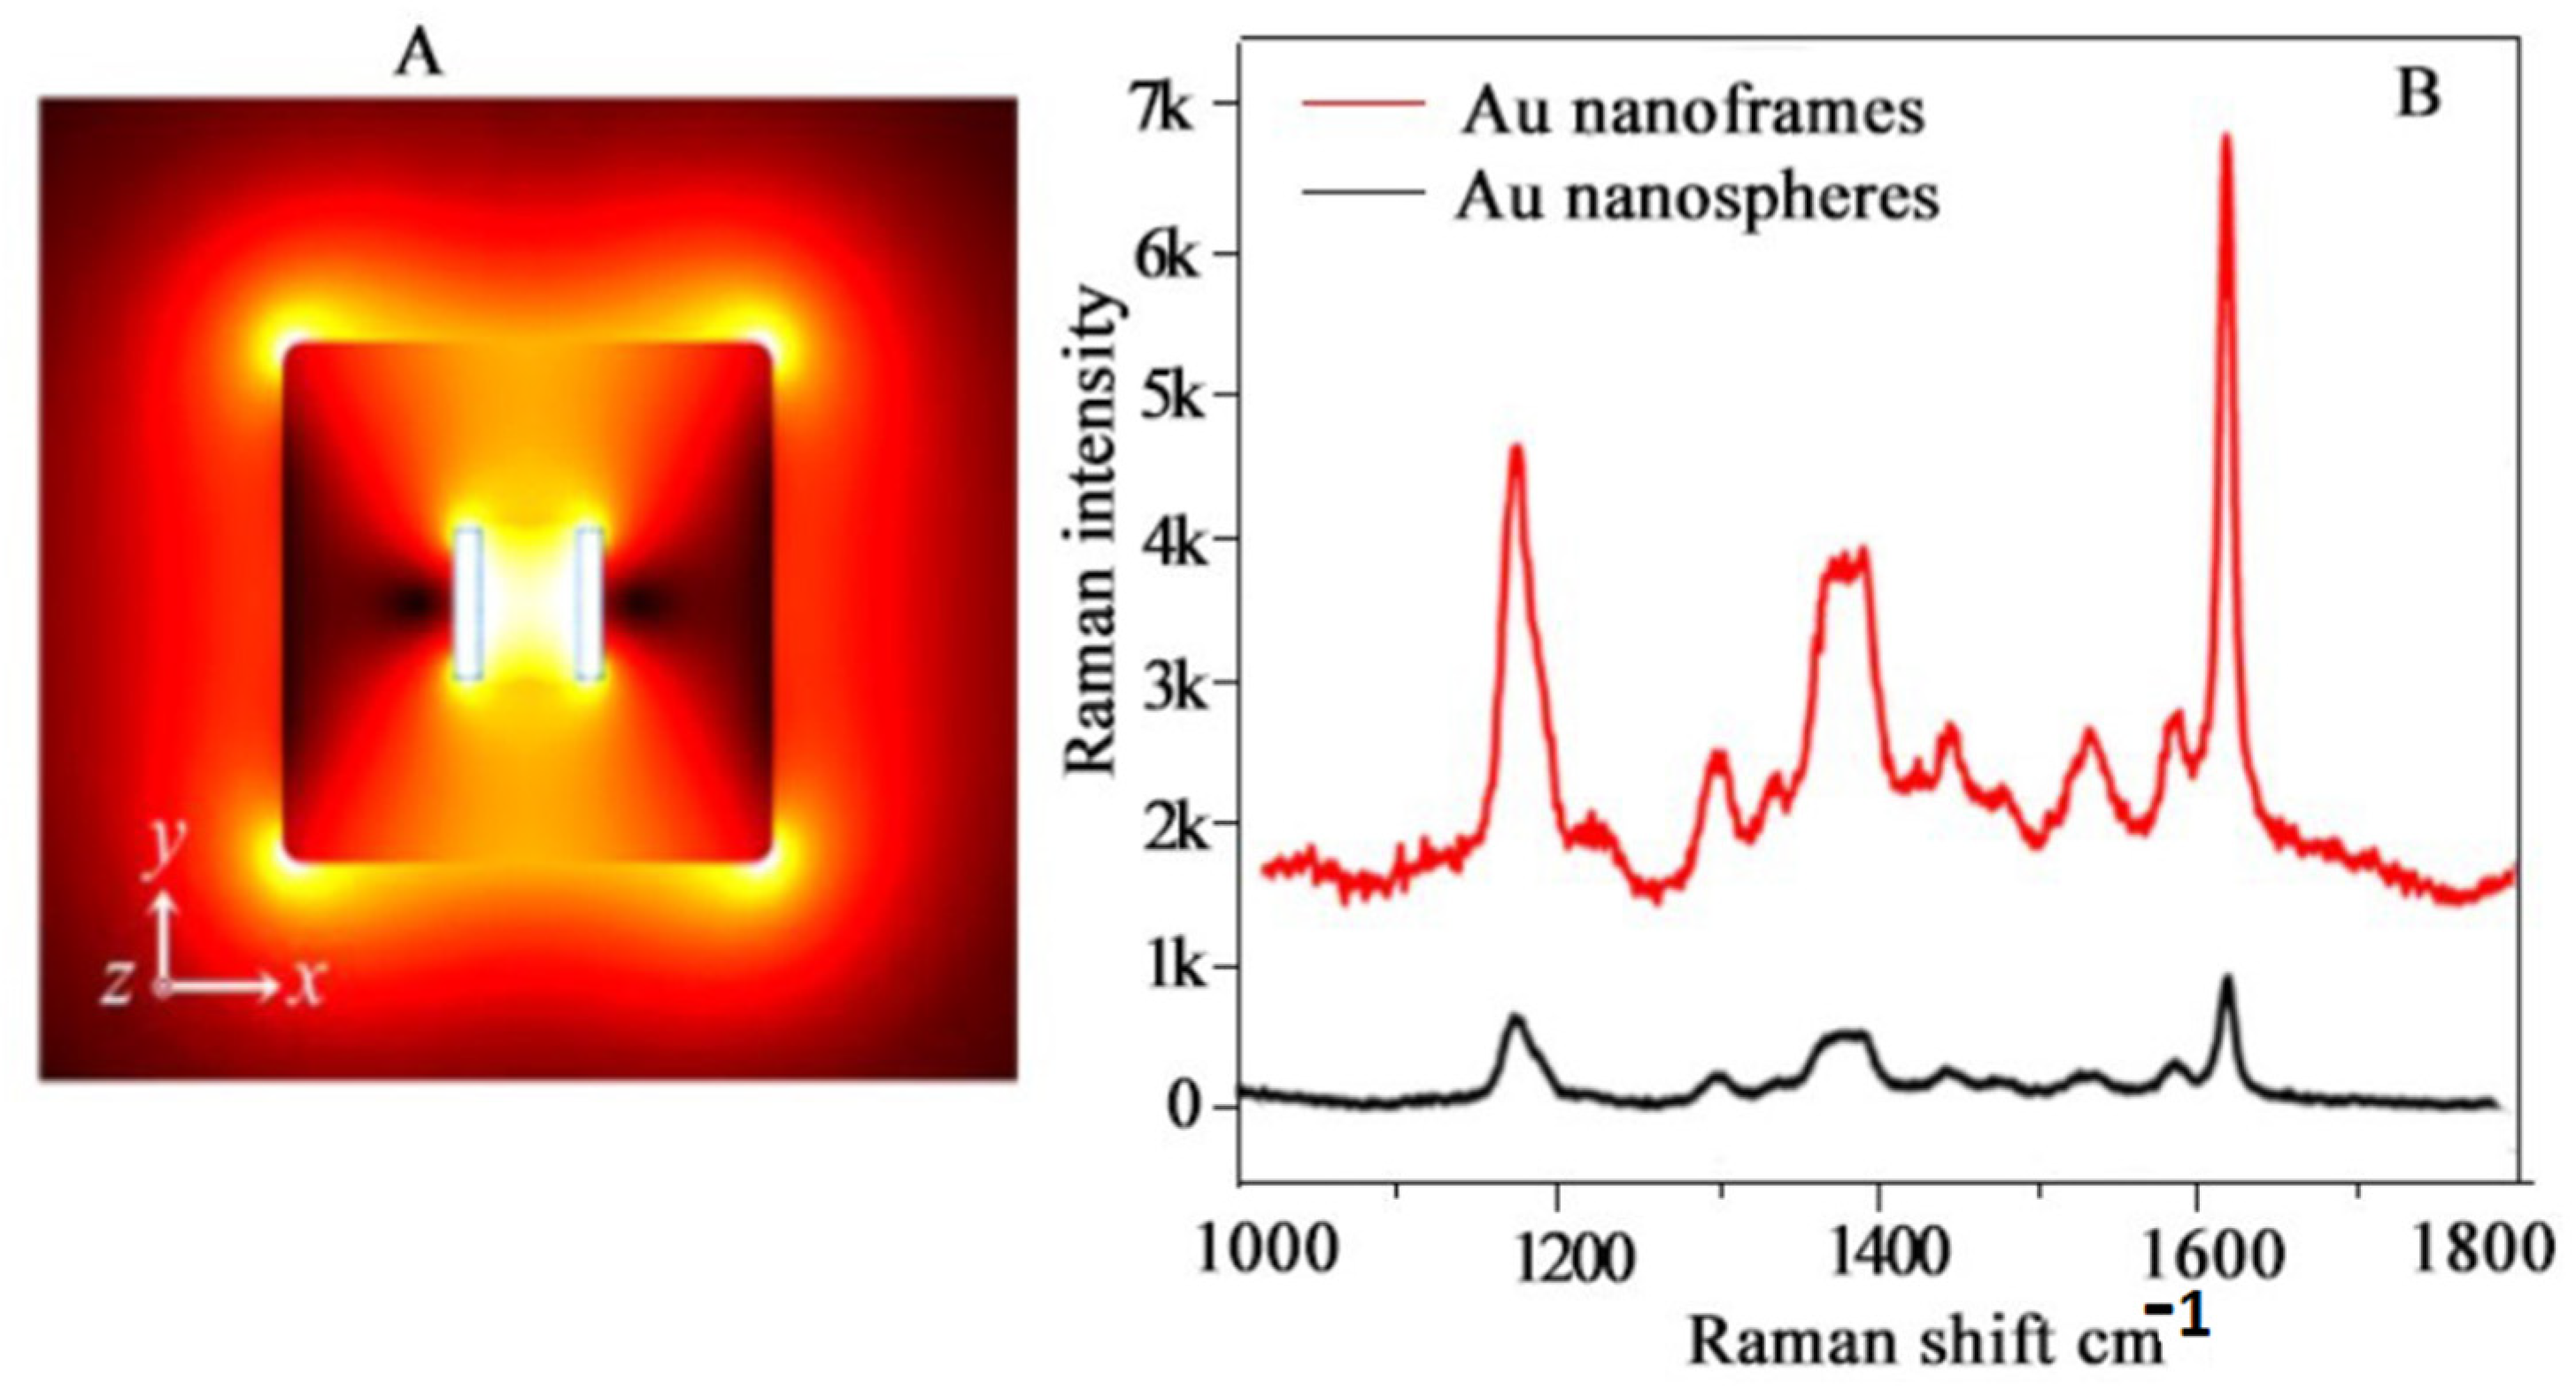
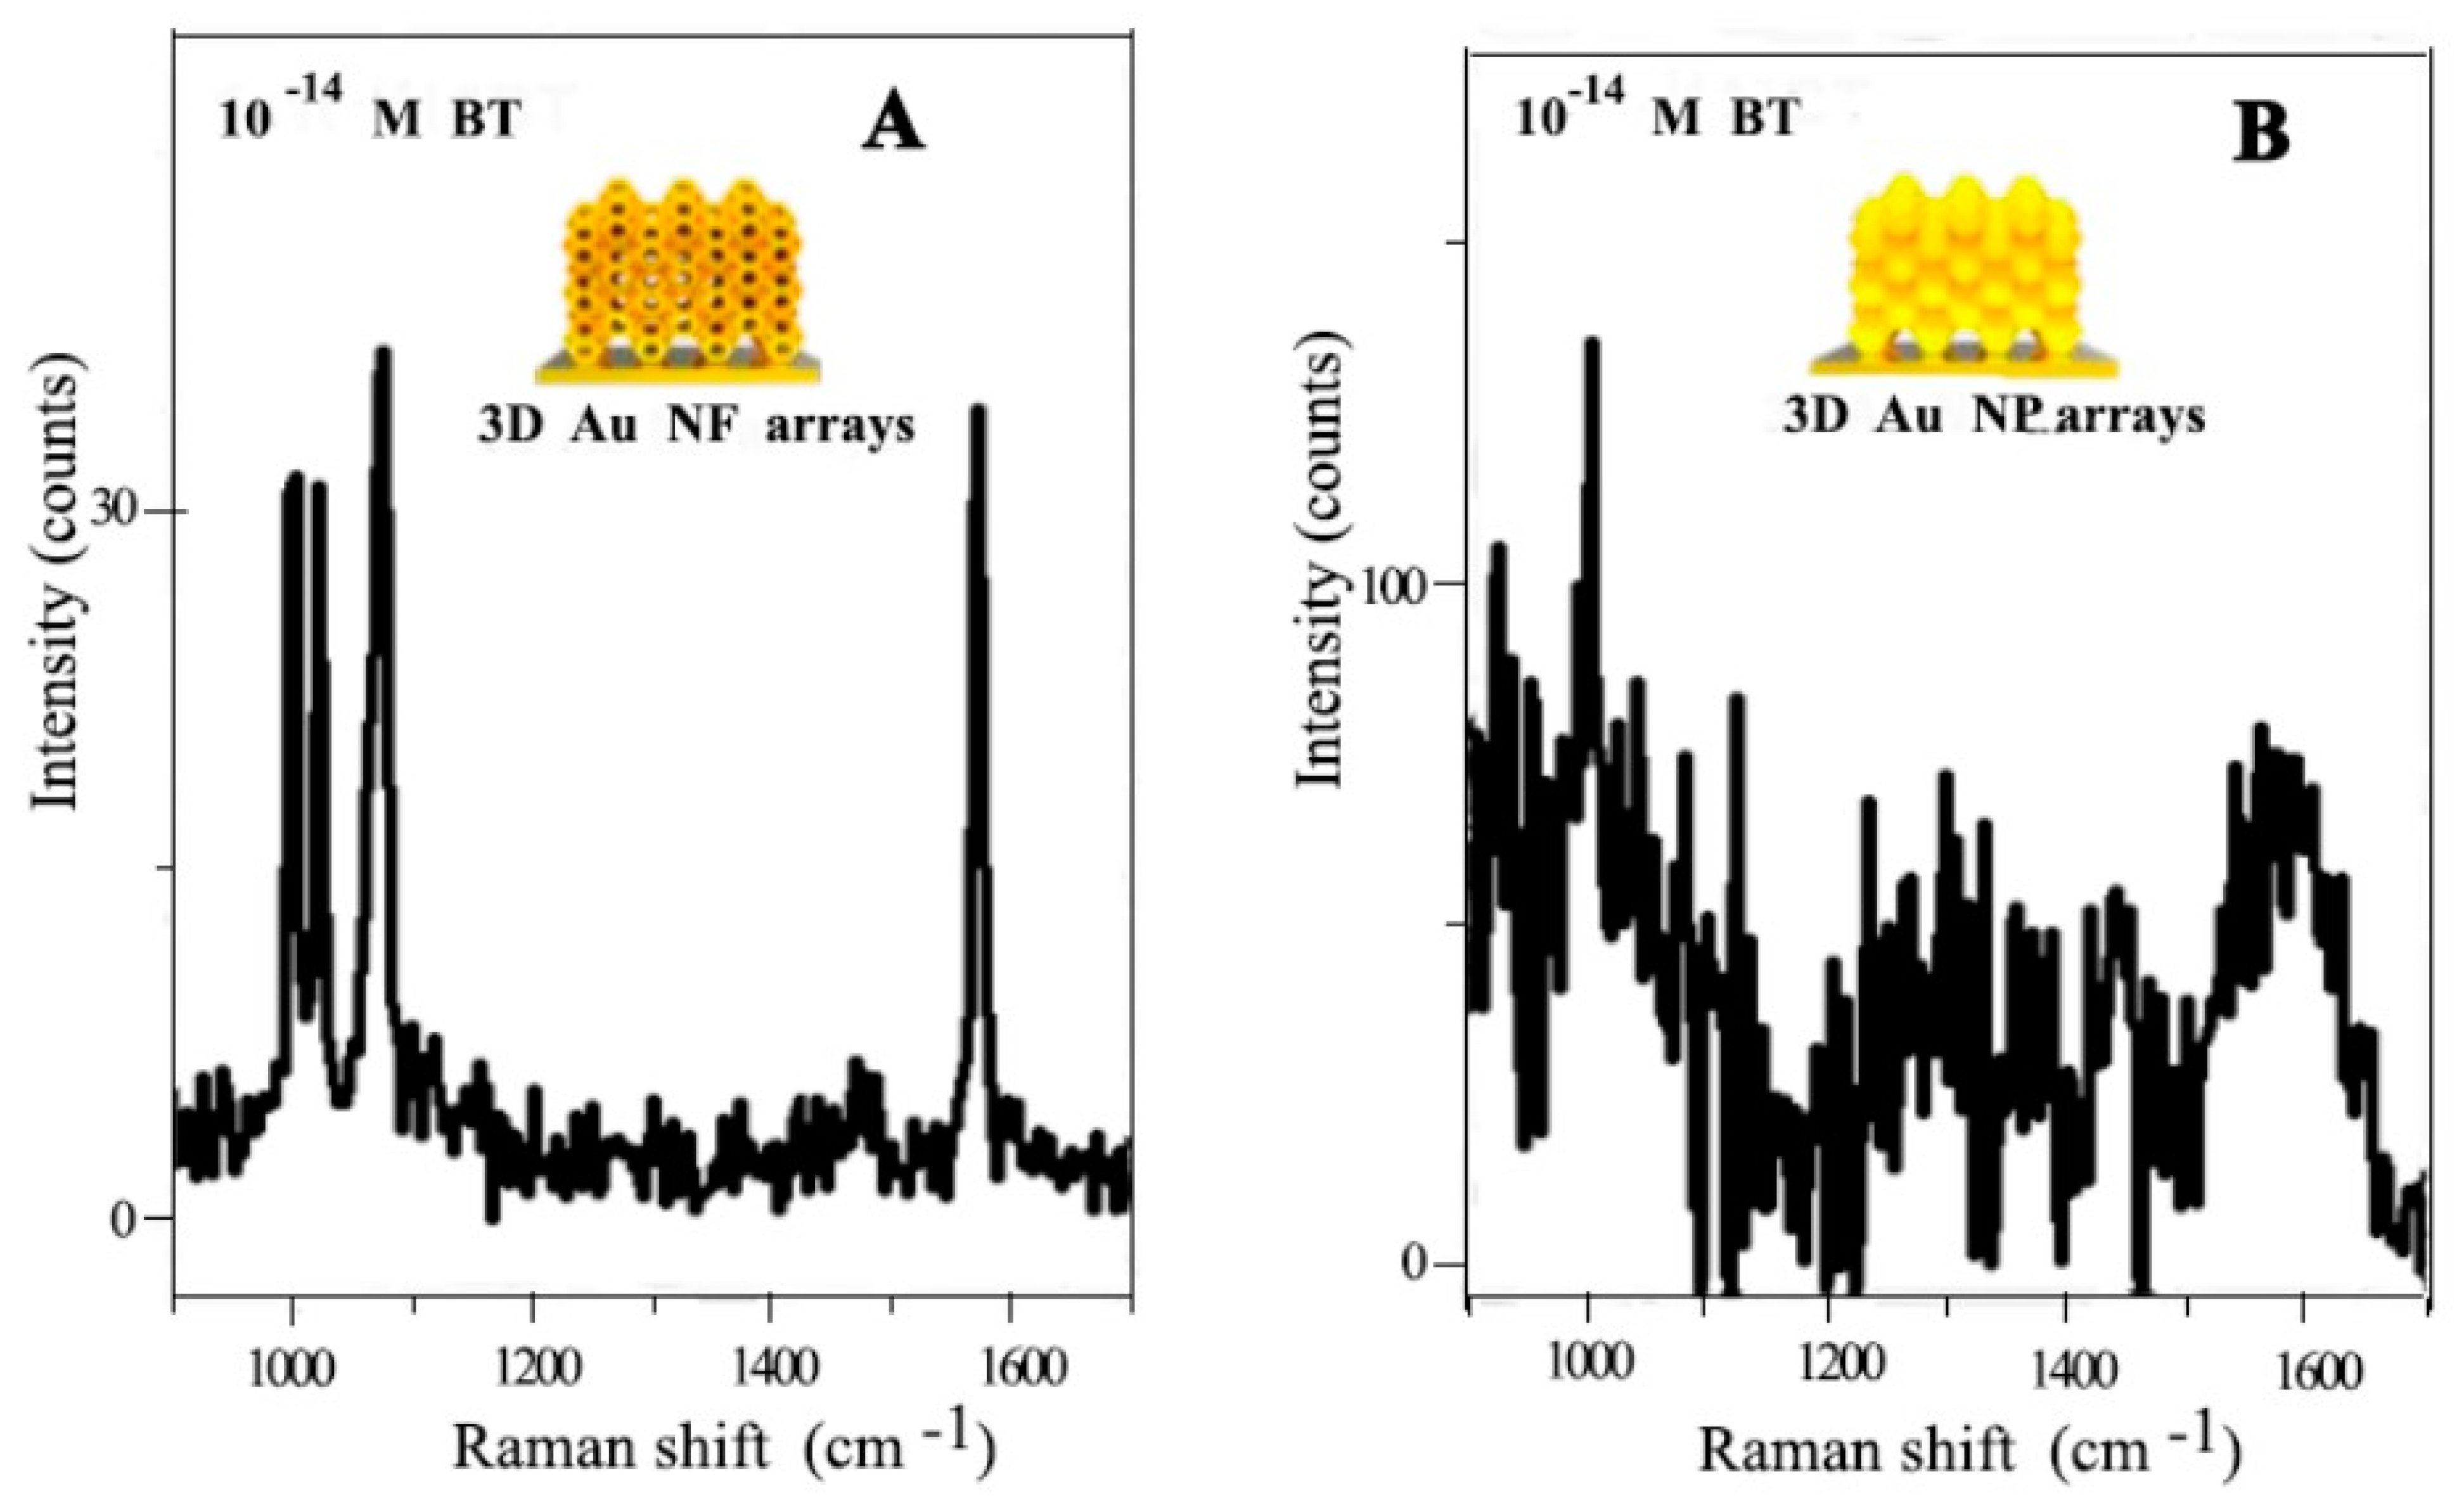
4.8. Surface-Enhanced Resonance Spectroscopy (SERS)

In SERS, there is the production of more intensified Raman signals due to the molecules absorbed on the surface; hence, analytes with very low concentrations can be detected easily. Some specific sites of these absorbed molecules called “hotspots” are mainly responsible for the enhanced intensity of Raman signals, which contribute to the overall intensity factor. The SERS activity of Au nanoframes has been compared with Au nanospheres of the same size [122]. Laser signals of 633 nm irradiations were used to detect SERS signals (Figure 41A). It was reported that the Raman signals originating from the substrate surface formulated with Au nanospheres were almost six times less intense than those of Au nanoframes of similar size due to the existence of intramolecular hotspots along with intermolecular ones later (Figure 41B). In another synthetic strategy, a gold ring inside a triangle metal nanoframe was synthesized and this firm structure was found to be suitable for near-field focusing, as they were able to withstand high-temperature and oxidizing conditions. They have also played their part in the so-called “lightening rod effect” [123].

4.9. Fuel Cell Electrolysis

Pt-Co nanoframes were analyzed for their fabulous performance in fuel cell technology for both the MOR and ORR in acidic and alkaline media and also for their structural stability [124]. First of all, the electrocatalytic activity required for ORR measurement was detected through CV graphs in an acidic medium (Figure 42C). Initially, the ECSA was found to be 50.0 m2 gPt−1, and after 10,000 cycles, the value only reduced to 45.8 m2 gPt−1. This ensured the excellent stability and durability of Pt-Co nanoframes in an acidic medium. Moreover, the specific activity and mass activity were found to be 0.80 mA cm−2 and 0.40 A mgPt−1, i.e., six and four times greater than Pt/C (Figure 42D). In basic media, CV was performed in the same manner as in an acidic medium to calculate the ECSA (Figure 42A). The mass activity left behind after 2000 and 6000 cycles was found to be 0.37 and 0.31 A mgPt−1, respectively, which is higher than the value for commercial Pt/C (Figure 42B). For the MOR activity, the CA responses of Pt-Co nanoframes and Pt/C were analyzed at 0.67 V vs. RHE. It was reported that after 1800 cycles, the activity of Pt/C declined from 0.31 to 0.02 A mgPt−1, which is an almost 94% loss, but the Pt-Co nanoframe suffered only a little degradation and had a mass activity of 0.33 A mgPt−1.

4.10. Sensing of Gaseous Molecules

4.10.1. VOCs and CWA (Chemical Warfare Agent)

The sensing of gaseous molecules such as benzenethiol (BT) is an important aspect of explosives, medical diagnostics, and many industrial protocols [125]. The SERS spectra of BT were analyzed using 3D Au NFs and 3D Au nanoparticles for the adsorption of gaseous molecules, i.e., 10−2 M benzenethiol. After 60 s of exposure, the gold nanoframe showed very clear Raman peaks, but the gold NP gave peaks after an exposure time of 150 s. This fast sensing property of Au NF can be used for sensing toxic species like VOCs and chemical warfare agents (CWAs). Moreover, for the 10−14 M benzenethiol molecule, the 3D Au NF arrays showed characteristic peaks, but the Au NP under the same experimental conditions showed no clear signals (Figure 43).

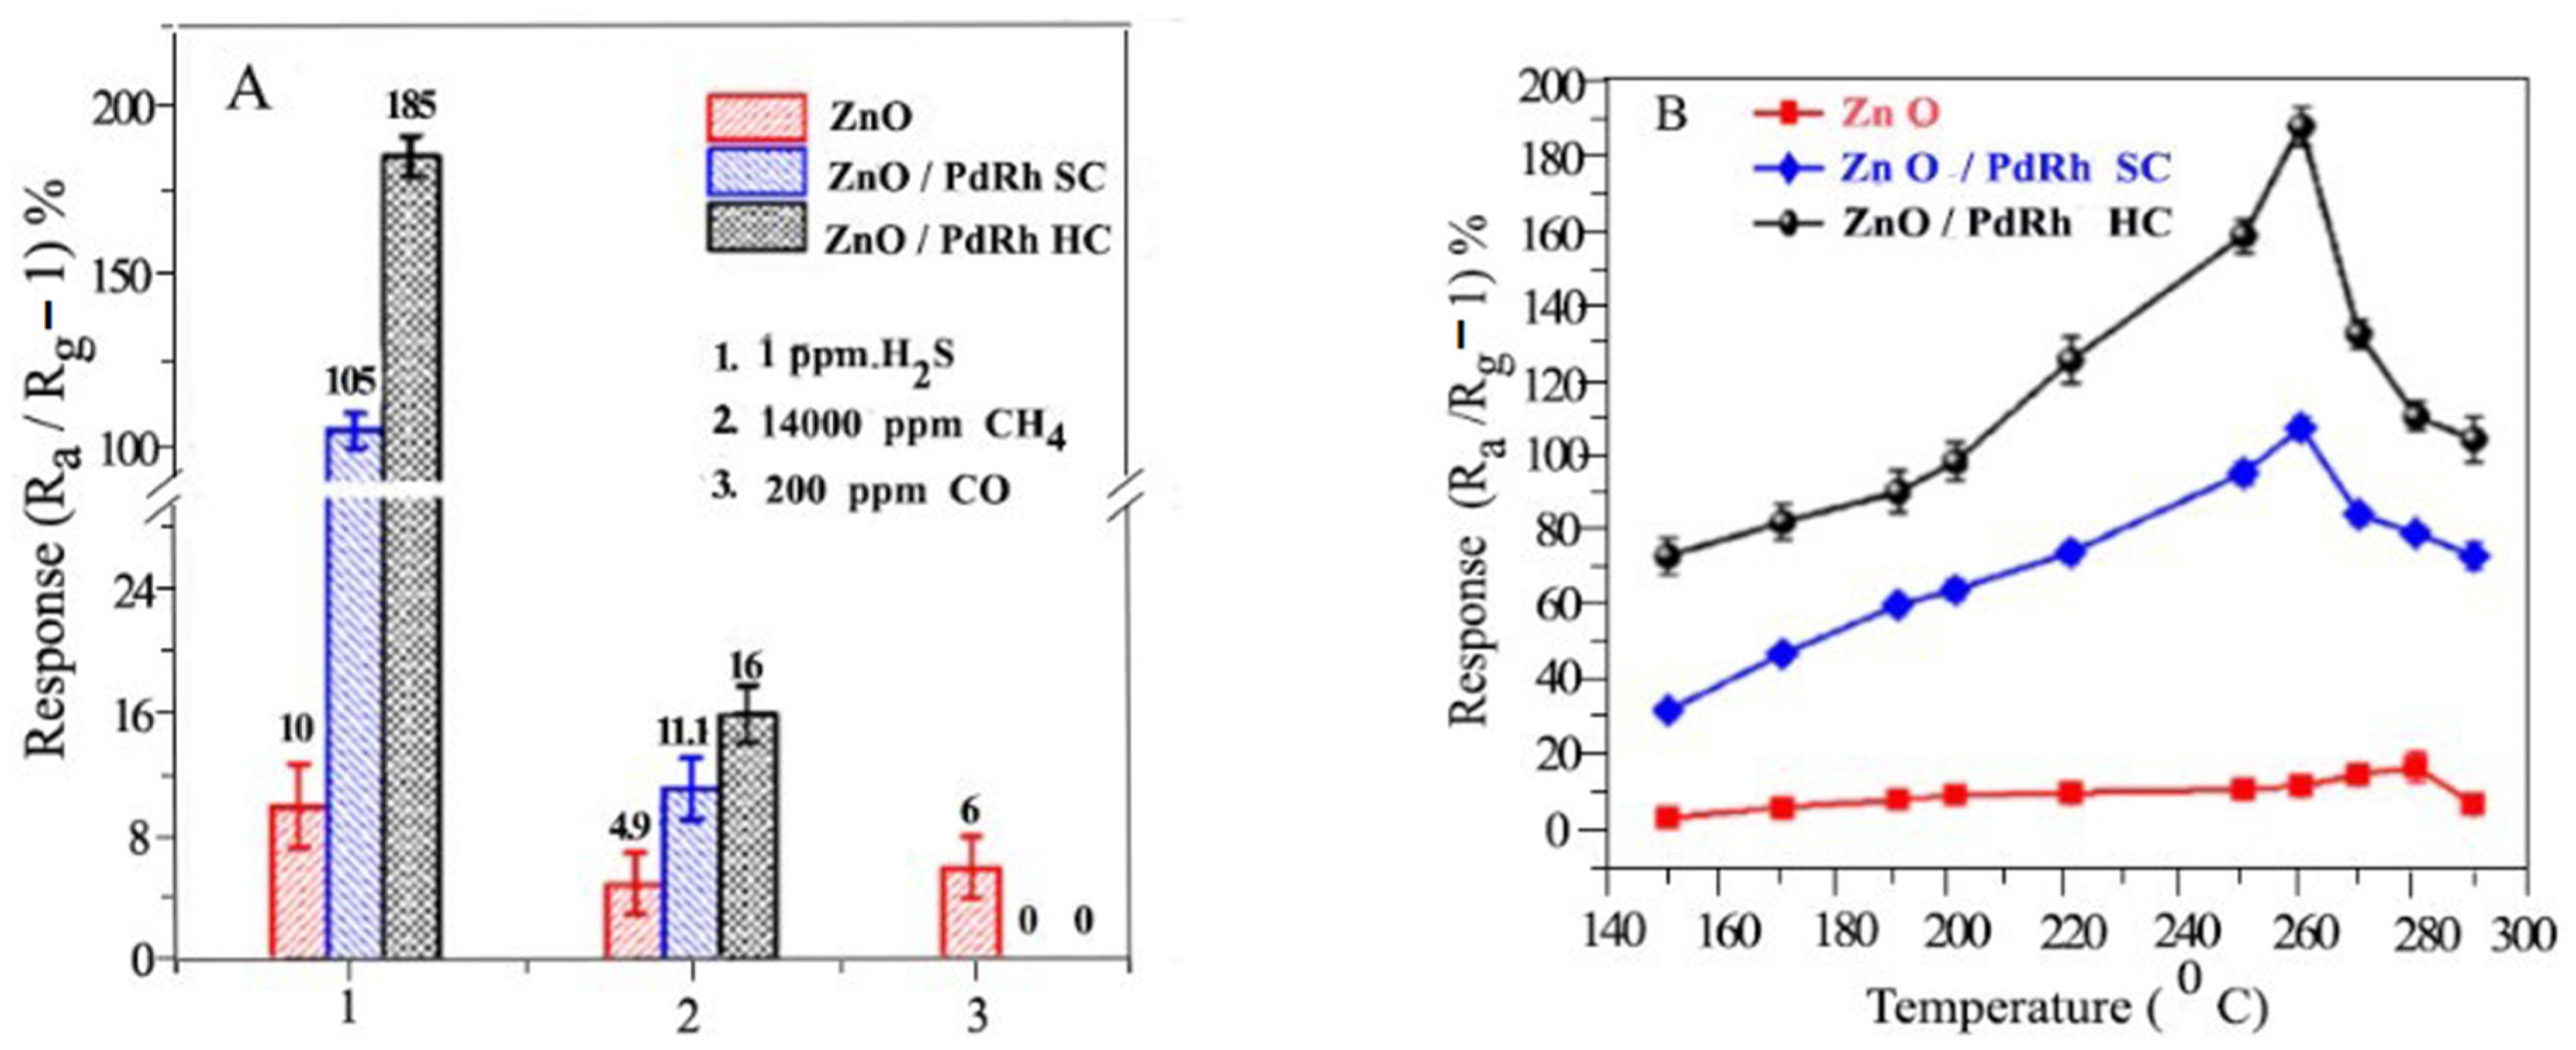
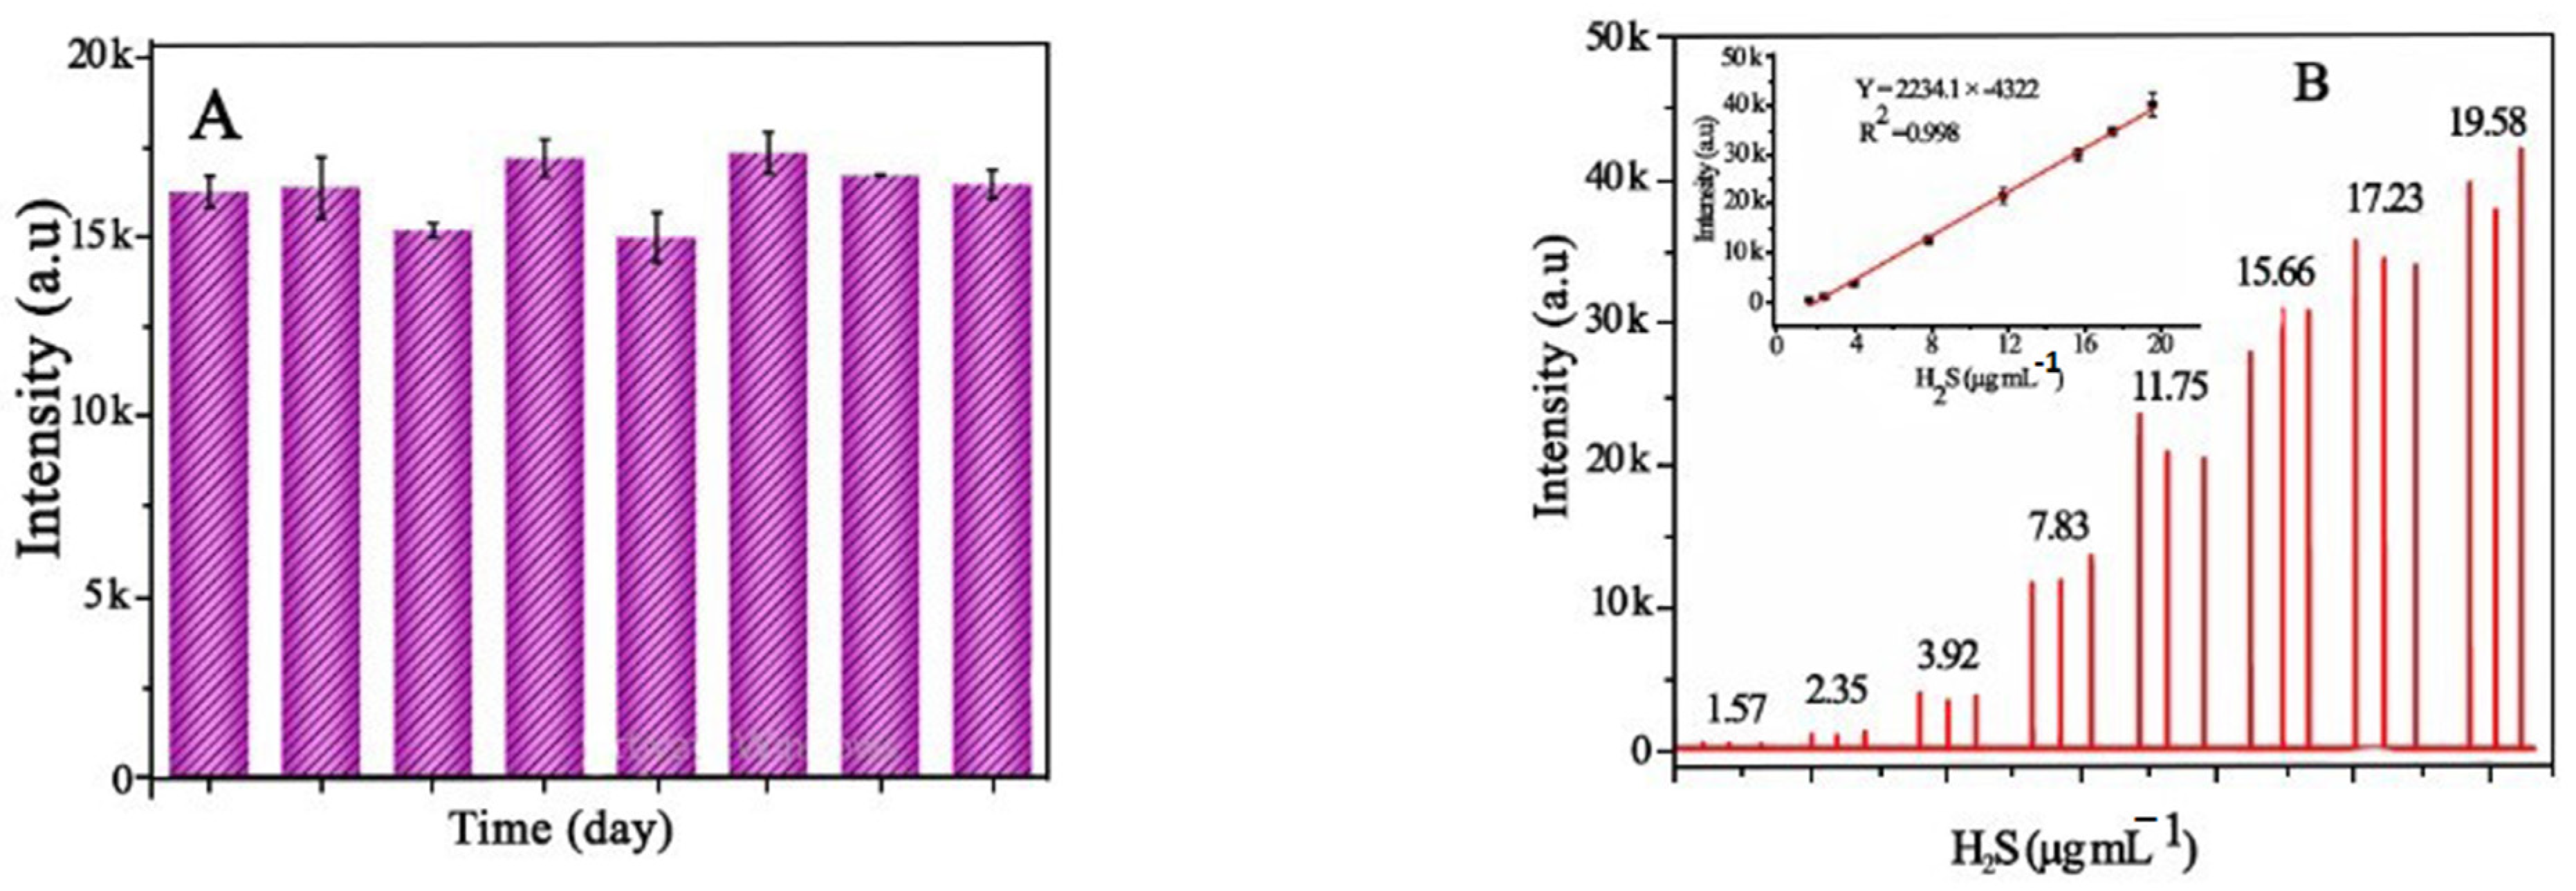
4.10.2. Hydrogen Sulfide (H2S) Detection

Recently, it has been reported that nanoframes can be used for hydrogen sulfide gas detection. In comparison to solid nanocubes, PdRh SC/ZnO and the hollow nanocube PdRh HC/ZnO-based sensors possessed better sensing activity towards H2S gas, showing good selectivity towards H2S gas in comparison to all other gases detected (Figure 44A) [126]. This is because the latter has a greater surface area for the adsorption of gas and is also due to the hollow structure passage of gas, which makes the redox reaction between gas molecules and adsorbed oxygen anions more feasible. With the increase in temperature, the sensing ability of sensors first increases and then decreases due to competition between gas adsorption and desorption (Figure 44B). Fe-doped MOF-derived porous C-based NFs, i.e., Zn10Fe1-C-900, have been proposed as efficient H2S sensors with a fast response time of 0.1 s and recovery time of 0.6 s, a long-term stability of up to 8 days, and a LOD of up to 0.13 µg mL−1 [127], the comparative analysis for H2S sensing of Fe-doped MOF-derived porous C-based NFs with rest of the Nano frames which are used in this regard are reported in Table 4. With the increase in H2S concentration, the CTL sensor intensity also increases (Figure 45B).

4.11. Reduction of CO2

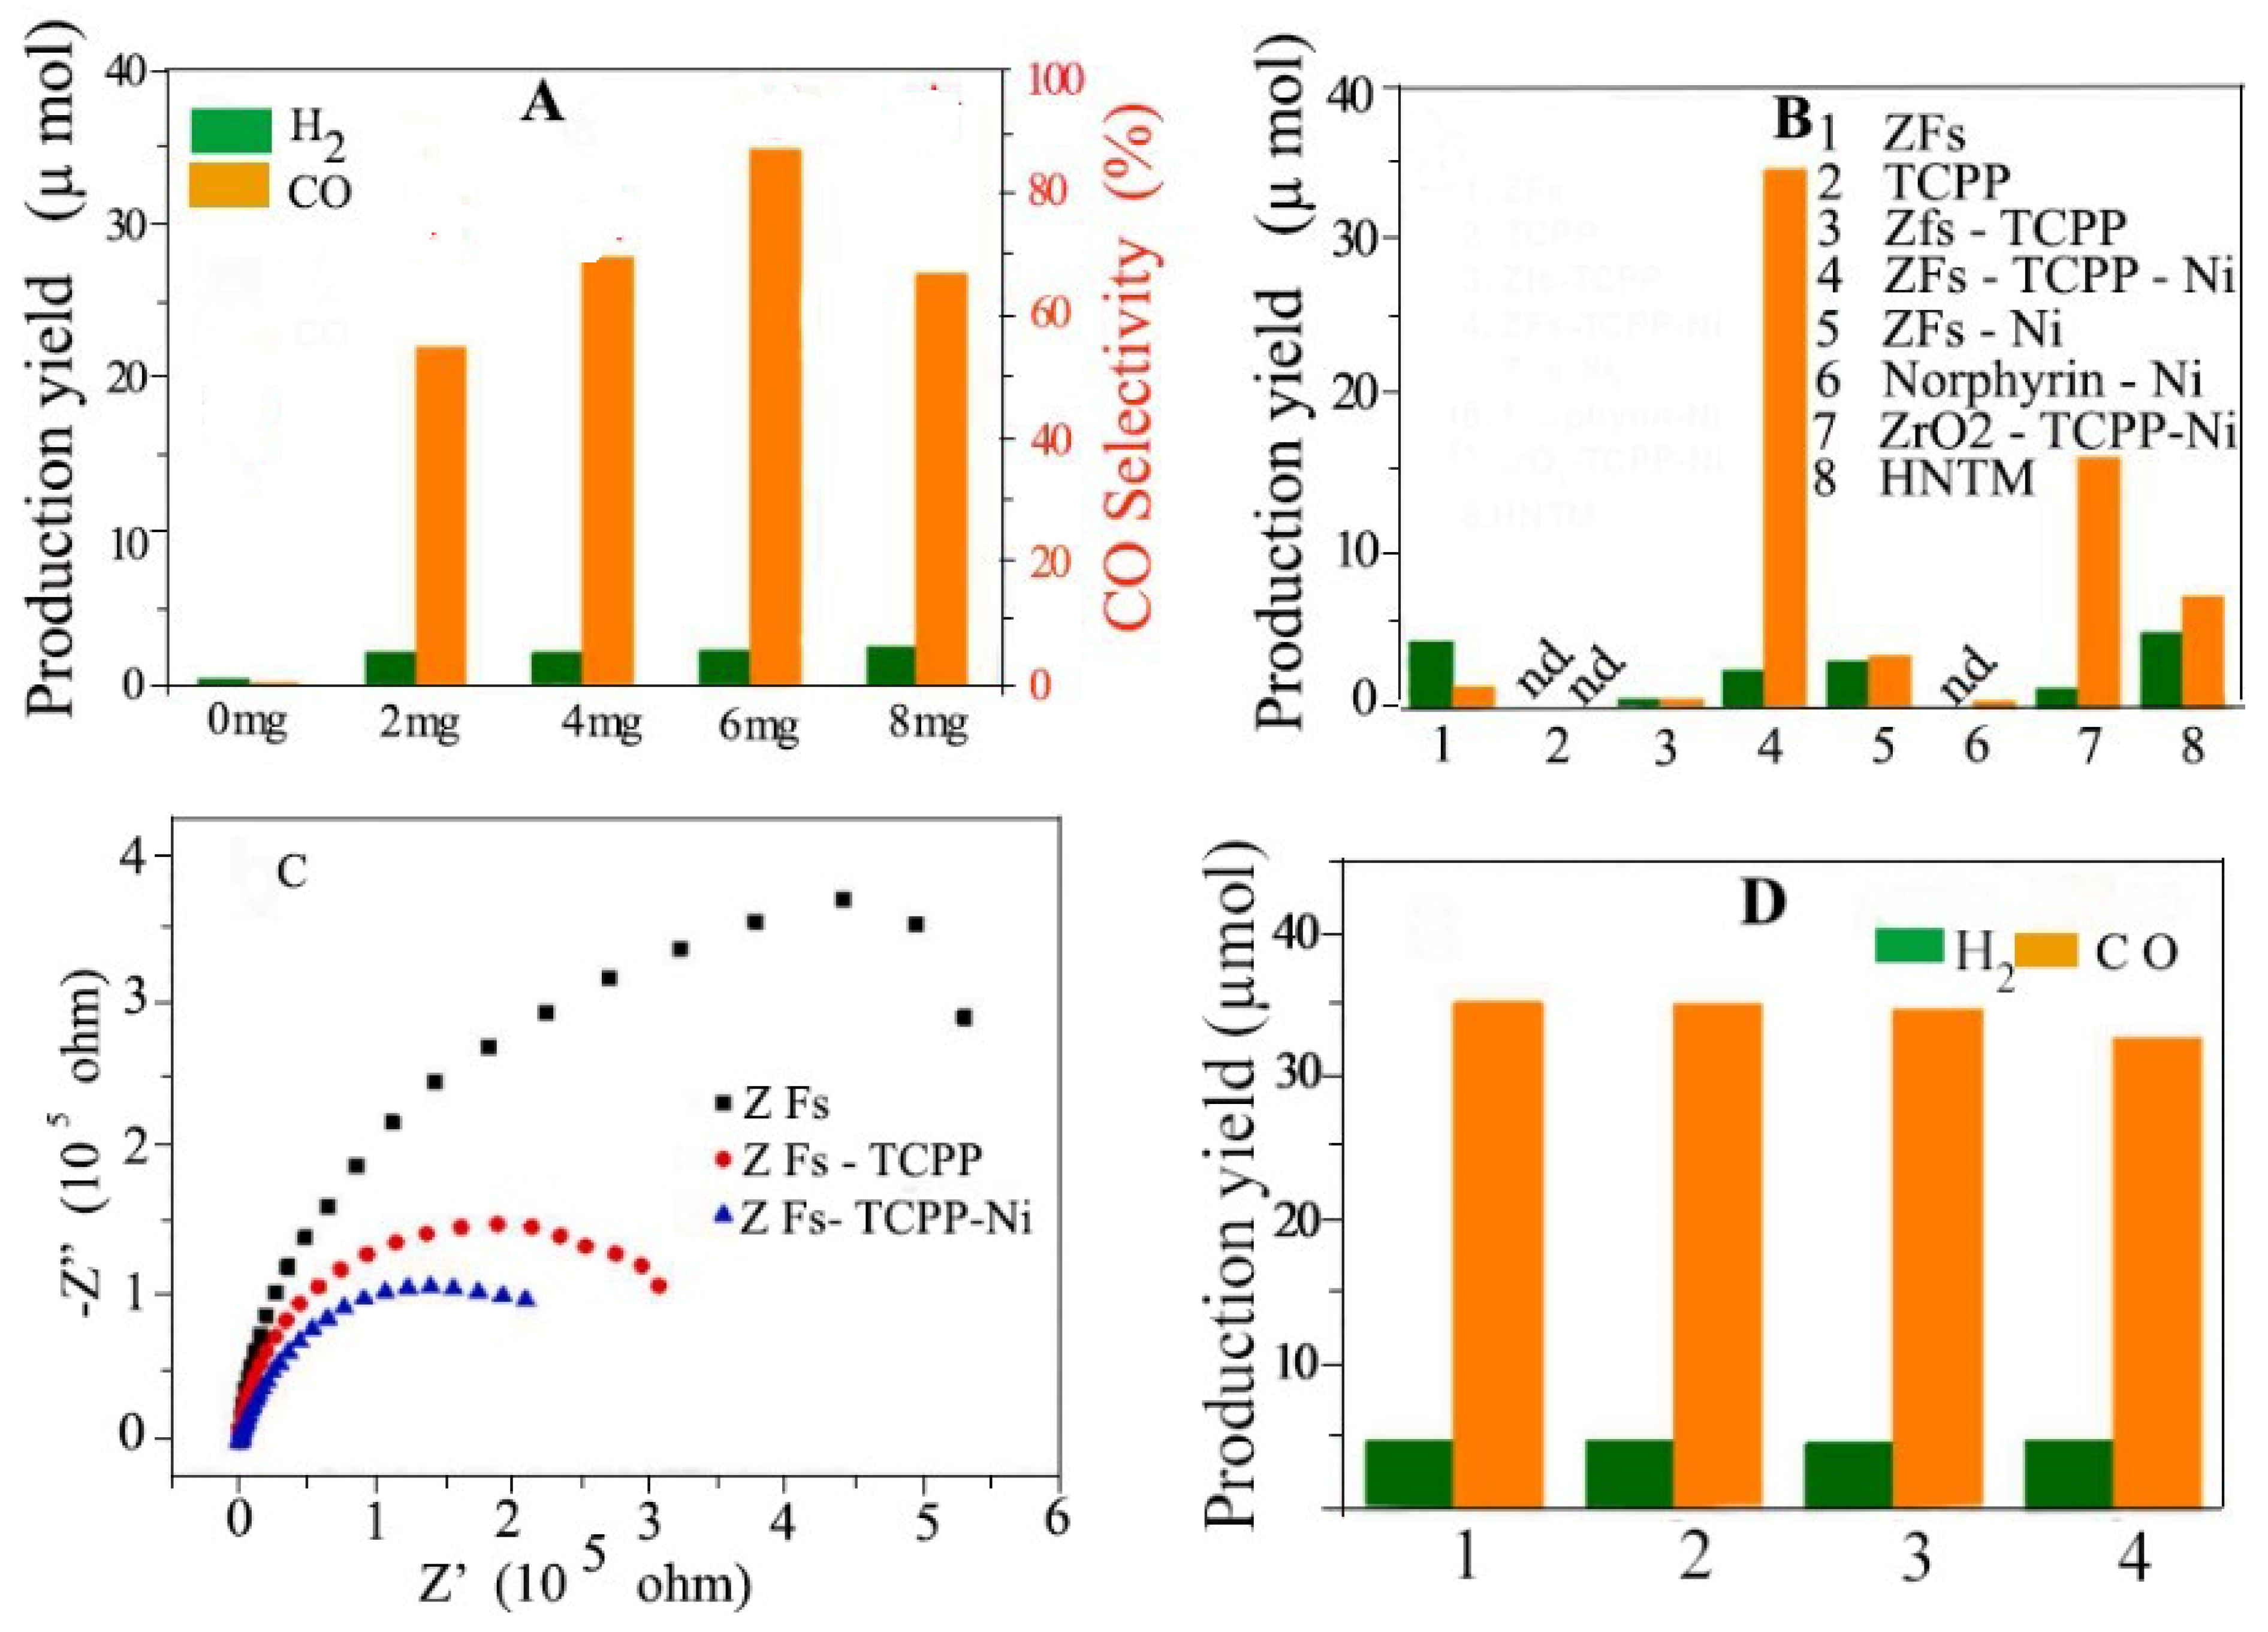
4.11.1. Photocatalytic

The main products after the photocatalytic reduction of CO2 are CO and H2. The photocatalytic reduction of different sample materials like ZFs [134] (ZrO2 nanoframes) ZFs-TCCP (Tetrakis-4-carboxyphenyl porphyrin), the HNTM (bulky zirconium porphyrin-based metal–organic framework) was assessed, and then the one with the best activity was checked with different concentrations. It was concluded that ZFs-TCPP-Ni showed the highest CO evolution yield among all other samples, with 6 mg being the optimum amount of catalyst used (Figure 46A,B). Moreover, no drop in the activity of ZFs-TCPP-Ni was found during recycling tests, suggesting its excellent stability as well (Figure 46D). EIS plots showed its reduced charge transfer resistance under light irradiation (Figure 46C).

4.11.2. Electro Catalytic

In addition to having excellent catalytic performance towards the ORR, the FeSAs/CNF-900 C-based metal–organic framework (MOF) has been used by some researchers for the electro catalytic reduction of CO2 [135]. The LSV curve depicts low overpotential losses for CO2 reduction and the value of the onset potential measured is positive. The current density and turnover frequency (TOF) value found for this catalyst for CO production showed a high value compared to all other catalysts, i.e., 86.9% at 0.47 V and 639.9 h−1 among all other sample catalysts used (Figure 47A). Moreover, by increasing the pyrolysis temperature, the selectivity of the CO product increases (Figure 47B).

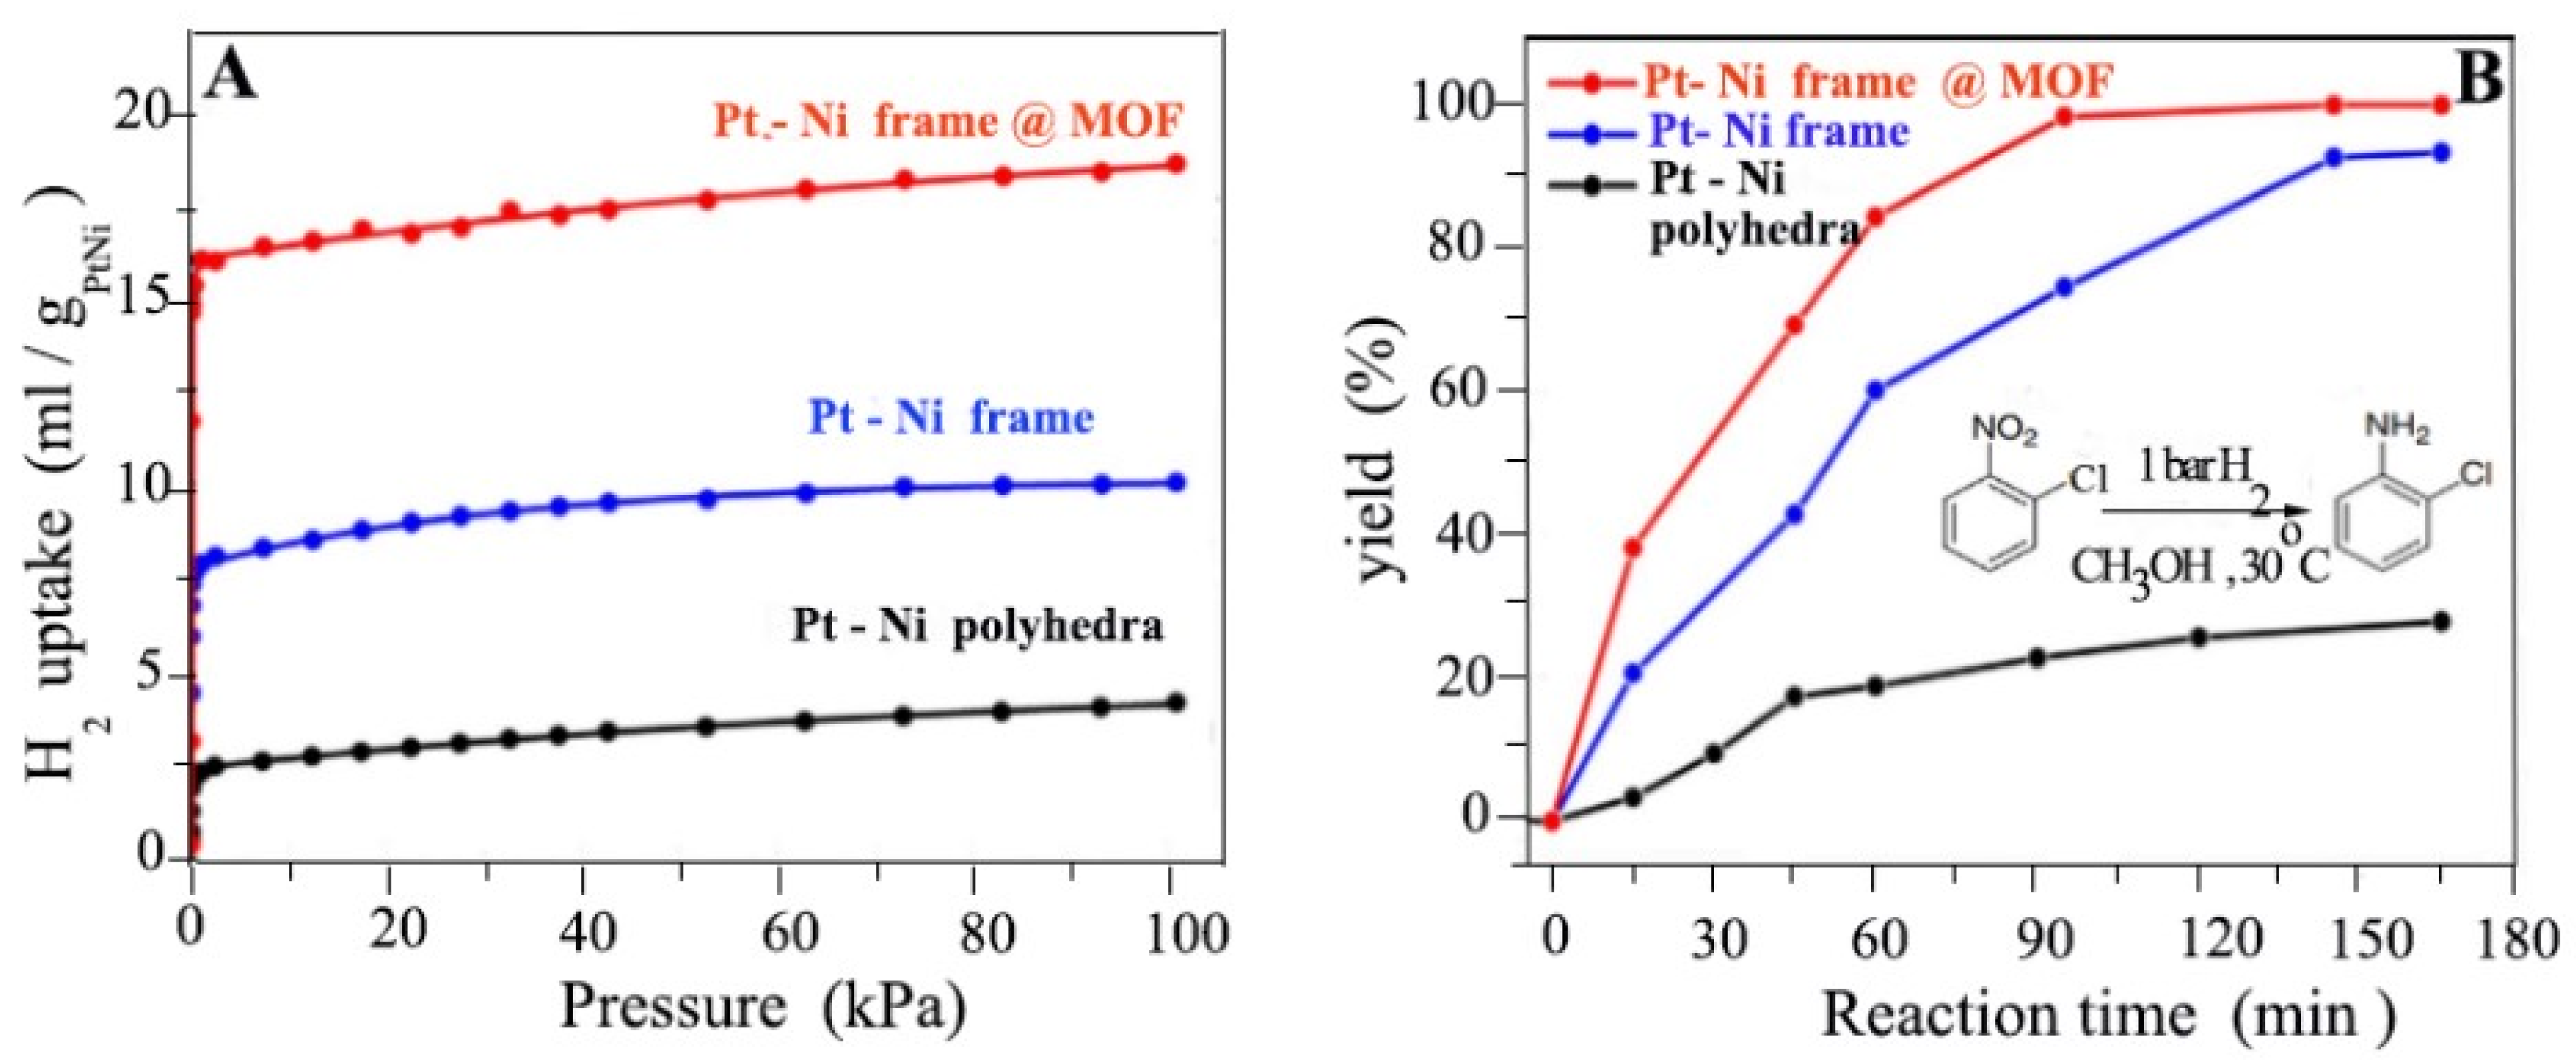
4.12. Hydrogen Enrichment and Molecular Sieving

The hydrogenation reaction is an elementary constituent of metal catalysis. How efficiently this reaction will proceed depends upon the use of the most suitable metal surface for absorption, as well as the dissociation of hydrogen on that surface. The H2 adsorption efficiency for three different catalysts was compared, i.e., the Pt-Ni polyhedral, Pt-Ni frame, and platinum–nickel frame within the metal–organic framework (Pt-Ni frame @ MOF); the last one was found to have the best performance among all of them (Figure 48A) [50]. An important hydrogenation reaction of 1-chloro-2-nitrobenzene to form 2-chhloroaniline was used as a test reaction to check the adsorption capability of the catalyst, which shows that the Pt-Ni frame @ MOF possesses a greater % yield for 2-chloroaniline (Figure 48B).

4.13. Spectator of Co+2 Ions

Glutathione (GSH)-modified gold and silver nanoframes (GSH-Ag/Au Nfs) have been reported as the best candidate for the detection of Co+2 ions [136]. UV-vis spectrophotometry showed that there exists a linear relation between the absorption intensity of peaks with an increasing concentration of cobalt (Co+2) ions (Figure 49B). Therefore, these NFs can be used for the quantitative analysis of cobalt ions up to 1.7 micro molar. GSH-Au/AgNFs have shown the high selective detection of Co+2 ions among all other ions (Figure 49A).
Metal nanoframes can be used as a catalyst for biomass upgrading. To investigate the catalytic activity of ZrO2-promoted Ni (Ni/ZrO2) catalysts, biomass acids like octanoic acid (OA,C8) and stearic acids (SA,C18) were used [137]. The catalyst used was in various forms like Ni/ZrO2-F (nanoframe), Ni/ZrO2-H (hollow sphere), and Ni/ZrO2-C (commercial NPs). Among all of them, Ni/ZrO2-F was found to be a more suitable and excellent catalyst in the conversion of Octanoic acid as depicted through Table 5 and Stearic acid depicted through Table 6 and this is due to its high turnover frequencies of 10.2 and 3.4 h−1, respectively, compared to Ni/ZrO2-H and Ni/ZrO2-C (Figure 50). Their turnover frequencies were found to be 8.8 and 2.7 h−1 and 5.5 and 1.6 h−1, respectively.

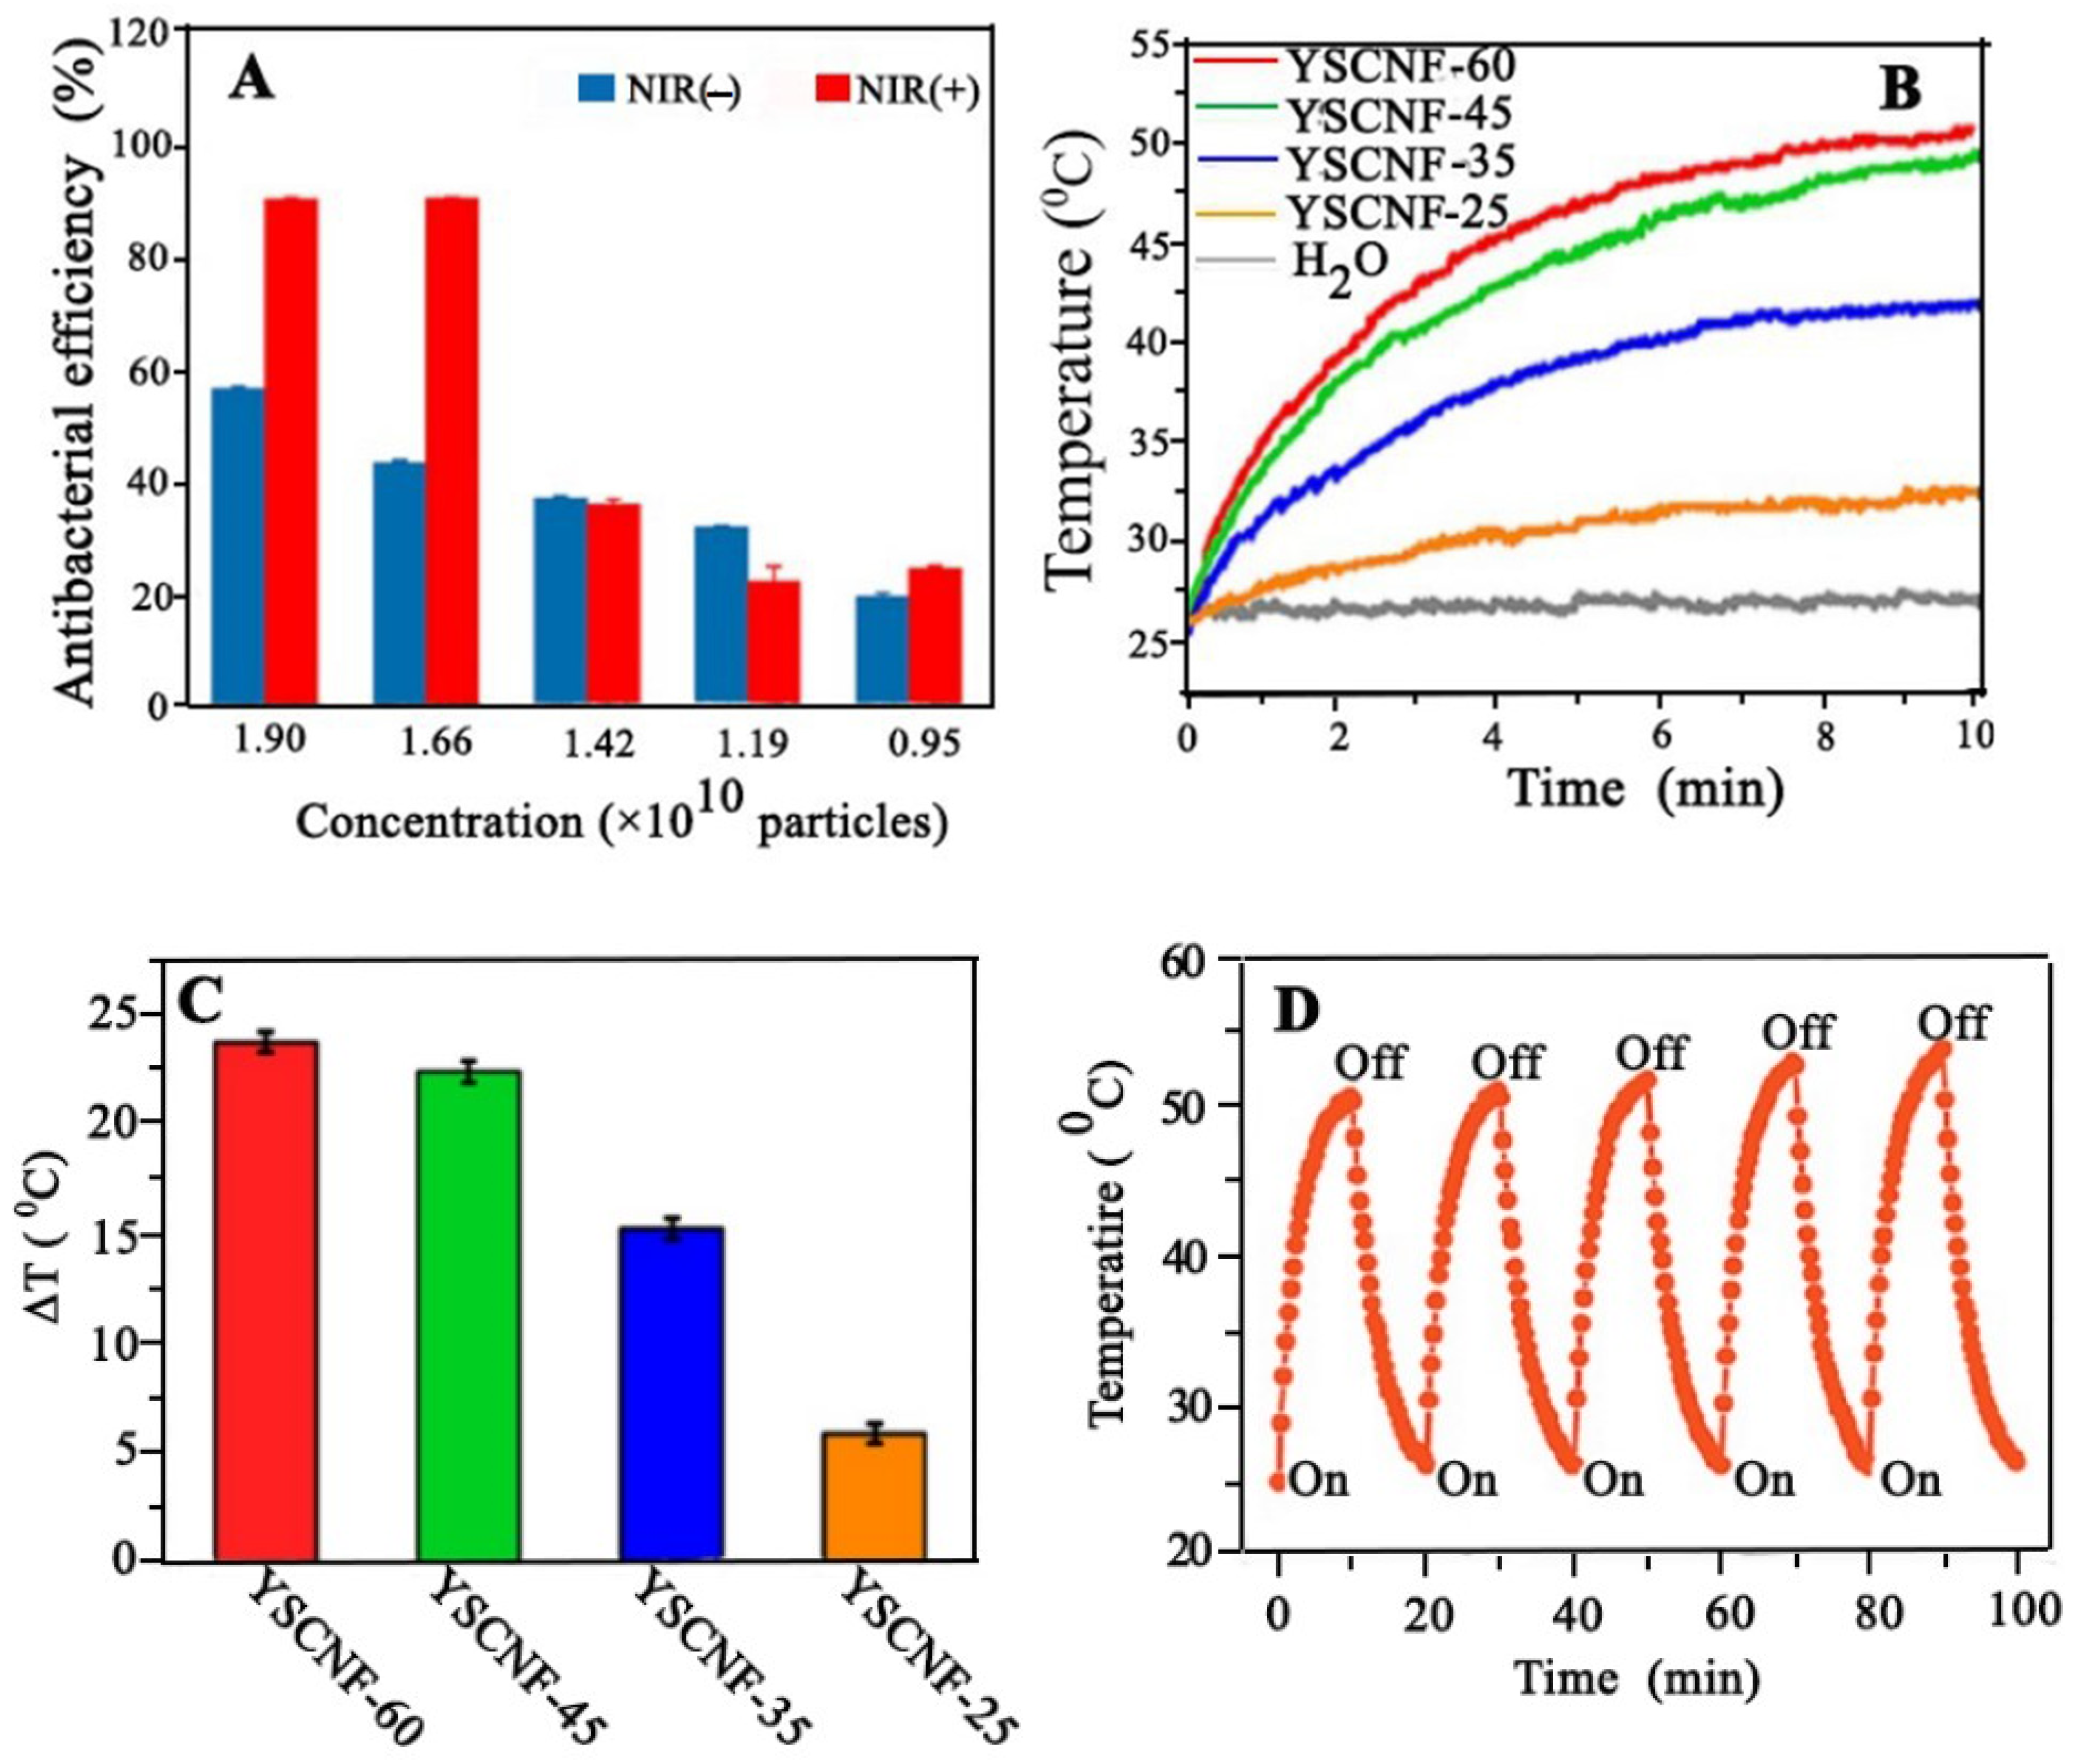
4.14. Antibacterial Performance

AgAu yolk–shell cubic nanoframes (AgAuYSCNFs) have been analyzed as an efficient material for antibacterial activity by using Methicillin-resistant staphylococcus aureus (MRSA) as a testing bacteria. When no laser irradiations were used, huge amounts of bacteria were found on the plate in the absence of these yolk–shell nanoframes [138]. However, by increasing the concentration of AgAuYSCNFs yolk–shell cubic nanoframes, the antibacterial efficiency was also increased (Figure 51A). Moreover, with an increase in temperature, the photothermal performance was increased (Figure 51B). The yolk–shell cubic nanoframes (YSCNF-60) were found to possess good photothermal activity with increasing temperature (Figure 51C). The antibacterial activity of these nanoframes was further escalated when irradiated with near-infrared spectroscopy (NIR) for just 10 min due to the synergistic effect of the Ag present and the high temperature produced as a result of photothermal conversion. They possess excellent photothermal stability even after five laser irradiation ON/OFF cycles (Figure 51D).
There is a need to make conventional gold nanoparticles (GNPs) more tolerant towards high temperatures, reductants, and surfactants [139]. Catechin, which is related to tea polyphenol, has been reported as a green reducing agent with the ability to synthesize gold NPs and also make the chelation of metal ions easier. Thus, phenol-assisted gold nanoparticles incorporated with an iron (pGNP-Fe) composite can generate a large amount of intracellular reactive oxygen species (ROS) in situ, which in turn makes the antibacterial effect last for a greater period [140].

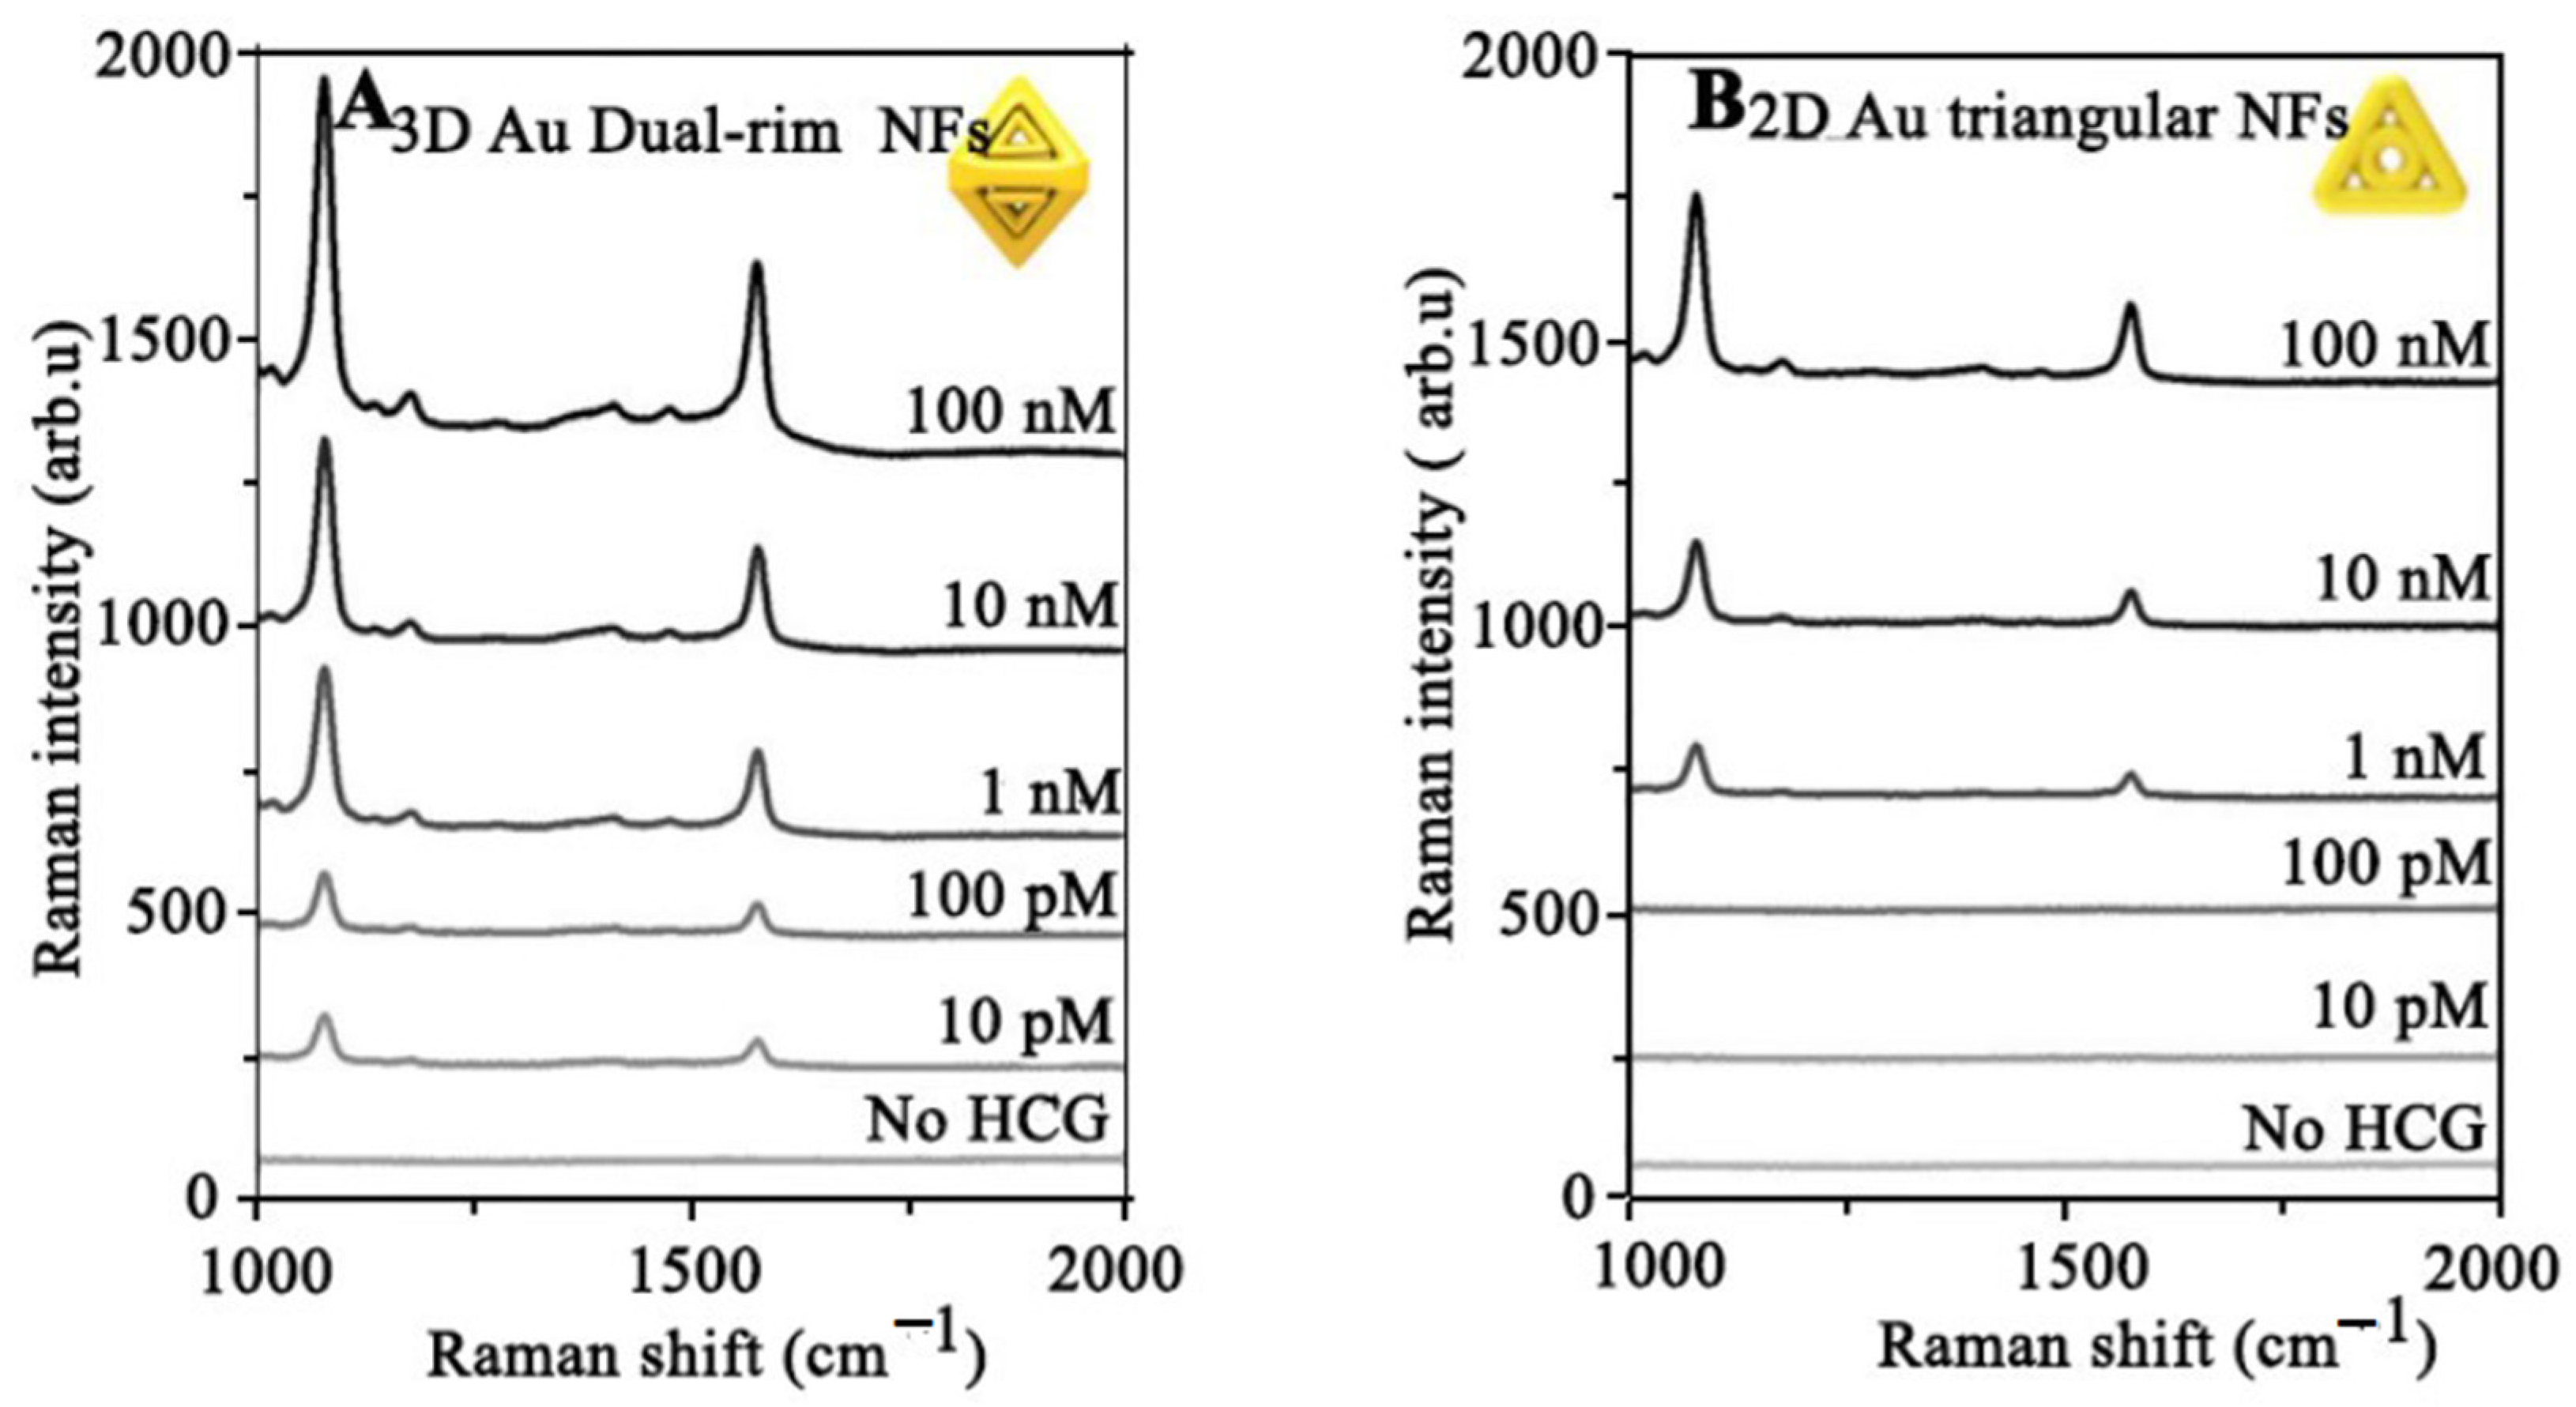
4.15. Nano Probes for Bio Sensing

4.15.1. Human Chorionic Gonadotrophin (HCG)

It has been reported that 3D Au dual-rim NFs show greater bio-sensitivity towards HCG (human chorionic gonadotrophin) compared to their 2D structure due to surface-enhanced Raman scattering, which in turn is due to the many intra-nanogaps present in the 3D structure (Figure 52) [141]. An intense electric field can be produced due to the well-known “lightening rod effect” [142].

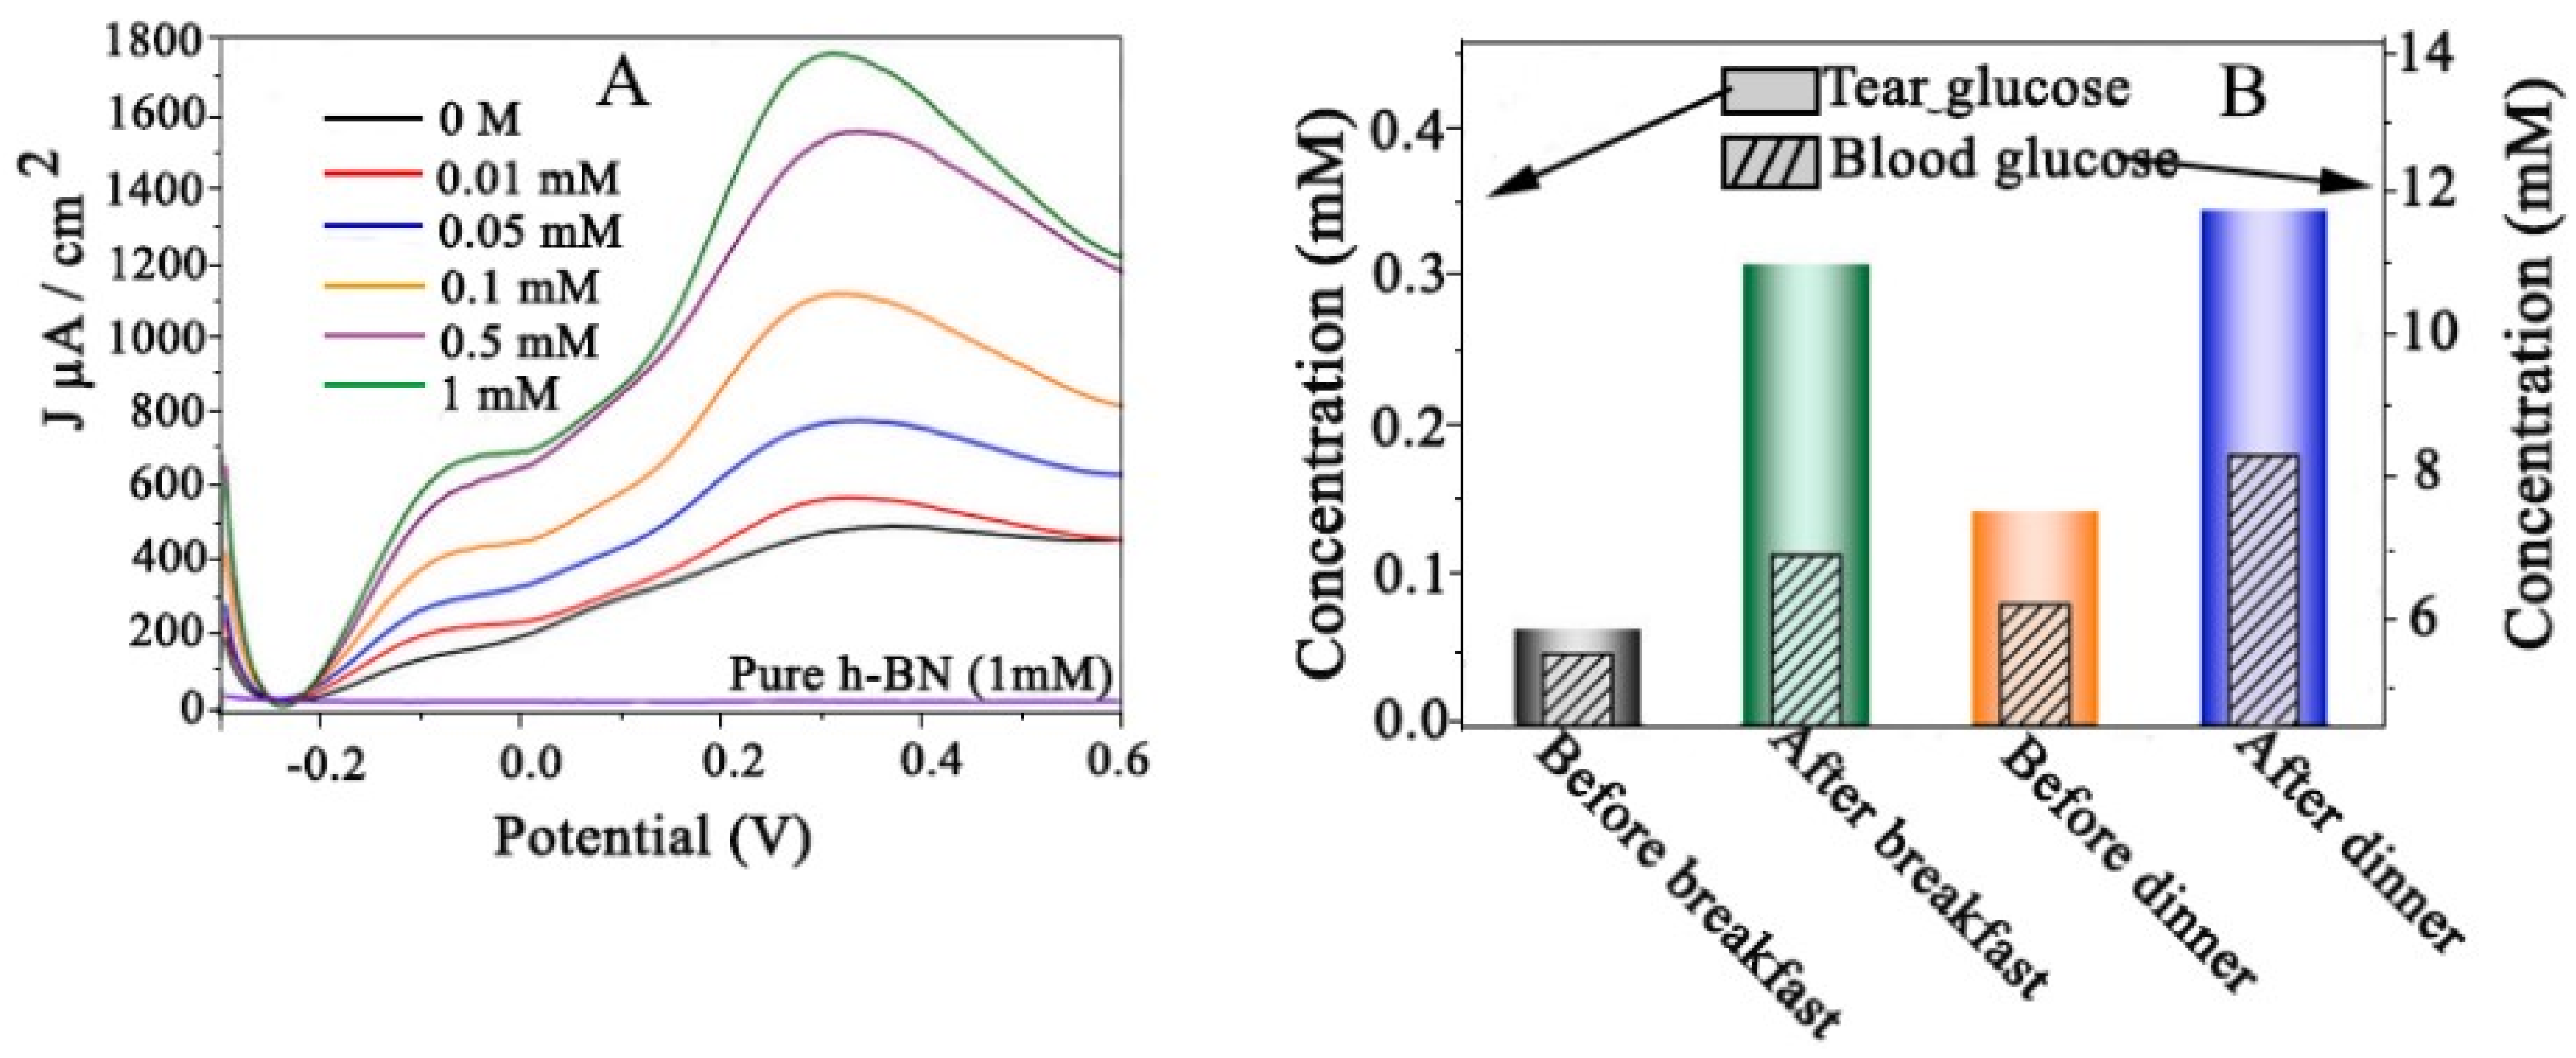
4.15.2. Glucose in Human Tears

Despite electrochemical [143] and photochemical [144] biosensors being the best and most efficient sensing tools, photo-electrochemical (PEC) biosensors are comparatively the most efficient biosensing strategy, showing both the advantage of photochemical and electrochemical bio-sensing [145,146]. Near-infrared photo-electrochemical (NIR-PEC) biosensors have been designed by using h-BN/Au5Pt9 nanoframes as an electrodic material for the monitoring of glucose in human tears with a detection limit of up to 0.406 nM [147]. Differential pulse voltammetry (DPV) curves have shown that the oxidation current increases with as the glucose concentration increases (Figure 53A). These NFs offered better results compared to the previously reported results using electro-catalytic and visible light reactions [148,149,150]. As far as stability is concerned, this NIR-PEC biosensor was able to maintain 96.7% of the initial current value even after 20 days. The relative standard deviation (RSD) for the amperometric current response was found to be not more than 5%. The glucose level in tears and blood was found to be increased by using hexagonal boron nitride (h-BN)-based h-BN/Au5Pt9 nanoframes in the NIR-PEC biosensor (Figure 53B).
Due to the expeditious usage of naturally existing energy resources and their significant role in boosting environmental pollution, there is a need for clean and renewable energy resources [151]. Hydrogen is the best way to store energy compared to conventional energy resources like fossil fuel [152].

4.16. Photo and Thermal Driven Catalytic Activity of Nanofrmes

4.16.1. Photothermal Catalytic

Multi-shell nanoframes (MNFs) like 3D C@TiO2 can be used for the production of hydrogen from wastewater containing dyes [153]. A C@TiO2 MNF showed a catalytic performance that was 4.3 times higher than a TiO2 MNF in terms of hydrogen evolution, i.e., 503 µmolg-1 h−1 and 116µmolg−1 h−1, respectively. It was also confirmed that the catalytic activity of C@TiO2 MNF for the hydrogen evolution reaction in the case of pure water was reduced to 35% compared to rhodamine B-containing water.

4.16.2. Solar-Driven H2 Production

To tackle the emerging issue of energy crises, hydrogen can be produced from water using solar energy [154,155,156]. Zinc Sulfide (ZnS) nanoframes with 1% copper doping have been reported for their superb photocatalytic activity in terms of hydrogen production in the presence of solar radiation (Figure 54A) [157]. There was no significant decrease in the activity of the catalyst observed even after five runs (Figure 54B).

5. Conclusions

In this review, we have highlighted the potential of nanoframes in tackling large-scale catalysis challenges, summarizing a range of synthetic methods aimed at improving their effectiveness. These synthetic methods include the galvanic replacement reaction, one-pot synthesis and chemical etching. However, many other strategies have been used recently by many research groups. This review also examined classifications based on their composition, either being made of pure single metal, alloys, or some other metal that is present as a dopant in the parent metallic nanoframe structure. Therefore, we represent these classifications as metal NFs, alloy metal NFs, and doped metal NFs. As we discussed metal nanoframes for their excellent applications, we tried to provide an overview of their application in various fields other than only the catalytic domain. This includes theranostics, biomedicine, the sensing or detection of different materials, and the photocatalytic and electrocatalytic reduction of CO2. In addition to their distinctive 3D structure, nanoframes exhibit unparalleled physiochemical properties, yet they present significant challenges that must be addressed in future research. These challenges include the need to control their thickness and the limitation of obtaining only small quantities of the final product, which may not be sufficient to meet industrial requirements.

6. Future Directions

Despite having unique physiochemical properties and a spatial 3D structure, challenges still exist in controlling the thickness of ridges, the extent of excavation, and their elemental composition. We can say that the primary concerns of future work should be as follows:
  • The thickness of ridges should be controlled by tuning the breadth of the metal being deposited on the template surface, which in turn can be achieved by the adjustment of the relative amount of both.
  • Until now, the production of NFs has been limited to a very small scale, i.e., milligrams. Attention should be given in future work to the enhancement of their production to meet industrial demands.

Author Contributions

Conceptualization, F.A. and T.A.; writing—original draft preparation, Q.u.A.; data curation, F.A.; writing—review and editing, S.Z.; supervision, F.A. All authors have read and agreed to the published version of the manuscript.

Funding

This research received no external funding.

Data Availability Statement

The original contributions presented in the study are included in the article further inquiries can be directed to the corresponding authors.

Conflicts of Interest

The authors declare no conflict of interest.

References

  1. Lee, K.Y.; Kim, M.; Noh, J.-S.; Choi, H.C.; Lee, W. Novel surfactant-free multi-branched gold stars characterized by inverse photocurrent. J. Mater. Chem. A 2013, 1, 13890–13895. [Google Scholar] [CrossRef]
  2. Liu, X.; Astruc, D. From galvanic to anti-galvanic synthesis of bimetallic nanoparticles and applications in catalysis, sensing, and materials science. Adv. Mater. 2017, 29, 1605305. [Google Scholar] [CrossRef]
  3. Ridelman, Y.; Singh, G.; Popovitz-Biro, R.; Wolf, S.G.; Das, S.; Klajn, R. Metallic nanobowls by galvanic replacement reaction on heterodimeric nanoparticles. Small 2012, 8, 654–660. [Google Scholar] [CrossRef] [PubMed]
  4. Collins, G.; McCarty, E.; Holmes, J.D. Controlling alloy formation and optical properties by galvanic replacement of sub-20 nm silver nanoparticles in organic media. CrystEngComm 2015, 17, 6999–7005. [Google Scholar] [CrossRef]
  5. Yamamoto, Y.; Fujime, Y.; Takahashi, C.N.; Nakanishi, S.; Itoh, T. Formation mechanism of plasmonic silver nanohexagonal particles made by galvanic displacement reaction. RSC Adv. 2016, 6, 31454–31461. [Google Scholar] [CrossRef]
  6. Hangarter, C.M.; Lee, Y.-I.; Hernandez, S.C.; Choa, Y.-h.; Myung, N.V. Nanopeapods by galvanic displacement reaction. Angew. Chem. Int. Ed. 2010, 49, 7081–7085. [Google Scholar] [CrossRef]
  7. Parisi, J.; Su, L.; Lei, Y. In situ synthesis of silver nanoparticle decorated vertical nanowalls in a microfluidic device for ultrasensitive in-channel SERS sensing. Lab Chip 2013, 13, 1501–1508. [Google Scholar] [CrossRef] [PubMed]
  8. Mohl, M.; Dobo, D.; Kukovecz, A.; Konya, Z.; Kordas, K.; Wei, J.; Vajtai, R.; Ajayan, P.M. Formation of CuPd and CuPt bimetallic nanotubes by galvanic replacement reaction. J. Phys. Chem. C 2011, 115, 9403–9409. [Google Scholar] [CrossRef]
  9. Liu, J.; Uprety, B.; Gyawali, S.; Woolley, A.T.; Myung, N.V.; Harb, J.N. Fabrication of DNA-templated Te and Bi2Te3 nanowires by galvanic displacement. Langmuir 2013, 29, 11176–11184. [Google Scholar] [CrossRef]
  10. Mohl, M.; Kumar, A.; Reddy, A.L.M.; Kukovecz, A.; Konya, Z.; Kiricsi, I.; Vajtai, R.; Ajayan, P.M. Synthesis of catalytic porous metallic nanorods by galvanic exchange reaction. J. Phys. Chem. C 2010, 114, 389–393. [Google Scholar] [CrossRef]
  11. Tan, Y.-N.; Yang, J.; Lee, J.Y.; Wang, D.I.C. Mechanistic Study on the Bis(p-sulfonatophenyl)phenylphosphine Synthesis of Monometallic Pt Hollow Nanoboxes Using Ag*−Pt Core−Shell Nanocubes as Sacrificial Templates. J. Phys. Chem. C 2007, 111, 14084–14090. [Google Scholar] [CrossRef]
  12. He, P.; Yu, X.Y.; Lou, X.W. Carbon-incorporated nickel–cobalt mixed metal phosphide nanoboxes with enhanced electrocatalytic activity for oxygen evolution. Angew. Chem. Int. Ed. 2017, 56, 3897–3900. [Google Scholar] [CrossRef] [PubMed]
  13. Wang, C.; Shang, H.; Xu, H.; Du, Y. Nanoboxes endow non-noble-metal-based electrocatalysts with high efficiency for overall water splitting. J. Mater. Chem. A 2021, 9, 857–874. [Google Scholar] [CrossRef]
  14. Cheng, X.; Jiang, Z.; Cheng, X.; Guo, S.; Tang, L.; Yang, H.; Wu, H.; Pan, F.; Zhang, P.; Cao, X. Bimetallic metal-organic frameworks nanocages as multi-functional fillers for water-selective membranes. J. Membr. Sci. 2018, 545, 19–28. [Google Scholar] [CrossRef]
  15. Xu, Y.; Hou, S.; Yang, G.; Wang, X.; Lu, T.; Pan, L. Synthesis of bimetallic NixCo1−xP hollow nanocages from metal-organic frameworks for high performance hybrid supercapacitors. Electrochim. Acta 2018, 285, 192–201. [Google Scholar] [CrossRef]
  16. Huang, M.; Mi, K.; Zhang, J.; Liu, H.; Yu, T.; Yuan, A.; Kong, Q.; Xiong, S. MOF-derived bi-metal embedded N-doped carbon polyhedral nanocages with enhanced lithium storage. J. Mater. Chem. A 2017, 5, 266–274. [Google Scholar] [CrossRef]
  17. Zhu, J.; Li, X.; Li, J.-j.; Zhao, J.-w. Enlarge the biologic coating-induced absorbance enhancement of Au-Ag bimetallic nanoshells by tuning the metal composition. Spectrochim. Acta Part A Mol. Biomol. Spectrosc. 2018, 189, 571–577. [Google Scholar] [CrossRef] [PubMed]
  18. Rodrigues, T.S.; da Silva, A.G.; Macedo, A.; Farini, B.W.; Alves, R.d.S.; Camargo, P.H. Probing the catalytic activity of bimetallic versus trimetallic nanoshells. J. Mater. Sci. 2015, 50, 5620–5629. [Google Scholar] [CrossRef]
  19. Kisukuri, C.M.; Palmeira, D.J.; Rodrigues, T.S.; Camargo, P.H.; Andrade, L.H. Bimetallic Nanoshells as Platforms for Metallo-and Biometallo-Catalytic Applications. ChemCatChem 2016, 8, 171–179. [Google Scholar] [CrossRef]
  20. Godinez-Salomon, F.; Albiter, L.; Mendoza-Cruz, R.; Rhodes, C.P. Bimetallic two-dimensional nanoframes: High activity acidic bifunctional oxygen reduction and evolution electrocatalysts. ACS Appl. Energy Mater. 2020, 3, 2404–2421. [Google Scholar] [CrossRef]
  21. Li, J.; Sun, X.; Qin, D. Ag-Enriched Ag-Pd Bimetallic Nanoframes and Their Catalytic Properties. ChemNanoMat 2016, 2, 494–499. [Google Scholar] [CrossRef]
  22. Cheng, D.; Wang, W.; Cao, D.; Huang, S. Simulating Synthesis of Metal Nanorods, Nanoplates, and Nanoframes by Self-Assembly of Nanoparticle Building Blocks. J. Phys. Chem. C 2009, 113, 3986–3997. [Google Scholar] [CrossRef]
  23. Fang, Z.; Wang, Y.; Liu, C.; Chen, S.; Sang, W.; Wang, C.; Zeng, J. Rational design of metal nanoframes for catalysis and plasmonics. Small 2015, 11, 2593–2605. [Google Scholar] [CrossRef] [PubMed]
  24. Xie, S.; Lu, N.; Xie, Z.; Wang, J.; Kim, M.J.; Xia, Y. Synthesis of Pd-Rh core–frame concave nanocubes and their conversion to Rh cubic nanoframes by selective etching of the Pd cores. Angew. Chem. Int. Ed. 2012, 51, 10266–10270. [Google Scholar] [CrossRef] [PubMed]
  25. Nosheen, F.; Zhang, Z.-c.; Zhuang, J.; Wang, X. One-pot fabrication of single-crystalline octahedral Pt–Cu nanoframes and their enhanced electrocatalytic activity. Nanoscale 2013, 5, 3660–3663. [Google Scholar] [CrossRef] [PubMed]
  26. Niu, H.-J.; Chen, H.-Y.; Wen, G.-L.; Feng, J.-J.; Zhang, Q.-L.; Wang, A.-J. One-pot solvothermal synthesis of three-dimensional hollow PtCu alloyed dodecahedron nanoframes with excellent electrocatalytic performances for hydrogen evolution and oxygen reduction. J. Colloid Interface Sci. 2019, 539, 525–532. [Google Scholar] [CrossRef] [PubMed]
  27. Zhang, C.; Yin, H.; Bai, X.; Yang, Z. Ru doping induced lattice distortion of Cu nanoparticles for boosting electrochemical nonenzymatic hydrogen peroxide sensing. Colloids Surf. A Physicochem. Eng. Asp. 2023, 666, 131311. [Google Scholar] [CrossRef]
  28. Kim, J.; Yoo, S.; Kim, J.-M.; Choi, S.; Kim, J.; Park, S.-J.; Park, D.; Nam, J.-M.; Park, S. Synthesis and Single-Particle Surface-Enhanced Raman Scattering Study of Plasmonic Tripod Nanoframes with Y-Shaped Hot-Zones. Nano Lett. 2020, 20, 4362–4369. [Google Scholar] [CrossRef] [PubMed]
  29. Luo, S.; Shen, P.K. Concave Platinum–Copper Octopod Nanoframes Bounded with Multiple High-Index Facets for Efficient Electrooxidation Catalysis. ACS Nano 2017, 11, 11946–11953. [Google Scholar] [CrossRef]
  30. Kwon, T.; Jun, M.; Kim, H.Y.; Oh, A.; Park, J.; Baik, H.; Joo, S.H.; Lee, K. Vertex-reinforced PtCuCo ternary nanoframes as efficient and stable electrocatalysts for the oxygen reduction reaction and the methanol oxidation reaction. Adv. Funct. Mater. 2018, 28, 1706440. [Google Scholar] [CrossRef]
  31. Liu, Y.; Gao, Z.-F.; Sun, Q.; Zeng, Y.-P. Template-assisted synthesis of single-crystalline Mn3O4 nanoframes and hollow octahedra. Solid State Sci. 2012, 14, 1462–1466. [Google Scholar] [CrossRef]
  32. Okazaki, K.-i.; Sakuma, J.; Yasui, J.-i.; Kuwabata, S.; Hirahara, K.; Tanaka, N.; Torimoto, T. Fabrication of nanoframe structures by site-selective assembly of gold nanoparticles on silver cubes in an ionic liquid. Chem. Lett. 2011, 40, 84–86. [Google Scholar] [CrossRef]
  33. Negondeni, J.; Ngwenya, T. Synthesizing Pt-Ni/C Nanoframes electrocatalyst using the solvothermal and in-house developed method for PEM fuel cells. Suid-Afr. Tydskr. Natuurwetenskap Tegnol./S. Afr. J. Sci. Technol. 2021, 40, 262–266. [Google Scholar] [CrossRef]
  34. Chen, X.-L.; Wen, G.-L.; Huang, H.; Wang, A.-J.; Wang, Z.-G.; Feng, J.-J. Uric acid supported one-pot solvothermal fabrication of rhombic-like Pt35Cu65 hollow nanocages for highly efficient and stable electrocatalysis. J. Colloid Interface Sci. 2019, 540, 486–494. [Google Scholar] [CrossRef]
  35. Snyder, J.; Fujita, T.; Chen, M.; Erlebacher, J. Oxygen reduction in nanoporous metal–ionic liquid composite electrocatalysts. Nat. Mater. 2010, 9, 904–907. [Google Scholar] [CrossRef]
  36. Snyder, J.; McCue, I.; Livi, K.; Erlebacher, J. Structure/processing/properties relationships in nanoporous nanoparticles as applied to catalysis of the cathodic oxygen reduction reaction. J. Am. Chem. Soc. 2012, 134, 8633–8645. [Google Scholar] [CrossRef] [PubMed]
  37. Chen, C.; Kang, Y.; Huo, Z.; Zhu, Z.; Huang, W.; Xin, H.L.; Snyder, J.D.; Li, D.; Herron, J.A.; Mavrikakis, M. Highly crystalline multimetallic nanoframes with three-dimensional electrocatalytic surfaces. Science 2014, 343, 1339–1343. [Google Scholar] [CrossRef] [PubMed]
  38. Xie, S.; Choi, S.-I.; Xia, X.; Xia, Y. Catalysis on faceted noble-metal nanocrystals: Both shape and size matter. Curr. Opin. Chem. Eng. 2013, 2, 142–150. [Google Scholar] [CrossRef]
  39. Yang, T.-H.; Ahn, J.; Shi, S.; Wang, P.; Gao, R.; Qin, D. Noble-metal nanoframes and their catalytic applications. Chem. Rev. 2020, 121, 796–833. [Google Scholar] [CrossRef]
  40. Wang, Z.; Wang, H.; Zhang, Z.; Yang, G.; He, T.; Yin, Y.; Jin, M. Synthesis of Pd nanoframes by excavating solid nanocrystals for enhanced catalytic properties. ACS Nano 2017, 11, 163–170. [Google Scholar] [CrossRef]
  41. Han, L.; Liu, H.; Cui, P.; Peng, Z.; Zhang, S.; Yang, J. Alloy Cu3Pt nanoframes through the structure evolution in Cu-Pt nanoparticles with a core-shell construction. Sci. Rep. 2014, 4, 6414. [Google Scholar] [CrossRef] [PubMed]
  42. Oh, A.; Baik, H.; Choi, D.S.; Cheon, J.Y.; Kim, B.; Kim, H.; Kwon, S.J.; Joo, S.H.; Jung, Y.; Lee, K. Skeletal octahedral nanoframe with cartesian coordinates via geometrically precise nanoscale phase segregation in a Pt@ Ni core–shell nanocrystal. ACS Nano 2015, 9, 2856–2867. [Google Scholar] [CrossRef] [PubMed]
  43. Yang, T.H.; Shi, Y.; Janssen, A.; Xia, Y. Surface capping agents and their roles in shape-Controlled synthesis of colloidal metal nanocrystals. Angew. Chem. Int. Ed. 2020, 59, 15378–15401. [Google Scholar] [CrossRef] [PubMed]
  44. Qin, Y.; Zhang, W.; Guo, K.; Liu, X.; Liu, J.; Liang, X.; Wang, X.; Gao, D.; Gan, L.; Zhu, Y. Fine-Tuning Intrinsic Strain in Penta-Twinned Pt–Cu–Mn Nanoframes Boosts Oxygen Reduction Catalysis. Adv. Funct. Mater. 2020, 30, 1910107. [Google Scholar] [CrossRef]
  45. Park, J.; Wang, H.; Vara, M.; Xia, Y. Platinum cubic nanoframes with enhanced catalytic activity and durability toward oxygen reduction. ChemSusChem 2016, 9, 2855–2861. [Google Scholar] [CrossRef]
  46. Zhang, L.; Roling, L.T.; Wang, X.; Vara, M.; Chi, M.; Liu, J.; Choi, S.-I.; Park, J.; Herron, J.A.; Xie, Z. Platinum-based nanocages with subnanometer-thick walls and well-defined, controllable facets. Science 2015, 349, 412–416. [Google Scholar] [CrossRef] [PubMed]
  47. Lu, X.; Au, L.; McLellan, J.; Li, Z.Y.; Marquez, M.; Xia, Y. Fabrication of cubic nanocages and nanoframes by dealloying Au/Ag alloy nanoboxes with an aqueous etchant based on Fe(NO3)3 or NH4OH. Nano Lett. 2007, 7, 1764. [Google Scholar] [CrossRef]
  48. Yoo, S.; Kim, J.; Choi, S.; Park, D.; Park, S. Two-dimensional nanoframes with dual rims. Nat. Commun. 2019, 10, 5789. [Google Scholar] [CrossRef]
  49. Gilroy, K.D.; Yang, X.; Xie, S.; Zhao, M.; Qin, D.; Xia, Y. Shape-controlled synthesis of colloidal metal nanocrystals by replicating the surface atomic structure on the seed. Adv. Mater. 2018, 30, 1706312. [Google Scholar] [CrossRef]
  50. Li, Z.; Yu, R.; Huang, J.; Shi, Y.; Zhang, D.; Zhong, X.; Wang, D.; Wu, Y.; Li, Y. Platinum–nickel frame within metal-organic framework fabricated in situ for hydrogen enrichment and molecular sieving. Nat. Commun. 2015, 6, 8248. [Google Scholar] [CrossRef]
  51. Pei, J.; Mao, J.; Liang, X.; Chen, C.; Peng, Q.; Wang, D.; Li, Y. Ir–Cu nanoframes: One-pot synthesis and efficient electrocatalysts for oxygen evolution reaction. Chem. Commun. 2016, 52, 3793–3796. [Google Scholar] [CrossRef]
  52. Kull, S.; Heymann, L.; Hungria, A.B.; Klinke, C. Synthesis of Single-Crystalline Lead Sulfide Nanoframes and Nanorings. Chem. Mater. 2019, 31, 5646–5654. [Google Scholar] [CrossRef]
  53. Gruzeł, G.; Arabasz, S.; Pawlyta, M.; Parlinska-Wojtan, M. Conversion of bimetallic PtNi 3 nanopolyhedra to ternary PtNiSn nanoframes by galvanic replacement reaction. Nanoscale 2019, 11, 5355–5364. [Google Scholar] [CrossRef] [PubMed]
  54. Yang, L.; Zhan, Q.; Wang, Z.; Chen, Q.; Tong, J.; Fang, D.; Xia, L.; Jin, M. Construction of light-harvesting system for enhanced catalytic performance of Pd nanoframes toward Suzuki coupling reaction. J. Mater. Chem. A 2017, 5, 10150–10153. [Google Scholar] [CrossRef]
  55. Chen, G.; Desinan, S.; Nechache, R.; Rosei, R.; Rosei, F.; Ma, D. Bifunctional catalytic/magnetic Ni@Ru core–shell nanoparticles. Chem. Commun. 2011, 47, 6308–6310. [Google Scholar] [CrossRef]
  56. Ahn, J.; Qin, D. Fabrication of Nanoscale Cage Cubes by Drilling Orthogonal, Intersected Holes through All Six Side Faces of Ag Nanocubes. Chem. Mater. 2019, 31, 9179–9187. [Google Scholar] [CrossRef]
  57. Hajfathalian, M.; Gilroy, K.D.; Golze, S.D.; Yaghoubzade, A.; Menumerov, E.; Hughes, R.A.; Neretina, S. A Wulff in a cage: The confinement of substrate-based structures in plasmonic nanoshells, nanocages, and nanoframes using galvanic replacement. ACS Nano 2016, 10, 6354–6362. [Google Scholar] [CrossRef]
  58. Liu, W.; Li, L.; Yang, S.; Gao, J.; Wang, R. Self-Assembly of Heterogeneously Shaped Nanoparticles into Plasmonic Metamolecules on DNA Origami. Chem. A Eur. J. 2017, 23, 14177–14181. [Google Scholar] [CrossRef]
  59. Wang, S.; Yang, G.; Yang, S. Pt-frame@ Ni quasi core–shell concave octahedral PtNi3 bimetallic nanocrystals for electrocatalytic methanol oxidation and hydrogen evolution. J. Phys. Chem. C 2015, 119, 27938–27945. [Google Scholar] [CrossRef]
  60. Godínez-Salomón, F.; Albiter, L.; Alia, S.M.; Pivovar, B.S.; Camacho-Forero, L.E.; Balbuena, P.B.; Mendoza-Cruz, R.; Arellano-Jimenez, M.J.; Rhodes, C.P. Self-Supported Hydrous Iridium–Nickel Oxide Two-Dimensional Nanoframes for High Activity Oxygen Evolution Electrocatalysts. ACS Catal. 2018, 8, 10498–10520. [Google Scholar] [CrossRef]
  61. Zhao, M.; Hood, Z.D.; Vara, M.; Gilroy, K.D.; Chi, M.; Xia, Y. Ruthenium nanoframes in the face-centered cubic phase: Facile synthesis and their enhanced catalytic performance. ACS Nano 2019, 13, 7241–7251. [Google Scholar] [CrossRef]
  62. Wang, Y.; Chen, S.; Wang, X.; Rosen, A.; Beatrez, W.; Sztaberek, L.; Tan, H.; Zhang, L.; Koenigsmann, C.; Zhao, J. Composition-Dependent Oxygen Reduction Reaction Activity of Pt-Surfaced PtNi Dodecahedral Nanoframes. ACS Appl. Energy Mater. 2020, 3, 768–776. [Google Scholar] [CrossRef]
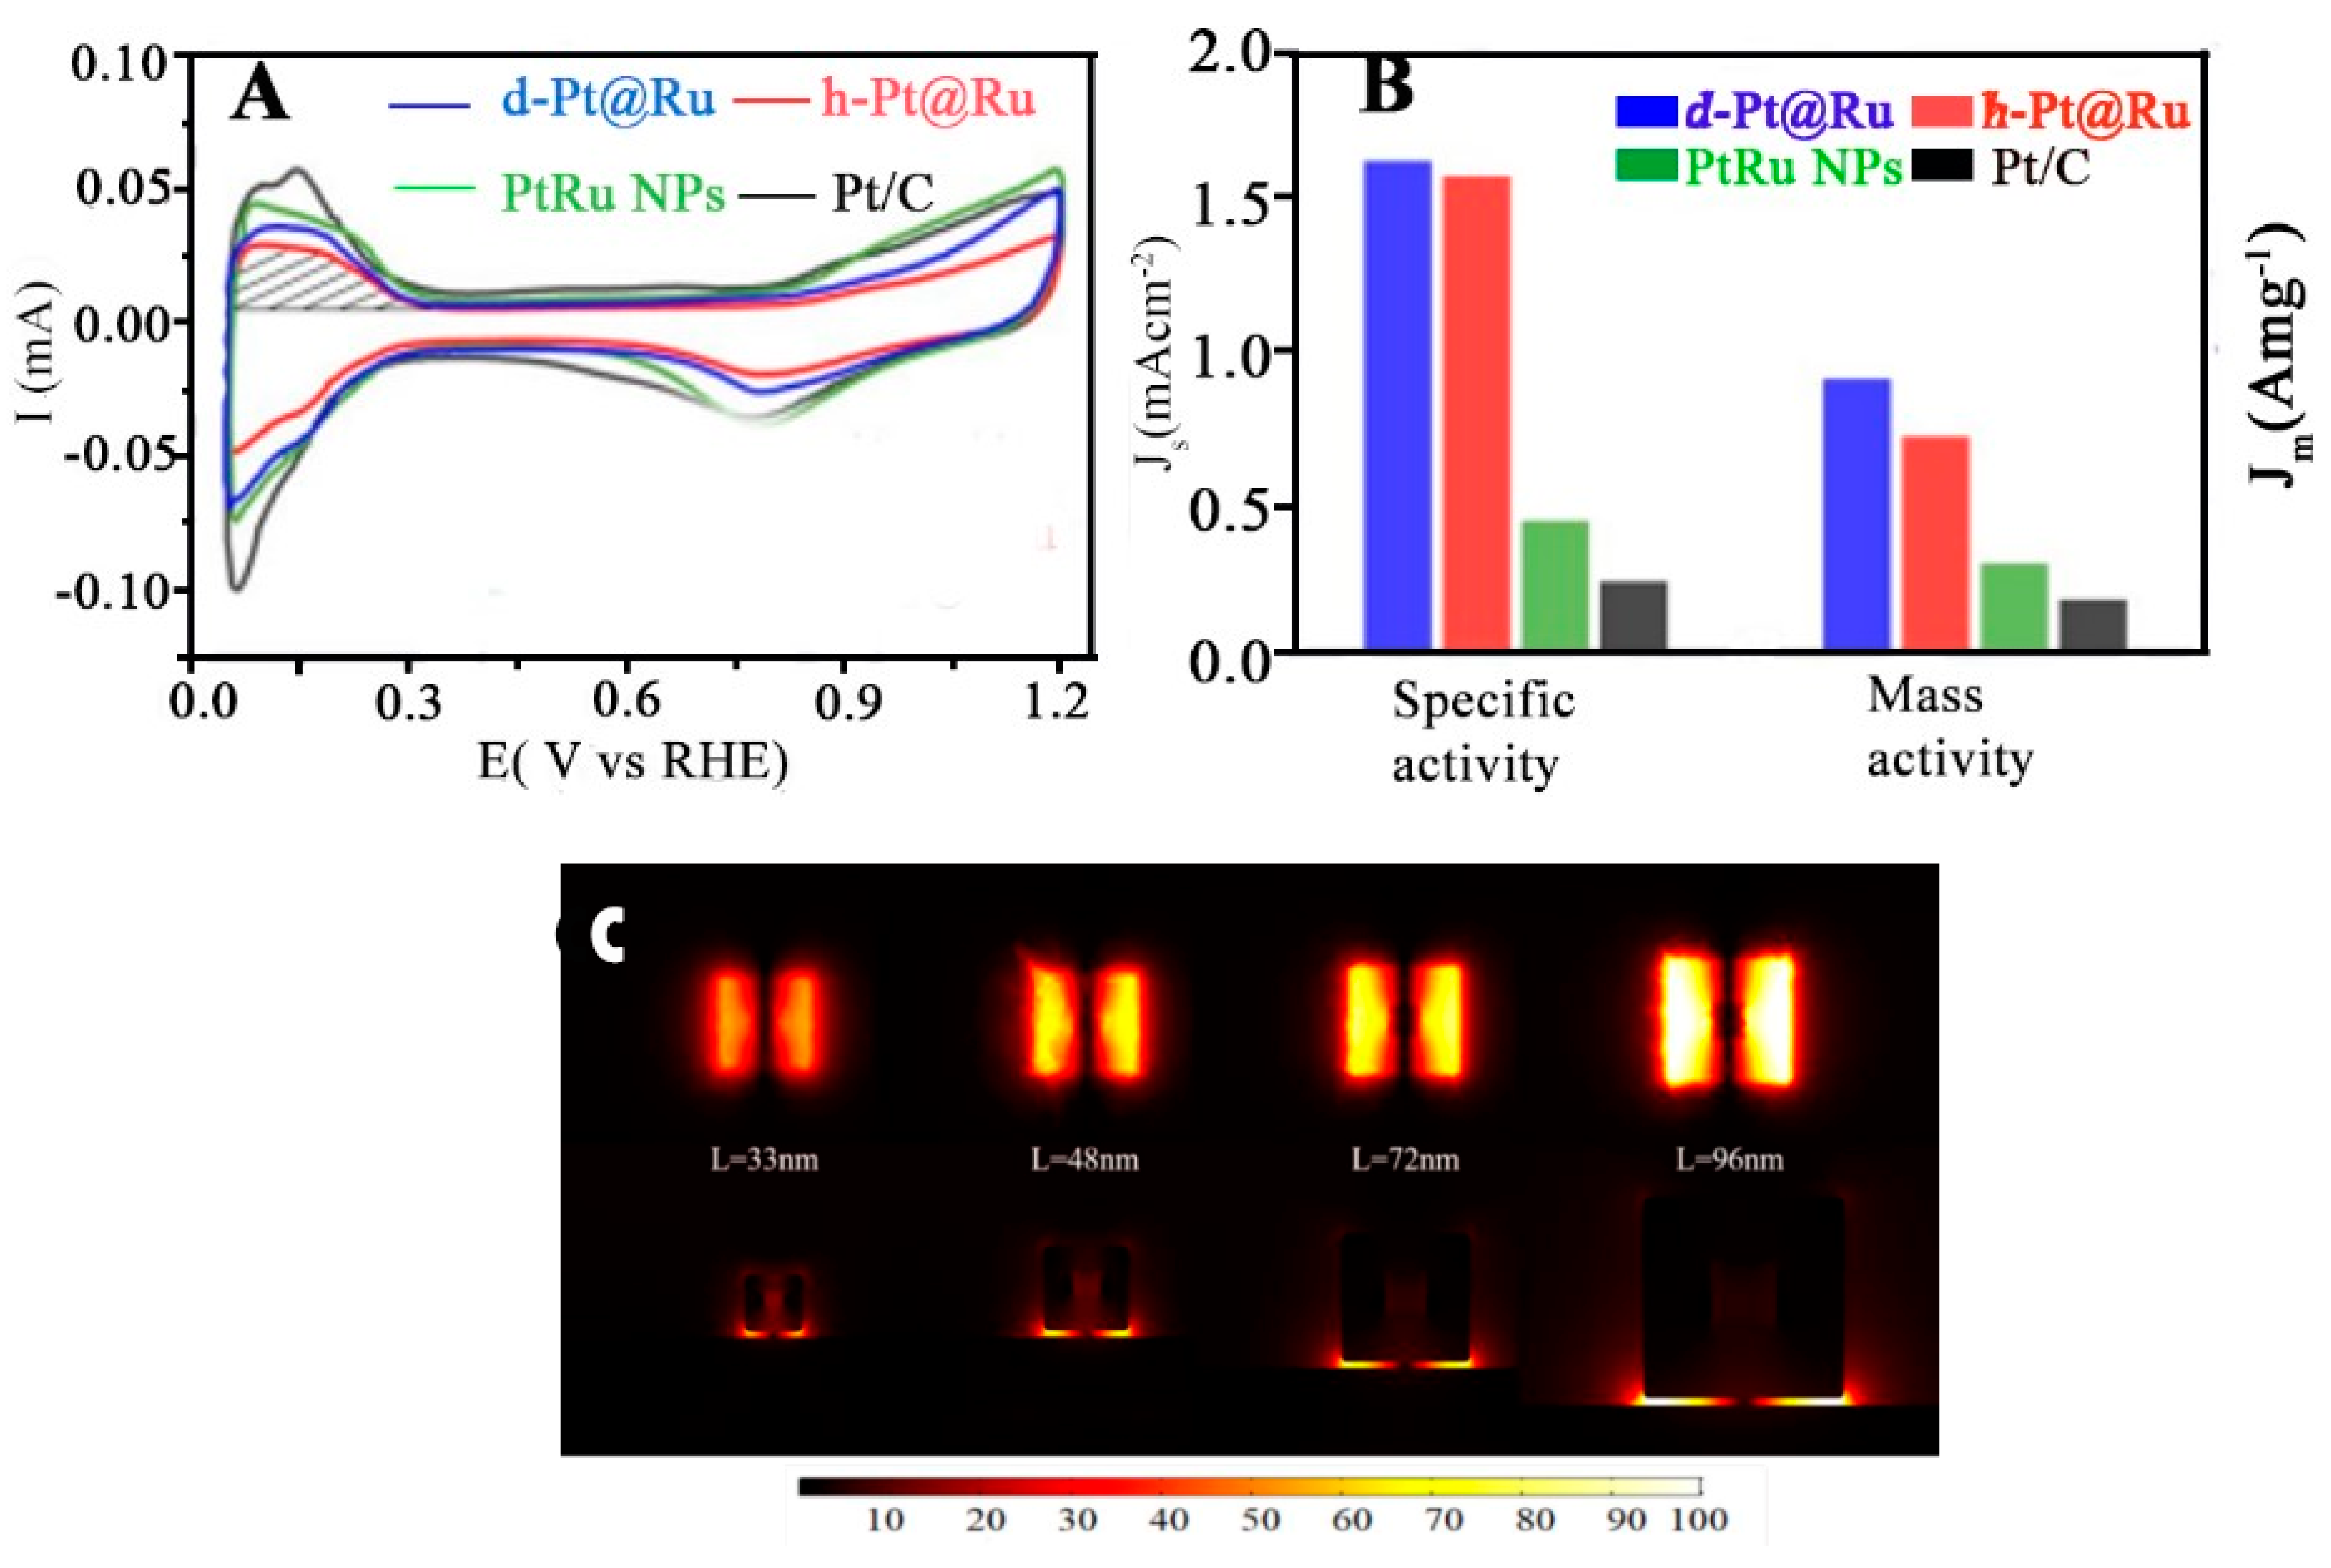
  63. Bai, X.; Geng, J.; Zhao, S.; Li, H.; Li, F. Tunable Hollow Pt@Ru Dodecahedra via Galvanic Replacement for Efficient Methanol Oxidation. ACS Appl. Mater. Interfaces 2020, 12, 23046–23050. [Google Scholar] [CrossRef]
  64. Nosheen, F.; Anwar, T.; Siddique, A.; Hussain, N. Noble metal based alloy nanoframes: Syntheses and applications in fuel cells. Front. Chem. 2019, 7, 456. [Google Scholar] [CrossRef] [PubMed]
  65. González, E.; Arbiol, J.; Puntes, V.F. Carving at the Nanoscale: Sequential Galvanic Exchange and Kirkendall Growth at Room Temperature. Science 2011, 334, 1377. [Google Scholar] [CrossRef]
  66. Shi, H.; Ouyang, S.; Peng, M.; Wang, T.; Wang, S. Photocatalytic template synthesis of Pt nanocages with enhanced electrocatalytic performance. ECS Electrochem. Lett. 2015, 4, H38. [Google Scholar] [CrossRef]
  67. Zhang, X.-F.; Wang, A.-J.; Zhang, L.; Yuan, J.; Li, Z.; Feng, J.-J. Solvothermal synthesis of monodisperse PtCu dodecahedral nanoframes with enhanced catalytic activity and durability for hydrogen evolution reaction. ACS Appl. Energy Mater. 2018, 1, 5054–5061. [Google Scholar] [CrossRef]
  68. Huang, X.-Y.; You, L.-X.; Zhang, X.-F.; Feng, J.-J.; Zhang, L.; Wang, A.-J. L-proline assisted solvothermal preparation of Cu-rich rhombic dodecahedral PtCu nanoframes as advanced electrocatalysts for oxygen reduction and hydrogen evolution reactions. Electrochim. Acta 2019, 299, 89–97. [Google Scholar] [CrossRef]
  69. Luo, S.; Tang, M.; Shen, P.K.; Ye, S. Atomic-Scale Preparation of Octopod Nanoframes with High-Index Facets as Highly Active and Stable Catalysts. Adv. Mater. 2017, 29. [Google Scholar] [CrossRef] [PubMed]
  70. Li, Y.; Tang, S.; Xu, S.; Duan, Z.; Wang, Z.; Zhang, Y. Ag Nanoframes Deposited on Au Films Generate Optical Cavities for Surface-Enhanced Raman Scattering. ACS Appl. Nano Mater. 2020, 3, 5116–5122. [Google Scholar] [CrossRef]
  71. Godínez-Salomón, F.; Mendoza-Cruz, R.; Arellano-Jimenez, M.J.; Jose-Yacaman, M.; Rhodes, C.P. Metallic Two-Dimensional Nanoframes: Unsupported Hierarchical Nickel–Platinum Alloy Nanoarchitectures with Enhanced Electrochemical Oxygen Reduction Activity and Stability. ACS Appl. Mater. Interfaces 2017, 9, 18660–18674. [Google Scholar] [CrossRef]
  72. Kao, C.-R.; Yeh, A.-H.; Chen, B.-H.; Lyu, L.-M.; Chuang, Y.-C.; Sneed, B.T.; Kuo, C.-H. Insights into Transformation of Icosahedral PdRu Nanocrystals into Lattice-Expanded Nanoframes with Strain Enhancement in Electrochemical Redox Reactions. Chem. Mater. 2022, 34, 2282–2291. [Google Scholar] [CrossRef]
  73. Ye, H.; Wang, Q.; Catalano, M.; Lu, N.; Vermeylen, J.; Kim, M.J.; Liu, Y.; Sun, Y.; Xia, X. Ru Nanoframes with an fcc Structure and Enhanced Catalytic Properties. Nano Lett. 2016, 16, 2812–2817. [Google Scholar] [CrossRef] [PubMed]
  74. Zhang, L.; Pu, J.; Jiang, Y.; Shen, Z.; Li, J.; Liu, J.; Ma, H.; Niu, J.; Zhang, H. Low Interface Energies Tune the Electrochemical Reversibility of Tin Oxide Composite Nanoframes as Lithium-Ion Battery Anodes. ACS Appl. Mater. Interfaces 2018, 10, 36892–36901. [Google Scholar] [CrossRef] [PubMed]
  75. Zhang, Y.; Li, Y.; Gao, Z.; Ding, B.; An, P.; Zhang, X.; Sun, B.; Sun, B. Mesoporous Silica-Coated Silver Nanoframes as Drug-Delivery Vehicles for Chemo/Starvation/Metal Ion Multimodality Therapy. Langmuir 2020, 36, 6345–6351. [Google Scholar] [CrossRef] [PubMed]
  76. Huang, C.; Zheng, L.; Feng, W.; Guo, A.; Gao, X.; Long, Z.; Qiu, X. Copper Isolated Sites on N-Doped Carbon Nanoframes for Efficient Oxygen Reduction. ACS Sustain. Chem. Eng. 2020, 8, 14030–14038. [Google Scholar] [CrossRef]
  77. Oh, A.; Sa, Y.J.; Hwang, H.; Baik, H.; Kim, J.; Kim, B.; Joo, S.H.; Lee, K. Rational design of Pt–Ni–Co ternary alloy nanoframe crystals as highly efficient catalysts toward the alkaline hydrogen evolution reaction. Nanoscale 2016, 8, 16379–16386. [Google Scholar] [CrossRef] [PubMed]
  78. Park, J.; Sa, Y.J.; Baik, H.; Kwon, T.; Joo, S.H.; Lee, K. Iridium-based multimetallic nanoframe@ nanoframe structure: An efficient and robust electrocatalyst toward oxygen evolution reaction. ACS Nano 2017, 11, 5500–5509. [Google Scholar] [CrossRef] [PubMed]
  79. Chen, Z.; Zhao, B.; He, Y.-C.; Wen, H.-R.; Fu, X.-Z.; Sun, R.; Wong, C.-P. NiCo2O4 nanoframes with a nanosheet surface as efficient electrocatalysts for the oxygen evolution reaction. Mater. Chem. Front. 2018, 2, 1155–1164. [Google Scholar] [CrossRef]
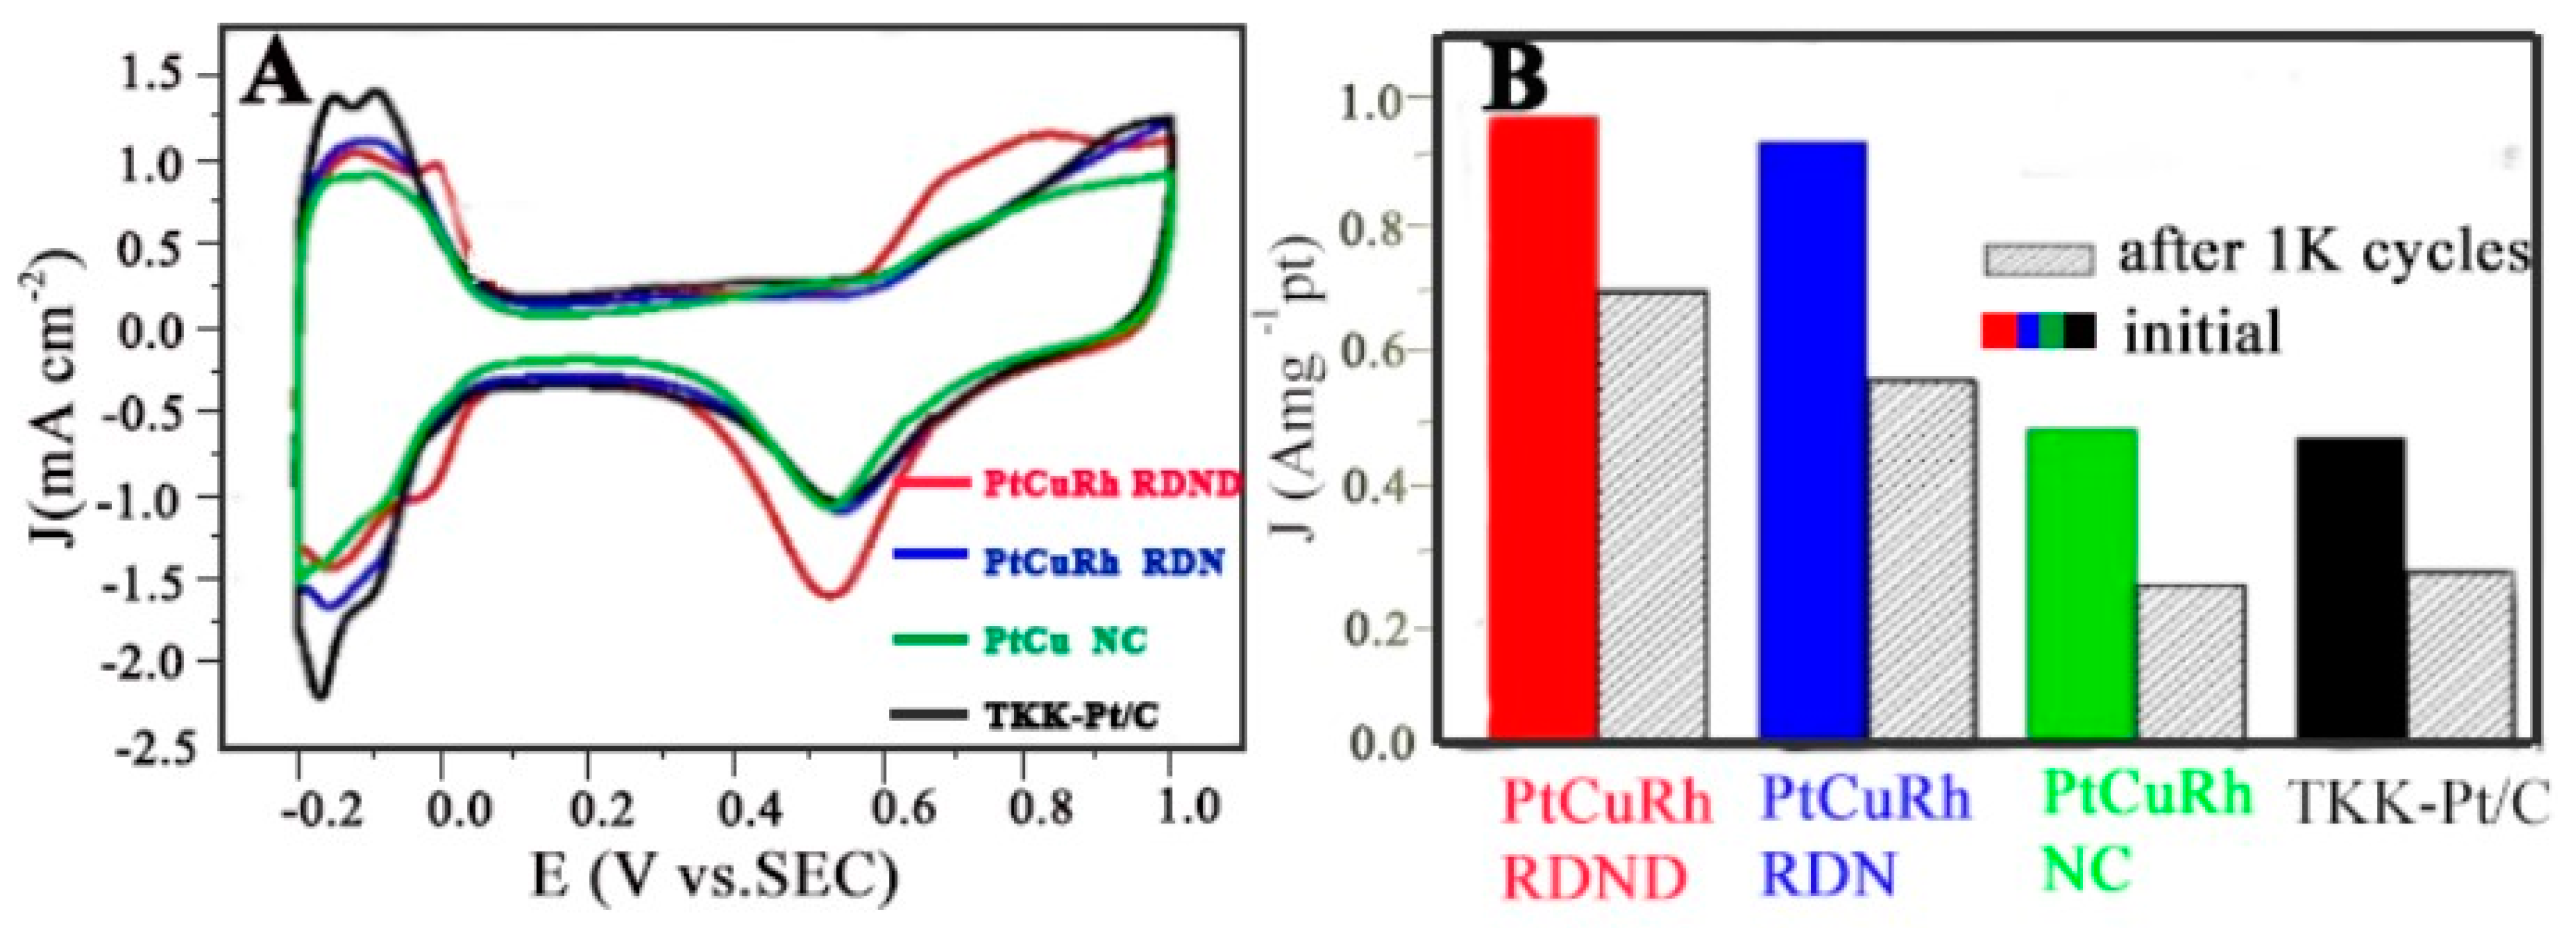
  80. Wang, Z.; Huang, L.; Tian, Z.Q.; Shen, P.K. The controllable growth of PtCuRh rhombic dodecahedral nanoframes as efficient catalysts for alcohol electrochemical oxidation. J. Mater. Chem. A 2019, 7, 18619–18625. [Google Scholar] [CrossRef]
  81. Yuan, X.; Jiang, B.; Cao, M.; Zhang, C.; Liu, X.; Zhang, Q.; Lyu, F.; Gu, L.; Zhang, Q. Porous Pt nanoframes decorated with Bi(OH)3 as highly efficient and stable electrocatalyst for ethanol oxidation reaction. Nano Res. 2020, 13, 265–272. [Google Scholar] [CrossRef]
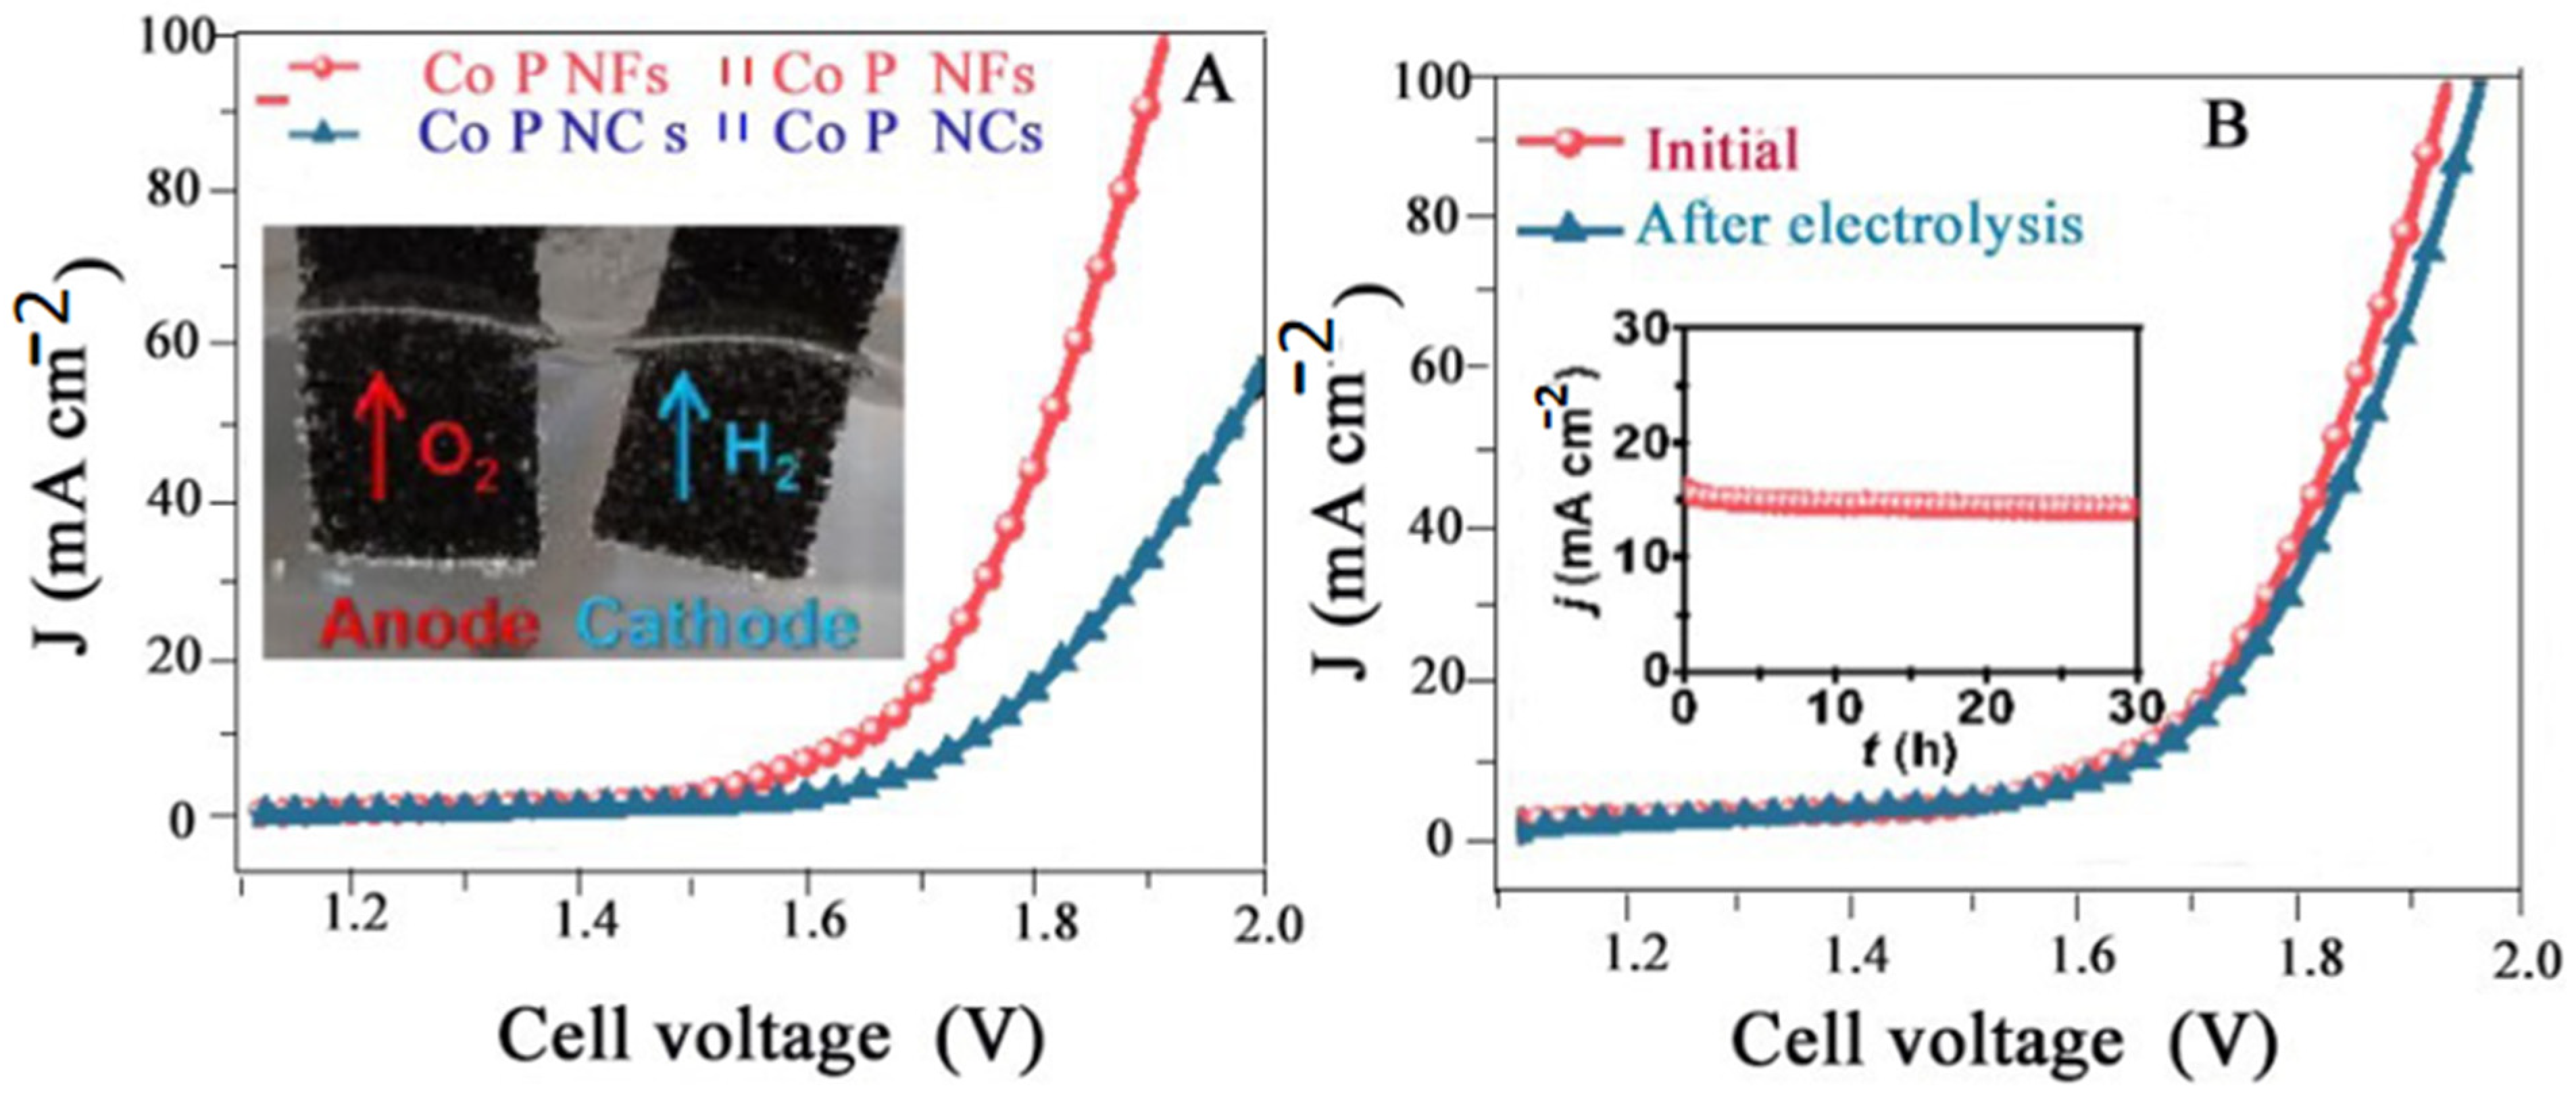
  82. Ji, L.; Wang, J.; Teng, X.; Meyer, T.J.; Chen, Z. CoP Nanoframes as Bifunctional Electrocatalysts for Efficient Overall Water Splitting. ACS Catal. 2020, 10, 412–419. [Google Scholar] [CrossRef]
  83. Lian, Y.; Sun, H.; Wang, X.; Qi, P.; Mu, Q.; Chen, Y.; Ye, J.; Zhao, X.; Deng, Z.; Peng, Y. Carved nanoframes of cobalt–iron bimetal phosphide as a bifunctional electrocatalyst for efficient overall water splitting. Chem. Sci. 2019, 10, 464–474. [Google Scholar] [CrossRef] [PubMed]
  84. Ji, L.; Wei, Y.; Wu, P.; Xu, M.; Wang, T.; Wang, S.; Liang, Q.; Meyer, T.J.; Chen, Z. Heterointerface Engineering of Ni2P–Co2P Nanoframes for Efficient Water Splitting. Chem. Mater. 2021, 33, 9165–9173. [Google Scholar] [CrossRef]
  85. Wang, A.J.; Zhang, X.F.; Jiang, L.Y.; Zhang, L.; Feng, J.J. Bimetallic Alloyed PtCu Nanocubic Frames with Three-Dimensional Molecular Accessible Surfaces for Boosting Oxygen Reduction and Glycerol Oxidation Reactions. ChemCatChem 2018, 10, 3319–3326. [Google Scholar] [CrossRef]
  86. Chen, M.; Meng, Y.; Zhou, J.; Diao, G. Platinum nanoworms self-assemble on β-cyclodextrin polymer inclusion complexes functionalized reduced graphene oxide as enhanced catalyst for direct methanol fuel cells. J. Power Sources 2014, 265, 110–117. [Google Scholar] [CrossRef]
  87. Wang, L.; Chen, Y.; Lin, H.Y.; Hou, Y.-T.; Yang, L.-C.; Sun, A.Y.; Liu, J.-Y.; Chang, C.-W.; Wan, D. Near-IR-Absorbing Gold Nanoframes with Enhanced Physiological Stability and Improved Biocompatibility for In Vivo Biomedical Applications. ACS Appl. Mater. Interfaces 2017, 9, 3873–3884. [Google Scholar] [CrossRef] [PubMed]
  88. Liu, S.; Lu, S.; Sun, S.; Hai, J.; Meng, G.; Wang, B. NIR II Light-Response Au Nanoframes: Amplification of a Pressure-and Temperature-Sensing Strategy for Portable Detection and Photothermal Therapy of Cancer Cells. Anal. Chem. 2021, 93, 14307–14316. [Google Scholar] [CrossRef] [PubMed]
  89. Hashemi, P.; Afkhami, A.; Baradaran, B.; Halabian, R.; Madrakian, T.; Arduini, F.; Nguyen, T.A.; Bagheri, H. Well-orientation strategy for direct immobilization of antibodies: Development of the immunosensor using the boronic acid-modified magnetic graphene nanoribbons for ultrasensitive detection of lymphoma cancer cells. Anal. Chem. 2020, 92, 11405–11412. [Google Scholar] [CrossRef] [PubMed]
  90. Tang, Y.-H.; Lin, H.-C.; Lai, C.-L.; Chen, P.-Y.; Lai, C.-H. Mannosyl electrochemical impedance cytosensor for label-free MDA-MB-231 cancer cell detection. Biosens. Bioelectron. 2018, 116, 100–107. [Google Scholar] [CrossRef]
  91. Baird, Z.; Pirro, V.; Ayrton, S.; Hollerbach, A.; Hanau, C.; Marfurt, K.; Foltz, M.; Cooks, R.G.; Pugia, M. Tumor cell detection by mass spectrometry using signal ion emission reactive release amplification. Anal. Chem. 2016, 88, 6971–6975. [Google Scholar] [CrossRef]
  92. Zhang, X.; Chen, B.; He, M.; Wang, H.; Hu, B. Gold nanoparticles labeling with hybridization chain reaction amplification strategy for the sensitive detection of HepG2 cells by inductively coupled plasma mass spectrometry. Biosens. Bioelectron. 2016, 86, 736–740. [Google Scholar] [CrossRef] [PubMed]
  93. Shan, B.; Li, L.; Zhao, Y.; Wang, H.; Li, M. Near-Infrared II Plasmonic Au@Au–Ag Dot-in-Cubic Nanoframes for In Vivo Surface-Enhanced Raman Spectroscopic Detection and Photoacoustic Imaging. Adv. Funct. Mater. 2021, 31, 2103186. [Google Scholar] [CrossRef]
  94. Yu, T.; Dai, P.-P.; Xu, J.-J.; Chen, H.-Y. Highly sensitive colorimetric cancer cell detection based on dual signal amplification. ACS Appl. Mater. Interfaces 2016, 8, 4434–4441. [Google Scholar] [CrossRef] [PubMed]
  95. Zhai, J.; Gao, J.; Zhang, J.; Liu, D.; Gao, S.; Yan, Y.; Zhang, K.; Cai, K.; Yu, F.; Lin, M. Concave octahedral PtCu nanoframes mediated synergetic photothermal and chemodynamic tumor therapy. Chem. Eng. J. 2022, 442, 136172. [Google Scholar] [CrossRef]
  96. Ramanathan, S.; Archunan, G.; Sivakumar, M.; Selvan, S.T.; Fred, A.L.; Kumar, S.; Gulyás, B.; Padmanabhan, P. Theranostic applications of nanoparticles in neurodegenerative disorders. Int. J. Nanomed. 2018, 13, 5561. [Google Scholar] [CrossRef] [PubMed]
  97. Karampelas, I.H.; Liu, K.; Alali, F.; Furlani, E.P. Plasmonic Nanoframes for Photothermal Energy Conversion. J. Phys. Chem. C 2016, 120, 7256–7264. [Google Scholar] [CrossRef]
  98. Vu, X.H.; Dien, N.D.; Pham, T.T.H.; Van Truong, N.; Ca, N.X.; Van Thu, V. Tunable LSPR of silver/gold bimetallic nanoframes and their SERS activity for methyl red detection. RSC Adv. 2021, 11, 14596–14606. [Google Scholar] [CrossRef] [PubMed]
  99. Yan, Y.; Cheng, S.; Zhou, P.; Li, H.; Liu, X.; Lin, M.; Xie, F.; Zhang, K.; Zhang, Y.; Zhang, C. Concave octopus-like PtCu nanoframe mediated photo-electro Fenton catalysis for fast organic dyestuff elimination. Nanoscale Adv. 2022, 4, 2782–2786. [Google Scholar] [CrossRef] [PubMed]
  100. Su, T.-y.; Lu, G.-P.; Sun, K.-K.; Zhang, M.; Cai, C. ZIF-derived metal/N-doped porous carbon nanocomposites: Efficient catalysts for organic transformations. Catal. Sci. Technol. 2022, 12, 2106–2121. [Google Scholar] [CrossRef]
  101. Ganjali, F.; Kashtiaray, A.; Zarei-Shokat, S.; Taheri-Ledari, R.; Maleki, A. Functionalized hybrid magnetic catalytic systems on micro-and nanoscale utilized in organic synthesis and degradation of dyes. Nanoscale Adv. 2022, 4, 1263–1307. [Google Scholar] [CrossRef]
  102. Mandal, B.; Panda, J.; Paul, P.K.; Sarkar, R.; Tudu, B. MnFe2O4 decorated reduced graphene oxide heterostructures: Nanophotocatalyst for methylene blue dye degradation. Vacuum 2020, 173, 109–150. [Google Scholar] [CrossRef]
  103. Chen, C.-H.; Liang, Y.-H.; Zhang, W.-D. ZnFe2O4/MWCNTs composite with enhanced photocatalytic activity under visible-light irradiation. J. Alloys Compd. 2010, 501, 168–172. [Google Scholar] [CrossRef]
  104. Dom, R.; Subasri, R.; Radha, K.; Borse, P.H. Synthesis of solar active nanocrystalline ferrite, MFe2O4 (M: Ca, Zn, Mg) photocatalyst by microwave irradiation. Solid State Commun. 2011, 151, 470–473. [Google Scholar] [CrossRef]
  105. Valero-Luna, C.; Palomares-Sanchéz, S.; Ruíz, F. Catalytic activity of the barium hexaferrite with H2O2/visible light irradiation for degradation of Methylene Blue. Catal. Today 2016, 266, 110–119. [Google Scholar] [CrossRef]
  106. Du, Y.; Zheng, Z.; Chang, W.; Liu, C.; Bai, Z.; Zhao, X.; Wang, C. Trace Amounts of Co3O4 Nano-Particles Modified TiO2 Nanorod Arrays for Boosted Photoelectrocatalytic Removal of Organic Pollutants in Water. Nanomaterials 2021, 11, 214. [Google Scholar] [CrossRef] [PubMed]
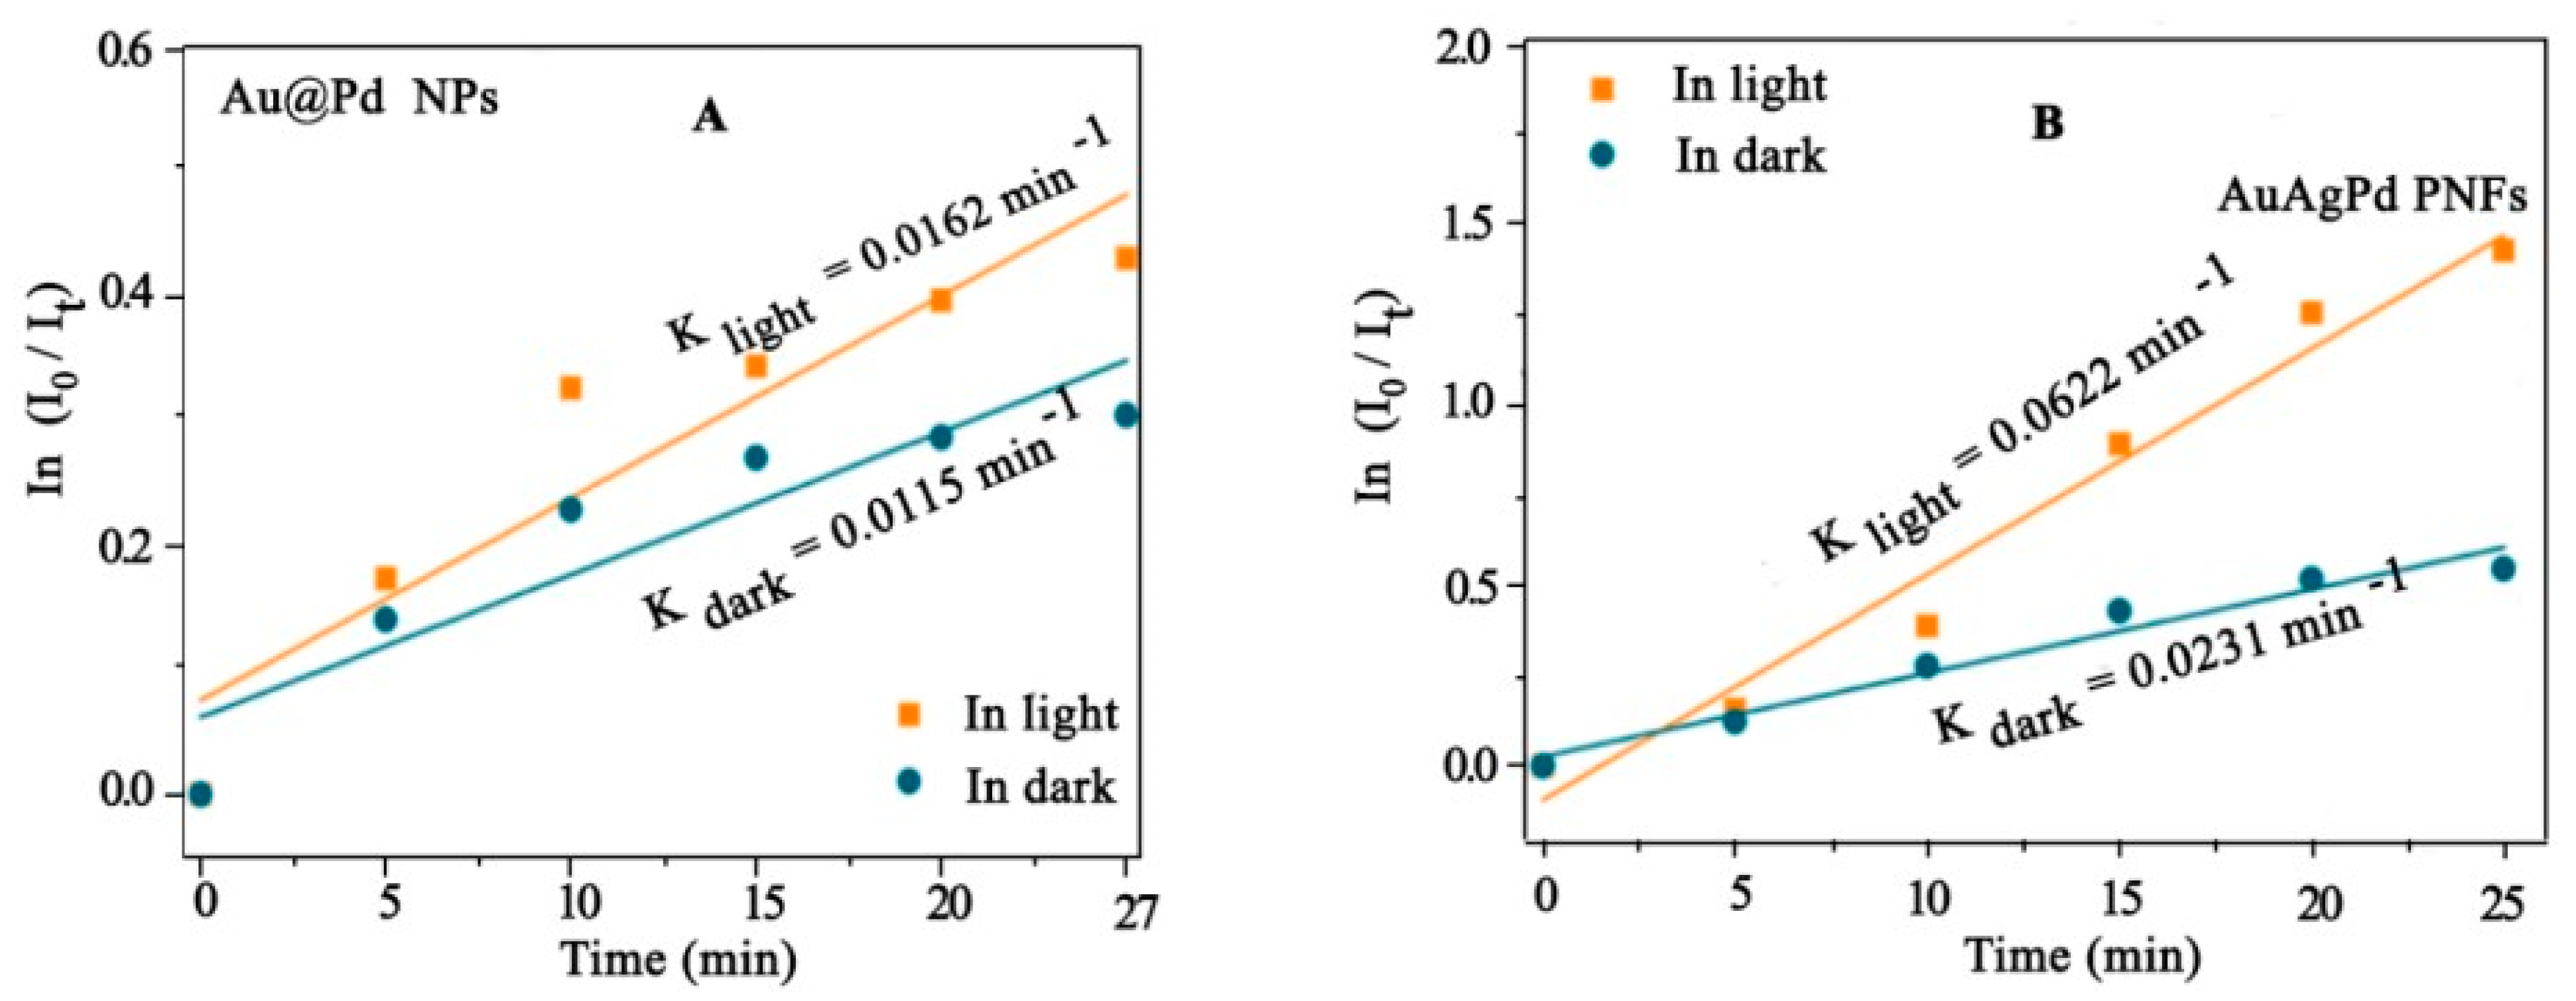
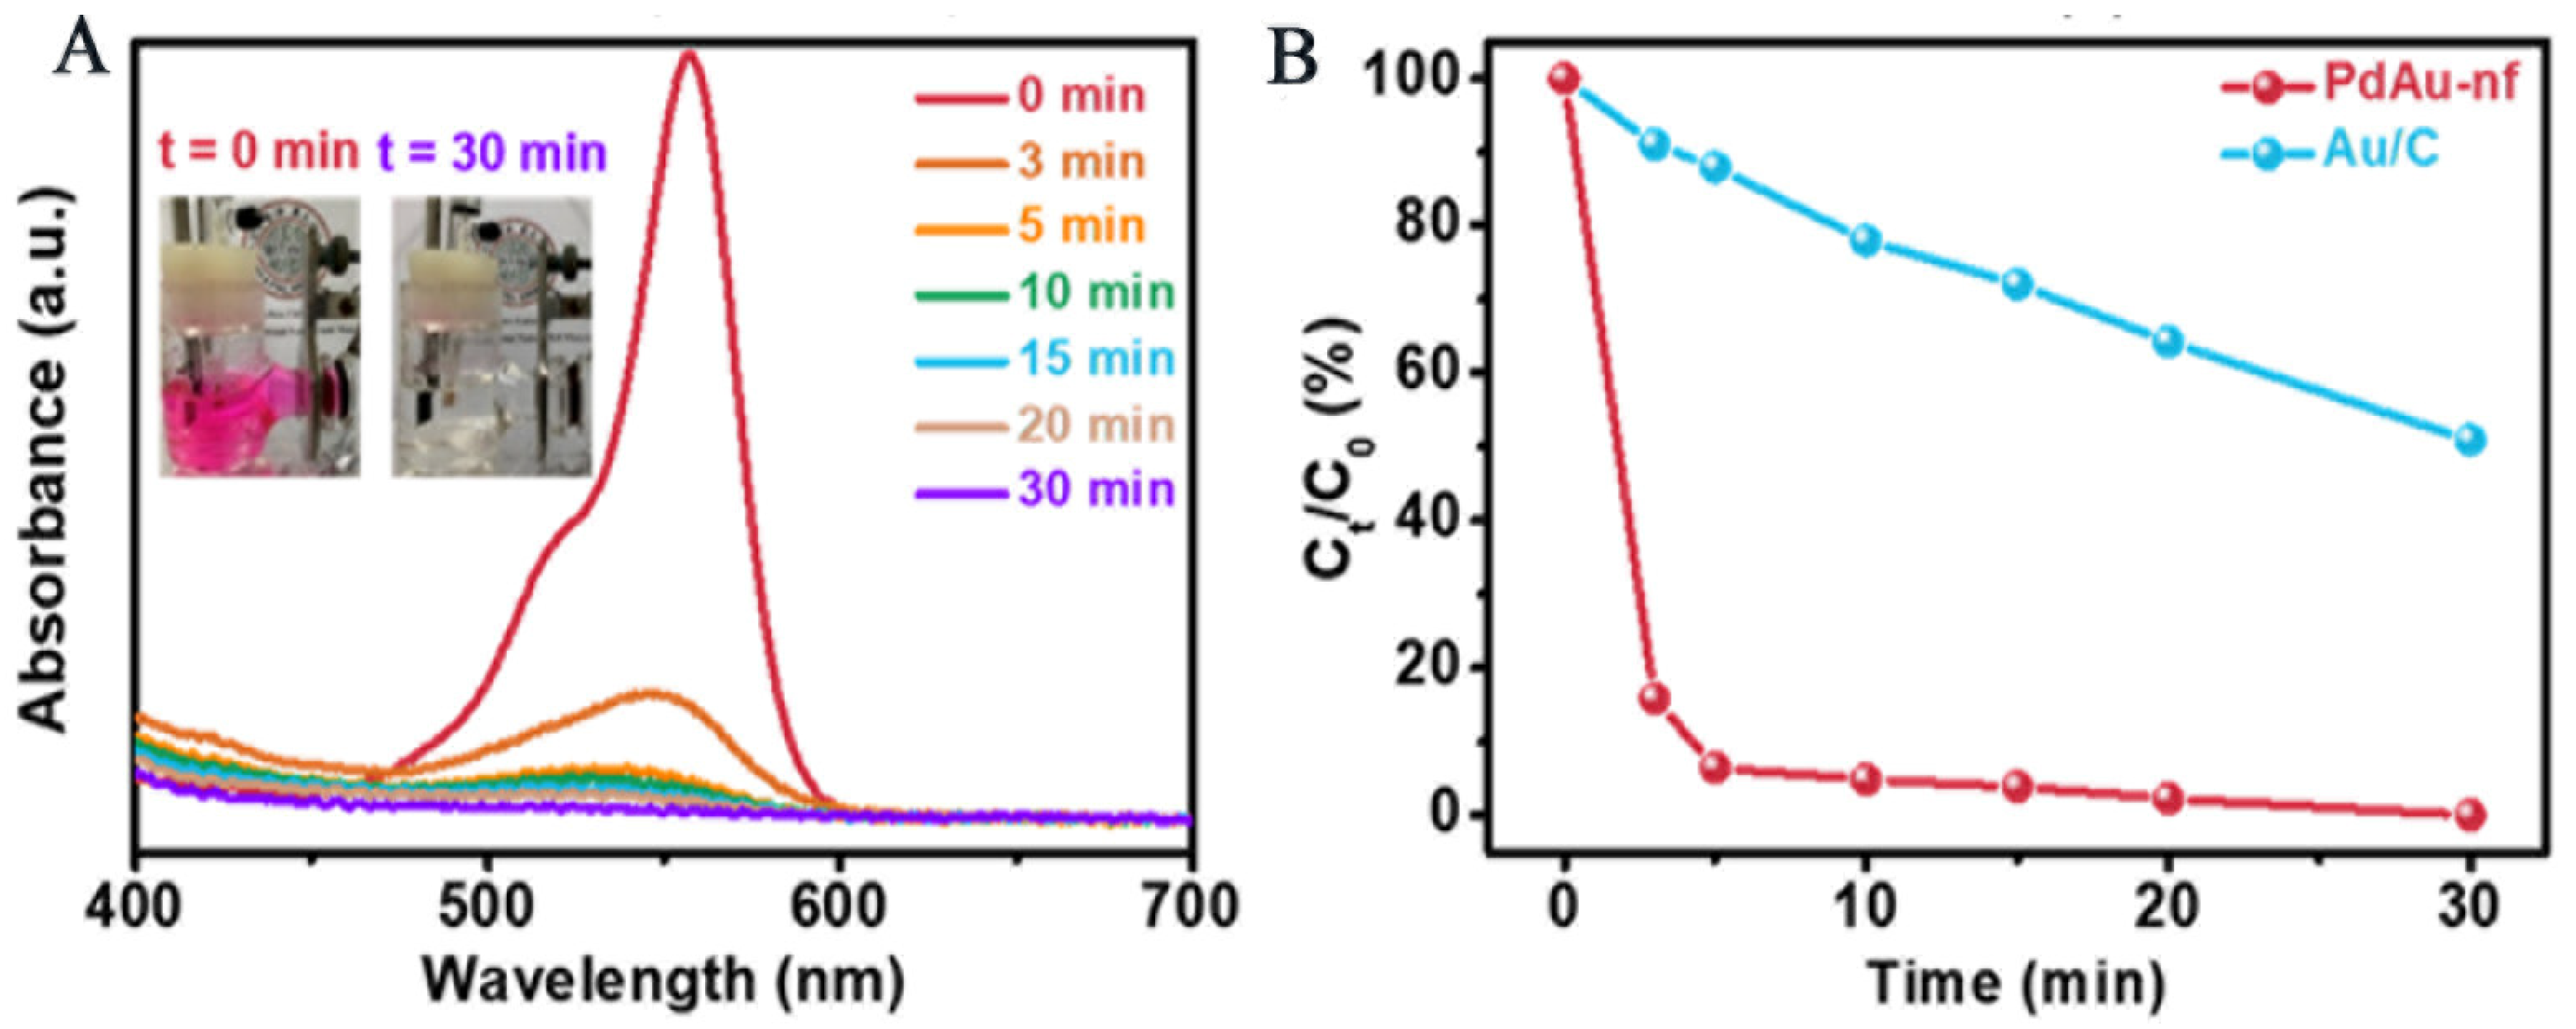
  107. Kong, Y.; Sun, Q.; Zhang, G.; Liu, F.; Liu, M.; Zheng, Y. Stepwise synthesis of polyhedral AuAgPd nanoframes for plasmon-enhanced catalytic reduction of 4-nitrophenol. Mater. Lett. 2022, 325, 132808. [Google Scholar] [CrossRef]
  108. Mostafa, A.M.; Menazea, A.A. Polyvinyl Alcohol/Silver nanoparticles film prepared via pulsed laser ablation: An eco-friendly nano-catalyst for 4-nitrophenol degradation. J. Mol. Struct. 2020, 1212, 128125. [Google Scholar] [CrossRef]
  109. Zhao, X.; Yang, H.; Xu, J.; Cheng, T.; Li, Y. Bimetallic PdAu Nanoframes for Electrochemical H2O2 Production in Acids. ACS Mater. Lett. 2021, 3, 996–1002. [Google Scholar] [CrossRef]
  110. Bai, J.; Wang, K.; Feng, J.; Xiong, S. ZnO/CoO and ZnCo2O4 Hierarchical Bipyramid Nanoframes: Morphology Control, Formation Mechanism, and Their Lithium Storage Properties. ACS Appl. Mater. Interfaces 2015, 7, 22848–22857. [Google Scholar] [CrossRef]
  111. Fang, Y.; Guan, B.Y.; Luan, D.; Lou, X.W. Synthesis of CuS@CoS2 double-shelled nanoboxes with enhanced sodium storage properties. Angew. Chem. 2019, 131, 7821–7825. [Google Scholar] [CrossRef]
  112. Fang, Y.; Luan, D.; Chen, Y.; Gao, S.; Lou, X.W. Synthesis of copper-substituted CoS2@CuxS double-shelled nanoboxes by sequential ion exchange for efficient sodium storage. Angew. Chem. Int. Ed. 2020, 59, 2644–2648. [Google Scholar] [CrossRef]
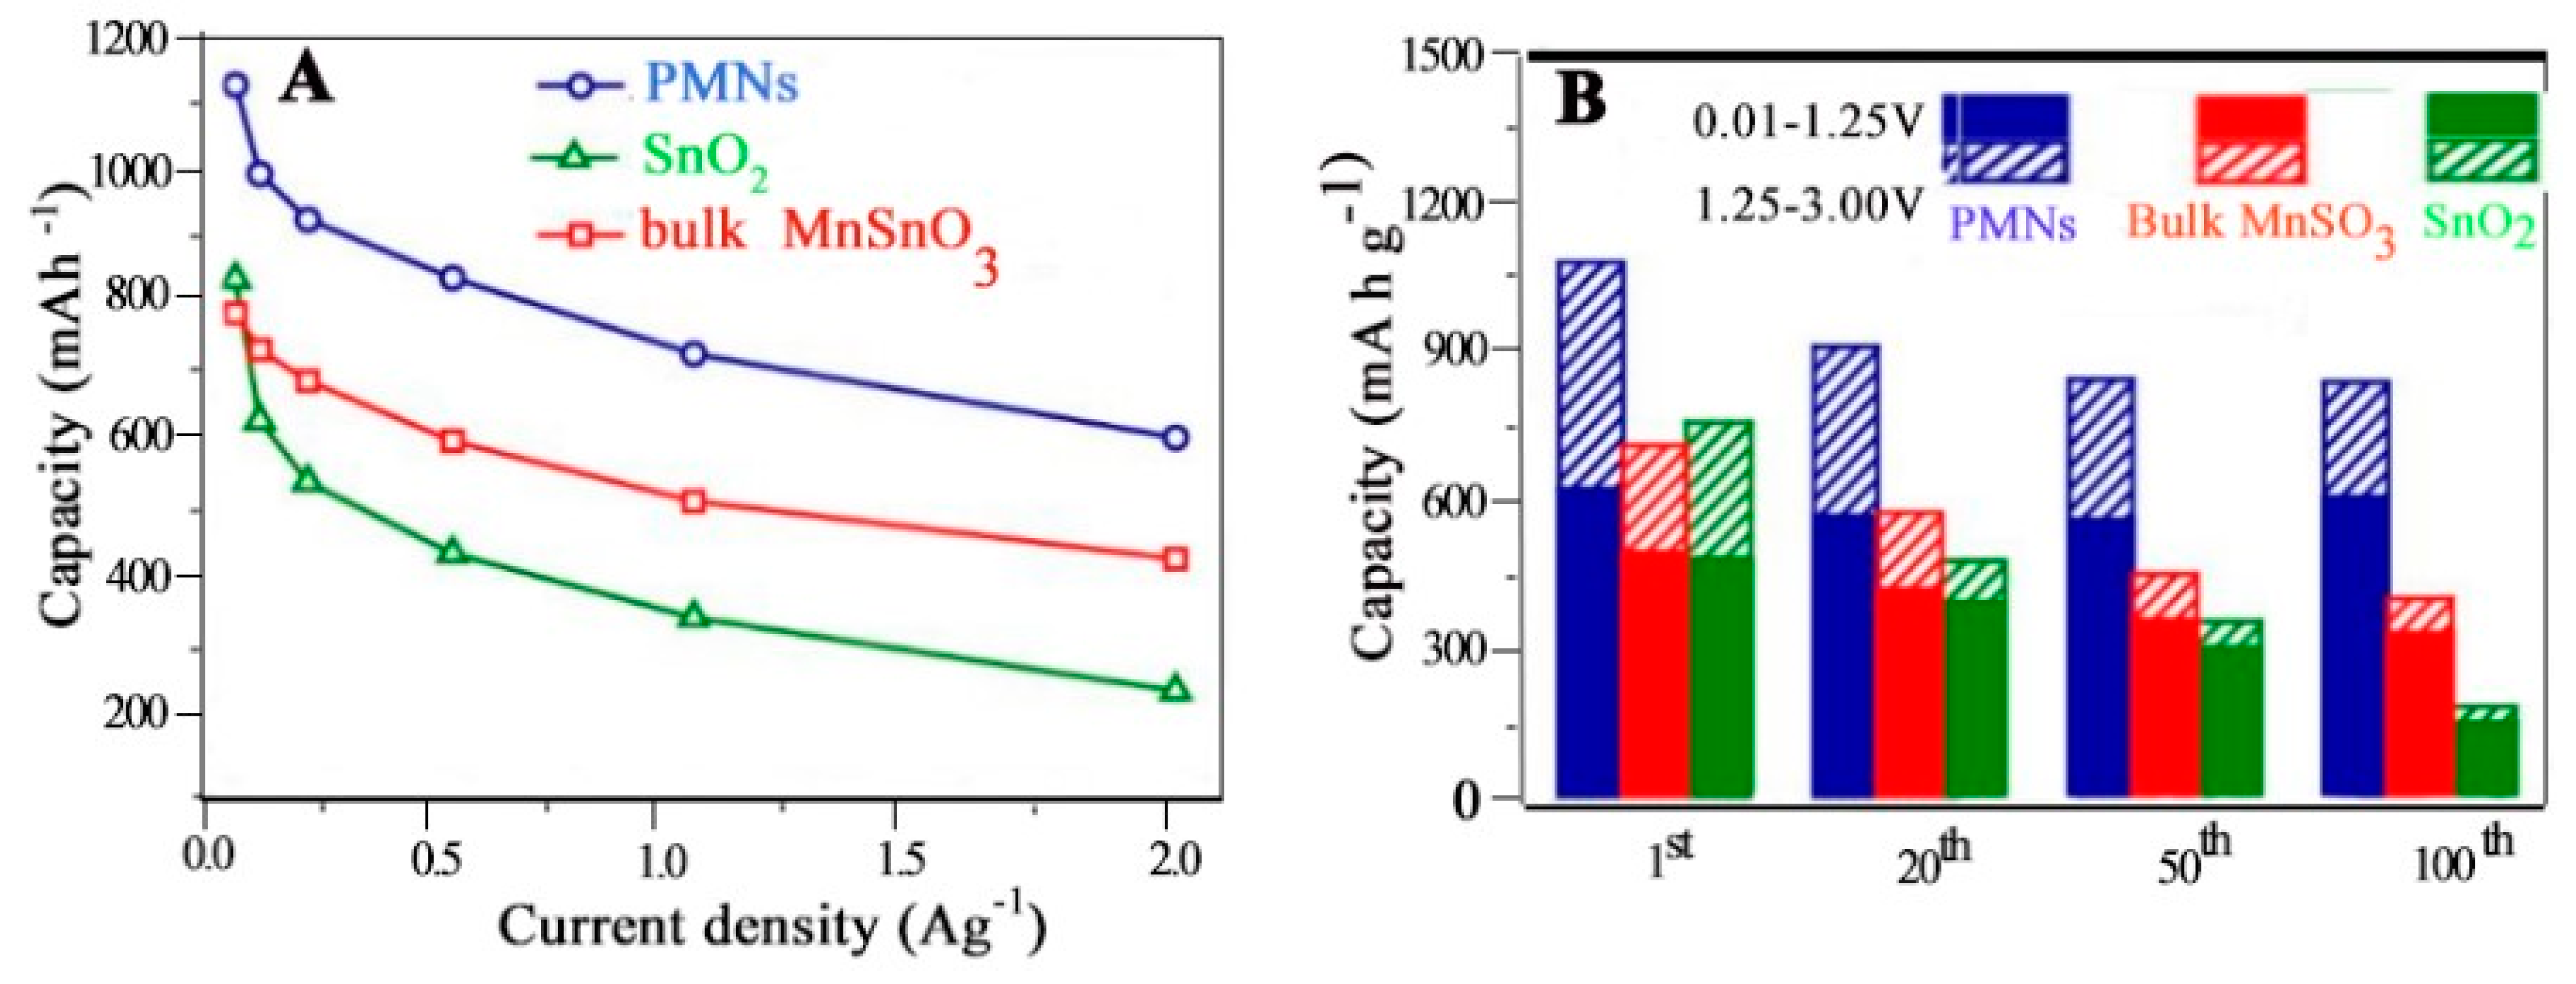
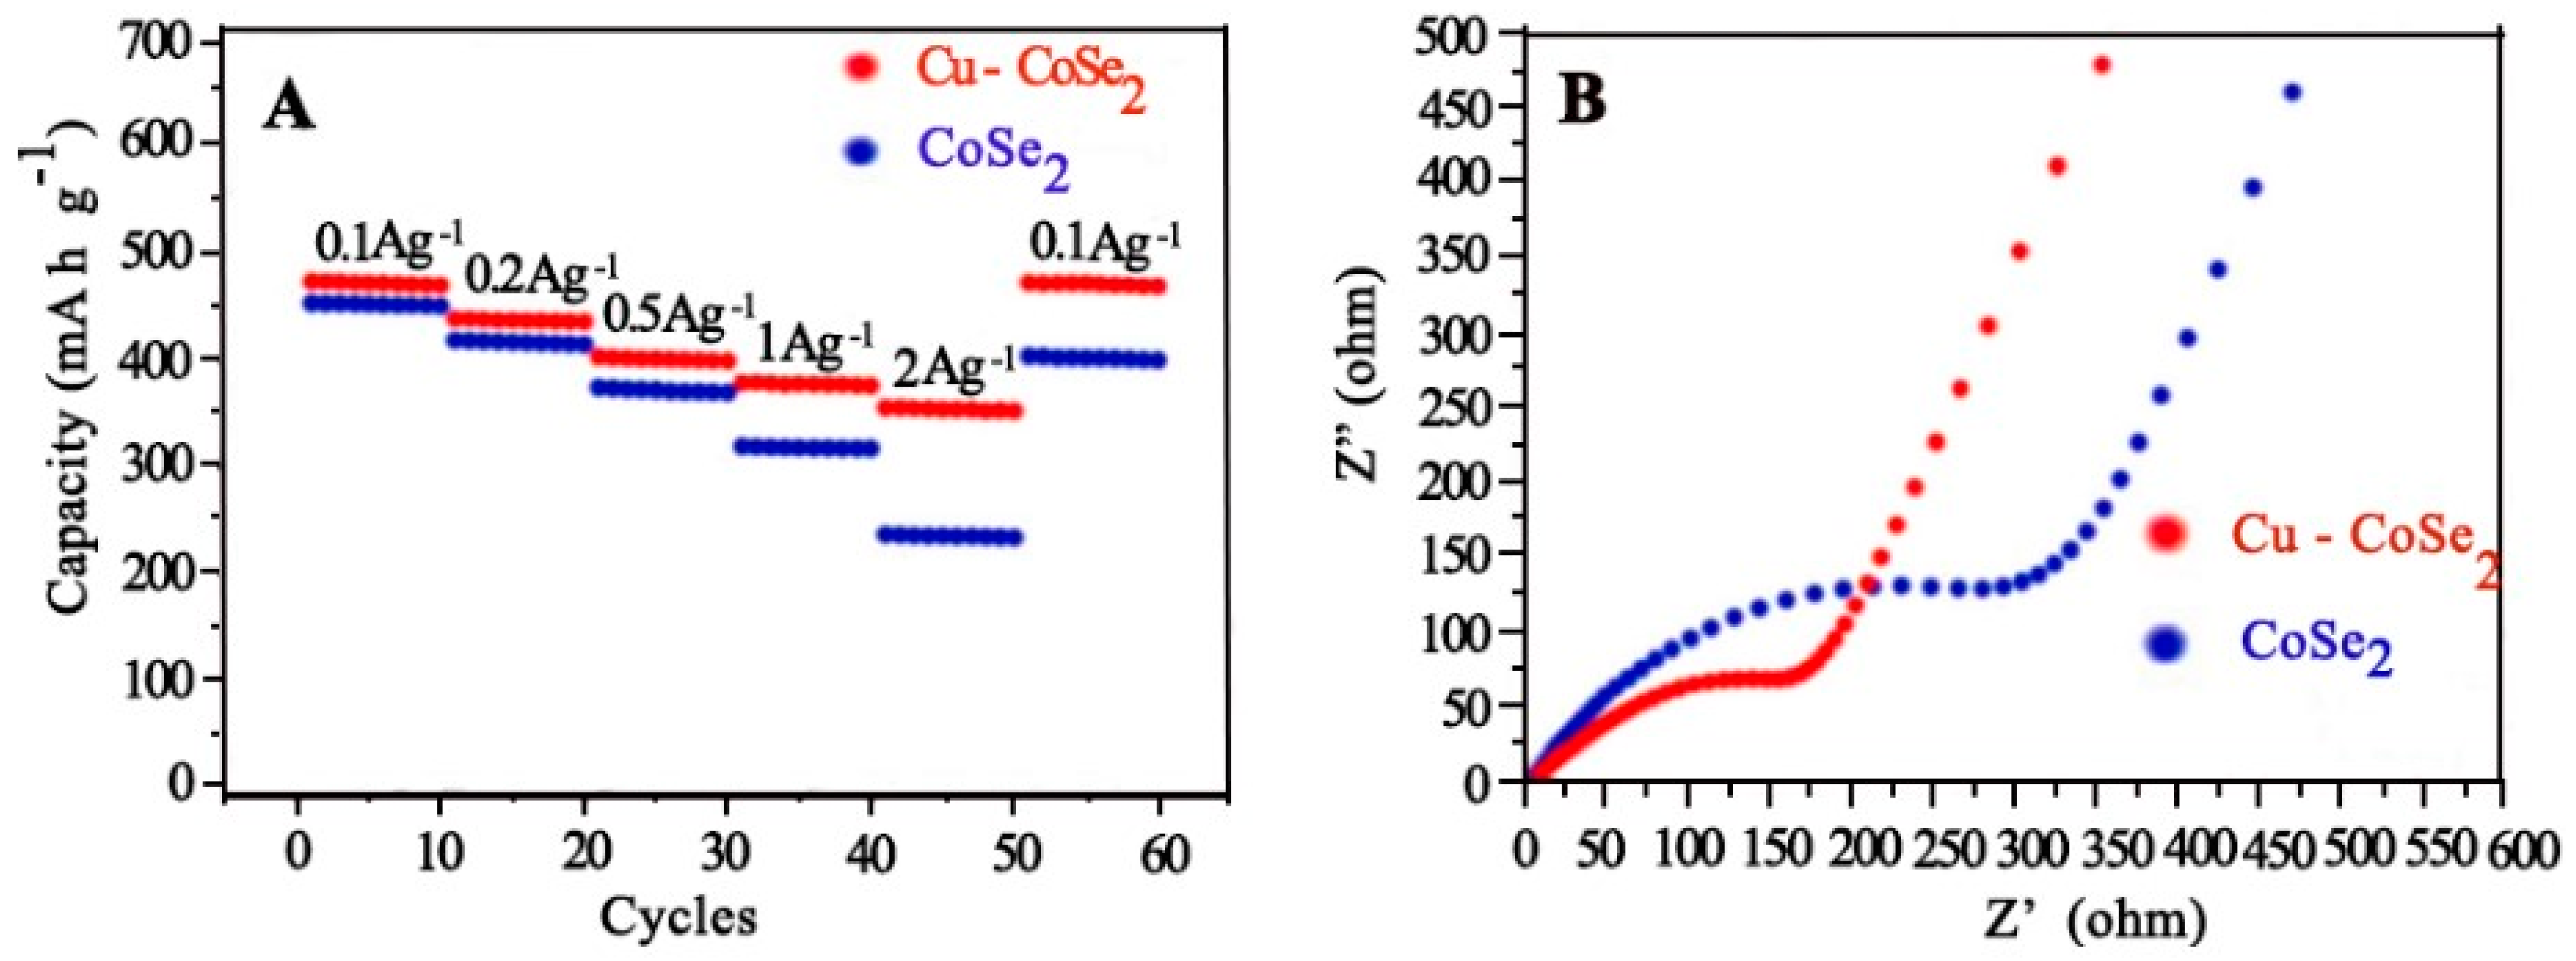
  113. Zhang, L.; Li, H.; Sheng, T.; Chen, J.; Lu, M.; Xu, Y.; Yuan, H.; Zhao, J.; Lu, J. Synthesizing Cu-doped CoSe2 nanoframe cubics for Na-ion batteries electrodes. Colloids Surf. A Physicochem. Eng. Asp. 2021, 628, 127379. [Google Scholar] [CrossRef]
  114. Chen, L.; Yu, H.; Li, W.; Dirican, M.; Liu, Y.; Zhang, X. Interlayer design based on carbon materials for lithium–sulfur batteries: A review. J. Mater. Chem. A 2020, 8, 10709–10735. [Google Scholar] [CrossRef]
  115. Cui, J.; Li, Z.; Wang, G.; Guo, J.; Shao, M. Layered double hydroxides and their derivatives for lithium–sulfur batteries. J. Mater. Chem. A 2020, 8, 23738–23755. [Google Scholar] [CrossRef]
  116. Wang, R.; Tang, W.; Tang, M.; Wu, Q.; Li, J. ZIF-Derived Carbon Nanoframes as a Polysulfide Anchor and Conversion Mediator for High-Performance Lithium–Sulfur Cells. ACS Appl. Mater. Interfaces 2021, 13, 21544–21555. [Google Scholar] [CrossRef] [PubMed]
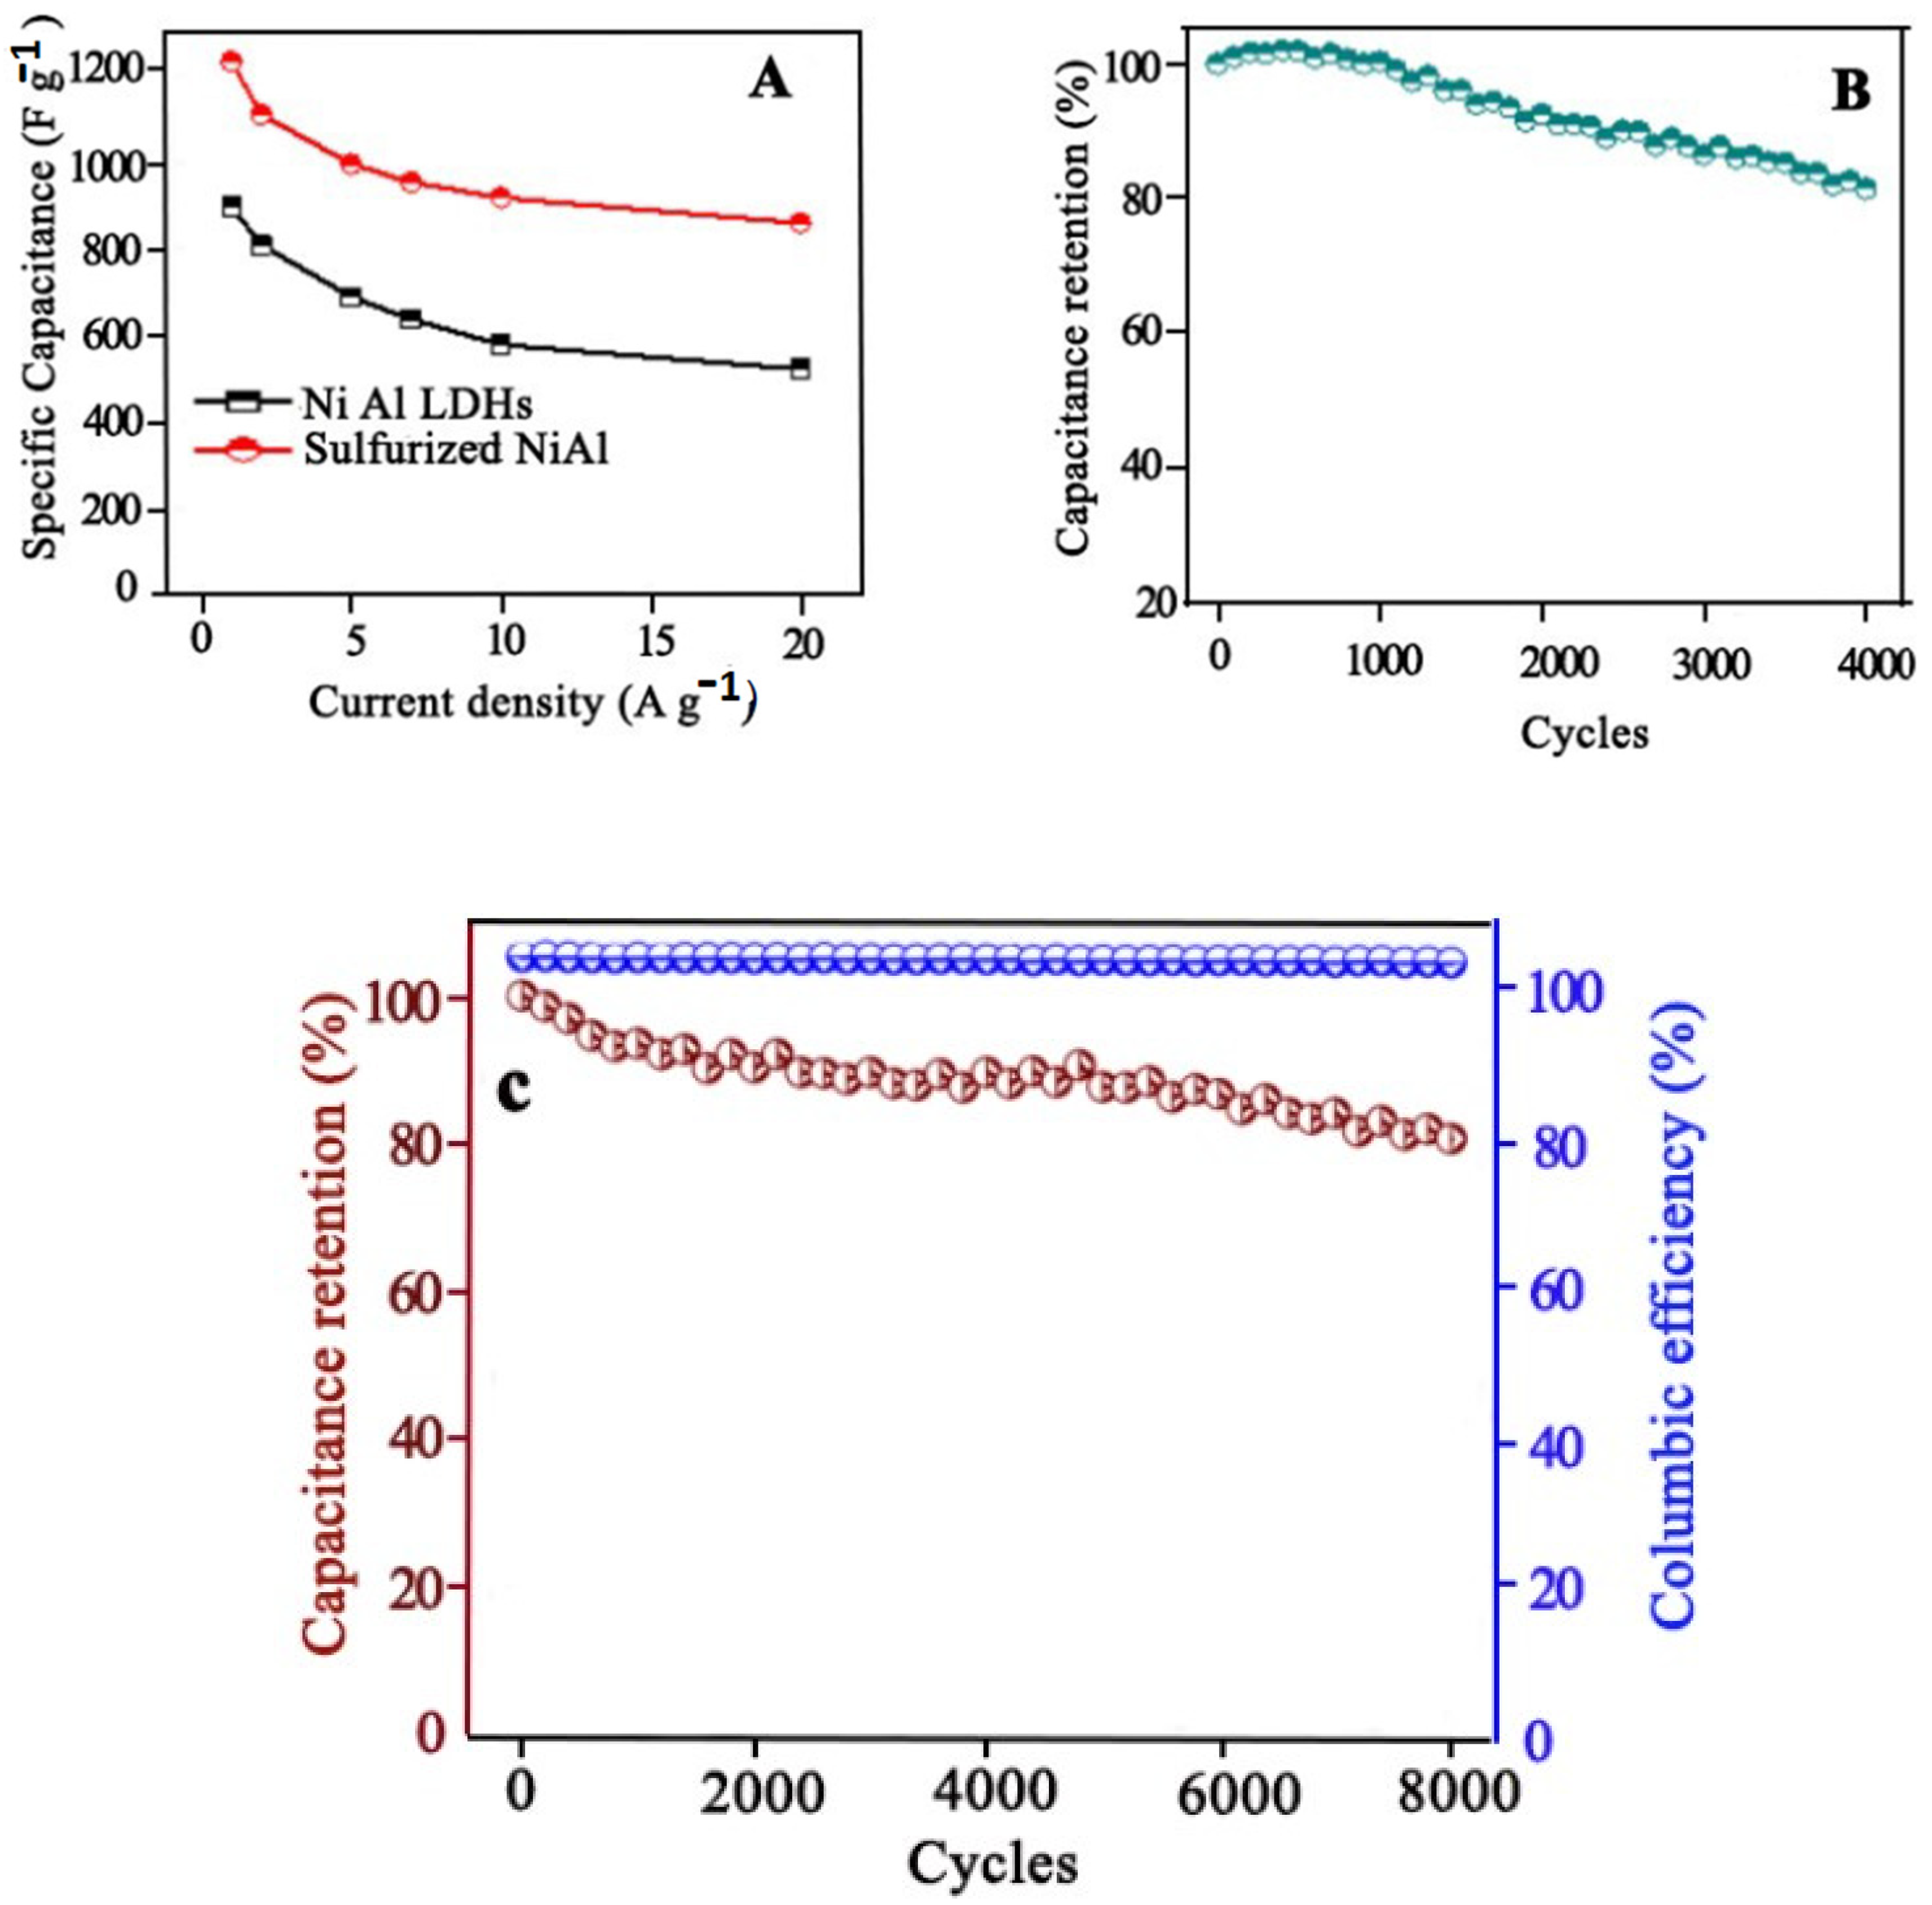
  117. Ahmed, F.; Khalafallah, D.; Zhi, M.; Hong, Z. Porous nanoframes of sulfurized NiAl layered double hydroxides and ternary bismuth cerium sulfide for supercapacitor electrodes. Adv. Compos. Hybrid Mater. 2022, 5, 2500–2514. [Google Scholar] [CrossRef]
  118. Shinde, N.M.; Xia, Q.X.; Yun, J.M.; Mane, R.S.; Kim, K.H. Polycrystalline and mesoporous 3-D Bi2O3 nanostructured negatrodes for high-energy and power-asymmetric supercapacitors: Superfast room-temperature direct wet chemical growth. ACS Appl. Mater. Interfaces 2018, 10, 11037–11047. [Google Scholar] [CrossRef] [PubMed]
  119. Kim, S.J.; Sharma, V.; Kshetri, T.; Kim, N.H.; Lee, J.H. Freestanding binder-free electrodes with nanodisk-needle-like MnCuCo-LTH and Mn1Fe2S2 porous microthorns for high-performance quasi-solid-state supercapacitors. ACS Appl. Mater. Interfaces 2022, 14, 12523–12537. [Google Scholar] [CrossRef]
  120. Fu, F.; Wang, H.; Yang, D.; Qiu, X.; Li, Z.; Qin, Y. Lamellar hierarchical lignin-derived porous carbon activating the capacitive property of polyaniline for high-performance supercapacitors. J. Colloid Interface Sci. 2022, 617, 694–703. [Google Scholar] [CrossRef]
  121. Yan, M.; Yao, Y.; Wen, J.; Long, L.; Kong, M.; Zhang, G.; Liao, X.; Yin, G.; Huang, Z. Construction of a hierarchical NiCo2S4@PPy core–shell heterostructure nanotube array on Ni foam for a high-performance asymmetric supercapacitor. ACS Appl. Mater. Interfaces 2016, 8, 24525–24535. [Google Scholar] [CrossRef]
  122. Zhang, L.; Liu, T.; Liu, K.; Han, L.; Yin, Y.; Gao, C. Gold Nanoframes by Nonepitaxial Growth of Au on AgI Nanocrystals for Surface-Enhanced Raman Spectroscopy. Nano Lett. 2015, 15, 4448–4454. [Google Scholar] [CrossRef]
  123. Go, S.; Yoo, S.; Son, J.; Lee, S.; Lee, J.; Lee, S.; Kim, J.; Park, M.; Park, W.; Kim, J.-M.; et al. Ring-in-a-Triangle Nanoframes: Integrating with Intra- and Interhotspots for Highly Amplified Near-Field Focusing. Nano Lett. 2022, 22, 1734–1740. [Google Scholar] [CrossRef] [PubMed]
  124. Chen, S.; Li, M.; Gao, M.; Jin, J.; van Spronsen, M.A.; Salmeron, M.B.; Yang, P. High-Performance Pt–Co Nanoframes for Fuel-Cell Electrocatalysis. Nano Lett. 2020, 20, 1974–1979. [Google Scholar] [CrossRef] [PubMed]
  125. Kim, D.; Lee, J.; Yoo, S.; Choi, S.; Park, D.; Park, S. Quantitative Surface-Enhanced Raman Spectroscopy Analysis through 3D Superlattice Arrays of Au Nanoframes with Attomolar Detection. Anal. Chem. 2020, 92, 1972–1977. [Google Scholar] [CrossRef]
  126. Luo, N.; Chen, Y.; Zhang, D.; Guo, M.; Xue, Z.; Wang, X.; Cheng, Z.; Xu, J. High-Sensitive MEMS Hydrogen Sulfide Sensor made from PdRh Bimetal Hollow Nanoframe Decorated Metal Oxides and Sensitization Mechanism Study. ACS Appl. Mater. Interfaces 2020, 12, 56203–56215. [Google Scholar] [CrossRef]
  127. Zhou, Q.; Yan, S.; Zhang, L. Fe-doped MOF-derived N-rich porous carbon nanoframe for H2S cataluminescence sensing. Luminescence 2022, 37, 1135–1144. [Google Scholar] [CrossRef] [PubMed]
  128. Bian, Y.; Li, L.; Song, H.; Su, Y.; Lv, Y. Porous boron nitride: A novel metal-free cataluminescence material for high performance H2S sensing. Sens. Actuators B Chem. 2021, 332, 129512. [Google Scholar] [CrossRef]
  129. Wu, L.; Zhang, L.; Sun, M.; Liu, R.; Yu, L.; Lv, Y. Metal-free cataluminescence gas sensor for hydrogen sulfide based on its catalytic oxidation on silicon carbide nanocages. Anal. Chem. 2017, 89, 13666–13672. [Google Scholar] [CrossRef]
  130. Zhang, Z.; Jiang, H.; Xing, Z.; Zhang, X. A highly selective chemiluminescent H2S sensor. Sens. Actuators B Chem. 2004, 102, 155–161. [Google Scholar] [CrossRef]
  131. Pu, S.; Pan, Y.; Zhang, L.; Lv, Y. Recent advances in chemiluminescence and cataluminescence for the detection of volatile sulfur compounds. Appl. Spectrosc. Rev. 2021, 58, 401–427. [Google Scholar] [CrossRef]
  132. Hu, Y.; Li, L.; Zhang, L.; Lv, Y. Dielectric barrier discharge plasma-assisted fabrication of g-C3N4-Mn3O4 composite for high-performance cataluminescence H2S gas sensor. Sens. Actuators B Chem. 2017, 239, 1177–1184. [Google Scholar] [CrossRef]
  133. Zeng, B.; Zhang, L.; Wan, X.; Song, H.; Lv, Y. Fabrication of α-Fe2O3/g-C3N4 composites for cataluminescence sensing of H2S. Sens. Actuators B Chem. 2015, 211, 370–376. [Google Scholar] [CrossRef]
  134. Liang, S.; Zhong, X.; Zhong, Z.; Han, B.; Chen, W.; Song, K.; Deng, H.; Lin, Z. Biomimetic inspired porphyrin-based nanoframes for highly efficient photocatalytic CO2 reduction. Chem. Eng. J. 2021, 411, 128414. [Google Scholar] [CrossRef]
  135. Chen, X.; Ma, D.-D.; Chen, B.; Zhang, K.; Zou, R.; Wu, X.-T.; Zhu, Q.-L. Metal–organic framework-derived mesoporous carbon nanoframes embedded with atomically dispersed Fe–Nx active sites for efficient bifunctional oxygen and carbon dioxide electroreduction. Appl. Catal. B Environ. 2020, 267, 118720. [Google Scholar] [CrossRef]
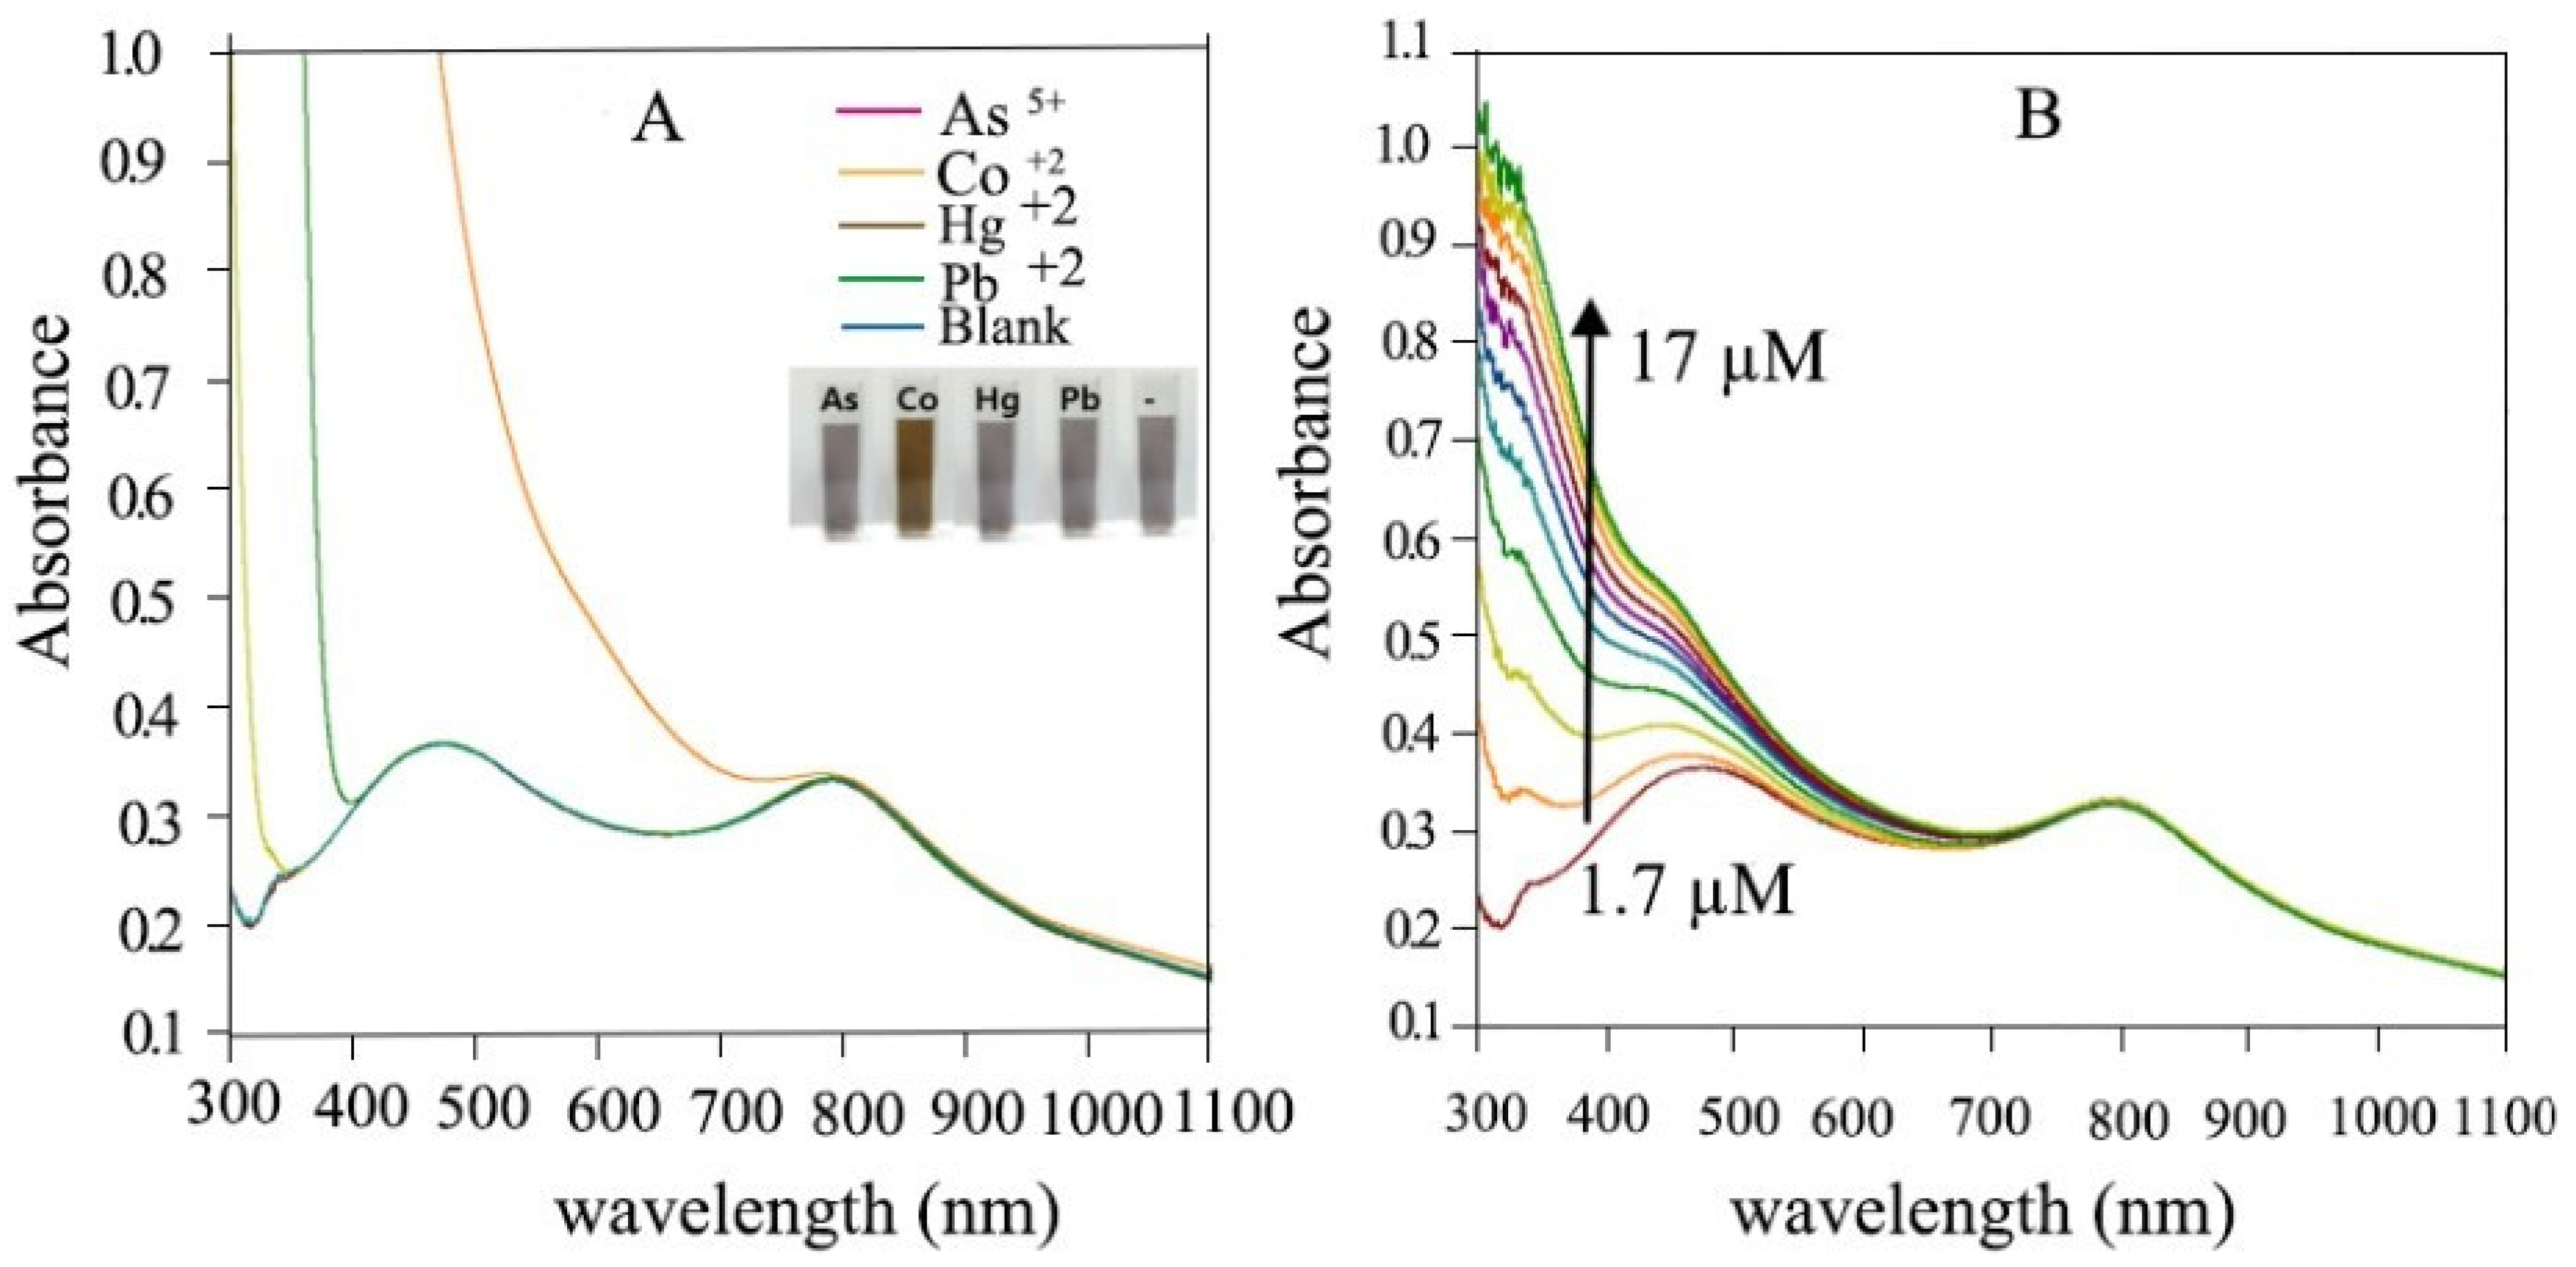
  136. Lee, H.; Sung, H.K.; Park, C.; Kim, Y. Bimetallic Au/Ag nanoframes as spectator for Co2+ ion. J. Ind. Eng. Chem. 2017, 48, 235–241. [Google Scholar] [CrossRef]
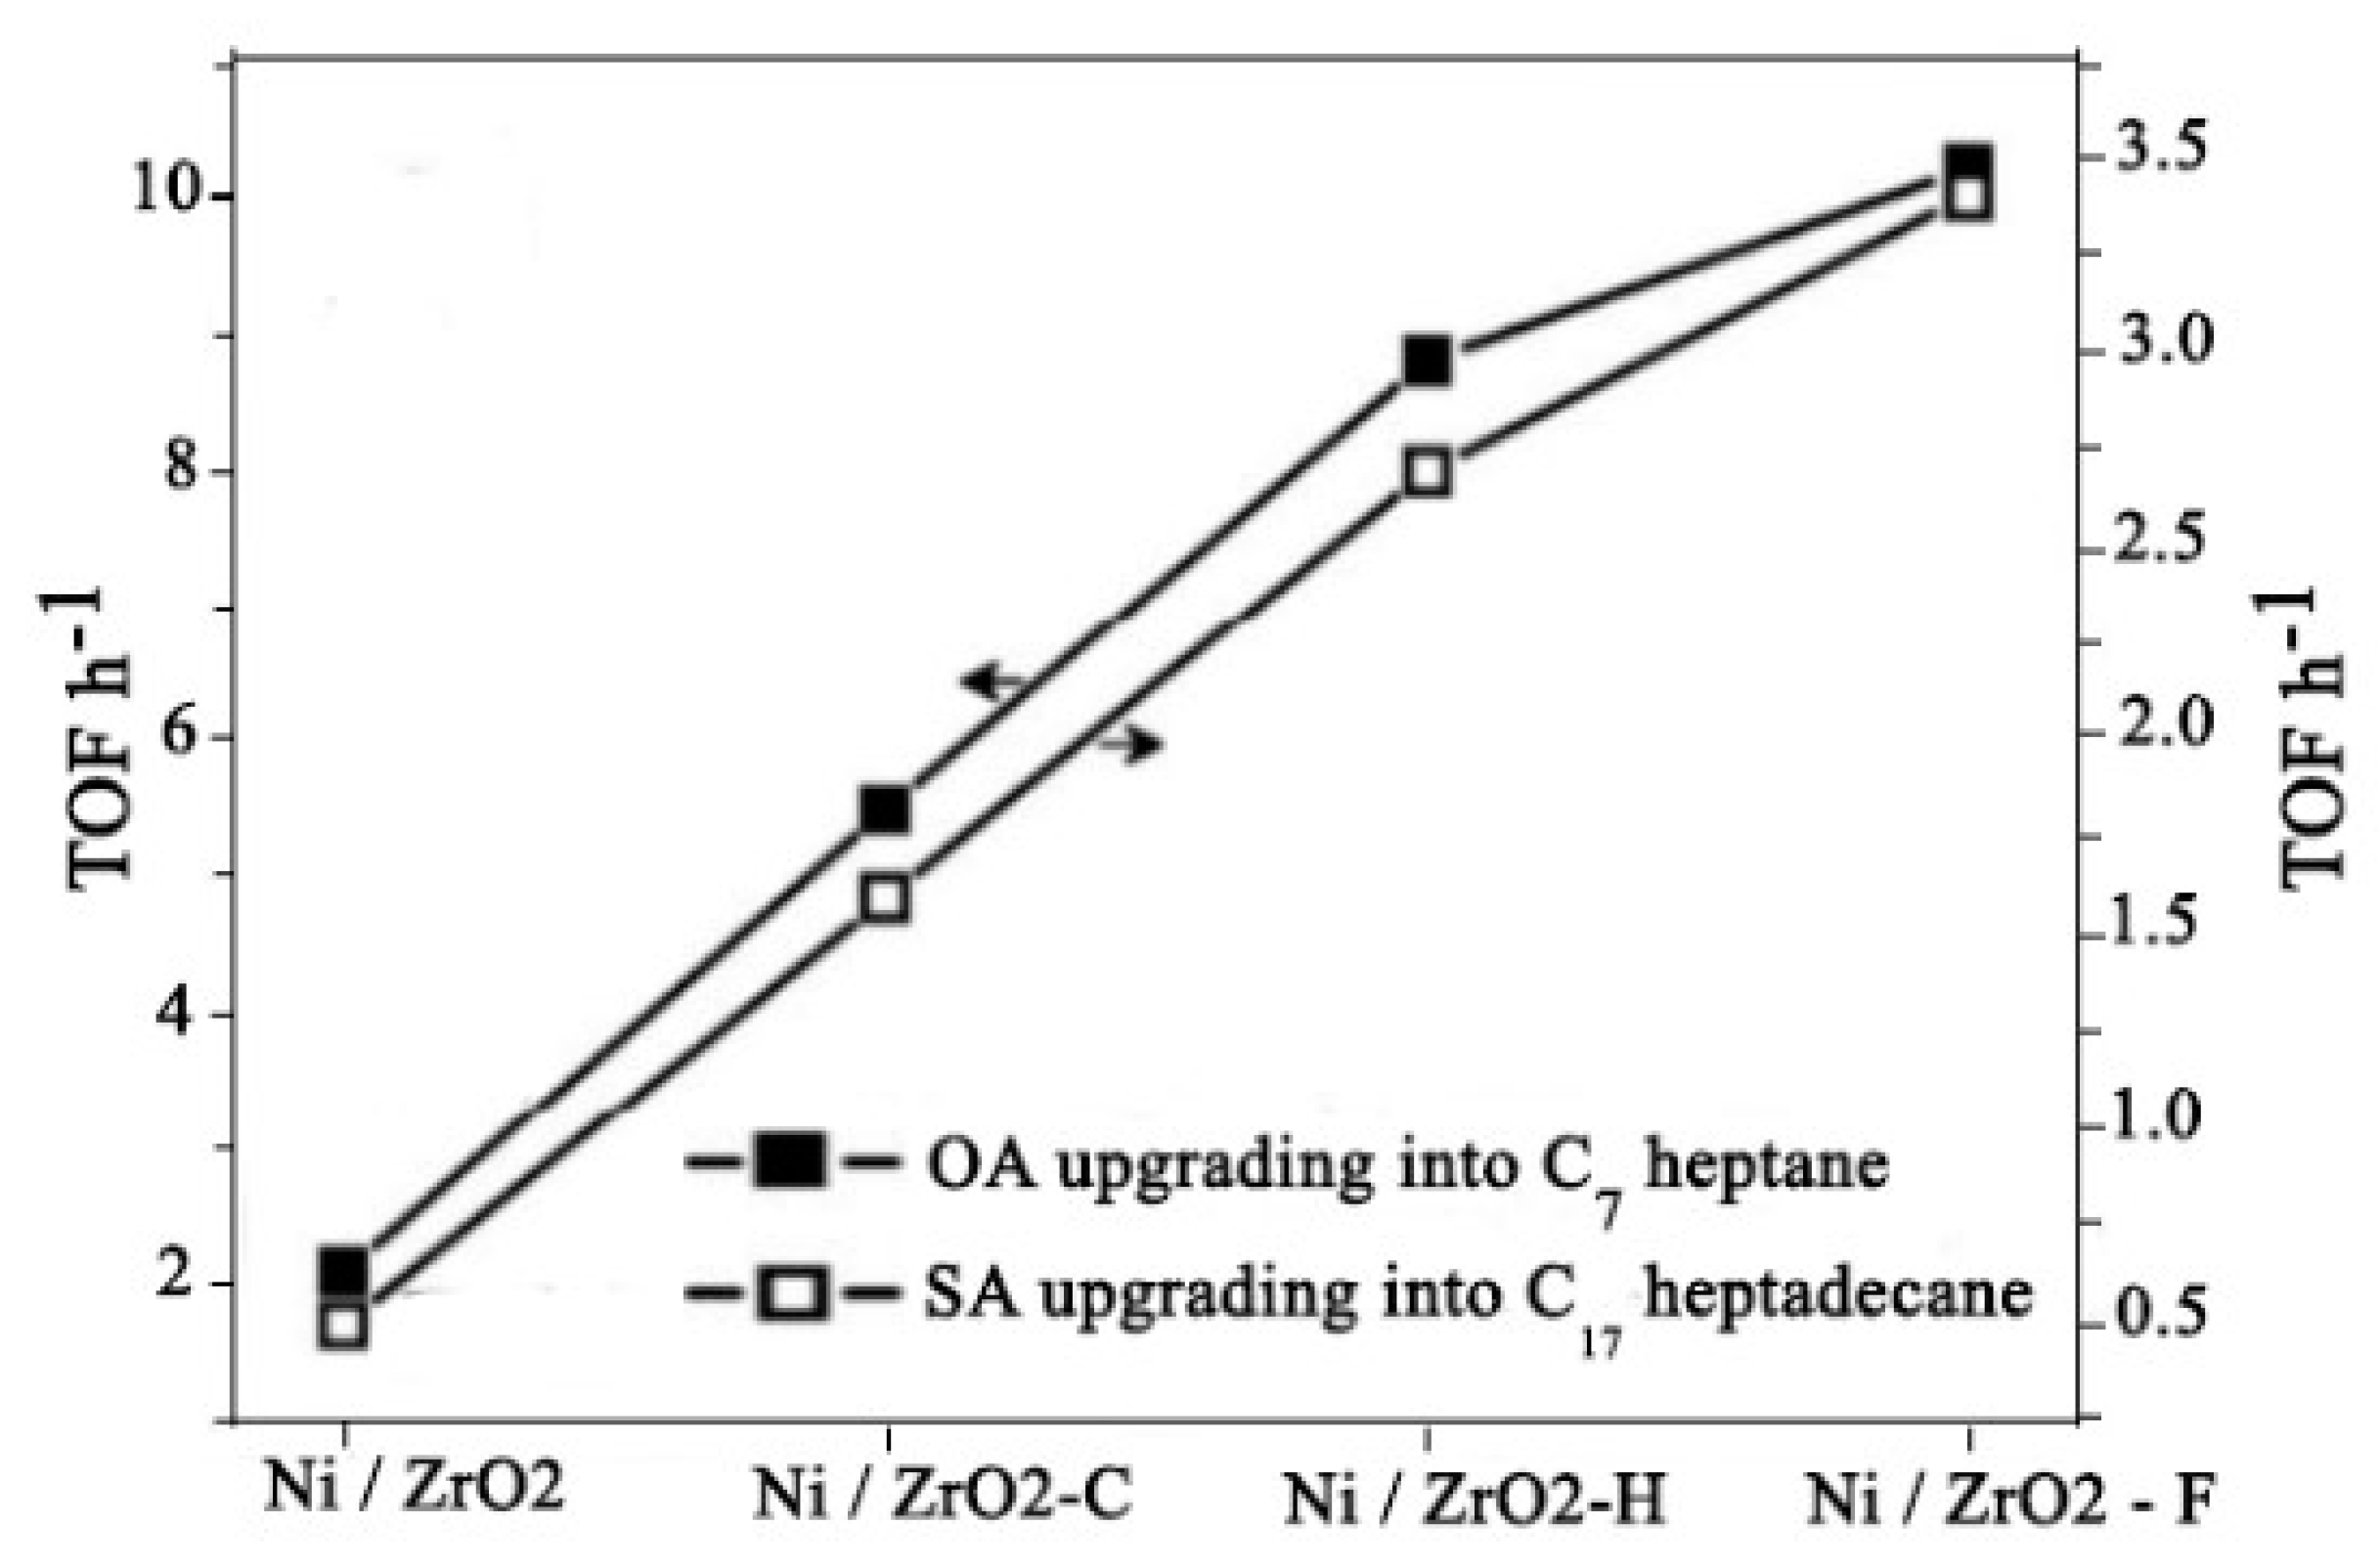
  137. Wang, H.; Chen, H.; Ni, B.; Wang, K.; He, T.; Wu, Y.; Wang, X. Mesoporous ZrO2 Nanoframes for Biomass Upgrading. ACS Appl. Mater. Interfaces 2017, 9, 26897–26906. [Google Scholar] [CrossRef] [PubMed]
  138. Zhang, H.; Tan, J.; Yang, X.; Ma, Y.; Zou, H.; Wang, Y.; Zhang, P.; Zheng, Y. Size-Tunable Yolk–Shell Gold–Silver Nanostructures for Photothermal Treatment of Multidrug-Resistant Bacteria. ACS Appl. Nano Mater. 2022, 5, 10818–10828. [Google Scholar] [CrossRef]
  139. Dreaden, E.C.; Alkilany, A.M.; Huang, X.; Murphy, C.J.; El-Sayed, M.A. The golden age: Gold nanoparticles for biomedicine. Chem. Soc. Rev. 2012, 41, 2740–2779. [Google Scholar] [CrossRef] [PubMed]
  140. Liu, P.; Wu, Y.; Mehrjou, B.; Tang, K.; Wang, G.; Chu, P.K. Versatile Phenol-Incorporated Nanoframes for In Situ Antibacterial Activity Based on Oxidative and Physical Damages. Adv. Funct. Mater. 2022, 32, 2110635. [Google Scholar] [CrossRef]
  141. Hilal, H.; Zhao, Q.; Kim, J.; Lee, S.; Haddadnezhad, M.; Yoo, S.; Lee, S.; Park, W.; Park, W.; Lee, J. Three-dimensional nanoframes with dual rims as nanoprobes for biosensing. Nat. Commun. 2022, 13, 4813. [Google Scholar] [CrossRef]
  142. Liu, X.-L.; Wang, J.-H.; Liang, S.; Yang, D.-J.; Nan, F.; Ding, S.-J.; Zhou, L.; Hao, Z.-H.; Wang, Q.-Q. Tuning plasmon resonance of gold nanostars for enhancements of nonlinear optical response and Raman scattering. J. Phys. Chem. C 2014, 118, 9659–9664. [Google Scholar] [CrossRef]
  143. Chiu, W.-T.; Chang, T.-F.M.; Sone, M.; Tixier-Mita, A.; Toshiyoshi, H. Electrocatalytic activity enhancement of Au NPs-TiO2 electrode via a facile redistribution process towards the non-enzymatic glucose sensors. Sens. Actuators B Chem. 2020, 319, 128279. [Google Scholar] [CrossRef]
  144. Madriz, L.; Tatá, J.; Carvajal, D.; Núñez, O.; Scharifker, B.R.; Mostany, J.; Borrás, C.; Cabrerizo, F.M.; Vargas, R. Photocatalysis and photoelectrochemical glucose oxidation on Bi2WO6: Conditions for the concomitant H2 production. Renew. Energy 2020, 152, 974–983. [Google Scholar] [CrossRef]
  145. Yang, Y.; Chen, H.; Zou, X.; Shi, X.-L.; Liu, W.-D.; Feng, L.; Suo, G.; Hou, X.; Ye, X.; Zhang, L.; et al. Flexible Carbon-Fiber/Semimetal Bi Nanosheet Arrays as Separable and Recyclable Plasmonic Photocatalysts and Photoelectrocatalysts. ACS Appl. Mater. Interfaces 2020, 12, 24845–24854. [Google Scholar] [CrossRef]
  146. Wang, C.; Nie, X.-G.; Shi, Y.; Zhou, Y.; Xu, J.-J.; Xia, X.-H.; Chen, H.-Y. Direct Plasmon-Accelerated Electrochemical Reaction on Gold Nanoparticles. ACS Nano 2017, 11, 5897–5905. [Google Scholar] [CrossRef] [PubMed]
  147. Tian, Y.; Cui, Q.; Xu, L.; Jiao, A.; Ma, H.; Wang, C.; Zhang, M.; Wang, X.; Li, S.; Chen, M. Alloyed AuPt nanoframes loaded on h-BN nanosheets as an ingenious ultrasensitive near-infrared photoelectrochemical biosensor for accurate monitoring glucose in human tears. Biosens. Bioelectron. 2021, 192, 113490. [Google Scholar] [CrossRef] [PubMed]
  148. Toi, P.T.; Trung, T.Q.; Dang, T.M.L.; Bae, C.W.; Lee, N.-E. Highly Electrocatalytic, Durable, and Stretchable Nanohybrid Fiber for On-Body Sweat Glucose Detection. ACS Appl. Mater. Interfaces 2019, 11, 10707–10717. [Google Scholar] [CrossRef]
  149. Koskun, Y.; Şavk, A.; Şen, B.; Şen, F. Highly sensitive glucose sensor based on monodisperse palladium nickel/activated carbon nanocomposites. Anal. Chim. Acta 2018, 1010, 37–43. [Google Scholar] [CrossRef] [PubMed]
  150. Wang, L.; Zhu, W.; Lu, W.; Shi, L.; Wang, R.; Pang, R.; Cao, Y.; Wang, F.; Xu, X. One-step electrodeposition of AuNi nanodendrite arrays as photoelectrochemical biosensors for glucose and hydrogen peroxide detection. Biosens. Bioelectron. 2019, 142, 111577. [Google Scholar] [CrossRef]
  151. Alotaibi, I.; Abido, M.A.; Khalid, M.; Savkin, A.V. A Comprehensive Review of Recent Advances in Smart Grids: A Sustainable Future with Renewable Energy Resources. Energies 2020, 13, 6269. [Google Scholar] [CrossRef]
  152. Shen, Q.; Xue, J.; Li, Y.; Gao, G.; Li, Q.; Liu, X.; Jia, H.; Xu, B.; Wu, Y.; Dillon, S.J. Construction of CdSe polymorphic junctions with coherent interface for enhanced photoelectrocatalytic hydrogen generation. Appl. Catal. B Environ. 2021, 282, 119552. [Google Scholar] [CrossRef]
  153. Li, Y.; Chang, H.; Wang, Z.; Shen, Q.; Liu, X.; Xue, J.; Jia, H. A 3D C@TiO2 multishell nanoframe for simultaneous photothermal catalytic hydrogen generation and organic pollutant degradation. J. Colloid Interface Sci. 2022, 609, 535–546. [Google Scholar] [CrossRef] [PubMed]
  154. Ye, S.; Shi, W.; Liu, Y.; Li, D.; Yin, H.; Chi, H.; Luo, Y.; Ta, N.; Fan, F.; Wang, X.; et al. Unassisted Photoelectrochemical Cell with Multimediator Modulation for Solar Water Splitting Exceeding 4% Solar-to-Hydrogen Efficiency. J. Am. Chem. Soc. 2021, 143, 12499–12508. [Google Scholar] [CrossRef] [PubMed]
  155. Wang, Q.; Domen, K. Particulate Photocatalysts for Light-Driven Water Splitting: Mechanisms, Challenges, and Design Strategies. Am. Chem. Soc. 2020, 120, 919–985. [Google Scholar] [CrossRef] [PubMed]
  156. Chen, T.; Liu, L.; Hu, C.; Huang, H. Recent advances on Bi2WO6-based photocatalysts for environmental and energy applications. Chin. J. Catal. 2021, 42, 1413–1438. [Google Scholar] [CrossRef]
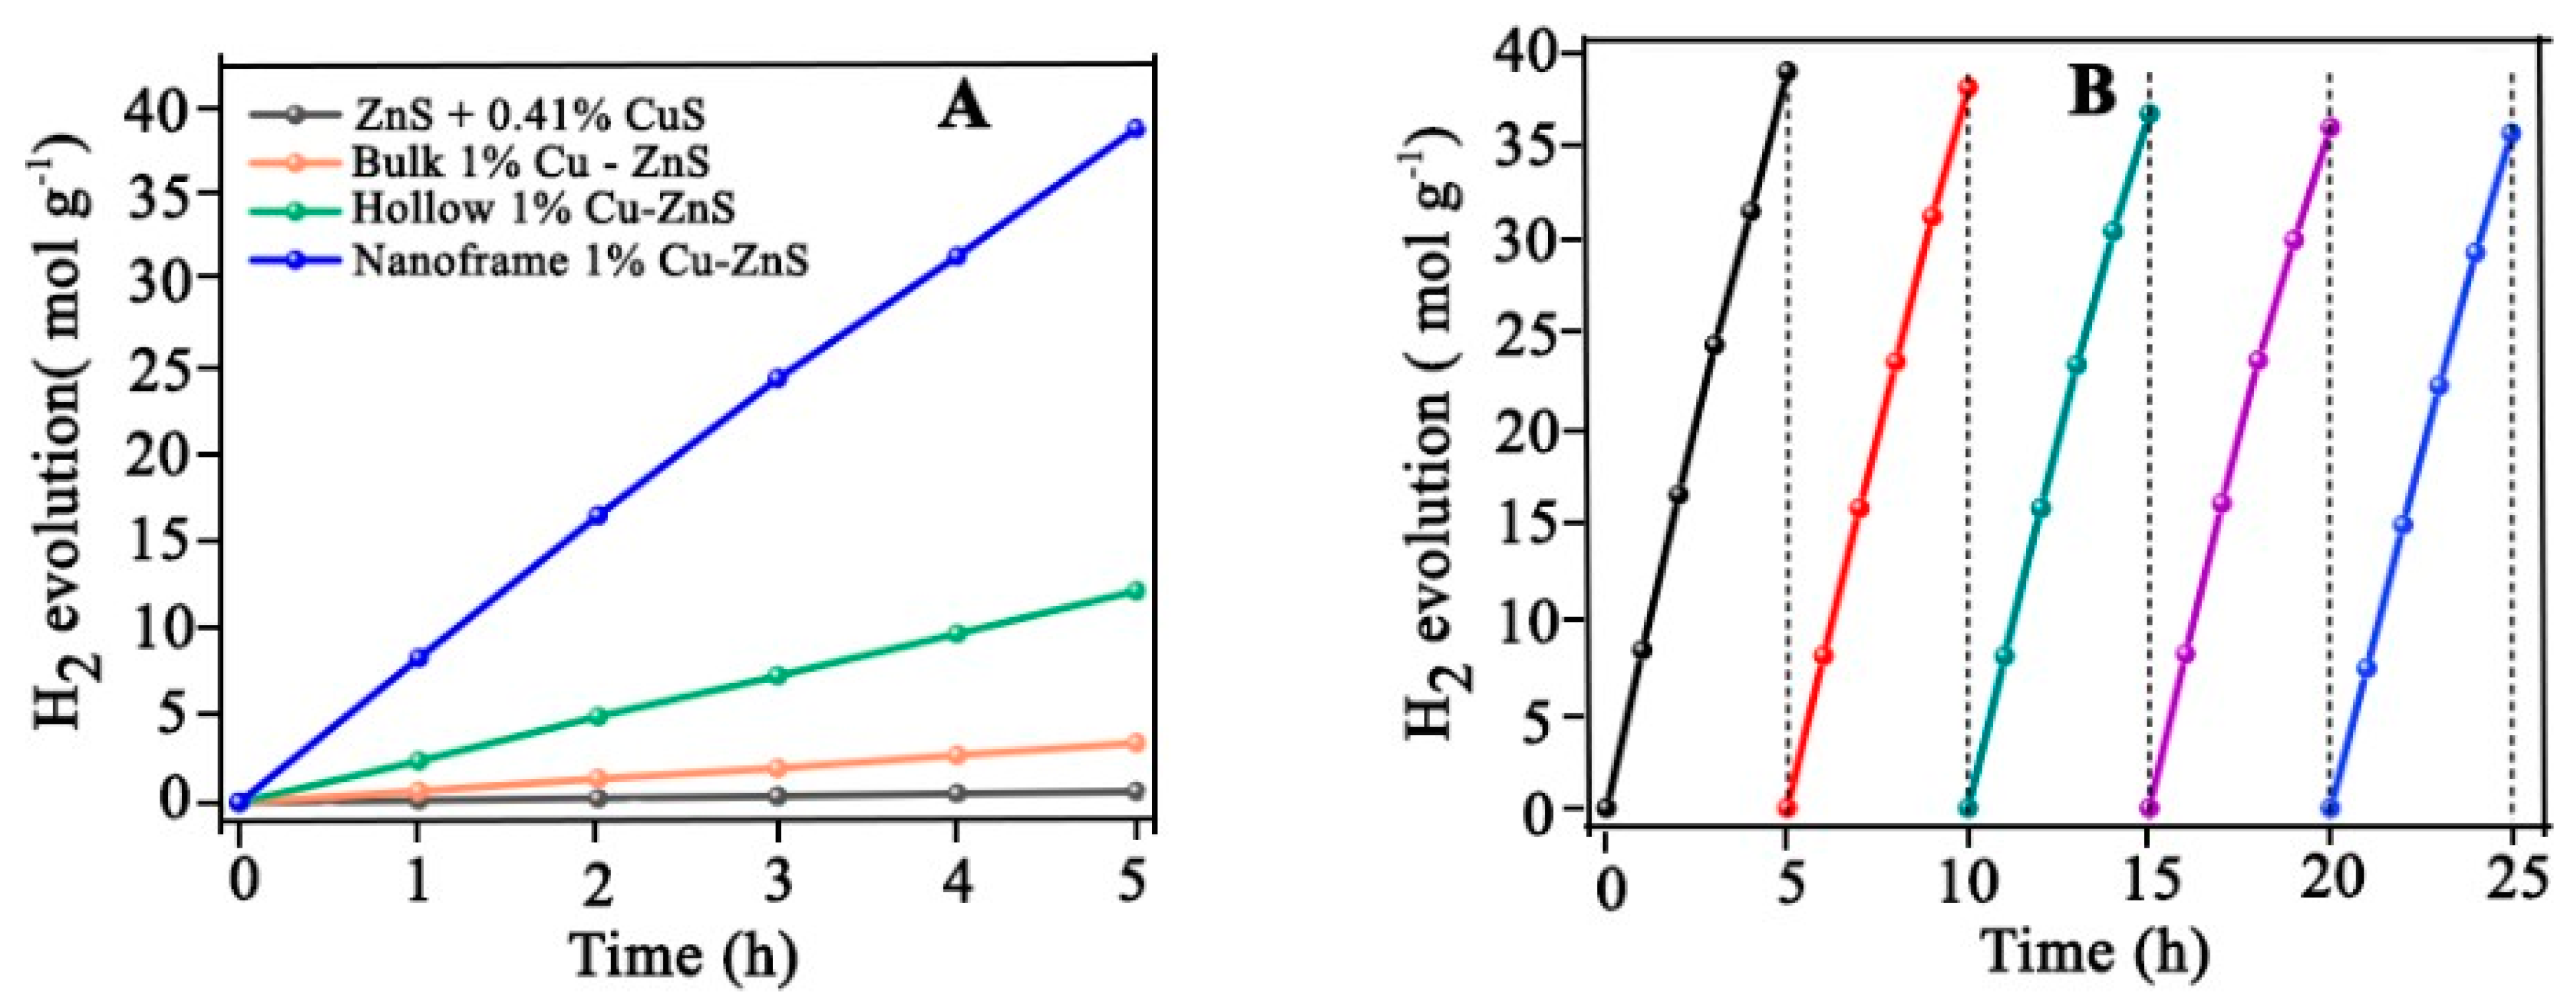
  157. Huang, J.; Chen, J.; Liu, W.; Zhang, J.; Chen, J.; Li, Y. Copper-doped zinc sulfide nanoframes with three-dimensional photocatalytic surfaces for enhanced solar driven H2 production. Chin. J. Catal. 2022, 43, 782–792. [Google Scholar] [CrossRef]
Figure 1. General schematic diagram to show synthesis of nanoframes from monometallic octahedron (A) and bimetallic dodecahedron nanocrystal (B) based upon carving of atoms from side faces. Reprinted with permission from Ref. [39]. Copyright 2021 American Chemical Society.
Symmetry 16 00452 g001
Figure 2. Schematic representation of design of Pt-Ni nanoframe with Pt-rich edges. Reprinted with permission from Ref. [42]. Copyright 2015 American Chemical Society.
Symmetry 16 00452 g002
Figure 3. TEM images obtained at different points during the synthesis of Pt-Ni nanoframe. 3 (AD) TEM images show shape changing in the overall synthetic process of the nanostructure. Reprinted with permission from Ref. [42]. Copyright 2015 American Chemical Society.
Symmetry 16 00452 g003
Figure 4. Schematic diagram depicting the formation of a nanoframe made up of metal B by selective deposition on the vertices and edges of a nanocube made of metal A and followed by etching.
Symmetry 16 00452 g004
Figure 5. Schematic representation of the formation of the A–B alloy and then the cubic nanoframe of metal B via the dealloying of metal A from the A–B nanobox using a chemical etchant.
Symmetry 16 00452 g005
Figure 6. Scheme showing how the growth rate affects either the evolution of the deposited metal into a complete shell on the nanoframe ridges or its random distribution to form discrete islands or spikes on it.
Symmetry 16 00452 g006
Figure 7. Crystallographic models of nanostructure designed by using lead (grey) and sulfur (yellow). (1) PbS nanosheet evolved into nanoframes, (2) followed by nanoring formation (3), and further decomposed into fragments, prolonging the synthesis. Reprinted with permission from Ref. [52]. Copyright 2019 American Chemical Society.
Symmetry 16 00452 g007
Figure 8. Schematic illustration of the experimental steps undertaken to synthesize 2D Ni-Ir nanoframes. Reprinted with permission from Ref. [60]. Copyright 2018 American Chemical Society.
Symmetry 16 00452 g008
Figure 9. (a) TEM images of Ru cuboctahedral nanoframe; (b) HAADF-STEM images viewed from different directions ([100], [110], [211], [111], respectively); (c) EDX mapping of individual nanoframes. Reprinted with permission from Ref. [61]. Copyright 2019 American Chemical Society.
Symmetry 16 00452 g009
Figure 10. Schematic illustration of the synthesis of the Pt-Ni dodecahedral nanoframe. Reprinted with permission from Ref. [62]. Copyright 2020 American Chemical Society.
Symmetry 16 00452 g010
Figure 11. (A) TEM images of Pt-Ni dodecahedral nanoframe; (B) HADF-STEM images and EDX mapping of Pt-Ni dodecahedral nanoframe. Reprinted with permission from Ref. [62]. Copyright 2020 American Chemical Society.
Symmetry 16 00452 g011
Figure 12. Scheme of the synthetic routes for the tunable hollow Pt@Ru nanoframe. Reprinted with permission from Ref. [63]. Copyright 2020 American Chemical Society.
Symmetry 16 00452 g012
Figure 13. (A,B) TEM dark-field image and SEM image of h-Pt@Ru (C,D); TEM bright-field image and SEM image of d@Ru. Insets are corresponding structure models. Reprinted with permission from Ref. [63]. Copyright 2020 American Chemical Society.
Symmetry 16 00452 g013
Figure 14. Synthetic protocol used to create complex polymetallic hollow nanomaterials by galvanic replacement followed by the Kirkendall effect.
Symmetry 16 00452 g014
Figure 15. Schematic representation of Pt nanocubes formed by photocatalytic template synthesis. Reprinted with permission from Ref. [66]. Copyright 2015 The Electrochemical Society.
Symmetry 16 00452 g015
Figure 16. TEM images of Pt-200 samples assembled at different growth stages: (A) 30 min; (B) 60 min; (C) 90 min; (D) Pt nanocage. Reprinted with permission from Ref. [66]. Copyright 2015 The Electrochemical Society.
Symmetry 16 00452 g016
Figure 17. Evolution models of triangular Ag/Au nanoframe (AE) and hexagonal Au nanoframe (FJ). Reprinted with permission from Ref. [22]. Copyright 2009 American Chemical Society.
Symmetry 16 00452 g017
Figure 18. Mechanism of dPtCu nanoframe formation. Reprinted with permission from Ref. [67]. Copyright 2018 American Chemical Society.
Symmetry 16 00452 g018
Figure 19. (A) Low, (B) medium and (C,D) high-resolution TEM images of dPtCu nanoframes. Reprinted with permission from Ref. [67]. Copyright 2018 American Chemical Society.
Symmetry 16 00452 g019
Figure 20. (A) CV curves of four different catalysts in 0.5 M H2SO4. (B) Comparison of specific activity and mass activity at 0.8 V vs. Reversible Hydrogen Electrode (RHE). Reprinted with permission from Ref. [63]. Copyright 2020 American Chemical Society. (C) Resonance wavelength excitation for silver nanoframe on Au mirror. Reprinted with permission from Ref. [70]. Copyright 2020 American Chemical Society.
Symmetry 16 00452 g020
Figure 21. (A) CV curves obtained for PtCuRh RDND, PtCuRh RDN, PtCu NC and Pt/C in 0.5 M aqueous H2SO4. (B) Histograms of mass activity after 1000 cycles of the stability test. Reprinted with permission from Ref. [80]. Copyright 2019 Royal Society of Chemistry.
Symmetry 16 00452 g021
Figure 22. (A) CV, the current for unsupported NiPt-200 and NiPt-300 2D nanoframes; Ni(OH)s@Pt is multiplied by a factor of 7 to facilitate the comparison with state-of-the-art catalysts, i.e., Pt/C. (B) Comparison of specific activity of NiPt-200 and NiPt-300 2D nanoframes, Ni(OH)2@Pt, and commercial Pt/C (left), and mass activity (right). Reprinted with permission from Ref. [71]. Copyright 2017 American Chemical Society.
Symmetry 16 00452 g022
Figure 23. Comparison of electrochemical properties of PtCu DNFs (curve a), Pt/C (curve b), PtCu NPHs (curve c) and Pt black (curve d) with 0.5 M H2SO4 and a scan rate of 5 mVS−1. (A) HER polarization curves; (B) Tafel plot. Reprinted with permission from Ref. [67] Copyright 2018 American Chemical Society.
Symmetry 16 00452 g023
Figure 24. (A) CV curves of Pd nanoframe and Pd octahedra normalized against ECSA. (B) Electrochemical durability test after 1000 cycles. Reprinted with permission from Ref. [40]. Copyright 2017 American Chemical Society.
Symmetry 16 00452 g024
Figure 25. LSV curve of CoP NFs and CoP NCs (A) in 1 M KOH without iR compensation in a two-electrode configuration (B) before and after electrolysis in 1 M KOH. Reprinted with permission from Ref. [82]. Copyright 2020 American Chemical Society.
Symmetry 16 00452 g025
Figure 26. Electrochemical properties of PtCu HCNFs, Pt NCs, Pt/C, and Pt black catalysts in 0.5 M KOH at 50 mV s−1. (A) CV plots and (B) ORR polarization curves. Reprinted with permission from Ref. [85]. Copyright 2018 Wiley Online Library.
Symmetry 16 00452 g026
Figure 27. Schematic illustration to compare physiological stability and biocompatibility of GNs and GNFs. Reprinted with permission from Ref. [87]. Copyright 2017 American Chemical Society.
Symmetry 16 00452 g027
Figure 28. (A) UV–visible NIR absorption spectra of Au NF-mediated TMB-H2O2 system. (B) Temperature changes of different Au NF-mediated TMB-H2O2 systems. Reprinted with permission from Ref. [88]. Copyright 2021 American Chemical Society.
Symmetry 16 00452 g028
Figure 29. (A) 1: SERS images of Au@Au–Ag DCFs at different penetration depths; 2: SERS spectra of agarose phantom containing different concentrations of Au@Au–Ag DCFs. (B) 1: NIR-II SERS images of the agarose phantoms containing 185.4 µg mL−1 Au@Au–Ag DCFs at different penetration depths; 2: the decay of the average NIR-II SERS intensity over the increasing penetration depth under a 1064 nm laser (laser power: 13.1 mW; integration time: 5 s. Reprinted with permission from Ref. [94]. Copyright 2021 Wiley Online Library.
Symmetry 16 00452 g029
Figure 30. In vivo anti-tumor experiments. (A) Relative tumor volume for various therapeutic treatments within 16 days. (B) Survival rate of mice in various groups during 60-day period. Reprinted with permission from Ref. [95]. Copyright 2022 Elsevier.
Symmetry 16 00452 g030
Figure 31. Nanoframe with different dimensions: (L) edge length; (W) edge thickness.
Symmetry 16 00452 g031
Figure 32. Absorption spectra of nanoframe as a function of different geometric parameters. (A) Absorption spectra vs. L (W = 7 nm). (B) absorption spectra vs. R = L/W (L = 28 nm). Reprinted with permission from Ref. [97]. Copyright 2016 American Chemical Society.
Symmetry 16 00452 g032
Figure 33. (A) UV–visible absorption spec tra of MR, Ag/Au Fr5 and MR+Ag/Au Fr5 at a 10−5 M concentration of MR. (B) SERS spectra of 10−5 M methyl red on Ag/Au nanoframe substrate. Reprinted with permission from Ref. [98]. Copyright 2021 RSC Advances.
Symmetry 16 00452 g033
Figure 34. (A) Recyclability of CoPC-NFs treated with DC and NIR laser for methylene blue removal within 10 cycles. (B) H2O2 generation profile for different nanocatalysts under DC treatment. Reprinted with permission from Ref. [99]. Copyright 2022 Nanoscale Advances.
Symmetry 16 00452 g034
Figure 35. Plots showing ln(I0/It) value versus reaction time under different conditions. (A) catalyst Au@Pd NPs; (B) AuAgPd PNFs. Reprinted with permission from Ref. [107]. Copyright 2022 Elsevier.
Symmetry 16 00452 g035
Figure 36. (A) UV–visible absorption spectra of RhB solution after electro-Fenton reaction at 0.3 V for different times. (B) Decay of RhB concentration over time during electro-Fenton reaction at 0.3 V by Pd Au-NF and Au/C. Reprinted with permission from Ref. [109]. Copyright 2021 American Chemical Society.
Symmetry 16 00452 g036
Figure 37. Electrochemical properties of PMNs, bulk MnSnO3, and SnO2: (A) Rate properties at varied current densities and (B) capacity variation at two voltage ranges with respect to the cycle number. Reprinted with permission from Ref. [74]. Copyright 2018 American Chemical Society.
Symmetry 16 00452 g037
Figure 38. Electrochemical properties of Cu-CoSe2 NFCs: (A) Rate property at 0.1–2 Ag−1 and (B) Electrochemical impedance spectra. Reprinted with permission from Ref. [113]. Copyright 2021 Elsevier.
Symmetry 16 00452 g038
Figure 39. The long-lasting cyclic performance of S@ 3DZCN-C at 2C. Reprinted with permission from Ref. [116]. Copyright 2021 American Chemical Society.
Symmetry 16 00452 g039
Figure 40. Electrochemical performance of (A) relationship between specific capacitance and current density of sulfurized and Ni-Al LDHs. (B) Cyclic performance of sulfurized NiAl at 20 A g−1. (C) Cyclic stability and capacitance retention of NiAl/Bi-Ce-S ASC device at 10 Ag−1. Reprinted with permission from Ref. [117]. Copyright 2022 springer Nature.
Symmetry 16 00452 g040
Figure 41. (A) Electric field distribution of Au nanoframe. A laser of 633 nm wavelength was irradiated from the z-axis with polarization in the x direction. A dotted square indicates the area of maximum electric field enhancement. (B) SERS spectrum of crystal violet (10−6 M) absorbed on the substrate modified with an Au nanoframe and Au nanosphere. Reprinted with permission from Ref. [122]. Copyright 2015 American Chemical Society.
Symmetry 16 00452 g041
Figure 42. Electrochemical properties of Pt-Co nanoframes: (A,B) 1 M KOH electrolyte; (C,D) 0.1 M HClO4; (A,C) CV curves; (B,D) specific and mass activity. Reprinted with permission from Ref. [124]. Copyright 2020 American Chemical Society.
Symmetry 16 00452 g042
Figure 43. SERS spectra of benzene thiol (10−14) M adsorbed on (A) 3D arrays of Au nanoframe with 18 nm thickness and (B) 3D Au nanoparticle arrays. Reprinted with permission from Ref. [125]. Copyright 2020 American Chemical Society.
Symmetry 16 00452 g043
Figure 44. Responses of ZnO, PdRh SC/ZnO, and PdRh HC/ZnO-based sensors to (A) 1 ppm of H2S, 14,000 ppm of CH4, and 200 ppm of CO at 260 °C; (B) 1 ppm of H2S at varied temperature. Reprinted with permission from Ref. [126]. Copyright 2020 American Chemical Society.
Symmetry 16 00452 g044
Figure 45. (A) Stability of proposed CTL-based sensor based on Zn10Fe1-C-900 within 8 days. (B) CTL sensor response to different H2S concentrations. Reprinted with permission from Ref. [127]. Copyright 2022 Wiley online library.
Symmetry 16 00452 g045
Figure 46. Photocatalytic performance of ZFs-TCPP-Ni in (A) varied amounts. (B) Different samples. (C) EIS plots. (D) Cyclic stability. Reprinted with permission from Ref. [134]. Copyright 2021 Elsevier.
Symmetry 16 00452 g046
Figure 47. Faradaic efficiency for production of CO and H2 depending on potential: (A) ZnxFey-C-900 and (B) Zn20Fe1-C-T catalysts. Reprinted with permission from Ref. [135]. Copyright 2020 Elsevier.
Symmetry 16 00452 g047
Figure 48. Catalytic hydrogen efficiencies of the Pt–Ni polyhedra, Pt–Ni frame, and Pt–Ni frame @ MOF. (A) Comparison of H2 adsorption isotherm at 273 K, with 1 bar among three different catalysts. (B) % yield of 2-chloroaniline produced as a result of hydrogenation of 1-chloro-2-nitrobenzene. Reprinted with permission from Ref. [50]. Copyright 2015 Nature Communication.
Symmetry 16 00452 g048
Figure 49. UV–visible spectra of GSH-Ag/Au nanoframes (A) for different metal ions and (B) various concentrations of Co+2. Reprinted with permission from Ref. [136]. Copyright 2017 Elsevier.
Symmetry 16 00452 g049
Figure 50. TOF values for Ni/ZrO2-F, Ni/ZrO2-H, Ni/ZrO2-C, and Ni/ZrO2. Reprinted with permission from Ref. [137]. Copyright © 2017 American Chemical Society.
Symmetry 16 00452 g050
Figure 51. (A) Growth retardation of MRSA and antibacterial activity at different concentrations of AuAg YSCNFs-60 with and without NIR radiation. (B) Photothermal conversion performance of pure water and YSCNFs recorded with NIR laser (808 nm). (C) temperature changes for YSCNFs with different edge lengths. (D) Photothermal stability of YSCNF-60 with five cycles of ON/OFF laser irradiation. Reprinted with permission from Ref. [138]. Copyright © 2022 American Chemical Society.
Symmetry 16 00452 g051
Figure 52. SERS-based detection of HCG hormone. (A) 3D Au dual-rim NFs and (B) 2D Au triangular dual-rim NFs with different concentrations of HCG. Reprinted with permission from [141]. Copyright 2022 Nature Communications.
Symmetry 16 00452 g052
Figure 53. (A) DPV curves of h-BN/Au5Pt9 nanoframes in dark containing different concentrations of glucose in artificial tears. (B) Glucose concentration in tears and blood of volunteer before and after breakfast. Reprinted with permission from Ref. [147]. Copyright 2021 Published by Elsevier.
Symmetry 16 00452 g053
Figure 54. (A) Photocatalytic hydrogen evolution curves for x% Cu-ZnS nanoframe. (B) Photocatalytic hydrogen production in five consecutive cycles for 1% Cu-ZnS nanoframe under solar irradiation. Reprinted with permission from Ref. [157]. Copyright 2022 Elsevier.
Symmetry 16 00452 g054
Table 2. Photo-degradation of methylene blue (MB) dye with different nanocatalysts.
CatalystCatalyst (g/L)Irradiation
Time (min)
Wavelength
(nm)
Degradation
%
References
ZnFe2O40.6360400–700 nm32.0[99]
MnFe2O4/rGO- 60 662 nm97[102]
MgFe2O40.6180400–700 nm26.0[103]
CaFe2O41.0360›420 nm28.0[104]
BaFe12O191.0360420–700 nm26.0[105]
COPC-NFs0.330808 nm43.9Present work
Table 3. Photo-electrode gradation of MB dye with different nanocatalysts.
CatalystDC Power
(W)
Time
(min)
Degradation
(%)
References
TiO250018022.4[106]
CO/TiO250012074.2[106]
COPC-NFs5003099.2Present work
Table 4. Comparison of different H2S CTL gas sensors.
Sensing MaterialsTemperature
(°C)
Response/Recovery
Time
LODReferences
Metal freeBN2450.1/0.2 s0.52 µgmL−1[128]
F-SiC2980.6/1.03 ppm[129]
Metal oxideFe2O332015/1203 ppm[130]
MnO22240.3/0.40.28 µgmL−1[131]
Metal–carbon complexMn3O4/g-
C3N4
1840.6/0.60.13 µgmL−1[132]
Fe2O3/g-C3N41830.1/0.60.5 µgmL−1[133]
Metal-doped porous carbon nanomaterialFe doped
Porous carbon
2150.1/0.60.13 µGmL−1Present work
Table 5. Reaction conditions: Octanoic acid (1 g), decane (100 mL), catalyst (0.1 g), 330 °C, 3 MPa, H2, 4 h.
CatalystConversion %Yield %
HeptaneOctaneOctanolOthers
NiZrO2-C54.238.76.63.25.6
NiZrO2-H86.470.36.92.66.3
NiZrO2-F100.086.06.02.12.1
Table 6. Reaction conditions: Stearic acid (1 g), dodecane (100 mL, catalyst (0.1 g), 260 °C, 3 MPa, H2.
CatalystConversion %Yield %
HeptaneOctane OctanolOthers
NiZrO2-C48.138.65.81.52.2
NiZrO2-H80.369.57.81.31.7
NiZrO2-F100.089.37.11.22.4
Disclaimer/Publisher’s Note: The statements, opinions and data contained in all publications are solely those of the individual author(s) and contributor(s) and not of MDPI and/or the editor(s). MDPI and/or the editor(s) disclaim responsibility for any injury to people or property resulting from any ideas, methods, instructions or products referred to in the content.

