Abstract
In the present study, we investigated the deformation of polyurethane composite solar cell bezels during the curing process. To address the problem of deformation, thermochemical and curing kinetics models were developed to investigate the mechanical behavior of the resin during the curing process. The importance of the influencing factors was determined through orthogonal experiments and simulation analysis. The results showed that holding pressure had a significant effect on the amount of deformation of the bezel, followed by curing temperature, pultrusion speed, and holding time. The optimal combination of process parameters was a curing temperature of 150 °C, a pultrusion speed of 50 cm/min, a holding time of 12 s, and a holding pressure of 0.14 MPa, which aided in significantly reducing the deformation of the bezel and achieving effective control of curing deformation.
1. Introduction
The advantages of composites lie in their light weight, high strength, high corrosion resistance, and excellent fatigue resistance, with them being particularly suitable for large and monolithic molded structures; they have been widely used in many fields, such as aerospace, automotive, weaponry, and new energy [1,2,3]. The application of composite materials in solar power generation systems has gradually increased, particularly in the manufacture of solar cell bezels [4]. As an important component of solar modules, the solar cell bezel plays a key role in supporting, fixing, and sealing processes. At present, the use of pultrusion molding technology to manufacture solar cell bezels has become mainstream. However, the common phenomenon of curing deformation during pultrusion causes defects in the molding of parts, which, in turn, leads to a decrease in the mechanical stability of the cell module and a decrease in sealing, and can even damage the cell and affect the photovoltaic conversion efficiency. In light of these issues, controlling curing deformation is crucial.
Residual stresses in composites during the curing stage can lead to component deformation [5,6,7], which is the result of composites being affected by numerous factors during the curing process, including intrinsic factors such as material anisotropy, asymmetric structure, curing shrinkage of the resin, and extrinsic factors such as non-uniformity of the pressure and temperature fields and mold influences. Among them, the more influential factors include thermal expansion of the resin, chemical shrinkage, holding time, curing temperature, and holding pressure [8,9,10,11,12].
In order to analyze the curing deformation problem during the manufacturing of composite parts, both experimental and simulation methods are typically used. Experimental methods involve the process of seeking the optimal process parameters through the use of systematic tests and parameter adjustments; such methods have a high degree of confidence but are time-consuming and costly. In contrast, simulation methods are based on the mechanical constitutive equations of composite materials, with numerical solution methods being used to study the stress–strain relationship of composite parts and the optimal solution obtained being corrected through comparison with a database. In the end, the components that meet the specified requirements are manufactured [13,14,15,16]. Such methods are more convenient than traditional experimental methods and can greatly reduce the workload required for mold repair. Experimental and simulation methods complement each other; experimental results can verify the accuracy of the simulation model, while the simulation model can guide experimental design and parameter optimization, thus improving research efficiency and the reliability of the results produced. In the engineering field, experimental methods and simulation methods are often used in combination and play a complementary role.
Zou et al. investigated the effects of chemical shrinkage and thermal strain in the analysis of the curing deformation of long truss-like composite parts and proposed a profile compensation method to reduce the forming error to within 5% [17]. Zhu et al. simulated the curing process using thermodynamic coupled analysis to derive the effect of anisotropic thermal conductivity on temperature distribution [18]. Wu et al. used a linear elastic model to focus on the effects of design parameters such as transfer radius, number of layers, and stacking sequence on curing deformation [19]. Johnston et al. found that the mechanical properties of resin during the curing process were related to the degree of cure and temperature and proposed the CHILE intrinsic model [20]. Ersoy et al. proposed a path-dependent model for property leapfrogging based on the phenomenon that the time dependence of curing deformation is not obvious [21]. More recently, Jiao et al. summarized the current understanding of the curing deformation mechanism, simulation scheme, and control method [22].
Although there are a number of studies on the curing deformation of composites, they are primarily carried out on C- and L-shaped laminates with simpler shapes, and there are fewer studies on composites with complex cross-sectional shapes. With the wide application of composites in solar power generation systems, the establishment of the intrinsic modeling of polyurethane composite solar cell bezels, as well as curing simulation analysis, has become crucial. Since simulation methods are convenient and efficient and can be used to predict the potential results of complex systems, which in turn reduces the cycle time and costs required for mold repair; in this study, we will focus on the deformation phenomenon of a polyurethane composite solar cell frame during the curing process by using a simulation method in order to thoroughly investigate its deformation characteristics and mechanisms.
2. Theoretical Model for Solidification Deformation Simulation
It is common for residual stresses to be generated during the curing formation stage of thermoset resin matrix composites, regardless of the temperature rise or fall. In this study, the effects of curing temperature distribution and resin curing shrinkage on the residual stresses were considered, and a simulation prediction model was developed. The model is capable of accurately calculating the accumulation of residual stresses throughout the curing process and the resulting curing deformation. The simulation model covers heat transfer analysis and curing kinetics analysis, which provides strong theoretical support for the study of the mechanical behavior of thermosetting resin matrix composites during the curing process.
2.1. Part Parameters and Experimental Methods
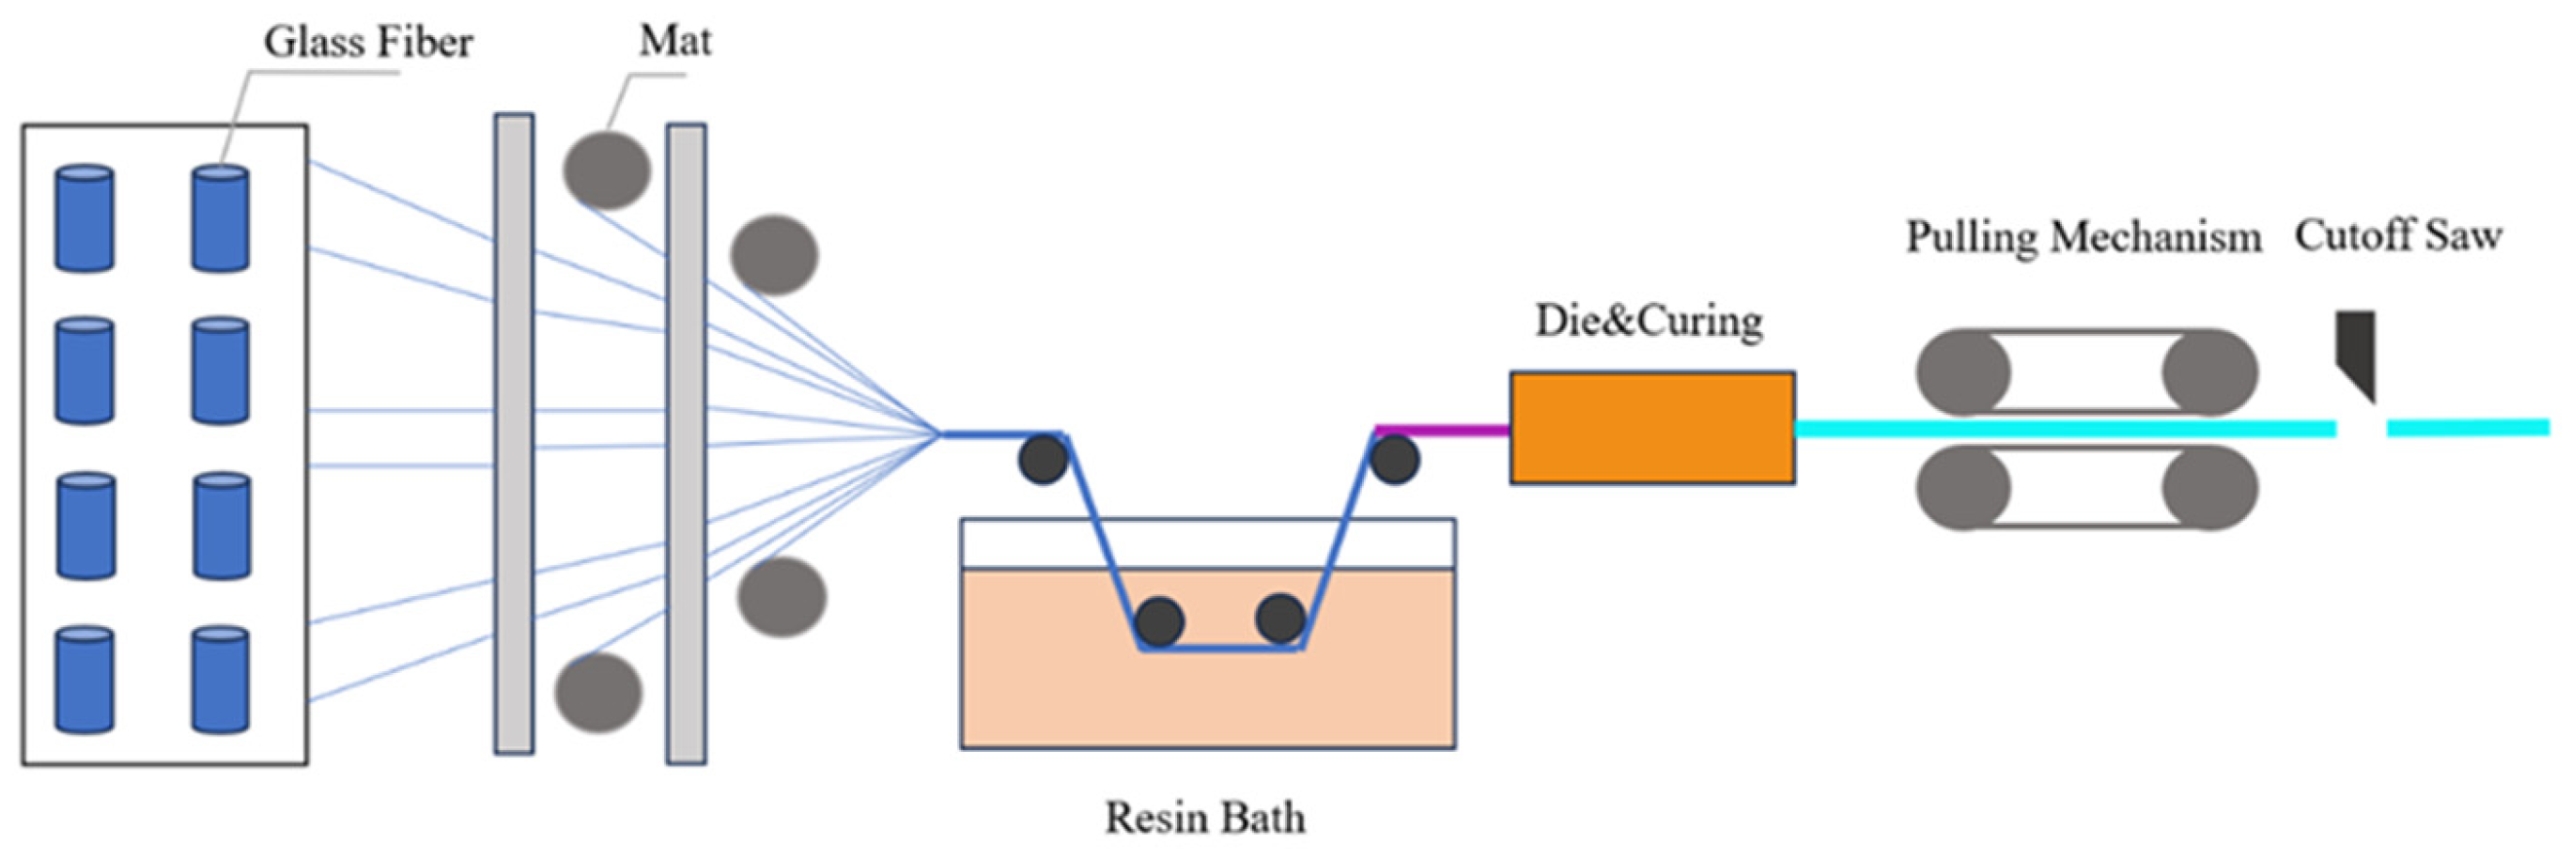
The solar cell bezel analyzed in this paper has a length of 30 mm, a height of 25 mm, and a cross-sectional shape as shown in Figure 1. It is made by using glass fiber and polyurethane pultrusion molding, and the specific flow chart is shown in Figure 2. The glass fiber and mat are pulled through the liner plate by the traction equipment, impregnated with polyurethane in the resin tank, and then entered into the mold to join the curing, and finally cut to form the member.
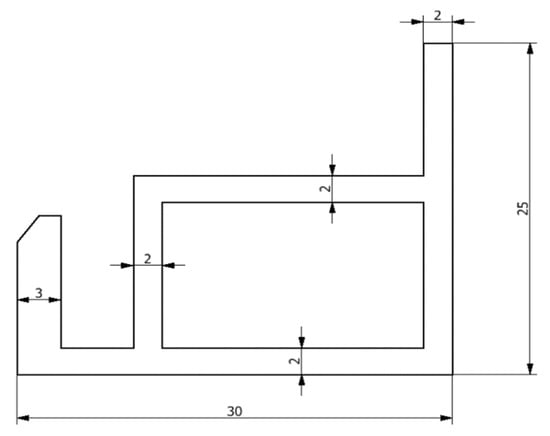
Figure 1.
Cross-section of a composite solar cell bezel.

Figure 2.
Schematic diagram of polyurethane composite solar frame pultrusion molding.
In this study, four process parameters that have a significant impact on the deformation of the composite bezel were selected as the control factors, namely, curing temperature (A, °C), pultrusion speed (B, cm/min), holding time (C, s), and holding pressure (D, MPa). According to the results of our production site investigation, four levels were set for each process parameter factor, as shown in Table 1. The established simulation model was applied to ABAQUS software during the study, and the deformations at each level were individually analyzed using sequential coupling.

Table 1.
Pultrusion process parameter factors and level values.
2.2. Mathematical Modeling of the Thermochemical Analysis
2.2.1. Thermochemical Reaction Model
The curing process of thermoset composites is incredibly complex, and the pultrusion of polyurethane composite frames is a process, in which heat and chemical reactions are coupled. In this process, the resin curing reaction in the component is continuously exothermic as well as the surface of the component and the inside area of the mold is subjected to convective heat transfer, and the material properties of the composite material, such as the rate of the curing reaction and the rate of heat transfer, determine the temperature distribution of the component. Therefore, only by solving the non-linear problem of heat transfer from the internal heat source can the temperature distribution of the component be predicted. Based on the principle of energy conservation and Fourier’s law of heat conduction [23,24,25], a numerical computational model shown in Equation (1) was constructed to describe the temperature variation:
where C, ρ_c, kxx, kyy, and kzz are the specific heat, density, and thermal conductivity of the composite in each direction, respectively. It can be calculated using Equation (2):
where the subscripts c, f, and r denote the relevant parameters of composites, fibers, and resins, respectively.
is the amount of heat released during the curing reaction of the resin and can be expressed by Equation (3):
where is the density of the resin, Hu is the total heat released per unit mass of resin after curing, and is the curing rate.
2.2.2. Curing Kinetics Model
The degree of cure is dynamic with time during the curing process and can be calculated using the kinetic analysis model of curing [26,27,28] (Equation (4)), which can also be used to calculate the amount of exothermic heat derived from an internal heat source (Equation (3)). In this paper, the n-scale kinetic model, which is widely used at present, is adopted, and it is simple and accurate and can be used to study the curing reaction of polyurethane resins.
where A is the frequency factor, E is the activation energy of the reaction, and R is the universal gas constant.
A and E in the model can be calculated using the Kissinger equation in the form of Equation (5):
It is empirically recognized that at curing degrees below 0.8, the reaction exhibits a significantly non-linear relationship. However, when the degree of cure exceeds 0.8, the reaction exhibits a linear relationship, a performance that can be considered as an n-order reaction. Therefore, for the above case, we chose to set the value of n to 0.85.
2.3. Mathematical and Solidified Ontological Models for Thermal Analysis
2.3.1. Mathematical Models for Thermal Analysis
The physical morphology of thermosetting resins changes continuously during the curing process, and based on the variability of material properties, it is generally divided into three stages: viscous fluid, rubbery, and glassy based on the dividing line between the gel point and the glass transition point. The residual stresses and strains during the curing of the composite generally do not occur in the viscous fluid and rubbery phases. Instead, they are generated at the stage when the curing holding temperature is reduced to room temperature [29], and Equation (6) is an expression for the effective strain.
where εeff and εtot denote the effective strain and total strain; αgel denotes the degree of solidification at the gel point; β and γ denote the coefficients of thermal expansion and chemical shrinkage; and γ can be calculated by Equation (7):
where V and E denote the Poisson’s ratio and modulus of the composite; αg denotes the degree of cure at the glass transition point; and Vsh denotes the chemical shrinkage coefficient of the resin after gelation.
2.3.2. Solidification Eigenmodel
The mechanical behavior of composites during curing can be calculated using the viscoelastic constitutive equations. However, the material data used are cumbersome and some have to be obtained through extensive experimentation. In view of this issue, a simplified viscoelastic equation, the path-dependent model [30], is used in the present study. The change in material properties occurs when the temperature reaches Tg, and considering the composite properties as a constant in the rubbery and glassy stages of curing is the main strength of this model, and the change of resin in the path-dependent model can be expressed by the following equations:
The corresponding incremental equations for the intrinsic model of the composite are as follows:
where Si is the historical state variable and can be defined as follows:
As can be seen from Equation (8), the two complex conversion factors in the viscoelastic constitutive model are regarded as two extremes in the path-dependent model, which are regarded as zero and infinity in the rubbery and glassy phases. It is this simplified method that makes it unnecessary to study the more difficult-to-obtain viscoelastic performance parameters related to the rate, but instead use the more easily obtained performance parameters related to the path, which can simultaneously ensure the accuracy of the calculation and greatly reduce the difficulty involved in the said calculation.
2.4. Finite Element Modeling
Composite curing simulation is a multi-field coupling process, which includes thermochemical and thermal fields; if the two fields are directly coupled during analysis, the operation is more complex and the simulation difficulty will increase. In light of this, in this study, we adopted a simpler but more accurate sequential coupling method, which can greatly reduce the simulation difficulty. Firstly, a thermochemical simulation was carried out to conserve the calculated temperature field and solidity field; afterward, a thermodynamic simulation analysis was carried out. The thermodynamic simulation analysis is divided into two steps: simulating the residual stresses generated during the curing process and simulating the deformation process after demolding. Different grid nodes are loaded with the temperature and curing degree fields obtained from the thermochemical simulation analysis, and the residual strains generated by the temperature fluctuation and thermal expansion characteristics are then substituted into the curing intrinsic model, from which the residual stresses can be calculated. Afterward, as the component is demolded, the displacement constraints on the surface of the component disappear, thus releasing the residual stresses inside the component, which leads to the deformation of the component. The secondary program development function of ABAQUS software can realize the above requirements sufficiently; therefore, the simulation was carried out by using this software. In the USDFLD and HETVEL subroutines, the thermochemical simulation analysis can be completed by applying equations. In UEXPAN and UMAT subroutines, the thermodynamic simulation can be completed by using Equations (6)–(10). The flowchart for the simulation of solidification deformation and residual stress is shown in Figure 3.
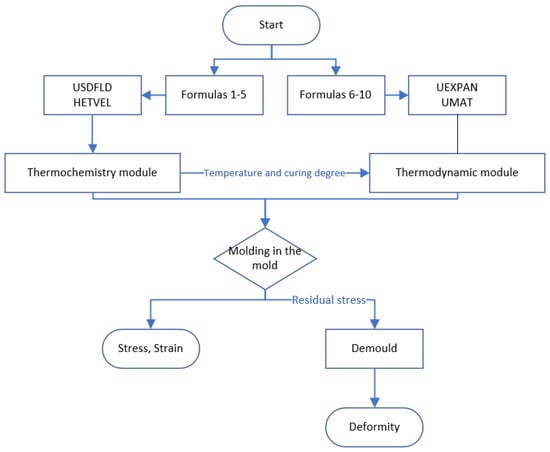
Figure 3.
Flowchart for finite element simulation of solar cell bezel curing.
Finite element mesh modeling of the composite solar cell bezel model was carried out using ABAQUS software. The C3D8T cell type was selected, which can be used for thermal coupling analysis, and the model consists of 4824 meshes, as shown in Figure 4. During the calculation process, it was considered that the bezel was constrained by the surface in the mold and was free after demolding.
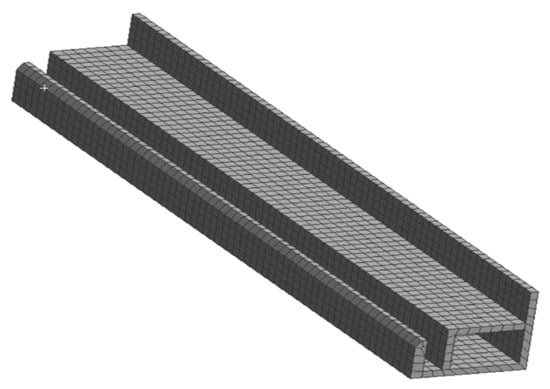
Figure 4.
Finite element analysis meshing.
3. Analysis of Experimental Results
3.1. Analysis of Field Variables in the Curing Process
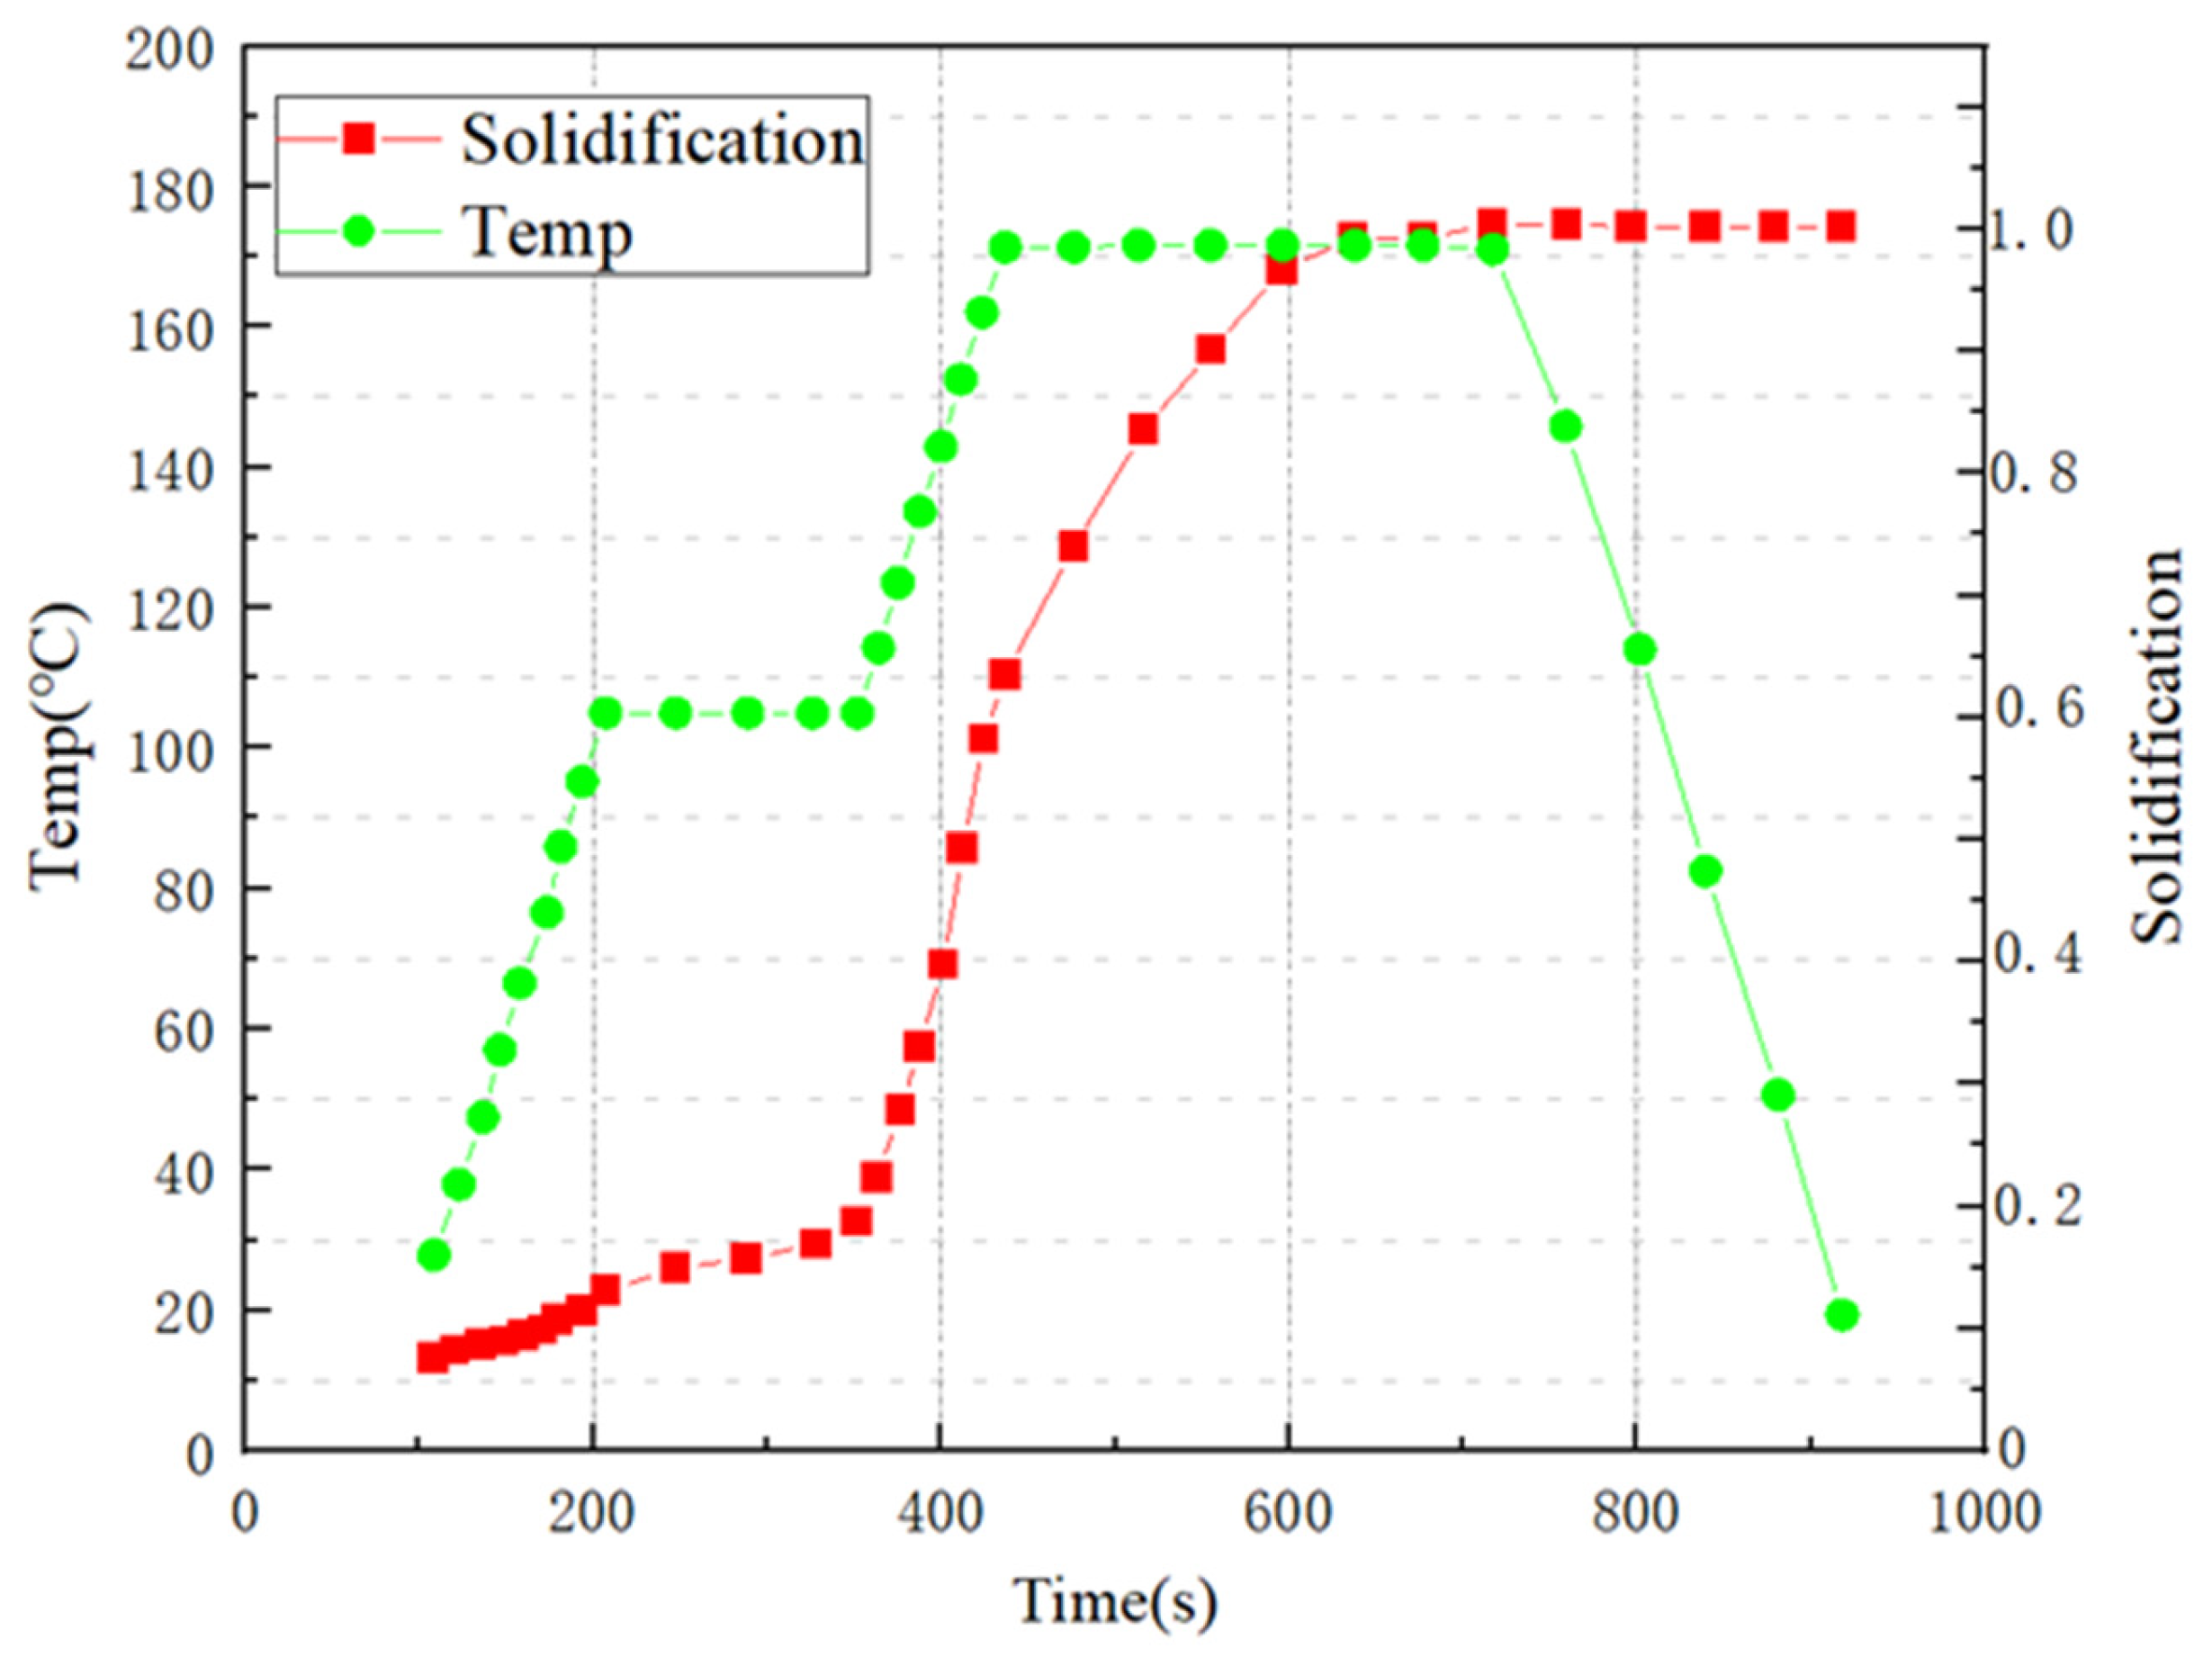
According to the evolution of temperature and curability during the molding process shown in Figure 5, the following observations can be made: When the temperature increases from 25 °C to 100 °C, the curability of the resin is almost constant at an incredibly small value. From 105 °C, the curability starts to increase slowly during the holding phase. As the temperature increases from 105 °C to 170 °C, the degree of cure increases rapidly from about 0.2 to about 0.7. During the subsequent holding and cooling phases, the degree of cure of the resin gradually increases to 1 and eventually stabilizes.
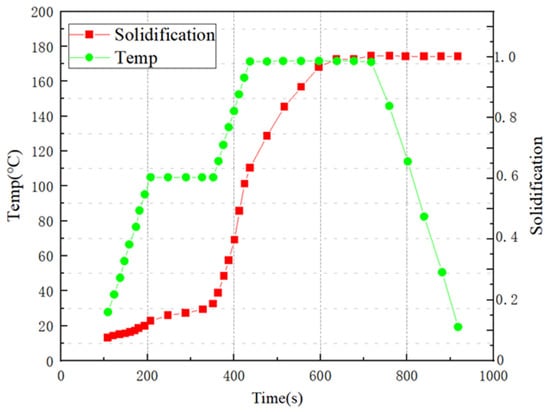
Figure 5.
The degree of resin curing during molding varies with temperature.
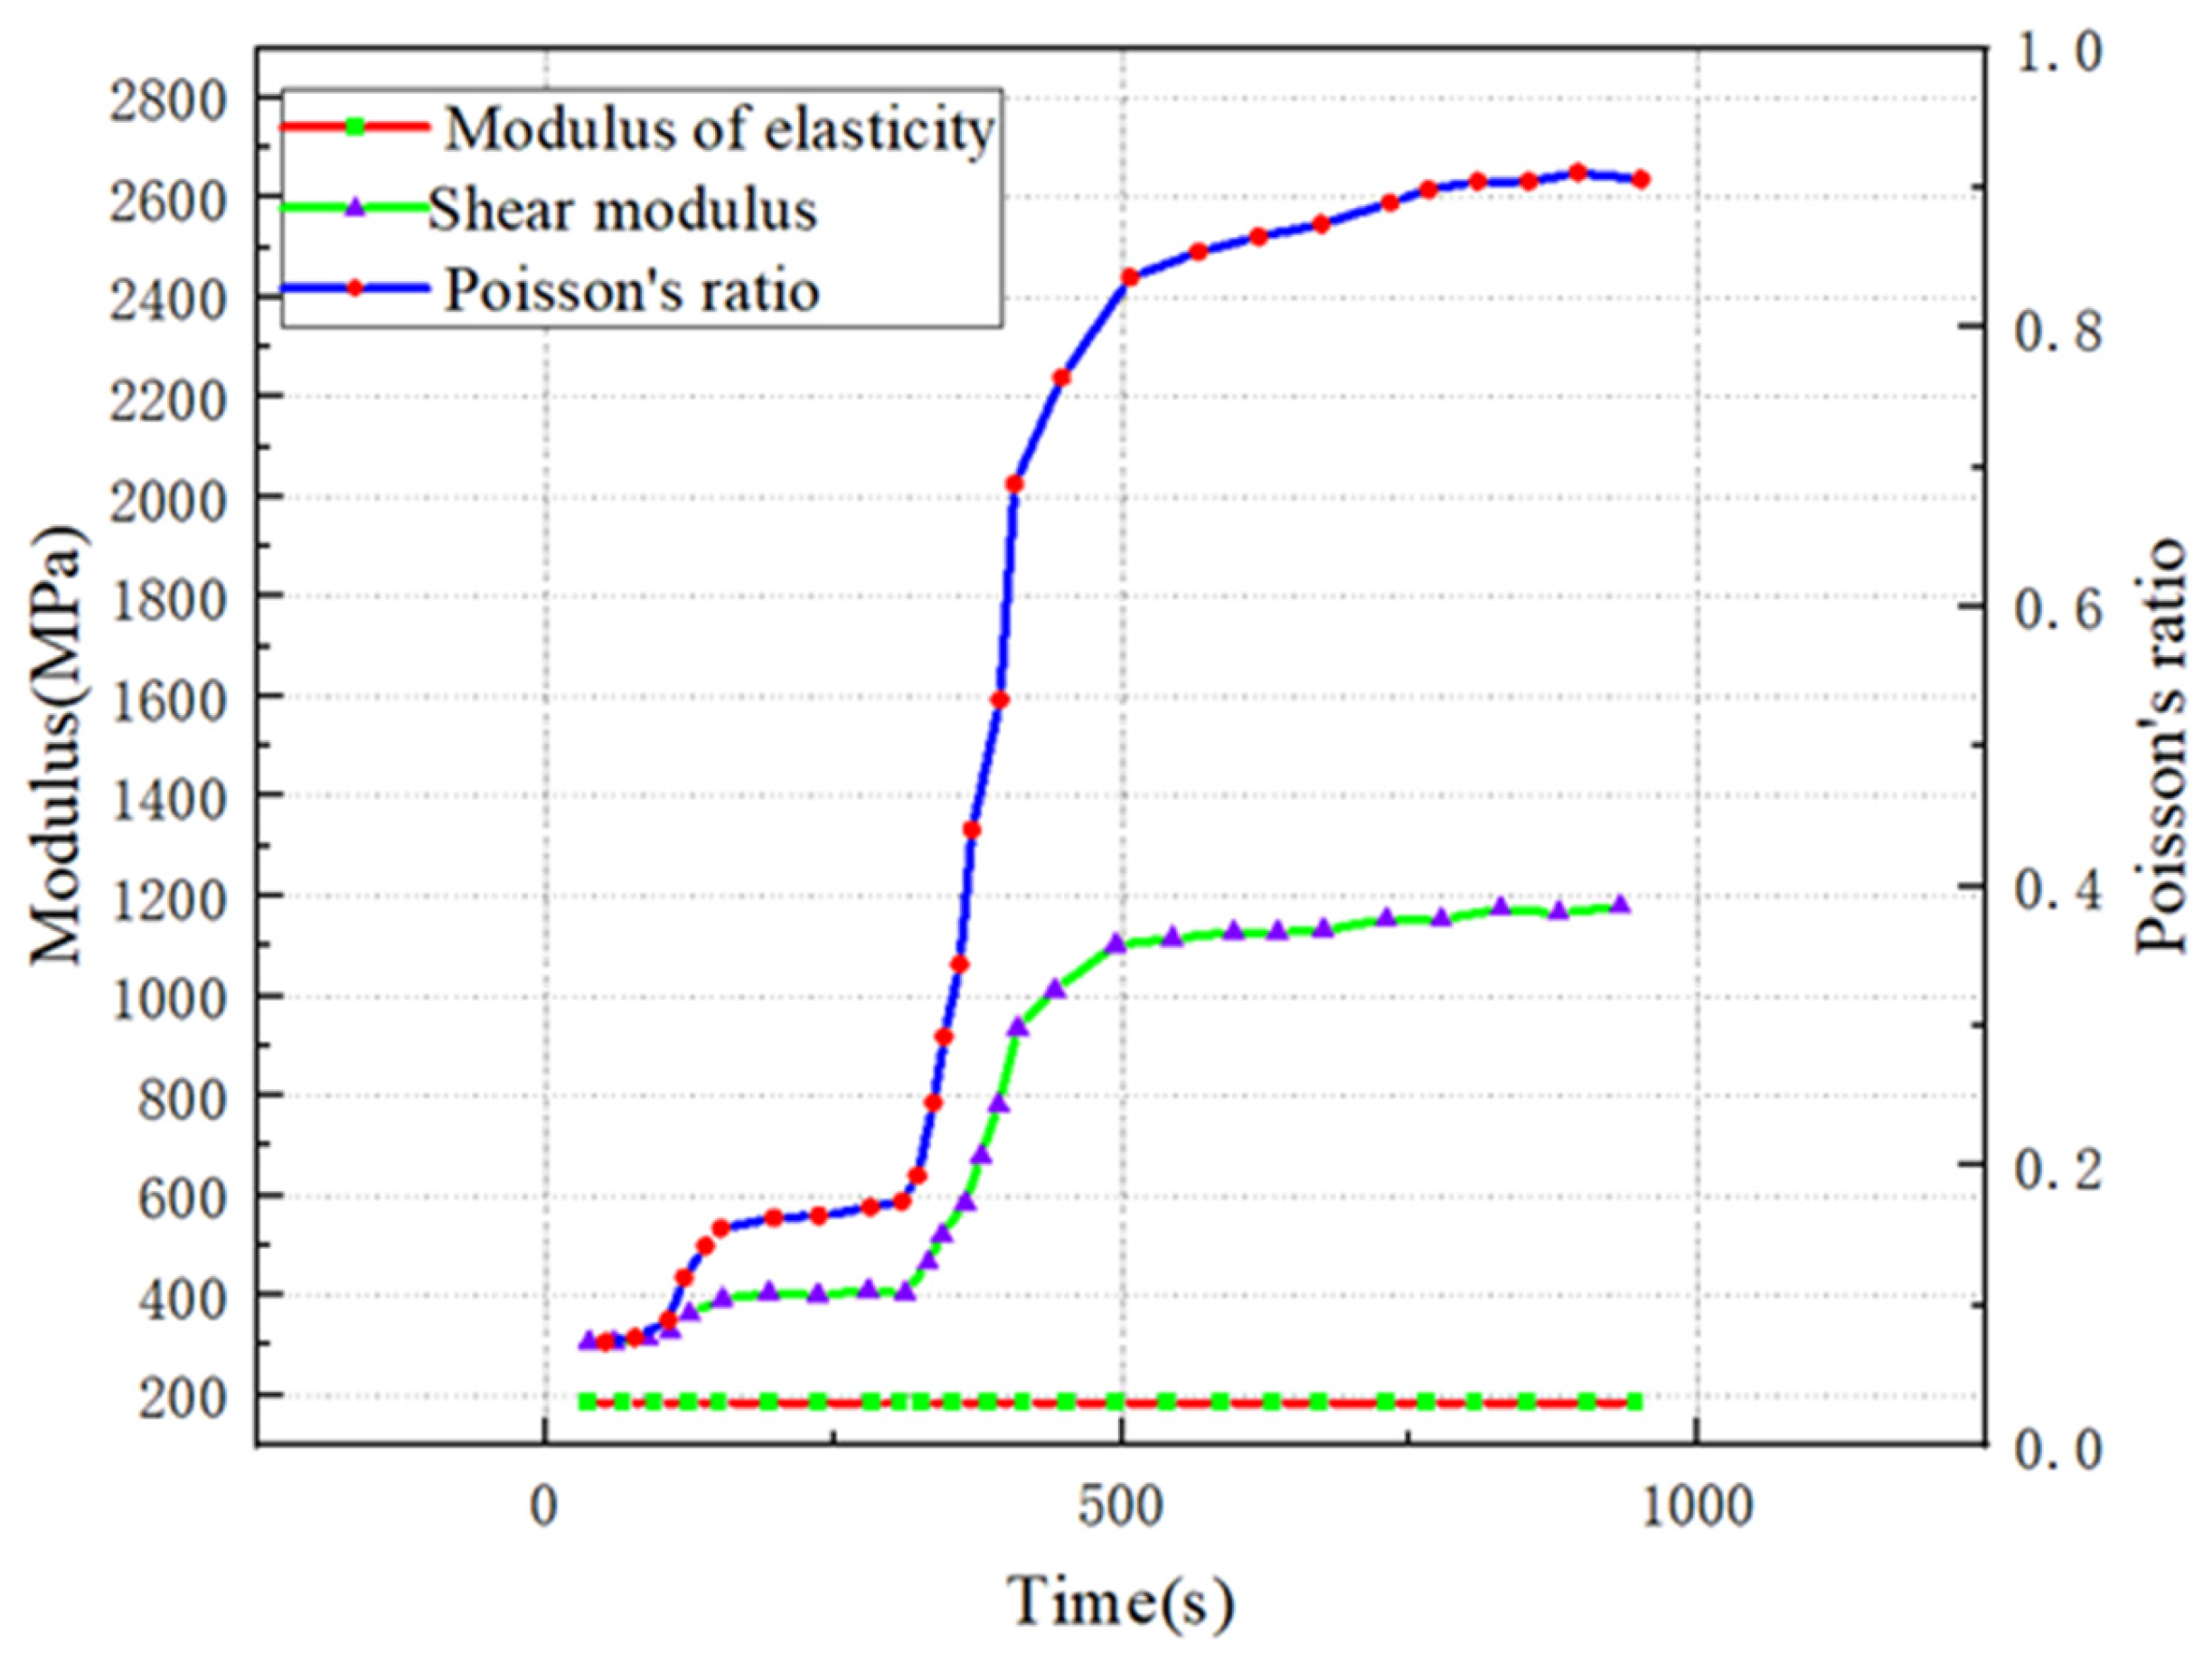
According to the results of a previous study [31], it is recognized that the mechanical properties of the material during the curing process are not significantly affected by the difference in Poisson’s ratio of the resin. Figure 6 shows the trend of resin modulus at a constant Poisson’s ratio, from which it can be seen that the trend of the shear modulus and elastic modulus of the resin is highly similar to the curing degree. At a low curing degree, the shear modulus and elastic modulus also remain at a low level, and with the increase in curing degree, both are subjected to an abrupt change and eventually stabilize.
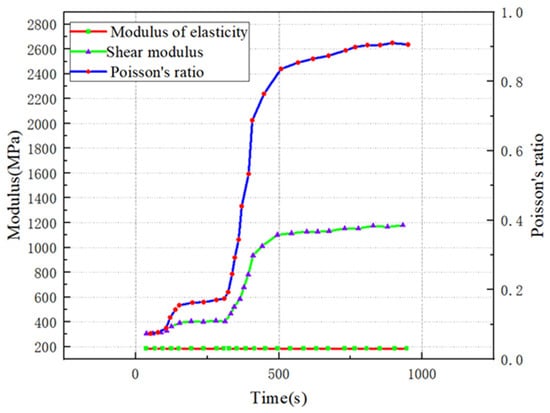
Figure 6.
Variation in resin modulus at a constant Poisson’s ratio.
3.2. Analysis of the Impact of Factors
According to the parameter factor level results listed in Table 1, different combinations of orthogonal experimental methods were used to design L16 (44) orthogonal tests, and the previous numerical model was applied for simulation and analysis, which can be used to determine the deformation amount under each step of the working conditions. The different process parameter design schemes and their corresponding values of edge deformation are given in Table 2.
Table 2.
Curing deformation orthogonal experimental scheme and results.
Based on the data presented in Table 2, the extreme deviation in each parameter was calculated and analyzed, and the results of the analysis are given in Table 3. Through our comparative study, we obtained the following result: R(C) < R(B) < R(A) < R(D), that is, the fluctuations in the factors affecting the deformation of the composites are in the following order from smallest to largest: holding time, pultrusion speed, curing temperature, and holding pressure.
Table 3.
Results of extreme variance analysis of cured deformation.
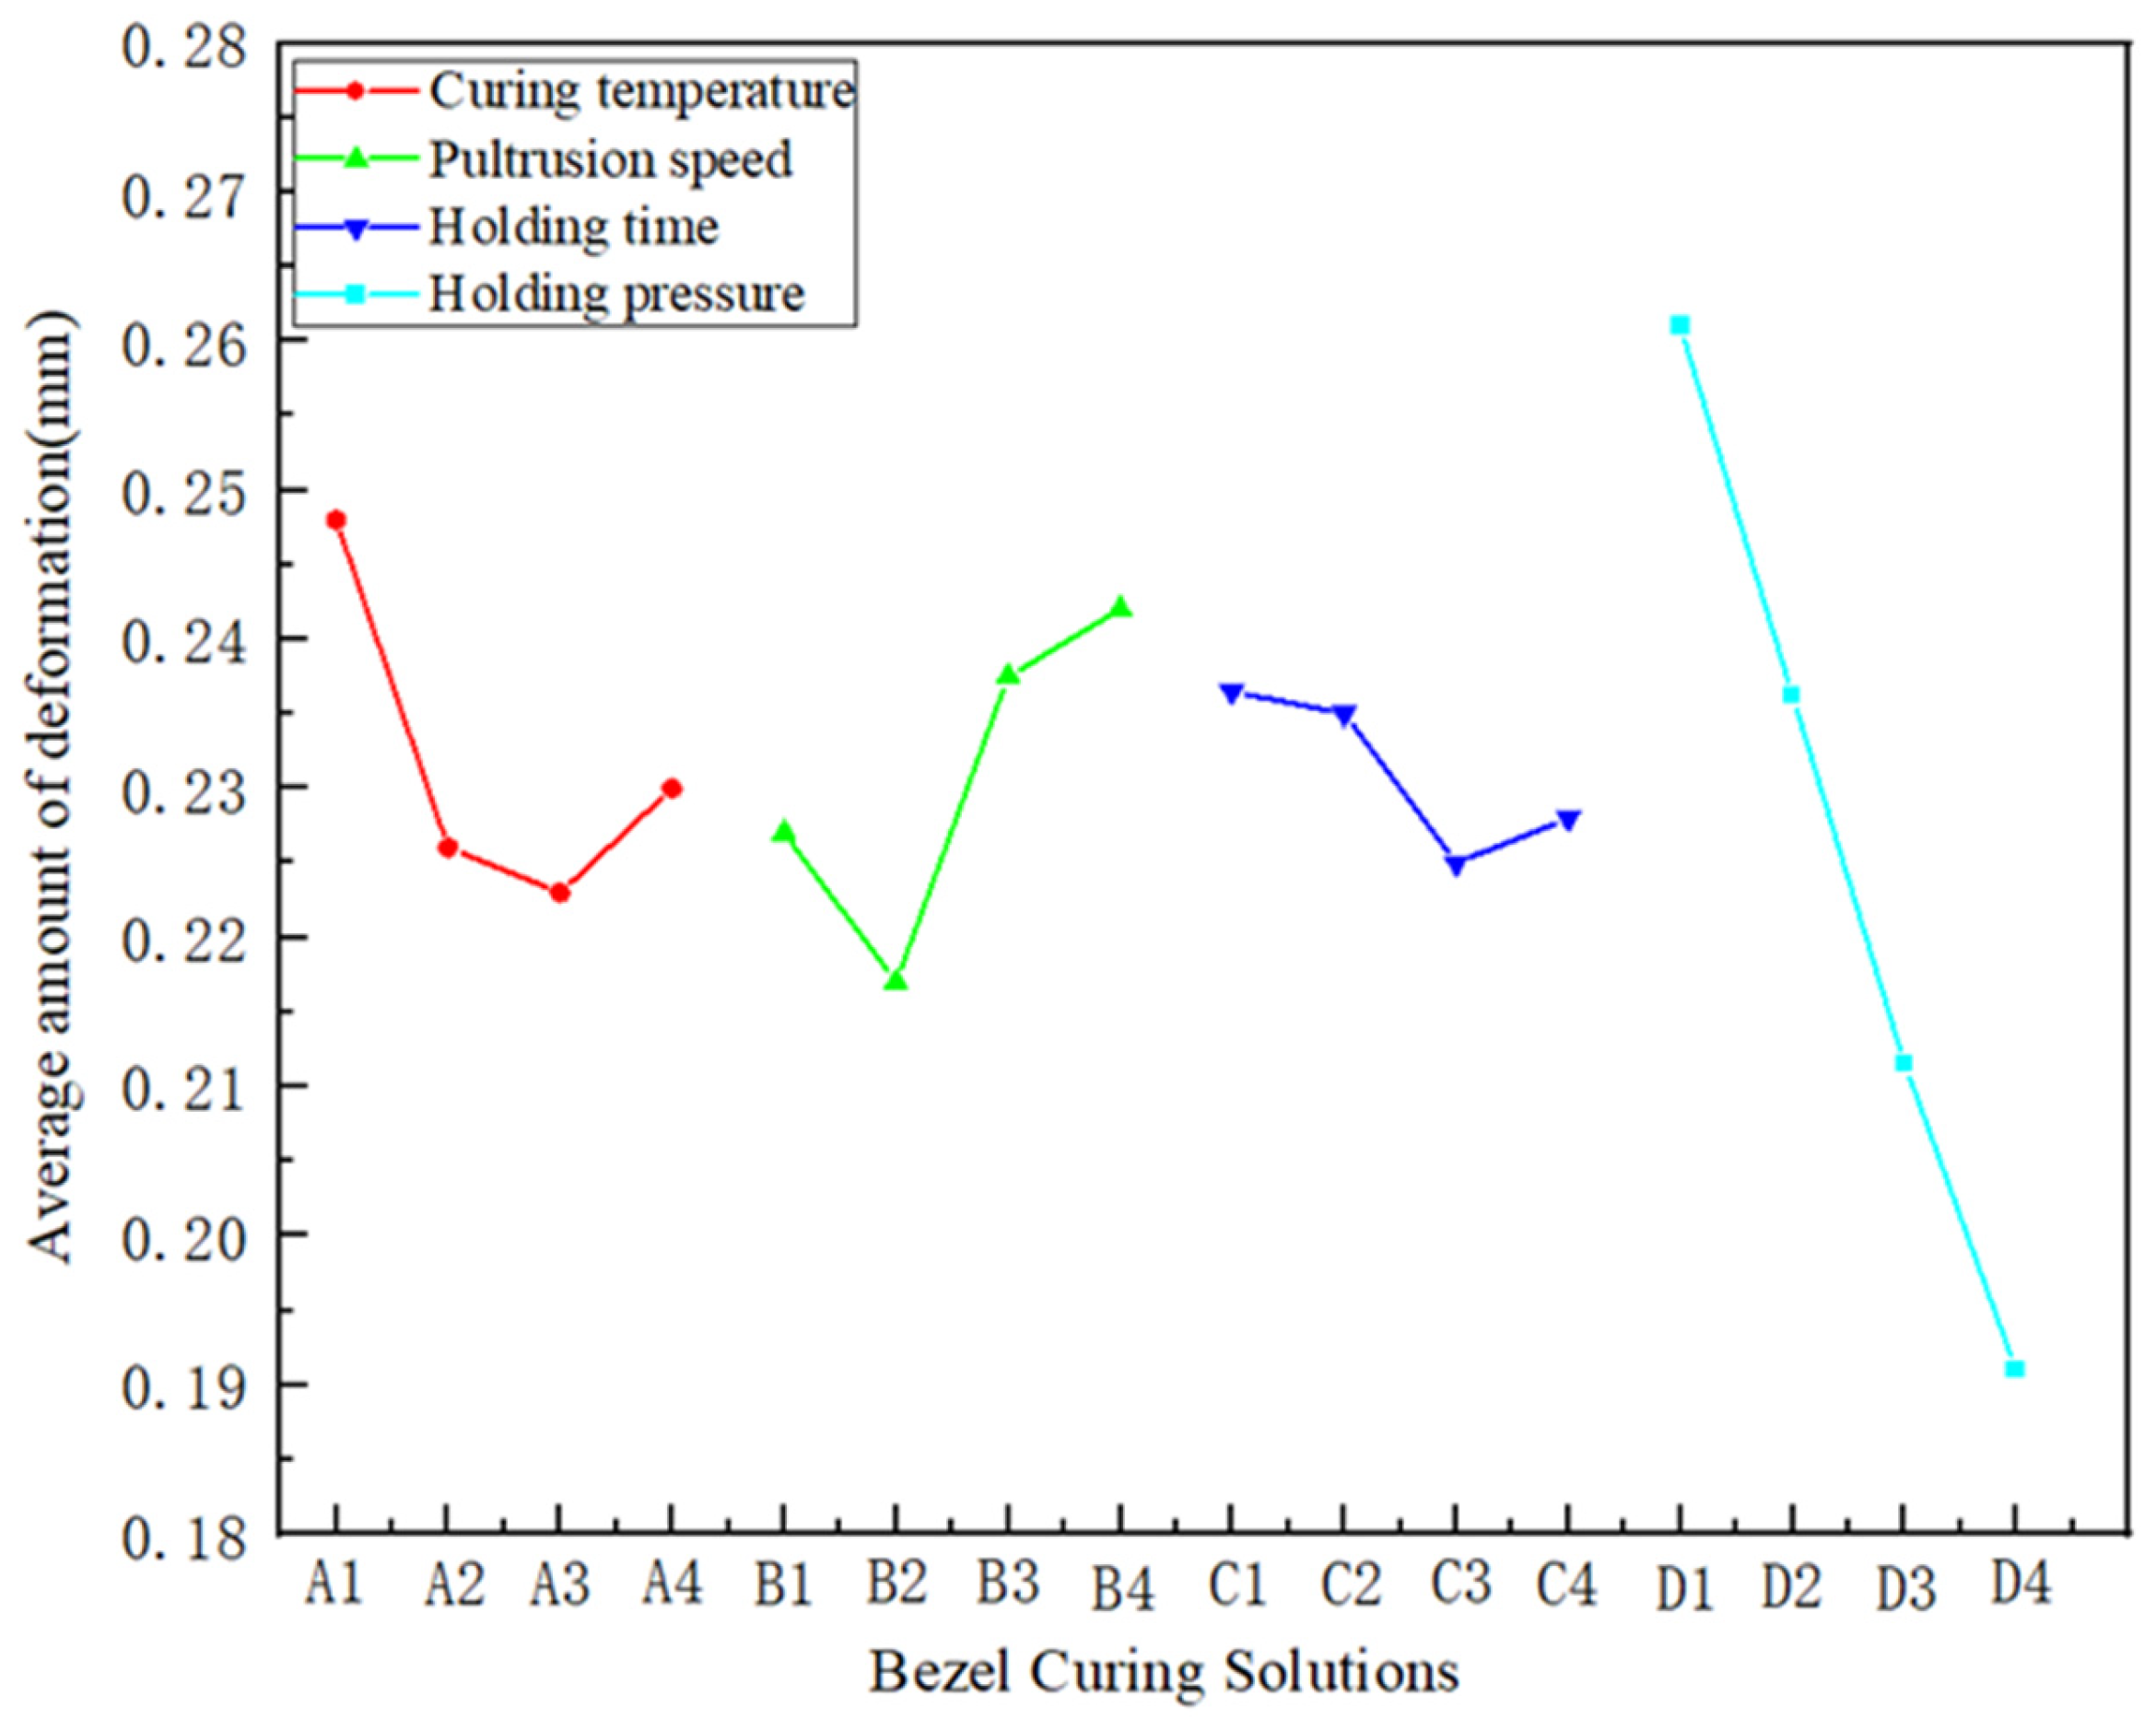
Mean value analysis was carried out with the aim of determining the effect of holding time, holding pressure, curing temperature, and pultrusion speed on the deformation of the bezel, and the distribution of deformation of the bezel with the effect of the factors is shown in Figure 7. The value of the vertical coordinate is the average value of the deformation of the frame by each factor at the same level, and the maximum mean value of deformation is 0.263 mm and the minimum is 0.196 mm. The deformation of the product decreases with the increase in holding pressure, and the increase in holding pressure ensures that the resin fully fills the mold and reduces the generation of bubbles and voids, which in turn reduces the deformation of the product; deformation decreases first and then increases with the increase in the holding time, and the prolonged holding pressure will lead to the deformation of the internal part of the composite. The long holding pressure will lead to the accumulation of internal stresses in the component, which may come from the shrinkage of the material or thermal stresses, thus increasing the possibility of deformation. The curing temperature and pultrusion speed decrease and then increase the amount of deformation with the increase in their respective level values. This phenomenon may be due to the fact that faster pultrusion speeds may lead to a temperature rise that is too rapid, which in turn prompts the curing process to occur more quickly, reducing the time for internal stresses to build up and thus decreasing the risk of curing deformation; a curing rate that is too rapid at higher temperatures leads to inadequate cross-linking of resin molecules, which in turn increases the material’s internal stresses, which as a result causes an increase in cure distortion.
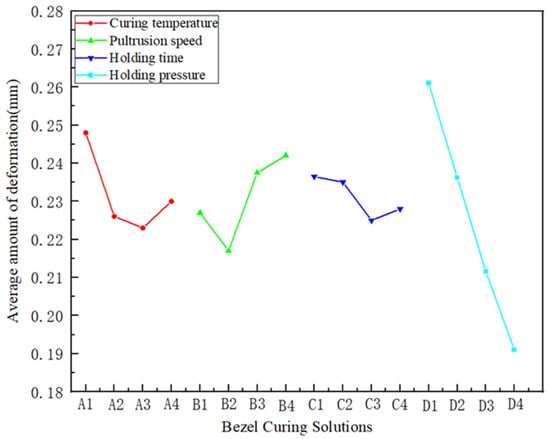
Figure 7.
Distribution of the influence of each factor on the amount of bezel deformation.
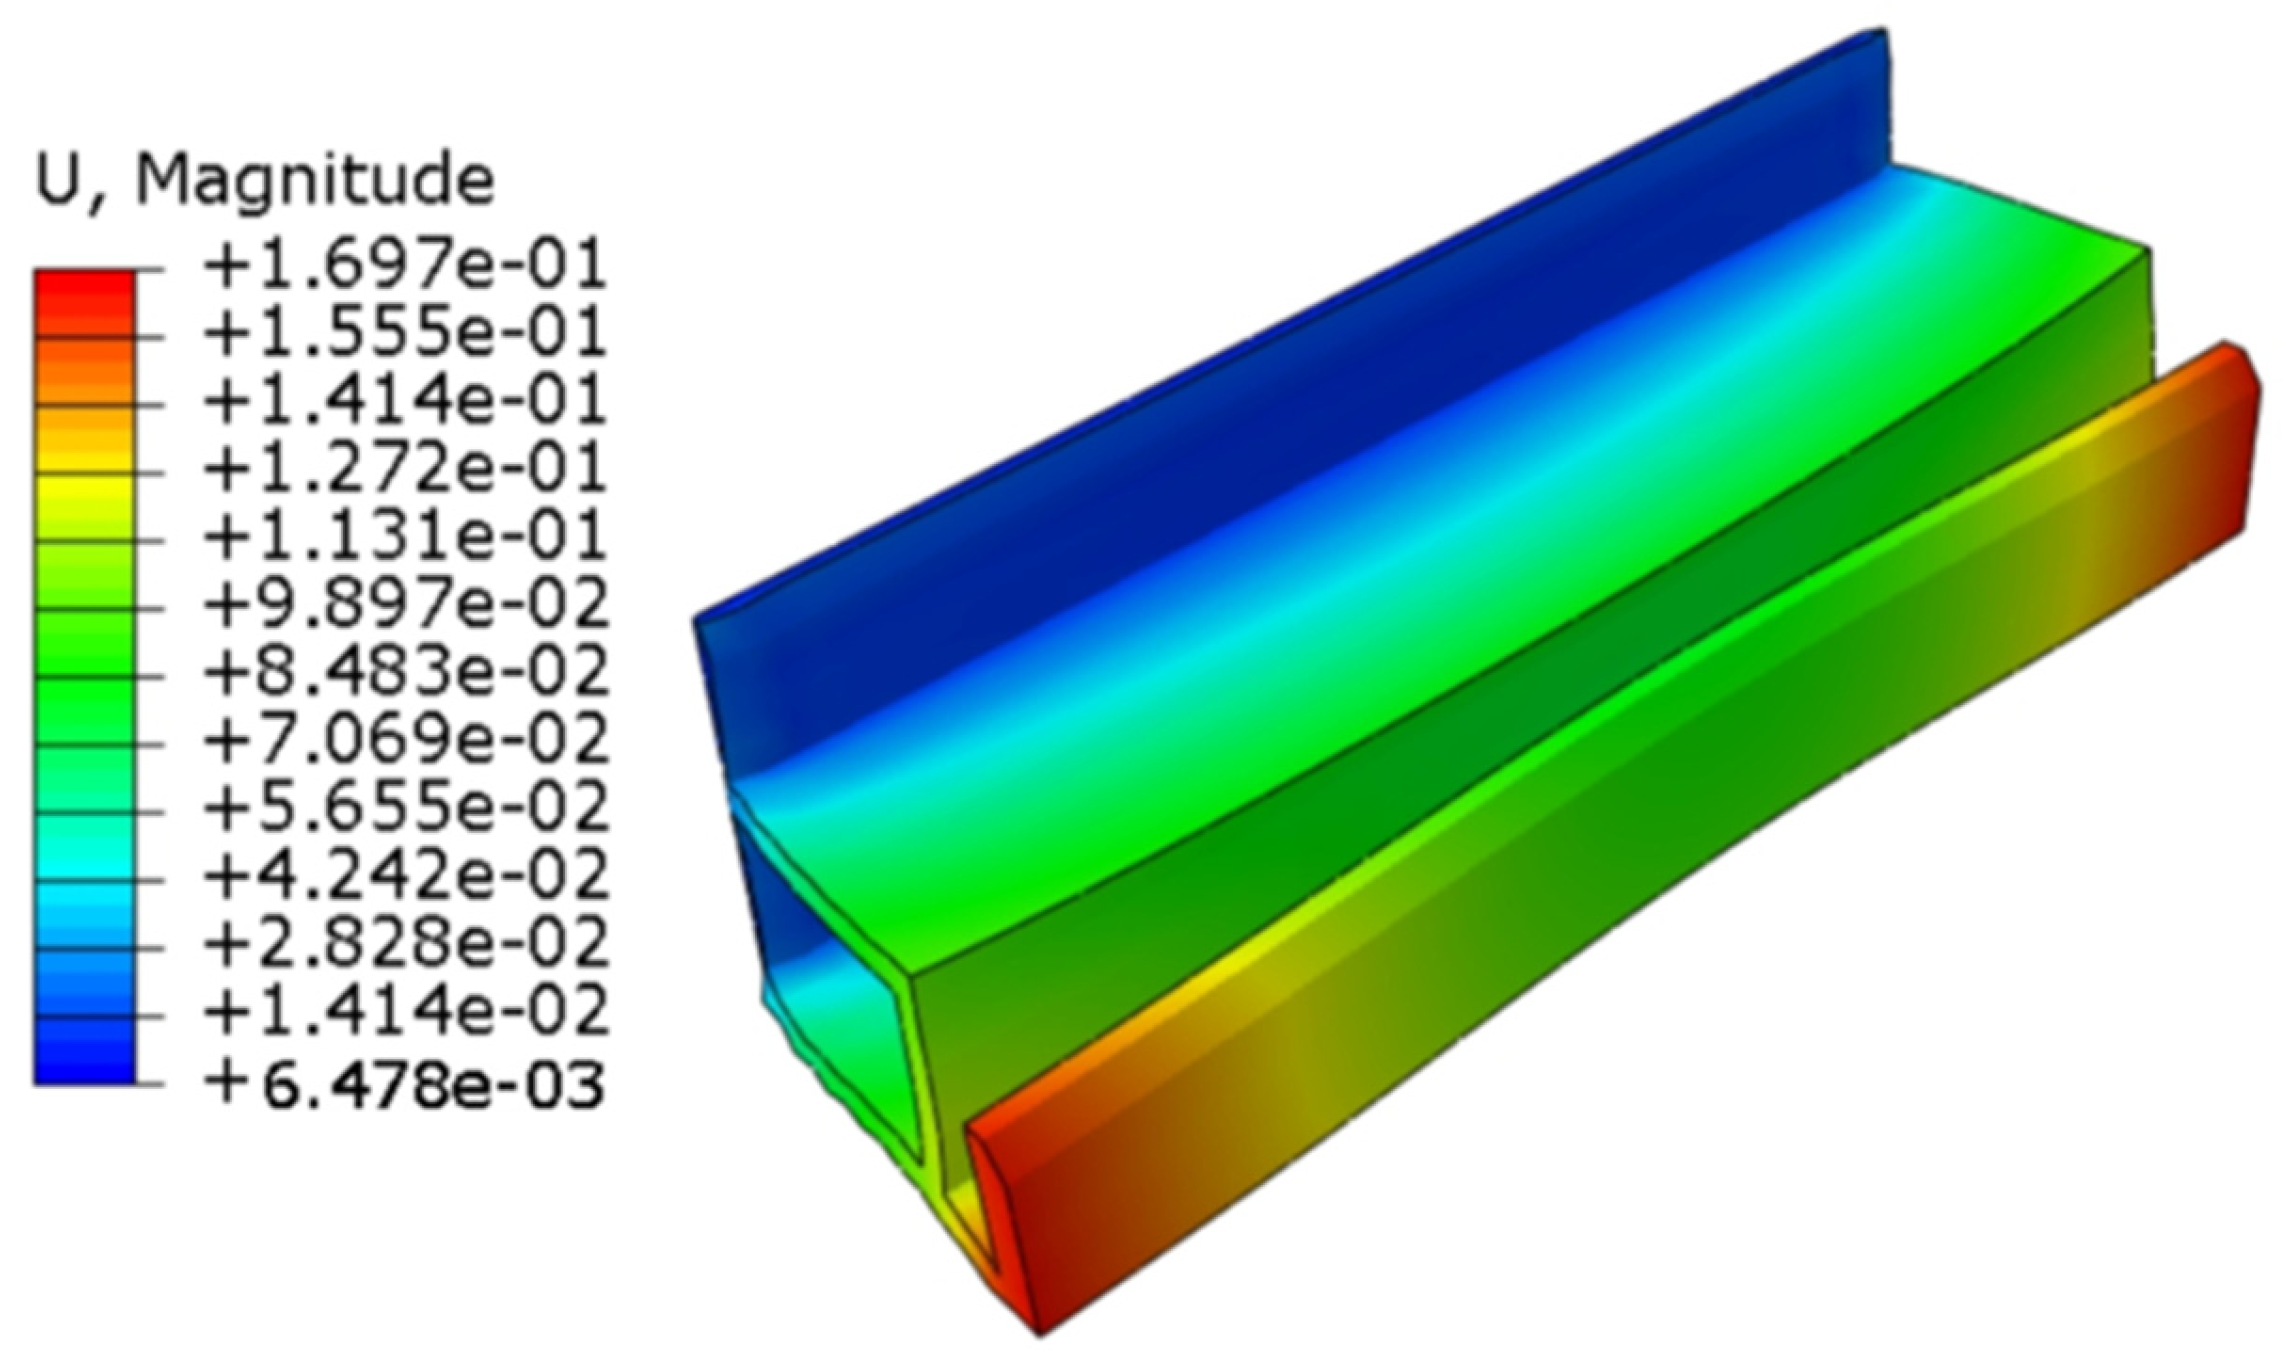
Taking the lowest point of the deformation of each fold in the figure, i.e., when the curing temperature is 150 °C, the pultrusion speed is 50 cm/min, the holding time is 12 s, and the holding pressure is 0.14 MPa, the optimal scheme is A3B2C3D4. Since this scheme is not present in the orthogonal table, another simulation analysis was carried out. The residual stresses of the simulation results are shown in Figure 8, and the deformation cloud diagram is shown in Figure 9. There are residual stresses of 1750 Pa and deformation of 0.1697 mm, which are smaller than any of the experimental results shown in the orthogonal test table.
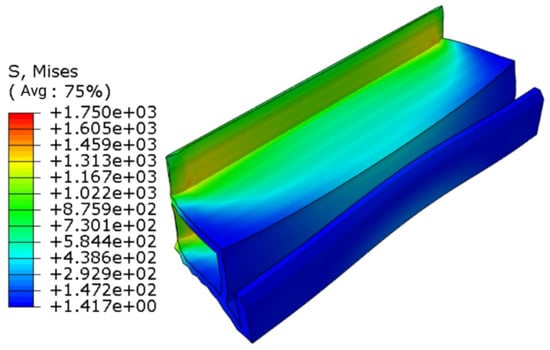
Figure 8.
Residual stress map of the bezel under optimal conditions.

Figure 9.
Border deformation cloud under optimal conditions.
The intuitive analysis method of orthogonal experimental design is unable to accurately estimate the magnitude of error in the experimental process and measurement of the results, resulting in the inability to determine whether a factor causes a difference in the experimental results at different levels and the inability to perform a test of significance. In order to be able to compensate for these shortcomings, we carried out an ANOVA, and Table 4 shows the results of the analysis.
Table 4.
ANOVA results for solidification deformation.
As can be seen from the results listed in Table 4, the holding pressure F-value of 2.874 has a significant influence on the amount of deformation of the product. In contrast, the other factors are insignificant, and the degree of influence, in descending order, is holding pressure > curing temperature > pultrusion speed > holding time. It should be noted that the above conclusions are reasonable for the parameter value intervals set in the study; however, different parameter value intervals may lead to different numerical results.
4. Conclusions
The results provided in this paper confirm the influence of process parameters on the curing deformation of components during the production of composite solar cell bezels using the pultrusion process. A new contribution to the knowledge of curing deformation during the pultrusion production of polyurethane composite solar cell bezels is provided through the development of a simulation prediction model. Although they all involve composite curing deformation simulations, most previous studies have involved the simulation of epoxy resin composites with simple cross-sections and paid less attention to the simulation of polyurethane fiberglass composites with complex cross-sections. The results of this study, therefore, provide a valuable reference for industrial practice.
The prediction of the state of parameters such as the degree of cure and resin elastic modulus during the curing process was carried out with the aim of calculating the residual stresses in the composites and the deformation after demolding by studying said parameters, so as to achieve effective control of the deformation problem during the curing process. The effects of multifactorial and multilevel molding process parameters on the amount of deformation of the bezel were investigated using an orthogonal experimental method, and the results were subjected to analysis of variance (ANOVA), with the results indicating that the degree of influence on the value of deformation of the bezel was, in descending order, holding pressure > curing temperature > pultrusion speed > holding time. When the process parameter level is set to A3B2C3D4, the deformation of the frame is minimized, which is in line with the actual production situation. These results also provide a reference for the pultrusion production of other types of composite components.
According to research findings, the curing process used in composite manufacturing is often accompanied by member deformation, which is an inevitable problem. To address this challenge, the authors of future studies could explore the application of more advanced numerical simulation techniques, especially digital twin technology, and the use of joint simulation with mold flow analysis software and ABAQUS as well to achieve more accurate prediction and control of the curing process. It is expected that such an approach will reduce the deformation of components and improve manufacturing efficiency and product quality. This will, in turn, lead to a reduction in production costs and the conservation of social resources.
Author Contributions
Conceptualization, R.W.; Funding acquisition, R.W.; Investigation, W.Z. (Wei Zhou) and W.Z. (Wenxing Zhou); Methodology, W.Z. (Wenxing Zhou) and Y.X.; Resources, Z.F.; Software, W.Z. (Wei Zhou), Y.X. and W.Z. (Wenxing Zhou); Supervision, R.W. and Z.F.; Writing—original draft, W.Z. (Wenxing Zhou); Writing—review & editing, R.W. and Z.F. All authors have read and agreed to the published version of the manuscript.
Funding
This research received no external funding.
Data Availability Statement
Data are contained within the article.
Conflicts of Interest
Author Zhenhua Fan is employed by the company Chongqing International Composite Material Co., LTD. The remaining authors declare that the research was conducted in the absence of any commercial or financial relationships that could be construed as a potential conflict of interest.
References
- Zhang, H.; Li, G.; Liu, Z.; Wang, Y.; Shao, M.; Wang, C.; Zheng, S.; Meng, Z.; Wang, Z.; Wei, H. Characterisation of domestic T700-grade carbon fibre and composite materials. New Chem. Mater. 2020, 48, 238–240. [Google Scholar]
- Li, B.; Wen, Y.Y.; Wang, Q.Z.; Gu, T.Z.; Li, M.; Zhang, Z.G. Wet thermomechanical properties of domestically produced carbon fibre/bimah resin composites for aerospace applications. J. Aerosp. Mater. 2020, 40, 80–87. [Google Scholar]
- Bao, J.W.; Jiang, S.C.; Zhang, D.J. Development status and trend of aerospace carbon fibre resin matrix composites. Sci. Technol. Her. 2018, 36, 52–63. [Google Scholar]
- Ye, Y. A case study on the development of composite materials for photovoltaic module applications. Glass Fibre 2023, 5, 46–48. [Google Scholar]
- Baran, I.; Cinar, K.; Ersoy, N.; Akkerman, R.; Hattel, J.H. A review on the mechanical modeling of composite manufacturing processes. Arch. Comput. Methods Eng. 2017, 24, 365–395. [Google Scholar] [CrossRef] [PubMed]
- Ding, A.X.; Li, S.X.; Ni, A.Q.; Wang, J. A review of numerical simulation studies on curing deformation and residual stress in thermoset resin matrix composites. J. Compos. Mater. 2017, 34, 471–485. [Google Scholar]
- Yuan, Z.Y.; Wang, Y.J.; Zhang, Y.; Yang, X.; Wang, J.; Wei, S. Multi-field coupled numerical simulation of composite curing process based on time-varying properties of material properties. J. Compos. Mater. 2015, 32, 167–175. [Google Scholar]
- Zhang, C.; Sun, Y.; Xu, J.; Shi, X.; Zhang, G. Study on curing deformation of composite thin shells prepared by M-CRTM with adjustable injection gap. J. Polymers. 2022, 14, 5564. [Google Scholar] [CrossRef] [PubMed]
- Wang, B.; Fan, S.; Chen, J.; Yang, W.; Liu, W.; Li, Y. A review on prediction and control of curing process-induced deformation of continuous fiber-reinforced thermosetting composite structures. J. Compos. Part A Appl. Sci. Manuf. 2023, 165, 107321. [Google Scholar] [CrossRef]
- Peng, X.; Xu, J.; Cheng, Y.; Zhang, L.; Yang, J.; Li, Y. An analytical model for cure-induced deformation of composite Laminates. J. Polymers. 2022, 14, 2903. [Google Scholar] [CrossRef]
- Wang, X.; Zhao, Y.; Su, H.; Jia, Y. Curing process-induced internal stress and deformation of fiber reinforced resin matrix composites: Numerical comparison between elastic and viscoelastic models. J. Polym. Polym. Compos. 2016, 24, 155–160. [Google Scholar] [CrossRef]
- Zhi, J.; Yang, B.; Li, Y.; Tay, T.E.; Tan, V.B.C. Multiscale thermo-mechanical analysis of cure-induced deformation in composite laminates using Direct FE2. J. Compos. Part A Appl. Sci. Manuf. 2023, 173, 107704. [Google Scholar] [CrossRef]
- Zhang, X.L.; Du, F.J.; Huang, W.C.; Fang, C.W. Simulation analysis and control of curing deformation of aircraft composite structures. Aviat. Comput. Technol. 2019, 49, 54–58. [Google Scholar] [CrossRef]
- Li, C.L.; Yu, N.; Wen, Y.Y. Numerical simulation and compensation of curing deformation of composite L-shaped structures. Plast. Ind. 2016, 44, 51–54. [Google Scholar]
- Yan, D.X. Deformation Prediction and Control of Carbon Fibre Composite C-Beam Fabrication. Ph.D. Thesis, Shanghai Jiao Tong University, Shanghai, China, 2020. [Google Scholar]
- Yuan, Z.Y.; Wang, Y.J.; Yang, K.; Liu, T.J.; Wang, J.B.; Wei, S.M.; Zhao, G.Q.; Wei, J.P. Numerical simulation of thermoset resin matrix composite hot diaphragm moulding process. J. Compos. Mater. 2016, 33, 1339–1350. [Google Scholar]
- Zou, Y.; Cai, Y.J. Numerical simulation and verification of solidification deformation of long-truss composite parts. Aeronaut. Manuf. Technol. 2020, 63, 94–101. [Google Scholar]
- Zhu, H.H.; Zhang, L.; Yu, N. Simulation of curing process and deformation prediction for composite thin-walled parts. J. Plast. Eng. 2020, 27, 146–153. [Google Scholar]
- Wu, Q.; Zhao, K.; Liu, P.F.; Zhang, T.T.; Zhu, D.Y. Curing deformation analysis of Z-shaped fiber-reinforced composite laminates. Compos. Sci. Eng. 2024, 3, 84–90. [Google Scholar]
- Johnston, A.; Vaziri, R.; Poursartip, A. A plane strain model for process induced deformation of laminated composite structures. Compos Mater 2001, 35, 1436–1469. [Google Scholar] [CrossRef]
- Ersoy, N.; Garstka, T.; Potter, K.; Wisnom, M.R.; Porter, D.; Stringer, G. Modelling of the spring-in phenomenon in curved parts made of a thermosetting composite. Compos. Part A 2010, 41, 410–418. [Google Scholar] [CrossRef]
- Jiao, Y.L.; Zhong, B.X.; Xiao, D.R. Analysis and control of cured deformation of fiber-reinforced thermosetting composites: A review. J. Zhejiang Univ.-Sci. A 2019, 20, 311–333. [Google Scholar]
- Johnston, A.A. An Integrated Model of the Development of Process-Induced Deformation in Autoclave Processing of Composite Structure. Ph.D. Thesis, The University of New Brunswick, Fredericton, NB, Canada, 1997. [Google Scholar]
- Sorrentino, L.; Bellini, C. Validation of a methodology for cure process optimization of thick composite laminates. Polym.-Plast. Technol. Eng. 2015, 54, 1803–1811. [Google Scholar] [CrossRef]
- Bellini, C.; Sorrentino, L. Analysis of cure induced deformation of CFRP U-shaped laminates. Compos. Struct. 2018, 197, 1–9. [Google Scholar] [CrossRef]
- Bogetti, T.A.; Gillespie, J.W., Jr. Two-Dimensional Cure Simulation of Thick Thermosetting Composites. J. Compos. Mater. 1991, 25, 239–273. [Google Scholar] [CrossRef]
- Bogetti, T.A.; Gillespie, J.W.; McCullouqh, R.L. Influence of Processing on the Development of Residual Stresses in Thick Section Thermoset Composites. Int. J. Mater. Prod. Technol. 1994, 9, 170–182. [Google Scholar]
- Svanberg, J.M.; Holmberg, J.A. Prediction of shape distortions. Part II. Experimental validation and analysis of boundary conditions. Compos. Part A Appl. Sci. Manuf. 2004, 35, 723–734. [Google Scholar] [CrossRef]
- Shah, S.P.; Patil, S.U.; Hansen, C.J.; Odegard, G.M.; Maiarù, M. Process modeling and characterization of thermoset composites for residual stress prediction. J. Mech. Adv. Mater. Struct. 2023, 30, 486–497. [Google Scholar] [CrossRef]
- Svanberg, J.M.; Holmberg, J.A. Prediction of shape distortions Part I. FE-implementation of a path dependent constitutive model. Compos. Part A Appl. Sci. Manuf. 2004, 35, 711–721. [Google Scholar] [CrossRef]
- Bogetti, T.A.; Gillespie, J.W., Jr. Process-induced stress and deformation in thick-section thermoset composite laminates. J. Compos. Mater. 1992, 26, 626–660. [Google Scholar] [CrossRef]


Disclaimer/Publisher’s Note: The statements, opinions and data contained in all publications are solely those of the individual author(s) and contributor(s) and not of MDPI and/or the editor(s). MDPI and/or the editor(s) disclaim responsibility for any injury to people or property resulting from any ideas, methods, instructions or products referred to in the content. |
© 2024 by the authors. Licensee MDPI, Basel, Switzerland. This article is an open access article distributed under the terms and conditions of the Creative Commons Attribution (CC BY) license (https://creativecommons.org/licenses/by/4.0/).