Article

Feasibility Study on Active Structural Attenuation: Addressing Multiband Vibration in Automotive Vehicles on 2D Asymmetric Structures with a Faulty Horizontal Actuator

1
Daegu Mechatronics & Materials Institute, 32, Seongseogongdan-ro 11-gil, Dalseo-gu, Daegu 42714, Republic of Korea
2
School of Mechanical Engineering, Yeungnam University, 280, Daehak-ro, Gyeongsan-si 38541, Republic of Korea
*
Author to whom correspondence should be addressed.
Symmetry 2024, 16(6), 727; https://doi.org/10.3390/sym16060727
Submission received: 8 March 2024 / Revised: 29 May 2024 / Accepted: 7 June 2024 / Published: 11 June 2024
(This article belongs to the Section Engineering and Materials)

Abstract

:
This work presents a study on the modeling, analysis, and control of asymmetric source structures, which focuses on a multi-directional active mounting system that aims to consider the location and orientation of an actual automotive powertrain mount. An active mount was created by connecting a PZT (piezo-stack) actuator with a rubber grommet. Additional force necessary for every mount was determined by using forces caused by harmonic stimulation and the control input has the capability to reduce vibrations by engaging in detrimental opposition against the input. In addition, the vibration in the horizontal direction can be reduced with the adjustment of variables that can be modified via the dynamic interconnection of the source frame. This study especially evaluated the effectiveness of vibration reduction without a horizontal active component and determined the feasibility of control. Through sequences of simulated outcomes, it was demonstrated that the implementation of this asymmetric, bi-directional (both horizontally and vertically) active mount may effectively reduce stimulation oscillations. Additionally, a numerical validation was performed to reduce the vibrations generated by the modulation. It was accomplished by observing the system’s response utilizing a digital filter with a normalized least mean square method. The simulations of adaptive digital filters demonstrated that the efficacy of control diminishes when faced with intricate noise and signals, while the attenuation trend stays unaltered.

1. Introduction

1.1. Research Background

The operation of most mechanical devices generates vibration and noise, which reduces machine performance in terms of dependability and longevity. In light of the accelerated advancements in technology, it is critical that products provide satisfactory performance and elicit emotional responses through the five human senses. As an illustration, during the previous stage of automobile development, durability, fuel economy, and crash performance were considered essential for this emblematic emotional product. In recent times, however, consumers have emphasized performances on ride comfort and noise vibration harshness (NVH). Figure 1a depicts the overall engine and transmission (powertrain) configuration of an automobile, consisting of an engine with two brackets and a transmission with one bracket. The brackets function as a means of linking the subframe of the car and also act as a rubber mount to minimize the transmission of vibration from the powerplant. Figure 1b depicts the real powertrain of a commercial car, with the red circle indicating the specific section of the automotive mounts linked to the car frame. The left upper one is the engine mount, the right upper one is the transmission mount, and the bottom one is the roll rod. The advances in electric vehicles have introduced the challenge of vibration and noise control that is more crucial to achieve because of the force stimulation generated from the powertrain, such as the inverter, gearbox and motor, as opposed to the excitation force of traditional engines. More research and the design of engine mounts that support the vehicle powertrain and insulate the interior from vibrations transmitted by the powertrain are needed.
While conventional engine mounting systems effectively mitigate vibrations at low frequencies, they cannot do so at high frequencies. Currently, these techniques are found in the overwhelming majority of commercial vehicles. Consequently, active mount structures with smart actuators are attracting considerable attention as a pivotal methodology in the research of automotive manufacturing. This technology can enhance performances on ride comfort and NVH within a versatile context with the adjustment of mount characteristics to correspond with either a low or high range of frequency. Figure 2 is a visionary illustration of the active vibration control technology utilized in the mounting system of automobiles. The basis of this system is that, when a sinusoidal perturbation is produced, as seen above on the left, the actuator generates an additional (secondary) force with the same frequency and amplitude, but with a phase difference of 180 degrees from the disturbance. By combining these two signals, it is theoretically possible to totally eliminate the resulting vibration at the conclusion.

1.2. Review of Previous Works

A powertrain mounting system for automotive vehicles is a component that holds up the engine and transmission of a car and restricts their vibration from transferring to the chassis of the car. Rubber is typically used because it is viscoelastic, but it is only effective as insulation within the range of relatively low frequencies and cannot prevent vibration within the range of relatively high frequencies. Automotive fields have recently invested heavily in commercializing electric cars, and considerable research is being conducted to deal with the unexpected force caused by motors and gearboxes, which is more complicated than that generated by the internal combustion engines that are now in use. Yu et al. [1] reported the fundamentals and constraints of three difference mount types (passive, active, and half active). Elastic and manual hydraulic mountings are examples of representative passive mounts. These mounts can control vibration within the range of relatively low frequencies, but have limits regarding their inability to do so in the high-frequency region. Electrorheological (ER) and magnetorheological (MR) fluid mounts are commonly used in half-active mounts. These mounts exhibit a superior vibration control ability within the range of low frequencies distinguished with passive ones, yet they are still unable to control vibration within the range of high frequencies. Examples of typical active mounting systems consist of active hydraulic and elastic mountings, which integrate an actuator with an original rubber (passive) mount. The control of vibrations in both high- and low-frequency ranges may be achieved by adjusting the dynamic stiffness of the actuator specific to each frequency band.
Hosseini et al. [2] devised an experimental setup and a nonlinear model of a motor mount with a solenoid actuator. Kraus et al. [3] demonstrated that a mechanism for reducing noise and vibration in an engine mount may be achieved by connecting a viscous damper and an actuator side by side. Chae et al. [4] reduced vibrations on an ambulance bed stage by incorporating an MR damper. Yang et al. [5] used an adaptive technique using a multinotch filter to mitigate vibrations on four hydromechanical actuators. Jeon et al. [6] introduced a new controllable mount system for engine. This system utilized a piezoelectric stack-type actuator and a magnetorheological fluid actuator. Jiang et al. [7] applied a magnetostrictive actuator to control active vibration. Fakhari et al. [8] demonstrated attenuation with the application of an adaptive control with a robust model to an engine mount with electromagnetic actuators by way of simulations and experiments. Elahinia et al. [9] developed a half-active actuator containing electrorheological and magnetorheological fluids for the isolation of vibrations and shock. Wu et al. [10] developed a vibration reducer utilizing the high-static and low-dynamic stiffness properties of a negative-stiffness magnetized spring. Truong [11] performed the simulation of a hydraulic engine mount based on mathematical modeling. Kamada et al. [12] reported that active vibration control can be achieved by combining a column and piezo-stack actuator to attenuate structural vibrations. Loukil et al. [13] introduced a methodology that harnesses the energy of a piezoelectric actuator to achieve efficient isolation. Sui et al. [14] utilized piezoelectric actuators to fabricate an automotive engine mounting system that exhibited rapid response properties; they validated the performance of the mount in reducing vibrations using simulations.
Choi et al. designed a sliding mode controller (SMC) to compare the vibration reduction capabilities of the engine mount with ER fluid using the shear mode [15]. In contrast to the scenario where a constant electric field is supplied, the vibration response decreased using the SMC with a variably changing electric field for the input current. Sarkar et al. [16] proposed utilizing MR fluid to produce the perfect engine mount. The fluid reduced vibrations across the whole range of frequency by regulating the dynamic stiffness using a magnetic field [16]. On the other hand, when used as an engine mount, there was the issue of fluid leakage that was very difficult to regulate. Chang et al. extended the dynamic vibration absorber approach to include the quasi-zero stiffness method to control the anti-resonance formed in the ultra-low frequency that was not controllable by DVAs [17]. Liette et al. reduced the automotive noise and vibration attenuation capabilities in the PE (power electric) frequency region of a hybrid vehicle [18] using an active mounting system that connects a passive mount and a piezo-stack actuator in series. Hong and Kim [19] analyzed a mounting system comprising three mounts, including one active path, along with the combination of a piezoelectric stack actuator and a passive mount on a plate-structured automotive model. Hong and Kim [20] devised a quantification method for analytically determining the optimal inputs for active structural trajectories. Numerically, the derived inputs performed admirably, but they may benefit from some experimental tuning.
Qiu et al. suggested standards of the active elements’ placement to minimize vibration based on their verification of the efficacy of vibration reduction concerning the shift in the location of the piezoelectric stack actuator in the model of plate-type structures [21]. Two issues being experienced by the existing mounting method are fluid leakage and uncontrollability in the high-frequency band, which may be best addressed with this approach. It can also benefit from the low power and quick reaction times of the PZT. The controller is also a crucial consideration when using active engine mounts (AEMs). Hausberg et al. used the adaptive filter Fx-LMS method to forecast the dynamic properties of AEMs after conducting a theoretical and experimental analysis of the secondary path change in AEMs [22]. Bartel et al. [23] proposed a new engine mount design that includes dynamic force resistance. The outcomes confirmed that the suggested mounting system for engines could mitigate vibrations.
Several ongoing research projects are now working on implementing active control using skyhook attenuation. Li and Goodall [24] investigated several control approaches used in the active suspension systems of railway cars and applied skyhook damping control. The velocity signal was filtered using nonlinear methods based on the Kalman filter. The authors Singal and Rajamani [25] included an energy-adaptive skyhook gain into their innovative zero-energy active suspension system. The system operated actively across a broad range of frequencies and passively over all frequencies. Emura et al. [26] introduced a semi-active suspension system that incorporates skyhook damping to allow for active control of the damping coefficient and system design. Chai et al. investigated the practical use of composite lattice sandwich plates with a piezoelectric actuator and sensor for active control purposes. The plates’ reactions were calculated by the use of nonlinear equations, and the implementation of velocity feedback and H-infinity controllers [27].

1.3. Research Purpose

Diverse research cases provide evidence that many intelligent material formulations have been suggested to insulate the vehicle body from vibrations caused by the engine. Implementing smart structure-based engine mounting systems for vibration isolation presents challenges in regulating vibrations across a broad frequency range. The half-active engine mount, which uses electro- and magneto-rheological fluids, is particularly susceptible to fluid leakage and is thus unreliable. For covering a broad frequency range and better reliability, a hybrid mounting system (both passive and active) comprising rubber, a viscoelastic material, and a piezoelectric stack-type actuator was suggested as a solution to this issue. However, since the actuators are along the force path and affected by the engine force directly, a durability issue can occur. This can be overcome by using a type of casing that can endure transmitted force. In addition, a technique was suggested for mitigating vibration using a digital filter as the actuator input and a signal that tracked the system’s response. Furthermore, the configuration can be modified to reduce vibrations within a narrow band or when a specific frequency is aroused. Nevertheless, this approach does not apply to electric vehicles, which generate complex signals from the gearbox, transmission, and motor.
If the structure is symmetric, horizontal motion can be ignored with vertical excitations only. However, the layouts of typical powertrain systems are mostly asymmetric and the horizontal motion will be relatively large with vertical excitations, so that it cannot be disregarded. Hence, the present study devised a source–paths–receiver configuration considering the vertical and horizontal combination of vehicle engine mounts. Vibration reduction was assessed using a piezoelectric stack actuator and a passive mount-coupled active mount. A comprehensive methodology is recommended for analyzing the vibrational behavior of mounting structures. The interactions of a structure whose design was influenced by an automotive mount with respect to lateral and vertical vibrations are investigated. Additionally, a comparison and evaluation of the efficacy of vibration attenuation are conducted regarding the particular locations utilized for the actuator input measurement. In conclusion, multispectral stimulations are employed to the proposed framework to evaluate its ability to reduce vibrations caused by relatively intricate vibrations.
The present work is structured in this way: Section 2 introduces a 5DOF model, where active mounts are integrated in the horizontal and vertical orientations to mitigate vibration, considering the scenario where the horizontal mounting system breaks down, and thus only the vertical mounting system continues to function without any interruptions. The attenuation level is evaluated by enumerating the input analytically for individual paths after the structure is stimulated by a single sinusoidal signal. Furthermore, an analysis was performed to compare the mitigation ability of the system when relatively complicated signals (such as modulated signals) are excited, and the response signal was traced using the NLMS algorithm versus when the analytically calculated input signal is used in the secondary path (Section 3). Section 4 provides a summary of the findings of this paper as well as suggestions for future research.

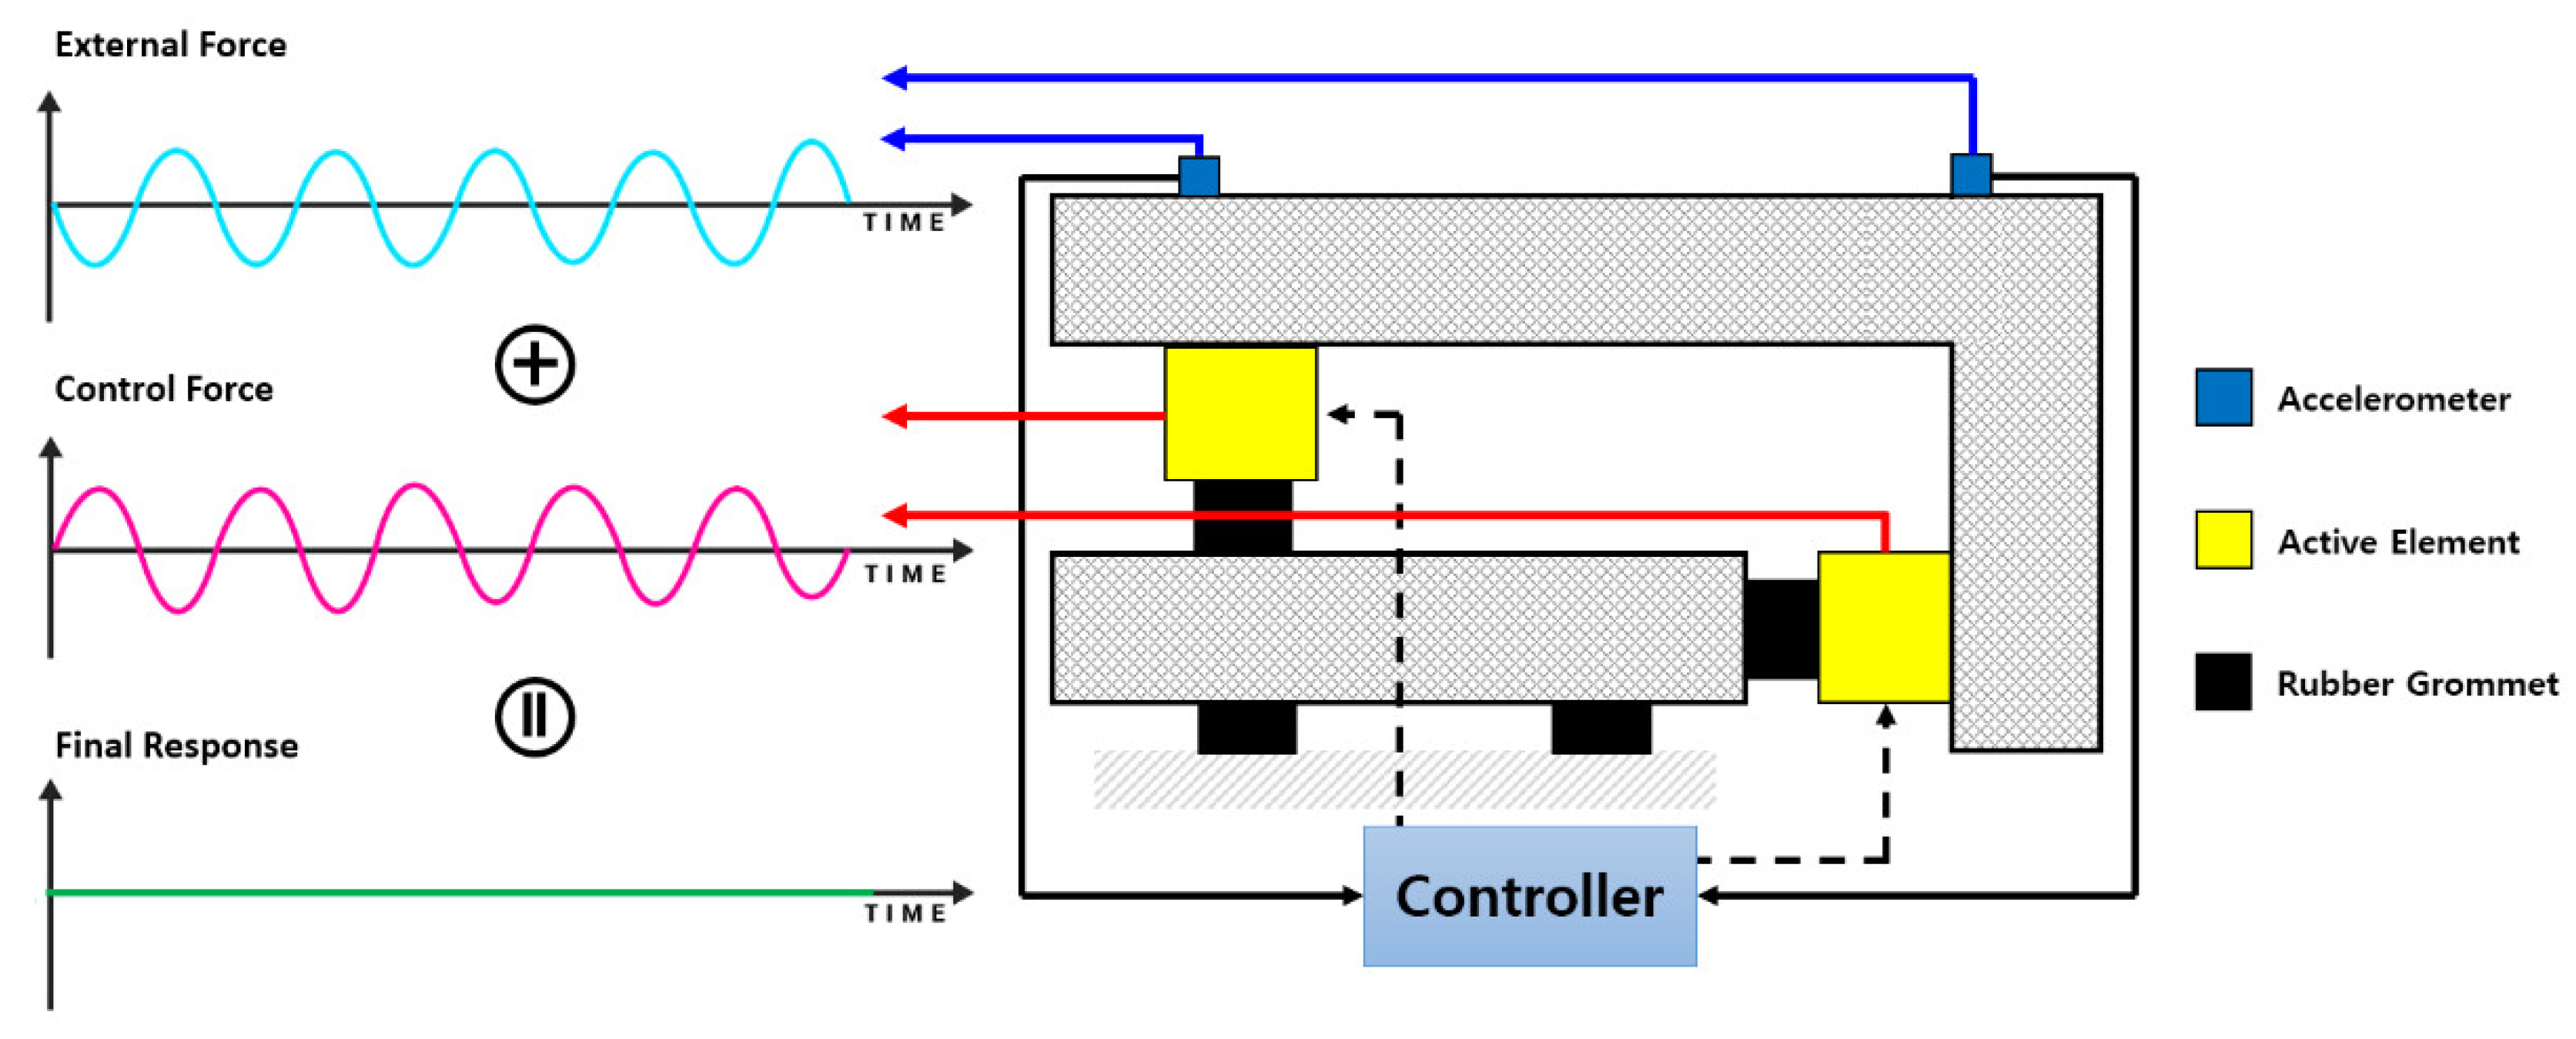
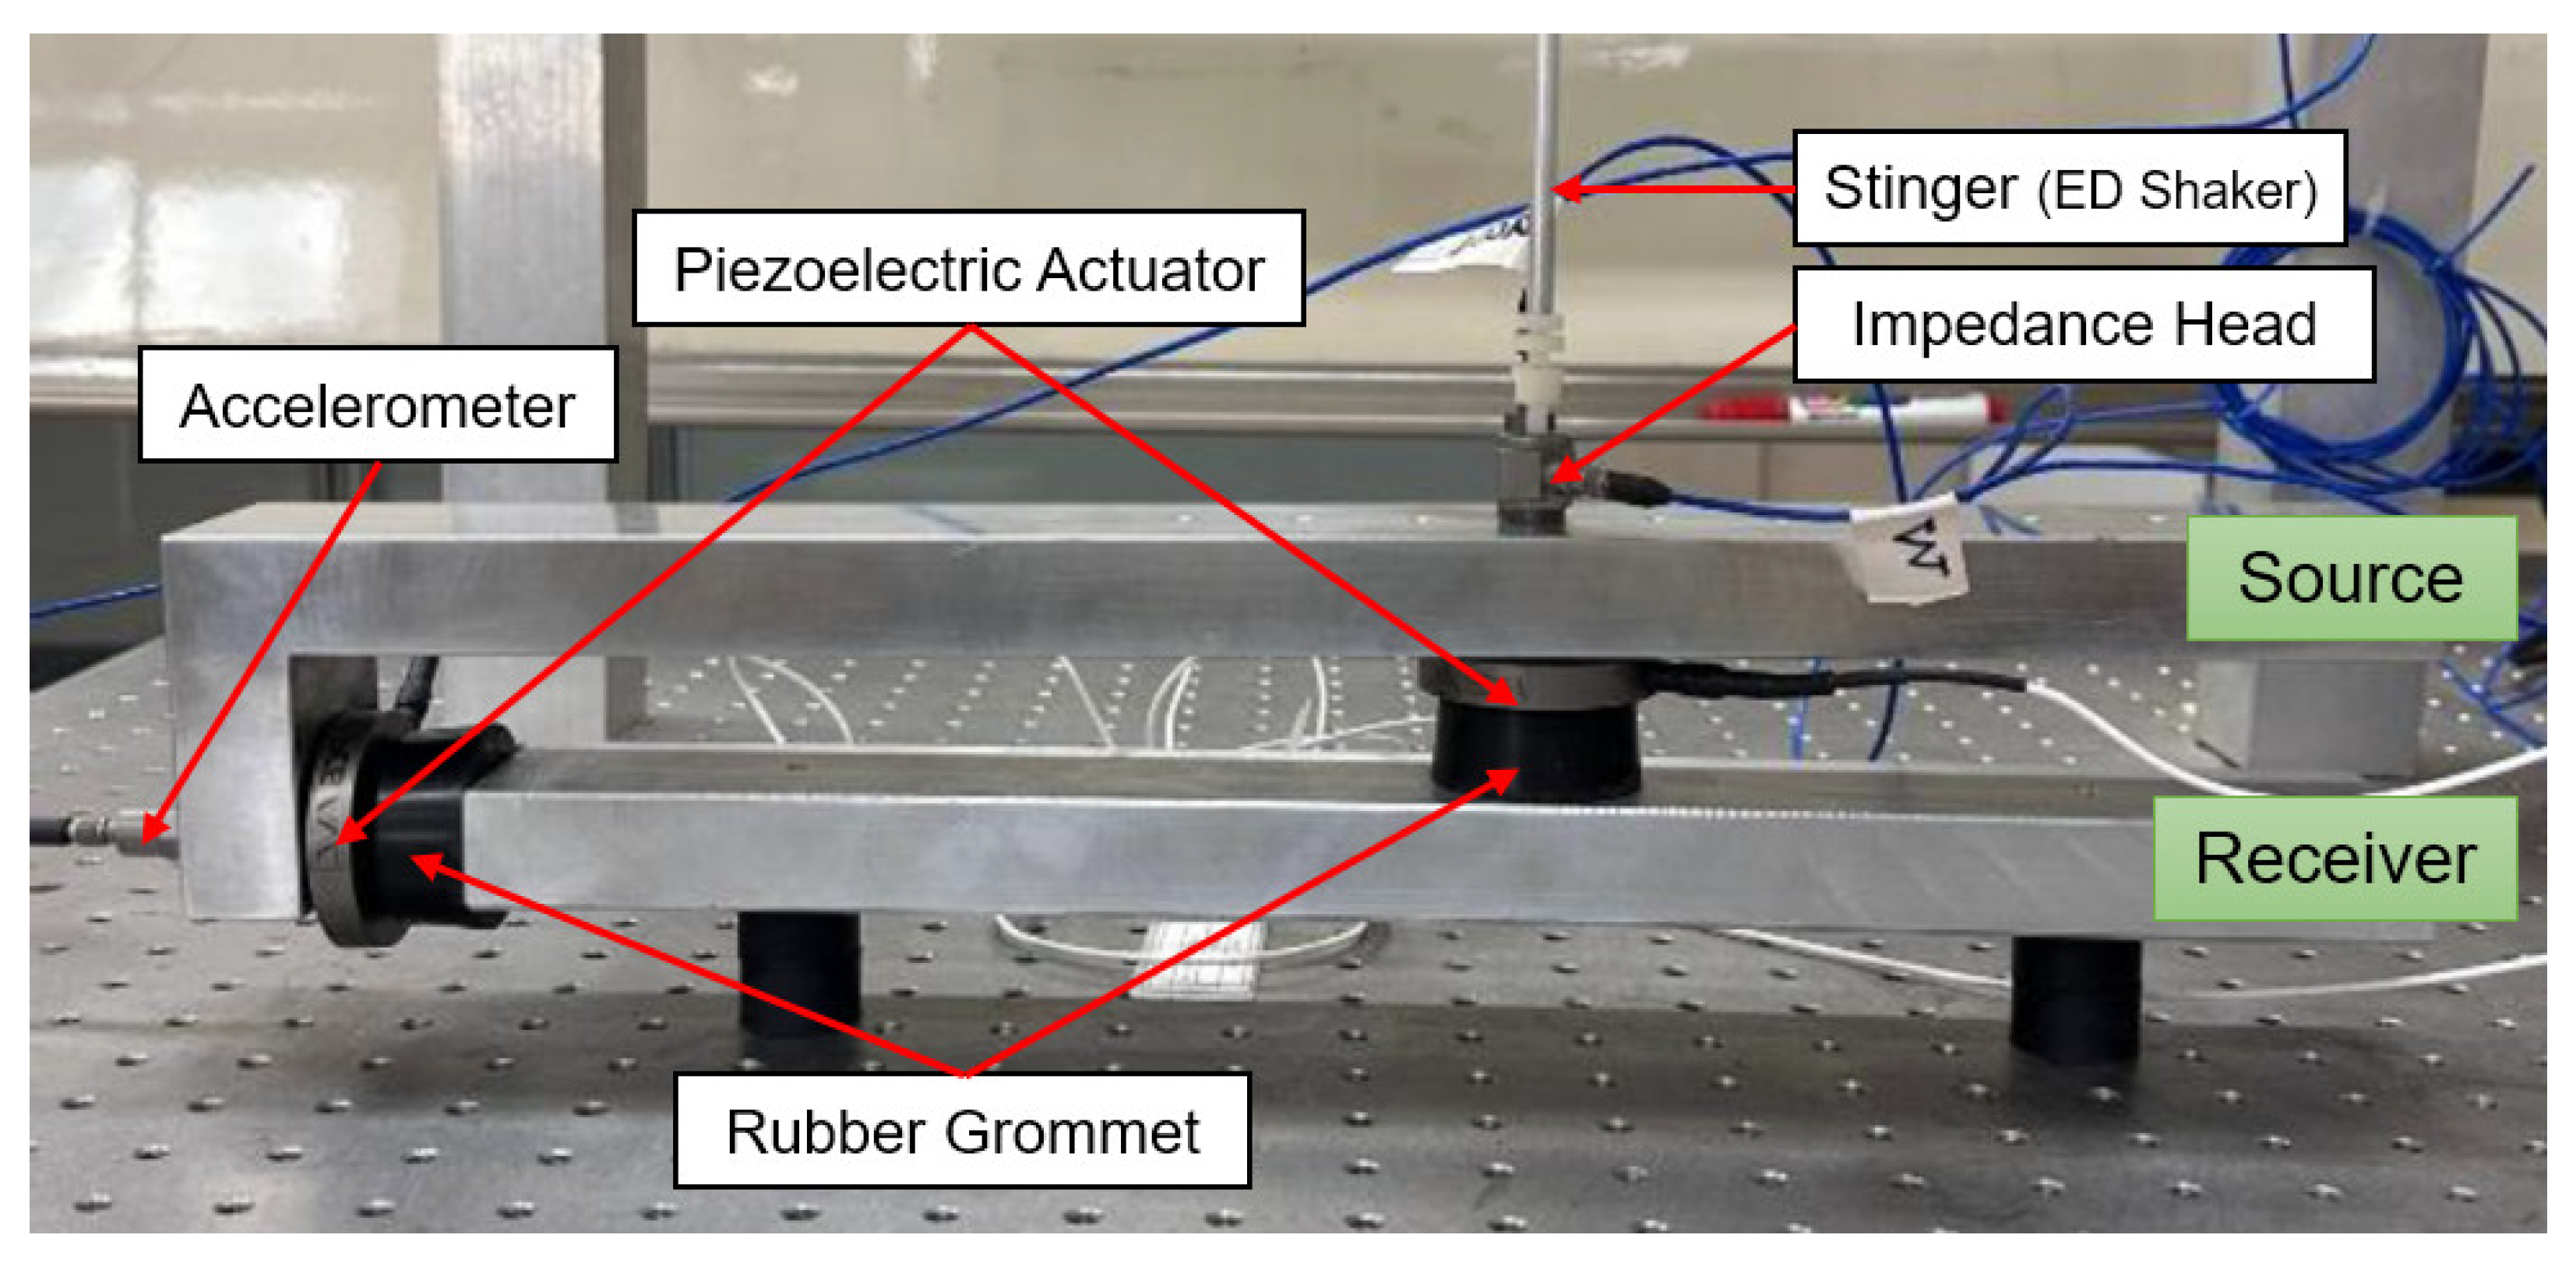
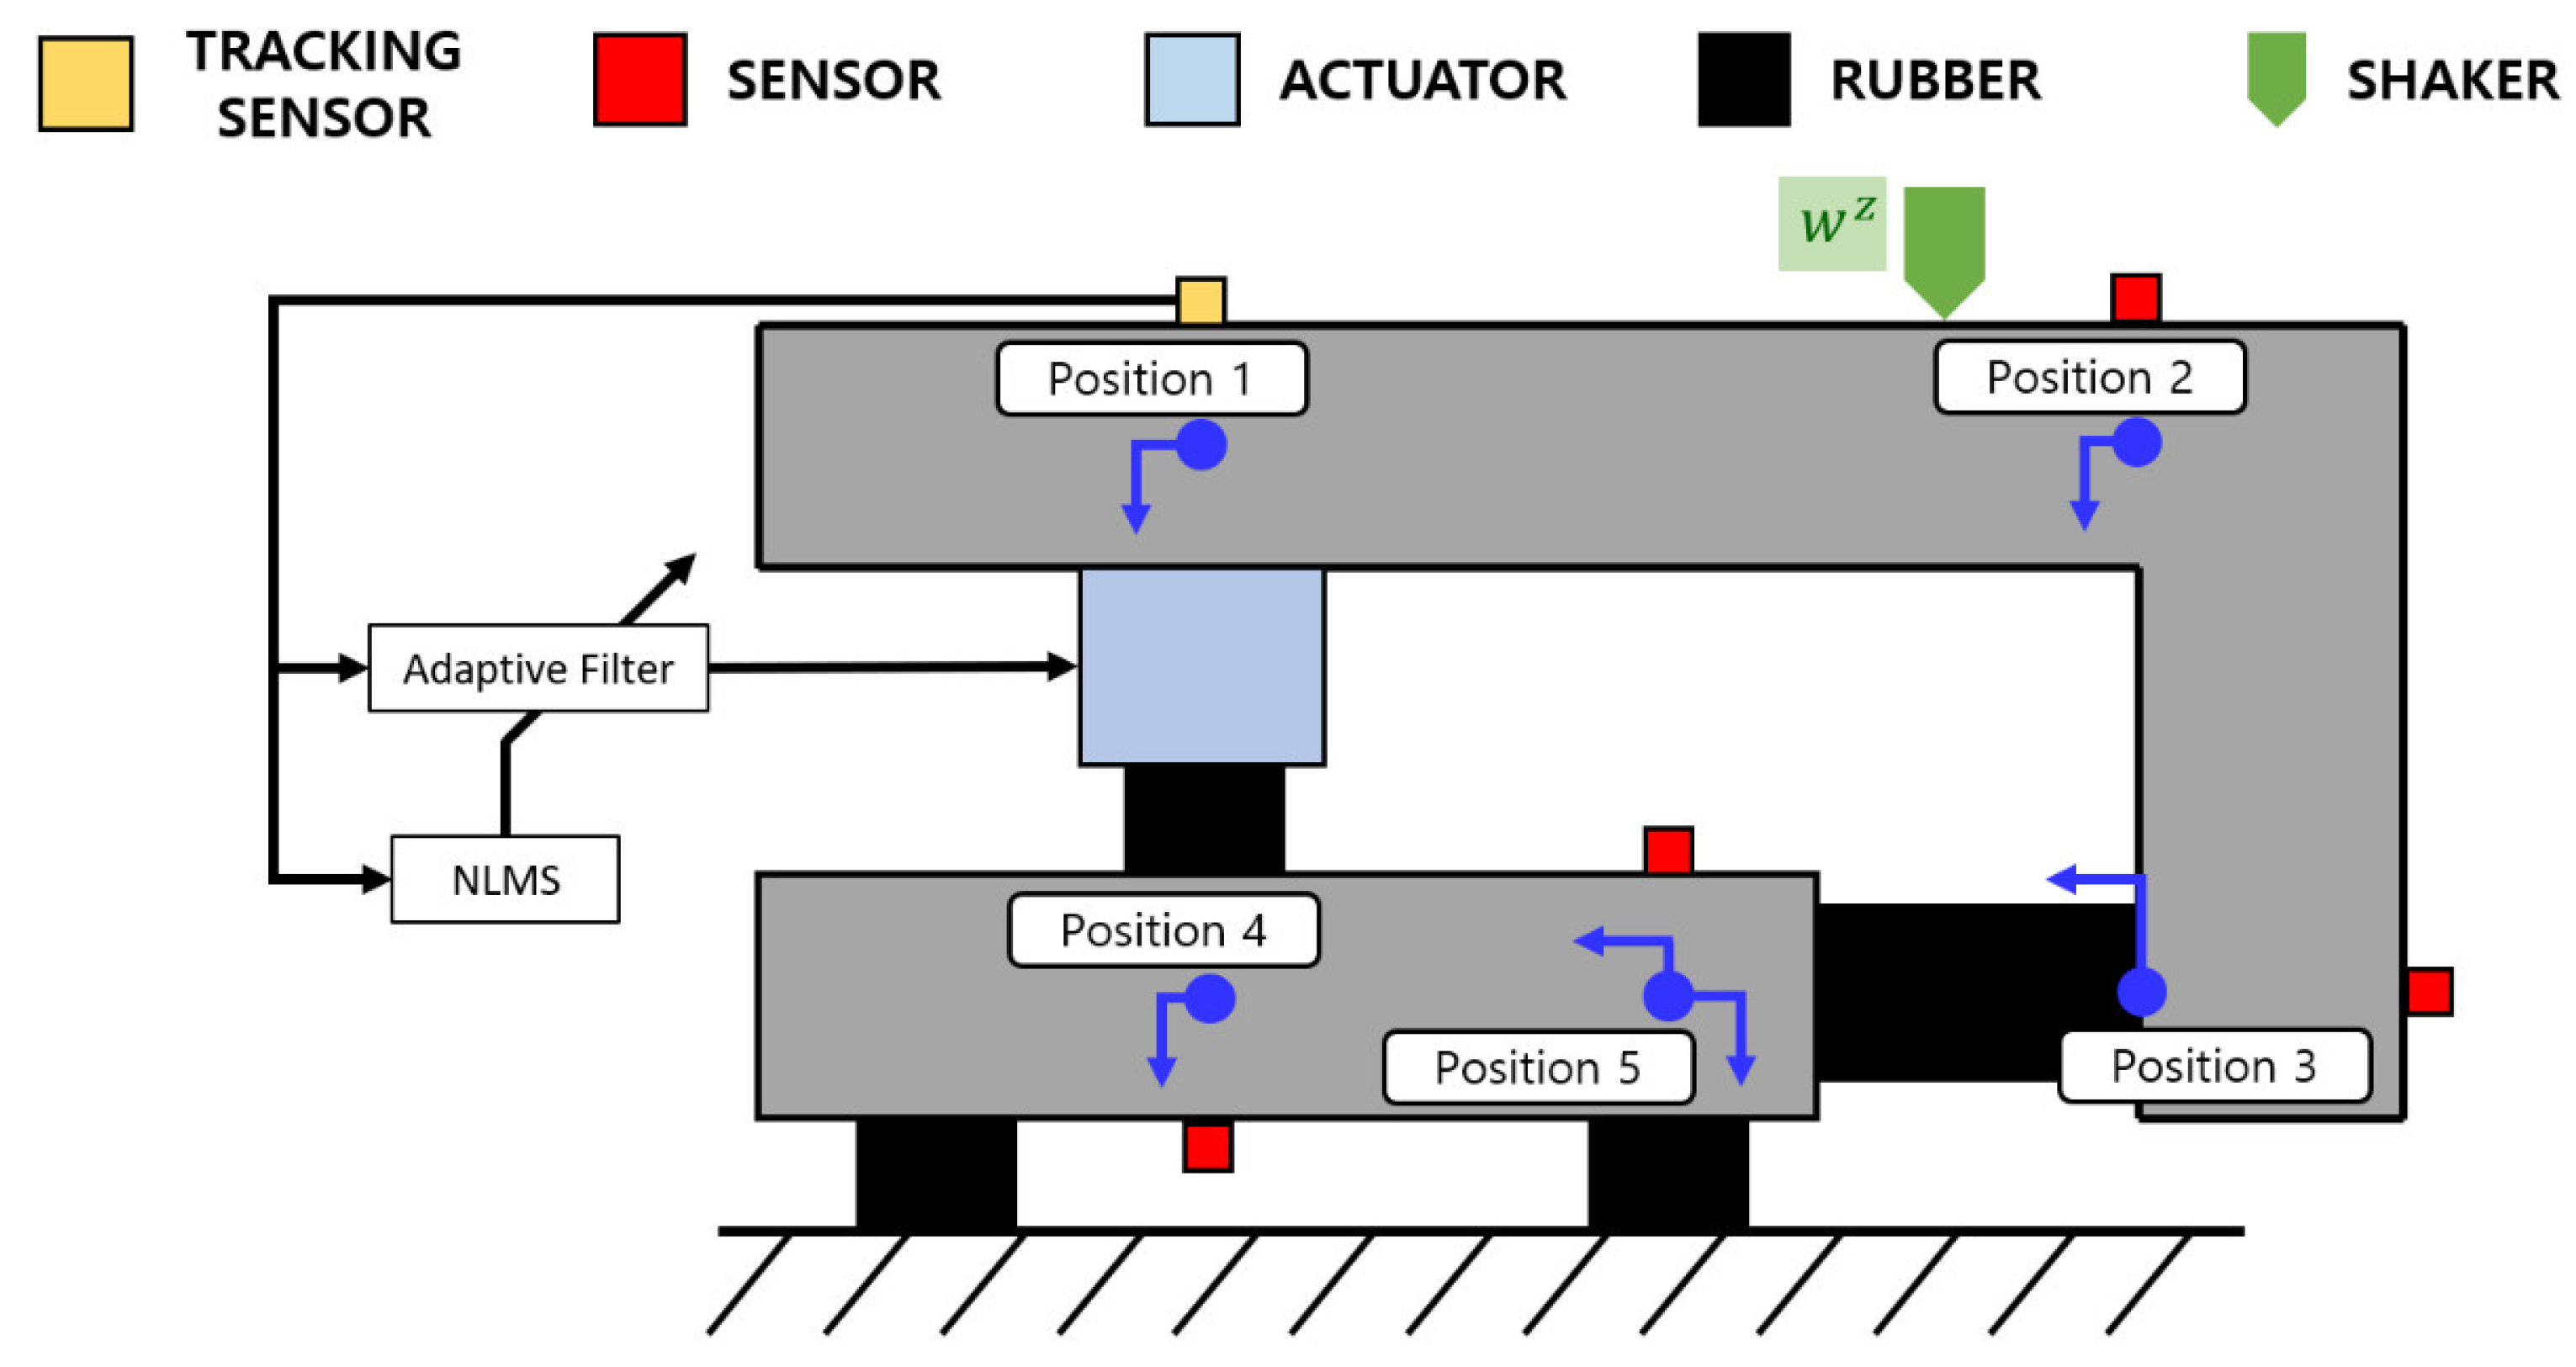
2. Active Mounting Structure for Vibration Attenuation

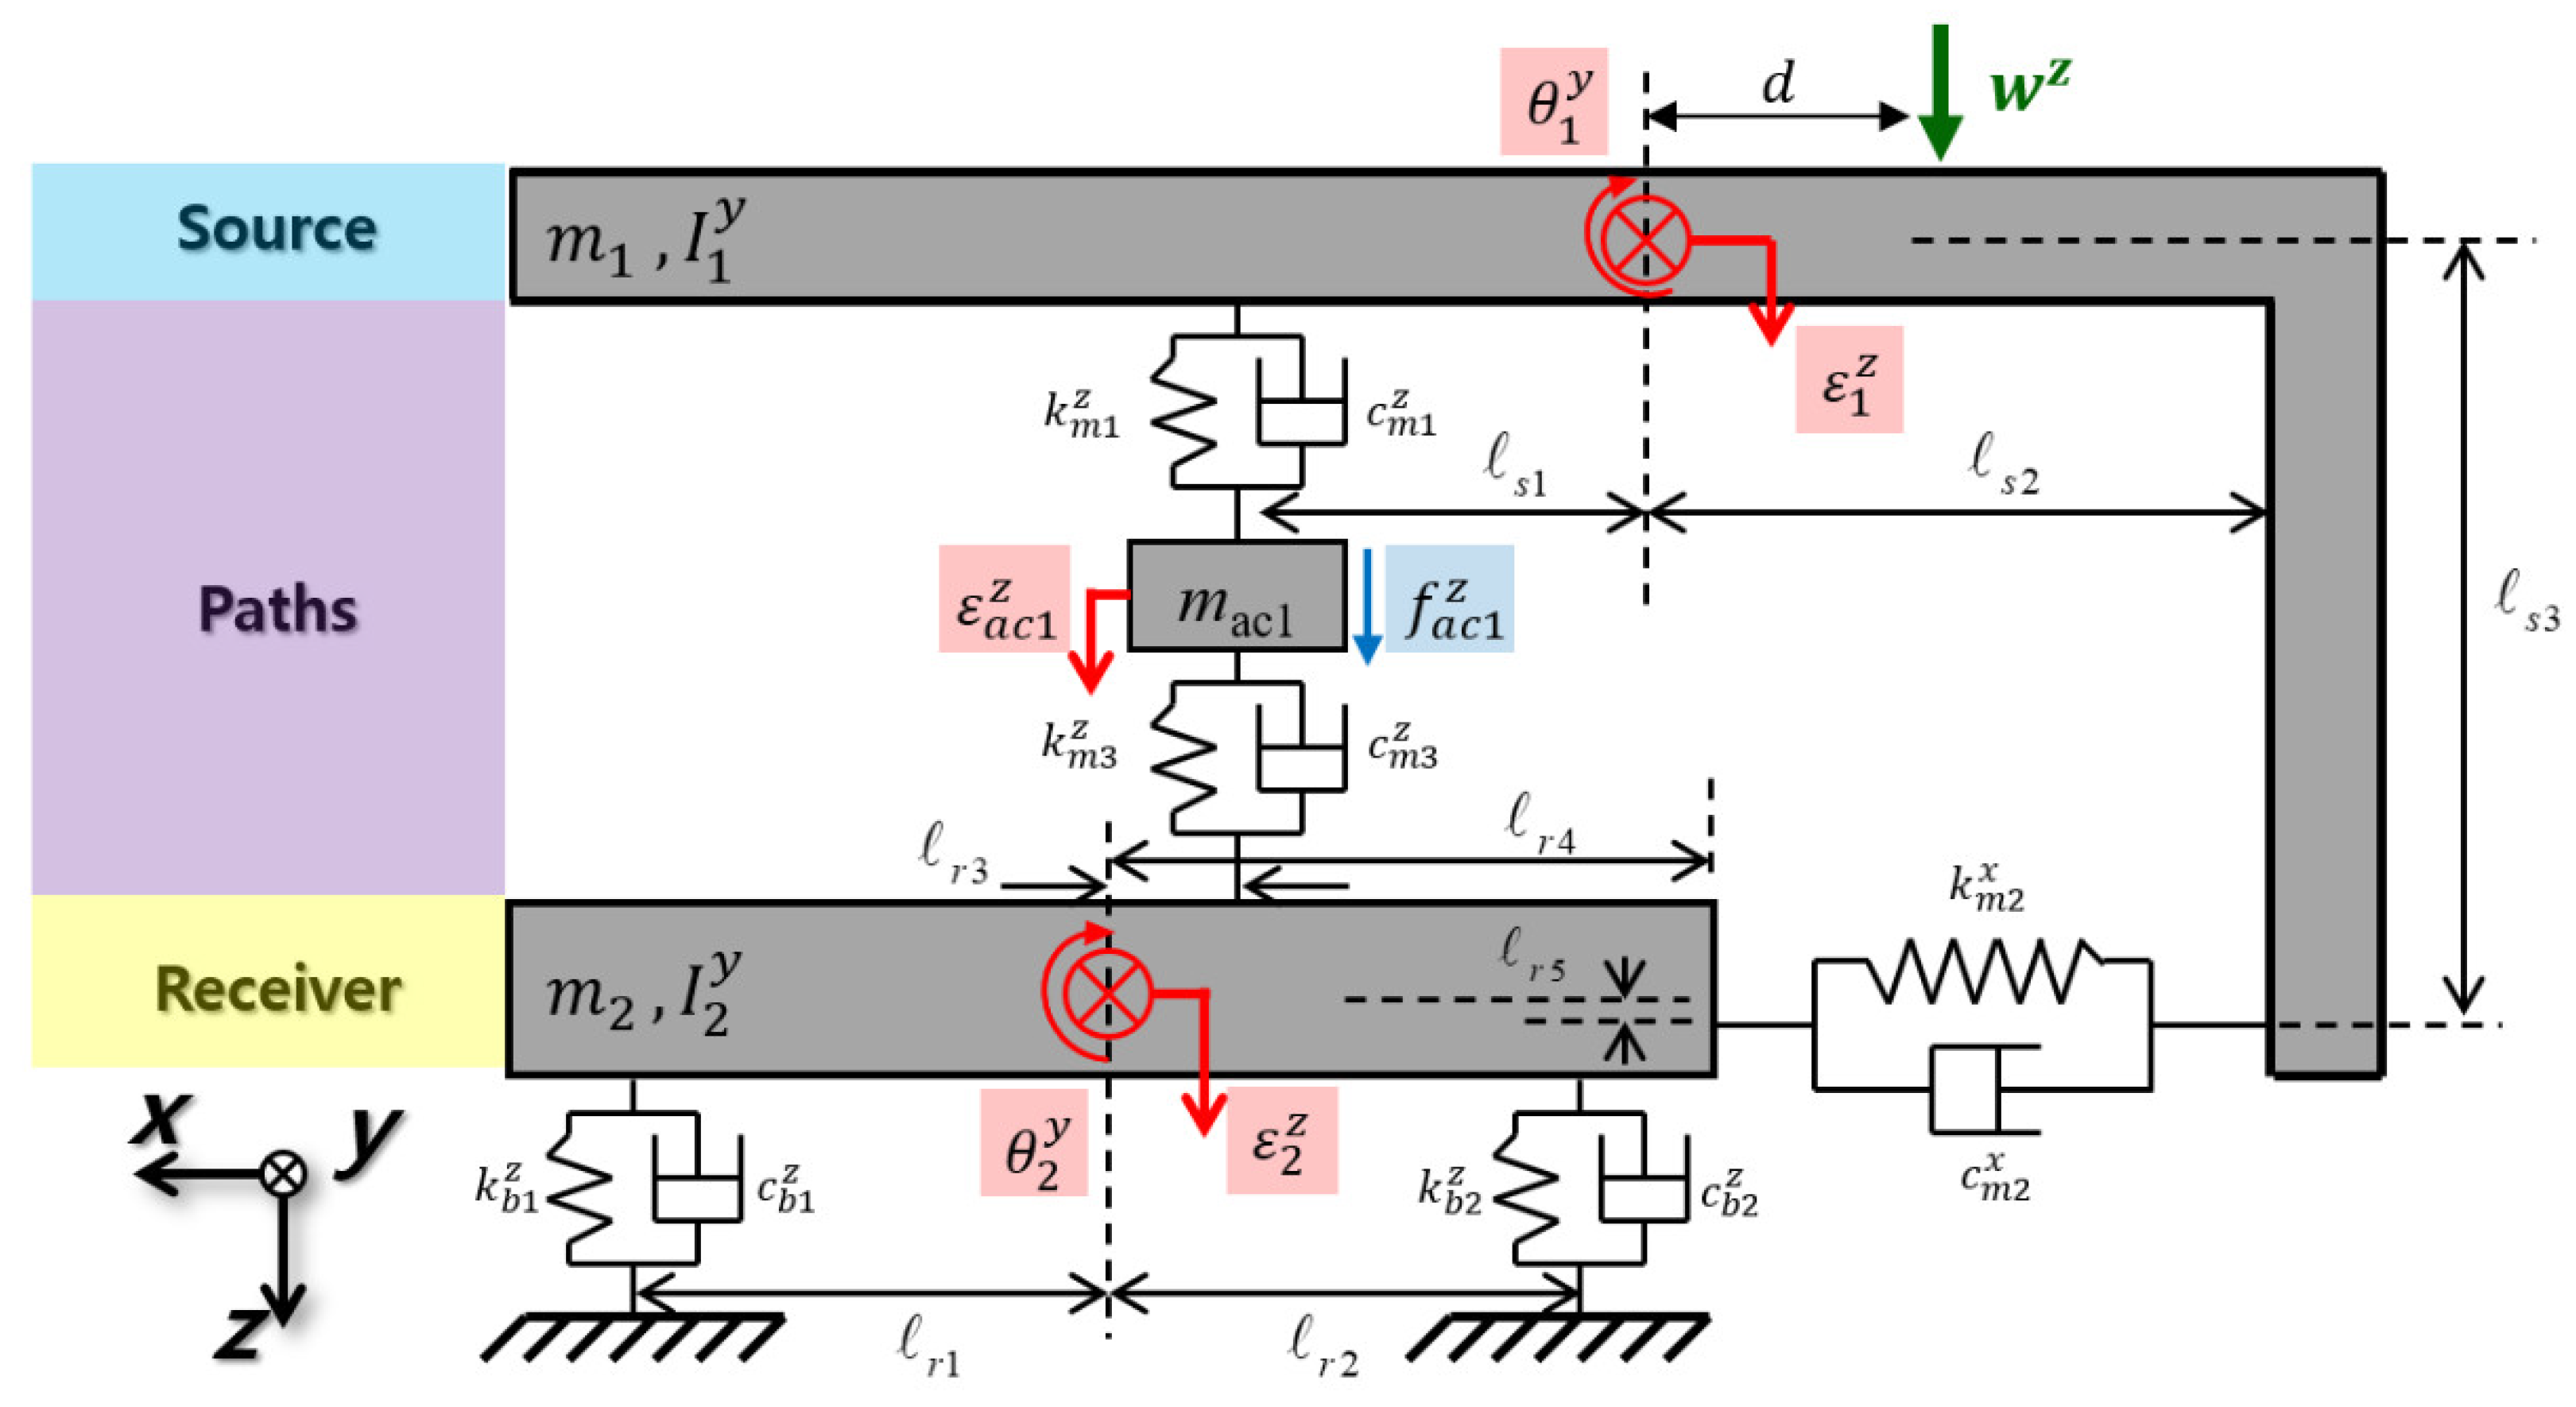
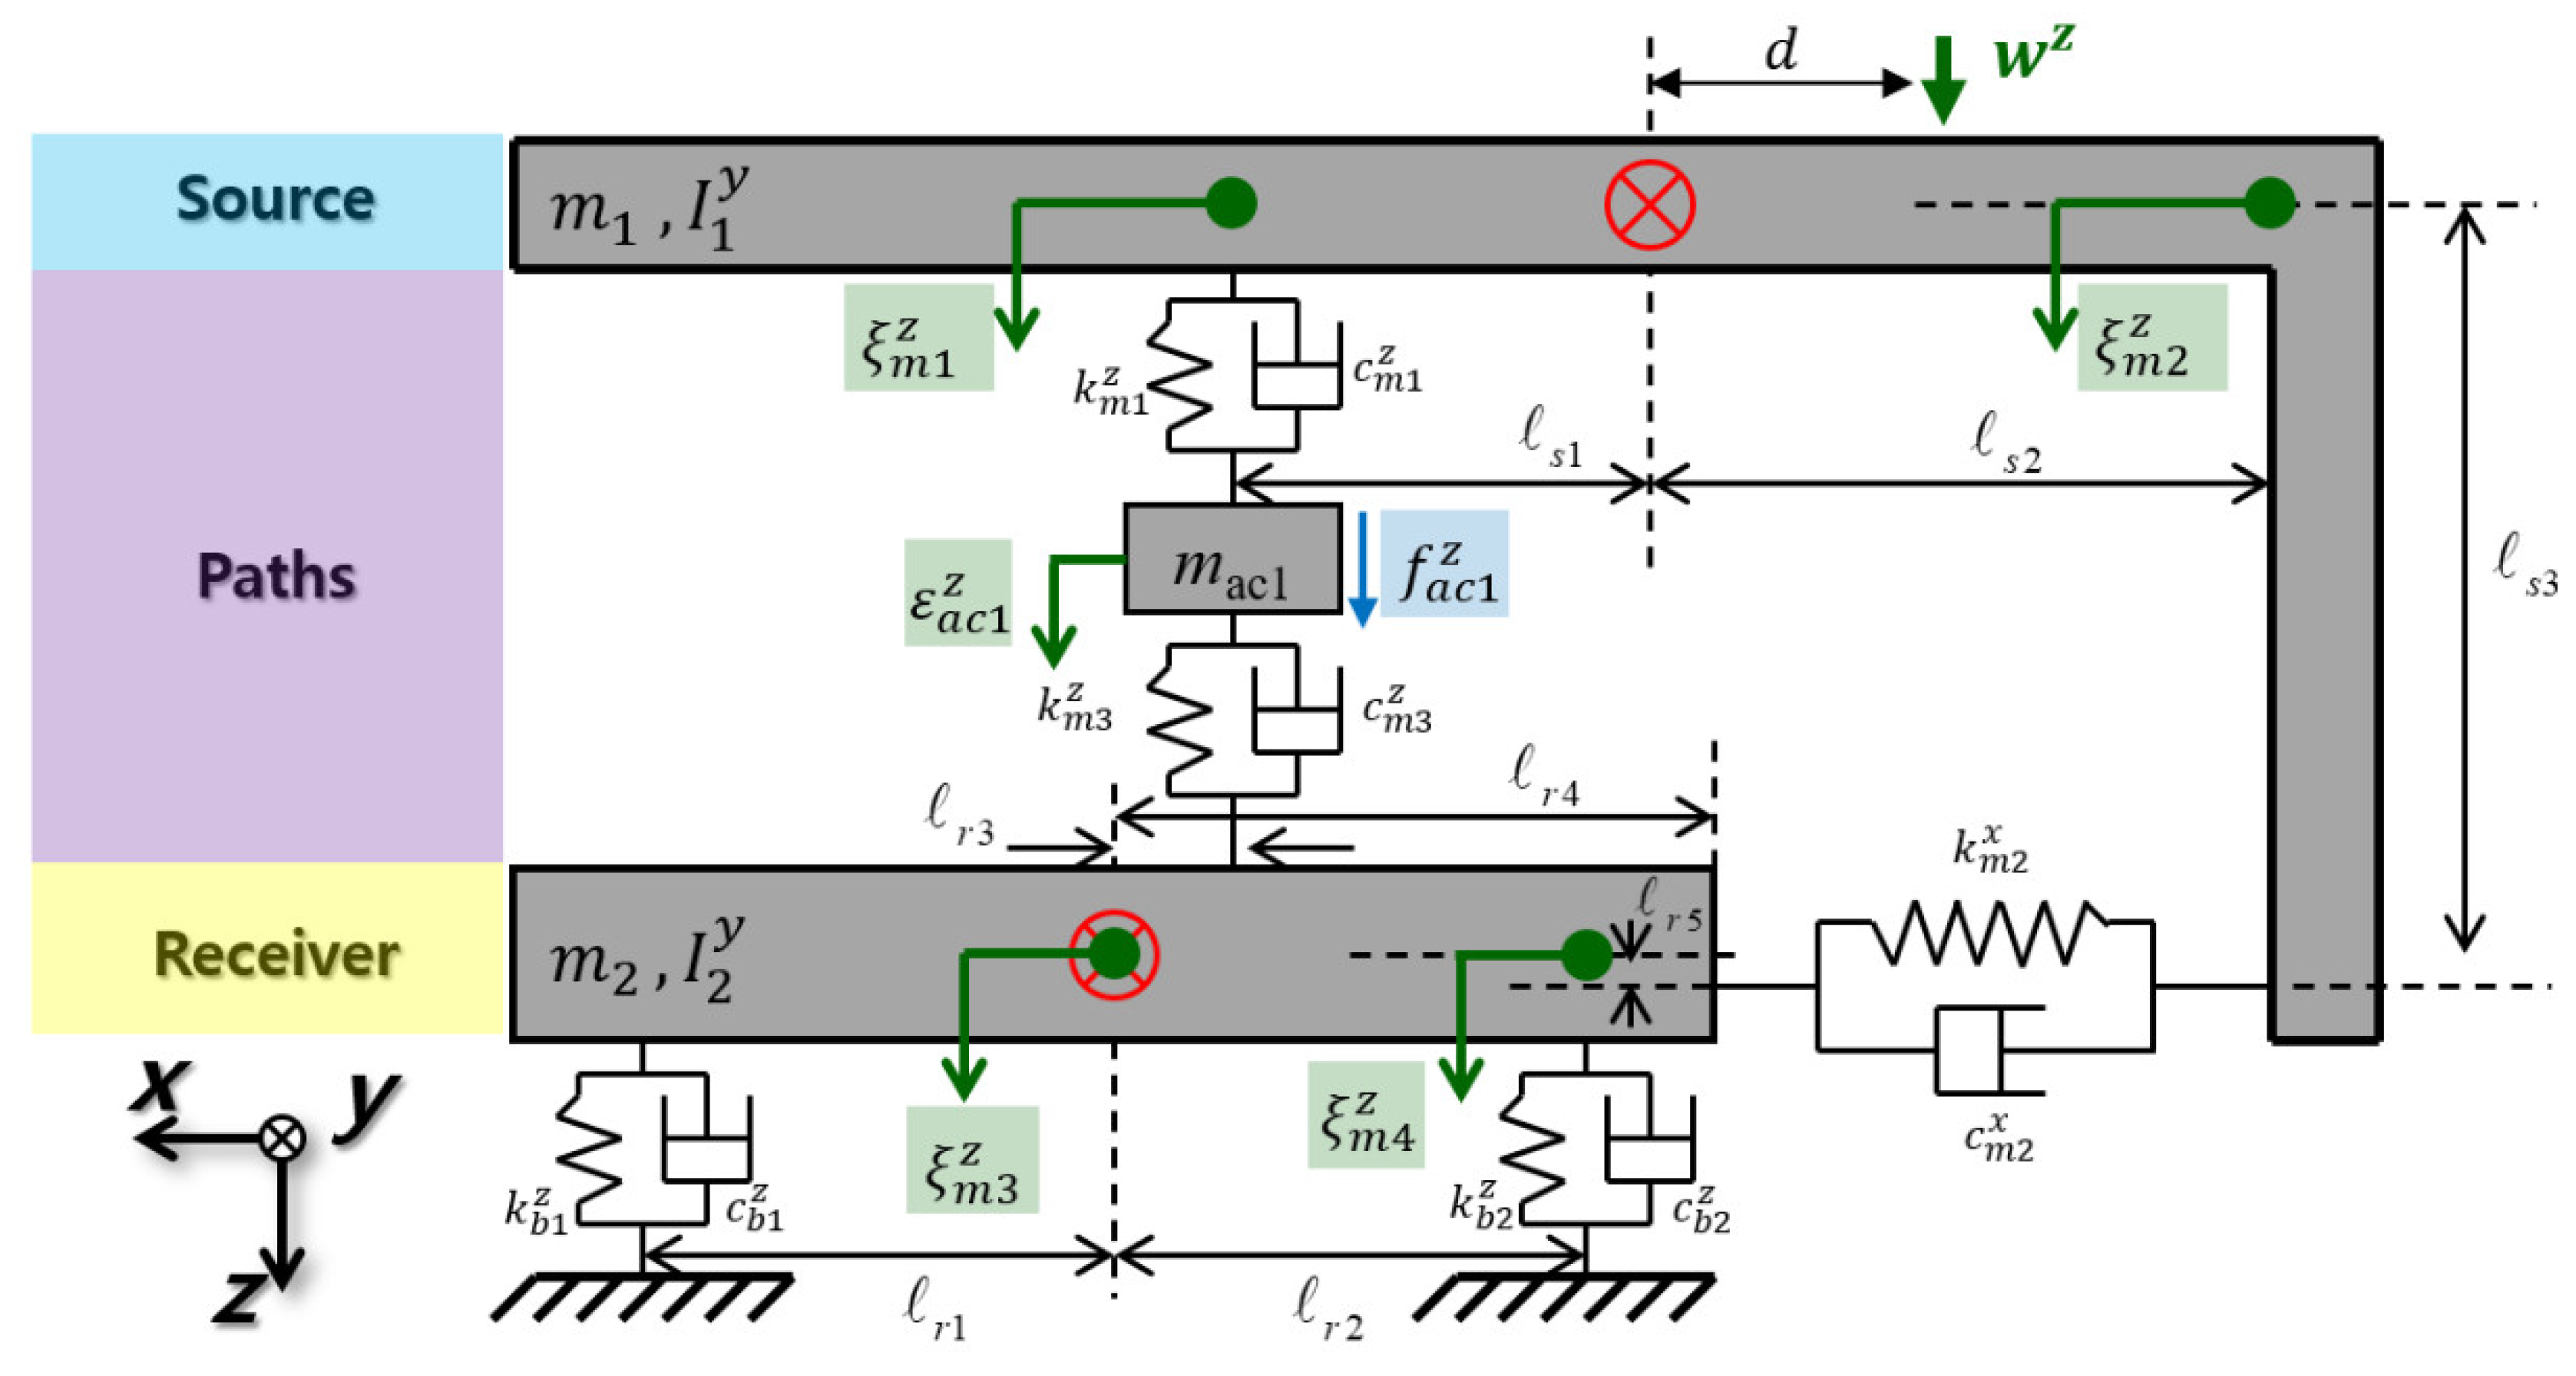
2.1. Mathematical Modeling

The horizontal active mount failed, leaving only the vertical mount operational. Figure 3 shows the active engine mount, powertrain, and subframe structure of the vehicle. The vibrations are hypothesized to originate from the engine, traverse through the subframe, and be received by the active mount containing a piezoelectric stack connected with rubber. The engineers constructed the source as a curved two-dimensional structure and devised the receiver as a beam-type structure owing to the horizontal attachment of the engine mount to the subframe and the engine in the actual vehicle.
The symbols in Figure 3 used to denote different components of the system are as follows: m 1 and m 2 are the mass of the source and receiver, respectively; m a c 1 is the actuator mass in the vertical direction; I 1 y is the moment of inertia of the source in the y direction; and I 2 y is the receiver’s moment of inertia in the y direction. d denotes the distance from the source’s center of gravity to the point where the exciting force is applied, while l s i and l r i are the span between paths and the receiver’s center of gravity and the source, individually. The Kelvin–Voigt expression was applied to the complex stiffness values, resulting in the following expressions for damping and real stiffness: k m i z , k m i x , k b i z and c m i z , c m i x , and c b i z . The translational and vertical motions of the vertically connected active mounting system, the y-axis rotating motion, and the translational and vertical motions of both the receiver and the source were all accounted for using a five-degrees-of-freedom (DOF) model. The displacement vector, ε 1 z , describes the source’s vertical displacement; θ 1 y is the angle of rotation; ε 2 z is the receiver’s vertical displacement; and θ 2 y is the angle of rotation. ε a c 1 z is the displacement in the vertical direction for the vertical active mounting system. The variables W z and f a c 1 z represent “excitation force” and “control force,” respectively, because they relate to the vertical active mount. The following equation expresses the constitutive equations that result from deriving the model described above employing the second law of motion by Newton:
M q ¨ + C q ˙ + K q = W + F
where M, C, K, W, F, and q are the mass, damping, and stiffness matrix, excitation force, active mount control force, and displacement vector, respectively. They are presented as Equations (2)–(7):
M = d i a g m 1 m 2 m a c 1 m a c 1 I 1 y I 2 y
K = k m 1 z + k m 2 z k m 2 z k m 1 z k m 2 z k m 2 z + k m 3 z + k b 1 z + k b 2 z k m 3 z k m 1 z k m 3 z k m 1 z + k m 3 z k m 2 z l s 2 k m 2 z x l s 3 k m 1 z l s 1 k m 2 z l s 2 + k m 2 z x l s 3 k m 1 z l s 1 k m 2 z x l r 5 k m 2 z l r 4 k m 3 z l r 3 + k m 2 z l r 4 k b 1 z l r 1 + k b 2 z l r 2 k m 2 z x l r 5 k m 3 z l r 3 k m 2 z l s 2 k m 1 z l s 1 k m 2 z x l s 3 k m 2 z x l r 5 k m 2 z l r 4 k m 2 z x l s 3 k m 2 z l s 2 k m 3 z l r 3 + k m 2 z l r 4 k b 1 z l r 1 + k b 2 z l r 2 k m 2 z x l r 5 k m 1 z l s 1 k m 3 z l r 3 k m 1 z l s 1 2 + k m 2 z l s 2 2 + k m 2 x l s 3 2 2 k m 2 z x l s 2 l s 3 k m 2 z l s 2 l r 4 + k m 2 z x l s 2 l r 5 k m 2 x l s 3 l r 5 + k m 2 z x l s 3 l r 4 k m 2 z l s 2 l r 4 + k m 2 z x l s 3 l r 4 k m 2 x l s 3 l r 5 + k m 2 z x l s 2 l r 5 k m 3 z l r 3 2 + k m 2 z l r 4 2 + k m 2 x l r 5 2 + k b 1 z l r 1 2 + k b 2 z l r 2 2 2 k m 2 z x l r 4 l r 5
C = c m 1 z + c m 2 z c m 2 z c m 1 z c m 2 z c m 2 z + c m 3 z + c b 1 z + c b 2 z c m 3 z c m 1 z c m 3 z c m 1 z + c m 3 z c m 2 z l s 2 c m 2 z x l s 3 c m 1 z l s 1 c m 2 z l s 2 + c m 2 z x l s 3 c m 1 z l s 1 c m 2 z x l r 5 c m 2 z l r 4 c m 3 z l r 3 + c m 2 z l r 4 c b 1 z l r 1 + c b 2 z l r 2 c m 2 z x l r 5 c m 3 z l r 3 c m 2 z l s 2 c m 1 z l s 1 c m 2 z x l s 3 c m 2 z x l r 5 c m 2 z l r 4 c m 2 z x l s 3 c m 2 z l s 2 c m 3 z l r 3 + c m 2 z l r 4 c b 1 z l r 1 + c b 2 z l r 2 c m 2 z x l r 5 c m 1 z l s 1 c m 3 z l r 3 c m 1 z l s 1 2 + c m 2 z l s 2 2 + c m 2 x l s 3 2 2 c m 2 z x l s 2 l s 3 c m 2 z l s 2 l r 4 + c m 2 z x l s 2 l r 5 c m 2 x l s 3 l r 5 + c m 2 z x l s 3 l r 4 c m 2 z l s 2 l r 4 + c m 2 z x l s 3 l r 4 c m 2 x l s 3 l r 5 + c m 2 z x l s 2 l r 5 c m 3 z l r 3 2 + c m 2 z l r 4 2 + c m 2 x l r 5 2 + c b 1 z l r 1 2 + c b 2 z l r 2 2 2 c m 2 z x l r 4 l r 5
q = ε 1 z ε 2 z ε a c 1 z ε a c 1 x θ 1 y θ 2 y T
W = W z 0 0 0 W z d 0 T
F = 0 0 0 f a c 1 x 0 0 T
The significance of the vibration reduction performance was evaluated by analyzing the displacement at the location adjoining the path in a model converted from the CG (center of gravity) coordinates to the mount coordinates, as shown in Figure 4.
Figure 4 presents the vertical displacement of various mounts and sources. Specifically, ξ m 1 z is the displacement of the vertical mounting system in the vertical direction and the adjacent source; ξ m 2 z is the displacement of the horizontal mounting system in the vertical direction and the adjacent source; ξ m 3 z is the displacement of the vertical mounting system in the vertical direction and the adjacent receiver; and ξ m 4 z is the displacement of the receiver in the vertical direction. Equation (9) defines the conversion matrix of the 5 DOF model by arranging each position according to the formulae for the internally and externally dividing points, as expressed in Equation (8).
ε 1 z = ξ m 1 z l s 2 + ξ m 2 z l s 1 l s 1 + l s 2 = l s 2 l s 1 + l s 2 ξ m 1 z + l s 1 l s 1 + l s 2 ξ m 2 z
Π = l s 2 l s 1 + l s 2 l s 1 l s 1 + l s 2 0 0 0 0 0 0 l r 4 l r 3 + l r 4 l r 3 l r 3 + l r 4 0 0 1 0 0 1 l s 1 + l s 2 1 l s 1 + l s 2 0 0 0 0 0 0 1 l r 3 + l r 4 1 l r 3 + l r 4
Equation (11) expresses the equation of motion when all the matrices of the CG coordinates are multiplied by the transformation matrix. Equation (10) expresses the displacement vector with the mount coordinates through the conversion matrix described in Equation (9).
q = ξ m 1 z ξ m 2 z ε a c 1 z ξ m 3 z ξ m 4 z T
M ¨ q ¨ + C q ˙ + K q = W + F
The effectiveness of the vibration mitigation ability is confirmed only when the active mounting system in the vertical direction is in operation through Equation (11); the dynamic relationship expression is presented in the next sub-chapter. The response tendency of the horizontal direction is obtained from the motion equations transformed to mount coordinates.

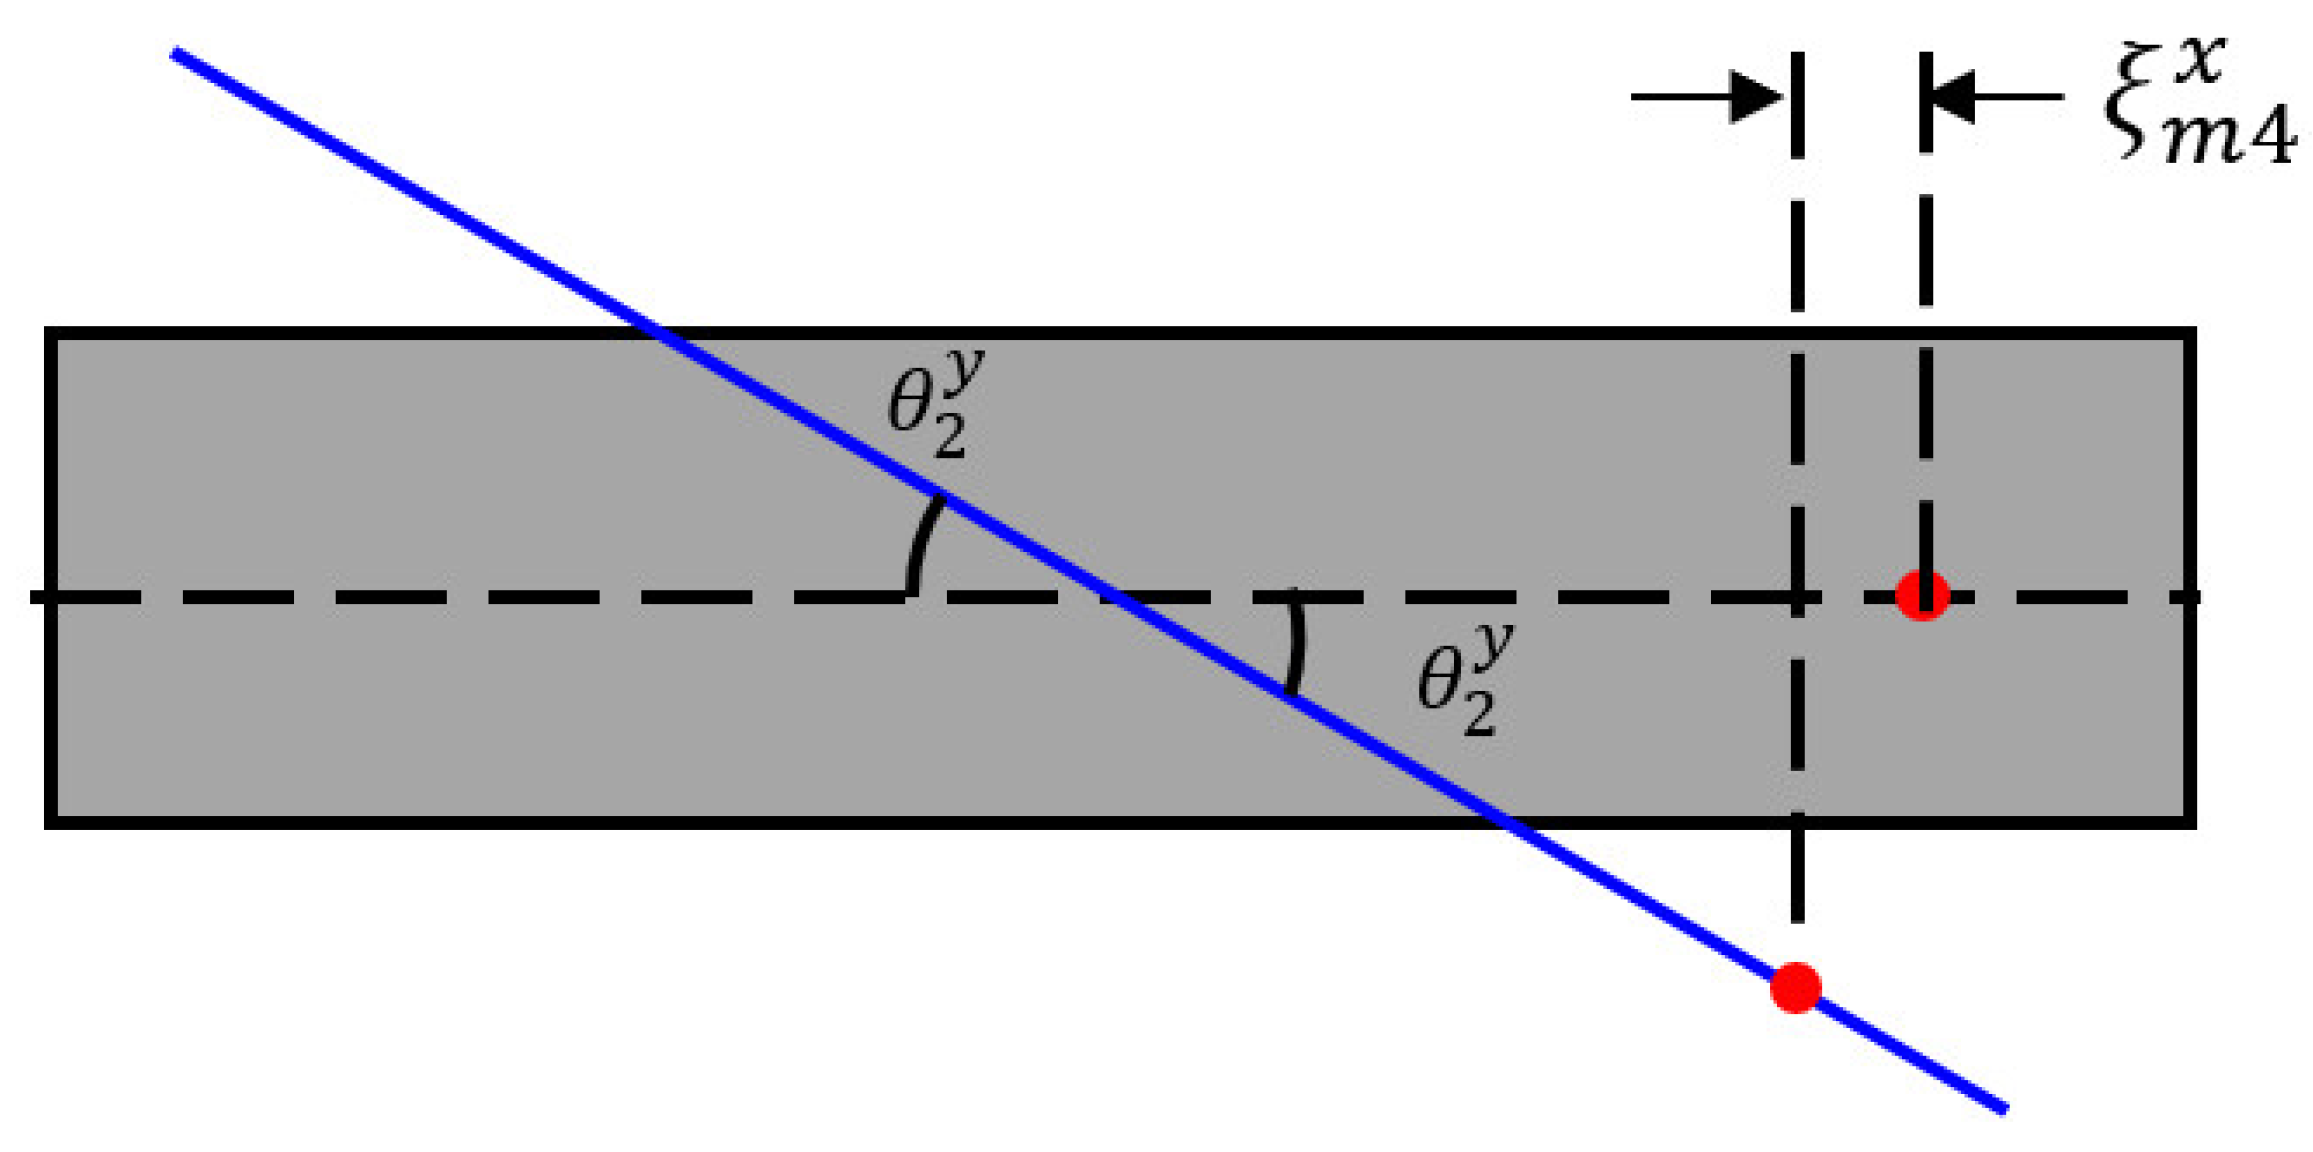
2.2. Response Trend in the Horizontal Direction

Because of structure’s asymmetricity, horizontal motion cannot be ignored. With the presented model, the vertical reaction at each place may be identified, but the horizontal response cannot be estimated based on the suggested aggregated parameter model. The response tendency of the horizontal direction at each position was evaluated applying the dynamic relationship of the structure. The location bordering to the horizontal mounting system, which significantly affects the displacement in the horizontal orientation, was analyzed as the horizontal direction response trend. Figure 5 presents the source’s dynamic motion.
The dashed line presents the source’s equilibrium phase, while the blue solid line depicts the source’s motion by perturbation. The source’s displacement adjacent to the horizontal mounting system can be obtained by summing and , where is derived from the characteristic of an isosceles triangle and the trigonometric formulation, and is derived from the similitude ratio, as described in Equations (12) and (13), respectively.
= ξ m 2 z t a n θ 1 y 2
: ξ m 2 z = l s 3 s i n θ 1 y : l s 2 s i n θ 1 y
Equation (14) describes the horizontal movement pattern of the source located next to the horizontal mount based on Equations (12) and (13).
ξ m 2 x = + = t a n θ 1 y 2 + l s 2 l s 3 ξ m 2 z
Equation (15) can be derived by linearizing Equation (14).
ξ m 2 x = θ 1 y 2 + l s 2 l s 3 ξ m 2 z
The source’s horizontal movement is influenced by the structural geometry, the rotation angle of the source, and the vertical movement, as shown by the preceding equation. The vertical displacement governs the horizontal movement of the source because of the difficulty of changing the source structure. Figure 6 presents the receiver’s dynamic motion.
The dashed line shows the receiver’s equilibrium phase, whereas the blue solid line depicts the receiver’s motion by perturbation. The receiver’s displacement adjacent to the horizontal mounting system is defined as ξ m 4 x , which is equal to when deducing the source’s horizontal motion using the characteristics of an isosceles triangle and the trigonometric formulation.
ξ m 4 x = ξ m 4 z t a n θ 2 y 2
Equation (17) can be derived by linearizing Equation (16).
ξ m 4 x = θ 2 y 2 ξ m 4 z
This equation demonstrates that the receiver’s horizontal motion is influenced by both its rotation angle and vertical displacement. Thus, it may be regulated by horizontal receiver motion. Consequently, the model’s vertical and horizontal responses were examined.

2.3. Input Quantification for Active Elements
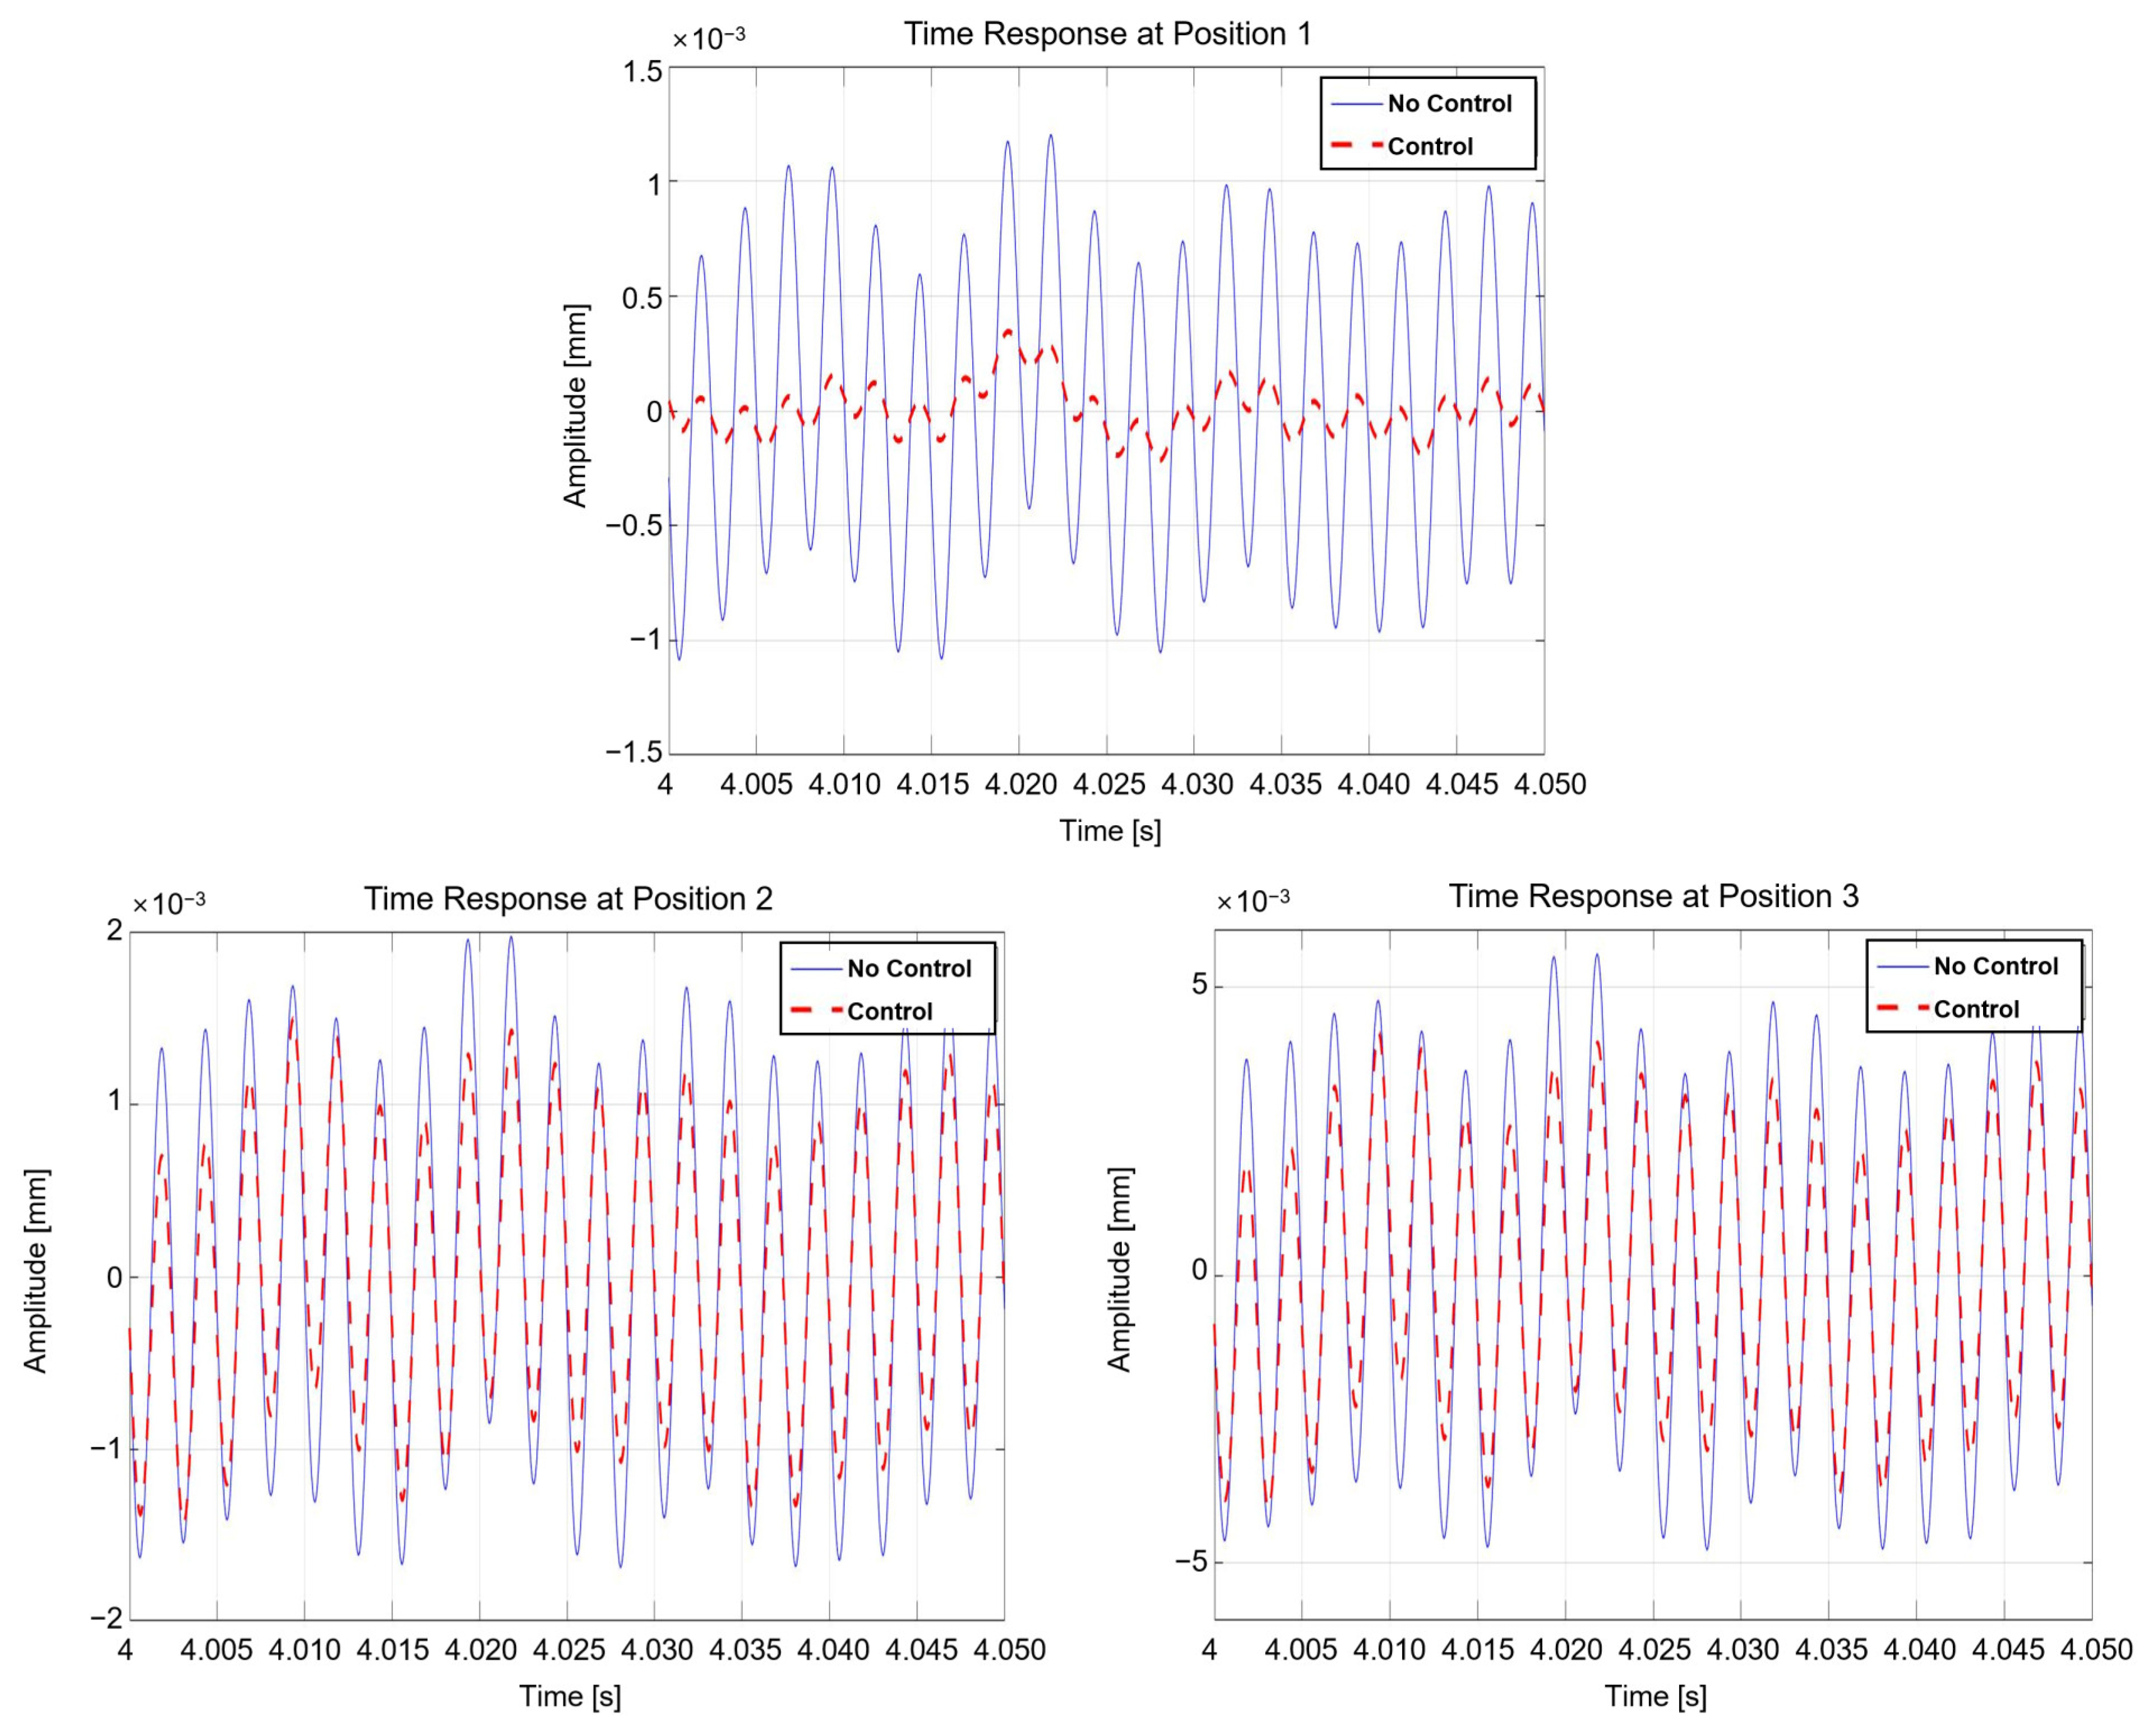
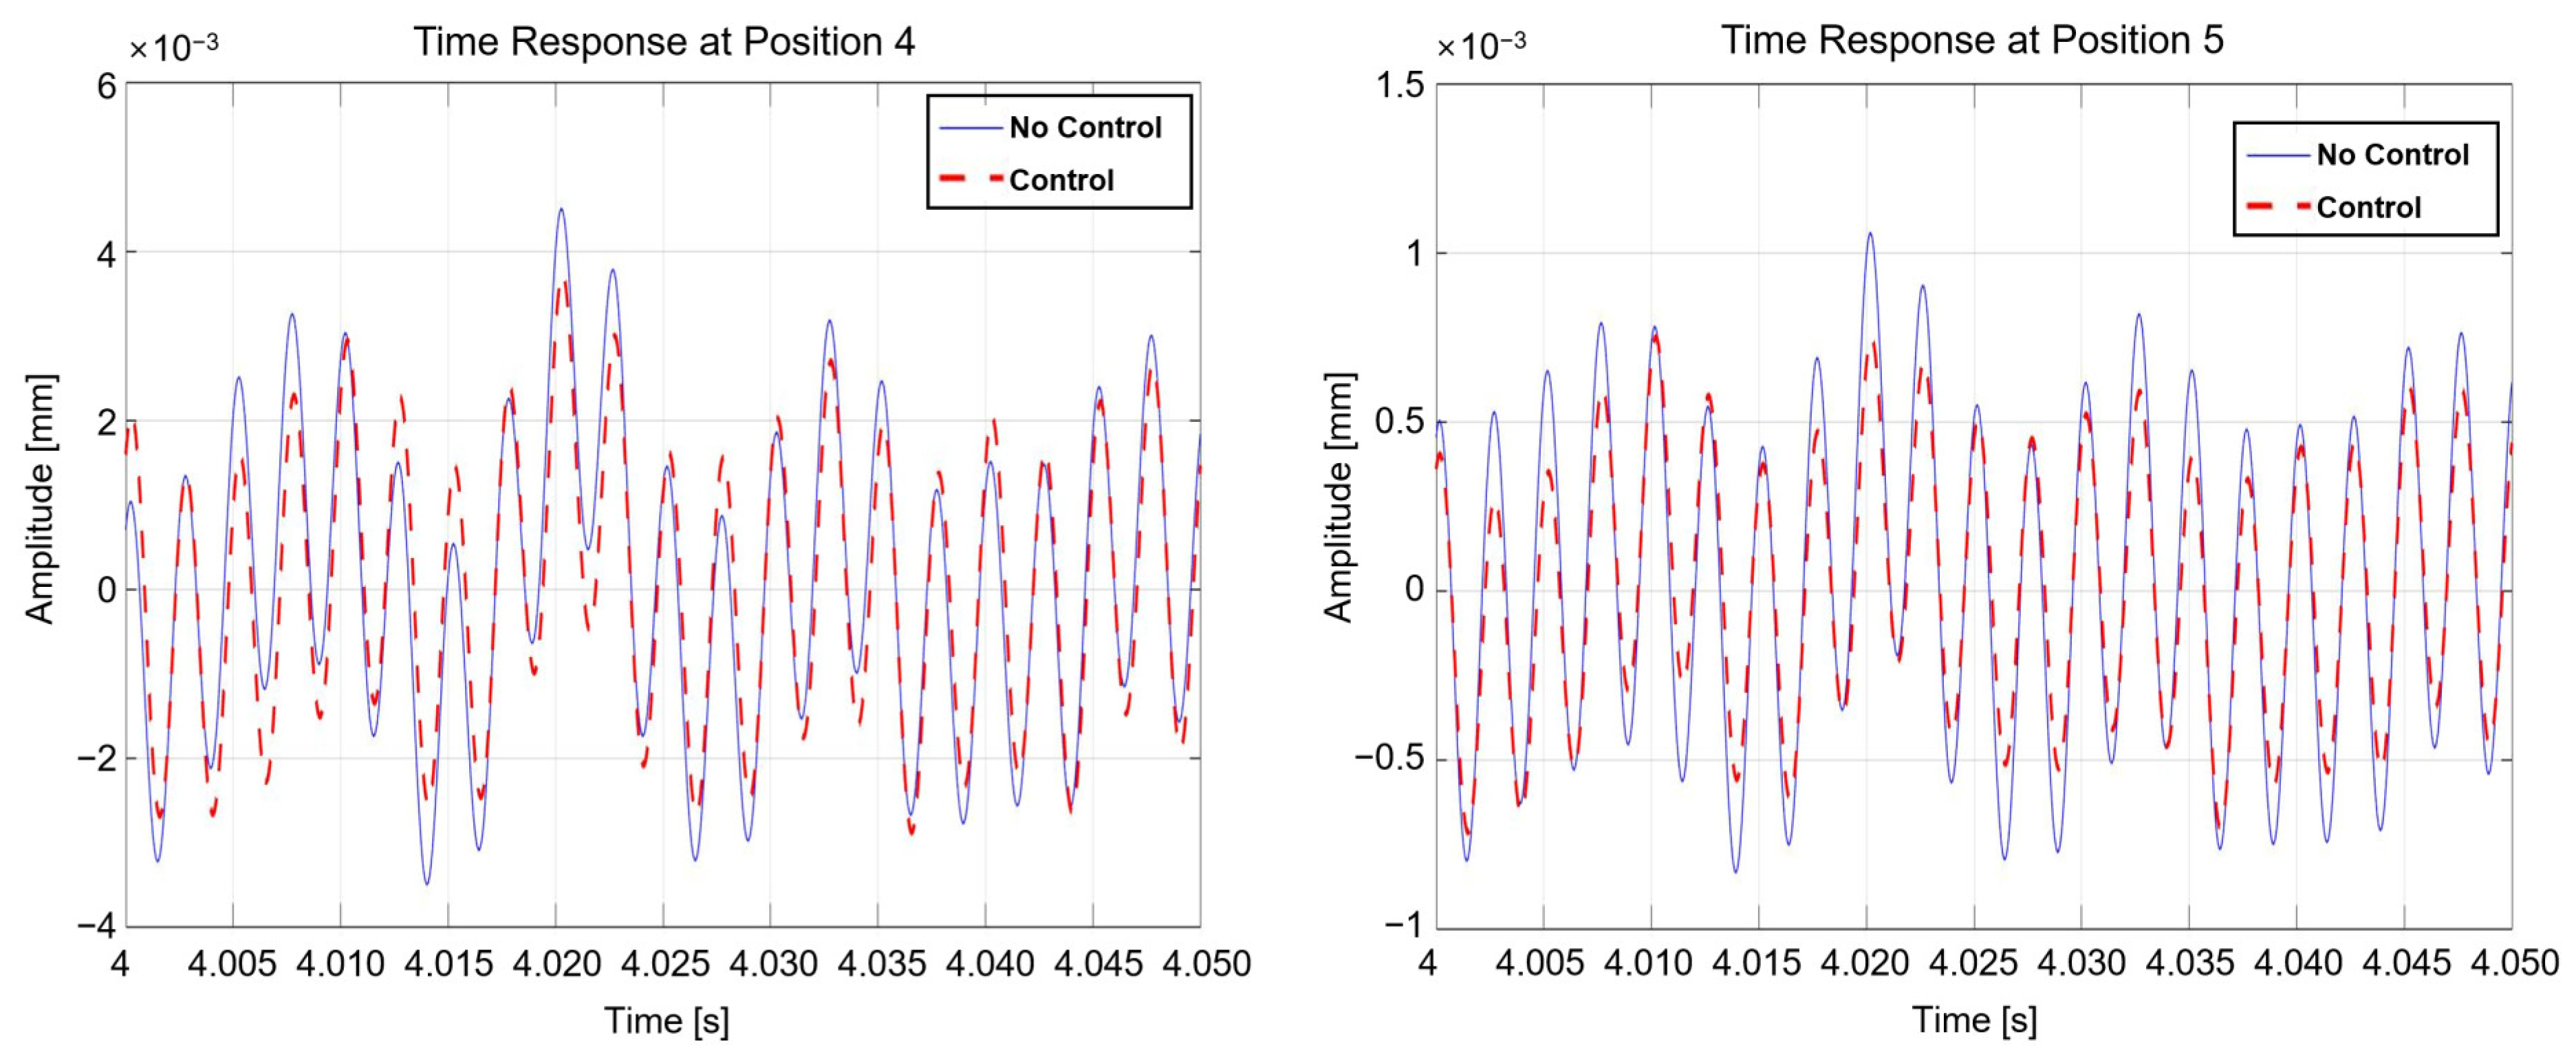
The amplitude and phase value significantly affect the resulting response when a harmonic force is stimulated. Control forces and input disturbances in the form of harmonic functions can be described as a form of complex numbers through Euler’s law as the following equations:
W z t = W z e i ω t
f a c 1 z t = f a c 1 z e i ( ω t + ϕ a c 1 )
where W z is the amplitude of the input disturbance; ω is the input frequency; f a c 1 z is the amplitude of the control force in the vertical direction; and ϕ a c 1 is the phase of the vertical control force. Employing the control forces and the input disturbance to the mount coordinate model will yield the response at each position. The response of each position is expressed as Equation (20).
ξ t = ξ m i z t
where ξ m i z t is the vertical motion of the i-position with the mount coordinates, which is a response influenced by the control force and the input disturbance via a secondary path. The determination of this displacement may be achieved by defining the compliance matrix as the reciprocal of the dynamic stiffness matrix. The dynamic stiffness matrix and compliance matrix are expressed as Equations (21) and (22), respectively, based on the mount coordinates.
κ = ω 2 M + i ω C + K
H = κ 1 = H 11 H 12 H 13 H 14 H 15 H 21 H 22 H 23 H 24 H 25 H 31 H 32 H 33 H 34 H 35 H 41 H 42 H 43 H 44 H 45 H 51 H 52 H 53 H 54 H 55
Equation (23) expresses each location’s displacement with the mount coordinates obtained with the compliance matrix.
q = H W + H F
The response may be expressed by using the input disturbance, control force, and the compliance matrix, as expressed in Equation (23). This suggests that the movement of each position can be expressed using the amplitude of the input disturbance, the amplitude of the control force, and the phase. Equation (24) expresses the displacement of each location:
ξ j t = Ξ m j z e i β m j + Ξ m j . a c 1 z e i ϕ a c 1 + β m j . a c 1 e i ω t
At position j, Ξ m j z is the amplitude due to the input disturbance; β m j is the phase from the excitation force; Ξ m j . a c 1 z is the amplitude because of the vertical mount control force; and β m j . a c 1 is the phase from the control force of the vertical mount control force. Equations (25)–(28) express these amplitudes and phases with the compliance matrix:
Ξ m j z = H j 1 + H j 4 d W z
Ξ m j . a c 1 z = H j 3 f a c 1 z
β m j = H j 1 + H j 4 d
β m j . a c 1 = H j 3
Equation (24) describes the displacement, and everything is known except the amplitude and phase of the control force in the vertical mount. A phase of the control force that equalizes the phase values is used to calculate the control force of the vertical mount that results in non-movement, as expressed in Equation (29).
β m j = β m j . a c 1 + a c 1
Equation (30) shows the phase that the vertical mount should hold according to Equation (29).
a c 1 = β m j β m j . a c 1
Substituting Equation (30) into Equation (24) yields the following:
ξ j t = Ξ m j z + Ξ m j . a c 1 z e i ω t + β m j
If the amplitude component in Equation (31) is set to zero, the displacement at position j can also be set to zero because there is only one unknown to calculate. Equation (32) defines the vertical mount amplitude that results in a zero displacement of the j position by replacing the amplitude component of Equation (31) with Equations (25) and (26).
f a c 1 z = W z H j 1 + H j 4 d H j 3
To nullify the displacement of position j, the secondary path must receive the control force determined by the phase value of Equation (30) and the amplitude value of Equation (32). In the 5-degrees-of-freedom model, there are four ways to target the movement of the location bordering to the mount as zero: (1) focusing the source motion next to the vertical mounting system, (2) focusing the receiver motion next to the vertical mounting system, (3) focusing the source motion next to the horizontal mounting system, and (4) focusing the receiver motion next to the horizontal mounting system.

3. Simulation

Before commencing the experiment to showcase the model and verify the aforementioned formulae, a numerical simulation was executed to ascertain the model’s achievement utilizing a laboratory configuration, including a framework equipped with two mounts. Table 1 lists the constituent parameters of the simulation. The subsequent experimental apparatus in Figure 7 will be used to validate the simulation results experimentally, upon which these values are predicated. The top section indicates the car’s powertrain, while the bottom section indicates the chassis of the vehicle. Every operational pathway comprises a piezo stack-type actuator and a rubber mount. The signal from accelerometers was recorded instantaneously using a rapid control prototyping system (dSPACE 1104). An input disturbance was engaged utilizing a shaker, and its measurement was obtained using the force sensor (impedance head) connected to the stinger tip. The inertia and masses were computed and measured. The damping coefficient and stiffness were measured using multiple experiments. A pulse voltage signal was used to stimulate the stack mass, while an accelerometer was used to quantify the resulting response. Consequently, a solitary peak indicating the resonance was observed, which was the foundation for estimating the rigidity value via the half-power method and the formulation for the natural frequency.
Both horizontal and vertical mounts were located at the source’s and receiver’s CGs, and a simulation with a quantified secondary path input was conducted. The output was validated using the state space approach with linear and time-invariant conditions, and the attenuation performance of vibration was validated through the comparison of the response when just the input force was employed to the response when both the input force and the computed control input were applied. Equations (33)–(35) express the state space equation when the mass–spring–damper motion equation is converted to the mount coordinates described in Equation (17).
x ˙ t = A x t + B u t
y t = C x t + D u ( t )
A = 0 5 × 5 I 5 × 5 M 1 K M 1 C B = 0 5 × 5 M 1 C = I 2 × 2 0 2 × 1 0 2 × 2 0 2 × 5 0 2 × 2 0 2 × 1 I 2 × 2 0 2 × 5 D = 0
In Equation (35), A, B, C, and D matrices indicate the state, input, output, and direct transfer term of the system, respectively. The output of simulation is indicated as the displacement of the location adjacent to the mount by modifying the state variable using Equation (36).
y t = ξ m 1 z t ξ m 2 z t ξ m 3 z t ξ m 4 z t T

3.1. Control via Quantified Input

The excitation frequency, excitation amplitude, and sampling frequency were set to 400 Hz, a sinusoidal signal of 10 N, and 15 kHz, respectively, to simulate the calculated secondary path input of the five-DOF model. Figure 8 expresses each displacement response in the case that the input force is only applied to the system model.
Figure 8 shows M o u n t i s z illustrating the displacement of the ith source position in the vertical direction with respect to the left hand from the mount coordinates. The displacement of the source in the horizontal direction bordering the horizontal mount is designated as M o u n t 2 s x . The displacement of the ith receiver position in the vertical direction is designated as M o u n t i R z , and the displacement of the receiver in the horizontal direction bordering the horizontal mount is designated as M o u n t 2 R x . The vibration becomes significantly more pronounced in the source directly affected by the input stimulation if the control input is not supplied through the subordinate path. M o u n t 2 S z , located at a considerable distance from the CG, is specifically vulnerable to vibration. This concern was addressed by verifying the vibration reduction performance by exchanging the input values of the subordinate path calculated using the 4 methods mentioned earlier. The effectiveness of each technique in reducing five-DOF vibrations was assessed by comparing its response plot in the steady state and the response’s root mean square value. Figure 9 presents the simulation using a simple diagram.
Position 1 in Figure 9 is M o u n t 1 S z (marked as P1) in Figure 3 and Figure 4; Position 2 is M o u n t 2 S z (marked as P2); Position 3 is M o u n t 2 S x (marked as P3); Position 4 is M o u n t 1 R z (marked as P4); and Position 5 is M o u n t 2 R z (marked as P5_vert) and M o u n t 2 R x (marked as P5_horiz) in Figure 4. In Case 1, the vertical displacement of zero is specified at position 1. In Case 2, zero displacement in the vertical direction is specified at position 4. In Case 3, the vertical displacement of zero is specified at position 2. In Case 4, zero displacement in the vertical direction is specified at position 5. The input of the vertical active mount in the subordinate route, which aims for zero displacement in the vertical direction, was substituted to run the simulation. Table 2 lists the root mean square values without and with controls, and Figure 10 shows the response plot in the steady state for Case 1, which focuses on the displacement of the source in the vertical direction next to the vertical mount to be ‘0’.
For Case 1, the input of the subordinate path was a sine wave with a 400 Hz frequency and −8.1659 N amplitude in the vertical mount. The vibration of M o u n t 1 S z , which was targeted, was reduced by 100%, M o u n t 2 S z and M o u n t 2 S x by 29.7%, M o u n t 1 R z by 43.34%, M o u n t 2 R z by 23.92%, and M o u n t 2 R x by 50.26%. Hence, the vibration reduction performance of the automobile in Case 1 is enhanced by isolating the engine and subframe vibrations.
Figure 11 and Table 3 display the results after control for Case 2 (the intended vertical displacement of the receiver bordering the vertical mount is ‘0’).
In Case 2, the input of the subordinate path was calculated to be a 400 Hz sine wave with an amplitude of −13.7238 N in a vertical mount. The vibration of M o u n t 1 R z , which was targeted, was reduced by 100%, M o u n t 1 S z by 4.64%, M o u n t 2 S z and M o u n t 2 S x by 34.95%, M o u n t 1 R z by 43.34%, M o u n t 2 R z by 21.92%, and M o u n t 2 R x by 54.90%. Therefore, the vibration reduction performance of the automobile is improved, even though the Case-2 method insulated the powertrain and subframe vibrations.
Figure 12 and Table 4 (source displacement in the vertical direction bordering the mount in the horizontal direction is set to ‘0’) present the control results of Case 3.
For Case 3, the input of the subordinate path was a 400 Hz sine wave with an amplitude of −27.3703 N in the vertical mount. The vibration of M o u n t 2 S z , which was targeted, was reduced by 100%, M o u n t 2 S x by 100%, M o u n t 2 R z by 73.68%, and M o u n t 2 R x by 95.85%, while the vibrations of M o u n t 1 S z and M o u n t 1 R z show deteriorating trends of 135.6% and 29.57%, respectively. This suggests that the method in Case 3 calculates the subordinate path targeting the displacement of a location far from the active mount, resulting in a significant displacement of the location bordering the active mount. Thus, the Case-3 control is inefficient and intensifies the vibration.
Figure 13 and Table 5 present the Case-4 control results (the intended receiver displacement in the vertical direction bordering the mount in the horizontal direction is ‘0’).
For Case 4, the input of the subordinate path was a 400 Hz sine wave with an amplitude of −31.8566 N in the vertical mount. The vibration of M o u n t 2 R z , which was targeted, was reduced by 100%, M o u n t 2 R x by 100%, and M o u n t 2 S z and M o u n t 2 S x by 69.3%, while the vibrations of M o u n t 1 S z and M o u n t 1 R z showed a deteriorating trend by 196.9% and 81.1%, respectively. Hence, the method in this case calculates the subordinate path targeting the displacement at a point far from the active path in the same manner as the method in Case 3, resulting in a larger displacement close to the active mount. Thus, the Case-4 control is unproductive and worsens the vibration. Comparing the results of every scenario shows that the movement of the active path and bordering location must be controlled to show the appropriate control force and control result. Moreover, compared to the seven-DOF model [28], the five-DOF model required a substantially greater control force when aiming at a position bordering the mount in the horizontal direction and demonstrated poor NVH reduction performance.

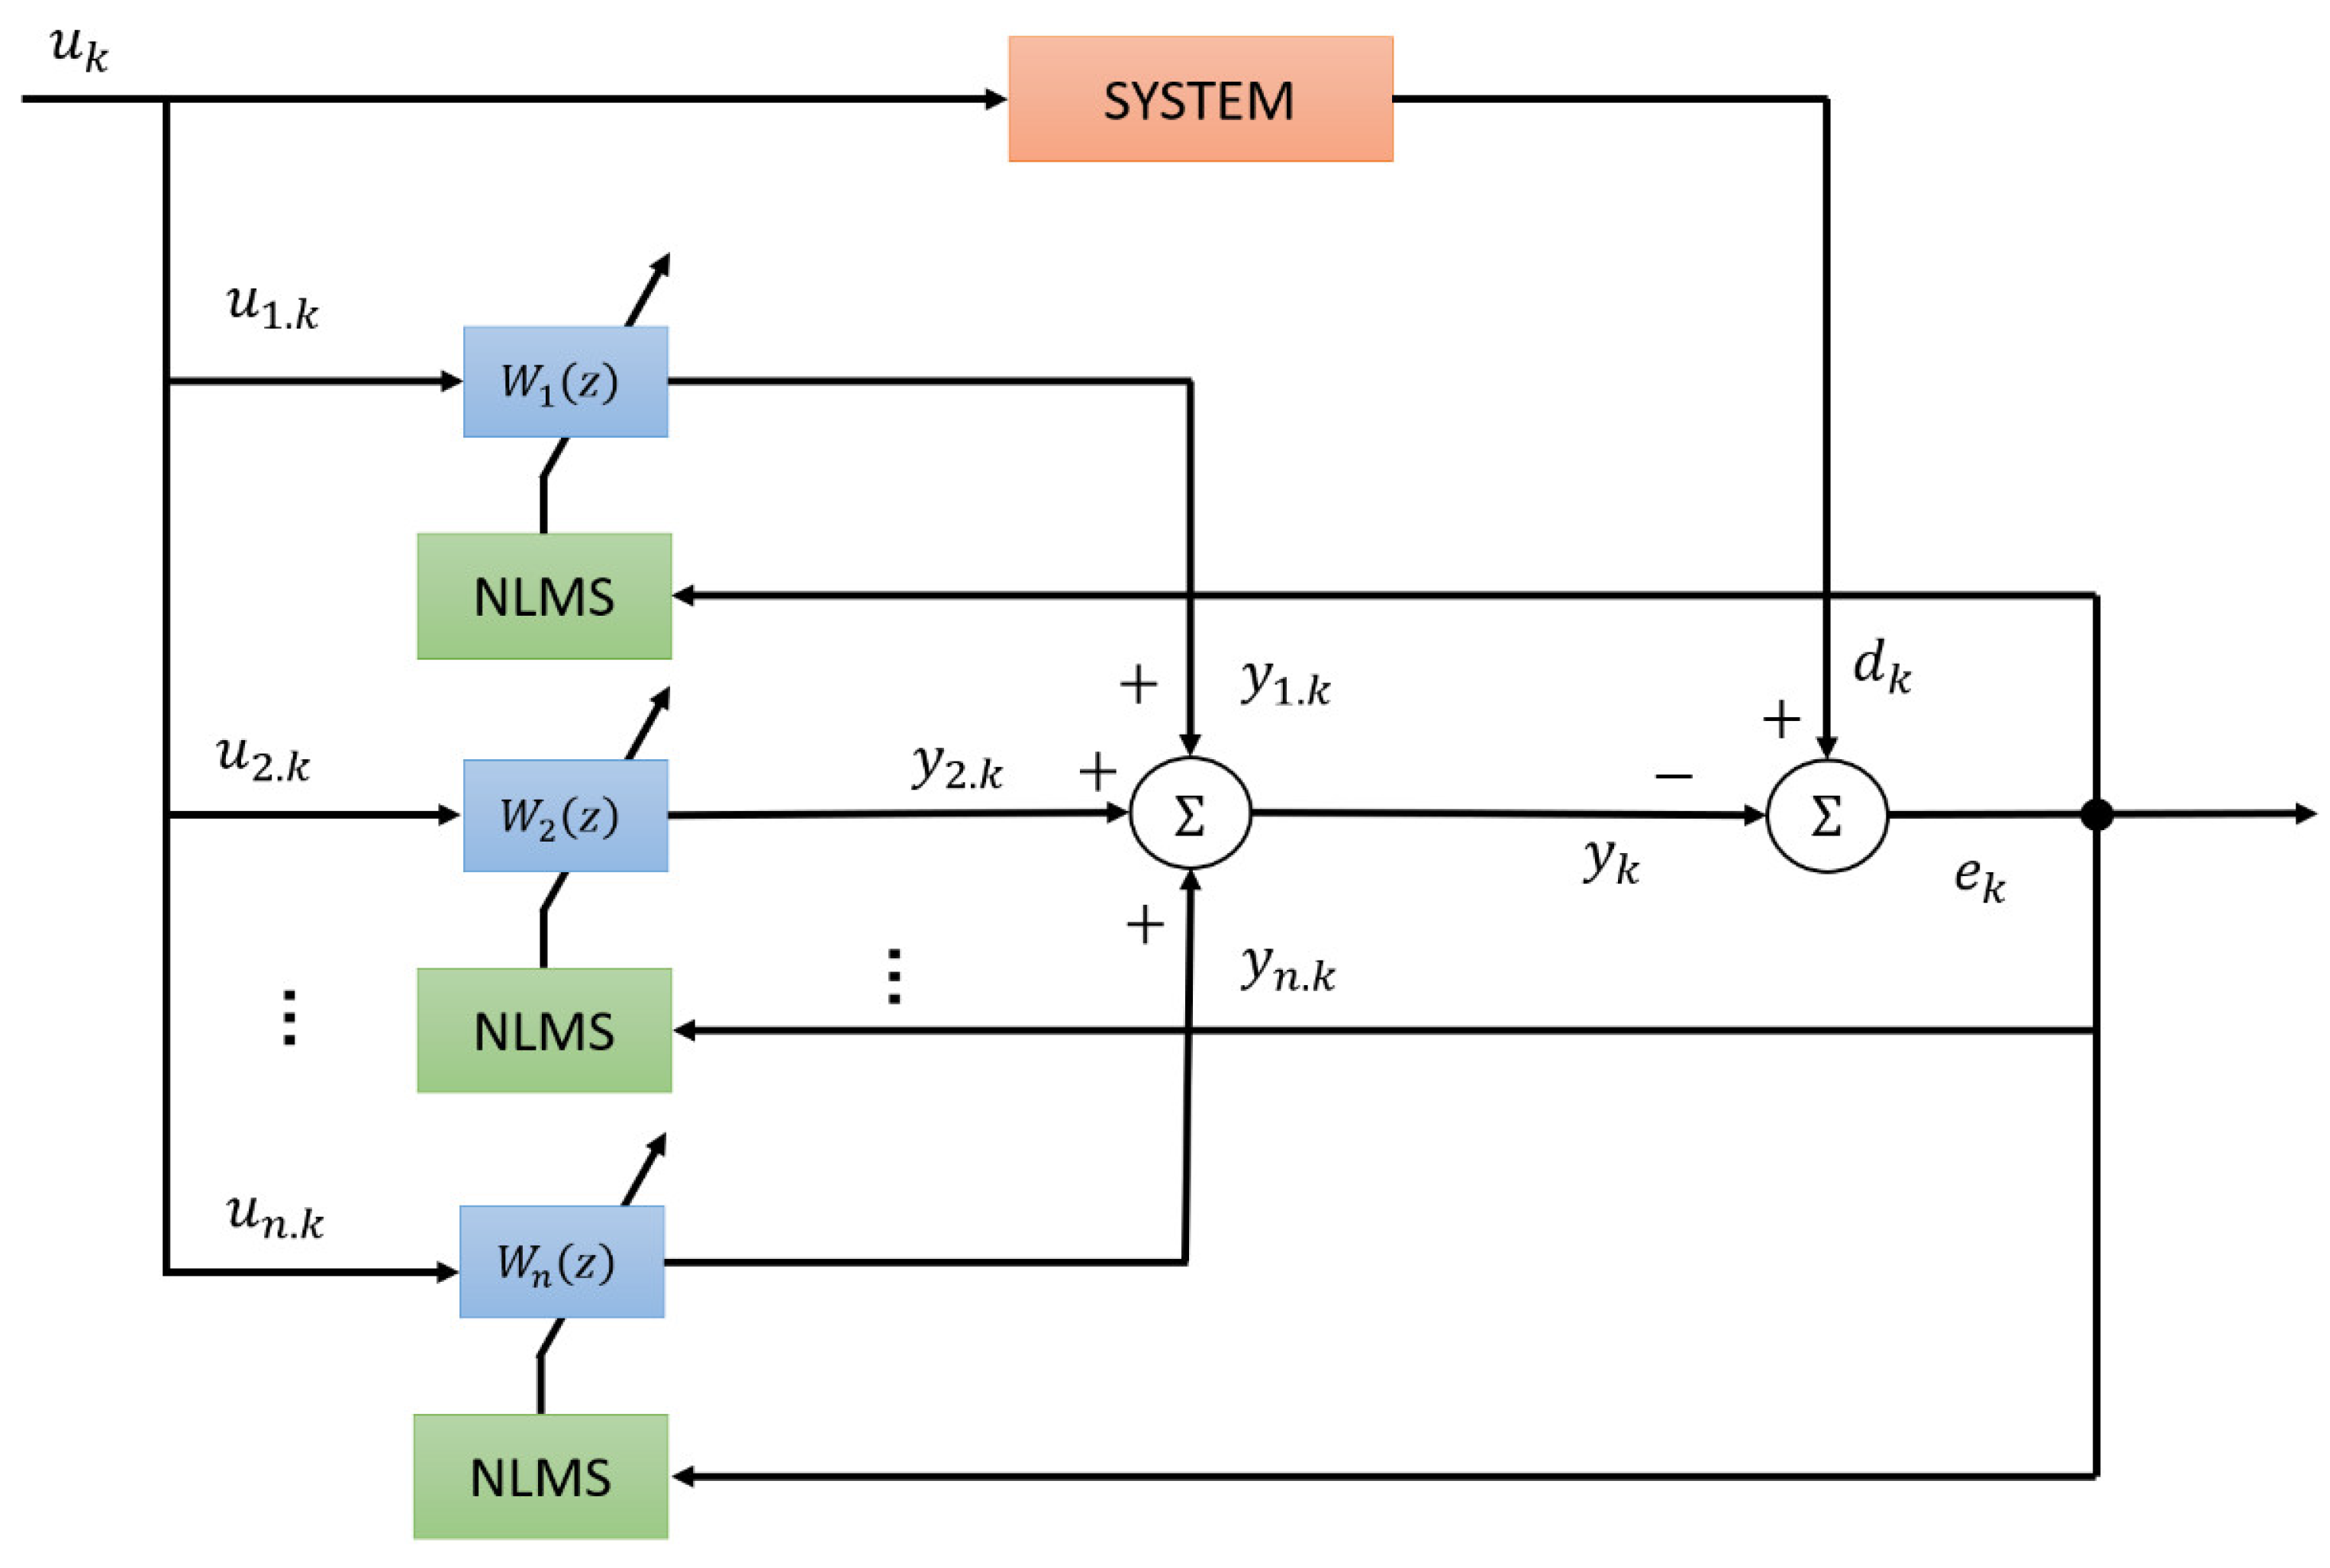
3.2. Control via the Adaptive Filtering Algorithm

When using the estimated input of the subordinate path for controlling, the control input needs to be calculated again each time there is a change in the surrounding environment or the stimulation force. It should be handled by an adaptive digital filter that regulates the filter coefficients in response to environmental factors to address this problem. Vibrations can be managed using representative adaptive filter techniques, like the algorithm called least mean squares (LMS). The LMS algorithm is often used for vibration and noise reduction because it is a straightforward and reliable technique. Also, the algorithm is easy to implement and shows relatively good performance for active vibration control (signal tracking problems). The disadvantage is that the convergence rate is somewhat sluggish, and the initial values heavily affect the convergence characteristics’ filter coefficients. The normalized LMS (NLMS) technique, which focuses on the shortcomings of the original LMS, and the vibration control approach in real time by closely observing the response of the source—a signal with the highest level from all the responses—were used in this study. A computer simulation assessed the suitability of the procedure before it was tested experimentally. Figure 14 presents a diagrammatic version of the five-DOF NLMS control simulation.
A basic sinusoidal signal, AM signal, and FM signal can be excited using the NLMS, an adaptive filtering algorithm for the five-DOF model, by replacing the signal that tracks the source signal next to the active mount in the vertical direction as an active mount input with the appropriate gain and phase. A numerical simulation was run to validate the persuasiveness of vibration attenuation; Figure 10 presents a simple illustration.
A sine wave with a 10 N amplitude and an excitation frequency of 400 Hz was provided because the simulation input for the case where the stimulation force is a plain sine wave, as expressed in Equation (37).
u ( t ) = 10 s i n ( 400 × 2 π t )
For the case of excitation with a straightforward sinusoid, the numerical simulation yielded the response graphs in the time domain in Figure 15 and Figure 16, comparing the RMS value of the steady-state response without and with control in Table 6 and the frequency spectrum in Table 7. The RMS comparison enabled the vibration reduction performance to be determined.
In accordance with Table 3, Table 4, Table 5 and Table 6, the vibrations showed a propensity to decrease as below: M o u n t 1 s z by 82.14%, M o u n t 2 s z by 25.18%, M o u n t 1 R z by 10.1%, M o u n t 2 R z by 21.14%, and M o u n t 2 R x by 40.64%. M o u n t 2 R x had a very small value both before and after control, similar to the seven-DOF results [28]. Therefore, the M o u n t 2 R x results were excluded from the results in the frequency domain, as shown in Table 7. The responses before and after control were compared via the FRF RMS from 300 Hz to 500 Hz. Vibration was reduced by 88.36% in M o u n t 1 s z , 26.48% in M o u n t 2 s z and M o u n t 2 s x , 0.78% in M o u n t 1 R z , and 21.39% in M o u n t 2 R z . This can be interpreted as minimizing the powertrain and subframe vibrations in the automobile. Therefore, NLMS control can enhance the vibration reduction performance of the automobile.
As a result of the development of electric vehicles, the powertrain of the vehicle generates signals with no less than 2–3 different frequencies. This suggests that it is challenging to regulate by calculating the input of the subordinate path depicted in Section 2.3 or by utilizing the NLMS only. Consequently, when modulated (AM and FM) signals with diversified frequencies are stimulated, the multi-NLMS algorithm with diversified channels is used for control, as shown in Figure 17.
An NLMS filter was Implemented for each frequency component of the input u k , which consists of n components. This adjustment modifies the filter coefficient, and the output signal is generated by summing the signals of single frequency. This method was implemented to reduce signal errors. The input for the scenario in which the stimulation force is an AM signal was an AM signal comprised of three frequency components and a 20 Hz carrier frequency, as indicated in Equation (38).
u t = 5 s i n 400 × 2 π t 1 + c o s 20 × 2 π t
The frequency component of Equation (38) was inserted for each NLMS input, as expressed in Equations (39)–(41).
u 1 t = s i n 380 × 2 π t
u 2 t = s i n 400 × 2 π t
u 3 t = s i n 420 × 2 π t
Through appropriate gain and phase control, the resultant signals were combined and then applied to the input of the subordinate path. In contrast to sinusoidal signals, comparing the responses of modulated (AM and FM) signals in the time domain is challenging. Hence, those signals were examined in contrast using FRF. The frequency response diagrams in Figure 18 and Figure 19 present the control results with multi-NLMS when the stimulation input is an amplitude modulated (AM) signal. In addition, the RMS responses from four seconds to 4.05 s in the time domain without and with control were examined in contrast at each position (Table 8), and the frequency domain response from 300 Hz to 500 Hz was compared (Table 9) to determine the reduction performance.
According to the RMS in the time domain, as shown in Table 8, the motions were attenuated by 67.38% in M o u n t 1 s z , 19.43% in M o u n t 2 S z and M o u n t 2 S x , 18.92% in M o u n t 1 R z , 18.41% in M o u n t 2 R z , and 25.56% in M o u n t 2 R x , compared to the values before control. Similar to the time domain, the frequency domain RMS results in Table 9 demonstrate a decreasing vibration trend by 72.33% in M o u n t 1 s z , 21.94% in M o u n t 2 S z , 21.94% in M o u n t 2 S x , 0.27% in M o u n t 1 R z , and 18.01% in M o u n t 2 R z . The AM signal exhibited a comparable tendency to the sine waves when it was stimulated, but its efficiency was inferior. This suggests that the complicated signal is agitated and the mitigation performance is decreased. On the other hand, the preceding results show that the powertrain and subframe of the automobile generate less vibration. Therefore, NLMS control can enhance the vibration reduction performance of the automobile.
The input involves a frequency modulated (FM) signal with a carrier frequency of 20 Hz. The signal’s frequency changes sinusoidally and theoretically contains an unlimited number of frequency components.
u t = 10 c o s 400 × 2 π t + s i n 20 × 2 π t
Equation (42) is used to provide the frequency components for each NLMS input, as seen in Equations (39)–(41). Figure 20 and Figure 21 depict the outcomes of the multi-NLMS control when the excitation force is a frequency modulation (FM) signal. In addition, for each position, the RMS response from four to 4.05 s in the time domain was compared with Table 10 before and after control, and the RMS response from 300 Hz to 500 Hz in the frequency domain was compared with Table 11 to understand the reduction performance.
As per the RMS in the time domain, as shown in Table 10, the vibration was attenuated by 62.61% in M o u n t 1 s z , 20.28% in M o u n t 2 S z and M o u n t 2 S x , 22.63% in M o u n t 1 R z , 17.65% in M o u n t 2 R z , and 35.32% in M o u n t 2 R x , compared to the values before control. Similar to the time domain, the frequency domain RMS results in Table 11 indicate a tendency to reduce vibrations by 64.02% in M o u n t 1 s z , 21.02% in M o u n t 2 S z and M o u n t 2 S x , and 18.01% in M o u n t 2 R z , while the vibration is amplified by 0.02% in M o u n t 1 R z . When the frequency modulated (FM) signal was stimulated, it exhibited an analogous tendency to the sinusoidal or AM signals, but the efficacy was inferior. This demonstrates that the complicated signal is agitated and the mitigation efficiency is decreased. The control results in the time domain and frequency domain, when excited by the FM signal, show that the engine vibration can be reduced to reduce engine noise and the vibration of the subframe that affects the ride comfort of the vehicle occupants. On the other hand, in the case that the active mount in the vertical direction was used solely, vibration reduction efficacy was poor compared to when the active mounts in both horizontal and vertical directions were used [28].

4. Conclusions

The present investigation involved the integration of a rubber grommet and piezoelectric stack actuator to produce a powertrain mount connecting the powertrain to the automobile subframe. The effectiveness of the vibration mitigation mechanism was evaluated by aligning the actuator with the connecting direction of the powertrain mount. The source–path–receiver configuration was used to design and construct the entire asymmetric structure, with the automobile powertrain serving as the source, the active mounting system functioning as the path, and the subframe substituting in a roll as the receiver. Analytical modeling was utilized to examine the impact of the vibration attenuation of the active mounting structure positioned vertically and horizontally. In particular, a vibration reduction performance analysis of the structure was conducted using a five-degree-of-freedom model, considering the possibility that a breakdown of the active mount occurs in the horizontal direction or functions exclusively as a vertical active mount. The validation of the vibration reduction effect for a sinusoidal signal involved deciding the phase and amplitude specifications for every active mounting system. In addition, the effect was confirmed by subjecting the AM and FM signals, each of which contained three frequency components, to excitation via the NLMS with adaptive digital filters.
With respect to the horizontal response, the expression for the dynamic relationship presented in this paper recognized the prevailing pattern and investigated potential strategies to regulate it. The stimulation of a sine wave and subsequent computation of the control input for every active mounting system result in the summing of the vibration reduction effect for a cumulative effect of six input control forces. Although the vibration reduction in the entire structure could be shown in a single instance, it was impossible to achieve the phase value of the control force. The NLMS algorithm was implemented to validate the impacts of noise and complex signal excitation on vibration reduction. Consequently, the vibrations near the CG of the source and vibrations of the receiver tended to be reduced substantially, improving NVH performance. Consequently, the monitored source experienced a significant vibration reduction, while the vibrational motion transferred to the receiver experienced a lesser reduction than the system containing two active mounts. Hence, in the event of a failure of the active mounting system in the horizontal direction, the vertical active mount efficiently mitigates engine vibration and noise. On the other hand, the vibration of the subframe remains equivalent to its pre-control state, necessitating maintenance. Applying force in the horizontal direction can significantly mitigate the vibrations of the structure. Nevertheless, additional investigations will be needed to determine the reciprocal connection between the horizontal and vertical trajectories.
The following are the contributions that this work has made.
(1)
An exhaustive technology for analyzing the motion of mounting systems is proposed. By integrating analytical modeling and input quantification for actuators, this methodology broadens its scope and facilitates its implementation across various mounting systems.
(2)
The present research examines and documents the interplay between lateral and vertical vibrations of a structure that draws inspiration from an automotive mount. Prior investigations have mainly concentrated on the manner of actuation and unidirectional vibration attenuation. In addition, an assessment and comparison are performed regarding the effectiveness of vibration attenuation corresponding to the particular locations utilized to measure the actuator input. Furthermore, this could aid in the formulation of the actuation strategy.
(3)
The vibration reduction efficacy of the suggested structure is examined by applying multi-spectral stimulations to relatively complex vibration signals.
With regard to subsequent investigations, the justification of the mathematical model should be checked with a series of laboratory experiments and also the vibration attenuation trend should be checked with more a automotive-like structure to confirm the applicability of this work. Also, control effectiveness with various methods should be discussed in more detail with the impacts of complex signals and noise. Furthermore, this study will determine how the coupling orientation of the engine mount affects the source and receiver to facilitate more effective control.

Author Contributions

Conceptualization, B.K.; methodology, D.H. and H.M.; software, D.H. and H.M.; writing—original draft preparation, D.H. and H.M.; writing—review and editing, B.K. All authors have read and agreed to the published version of the manuscript.

Funding

This work was supported by a 2024 Yeungnam University Research Grant (224A380033) and by the Basic Science Research Program through the National Research Foundation of Korea (NRF) funded by the Ministry of Education (NRF-2021R1A6A1A03039493).

Data Availability Statement

The data presented in this study are available upon request from thecorresponding author. These data are not publicly available because of the large sample size.

Conflicts of Interest

The authors declare no conflicts of interest.

References

  1. Yu, Y.; Naganathan, N.G.; Dukkipati, R.B. A literature review of automotive vehicle engine mounting systems. Mech. Mach. Theory 2001, 36, 123–142. [Google Scholar] [CrossRef]
  2. Hosseini, M.; Arzanpour, S.; Golnaraghi, F.; Parameswaran, A.M. Solenoid actuator design and modeling with application in engine vibration isolators. J. Vib. Control. 2012, 19, 1015–1023. [Google Scholar] [CrossRef]
  3. Kraus, R.; Herold, S.; Millitzer, J.; Jungblut, T. Development of active engine mounts based on piezo actuators. ATZ Peer Re-View 2014, 116, 50–55. [Google Scholar] [CrossRef]
  4. Chae, H.D.; Choi, S.B. A new vibration isolation bed stage with magneto-rheological dampers for ambulance vehicles. Smart Mater. Struct. 2015, 24, 0964–1726. [Google Scholar] [CrossRef]
  5. Yang, T.J.; Suai, Z.J.; Sun, Y.; Zhu, M.G.; Xiao, Y.H.; Liu, X.G.; Du, J.T.; Jin, G.Y.; Liu, Z.G. Active vibration isolation system for a diesel engine. Noise Control. Engr. J. 2012, 60, 267–282. [Google Scholar] [CrossRef]
  6. Jeon, J.; Han, Y.M.; Lee, D.Y.; Choi, S.B. Vibration control of the engine body of a vehicle utilizing the magneto-rheological roll mount and the piezostack right-hand mount. Proc. Inst. Mech. Eng. Part D J. Automob. Eng. 2013, 227, 1562–1577. [Google Scholar] [CrossRef]
  7. Jiang, J.; Gao, W.; Wang, L.; Teng, Z.; Liu, Y. Active vibration control based on modal controller considering structure actuator interaction. J. Mech. Sci. Technol. 2018, 32, 3515–3521. [Google Scholar] [CrossRef]
  8. Fakhari, V.; Choi, S.B.; Cho, C.H. A new robust adaptive controller for vibration control of active engine mount subjected to large uncertainties. Smart Mater. Struct. 2015, 24, 045044. [Google Scholar] [CrossRef]
  9. Elahinia, M.; Ciocanel, C.; Nguten, M.; Wang, S. MR and ER based semiactive engine mounts. Smart Mater. Res. 2013, 21, 831017. [Google Scholar] [CrossRef]
  10. Wu, W.; Chen, X.; Shan, Y. Analysis and experiment of a vibration isolator using a novel magnetic spring with negative stiffness. J. Sound Vib. 2014, 333, 2958–2970. [Google Scholar] [CrossRef]
  11. Truong, T.Q.; Ahn, K.K. A new type of semi-active hydraulic engine mount using controllable area of inertia track. J. Sound Vib. 2010, 329, 247–260. [Google Scholar] [CrossRef]
  12. Kamada, T.; Fujita, T.; Hatayama, T.; Arikabe, T.; Murai, N.; Aizawa, S.; Tohyama, K. Active vibration control of frame structures with smart structures using piezoelectric actuators (vibration control by control of bending moments of columns). Smart Mater. Struct. 1997, 6, 448–456. [Google Scholar] [CrossRef]
  13. Loukil, T.; Bareille, O.; Ichchou, M.N.; Haddar, M. A low power consumption control scheme: Application to a piezostack-based active mount. Front. Mech. Eng. 2013, 8, 383–389. [Google Scholar] [CrossRef]
  14. Sui, L.; Shi, X.X.G. Piezoelectric actuator design and application on active vibration control. Phys. Procedia 2012, 25, 1388–1396. [Google Scholar] [CrossRef]
  15. Choi, S.B.; Choi, Y.T. Sliding mode control of a shear-mode type ER engine mount. KSME Int. J. 1999, 13, 26–33. [Google Scholar] [CrossRef]
  16. Sarkar, C.; Hirani, H.; Sasane, A. Magneto-rheological Smart Automotive Engine Mount. Int. J. Curr. Eng. Technol. 2015, 5, 419–428. [Google Scholar]
  17. Chang, Y.; Zhou, J.; Wang, K.; Xu, D. A quasi-zero-stiffness dynamic vibration absorber. J. Sound Vib. 2020, 494, 115859. [Google Scholar] [CrossRef]
  18. Liette, J.; Dreyer, J.T.; Singh, R. Interaction between two Paths for source mass motion control over mid-frequency range. J. Sound Vib. 2014, 333, 2369–2385. [Google Scholar] [CrossRef]
  19. Hong, D.; Kim, B. Vibration Reduction for Modulated Excitation Using Lumped Parameter Modeling and Multi-Channel NLMS Algorithm for a Structure with Three Active Paths between Plates. J. Mech. Sci. Technol. 2019, 33, 4673–4680. [Google Scholar] [CrossRef]
  20. Hong, D.; Kim, B. Quantification of Active Structural Path for Vibration Reduction Control of Plate Structure under Sinusoidal Excitation. Appl. Sci. 2019, 9, 711. [Google Scholar] [CrossRef]
  21. Qiu, Y.; Hong, D.; Kim, B. Optimal placement criteria of hybrid mounting system for chassis in future mobility based on beam-type continuous smart structures. Sci. Rep. 2023, 13, 2317. [Google Scholar] [CrossRef] [PubMed]
  22. Hausberg, F.; Scheiblegger, C.; Pfeffer, P.; Plöchl, M.; Hecker, S.; Rupp, M. Experimental and analytical study of secondary path variations in active engine mounts. J. Sound Vib. 2015, 340, 22–38. [Google Scholar] [CrossRef]
  23. Bartel, T.; Herold, S.; Mayer, D.; Melz, T. Development and Testing of Active Vibration Control Systems with Piezoelectric Actuators. In Proceedings of the 6th ECCOMAS Conference on Smart Structures and Mate-Rials, Torino, Italy, 24–26 June 2013; pp. 24–26. [Google Scholar]
  24. Li, H.; Goodall, R.M. Linear and nonlinear skyhook damping control laws for active railway suspensions. Control. Eng. Pract. 1999, 7, 843–850. [Google Scholar] [CrossRef]
  25. Singal, K.; Rajamani, R. Zero-Energy Active Suspension System for Automobiles with Adaptive Skyhook Damping. J. Vib. Acoust. 2013, 135, 011011. [Google Scholar] [CrossRef]
  26. Emura, J.; Kakizaki, S.; Yamaoka, F.; Nakamura, M. Development of the Semi-Active Suspension System Based on the Skyhook Damper Theory. SAE Trans. J. Passeng. Cars 1994, 103, 1110–1119. [Google Scholar]
  27. Chai, Y.; Li, F.; Song, Z.; Zhang, C. Analysis and active control of nonlinear vibration of composite lattice sandwich plates. Nonlinear Dyn. 2020, 102, 2179–2203. [Google Scholar] [CrossRef]
  28. Hong, D.; Moon, H.; Kim, B. Bidirectional active vibration control of two-dimensional structure inspired by automotive engine mounting system. J. Mech. Sci. Technol. 2024, 38, 2231–2246. [Google Scholar] [CrossRef]
Figure 1. (a) Vibrations from the powertrain; (b) mount structure (red solid circles indicate engine mount, roll-rod, and transmission mount, from the left).
Symmetry 16 00727 g001
Figure 2. Active mounts integrated into automobiles for active vibration control.
Symmetry 16 00727 g002
Figure 3. Multi-directional mounting system model with a faulty horizontal active path.
Symmetry 16 00727 g003
Figure 4. Multi-directional mounting system model with mount coordinates.
Symmetry 16 00727 g004
Figure 5. Source’s dynamic motion by excitation.
Symmetry 16 00727 g005
Figure 6. Receiver’s dynamic motion by excitation.
Symmetry 16 00727 g006
Figure 7. Experimental structure utilized to determine the parameters.
Symmetry 16 00727 g007
Figure 8. Steady-state response under harmonic stimulation.
Symmetry 16 00727 g008
Figure 9. Simulation schematic for the model.
Symmetry 16 00727 g009
Figure 10. Case-1 controlled response in the steady state.
Symmetry 16 00727 g010
Figure 11. Case-2 controlled response in the steady state.
Symmetry 16 00727 g011
Figure 12. Case-3 controlled response in the steady state.
Symmetry 16 00727 g012
Figure 13. Case-4 controlled response in the steady state.
Symmetry 16 00727 g013
Figure 14. Five-degrees-of-freedom NLMS control simulation schematic.
Symmetry 16 00727 g014
Figure 15. Source control result with NLMS in time domain.
Symmetry 16 00727 g015
Figure 16. Receiver control result with NLMS in time domain.
Symmetry 16 00727 g016
Figure 17. Schematic diagram for multi-NLMS algorithm.
Symmetry 16 00727 g017
Figure 18. Comparison of FRF after NLMS control with AM.
Symmetry 16 00727 g018
Figure 19. Comparison of FRF after NLMS control with AM.
Symmetry 16 00727 g019
Figure 20. Comparison of FRF after NLMS control with FM.
Symmetry 16 00727 g020
Figure 21. Comparison of FRF after NLMS control with FM.
Symmetry 16 00727 g021
Table 1. Parameters used for simulations.
VariableValueUnit
m 1 1.721 k g
m 2 1.350 k g
m a c 1 0.075 k g
I 1 33.402 g m 2
I 2 18.070 g m 2
k m 1 z 5.46 k N / m m
k m 2 z = k m 2 x = k m 2 z x 0.5 k N / m m
k m 3 z 0.61 k N / m m
k b 1 z = k b 2 z 0.42 k N / m m
c m 1 z 22 N s / m
c m 2 z = c m 2 x = c m 2 z x 140 N s / m
c m 3 z 64 N s / m
c b 1 z = c b 2 z 200 N s / m
l s 1 = l s 3 50.686 m m
l s 2 179.314 m m
l r 1 = l r 2 136 m m
l r 3 = l r 5 0 m m
l r 4 200 m m
d 50 m m
Table 2. Case-1 controlled results.
[ Unit :   μ m ]SourceReceiver
P1P2P3P4P5_VertP5_Horiz
Without
Control
0.60021.03720.29320.08170.2214 2.03 × 10 7
With
Control
0
100%
0.7291
29.7%
0.2061
29.7%
0.0463
43.34%
0.1685
23.92%
1.01 × 10 7
50.26%
Table 3. Case-2 controlled results.
[ Unit :   μ m ]SourceReceiver
P1P2P3P4P5_VertP5_Horiz
Without
Control
0.60021.03720.29320.08170.2214 2.03 × 10 7
With
Control
0.5724
4.64%
0.6747
34.95%
0.1907
34.95%
0
100%
0.1729
21.92%
9.15 × 10 8
54.9%
Table 4. Case-3 controlled results.
[ Unit :   μ m ]SourceReceiver
P1P2P3P4P5_VertP5_Horiz
Without
Control
0.60021.03720.29320.08170.2214 2.03 × 10 7
With
Control
1.4142
135.6%
0
100%
0
100%
0.1058
29.57%
0.0583
73.68%
8.43 × 10 9
95.85%
Table 5. Case-4 controlled results.
[ Unit :   μ m ]SourceReceiver
P1P2P3P4P5_VertP5_Horiz
Without
Control
0.60021.03720.29320.08170.2214 2.03 × 10 7
With
Control
1.7821
196.9%
0.3184
69.3%
0.09
69.3%
0.148
81.1%
0
100%
0
100%
Table 6. RMS value comparison in the steady state with sinusoid.
[ Unit :   μ m ]SourceReceiver
P1P2P3P4P5_VertP5_Horiz
Without
Control
0.62861.06490.3010.17850.4747 4.76 × 10 7
With
Control
0.1123
82.14%
0.7968
25.18%
0.2252
25.18%
0.1604
10.1%
0.3739
21.14%
2.83 × 10 7
40.64%
Table 7. FRF RMS value comparison with sinusoid.
[ Unit :   m m ]SourceReceiver
P1P2P3P4P5_Vert
Without
Control
1.01031.74570.49350.24590.7447
With
Control
0.1176
88.36%
1.2834
26.48%
0.3628
26.48%
0.244
0.78%
0.5854
21.39%
Table 8. RMS value comparison in the steady state with AM.
[ Unit :   μ m ]SourceReceiver
P1P2P3P4P5_VertP5_Horiz
Without
Control
0.41250.67960.19210.1370.3239 2.51 × 10 7
With
Control
0.1345
67.38%
0.5475
19.43%
0.1548
19.43%
0.1111
18.92%
0.2643
18.41%
1.87 × 10 7
25.56%
Table 9. FRF RMS value comparison with AM.
[ Unit :   m m ]SourceReceiver
P1P2P3P4P5_Vert
Without
Control
0.62271.07570.30410.15390.4664
With
Control
0.1723
72.33%
0.8397
21.94%
0.2374
21.94%
0.1535
0.27%
0.3825
18.01%
Table 10. RMS value comparison in the steady state with FM.
[ Unit :   μ m ]SourceReceiver
P1P2P3P4P5_VertP5_Horiz
Without
Control
0.63081.07090.30270.18330.4888 5.36 × 10 7
With
Control
0.2358
62.61%
0.8537
20.28%
0.2413
20.28%
0.1632
10.95%
0.4025
17.65%
3.47 × 10 7
35.32%
Table 11. FRF RMS value comparison with FM.
[ Unit :   m m ]SourceReceiver
P1P2P3P4P5_Vert
Without
Control
1.01821.75890.49720.25350.7688
With
Control
0.3663
64.02%
1.3893
21.02%
0.3927
21.02%
0.2536
0.02%
0.6394
16.82%
Disclaimer/Publisher’s Note: The statements, opinions and data contained in all publications are solely those of the individual author(s) and contributor(s) and not of MDPI and/or the editor(s). MDPI and/or the editor(s) disclaim responsibility for any injury to people or property resulting from any ideas, methods, instructions or products referred to in the content.

