Abstract
With the continuously growing requirement for encryption in network environments, web browsers are increasingly employing hypertext transfer protocol security. Despite the increase in encrypted malicious network traffic, the encryption itself limits the data accessible for analyzing such behavior. To mitigate this, several studies have examined encrypted network traffic by analyzing metadata and payload bytes. Recent studies have furthered this approach, utilizing graph neural networks to analyze the structural data patterns within malicious encrypted traffic. This study proposed an enhanced encrypted traffic analysis leveraging graph neural networks which can model the symmetric or asymmetric spatial relations between nodes in the traffic network and optimized feature dimensionality reduction. It classified malicious network traffic by leveraging key features, including the IP address, port, CipherSuite, MessageLen, and JA3 features within the transport-layer-security session data, and then analyzed the correlation between normal and malicious network traffic data. The proposed approach outperformed previous models in terms of efficiency, using fewer features while maintaining a high accuracy rate of 99.5%. This demonstrates its research value as it can classify malicious network traffic with a high accuracy based on fewer features.
1. Introduction
With the increased utilization of the Internet, large volumes of sensitive information are being transmitted and received through networks. To protect sensitive information, there has been an increased demand for network encryption during data exchange over networks, and the hypertext transfer protocol secure (HTTPS) has been used for encryption. HTTPS protects communication and data transfer between a web browser of the user and a website using transport layer security (TLS) or a secure socket layer (SSL) [1]. By encrypting all exchanges among web servers, the protocol provides security to users. As of June 2023, approximately 97% and 94% of the websites were using HTTPS on the Chrome and Firefox browsers, respectively. Furthermore, the use of HTTPS within widely used browsers is increasing annually [2,3]. However, the number of instances wherein HTTPS-based network data encryption techniques are used to protect sensitive data within network communications has increased. Encrypted malicious network traffic can perform malicious activities, such as introducing malware into the target or inserting files containing malicious code [4,5]. In contrast to traditional nonencrypted malicious network traffic, malicious encrypted network traffic requires a decryption process for detailed analysis. This is because malicious activity is contained within encrypted TLS session data. Moreover, there are certain limitations in the detection of malicious activities through existing network traffic analysis techniques.
Therefore, current research is focusing on encrypted traffic analysis (ETA) techniques using metadata or payload bytes of encrypted network traffic for efficient analysis. Security technologies based on machine learning (ML) and deep learning (DL) techniques are also being studied for detection automation and intelligence [6,7,8,9,10,11,12,13,14,15,16,17,18,19,20,21,22,23]. This involves the efficient selection of features that can be used for analyzing and classifying malicious network traffic and applying an ML architecture optimized for encrypted network traffic analysis [24,25]. This study proposed an enhanced encrypted traffic analysis leveraging graph neural networks and optimized feature dimensionality reduction that can classify malicious encrypted network traffic by analyzing features that are usable, selecting the primary features, and using the minimum combination of features as a basis. The proposed architecture comprised the GraphSAGE and prediction models. To focus on analyzing encrypted network traffic, only TLS session data within encrypted normal/malicious network traffic were extracted for learning. The architecture utilized features only from the TLSClientHello packet. Furthermore, the GraphSAGE model comprising the proposed architecture facilitated the analysis of complex correlations among data, such as network traffic, and classified malicious network traffic using a prediction model built on two layers. Compared with the number of features used in existing GNN-based ETA studies, the proposed architecture classifies malicious network traffic using fewer features, achieving a classification accuracy of 99.5% by analyzing an ideal combination of features, including IP address, port, CipherSuite, MessageLen, and JA3. It achieves higher classification accuracy with fewer features than earlier ETA-based algorithms using the GNN architecture, and precision, recall, and F1-score were used to demonstrate the superiority of the proposed architecture.
The contributions of this study related to encrypted network traffic analysis are summarized as follows:
- The metadata used for encrypted network traffic classification and the ideal combination of usable features within the metadata, particularly the TLS session data, were analyzed.
- A classification architecture capable of classifying encrypted normal/malicious network traffic using fewer features than existing GNN-based ETA algorithms was proposed.
- The accuracy, precision, recall, and F1-score for each feature combination were analyzed to derive an ideal combination of features, demonstrating the enhanced capability of classifying malicious network traffic with fewer features based on the proposed feature combination.
The remainder of this paper is organized as follows. Section 2 describes the related work related to the design of the proposed architecture, including GNN-based ETA research and GNNs. Section 3 provides a general explanation of the proposed architecture. Section 4 describes the experimental and comparative analyses of each feature within the TLS session data using the proposed architecture. Finally, Section 5 concludes the study.
2. Related Work
This section describes the related studies for a better understanding of the proposed architecture. Further, detailed definitions of the components required to configure the proposed architecture are also presented.
2.1. Encrypted Network Traffic
ETA is a technology defined by Cisco for classifying malicious encrypted network traffic based on network data received from network devices and ML algorithms [24,25]. The network data used in ETA, including byte allocation, TLS-related functions, and packet-length-based ETA, are advantageous for handling the large volumes of data that are required to construct a classification model using the statistical features or behavioral characteristics of encrypted network traffic. When creating an encrypted channel on the network, only certain plain text data in the payload of encrypted traffic can be analyzed. Therefore, ETA is performed via the application of anomaly detection technology to the traffic rather than to the payload. ETA methodologies can be divided into traditional ML and DL methods and expert knowledge methods [26]. In the case of ML, feature selection must be preceded by a process such as feature engineering, whereas this can be omitted in DL [27]. In particular, DL-based ETA omits the manual feature extraction process, thereby facilitating the processing of constantly changing traffic patterns and improving upon the limitations of conventional ML, which is plagued by generalization constraints in terms of classification accuracy [26]. Previous research extracted meaningful information from network traffic and classified it using machine learning models. Moreover, because DL methods exhibit high traffic classification performance while omitting the need for efficient feature extraction processes, both analysis models have been recently used. However, in the case of DL, anomaly detection cannot actively respond to abnormal traffic in the absence of a basis for judging abnormal traffic. Therefore, the traditional ML method, which determines the abnormal traffic, is used. In the case of the DL method, studies have used models that can explain detection results [27], such as XAI [28].
In earlier algorithms, the features most commonly used in ETA were the IP, port, and packet length, which can be obtained from packet headers and payloads [7,8,9,10,12,13,14,17,20]. Various learning algorithms, such as ML, CNNs, and GNNs, have been used in ETA and have achieved excellent performance. Recently, when using ML for ETA, in contrast to the existing method of using only ML, a two-layer detection framework combined with a neural network (long short-term memory, residual neural network, etc.) was proposed, and a high accuracy of 99.73 was achieved [6]. They achieved an efficiency of 88.5–99.9% and employed various GNN-based models, such as graph convolutional networks (GCNs) [10,11,13,17,21,29], message passing neural networks (MPNNs) [30], graph attention networks (GATs) [31], and graph samples and aggregates (GraphSAGE) [32]. Handshake data have also been used in ETA [7,11,19]; these studies reported performance efficiencies of 96–99.9% using the GCN and GraphSAGE models and the GNN model. Certain studies have also used features such as packet length sequences [15,16] or flow-based features [21], as well as GNN-based ETA, using various features such as dividing the open systems interconnection (OSI) layer to configure data individually [18]. In addition, a method combining bidirectional encoder representations from transformers (BERT) and the CNN model was recently implemented. The byte feature convolution (BFCN) model-based classification technique [22] used this method and achieved an accuracy of 99.12–99.65%. In addition, malicious encrypted traffic with a causality explainable detection system (METCXDS), built using the Wasserstein GAN (WGAN), a type of generative adversarial network (GAN), achieved 99.5–100% FSr [23]. The use of packet length sequences yielded performances in the range of 95.97–98.86%. Flow-based features demonstrated a relatively low performance of 93%, and features based on individual configuration of data using the OSI layer achieved a performance of 97.48%. Table 1 summarizes the features used for learning, models, proposed techniques, and datasets used for accuracy verification in each study.

Table 1.
Related studies on ML, DL, and GNN-based network traffic analysis.
2.2. Graph Neural Network and GraphSAGE
The GNN model is a geometric learning technique used to process graph structure data composed of nodes and edges [35]. GNNs aim to understand the structural information within a graph by embedding a vector based on the situation of each node. This process includes two major stages: message passing and aggregation. In the first stage, the local graph neighbors of each node pass information collected from each neighbor as through . In the second stage, the aggregation function of aggregates all the information from the local neighboring nodes. The quality of the employed aggregation function determines the performance of the GNN model. Various state-of-the-art approaches has been proposed to optimize the representation capacity of GNNs [36,37]. The authors in [38] proposed an injective aggregation function based on a full rank aggregation function to enhance the representation capacity of the GNNs. The aggregation stage can be repeated a predefined number of times until a sufficient representation is obtained for each node in the graph. Owing to the possibility of losing the information of the target node during the message passing process, the GNN framework saves the node information separately to prevent the loss of information prior to the message passing stage. In most cases, a multilayer perceptron (MLP) with a trainable weight matrix is used to help learn the specific embeddings for nodes or edges.
Furthermore, the GNN operation can be generalized as indicated by Equation (1). In Equation (1), is a vector value representing the th embedding of node . The new hidden state of a given node is calculated by considering its interaction with neighboring nodes, the state in the previous layer, and the weight and bias. In addition, it iteratively extracts the characteristics within the graph. Thus, Equation (1) multiplies the weight matrix of the layer by the average of the hidden states of the layer for all nodes neighboring node , adds the bias value , and then uses the sigmoid function to adjust the value. The bias value is a parameter related to the model’s data adaptability and the appropriateness of the output value and is adapted to the data to improve model performance [39]. To generate new features of the current node, Equation (2) is used; where, denotes the message aggregated from the graph neighbors of . Obtaining the sum of neighboring embeddings renders the GNN unstable and sensitive to node degree. Consequently, the GNN framework normalizes the aggregation operation based on node degree, as expressed by Equation (2). Thus, the GNN updates each node’s attributes and synthesizes information from neighboring nodes to support the creation of new characteristics of the current node.
Following embedding, the result can be assigned to the loss function, and the weight parameters can be trained through either unsupervised or supervised learning. GNNs offer the advantages of universality and flexibility because they can integrate the global attributes shared by all nodes assigned to the graph used as the input [17].
Several studies have examined various GNN models, such as GCN, GraphSAGE, GAT, and MPNN. GraphSAGE can overcome the limitations of the transductive learning method; it learns node embedding for existing fixed graphs and can perform inductive node embedding for newly added nodes in evolving graphs. During the GraphSAGE learning process, operations are conducted in batches, and a fixed number of nearest nodes (neighbor nodes) are sampled by the uniform random draw method in each iteration. In other words, the model uses a neighbor sampling technique; that is, it does not add all the neighbor nodes to the embedding operation but rather samples only a predefined number of neighbor nodes. Consequently, optimization is performed during the GraphSAGE learning stage, and following K iterations, the input node representation , ∈ V is calculated using Equation (3). Equation (3) is the loss function calculation formula of GraphSAGE, which explains the process of learning relationships by considering positive/negative samples during the learning process. The loss function calculates the dot products of and , which are the embedding vectors of nodes and , adjusts the value with the sigmoid function δ, and calculates the log loss related to the probability of the relationship between node and neighboring node . This value plus the loss for negative samples for node and the expected value for negative samples , multiplied by the log loss of the probability of the relationship between node and its neighbor node , is derived by subtracting the sum of the values. By employing this approach, the model learns the relationship between positive and negative samples and updates the embedding vector of node .
Aggregation reflects the information of the nodes using Equations (4)–(7). This involves performing a linear transformation on each node’s embedding and then aggregating the information of the neighboring nodes through elementwise max pooling:
The weight matrices , ∈ {1, 2, …, } of the aggregator function are trained through gradient descent. Here, is the current step of the outer loop (or search depth), and represents the representation of the node at this step.
The graph-based loss function was applied to the output representation , ∈ V, and the weight matrix of the aggregate function , ∈ {1, 2, …, } was adjusted to ensure that the neighboring nodes had similar representations while distinguishing among the various node representations. Here, is a node that occurs together near in a fixed-length random walk, is a sigmoid function, and is defined as the number of negative samples. In contrast to traditional embedding approaches, input to this loss function is generated not by training unique embeddings for each node but rather through the features included in the local neighbors of the node.
In Equation (4), the mean aggregator utilizes the elementwise average of vectors located in , connecting the previous layer representation of node to the aggregation neighbor vector , thereby enhancing the performance. Furthermore, the LSTM aggregator in Equation (5) applies LSTM to random permutations of node neighbors, thus adjusting it to work on an unordered set. The current state is updated by providing the hidden state in the layer for neighboring node multiplied by as input to the LSTM. Finally, in Equation (6), the pooling aggregator independently feeds each neighbor’s vector through a fully connected neural network. aggregates the hidden states of the surrounding neighboring nodes, and the neighboring node of node , the hidden state in the layer of node , is synthesized to generate the hidden state in the kth layer of node . Finally, Equation (7) explains the hidden state of node v in the layer in , and the concatenated values of the hidden state in the layer of neighboring nodes are multiplied. Consequently, the value is updated by applying the sigmoid . By effectively synthesizing information from surrounding neighbors and updating the hidden state of all nodes by repeating this process across multiple layers, GraphSAGE can effectively learn the embedding of nodes within the graph [32].
3. Proposed Architecture
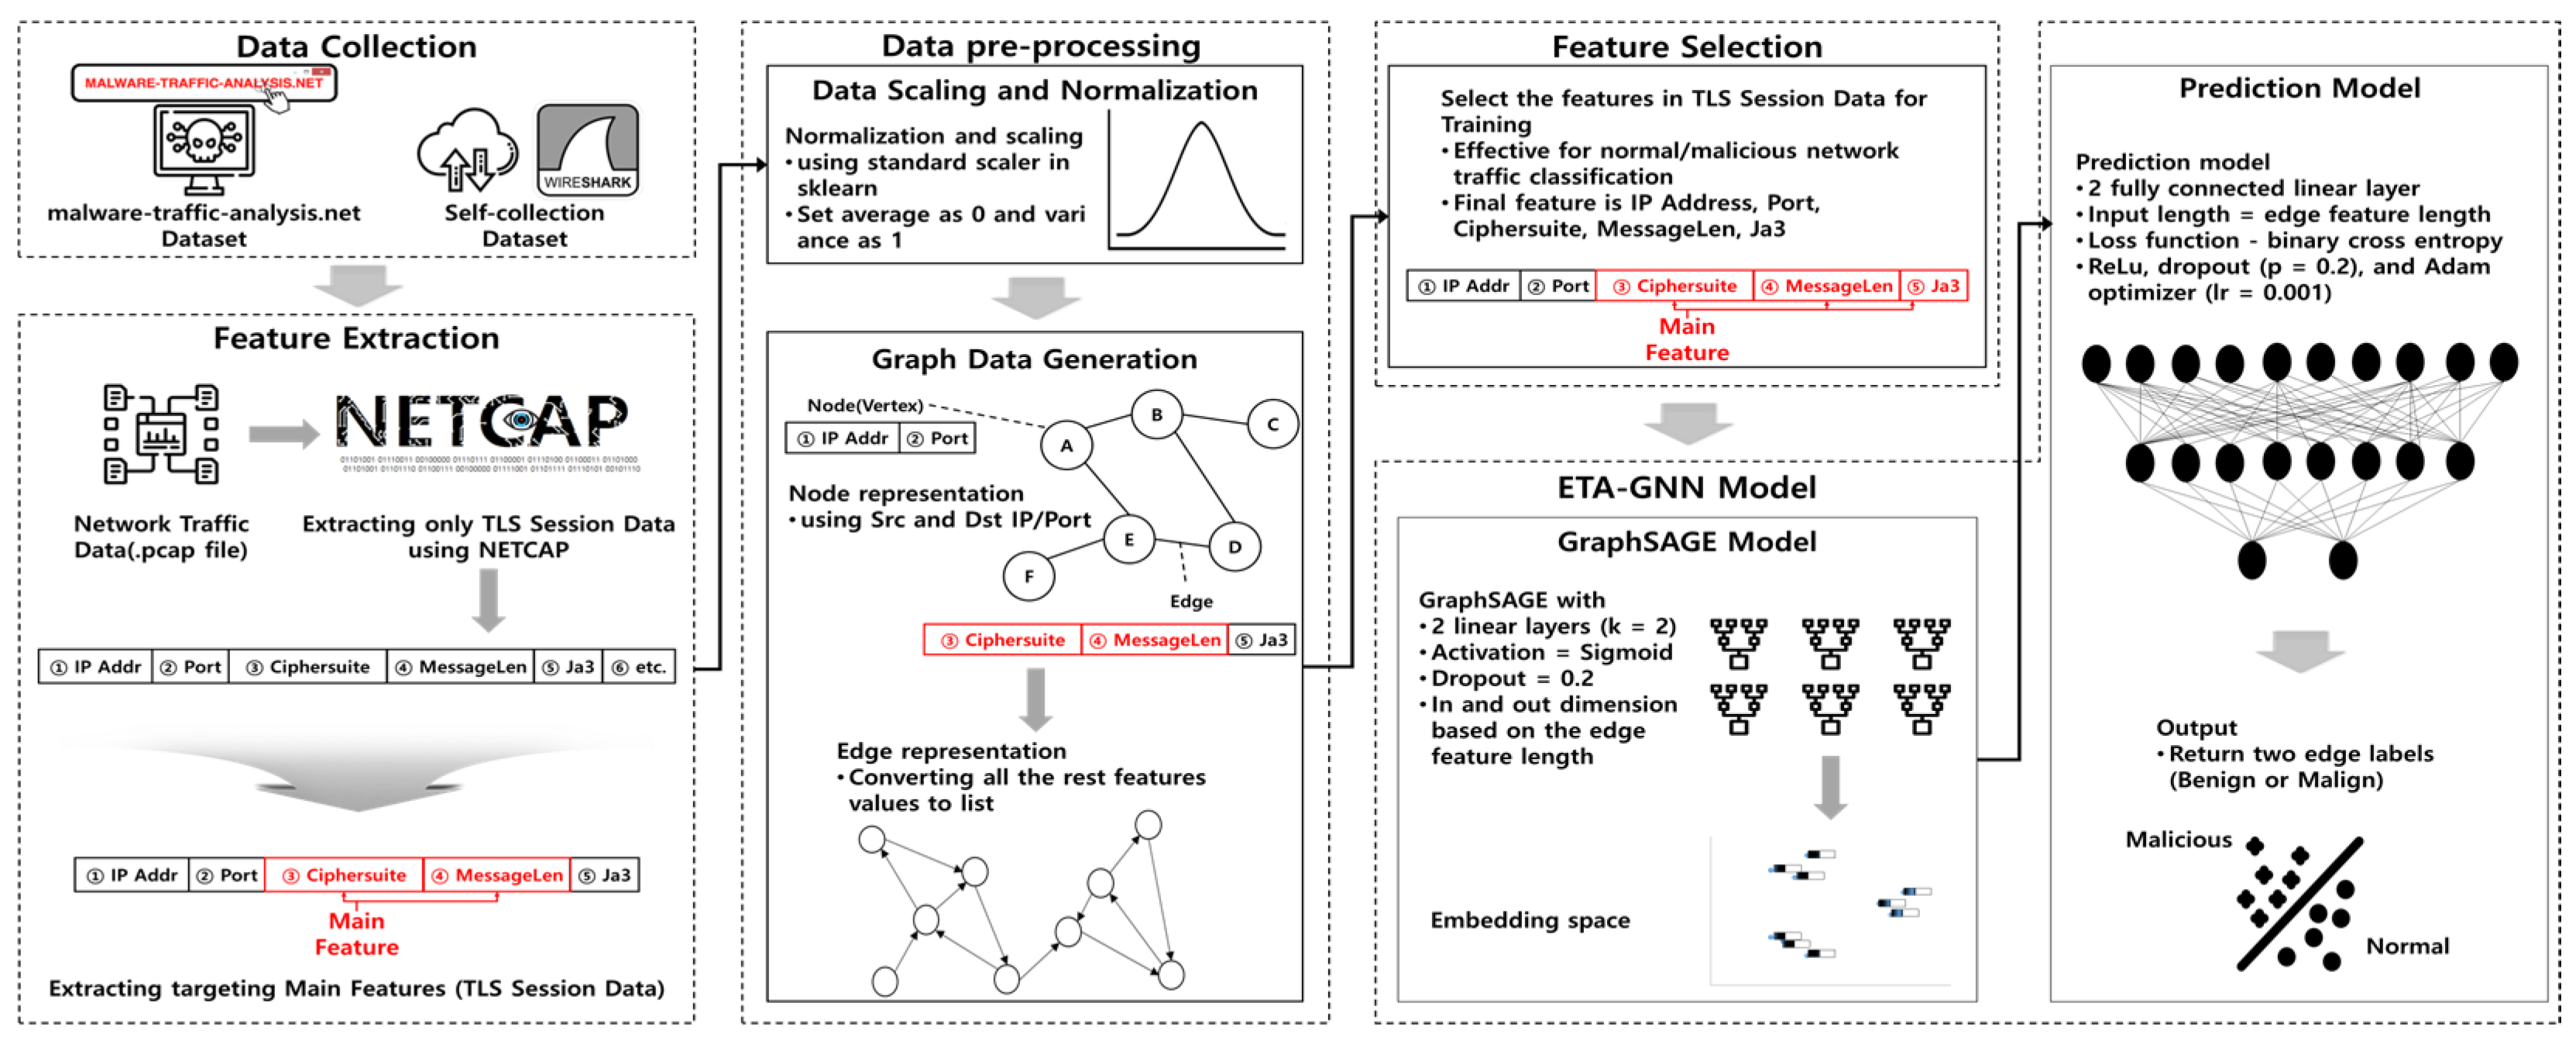
Table 1 indicates that ML, DL, and GNN-based ETA often use packet payloads or flow characteristics. Further, when using GNN, they can represent and analyze the interrelationships between network traffic types, demonstrating excellent performance. Studies on the utilization of GNNs for the classification of encrypted network traffic are underway [6,7,8,9,10,11,12,13,14,15,16,17,18,19,20,21,22,23]. Moreover, continuous research is expected to be conducted using feature selection and detailed model settings owing to automated learning and high performance. Therefore, this study proposed an ETA leveraging GNN and optimized feature dimensionality reduction that can classify normal or malicious network traffic using fewer features than existing methods. Figure 1. shows the architecture proposed in this study.
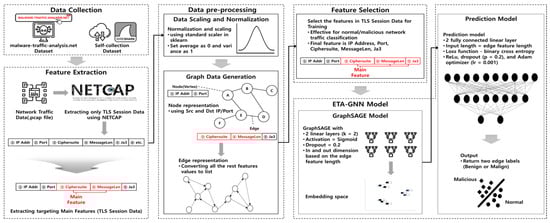
Figure 1.
Proposed architecture leveraging GNN and optimized feature dimensionality reduction.
3.1. Expression Notations
Table 2 presents the expressions used in this study and describes the specific symbols used in the composition of the proposed architecture.
Table 2.
Description of expressions.
3.2. Data Collection
Encrypted network traffic data were collected from both normal and malicious sources to extract features for distinguishing activities and training. Normal encrypted network traffic was collected using the Wireshark tool [40] on Windows 10 Pro for Workstation (version 22H2, OS Build 19045.3208). The data were collected by visiting normal HTTPS sites using Wireshark’s Capture feature in a secure environment where Windows-provided Firewall and Defender were operating; thus, the collection of reliable normal network traffic was ensured. The malicious network traffic dataset was collected through websites providing datasets such as Malware-Analysis-Traffic [41]. Encrypted normal and malicious network traffic data were collected as network traffic with the same features and similar characteristics, and normal and malicious network traffic data were merged, shuffled, and used for training to classify the network traffic fairly well and prevent overfitting to specific features. The overall dataset comprises 1,275,521 packets, of which 822,367 packets identified as normal and 453,154 packets identified as malicious. For training the proposed architecture, only the TLSClientHello data within the TLS session data were used to classify normal/malicious network traffic. For this architecture-based classification, the data were separated into training and validation datasets, and the ratio of training to validation data was set to the commonly used ratio in artificial intelligence training, that is, 7:3. Table 3 presents detailed information on the dataset, including the number of packets within the normal or malicious encrypted network traffic and the TLS session data.
Table 3.
Dataset used in this study.
3.3. Feature Extraction
The ETA-GNN architecture uses metadata for the classification of encrypted network traffic. Therefore, metadata must be extracted from the network traffic within the collected dataset. Here, we extracted metadata that could be used to classify encrypted malicious network traffic using network traffic analysis tools.
NETCAP-Based TLS Metadata Extraction
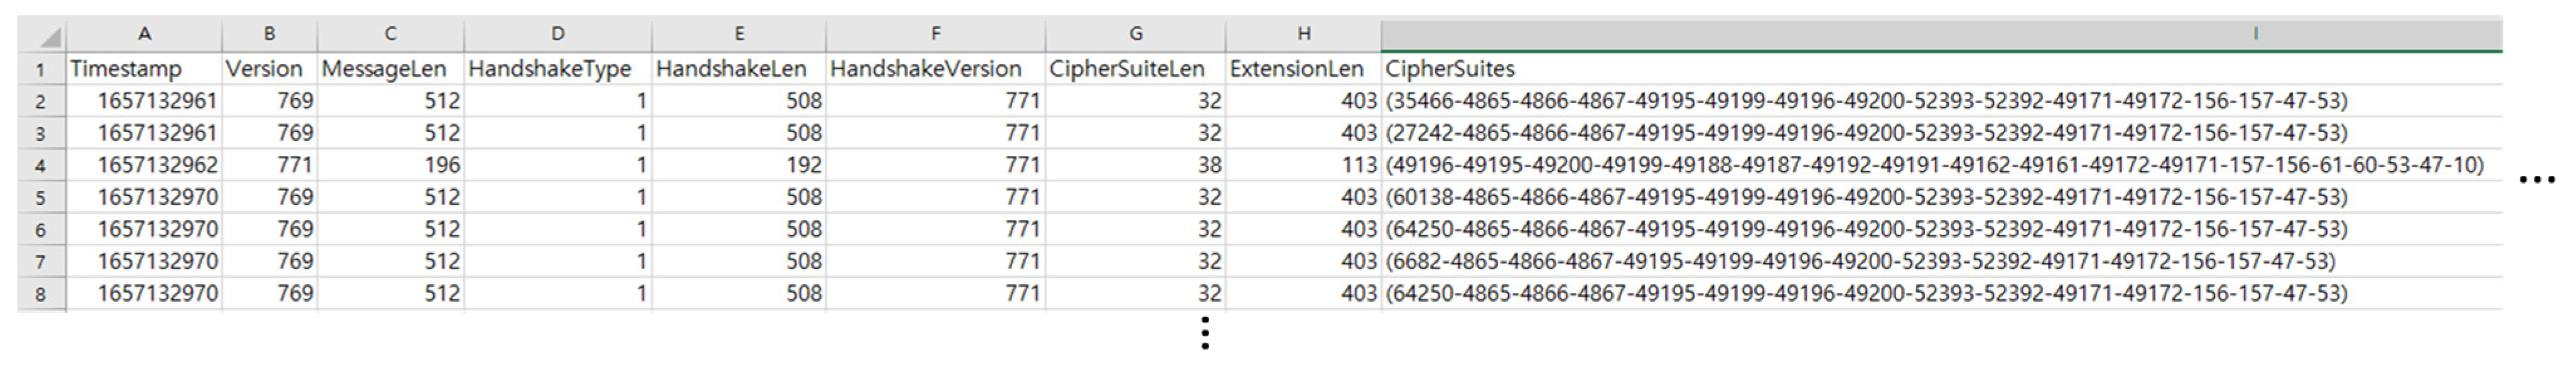
To extract metadata, NETCAP [42], which can convert network packet streams into specific protocols or abstraction records as desired by the user, was used. NETCAP is a useful tool for network traffic analysis because it can read .pcap files and extract only the desired columns. The process of extracting TLS metadata through NETCAP was as follows. Figure 2 illustrates a part of the TLSClientHello Metadata.csv file generated through NETCAP.
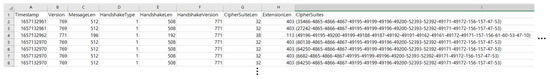
Figure 2.
TLSClientHello_Metadata.csv was generated via NETCAP.
- Step 1. Setting up the Docker environment.
NETCAP supports macOS, Linux, Windows, and Kali Linux environments. For this process, Docker must be installed on a Kali Linux system. Once Docker is set up, the .pcap files, which are externally stored, should be moved into the Docker container to render them accessible for processing with NETCAP.
- Step 2. Identifying extractable fields.
After initializing NETCAP, the .pcap file is imported and stored. Prior to the extraction of specific data, all the available fields that NETCAP can extract from the TLSServerHello/TLSClientHello metadata, such as Timestamp, Version, and CipherSuite, must be reviewed.
- Step 3. Data extraction from metadata
From the TLSServerHello/TLSClientHello metadata, the necessary fields are selected to serve as features for the analysis. For TLSServerHello, the fields Timestamp, Version, CipherSuite, Extensions, SrcIP, DstIP, SrcPort, and DstPort are extracted. For TLSClientHello, Timestamp, Version, MessageLen, HandshakeType, HandshakeLen, HandshakeVersion, CipherSuiteLen, ExtensionLen, CipherSuites, SrcIP, DstIP, SrcPort, and DstPort are extracted.
- Step 4. Storing extracted data
Following the extraction Steps 1–3, the selected metadata fields should be compiled and saved in a .csv format. This .csv file, which contains the TLSClientHello feature data, will be utilized for training the ETA-GNN model.
3.4. Data Preprocessing
The data preprocessing steps involved data scaling, graphing network traffic data (nodes: Src and Dst IP/Port; edges: CipherSuite, MessageLen, JA3), and other steps to prepare the data for learning based on the proposed architecture.
3.4.1. Data Scaling and Normalization
Data preprocessing, which involves scaling and normalization, is required before commencing efficient learning. Standardization of the features is crucial in scenarios wherein the features have different scales. This is because this approach helps prevent certain features from disproportionately influencing the learning algorithm because of their larger magnitudes, ultimately contributing to improved convergence and performance. We utilized StandardScaler from the scikit-learn preprocessing library, a prominent Python machine learning toolkit. StandardScaler operates by centering the data, subtracting the mean from each feature, and then scaling it by dividing each feature by its standard deviation. Mathematically, for a feature x, the transformation is expressed as Equation (8).
where z is the standardized version of x. This process ensures that each feature has a mean of 0 and a standard deviation of 1, placing them on a consistent scale.
Owing to the minimum and maximum values of the data being unknown, the proposed architecture used StandardScaler to adjust the data scale by setting the mean to 0 and variance to 1 [43]. Furthermore, this process could occur either before or after splitting the dataset into training and testing sets. In this architecture, scaling was performed before dividing the dataset, whereas normalization was subsequently performed.
3.4.2. Graph Data Generation
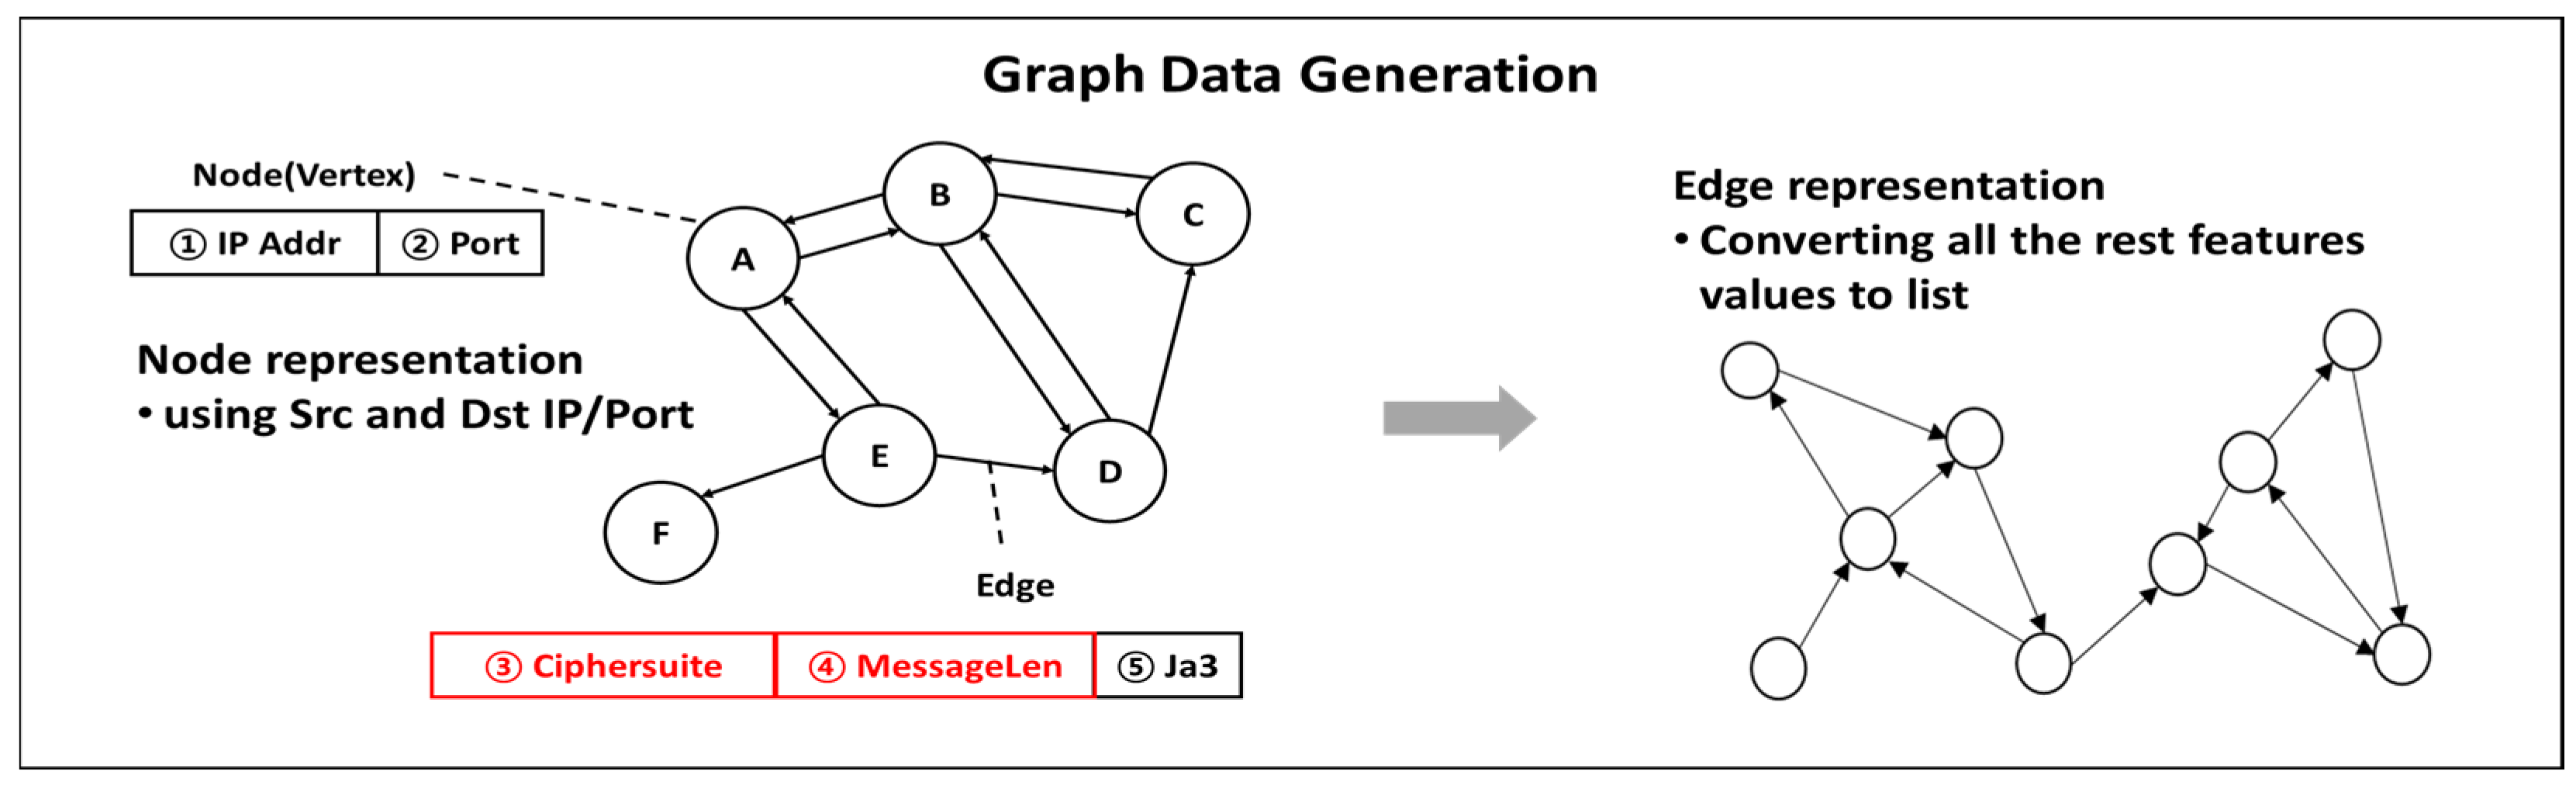
A GNN performs graph-based learning, wherein the data are transformed into a graph format comprising nodes and edges. The architecture requires the simultaneous presence of multiple nodes and edges, and as encrypted network traffic data are organized into graphs, they are composed of a directed graph to represent the source and destination. Therefore, MultiGraph is used with nodes using the two features IP address and port, and edges using the three features CipherSuite, MessageLen, and JA3, as shown in Figure 3.
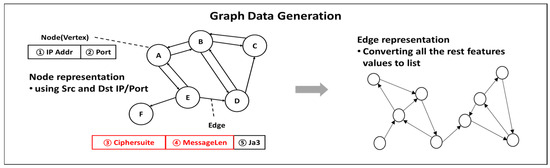
Figure 3.
TLS session data graph structure.
3.5. Feature Selection
3.5.1. CipherSuite
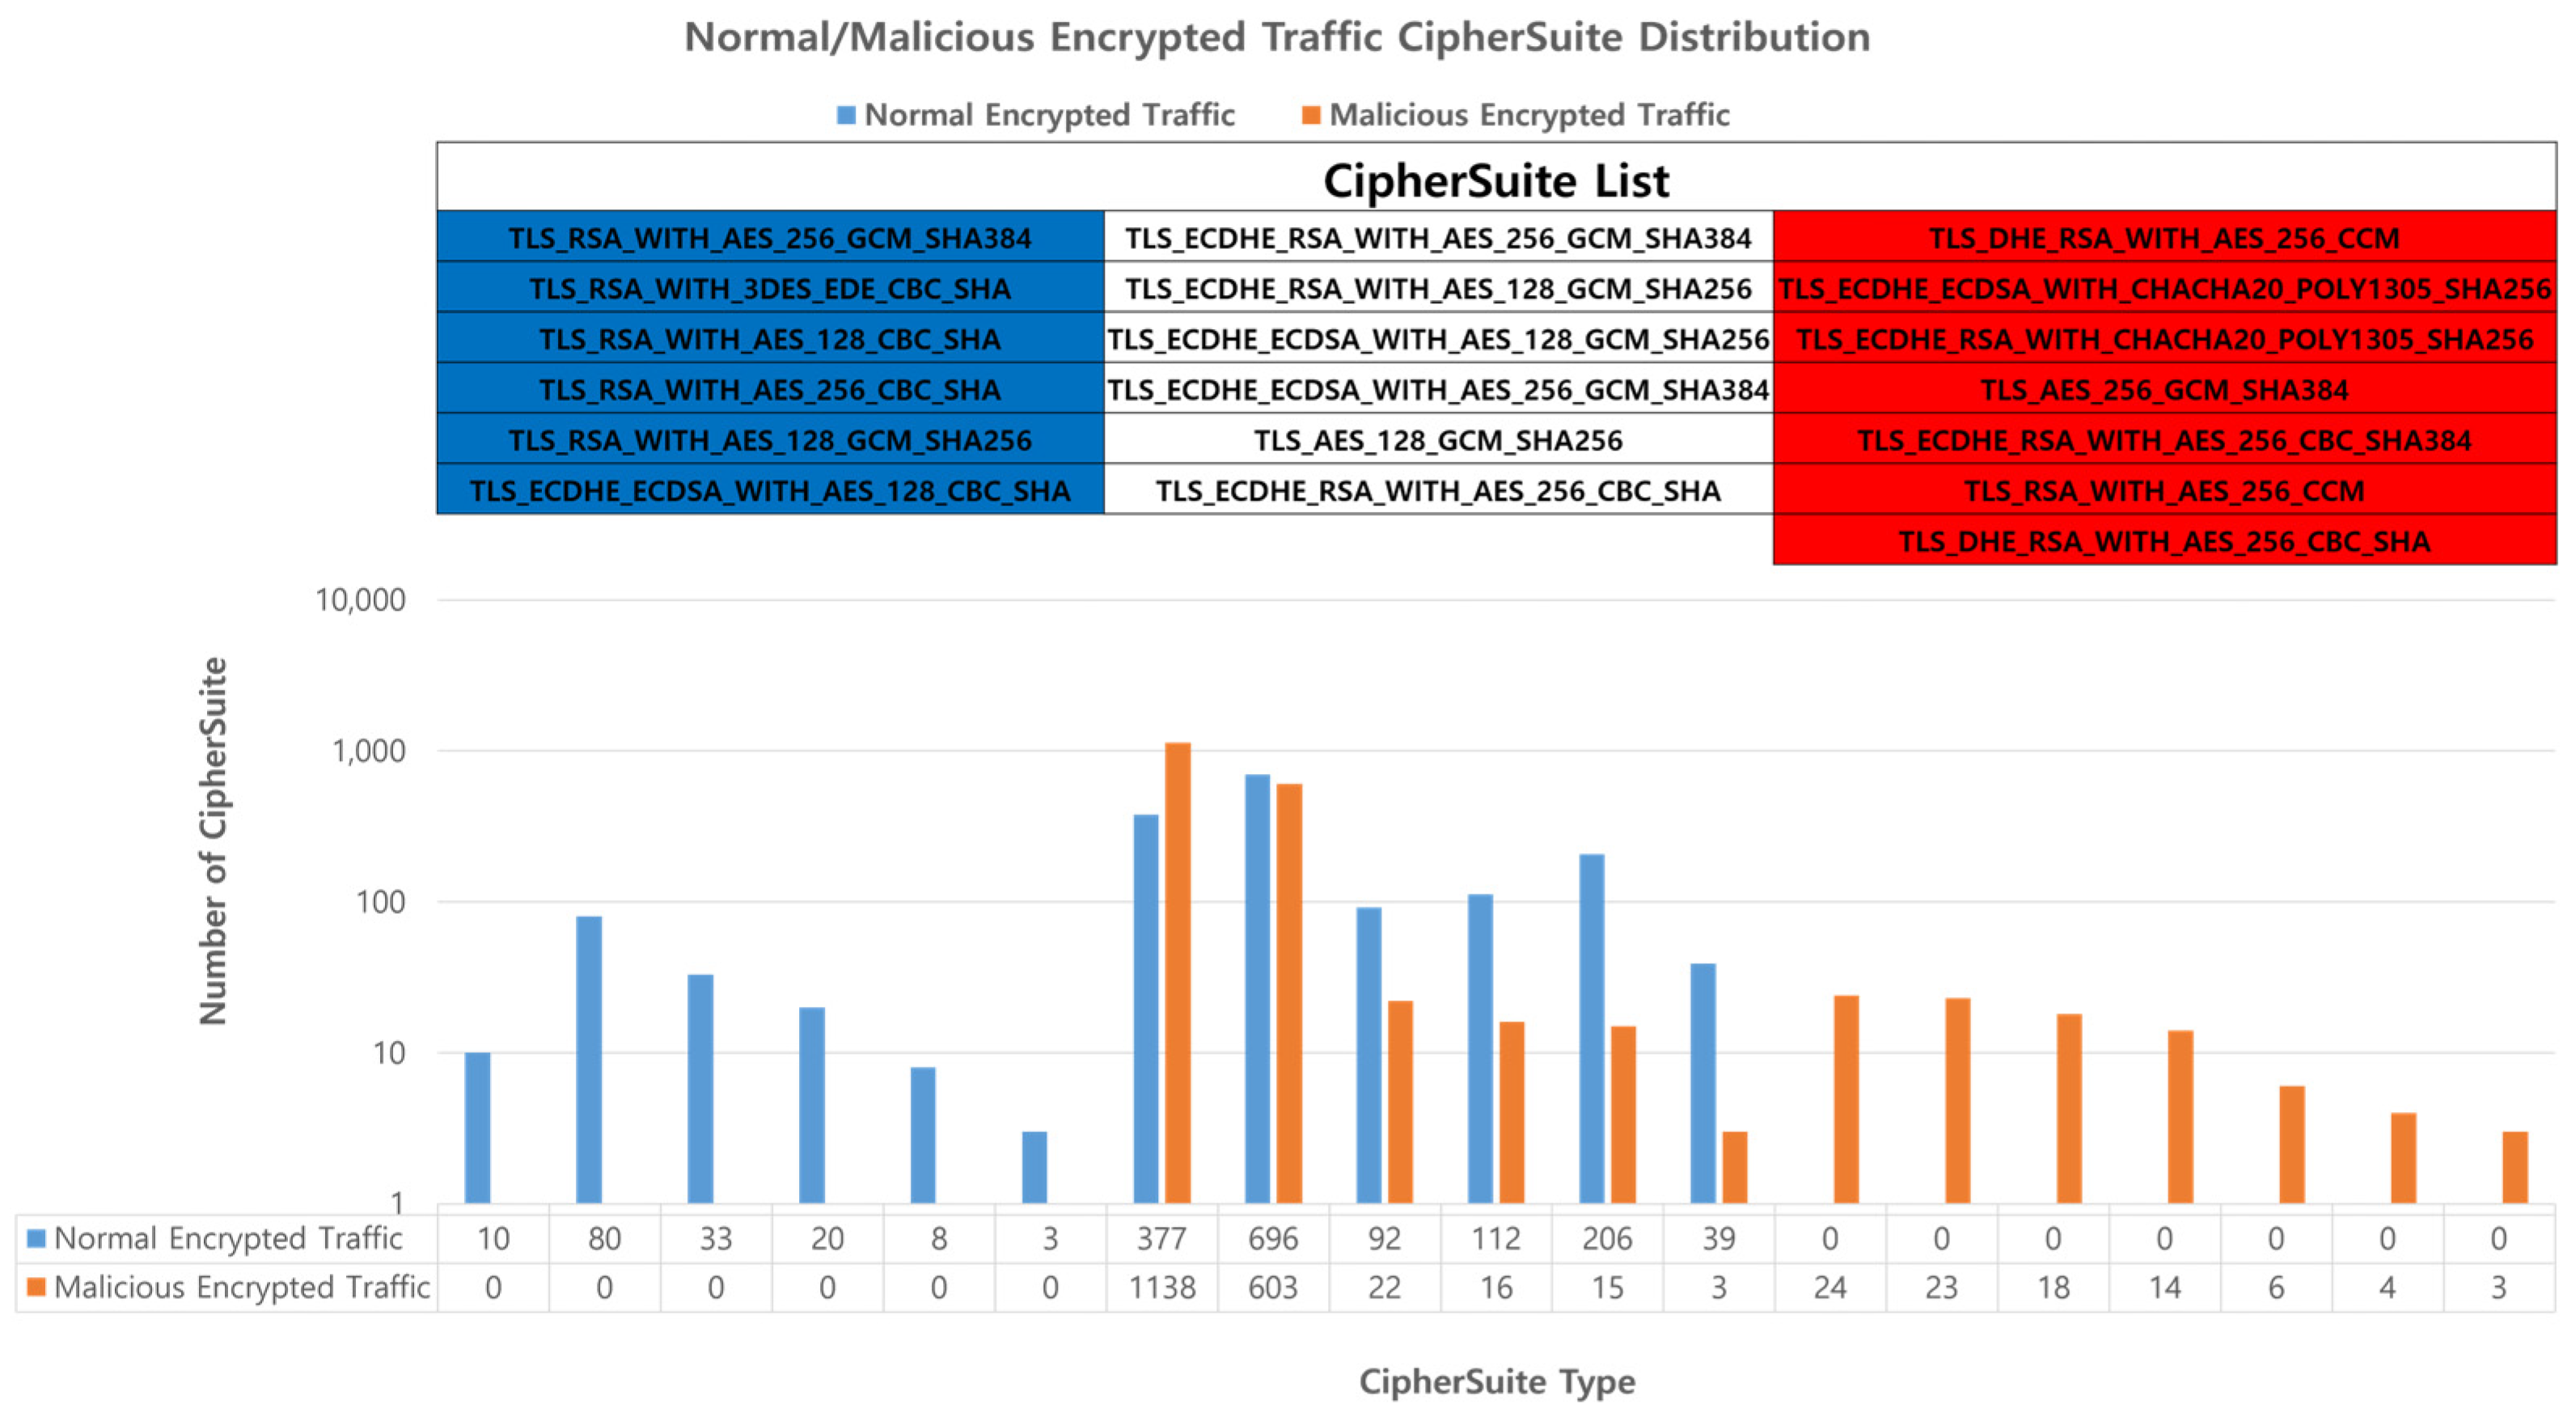
CipherSuite defines the set of encryption codes used in the ClientHello and ServerHello messages. The encryption sets vary depending on the TLS version, and they define the supported encryption standards based on the TLS protocol being used. CipherSuite is used when performing server authentication or, optionally, client authentication using the Diffie–Hellman (DH) algorithm. DH represents an encryption set containing DH parameters signed by a certification authority in the certificate of the server. The DH ephemeral (DHE) refers to temporary DH, wherein the temporary parameters are defined by the certification authority and the signature algorithm used by the server is specified after the DHE component in the CipherSuite name. The server can request a signable certificate from the client for authentication or a DH certificate, and any DH certificate provided by the client should use the parameters (group and generator) specified by the server [44]. We confirmed that there are specific CipherSuites used only by normal or malicious encrypted traffic among the various CipherSuites used in TLS sessions, as shown in Figure 4. This process facilitated the identification of the server that chooses which CipherSuite to use and the client that offers a list of available CipherSuites. This indicates that there are specific CipherSuites used only by either normal or malicious entities.
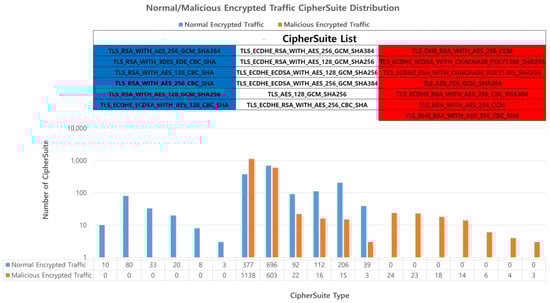
Figure 4.
Distribution of Ciphersuites used in encrypted network traffic, indicating exclusive use by either normal (blue) or malicious (red) traffic.
Consequently, this feature was selected as the primary feature for classifying normal and malicious encrypted traffic.
3.5.2. MessageLen
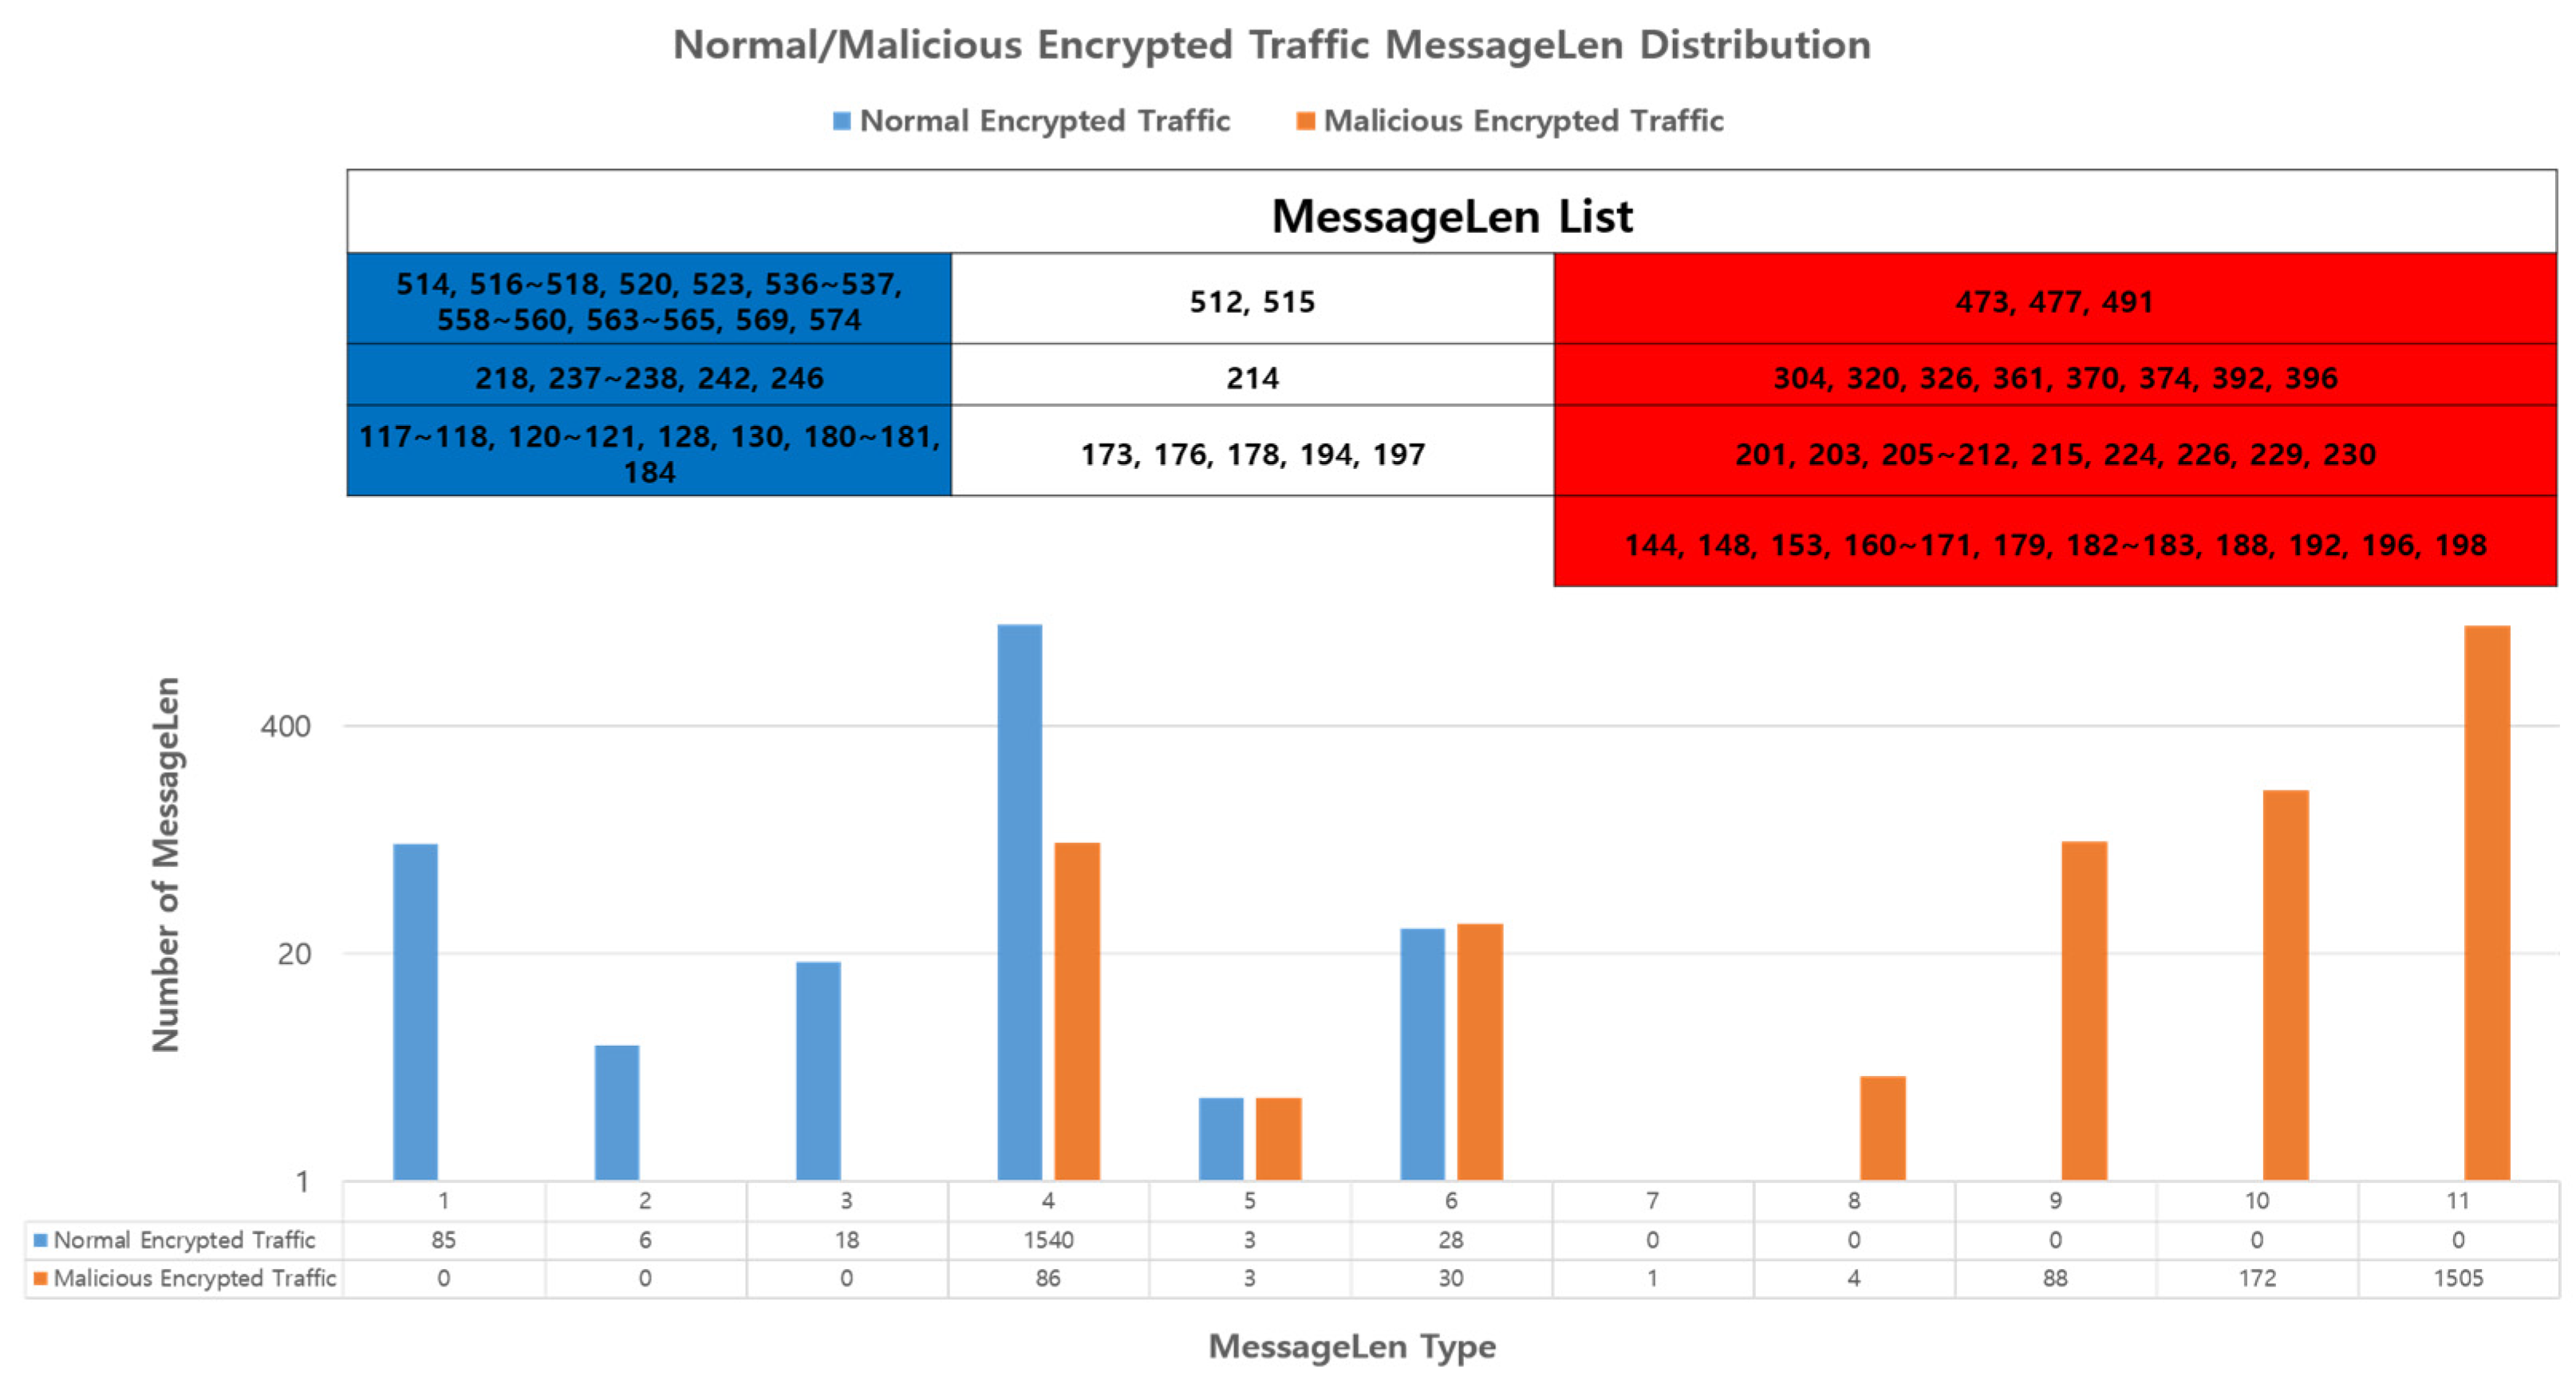
MessageLen defines the length of the messages sent and received by the client. Encrypted malicious network traffic messages are often characterized by varying lengths, as attackers may inject malicious behavior into normal messages or send only specific malicious traffic. However, we observed the use of a specific MessageLen by the encrypted malicious network traffic being sent, as shown in Figure 5. Therefore, we chose the length of the message as our primary feature.
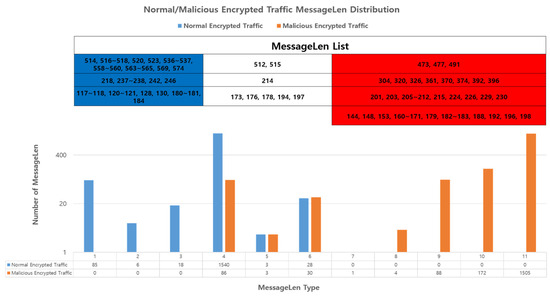
Figure 5.
Distribution of MessageLen used in encrypted network traffic, indicating exclusive use by either normal (blue) or malicious (red) traffic.
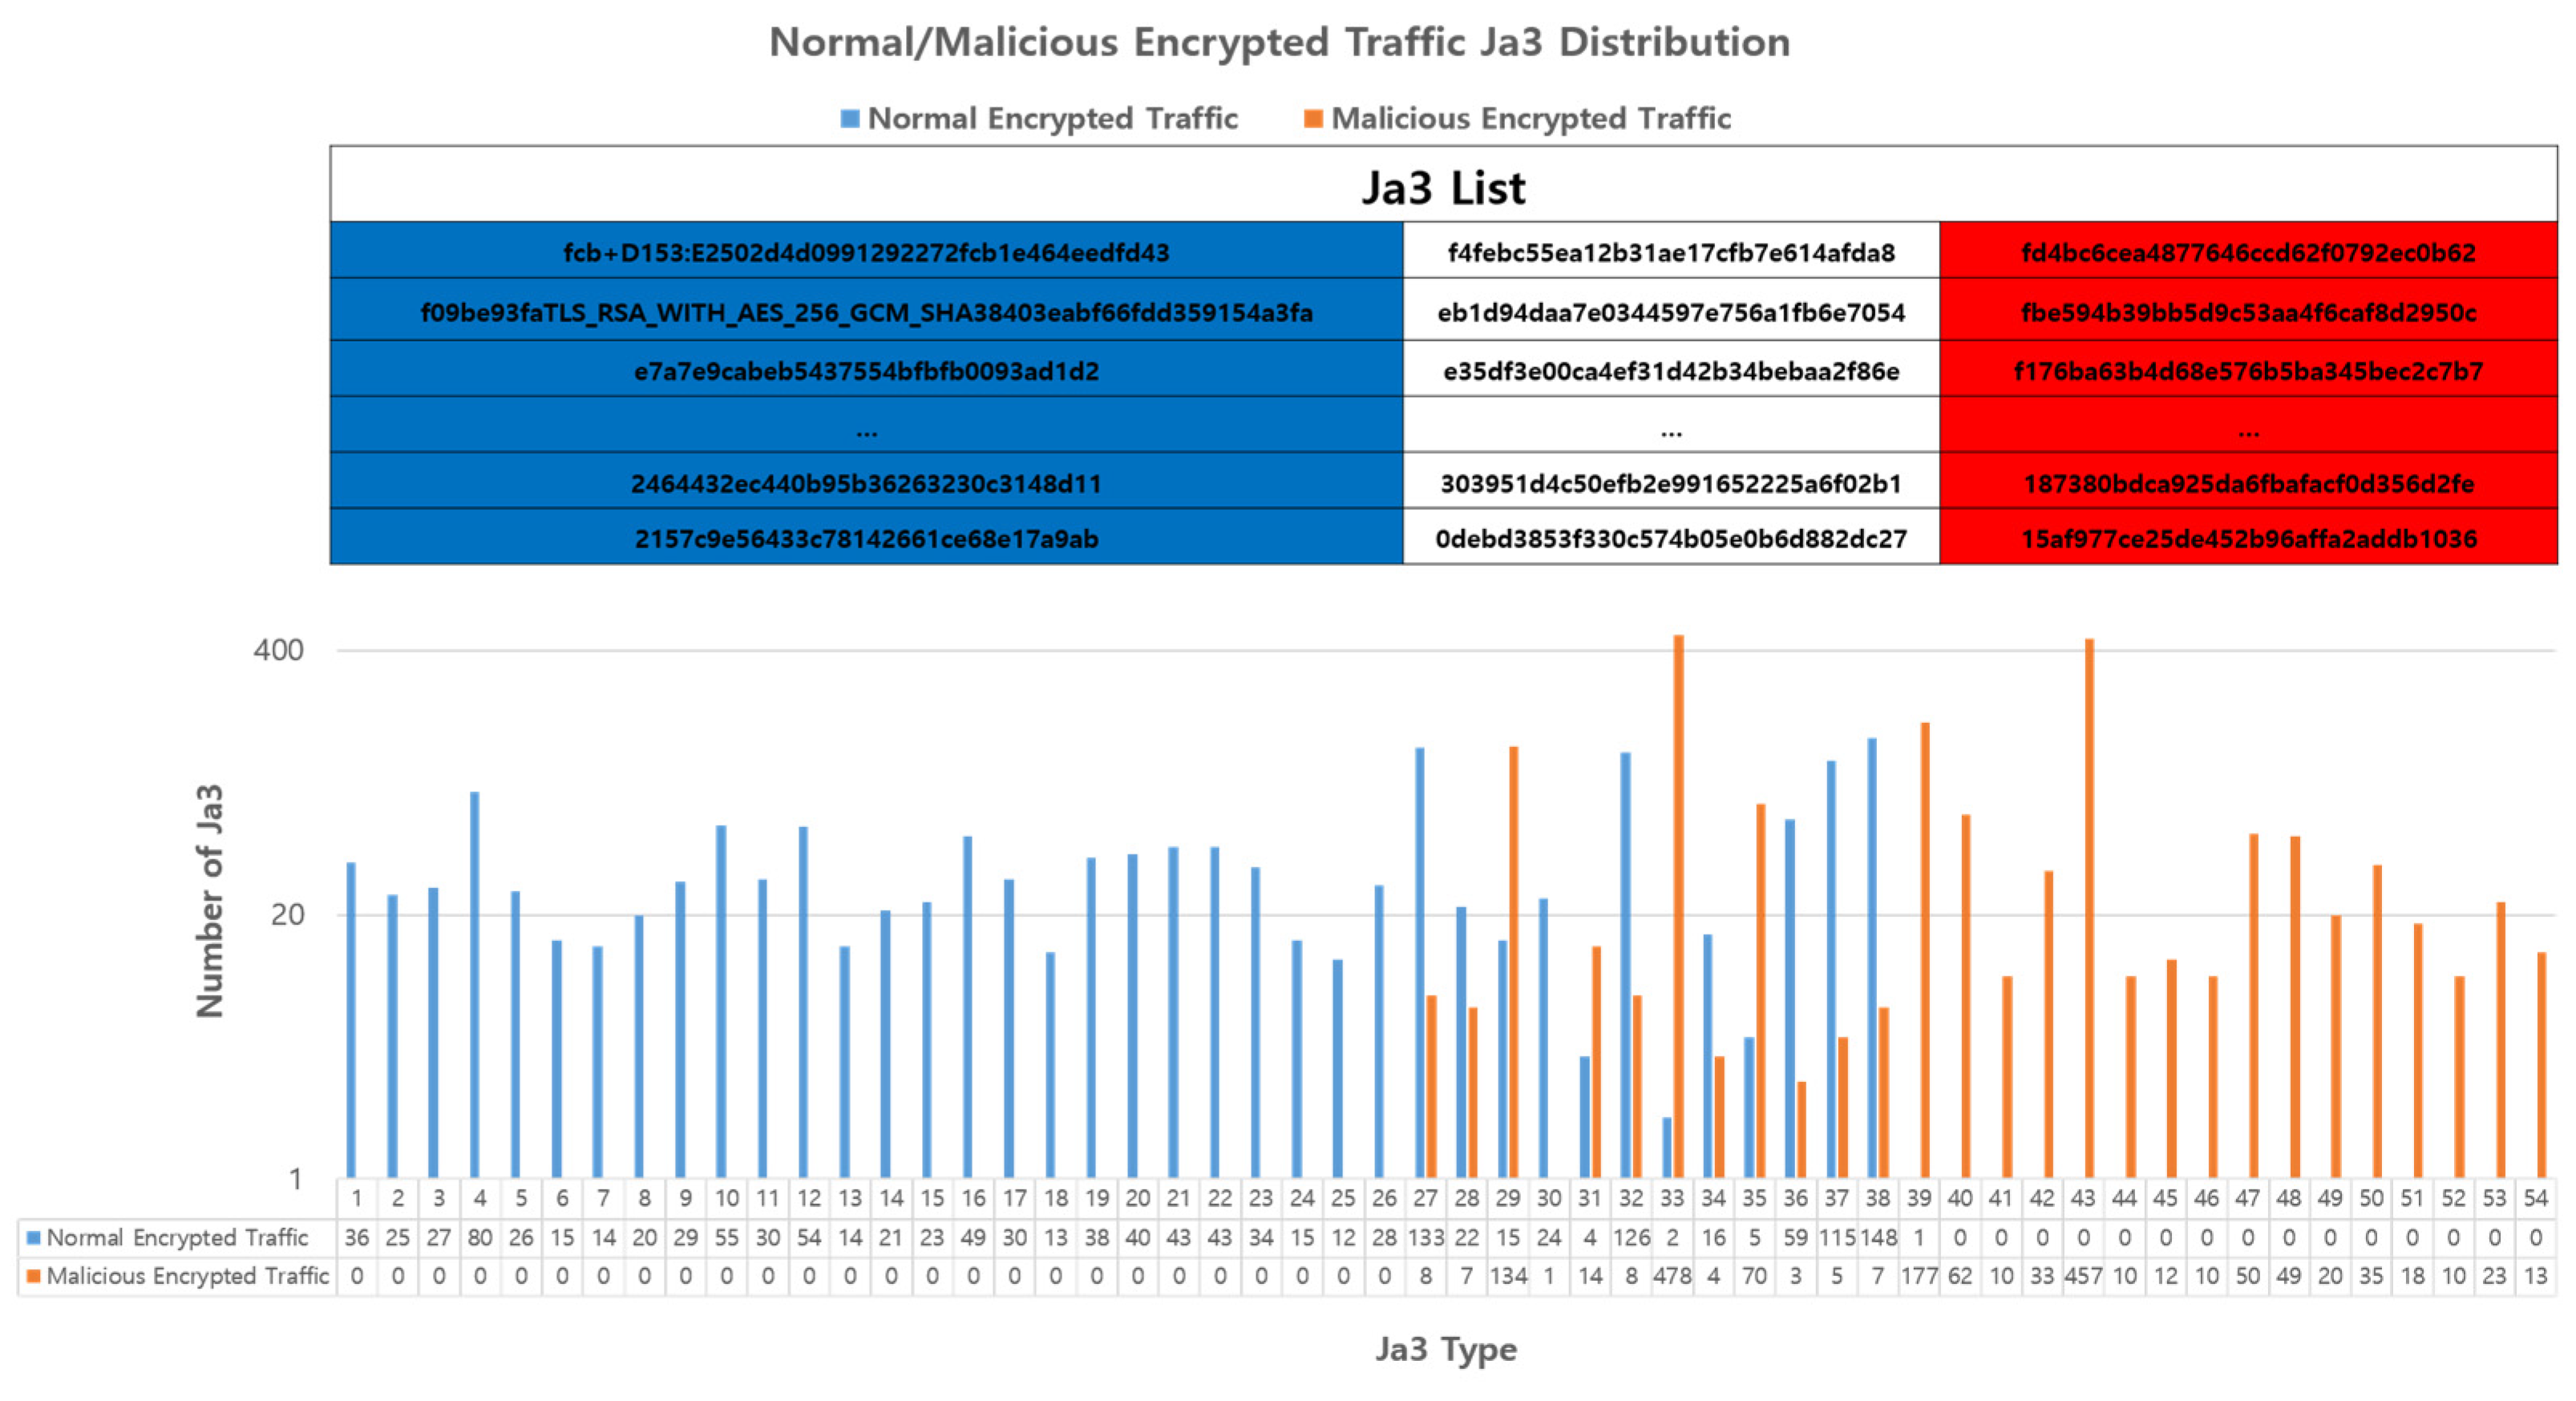
3.5.3. JA3
JA3 is a TLS client fingerprinting method that captures specific TLS client behaviors and comprises elements such as the SSL/TLS version, CipherSuite, and extension. JA3 primarily identifies specific TLS clients and plays a role in detecting potential malicious activities based on known JA3 signatures [44]. In addition, we observed that there were types of JA3 that used only encrypted normal network traffic and JA3 that used only encrypted malicious network traffic, as shown in Figure 6. Based on these findings, JA3 was selected as the main feature.

Figure 6.
Distribution of JA3 used in encrypted network traffic, indicating exclusive use by either normal (blue) or malicious (red) traffic.
3.6. ETA-GNN Model
The ETA-GNN model classified malicious traffic based on TLS session data composed of a directed graph within encrypted network traffic, using GNN and multilayer perceptron. We employed the GraphSAGE [32] framework for inductive representation learning and trained the model from scratch using the provided dataset. The GraphSAGE model offers the advantage of creating and applying new subgraphs for smooth graph data aggregation, targeting the nodes where the learning and validation processes are being performed. To classify malicious network traffic using GraphSAGE, the ETA-GNN model used TLS session data extracted from previously collected network traffic; among these data, only the TLSClientHello data, which are easily detectable for malicious activities, were used.
3.6.1. GraphSAGE Model
This section describes the GraphSAGE model used in the ETA-GNN. GraphSAGE incorporates inductive representation learning capabilities and deploys a nodewise sampling technique, effectively mitigating the complexities associated with large-scale graphs. Notably, GraphSAGE introduces mini-batch training and a fixed-size neighbor sampling algorithm to accelerate the training process. The mini-batch training strategy, a key feature of GraphSAGE, reduces the computational costs during the training phase. By considering only the nodes used in computing representations within each training iteration, we significantly diminished the number of sampled nodes, thereby enhancing the efficiency. Furthermore, GraphSAGE employs a fixed-size set of neighboring nodes for each layer during computation, deviating from the conventional approach of using entire neighborhood sets. This strategic sampling technique is instrumental in further improving training efficiency and mitigating issues related to neighborhood expansion. We expect that these enhancements, stemming from GraphSAGE’s design, would effectively bolster the robustness, scalability, and efficiency of our model, particularly in the context of large-scale network traffic analysis.
GraphSAGE performs message passing, a task that updates the state of a node using the information of neighboring nodes (feature values of nodes and edges) in the graph as shown in the Algorithm 1, line number 17. To do this, the model accepts network traffic data graphed from TLS session data as input. Here, comprises vertices (nodes) composed of the IP address and port values in the TLS session data. Further, represents edges, comprising CipherSuite, MessageLen, JA3, and label values indicating normal or malicious. The node ( and edge features that represent this process are used for learning, along with the number of epochs for model training and the loss function (), which is a cross-entropy loss function. For GraphSAGE, two main components are needed: message aggregation and concatenation, as described in Algorithm 1, line number 17 and 18. The message aggregation function combines the information for a specific node from the neighboring nodes and transforms it into a single message, denoted as . The function is defined as Equation (9). The message concatenation function combines the aggregated information of neighbors and a specific node into a single message, denoted as . It is defined as Equation (10). The message passing depth was set to K, and the parameter representing the message connection used weight matrices . Through this message passing process, the connectivity between neighboring nodes of the input was considered, and the contextualized result value, the edge embedding , was obtained for learning.
GraphSAGE derives results based on the weights of the graph data input into the embedding space using an efficient sigmoid activation function, and the dropout was set to the optimal value of 0.2. The GraphSAGE model dynamically set the input and output dimension lengths of the TLSClientHello data feature values, which comprised edges within the graph data. These hyperparameters were selected by employing a grid search algorithm to identify the optimal hyperparameter settings. The hyperparameters were selected within a predefined range of options. To enhance efficiency and avoid unnecessary attempts, we strategically selected the hyperparameters and their corresponding best-performing ranges based on practices established in prior studies [45,46,47]. Accordingly, the message aggregator type, learning rate, batch size, embedding depth, and hidden-layer size were optimized. For the message passing layers (K = 2), Algorithm 1 line number 15, we implemented varying neighborhood sampling depths for the first and second aggregation layers based on the graph’s degree distribution.
| Algorithm 1: GraphSAGE embedding |
| 1. Input: 2. Graph: G 3. Node feature (), number of epochs (), 4. loss function () (cross-entropy loss) 5. Edge features: 6. Message passing depth: 7. Aggregator: 8. Parameters: 9. Weight matrices: 10. Output: 11. Edge embeddings 12. for iteration 1 to do: 13. for all do: 14. = , 15. for k ← 1 to do: 16. for : 17. ← //Message Aggregation 18. ← //Message Concatenation 19. ← //Add Nonlinearity(Sigmoid Function) 20. ← cross-entropy loss 21. |
Considering our graph’s density of approximately 2.003, which indicates a relatively dense graph, we extended the maximum depth range following established practices from prior studies. The performance evaluation involved the testing of various combinations within the specified ranges for each hyperparameter, as presented in Table 4. The best-performing hyperparameter is highlighted in bold.
Table 4.
Hyperparameter settings.
Based on the configured GraphSAGE, the accuracy of the labeled normal or malicious traffic classification was computed using the edge values of the input graph data (CipherSuite, MessageLen, and JA3 features). Furthermore, GraphSAGE was used to analyze the correlation between the network traffic that was graphed. Consequently, two fully connected graphs were derived and the network traffic was classified using the prediction model.
3.6.2. Prediction Model
In this section, we describe the prediction model used in the ETA-GNN model. The prediction model, a neural network model for binary classification, is a fully connected neural network model comprising two linear layers. This model was used to classify normal/malicious network traffic. To do this, the embedding result {} derived through GraphSAGE was accepted as the input. Similar to GraphSAGE, the model used the number of epochs for model learning and the loss function (), which was a binary cross-entropy loss function, as shown in Algorithm 2, line number 2 to 4. Furthermore, the learning parameters were set and distinguished in the form of a weight and bias matrix {, }, as shown in Algorithm 2, line number 6. Based on the learning obtained from the prediction model, the classification result () was the outcome of applying SoftMax to the final layer output, and it represents the predicted probability for normal/malignant classification, as shown in Algorithm 2, line number 14.
| Algorithm 2: Prediction model |
| 1. Input: 2. input feature {} 3. number of epochs () 4. loss function () 5. Parameters: 6. weight and bias matrix{, } 7. Output: 8. Classification result () 9. for iteration 1 to do: 10. 11. 12. ← binary cross-entropy loss 13. backpropagate the gradient and update trainable parameters 14. |
The input length of the prediction model was set to the length of the edge feature. It used the ReLU activation function, which enabled simple computations and easy layer configuration, thereby exploiting the fully connected graph derived through GraphSAGE. The dropout value was set to the optimal value of 0.2. Moreover, a loss function was used to determine whether there was a learning loss in classifying normal/malicious network traffic based on the feature values within the input TLS session. Furthermore, considering the characteristics of network traffic data with multiple feature values, the Adam optimizer was used to optimize the learning rate. Based on the above-described GraphSAGE and prediction models, training was conducted using the constructed ETA-GNN model.
4. Implementation
4.1. Experimental Settings
The experiment to classify normal/malicious network traffic based on the ETA-GNN model was conducted in the constructed environment, as summarized in Table 5. This model used PyTorch and Jupyter Notebook to employ Python-based GraphSAGE and prediction model libraries along with the other Python libraries required to use the collected network traffic data. Furthermore, we utilized the NetworkX Python package for graph construction and the DGL library to leverage GPU acceleration.
Table 5.
Development environment.
4.2. Performance Metrics
In this section, we explain the matrices used to validate the performance of the proposed architecture. The superior performance of the ETA-GNN architecture was demonstrated through its classification accuracy, precision, recall, and F1 score. To evaluate the ETA-GNN architecture, we used the values of true positives (TPs), true negatives (TNs), false positives (FPs), and false negatives (FNs) for malicious network traffic classified as malicious, normal network traffic classified as normal, malicious network traffic classified as normal, and normal network traffic classified as malicious, respectively. The indicators TP, TN, FP, and FN were used in the evaluation to demonstrate the superior performance of the ETA-GNN architecture.
The proportion of normal network traffic wherein the architecture was predicted to be normal can be evaluated as the recall value, and is obtained as follows:
The actual normal traffic among the traffic types classified as normal network traffic by the architecture can be evaluated as the precision value, and is obtained as follows:
The performance of the architecture can be evaluated by verifying the actual values that classify normal network traffic as normal and malicious network traffic as malicious. This refers to the accuracy indicator that can be used for architectural evaluation, as follows:
This value provides the intuitive classification accuracy of the architecture. However, if the data label of the architecture is imbalanced, there are limitations in the accurate evaluation of its performance. Therefore, the F1-score was used to accurately evaluate the performance of the architecture. The F1-score, that is, the harmonic mean of precision and recall, is an indicator that can accurately evaluate the performance of the architecture when the data label has an imbalanced structure. The F1-score was used to accurately validate the performance of the architecture as follows:
4.3. Results
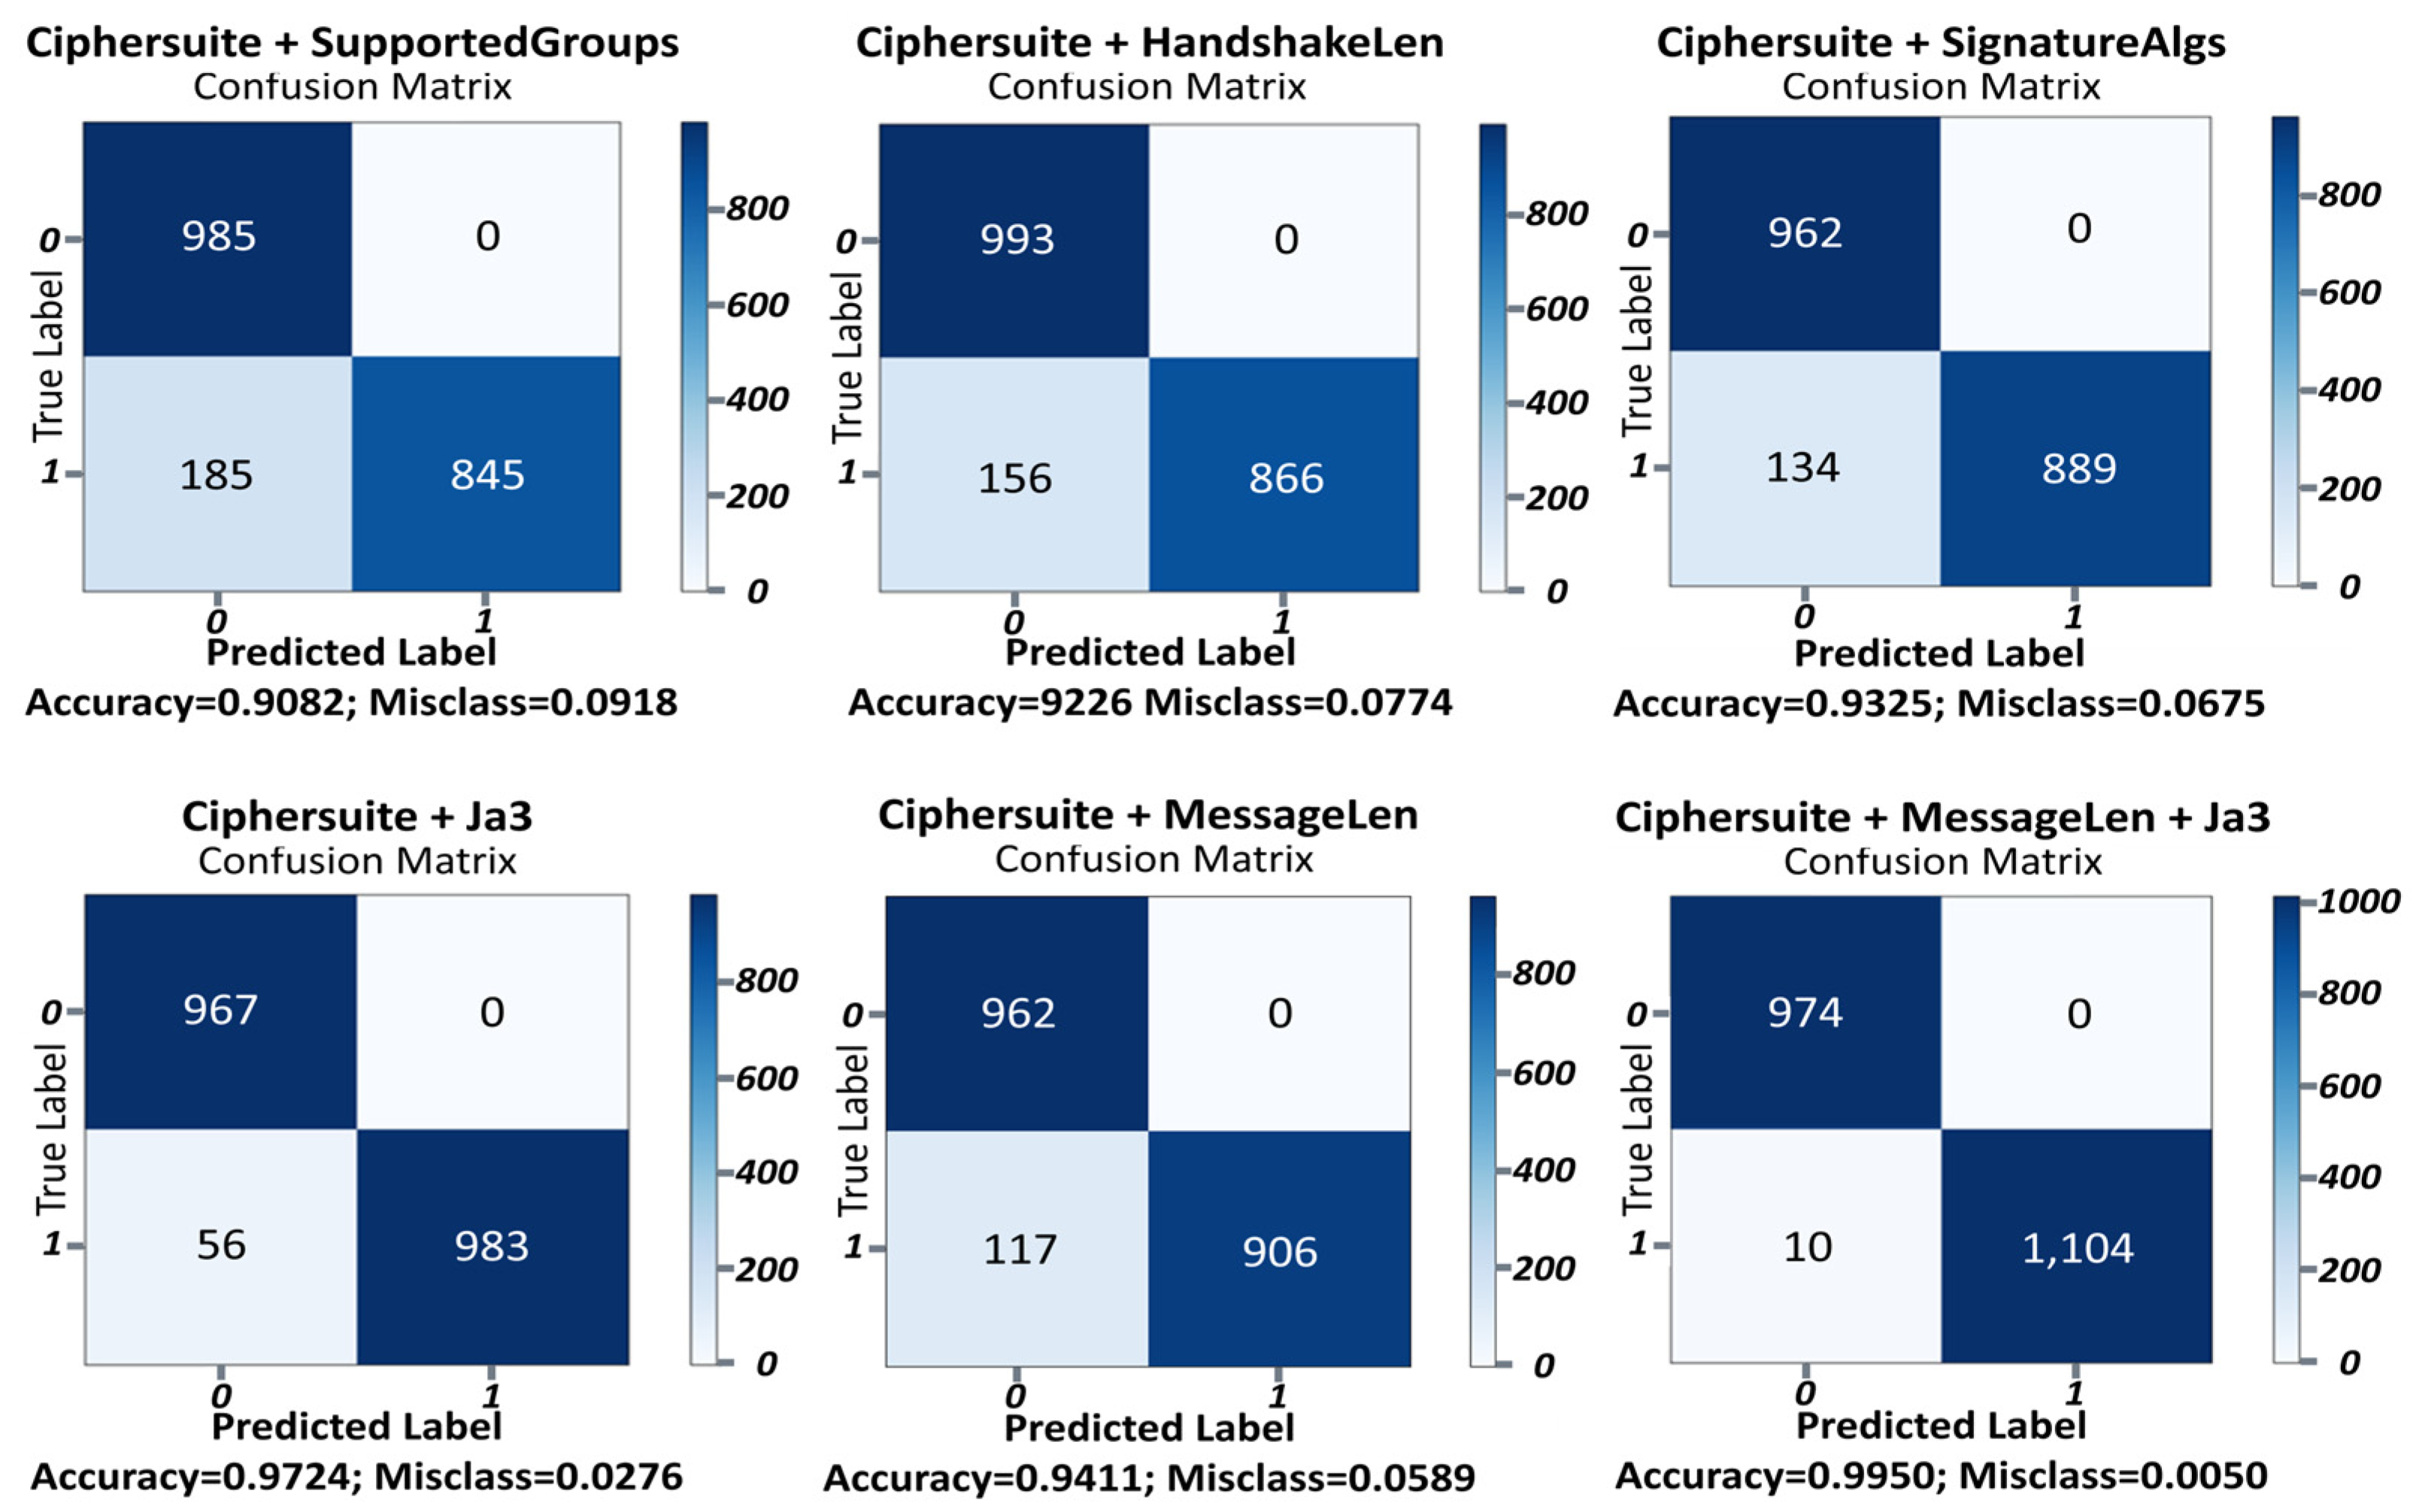
In this section, we present a comparative analysis of the classification performance for various combinations of usable feature values within TLS session data using the proposed ETA-GNN. For this comparison, we used the main feature values (CipherSuite, MessageLen, and JA3) and selected feature values for comparison (SupportedGroups and SignatureAlgs) within the utilized TLS session data. By comparatively analyzing the classification results of the ETA-GNN architecture based on each feature, we demonstrated the superior performance of the architecture in classifying normal/malicious network traffic based on the three main features. Figure 7 presents the overall classification performance of the ETA-GNN model based on each feature using the confusion matrix. Each feature is described in detail in the following section.
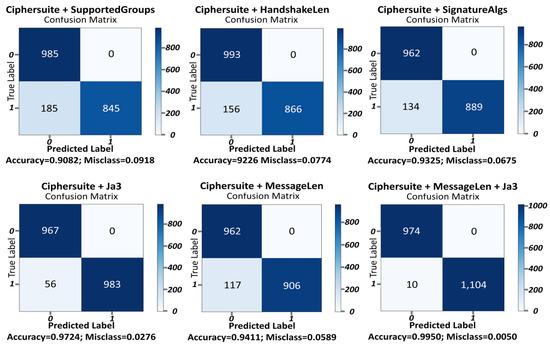
Figure 7.
Confusion matrices for distinct features extracted from TLS session data.
4.3.1. CipherSuite + SupportedGroups
The SupportedGroup value indicates the group that supports a key exchange when the client sends a message for a TLS session connection [1]. The classification accuracy of the ETA-GNN architecture using CipherSuite and SupportedGroups as features was 90.82%, indicating that the SupportedGroups feature can be used to classify encrypted malicious traffic.
4.3.2. CipherSuite + HandshakeLen
The classification accuracy of the ETA-GNN architecture using CipherSuite and HandshakeLen as features was 92.26%. This result was approximately 2% higher than the classification accuracy achieved using CipherSuite and SupportedGroups, signifying that HandshakeLen can classify malicious network traffic.
4.3.3. CipherSuite + SignatureAlgs
SignatureAlgs refers to the signature support algorithms for certificate verification during the TLS session process. The classification accuracy of the ETA-GNN architecture using CipherSuite and SignatureAlgs as features was 93.25%. This finding implies that the architecture can be used to classify malicious activities based on specific certificate validation algorithms in malicious network traffic. Further, the approximate 1–3% improvement over the classification accuracy of CipherSuite + SupportedGroup or HandshakeLen indicates that the value of SignatureAlgs can be used to classify encrypted malicious traffic.
4.3.4. CipherSuite + JA3
JA3 is a method of TLS client fingerprinting that captures a specific TLS client, including the SSL/TLS version, CipherSuite, and extensions. JA3 fingerprinting can be used primarily to identify specific TLS clients based on known JA3 signatures related to malicious activities and detect potentially malicious behavior. The classification accuracy of the ETA-GNN architecture using CipherSuite and JA3 as features was 97.24%. This result, which is approximately 1–7% higher than that of CipherSuite + (SupportedGroup or HandshakeLen or SignatureAlgs), indicates that the value of JA3 was efficient in classifying malicious network traffic.
4.3.5. CipherSuite + MessageLen
The classification accuracy of the ETA-GNN architecture using CipherSuite and MessageLen as features was 94.11%. MessageLen is a method of TLS client fingerprinting that captures a specific TLS client, including the SSL/TLS version, CipherSuite, and extensions. JA3 fingerprinting can be used primarily to identify specific TLS clients based on known JA3 signatures related to malicious activities and detect potentially malicious behavior. This result, which was approximately 1–7% higher than the classification accuracy of CipherSuite + (SupportedGroup or HandshakeLen or SignatureAlgs), indicates that the value of JA3 was efficient in classifying malicious network traffic.
4.3.6. CipherSuite + MessageLen + JA3
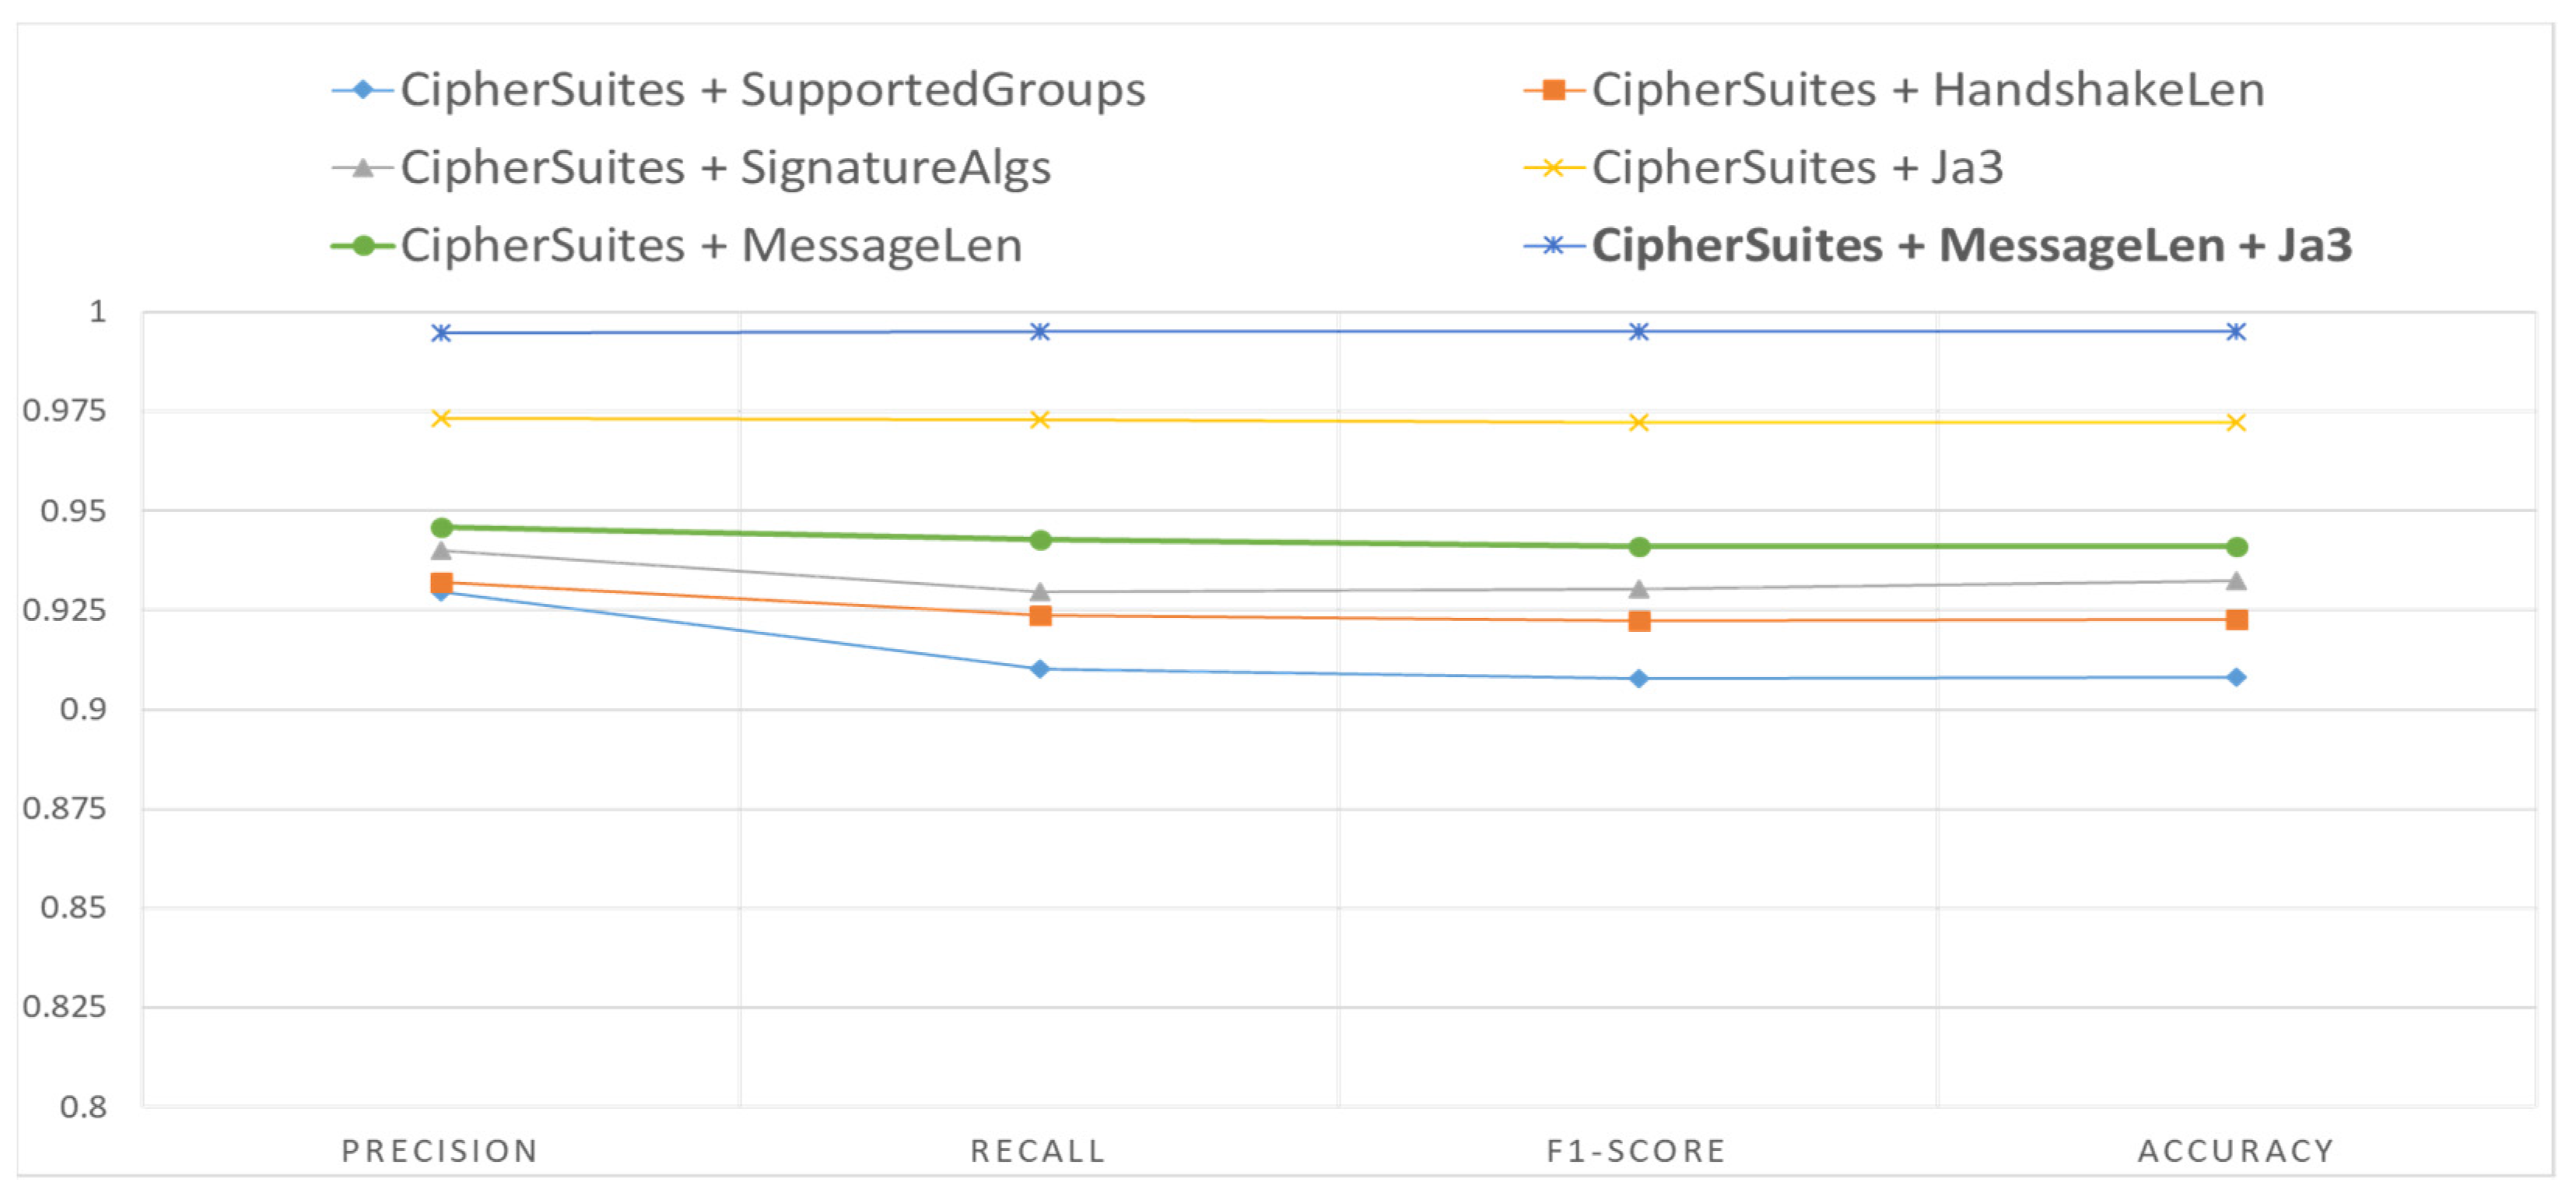
The classification accuracy of the ETA-GNN architecture for normal/malicious network traffic based on the combination of CipherSuite, MessageLen, and JA3, which were selected as the main features, was 99.50%. We derived a higher classification accuracy using the main features when compared with the classification accuracy based on features such as SupportedGroups, HandshakeLen, and SignatureAlgs that could be used to classify normal/malicious network traffic within TLS session data. The architecture used five features from the TLS session data: the TLSClientHello dataset’s IP address, port, CipherSuite, MessageLen, and JA3. The graph shows the classification accuracy of features that can be used to detect malicious activities and hidden channels within network traffic using the proposed architecture. The results based on this combination of features proved that it was possible to classify malicious network traffic that contained malicious activities and hidden channels using only five features, including the IP address and port. The overall comparison graph obtained through the experiment is presented in Figure 8.
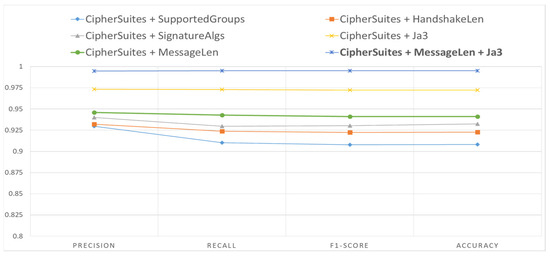
Figure 8.
Comparison of performance based on the proposed architecture for feature combinations.
4.4. Comparison with Related Work
As described above, we analyzed the normal/malicious network traffic classification results for each feature combination based on the GraphSAGE and prediction models. This study established that efficient classification was possible using fewer features than that typically employed in existing normal/malicious network traffic classification studies, while achieving similar or greater performance. Table 6 presents a comparative analysis of the performances of studies that used the GraphSAGE model for normal or malicious network traffic classification and the proposed model.
Table 6.
Comparison of the number of features and performance between existing studies and the proposed model.
As presented in Table 6, Zhang et al. [9] used more than seven feature values, including values in the packet header without IP addresses and port and packet payload values. Hong et al. [11] used more than 23 feature values, including handshake data, session metadata, and log values representing other network connections and TLS sessions. Each study used different data for learning with different detailed settings, thereby limiting the accuracy of the comparative analysis. Nevertheless, Table 6 indicates that the proposed GraphSAGE-based normal or malicious network traffic classification model yielded higher accuracy while using fewer feature values than existing methods across various features.
5. Conclusions and Future Work
HTTPS is used to protect sensitive information exchanged across networks. It is applied by default in the mainstream web browsers used by most Internet users, and the proportion of encrypted network traffic is increasing. However, encrypted malicious network traffic has also increased as the HTTPS protocol for protecting sensitive information can be exploited by malicious users. This approach increases the significance of normal or malicious network traffic classification techniques in response to this trend. Consequently, rapid analysis of data within real-time network traffic exchanges is required for accurate classification of network traffic containing malicious activities. This necessitates ensuring temporal efficiency based on minimal feature selection and high accuracy using optimal feature combinations. Therefore, this study analyzed the features of TLS session data that can be used for encrypted malicious network traffic classification and proposed the ETA-GNN architecture as a method for classifying normal or malicious network traffic using minimal features. To achieve temporal efficiency with minimal features and high accuracy using optimal feature combinations, we analyzed each feature combination. The GraphSAGE and prediction models were used for normal or malicious network classification based on correlations between network traffic. The proposed ETA-GNN architecture, structured with IP addresses and ports as nodes and CipherSuite, MessageLen, and JA3 as edges, demonstrated the best performance (99.50%). This performance was similar to or exceeded that of existing GNN-based ETA algorithms when fewer features were used, suggesting that efficient classification of normal or malicious network traffic classification was possible with lower resources and time. However, although the proposed method classifies normal and malicious network traffic with high accuracy using reduced features, there is a limitation in that more reliable verification experiments are needed to demonstrate low resource usage and time efficiency. To address this, we plan to conduct future works on this topic. In future research, we plan to analyze the time complexity and verify efficiency to prove that the technique proposed in this paper is time-efficient and uses fewer resources by utilizing reduced features. Additionally, by ensuring the reliability of the GNN model used in this paper through comprehensive model performance evaluation experiments considering noise and bias, we aim to develop a highly effective technology for addressing the large volume of encrypted malicious network traffic in the future.
Author Contributions
Conceptualization, I.-S.J. and Y.-R.S.; methodology, I.-S.J. and Y.-R.S.; software, L.A.J.; validation, L.A.J.; formal analysis, I.-S.J. and Y.-R.S.; investigation, I.-S.J. and Y.-R.S.; data curation, I.-S.J.; writing—original draft preparation, I.-S.J. and Y.-R.S.; writing—review and editing, L.A.J., D.-H.K., S.-Y.I., S.-W.S., Y.-H.K. and J.K.; visualization, L.A.J.; supervision, J.K.; project administration, J.K. All authors have read and agreed to the published version of the manuscript.
Funding
This research was supported by the Korea Research Institute for Defense Technology Planning and Advancement (KRIT)—Grant funded by Defense Acquisition Program Administration (DAPA) (KRIT-CT-21-037).
Data Availability Statement
The data presented in this study are available on request from the corresponding author.
Conflicts of Interest
The authors declare no conflicts of interest.
References
- Rescorla, E. The Transport Layer Security (TLS) Protocol Version 1.3. RFC. 2018. Available online: https://tools.ietf.org/html/rfc8446 (accessed on 16 May 2023).
- Google. Google Transparency Report: HTTPS Encryption on the Web. 2023. Available online: https://transparencyreport.google.com/https/overview?hl=en (accessed on 16 May 2023).
- Let’s Encrypt. Let’s Encrypt Stats. 2023. Available online: https://letsencrypt.org/stats/ (accessed on 16 May 2023).
- Fu, C.; Li, Q.; Shen, M.; Xu, K. Realtime robust malicious traffic detection via frequency domain analysis. In Proceedings of the 2021 ACM SIGSAC Conference on Computer and Communications Security, New York, NY, USA, 15–19 November 2021; pp. 3431–3446. [Google Scholar] [CrossRef]
- Papadogiannaki, E.; Ioannidis, S. A survey on encrypted network traffic analysis applications, techniques, and countermeasures. ACM Comput. Surv. 2022, 54, 123. [Google Scholar] [CrossRef]
- Wang, Z.; Thing, V.L.L. Feature mining for encrypted malicious traffic detection with deep learning and other machine learning algorithms. Comput. Sec. 2023, 128, 103143. [Google Scholar] [CrossRef]
- Shen, M.; Zhang, J.; Zhu, L.; Xu, K.; Du, X. Accurate decentralized application identification via encrypted traffic analysis using graph neural networks. IEEE Trans. Inform. Forensics Secur. 2021, 16, 2367–2380. [Google Scholar] [CrossRef]
- Liu, T.; Li, Z.; Long, H.; Bilal, A. NT-GNN: Network Traffic Graph for 5G Mobile IoT Android Malware Detection. Electronics 2023, 12, 789. [Google Scholar] [CrossRef]
- Zhang, H.; Yu, L.; Xiao, X.; Li, Q.; Mercaldo, F.; Luo, X.; Liu, Q. TFE-GNN: A temporal fusion encoder using graph neural networks for fine-grained encrypted traffic classification. In Proceedings of the ACM Web Conference WWW, New York, NY, USA, 30 April–4 May 2023; pp. 2066–2075. [Google Scholar] [CrossRef]
- Hu, G.; Xiao, X.; Shen, M.; Zhang, B.; Yan, X.; Liu, Y. TCGNN: Packet-grained network traffic classification via graph neural networks. Eng. Appl. Artif. Intell. 2023, 123, 106531. [Google Scholar] [CrossRef]
- Hong, Y.; Li, Q.; Yang, Y.; Shen, M. Graph based encrypted malicious traffic detection with hybrid analysis of multi-view features. Inf. Sci. 2023, 644, 119229. [Google Scholar] [CrossRef]
- Pang, B.; Fu, Y.; Ren, S.; Wang, Y.; Liao, Q.; Jia, Y. CGNN: Traffic classification with graph neural network. arXiv 2021, arXiv:2110.09726. [Google Scholar]
- Sun, B.; Yang, W.; Yan, M.; Wu, D.; Zhu, Y.; Bai, Z. An encrypted traffic classification method combining graph convolutional network and autoencoder. In Proceedings of the 2020 IEEE 39th International Performance Computing and Communications Conference, Austin, TX, USA, 6–8 November 2020; pp. 1–8. [Google Scholar] [CrossRef]
- Huoh, T.L.; Luo, Y.; Li, P.; Zhang, T. Flow-based encrypted network traffic classification with graph neural networks. IEEE Trans. Netw. Serv. Manag. 2023, 20, 1224–1237. [Google Scholar] [CrossRef]
- Jiang, M.; Li, Z.; Fu, P.; Cai, W.; Cui, M.; Xiong, G.; Gou, G. Accurate mobile-app fingerprinting using flow-level relationship with graph neural networks. Comput. Netw. 2022, 217, 109309. [Google Scholar] [CrossRef]
- Diao, Z.; Xie, G.; Wang, X.; Ren, R.; Meng, X.; Zhang, G.; Xie, K.; Qiao, M. EC-GCN: A encrypted traffic classification framework based on multi-scale graph convolution networks. Comput. Netw. 2023, 224, 109614. [Google Scholar] [CrossRef]
- Huoh, T.L.; Luo, Y.; Zhang, T. Encrypted network traffic classification using a geometric learning model. In Proceedings of the 2021 IFIP/IEEE International Symposium on Integrated Network Management (IM), Bordeaux, France, 17–21 May 2021; pp. 376–383. [Google Scholar]
- Okonkwo, Z.; Foo, E.; Hou, Z.; Li, Q.; Jadidi, Z. Encrypted network traffic classification with higher order graph neural network. In Proceedings of the Australasian Conference on Information Security and Privacy, Brisbane, QLD, Australia, 15 June 2023; pp. 630–650. [Google Scholar] [CrossRef]
- Pang, B.; Fu, Y.; Ren, S.; Jia, Y. High-performance network traffic classification based on graph neural network. In Proceedings of the 2023 IEEE 6th Information Technology, Networking, Electronic and Automation Control Conference (ITNEC), Chongqing, China, 24–26 February 2023; pp. 800–804. [Google Scholar] [CrossRef]
- Zhao, R.; Deng, X.; Wang, Y.; Chen, L.; Liu, M.; Xue, Z.; Wang, Y. Flow sequence-based anonymity network traffic identification with residual graph convolutional networks. In Proceedings of the 2022 IEEE/ACM 30th International Symposium on Quality of Service (IWQoS), Oslo, Norway, 10–12 June 2022; pp. 1–10. [Google Scholar] [CrossRef]
- Pham, T.D.; Ho, T.L.; Truong-Huu, T.; Cao, T.D.; Truong, H.L. Mappgraph: Mobile-app classification on encrypted network traffic using deep graph convolution neural networks. In Proceedings of the 37th Annual Computer Security Applications Conference, Virtual, 6–10 December 2021; pp. 1025–1038. [Google Scholar] [CrossRef]
- Shi, Z.; Luktarhan, N.; Song, Y.; Tian, G. BFCN: A novel classification method of encrypted traffic based on BERT and CNN. Electronics 2023, 12, 516. [Google Scholar] [CrossRef]
- Zeng, Z.; Xun, P.; Peng, W.; Zhao, B.K. Toward identifying malicious encrypted traffic with a causality detection system. J. Inf. Sec. Appl. 2024, 80, 103644. [Google Scholar] [CrossRef]
- Anderson, B.; McGrew, D. Identifying encrypted malware traffic with contextual flow data. In Proceedings of the 2016 ACM Workshop on Artificial Intelligence and Security, Vienna, Austria, 24–28 October 2016; pp. 35–46. [Google Scholar] [CrossRef]
- Anderson, B.; McGrew, D. Machine learning for encrypted malware traffic classification: Accounting for noisy labels and non-stationarity. In Proceedings of the 23rd ACM SIGKDD International Conference on Knowledge Discovery and Data Mining, Halifax, NS, Canada, 13–17 August 2017; pp. 1723–1732. [Google Scholar] [CrossRef]
- Shen, M.; Ye, K.; Liu, X.; Zhu, L.; Kang, J.; Yu, S.; Li, Q.; Xu, K. Machine learning-powered encrypted network traffic analysis: A comprehensive survey. IEEE Commun. Surv. Tutor. 2022, 25, 791–824. [Google Scholar] [CrossRef]
- Choi, Y.S.; Yoo, J.H.; Koo, K.J.; Moon, D.S. Trends of encrypted network traffic analysis technologies for network anomaly detection. Elec. Telecommun. Trends 2023, 38, 71–80. [Google Scholar]
- Srivastava, G.; Jhaveri, R.H.; Bhattacharya, S.; Pandya, S.; Rajeswari; Maddikunta, P.K.R.; Yenduri, G.; Hall, J.G.; Alazab, M.; Gadekallu, T.R. XAI for Cybersecurity: State of the art, challenges, open issues and future directions. arXiv 2022, arXiv:2206.03585. [Google Scholar]
- Kipf, T.N.; Welling, M. Semi-supervised classification with graph convolutional networks. arXiv 2016, arXiv:1609.02907. [Google Scholar]
- Gilmer, J.; Schoenholz, S.S.; Riley, P.F.; Vinyals, O.; Dahl, G.E. Neural message passing for quantum chemistry. In Proceedings of the International Conference on Machine Learning, Sydney, Australia, 6–11 August 2017; pp. 1263–1272. [Google Scholar]
- Veličković, P.; Cucurull, G.; Casanova, A.; Romero, A.; Liò, P.; Bengio, Y. Graph attention networks. arXiv 2017, arXiv:1710.10903. [Google Scholar]
- Hamilton, W.L.; Ying, Z.; Leskovec, J. Inductive representation learning on large graphs. In Proceedings of the 31st International Conference on Neural Information Processing Systems, Long Beach, CA, USA, 4–9 December 2017; pp. 1025–1035. [Google Scholar]
- Wang, Y.; Xiong, G.; Liu, C.; Li, Z.; Cui, M.; Gou, G. CQNET: A clustering-based quadruplet network for decentralized application classification via encrypted traffic. In Proceedings of the Machine Learning and Knowledge Discovery in Databases. Applied Data Science Track: European Conference, ECML PKDD 2021, Bilbao, Spain, 10 September 2021; pp. 518–534. [Google Scholar] [CrossRef]
- Lab, P. Real-World Web Test Bed. 2023. Available online: https://www.pcl.ac.cn/html/1030/2021-10-20/content-3879.html (accessed on 1 May 2023).
- Scarselli, F.; Gori, M.; Tsoi, A.C.; Hagenbuchner, M.; Monfardini, G. The graph neural network model. IEEE Trans. Neural Netw. 2009, 20, 61–80. [Google Scholar] [CrossRef] [PubMed]
- Yang, S.; Verma, S.; Cai, B.; Jiang, J.; Yu, K.; Chen, F.; Yu, S. Variational co-embedding learning for attributed network clustering. arXiv 2021, arXiv:2104.07295. [Google Scholar] [CrossRef]
- Yin, H.; Yang, S.; Song, X.; Liu, W.; Li, J. Deep fusion of multimodal features for social media retweet time prediction. World Wide Web 2021, 24, 1027–1044. [Google Scholar] [CrossRef]
- Dong, W.; Wu, J.; Zhang, X.; Bai, Z.; Wang, P.; Woźniak, M. Improving performance and efficiency of Graph Neural Networks by injective aggregation. Knowl.-Based Syst. 2022, 254, 109616. [Google Scholar] [CrossRef]
- Hamilton, W.L. Graph Representation Learning; Synthesis Lectures on Artificial Intelligence and Machine Learning; Morgan & Claypool Publishers: San Rafael, CA, USA, 2020; Volume 14, pp. 1–159. [Google Scholar]
- Wireshark. The World’s Most Popular Network Protocol Analyzer. 2023. Available online: https://www.wireshark.org/ (accessed on 23 March 2023).
- Malware-traffic-analysis.net. A Source for Packet Capture (pcap) Files and Malwarre Samples. 2023. Available online: https://www.malware-traffic-analysis.net/ (accessed on 1 February 2023).
- NETCAP. Netcap Overview. 2023. Available online: https://docs.netcap.io/ (accessed on 1 February 2023).
- Scikit-Learn. Examples. 2023. Available online: https://scikit-learn.org/stable/auto_examples/index.html#preprocessing (accessed on 1 February 2023).
- Rescorla, E.; Dierks, T. The Transport Layer Security (TLS) Protocol Version 1.2. RFC. 2008. Available online: https://tools.ietf.org/html/rfc5246 (accessed on 16 February 2023).
- Malhotra, V.; Potika, K.; Stamp, M. A Comparison of graph neural networks for malware classification. J. Comput. Virol. Hack. Tech. 2023, 20, 53–69. [Google Scholar] [CrossRef]
- Yuan, Y.; Wang, W.; Pang, W. Which hyperparameters to optimise? An investigation of evolutionary hyperparameter optimisation in graph neural network for molecular property prediction. In Proceedings of the Genetic and Evolutionary Computation Conference Companion, Lille, France, 10–14 July 2021; pp. 1403–1404. [Google Scholar] [CrossRef]
- Gonzales, C.; Lee, E.H.; Lee, K.L.K.; Tang, J.; Miret, S. Hyperparameter optimization of graph neural networks for the OpenCatalyst dataset: A case study AI for accelerated materials design. In Proceedings of the 36th Conference on Neural Information Processing Systems (NeurIPS 2022), New Orleans, LA, USA, 28–29 December 2022. [Google Scholar]
Disclaimer/Publisher’s Note: The statements, opinions and data contained in all publications are solely those of the individual author(s) and contributor(s) and not of MDPI and/or the editor(s). MDPI and/or the editor(s) disclaim responsibility for any injury to people or property resulting from any ideas, methods, instructions or products referred to in the content. |
© 2024 by the authors. Licensee MDPI, Basel, Switzerland. This article is an open access article distributed under the terms and conditions of the Creative Commons Attribution (CC BY) license (https://creativecommons.org/licenses/by/4.0/).