Abstract
In the field of biology, the ’biomarkers’ of the different animal species are of great relevance, as well as the relationships between them and the quality of the habitat. A study was proposed, analysing the antlers of the Iberian deer, to measure the bilateral asymmetry of its branches. The antlers are characterised in a 3D CAD model of their axial structure obtained via photogrammetric restitution from two photographs. This method quantifies the global and partial asymmetries of the antler’s structural features. The research evaluated 48 deer antlers from hunting days and taxidermy workshops. To quantify asymmetries, the measurements required are the same as those considered to assess the hunting quality of antlers. Bilateral deviations are estimated for each structural trait and the whole antler. Preliminary results showed a convergence between the values of global asymmetry and hunting quality. The methodology proved to be fast, inexpensive, and easy to implement, which facilitates its use in future asymmetry studies of other biological elements of animal or plant origin. It is only necessary that the starting data, which is the bilateral axial structure of the analysed element, is characterised in a 3D model.
1. Introduction
In ungulate species, the degree of stable development in an animal is determined by internal, genetic, and external factors; the level of pastures in the environment; relationships with other species, etc. Some of these may alter the development of the animal, causing geometric defects in certain morphological features of the antler. The antlers of ungulates are distinguished in that, in some species, such as bovids, their horns remain stable over time, and in other species, such as cervids, the antlers are cast off after the rutting season and are renewed every year. Some authors [1,2,3] point out the morphological and evolutionary differences between the antlers of both species of ungulates. Other authors [4,5,6] indicate the factors influencing the growth of cervid antlers and the ‘shedding’ period. The state of the antlers after the annual renewal represents a relevant biomarker that can be related to the influencing factors to which the specimen has been subjected. The function of the antler as a secondary sexual character with biomechanical properties adapted to fighting during the rutting period is therefore greatly affected by environmental factors, and it has even been observed that the year of birth is a determining factor for the future antler quality of the individual [7].
One of these alterations is defined by several authors as ‘fluctuating asymmetry’ (FA), representing the random deviations in the symmetrical development of certain features of bilateral structures [8,9]. Studies on fluctuating asymmetry (FA) have been initiated on invertebrates, lower vertebrates, and avian species [10,11,12]. The authors [13] study asymmetry values in the skeleton of primates (rhesus macaques) that suffered a certain degree of stress due to climatic hurricane events in their gestational stage of development. Most studies have been carried out on the estimation of the degree of asymmetry in ungulate species, such as moose (Alces alces) [14], fallow deer (Dama dama) [15,16,17], reindeer (Rangifer tarandus) [18], alpine chamois (Rupicapra rupicapra) [19], red deer (Cervus elaphus hispanicus) [20], and roe deer (Capreolus capreolus) [21], supporting the relationship between FA and the stress of the animal caused by adverse environmental conditions in the year of antler growth or earlier.
Several studies assess the degree of bilateral divergence in animals and the causes of developmental instability as a function of different animal stress conditions [22,23,24,25,26]. In Ref. [17], they study the influence of the fluctuating asymmetry in the antler of fallow deer on the individual quality of the specimen and the degree of relevance of the antler as a weapon in the fight with other males. In Iberian red deer [27], a direct correlation has been observed between age and the right and left branches of deer antlers being more significant in thickness than in the length and number of tines [28].
The study of FA in the antlers of Iberian red deer, since they are renewed annually, can be a good indicator of their individual quality and the degree of environmental stress they have suffered during their development [20].
Several studies question the reliability of the results regarding the relationship of asymmetry with other variables: some [28,29] state that studies with large sample sizes are needed to obtain conclusive results, others emphasise that methodologies with controlled measurement errors should be applied [25,30,31] and question the relationship between asymmetry and animal stress because the results obtained in numerous analyses are not consistent and homogeneous [26], or they question the fact that antler development is a factor in female selection [32,33].
The methodologies for asymmetry studies in cervids should be more rigorous and based on the study of those particular antler traits that represent the causes of developmental instability, thus causing asymmetry in the two branches of the antler [34]. Some authors emphasise the importance of directing asymmetry studies towards the analysis of particular geometric features of the antler [20,25,26], thus establishing partial asymmetry values in the differential features of the antler and enabling us to detect and relate those features which are more exposed to stress so that the conclusive results are more rigorous in studies on the instability of the development of the antler. Ref. [34] relates the degree of FA in different antler traits and at different age intervals. Contrary to other studies, he states that FA caused by developmental instability is more pronounced in older males. In the early stages, there is little degree of asymmetry; however, if asymmetry is detected in certain traits, it remains in more mature ages. The most frequent studies on asymmetry in cervid antlers have consisted of assessing asymmetry in particular traits of antlers. Thus, numerous authors have studied the degree of asymmetry not as a composite value but with respect to several traits, from a few [14,15,21] to a large number [28,33,35]. Studies that offer a composite value for asymmetry are less frequent [20,36]. Similarly, Refs. [24,37] study the relationship of asymmetry with hunting quality values obtained as hunting trophies in Alaskan moose species and white-tailed deer (Odocoileus virginianus) in North America.
Traditional methodologies have been based on the partial asymmetry assessments of some particular traits of the biological element under study and not on global asymmetry assessments for the whole structure. This is due to the difficulty in taking the necessary measurements and their precision regarding all the traits that form the structure in order to finally obtain a global value of asymmetry.
The method presented allows for extending this study to different traits of the antler structure and their relationships with the stress of the animal. The new methodology enables us to extend this study and to later infer the causes of influence.
More recent studies have evaluated asymmetry values, not as an overall value but as partial values for the differential traits of antler structures [14,15,21]. To a lesser extent, an overall value of asymmetry is evaluated and estimated for the entire antler [20,36].
The new method allows for the estimation of the partial values of asymmetry for those traits of antler structure taken into account in the evaluation of the biomarker of hunting quality. That is to say that, with the same values, it is possible to evaluate both biomarkers. It also allows the estimation of a global value of asymmetry for the whole antler.
Regarding the different methodological typologies for estimating the value of asymmetry, some authors [12,14,20,33] have created methods and tools for quantifying the asymmetry of biological elements using projective techniques of linear measurements in two dimensions. In 2007, Bartoš et al. [35] estimated the degree of asymmetry using three antler characteristics, the weight, length, and number of tips, without relying entirely on geometric values.
Ditchkoff and Defreese [38] use three-dimensional methodologies for the geometric definition of antlers for the subsequent analysis of asymmetries. The proposed method defines antlers in three dimensions in order to estimate, in the same way, the values of partial asymmetry in its structural traits, without considering horizontal or vertical symmetry planes referenced on the antlers themselves. The authors [39] obtain a 3D model of the antler of deer and evaluate its geometric accuracy by applying the 3D multi-image photogrammetry (SfM) technique (Structure from Motion). They apply it to morphological studies and to estimate the antler volume of deer.
Other authors [40] proposed a method for determining the global asymmetry of the entire antler. For this purpose, they use the antler data characterised by a CAD 3D model of its axial structure. In this case, the deviations of the extreme points of the tines of the antlers of both branches with respect to the reference of a symmetry plane linked to relevant points of the skull of the specimen are considered.
The new methodology presented in this study allows for a more direct application since it does not consider the previous definition of a symmetry plane. It will consider the divergences of the measurements on average of different related structural traits of the two branches of the antler of the Iberian deer (Cervus elaphus hispanicus). With these values of partial asymmetries, a global value of asymmetry for the whole antler structure is finally obtained. For the analysis, the characterisation of the antler is used as a 3D model of its axial structure. The algorithm takes advantage of the measurements considered for the assessment of the degree of hunting quality [41].
The new method will provide a number of relevant advantages over other methods:
- -
- For the analysis, the characterisation of the structure of the antler is used as input data by means of a 3D CAD model obtained via photogrammetric restitution from a few data: only two photographs.
- -
- The 3D model obtained is accurate, and therefore, the estimated deviations on the two branches of the antler will also be accurate, finally obtaining reliable values of the degree of asymmetries.
- -
- It is not necessary to refer to the deviations estimated between the two bilateral structures of the antler relative to a previously defined symmetry plane.
- -
- As the CAD definition of the antler by means of a 3D model is relatively fast, it will allow for further analyses with larger sample sizes so that conclusive results and degrees of correlations with other biomarkers and influencing factors can be obtained.
- -
- It will allow for the estimation of a ‘global’ value of the degree of asymmetry for the whole antler.
Estimating a global asymmetry value is of great difficulty due to the large number of measurements that must be considered at significant points corresponding to all traits of the antler structure. For this reason, most of the previous methods have estimated the asymmetry values of specific traits of the antler.
The proposed method resolves all of these drawbacks since it enables us to quickly measure, on the previously defined 3D CAD model, the values of the deviations in the traits of the two branches of the antler (partial asymmetries) and, based on these, quantify a ‘global’ asymmetry value for the whole antler:
- -
- The proposed method also makes it possible to take advantage of the same measurements used in the assessment of the hunting quality of the antler. These correspond to the geometric deviations produced in the structural traits of the two antler branches. Therefore, with the same measurements, two biomarkers can be estimated: the degree of hunting quality and the values of partial and global asymmetry.
Other subsequent studies of biological and ecological interest will be aimed at relating the values obtained for this biomarker to other influential factors.
2. Materials and Methods
In order to validate the methodology, a set of 48 red deer specimens was used: 21 of them obtained as hunting trophies from three sessions of officially approved processes (homologation sessions) and taxidermy workshops and 27 specimens shot in two hunting days in hunting areas between 2014 and 2019, which were aged between 5 and 9 years, in the Sierra de Andújar Natural Park in southern Spain.
2.1. Equipment Used
For all specimens, studied photographs were taken from different points of view, and a metric reference was used with panels sized in DIN-A3 format (594 × 420 mm) in order to enable photogrammetric restitution [42] to obtain a 3D spatial representation of the antler represented by an axial structure. Photographs were taken with an SLR reflex camera Nikon 300D with a resolution of 4288 × 2848 pixels and a 28–80 mm zoom lens. Exposure was kept at values of around 35 mm during photography. For the photogrammetric restitution process to be reliable and accurate, it was verified that the photographs taken with SLR cameras showed less deformation at the centre and periphery than those taken with compact cameras without the use of expensive metric cameras or subsequent photograph editing and adjustment treatments to correct deformations.
In terms of hardware, no major resources were required. The graphics card used was an ‘Nvidia GeForce RTX’ with 6 Gb of memory. In studies with 3D CAD objects, it is recommended that the graphics card be independent of the motherboard with a large amount of memory in order to achieve good performance in image processing.
The 3D modelling software ‘SolidWorks v.2020’ from Dassault Systèmes (Vélizy-Villacoublay, France) was used for the restitution of the antler, represented in the two photographs, by creating a 3D scenario for the definition of the 3D model of the antlers and the measurement of the different geometric parts of its axial structure.
For manual measurements of the different parts of the antler necessary for the hunting valuation process, it was necessary to use a flexible tape measure and adapt it to the different external surfaces of the antler, as indicated in previous studies [41].
2.2. Object of the Study
For the new proposed methodology, the study of deer antler asymmetry, it is necessary to start from a model that represents the structure of the antler so that the lengths and perimeters of the different structural parts of the antler considered can be measured on it.
The process of defining the 3D model of the antler, using photogrammetric restitution methodology from two photographs of the antler taken from different angles, is described in [42] (Figure 1). The axial 3D model is made up of different spline curves that represent each of the traits of the antler structure. These are obtained by intersecting the projective rays of the considered points of the antler represented in the two photographs. Similarly, the digital CAD geometry of the antler is also validated on the physical model of the antler, demonstrating its degree of approximation and geometric accuracy.
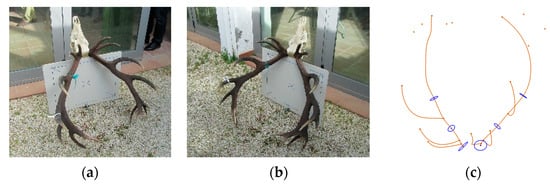
Figure 1.
(a,b) Deer antlers represented by two photographs. (c) Three-dimensional model with axial structure and cross sections.
In the proposed analysis, the starting data are the characterisation of the antler in a 3D CAD model of its axial structure, which faithfully describes the geometric elements of its structure: main beam, main tines (eye tines and trez tines), and the cross-sections of relevant parts of the main beam of the antler (Figure 2).
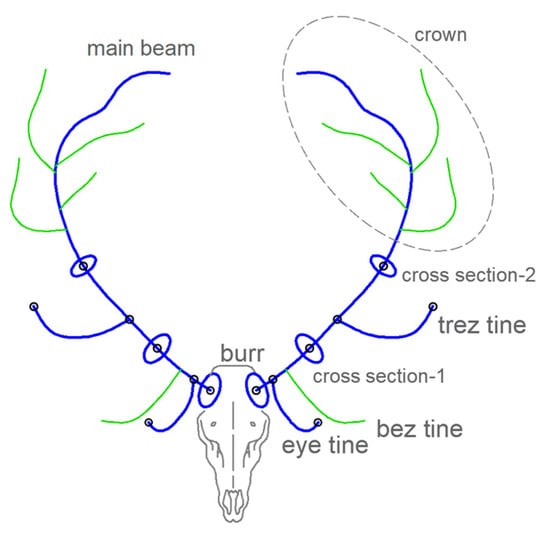
Figure 2.
Geometric elements of the antler considered for the study: main beam, eye tines, trez tines, and cross-sections.
2.3. Geometrical Data of the Antler Structure
For the present study, different relevant structural parts of the antler geometry, represented by its axial structure, are considered in order to quantify the length of each of them (Figure 2).
The geometric elements considered for each of the two branches of the antler are as follows: the ‘main beam’, the ‘eye tine’, the ‘trez tine’, the ‘burr’ and the two cross sections of the ‘main beam’, one taken between the ‘eye tine’ and the ‘trez tine’, and the other between the ‘trez tine’ and the ‘crown’.
2.4. Description of the Proposed Methodology
The proposed methodology allows for the estimation of the degree of antler asymmetry, which represents the symmetry defect between the two branches of the antlers of the deer studied, using measurements taken in previous studies quantifying the hunting quality of the antlers of the specimen.
Among the different items used in the official scale [37] for the evaluation of hunting quality, we considered those related to quantifiable distances, three lengths and three perimeters, belonging to the structural features of the antler in each of the two branches of the antler, as mentioned above (Figure 3).
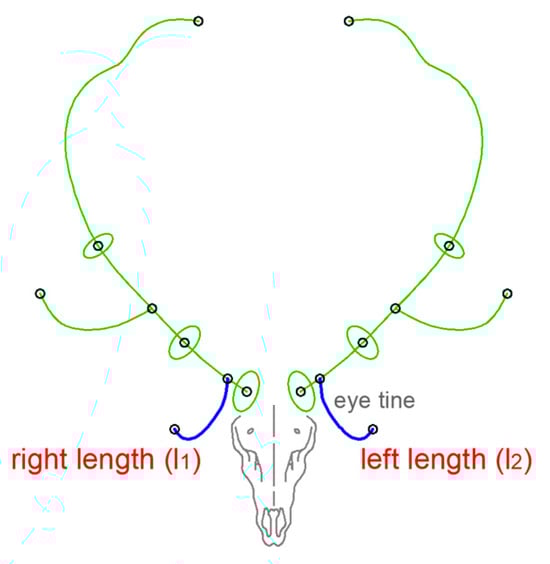
Figure 3.
Lengths considered (right and left) in the structural trait considered (eye tine) for the estimation of the value of partial asymmetry (PAI).
This method allows for the estimation of the asymmetry value, represented by the variable (PAI) (partial asymmetry index) for each of the six estimated geometric traits of the antler and a global asymmetry value for the whole antler, defined by the variable (GAI) (global asymmetry index).
In this proposal, the measurements pertaining to the same geometric trait of the antler under consideration were taken from both sides of the antler and compared; the difference between the two measurements was then evaluated and compared with the average length of the antler element studied (Figure 3) (Equation (1)).
The algorithm implemented in the methodology estimated the relative error representing the geometric divergence in the structural traits of the antler under study. The two measurements of the studied structural trait, the right and left branches of the antler, are usually close. Therefore, the resulting numerical value is usually a decimal value between 0 and 1, which is expressed with a precision of three decimal places.
The numerical value obtained (Equation (1)) was dimensionless and without units since it represents the metric difference between two related elements and is the average value of these.
For the structural trait analysed, (‘eye tine’) is as follows:
l1 represents the length of the right branch of the antler.
l2 represents the length of the left branch of the antler.
(PAI) (eye tine) represents the ‘partial asymmetry index’ for the specific trait studied: the ‘eye tine’.
Applying this procedure, the values of asymmetry for each of the six traits considered corresponding to the geometric elements of the antler were obtained. The global asymmetry value for the antler, (GAI) (global asymmetry index), was taken as the weighted sum of each of the six traits of the (PAI).
In order to establish the partial weights of the six structural traits of the antler, the weight assigned to each of the same traits in the official scale of the evaluation of the degree of its hunting quality as a hunting trophy [41] was considered.
The quantification of these weights was referenced relative to the specimen with the highest hunting quality in the sample studied. That specimen obtained a score of 187 points (gold medal) compared to the scores obtained (138.7) in the six antler traits of interest in the study of asymmetries. The partial weights assigned to each of the six antler traits (Table 1) were determined based on these scores.

Table 1.
Weights of each antler’s structural traits for the calculation of (PAI).
In the evaluation of hunting quality, apart from the items that express characteristics of the geometric development of the antler, other items were considered, some of which were subjective, such as ‘wingspan’, ‘total number of tines’, ‘weight’, and ‘separation’ of the antlers without the skull. These were not considered for the estimation of partial weights.
Once the weights represented by each estimated trait had been established, the calculation of the overall asymmetry value for the antler (GAI) was represented by the weighted sum of the six traits considering the weight represented by each one of them (Table 2) (Equation (2)).
Table 2.
Calculation process of the ‘Global Asymmetry Index’ (GAI).
The PAI and GAI values quantify the asymmetry defect of the antlers. For a given trait, a ‘0’ PAI value indicates no asymmetry; values close to zero represent reduced degrees of asymmetry.
This methodology uses the same measurements taken on the antlers to study their hunting quality. The proposed methodology allows for its application on the 3D model of the antler or on the physical model of the antler.
The general process of the methodology is described in (Figure 4).
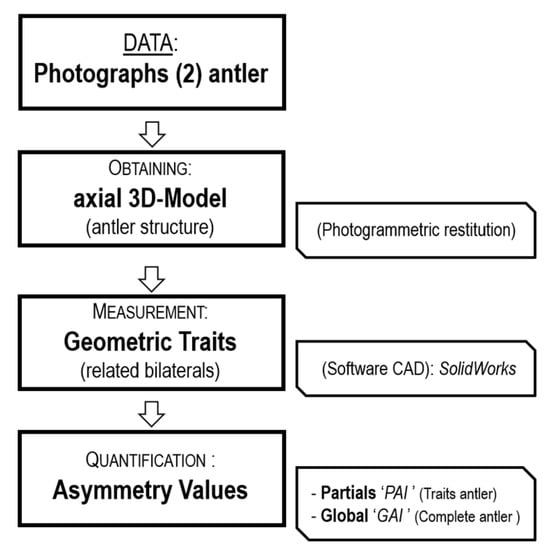
Figure 4.
General scheme of the proposed methodology.
3. Results
The process of calculating the values of PAI and GAI for each of the antlers is detailed in (Table 3). These results are derived from the same measurements used for the estimation of hunting quality, with metric values in cm with respect to the six structural features of the antlers considered. The results belong to the specimen of the sample taken as reference which presents the highest hunting quality: 187 points (gold medal).
Table 3.
Process of calculation of PAI and GAI.
The assessment analysis of the partial asymmetry (PAI) and global asymmetry (GAI) values of all the specimens evaluated was carried out on the input data of the antler characterised via its 3D CAD model (Table 4) (Figure 5). The results show the arithmetic mean of the PAI and GAI values in the specimens of each of the samples, corresponding to the three ‘homologation sessions’ and the two ‘hunting days’.
Table 4.
Results of ‘PAI’ and ‘GAI’ in antlers as ‘ 3D CAD model’.
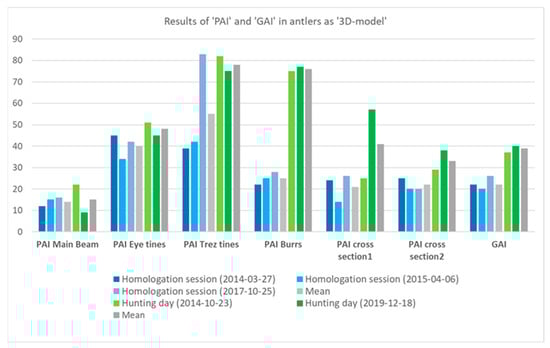
Figure 5.
Graphical summary of the data in Table 4.
4. Discussion
The PAI and GAI values detect some relationships in the obtained results of the different structural traits studied and of the origin of the specimens, such as ‘homologation sessions’ or ‘hunting days’. The convergence between the preliminary results obtained in the asymmetry biomarker and the hunting quality biomarker is also highlighted.
The value of ‘GAI’ is lower in the specimens from the ‘homologation sessions’ compared to hunting trophies: a mean value of 0.022, 44% lower than the mean value obtained from 0.039 of the specimens from hunting days. This is due to the fact that the antlers of the deer from the ‘homologation sessions’ present a higher degree of hunting quality and are therefore selected by their owners to be treated in taxidermy workshops for their definition as hunting trophies.
With respect to the asymmetry value evaluated in the different traits of the antler structure, ‘PAI’, it has been concluded that the three lengths with the lowest ‘PAI’ values, with mean values between 0.014 and 0.015, correspond to the length of the ‘main beam’ of the antler, thus representing the most symmetrical element. The next element of the antler, somewhat less symmetrical, corresponds to the ‘eye tine’, with mean ‘PAI’ values of between 0.040 and 0.048; the least symmetrical element is the one corresponding to the ‘central tine or trez tine’, with mean values ranging between 0.055 and 0.078.
With respect to the perimeters of the ‘burrs’ and the two cross-sections considered in the structural parts of the antler, it is observed that the ‘burrs’ present the greatest asymmetry defect, with a mean value of 0.025 in specimens from ‘homologation sessions’ and 0.076 in specimens from hunting days. The mean value of the ‘PAI’ at the perimeters of the cross-sections considered is 0.0215 in antlers from ‘homologation sessions’ and 0.037 in those from hunting days, which is 72% higher.
Finally, an approximation can be established for the ‘GAI’ value represented by a single ‘PAI’ trait out of the six that have been considered, represented by different geometric parts of the antler. As can be seen in (Table 4), the ‘overall asymmetry’ ‘GAI’ value of the antler is very closely approximated by the ‘partial asymmetry’ ‘PAI’ value corresponding to the perimeter of the cross-section taken between the ‘central tine or trez tine’ and the ‘crown’ of the antler; therefore, in a first approximation, the overall ‘GAI’ value could be represented by the ‘PAI’ value for that geometric trait due to the great convergence of these values.
The advantages of the proposed methodology are its ease of implementation and the economy of resources required. Therefore, its implementation may be appropriate in the study of biomarkers, asymmetries, and the hunting quality of large populations and samples, such as dead animals shot on hunting days [43] or selected specimens with samples from different sources. Subsequently, these results can be related to other influencing factors. Furthermore, this new methodology could extend to the study of naturally dead and older specimens [44]. The asymmetry relationship of various antler structural traits with respect to other mean antler values could be demonstrated. The degree of consistency of the relationships of partial asymmetries with age could also be studied. The proposed method allows for the study of particular antler traits where the causes of instabilities in antler development at various age intervals can subsequently be detected [34].
This proposed methodology will also enable us to relate two very relevant biomarker variables in biological studies: the degree of hunting quality and the global asymmetry ‘GAI’ of the antler. Based on the data obtained, a strong direct relationship has been observed between the value of ‘hunting quality’ and that of asymmetry; the specimens from the ‘homologation sessions’ present high values of ‘hunting quality’ (Table 4) together with low values of ‘GAI’, representing low defects and, therefore, high degrees of symmetry. The specimens that are evaluated in ‘homologation sessions’ are those whose hunting quality is recognized at first sight in terms of their degree of geometric development, number of points, colour, etc., and they are selected by hunters for their valuation and subsequently conserved as hunting trophies.
Therefore, this new variable ‘GAI’ is proposed as a ‘biomarker’ that quantifies the degree of antler symmetry defect on the two branches of the deer antlers so that future studies will be able to establish relationships and causalities with other internal and/or external environmental factors in which the specimens have developed.
Subsequent studies of populations of individuals, with larger samples, will allow for the inferring of results obtained with other internal variables (biomarkers), such as age, antler density, and the degree of geometric development determined by hunting quality, or other external variables such as the level of pastures in the specific place, the level of rainfall, the relationship of the environment with other animal species in which the population has developed, etc.
Other studies may relate the asymmetry of specific structural traits of the antler to age or geometric variables such as wingspan or hunting quality.
The species analysed in order to define the proposed methodology is the red deer (Cervus elaphus hipanicus). Given that the proposed method is initially based on the measurements taken for the valuation of hunting quality, based on quantifying the differences in the lengths and perimeters of the geometric features of the right and left branches of the antler, the applicability of the proposed methodology could be generalised to other species indicated in the ‘Manual de Homologación de Trofeos de Caza Mayor en España’ [41]: other cervids, such as fallow deer (Dama dama) and roe deer (Capreolus capreolus canus); and other ungulate species, such as wild boar (Sus scrofa baeticus), mouflon (Ovis orientalis musimon), mountain goat (Capra pirenaica victoriae), barbary sheep (Ammotragus lervia lervia), and chamois (Rupicapra pyrenaica parva).
For free-ranging specimens that develop in areas or habitats of countries that protect specific cervid species, such as the huemul (Hippocamelus bisulcus) in Argentina, the application of this methodology is complicated for conservation and species management reasons. To obtain the metric measurements of the antlers, for the estimation of asymmetries, it is necessary to have physical antlers or their characterisation in the form of a 3D CAD model based on two photographs. The photographs of the antler, used as starting data to obtain the 3D model, must include a metric reference that makes the photogrammetric spatial restitution process possible. With free-ranging specimens, this process is very complicated to carry out and not very efficient due to the costly infrastructure and controlled equipment requirements, such as, for example, well-balanced photo-trapping cameras with validated scaling.
Therefore, in estimating the biomarker of asymmetry in bilateral cervid antler structures, the implementation of the methodology in live animals is complicated. In protected areas where specimens in danger of extinction or other causes are conserved, the methodology could be applied to specimens that are found dead. In protected species, with respect to specimens that are found dead, the proposed methodology would provide additional information in complete analyses, such as necropsy procedures, implemented to determine the causes and other data of interest with respect to the circumstances of the specimen’s death. The asymmetry data obtained can be used later to infer other estimated biomarkers conditioned by the favourable environmental setting. Another case of obtaining the physical antler can be by obtaining ‘cast-off’ antler branches collected from the field at the end of the winter season when cervids shed their antlers annually, similarly to studies in which the cast-offs are used for either different genetic studies [45] or to validate methodologies for calculating antler volume and density [46].
However, this is complicated by the difficulty of finding and associating the two antler branches with the same specimen. Another drawback is the consistency of the results in the study due to the possibility of sample size limitation.
Comparison of Methodologies
The results obtained with the proposed methodology ‘Met-2’ were compared to those obtained with another previous methodology proposed by the same author [40], called ‘Met-1’. It is observed (Table 5) (Figure 6) that the mean AI (asymmetry index) values obtained with ‘Met-1’ were 0.063 for specimens studied in ‘homologation sessions’, 43% lower than for specimens from hunting days, with a mean value of 0.110, indicating a higher symmetry in specimens from ‘homologation sessions.’ The same proportion occurs in the results that applied ‘Met-2’: 0.024 and 0.039, 39% lower; the results of the two methodologies converge, each within its own scale of values.
Table 5.
Results of ‘AI’ (Met-1) and (Met-2) with data on the ‘3D CAD model’.
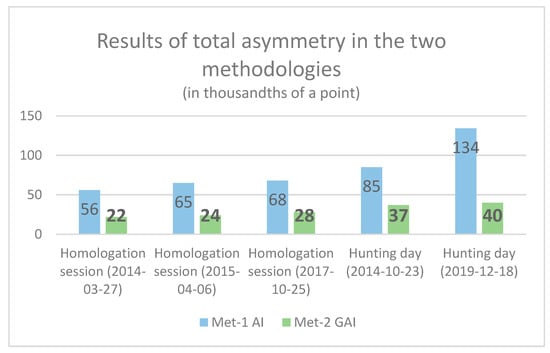
Figure 6.
Graphical summary of the data in Table 5.
On the new proposed methodology, ‘Met-2’, the results obtained are convergent with those obtained in ‘Met-1’, each within its own scale of results. The values of asymmetry in the specimens from ‘homologation sessions’ are somewhat lower than those from ‘hunting days’: 57% in ‘Met-1’ and 61% in ‘Met-2’.
Due to the great convergence of results obtained with the two methodologies ‘Met-1’ [40] and the new proposal ‘Met-2’ in the assessment of the degree of antler asymmetry, it will be necessary to decide, depending on the scope of the study, which of them will be applied.
The decision as to the implementation of one or the other method will be determined firstly by the type of data available, whether from CAD or manual measurements obtained using a tape measure on the physical model; secondly by the number of variables to be estimated, estimates of the degree of hunting quality, and the degree of asymmetry or both; and thirdly by the size of the population of specimens to be studied.
When only an asymmetry study is desired, the application of ‘Met-1’ is optimal since it only requires the spatial restitution of the pairs of points necessary for the study represented by the start and ends of the main points and the crown of the antler. ‘Met-2’ is more appropriate when hunting quality needs to be studied, and its measurements pertaining to the lengths and perimeters of the geometric elements of the two branches of the antler can be taken advantage of to perform the study of asymmetry, either globally as ‘GAI’ or partially as ‘PAI’, further allowing the study of each particular feature of the antler.
The following is a comparison between both methods, where the characteristics of each of them, their functionalities, and the suitability of their implementation according to the type of biological application are defined.
1. Characteristics of the methodology:
‘Met-1’: Here, we need to define a ‘plane of symmetry’, defined by three points on the skull. The asymmetry study is performed by comparing the perpendicularity and the distances on the plane of symmetry of the segments joining the pairs of related points of the antler considered.
‘Met-2’: There is no need to define a ‘plane of symmetry’. The proposed methodology consists of comparing the lengths of the different geometrical traits considered corresponding to the two branches of the antler.
2. Characteristics of the initial data:
‘Met-1’: This only admits that the starting data are in digital format; its spatial position is obtained from the points considered for the study and represented in two photographs by means of photogrammetric spatial restitution.
‘Met-2’: The evaluation of the degree of asymmetry is based on the results of the measurements, lengths, and perimeters, carried out for the evaluation of the hunting quality. These measurements can be obtained on the physical model of the antler using a tape measure, or they can be defined in a CAD 3D model representing the structure of the antler.
3. Obtaining process:
‘Met-1’: This is not necessary to obtain the entire CAD structure of the antler via photogrammetric restitution. It is only necessary to render in 3D the relevant ‘homologous’ points of the antler necessary for the study: the start and ends of the main tips and the centre of the crown corresponding to the two branches of the antler.
‘Met-2’: This is necessary to define in 3D the whole antler by representing its axial structure formed by the main beam, the main tines, and the geometrical centre of the crown tines.
4. Biological applications:
‘Met-1’: This is appropriate if it is only implemented for the assessment of the ‘degree of asymmetry’ as this requires more simplified, smaller, and quicker data. Without fully characterising the structural trait analysed by means of a 3D model, it is sufficient to define the three-dimensional spatial position of the significant points of the structural feature evaluated; all this is achieved by means of a 3D photogrammetric restitution process of these points represented in two photographs. This is recommended for the study of a large set of specimens, ‘populations’, located at a specific place.
‘Met-2’: This is appropriate in studies of ‘hunting valuation’ and of the global ‘degree of asymmetry’ or specific geometric traits of the antler; in this case, the study consists of knowing the two variables and being able to determine their degree of correlation. It can be implemented on specimens from ‘homologation sessions’ or groups of specimens from the same hunting day.
5. Conclusions
The present study validates the usefulness of CAD measurements taken from deer antler structures for assessing the degree of asymmetry in antler structure traits. The algorithm uses the same measurements used in the evaluation of hunting quality to estimate the values of antler asymmetry. The same measurements will allow for the estimation of two biomarkers. The input data for the analysis are the characterisation of the antler by means of a 3D CAD model represented by its axial structure. This is achieved by the spatial restitution of two photographs taken from different angles.
The implementation of the methodology is relatively fast; on the physical model of the antlers, it will only be necessary to make the calculation from the available measurements that were previously used to perform the evaluation of the hunting quality. For the definition of the 3D model of the antler, the time invested is somewhat longer due to the photogrammetric restitution and CAD modelling processes.
The asymmetry assessment study is carried out on an axial 3D model of the antler, obtained relatively quickly from two photographs. The different structural traits of the antler, the main beam, and the tines are spatially represented by its central axis. With these data, the asymmetries present in each of the structural traits are quantified by determining the metric divergence in each branch of the antler compared to the mean value. Therefore, it is not necessary to define a ‘solid’ 3D model for this type of analysis. The antlers were digitally characterised using an axial 3D model, allowing for analyses to be carried out in order to estimate the degree of asymmetry of deer specimens from ‘homologation sessions’ or in larger samples of specimens from ‘hunting days’.
The methodology presented here can also be implemented in asymmetry studies of other biological elements of animal or plant origin since the starting data, which are the bilateral axial structure of the geometric features under study, are relatively simple to obtain and digitally characterise in the form of a 3D model.
Author Contributions
J.M.M.-G.: Methodology, software, review and editing, and corresponding author. C.A.: Methodology, formal analysis, and review and editing. D.F.G.-M. and J.M.V.-Z.: software and data curation. M.Á.R.-P.: Methodology, review and editing, conceptualization, and project administration. All authors wrote the paper and reviewed it for final approval. All authors have read and agreed to the published version of the manuscript.
Funding
This study was carried out with the financial support of the ‘Fondo Europeo de Desarrollo Regional (FEDER), Consejería de Innovación, Ciencia y Empresa, Junta de Andalucía’ (Plan Andaluz de Investigación, Desarrollo e Innovación PAIDI2020), Research Group RNM175, and the project PID2022-1426610B-I00 granted by the ‘Ministerio de Ciencia e Innovación’, Spain.
Institutional Review Board Statement
All specimens used in this study came from authorized hunts during the official hunting season in the study area. Current regulations on animal protection and bioethics were complied with. This study complied with all Andalusian, Spanish, and European legal requirements and guidelines regarding experimentation and animal welfare. This study is developed by the ‘Animal Experimentation Ethics Committee’ of the ‘University of Jaén’ and is authorized by the ‘General Directorate of Agriculture and Livestock of the Department of Agriculture, Fisheries and Environment’ of the Regional Government of Andalucía (Junta de Andalucía). No special permits from the bioethics committees were required. The datasets and specimens of the current study, stored at the University of Jaén, may be available upon reasonable request to the corresponding author and the head of the Research Group PAI-RNM-175 and Vertebrate Laboratory.
Data Availability Statement
The data supporting the findings of this study are available from the corresponding author upon request.
Acknowledgments
The authors would also like to thank the ‘Organismo Autónomo de Parques Nacionales, Ministerio de Medio Ambiente, Medio Rural y Marino’, Spain; the hunters; game wardens; and taxidermists (Enrique Rodríguez) for their support in providing the necessary materials and access to officially protected hunting grounds for this study.
Conflicts of Interest
The authors declare no conflicts of interest.
References
- Goss, R.J. Deer Antlers. Regeneration, Function, and Evolution. Science 1983, 24, 737–738. [Google Scholar] [CrossRef]
- Bubenik, G.A.; Bubenik, A.B. Horns, Pronghorns, and Antlers Evolution, Morphology, Physiology, and Social Significance; Springer Inc.: New York, NY, USA, 1990. [Google Scholar] [CrossRef]
- Geist, V. Deer of the World: Their Evolution, Behaviour, and Ecology. In Stackpole Books; Swan Hill Press: Shrewsbury, UK, 1998. [Google Scholar]
- Baxter, B.J.; Andrews, R.N.; Barrell, G.K. Bone turnover associated with antler growth in red deer (Cervus elaphus). Anat. Rec. 1999, 256, 14–19. [Google Scholar] [CrossRef]
- Clements, M.N.; Clutton-Brock, T.H.; Albon, S.D.; Pemberton, J.M.; Kruuk, L.E.B. Getting the timing right: Antler growth phenology and sexual selection in a wild red deer population. Oecologia 2010, 164, 357–368. [Google Scholar] [CrossRef]
- Gómez, J.A.; Pérez-Barbería, J.; García, A.J.; Cappelli, J.; Chonco, L.; Ceacero, F.; Pérez-Serrano, M.; Landete-Castillejos, T. Factors affecting antler growth period and casting date in red deer. J. Mammal. 2022, 103, 169–177. [Google Scholar] [CrossRef]
- Azorit, C.; Analla, M.; Carrasco, R.; Muñoz-Cobo, J. Influence of age and environment on antler traits in spanish red deer (Cervus elaphus hispanicus). Eur. J. Wildl. Res. 2002, 48, 137–144. [Google Scholar] [CrossRef]
- Ludwig, W. Das RechtseLinks Problem im Tierreich und beim Menschen; Springer: Berlin, Germany, 1932. [Google Scholar]
- Van Valen, L. A study of fluctuating asymmetry. Evolution 1962, 16, 125–142. [Google Scholar] [CrossRef]
- Valentine, D.W.; Soulé, M.E.; Samallow, P. Asymmetry analysis in fishes: A possible statistical indicator of environmental stress. Enviromental Sci. 1973, 71, 350–373. [Google Scholar]
- Govind, C.K.; Pearce, J. Differential reflex activity determines claw and closer muscle asymmetry in developing lobsters. Science 1986, 233, 354–356. [Google Scholar] [CrossRef] [PubMed]
- Møller, A.P. Patterns of fluctuating asymmetry in weapons: Evidence for reliable signalling of quality in beetle horns and bird spurs. Proc. R. Soc. B Biol. Sci. 1992, 248, 199–206. [Google Scholar] [CrossRef]
- Romero, A.N.; Dickinson, E.; Turcotte, C.M.; Terhune, C.E. Skeletal age during hurricane impacts fluctuating asymmetry in Cayo Santiago rhesus macaques. Ecol. Evol. 2023, 13, e10425. [Google Scholar] [CrossRef]
- Solberg, E.J.; Saether, B.E. Fluctuating asymmetry in the antlers of moose (Alces alces): Does it signal male quality? Proc. R. Soc. B Biol. Sci. 1993, 254, 251–255. [Google Scholar] [CrossRef]
- Putman, R.J.; Sullivan, M.S.; Langbein, J. Fluctuating asymmetry in antlers of fallow deer (Dama dama): The relative roles of environmental stress and sexual selection. Biol. J. Linn. Soc. 2000, 70, 27–36. [Google Scholar] [CrossRef][Green Version]
- Stenström, D. Mating Behaviour and Sexual Selection in Nonleckking Fallow Deer (Dama dama). Ph.D. Thesis, University of Uppsala, Uppsala, Sweden, 1998. [Google Scholar]
- Jennings, D.J.; Gammell, M.P. Fluctuating asymmetry of fallow deer antlers is associated with weapon damage but not tactical behaviour during fights. Symmetry 2023, 15, 829. [Google Scholar] [CrossRef]
- Markusson, E.; Folstad, I. Reindeer antlers: Visual indicators of individual quality? Oecologia 1997, 110, 501–507. [Google Scholar] [CrossRef] [PubMed]
- Chirichella, R.; Rocca, M.; Brugnoli, A.; Mustoni, A.; Apollonio, M. Fluctuating asymmetry in Alpine chamois horns: An indicator of environmental stress. Evol. Ecol. 2020, 34, 573–587. [Google Scholar] [CrossRef]
- Mateos, C.; Alarcos, S.; Carranza, J.; Sánchez-Prieto, C.B.; Valencia, J. Fluctuating asymmetry of red deer antlers negatively relates to individual condition and proximity to prime age. Anim. Behav. 2008, 75, 1629–1640. [Google Scholar] [CrossRef]
- Pélabon, C.; Van Breukelen, L. Asymmetry in antler size in roe deer (Capreolus capreolus): An index of individual and population conditions. Oecologia 1998, 116, 1–8. [Google Scholar] [CrossRef] [PubMed]
- Clarke, G.M. Relationships between developmental stability and fitness: Application for conservation biology. Conserv. Biol. 1995, 9, 18–24. [Google Scholar] [CrossRef]
- Møller, A.P. Developmental stability and fitness: A review. Am. Nat. 1997, 149, 916–932. [Google Scholar] [CrossRef]
- Ditchkoff, S.S.; Lochmiller, R.L.; Masters, R.E.; Starry, W.R.; Leslie, D.M., Jr. Does fluctuating asymmetry of antlers in white-tailed deer (Odoicoleus virginianus) follow patterns predicted for sexually selected traits? Biol. Sci. 2001, 268, 891–898. [Google Scholar] [CrossRef]
- Palmer, A.R.; Strobeck, C. Fluctuating asymmetry analyses revisited. In Developmental Instability: Causes and Consequences; Oxford University Press: Oxford, UK, 2003. [Google Scholar] [CrossRef]
- Van Dongen, S. Fluctuating asymmetry and developmental instability in evolutionary biology: Past, present and future. J. Evol. Biol. 2006, 19, 1727–1743. [Google Scholar] [CrossRef] [PubMed]
- Azorit, C.; Analla, M.; Carrasco, R.; Carrasco, A.; Muñoz-Cobo, J. Astas, esqueleto y edad del ciervo (Cervus elaphus hispanicus) de Sierra Morena oriental: Estudio de correlación. An. De Biol. 2002, 24, 195–200. Available online: https://revistas.um.es/analesbio/article/view/31641 (accessed on 16 June 2024).
- Kruuk, L.E.B.; Slate, J.; Pemberton, J.M.; Clutton-Brock, T.H. Fluctuating asymmetry in a secondary sexual trait: No associations with individual fitness, environmental stress or inbreeding, and no heritability. J. Evol. Biol. 2003, 16, 101–113. [Google Scholar] [CrossRef] [PubMed]
- Palmer, A.R. Detecting publication bias in meta-analyses: A case study fluctuating asymmetry and sexual selection. Am. Nat. 1999, 154, 220–233. [Google Scholar] [CrossRef] [PubMed]
- Björklund, M.; Merilä, J. Why some measures of fluctuating asymmetry are so sensitive to measurement error. Ann. Zool. Fenn. 1997, 34, 133–137. Available online: https://www.jstor.org/stable/23735689 (accessed on 16 June 2024).
- Van Dongen, S.; Molenberghs, G.; Matthysen, E. The statistical analysis of fluctuating asymmetry: REML estimation of a mixed regression model. J. Evol. Biol. 1999, 12, 94–102. [Google Scholar] [CrossRef]
- Kruuk, L.E.B.; Slate, J.; Pemberton, J.M.; Broherstone, S.; Guinness, F.; Clutton-Brock, T. Antler size in red deer: Heritability and selection but no evolution. Evolution 2002, 56, 1683–1695. [Google Scholar] [CrossRef] [PubMed]
- Bartos, L.; Bahbouh, R. Antler size and fluctuating asymmetry in red deer (Cervus elaphus) stags and probability of becoming a harem holder in rut. Biol. J. Linn. Soc. 2006, 87, 59–68. [Google Scholar] [CrossRef]
- Krapinec, K.; Jumić, V.; Balekić, M.; Lolić, N.; Putnik, R.; Florijančić, T.; Ozimec, S.; Bošković, I. The reliability of fluctuating asymmetry in population estimation: The case of feedlot red deer. Symmetry 2022, 14, 2092. [Google Scholar] [CrossRef]
- Bartoš, L.; Bahbouh, R.; Vach, M. Repeatability of size and fluctuating asymmetry of antler characteristics in red deer (Cervus elaphus) during ontogeny. Biol. J. Linn. Soc. 2007, 91, 215–226. [Google Scholar] [CrossRef]
- Baker, K.H.; Hoelzel, A.R. Fluctuating asymmetry in populations of british roe deer (Capreolus capreolus) following historical bottlenecks and founder events. Mamm. Biol. 2013, 78, 387–391. [Google Scholar] [CrossRef]
- Bowyer, R.T.; Stewart, K.M.; Kie, J.G.; Gasaway, W. Fluctuating asymmetry in antlers of alaskan moose: Size maters. J. Mammal. 2001, 82, 814–824. [Google Scholar] [CrossRef]
- Ditchkoff, S.S.; Defreese, R.L. Assessing fluctuating asymmetry of white-tailed deer antlers in a three-dimensional context. J. Mammal. 2010, 91, 27–37. [Google Scholar] [CrossRef]
- Tsuboi, M.M.; Kopperud, B.T.; Syrowatka, C.; Grabowski, M.; Voje, K.; Pélabon, C.; Hansen, T.F. Measuring complex morphological traits with 3D photogrammetry: A case study with deer antlers. Evol. Biol. 2020, 47, 175–186. [Google Scholar] [CrossRef]
- Montalvo-Gil, J.M.; Azorit, C.; Valderrama-Zafra, J.M.; Rubio-Paramio, M.A. A new method for quantifying the asymmetry of biological elements by means of a photogrammetric technique using a parametric computer-aided design system. Symmetry 2022, 14, 2296. [Google Scholar] [CrossRef]
- Llanes-Borrero, L. Manual de Homologación de Trofeos de Caza Mayor en España; Lucas Llanes Borrero: Madrid, Spain, 2013. [Google Scholar]
- Rubio-Paramio, M.A.; Montalvo-Gil, J.M.; Ramírez-Garrido, J.A.; Martínez-Salmerón, D.; Azorit, C. An interactive photogrammetric method for assessing deer antler quality using a parametric Computer-Aided Design system (Interactive Photogrammetric Measure Method). Biosyst. Eng. 2016, 150, 54–68. [Google Scholar] [CrossRef]
- Schoenebeck, C.W.; Peterson, B.C. Evaluation of hunters antler-size selection through an age-specific comparison of harvested and naturally cast antler metrics. J. Fish Wildl. Manag. 2014, 5, 167–173. [Google Scholar] [CrossRef]
- Mills, K.J.; Peterson, R.O. Moose morphology and asymmetry on Isle Royale National Park. Alces 2013, 49, 17–28. Available online: https://alcesjournal.org/index.php/alces/article/view/106 (accessed on 16 June 2024).
- Venegas, C.; Varas, V.; Vásquez, J.P.; Marín, J.C. Non-invasive genetic sampling of deer: A method for DNA extraction and genetic analysis from antlers. Gayana 2020, 84, 75–82. [Google Scholar] [CrossRef]
- Rubio-Paramio, M.A.; Muñoz-Cobo, J.; Moro, J.; Gutiérrez, R.; Oya, A.; Tellado, S.; Azorit, C. Assessing red deer antler density with a hydrostatic method versus a new parametric volume-modelling technique using 3D-CAD. Anim. Prod. Sci. 2012, 52, 750–755. [Google Scholar] [CrossRef]


Disclaimer/Publisher’s Note: The statements, opinions and data contained in all publications are solely those of the individual author(s) and contributor(s) and not of MDPI and/or the editor(s). MDPI and/or the editor(s) disclaim responsibility for any injury to people or property resulting from any ideas, methods, instructions or products referred to in the content. |
© 2024 by the authors. Licensee MDPI, Basel, Switzerland. This article is an open access article distributed under the terms and conditions of the Creative Commons Attribution (CC BY) license (https://creativecommons.org/licenses/by/4.0/).