
Healthcare Supply Chain Resilience Investment Strategy Analysis Based on Evolutionary Game

Abstract
:1. Introduction
2. Literature Review
2.1. Healthcare Supply Chain
2.2. Healthcare Supply Chain Resilience
3. Evolutionary Modeling and Analysis of Stabilization Strategies
3.1. Healthcare Supply Chain Non-Disruption Scenario
3.1.1. Basic Hypothesis
3.1.2. Evolutionary Stabilization Strategy Analysis
- When , the . At this time, for any value, any probability of the MSM “resilience investment” strategy is an evolutionarily stable strategy; the probability of the system choosing the MSM’s resilience investment will not change over time, and the system is in an evolutionarily stable state.
- When , the . At this time, , , is the evolutionary stabilization point. The costs to the MSM of choosing the resilience investment outweigh the additional benefits of the resilience investment. Therefore, the “resilience non-investment” strategy is the preferred strategy for the MSM.
- When , the . At this time, , , is the evolutionary stabilization point. This indicates that the benefits of investing in resilience outweigh the costs, so the “resilience investment strategy” should be the priority for the MSM.
- 4.
- When , the . At this time, for any value, any probability of the MSR “resilience investment strategy” is an evolutionarily stable strategy, the probability of the system choosing the MSR’s resilience investment will not change over time, and the system is in an evolutionarily stable state.
- 5.
- If , then and is an increasing function on .
- (1)
- When , the . At this time, , , is the evolutionary stabilization point. The costs to the MSR of choosing the resilience investment outweigh the additional benefits of the resilience investment. Therefore, the “resilience non-investment strategy” is the preferred strategy for the MSR.
- (2)
- When , the . At this time, , , is the evolutionary stabilization point. This indicates that the benefits of investing in resilience outweigh the costs, so the “resilience investment strategy” should be the priority for the MSR.
- 6.
- If , then and is a decreasing function on .
- (1)
- When , . At this time, , , is the evolutionary stabilization point. This indicates that the benefits of investing in resilience outweigh the costs, so the “resilience investment strategy” should be the priority for the MSR.
- (2)
- When , . At this time, , , is the evolutionary stabilization point. The costs to the MSR of choosing the resilience investment outweigh the additional benefits of the resilience investment. Therefore, the “resilience non-investment strategy” is the preferred strategy for the MSR.
3.1.3. Equilibrium Point and Stability Analysis
3.2. Healthcare Supply Chain Disruption Scenario
3.2.1. Basic Hypothesis
3.2.2. Evolutionary Stabilization Strategy Analysis
- When , the . At this time, for any value, any probability of the MSM “resilience investment” strategy is an evolutionarily stable strategy; the probability of the system choosing the MSM’s resilience investment will not change over time, and the system is in an evolutionarily stable state.
- When , the . At this time, , , is the evolutionary stabilization point. The costs to the MSM of choosing the resilience investment outweigh the additional benefits of the resilience investment. Therefore, the “resilience non-investment” strategy is the preferred strategy for the MSM.
- When , the . At this time, , , is the evolutionary stabilization point. This indicates that the benefits of investing in resilience outweigh the costs, so the “resilience investment” strategy should be the priority for the MSM.
- 4.
- When , the . At this time, for any value, any probability of the MSR “resilience investment” strategy is an evolutionarily stable strategy; the probability of the system choosing the MSR’s resilience investment will not change over time, and the system is in an evolutionarily stable state.
- 5.
- When , the . At this time, , , is the evolutionary stabilization point. The costs to the MSR of choosing the resilience investment outweigh the additional benefits of the resilience investment. Therefore, the “resilience non-investment strategy” is the preferred strategy for the MSR.
- 6.
- When , the . At this time, and , is the evolutionary stabilization point. This indicates that the benefits of investing in resilience outweigh the costs, so the “resilience investment strategy” should be the priority for the MSR.
3.2.3. Equilibrium Point and Stability Analysis
4. Numerical Simulation Analysis
4.1. Numerical Simulation of Supply Chain Non-Disruption Scenarios
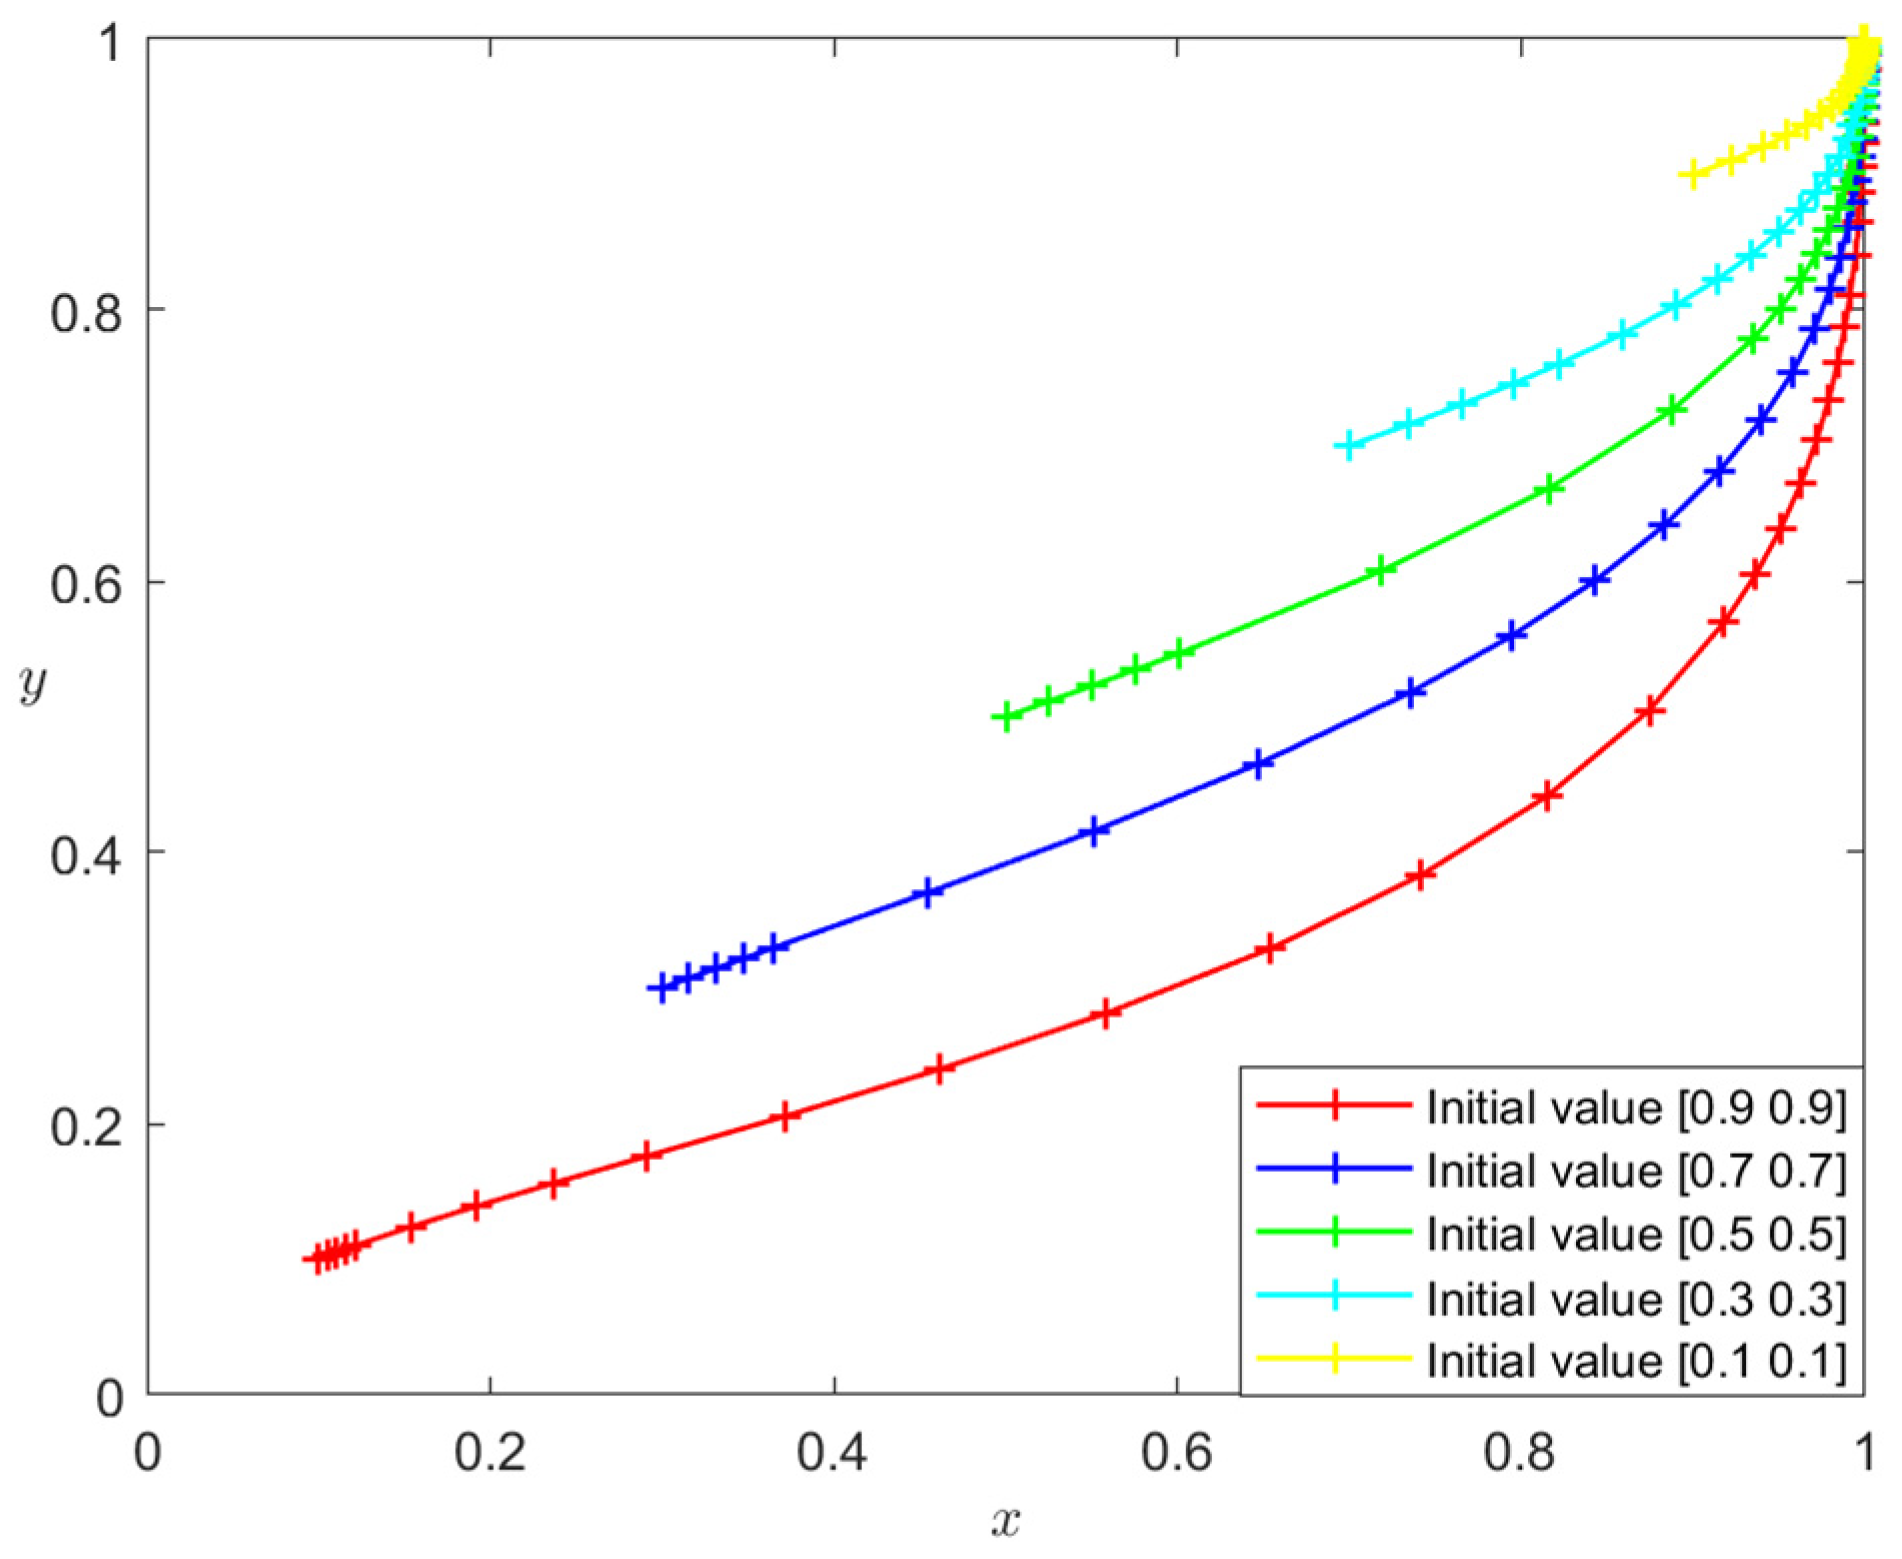
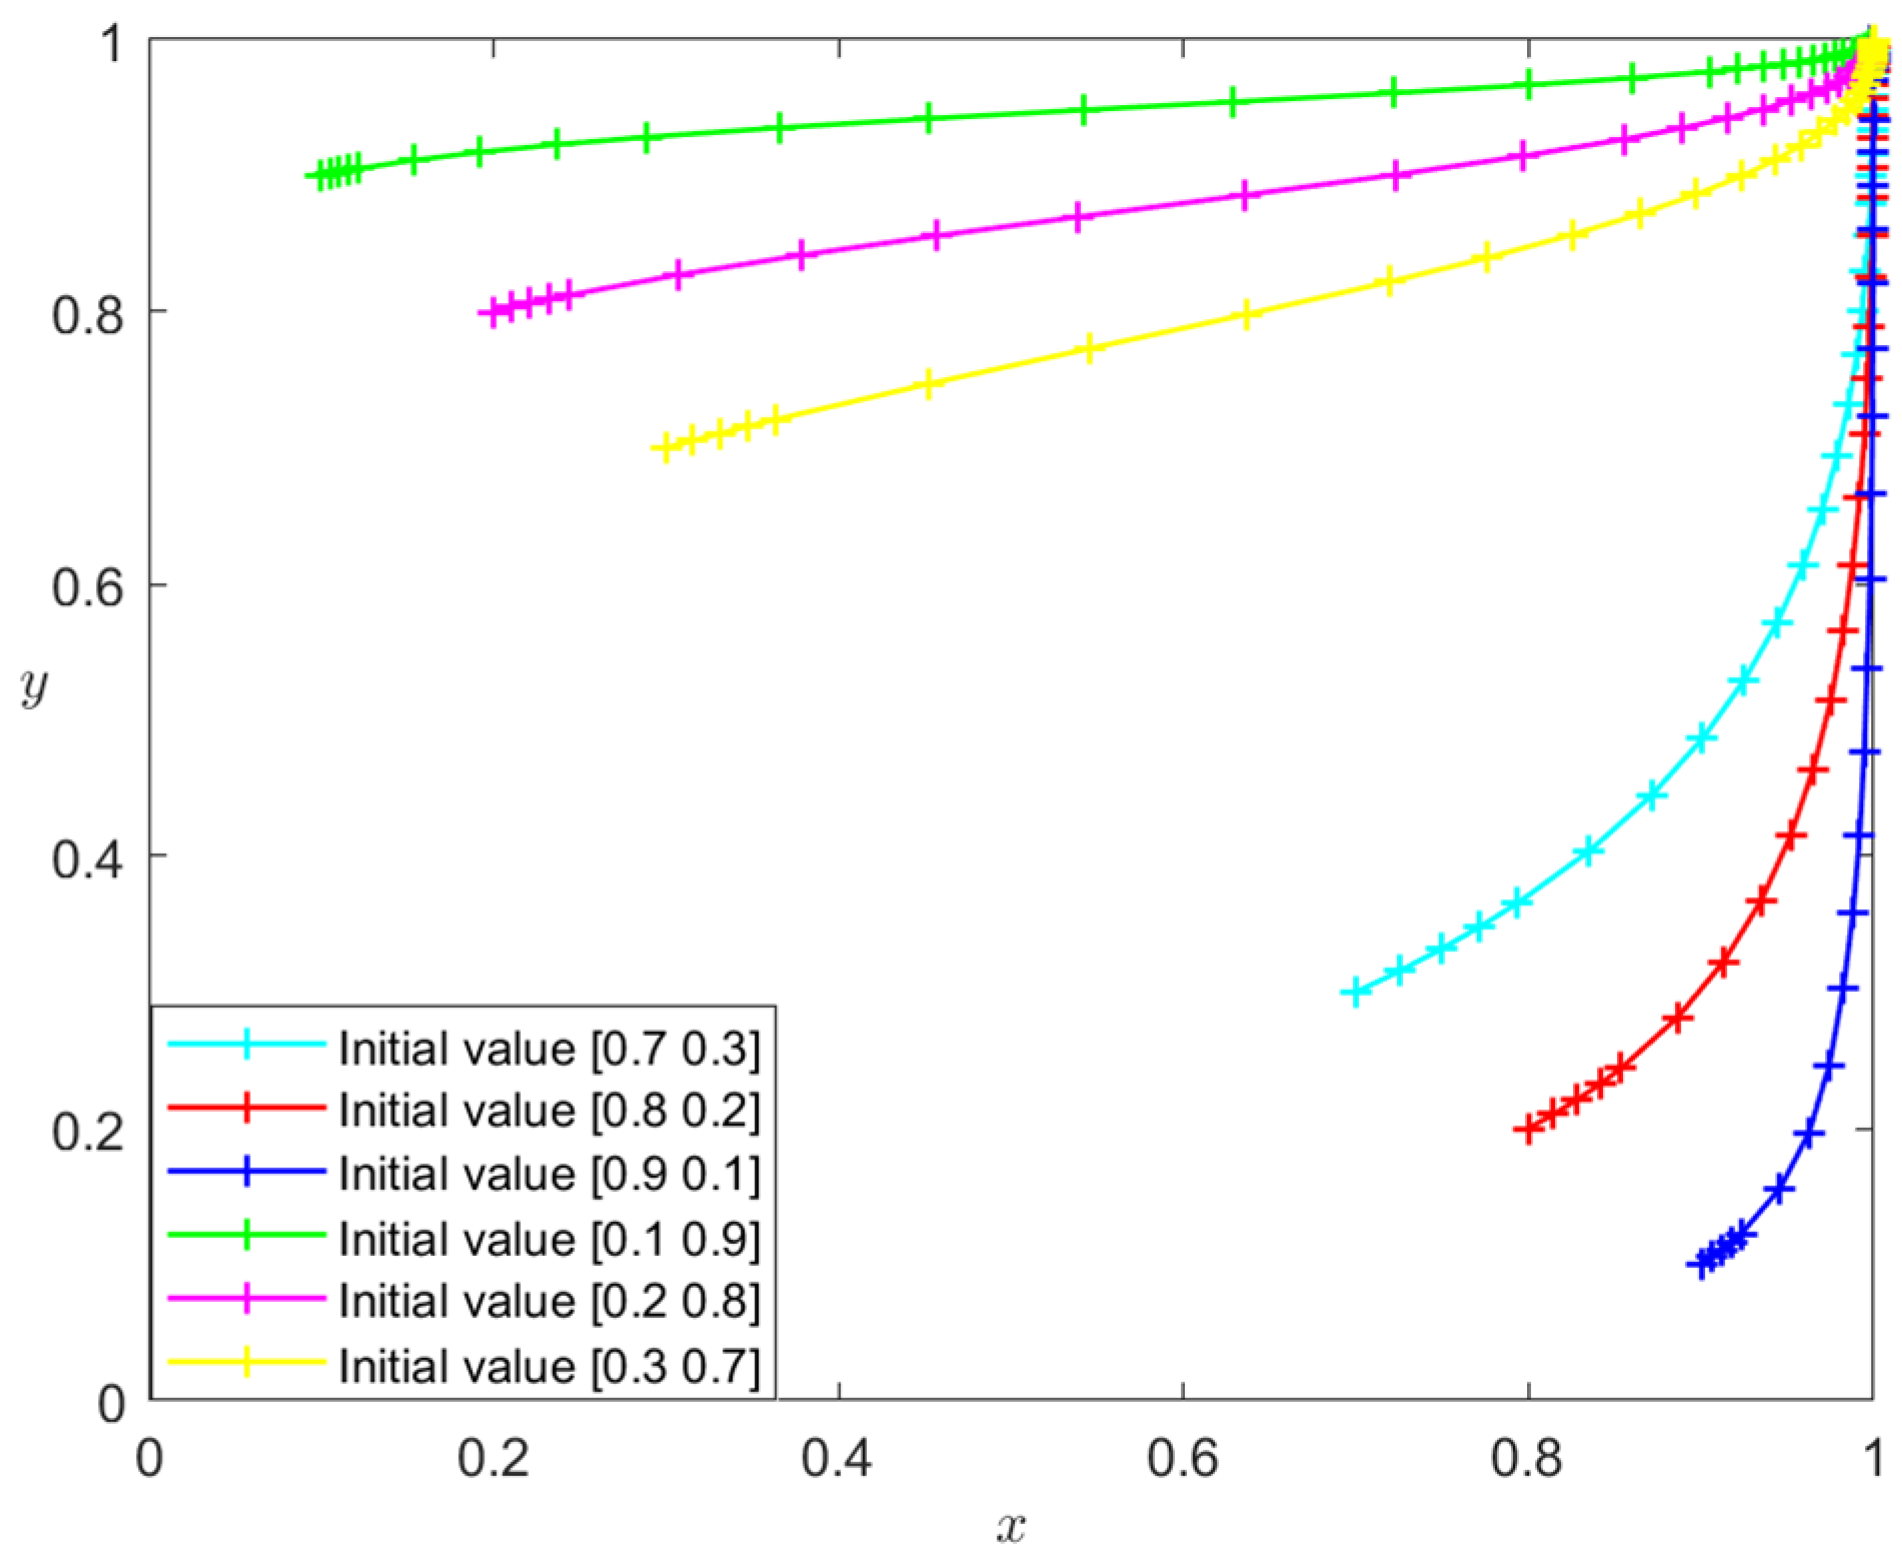
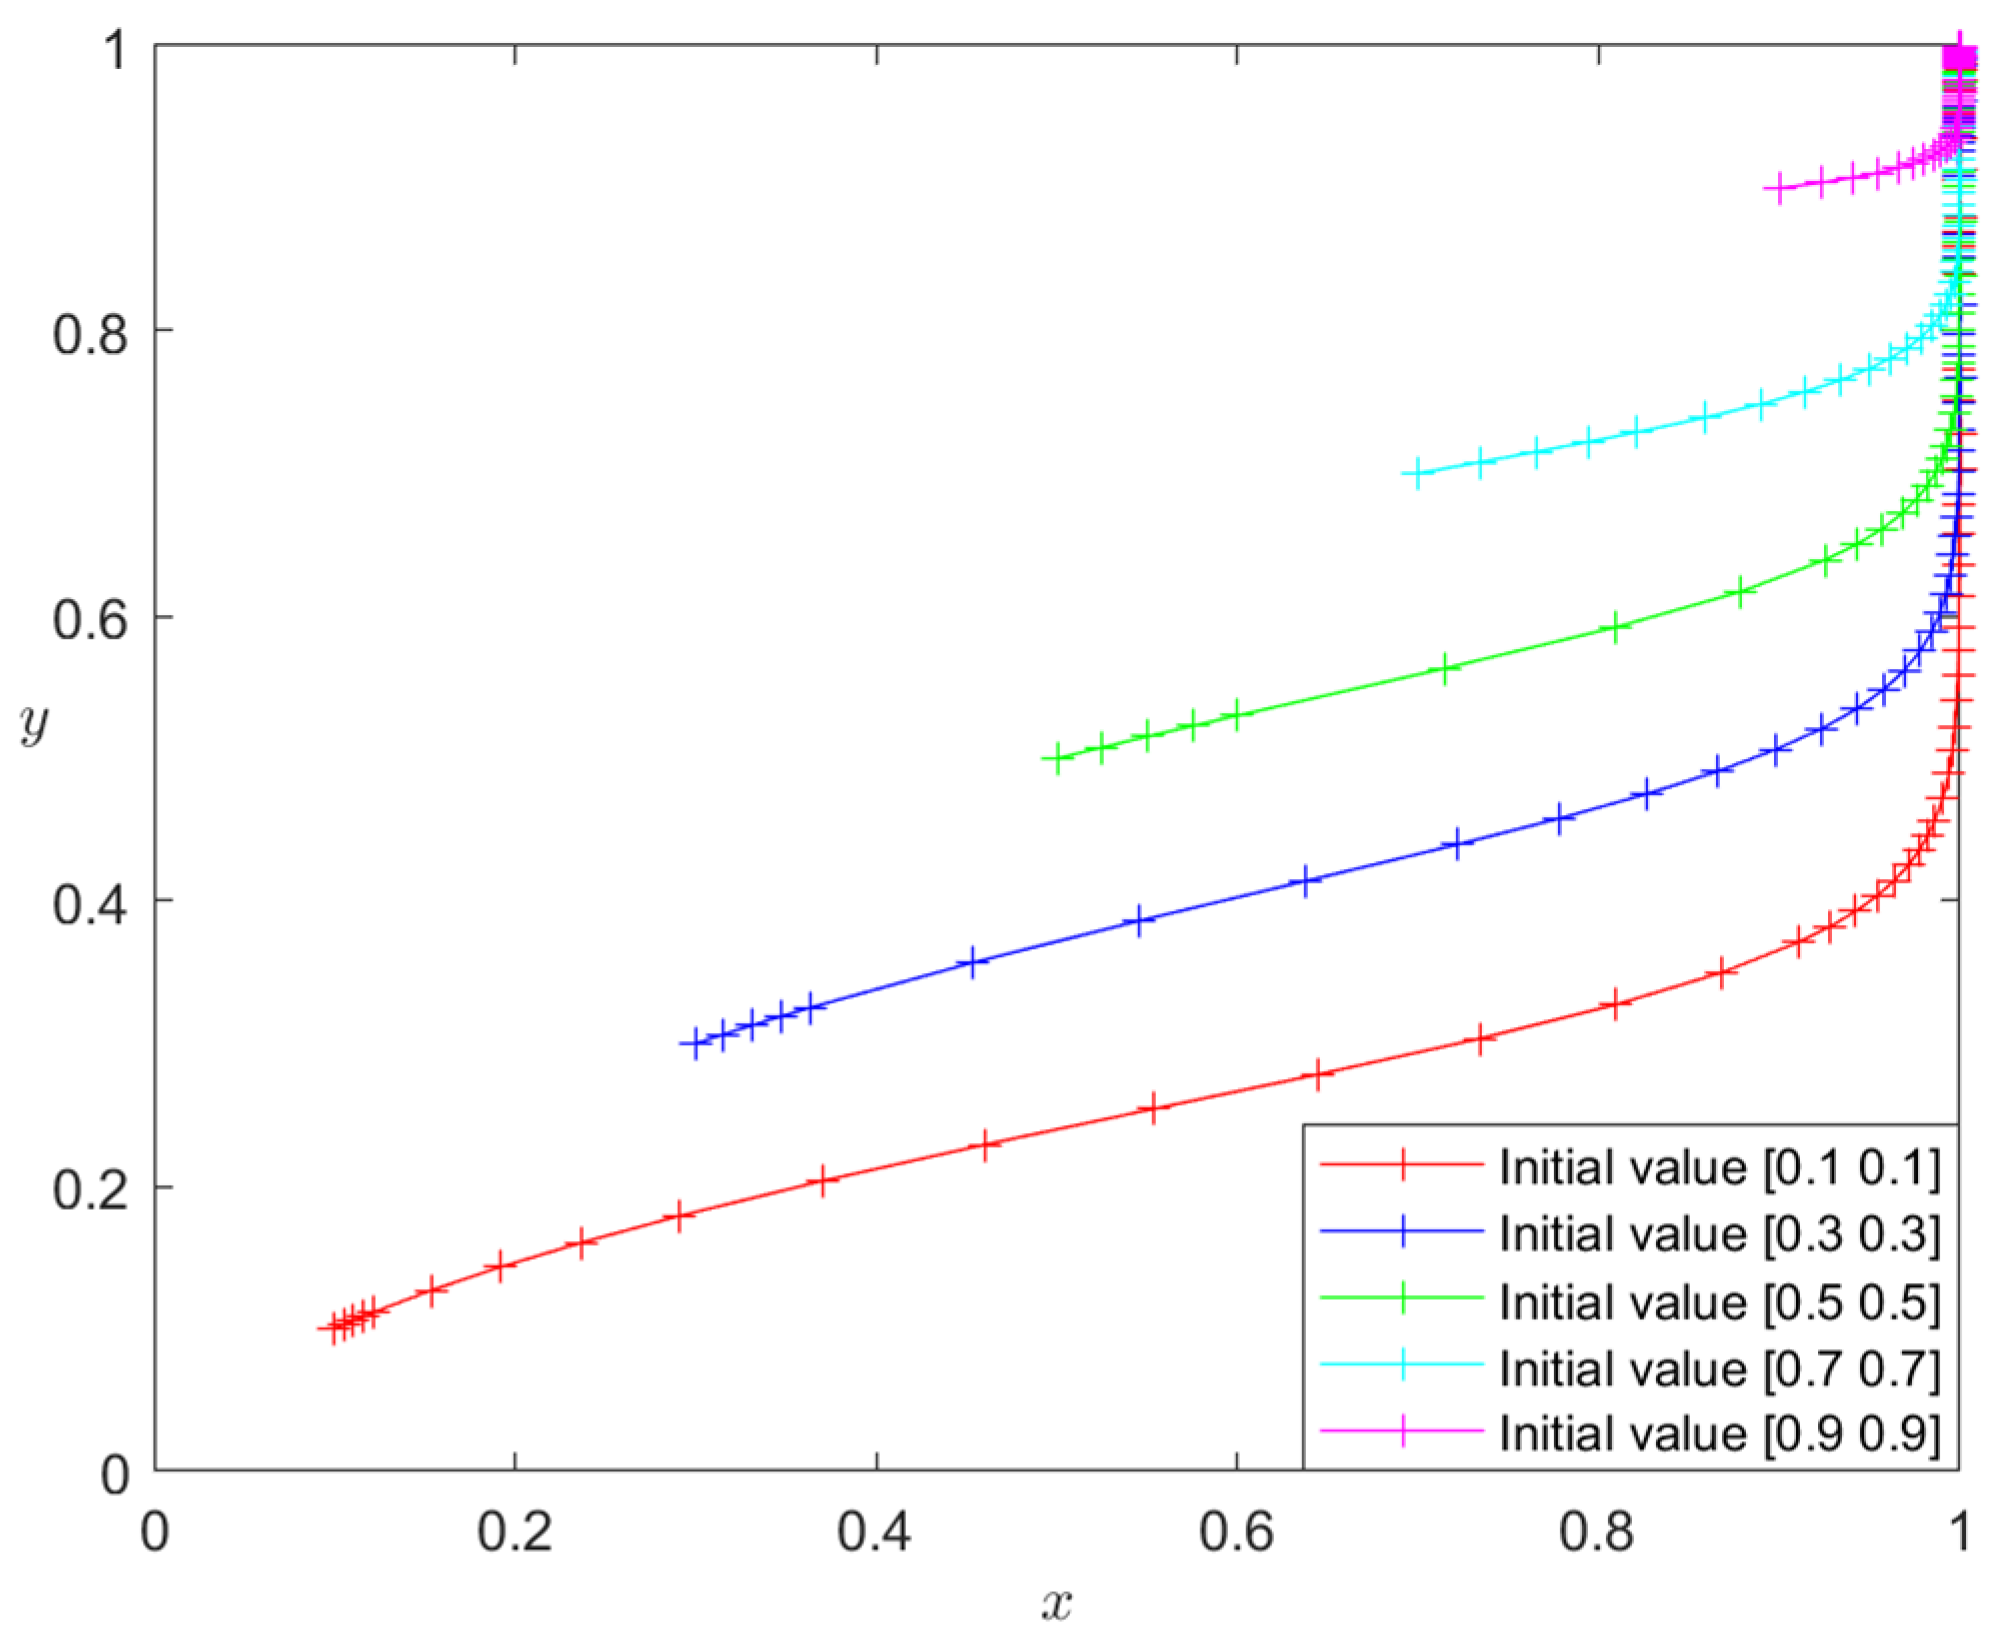
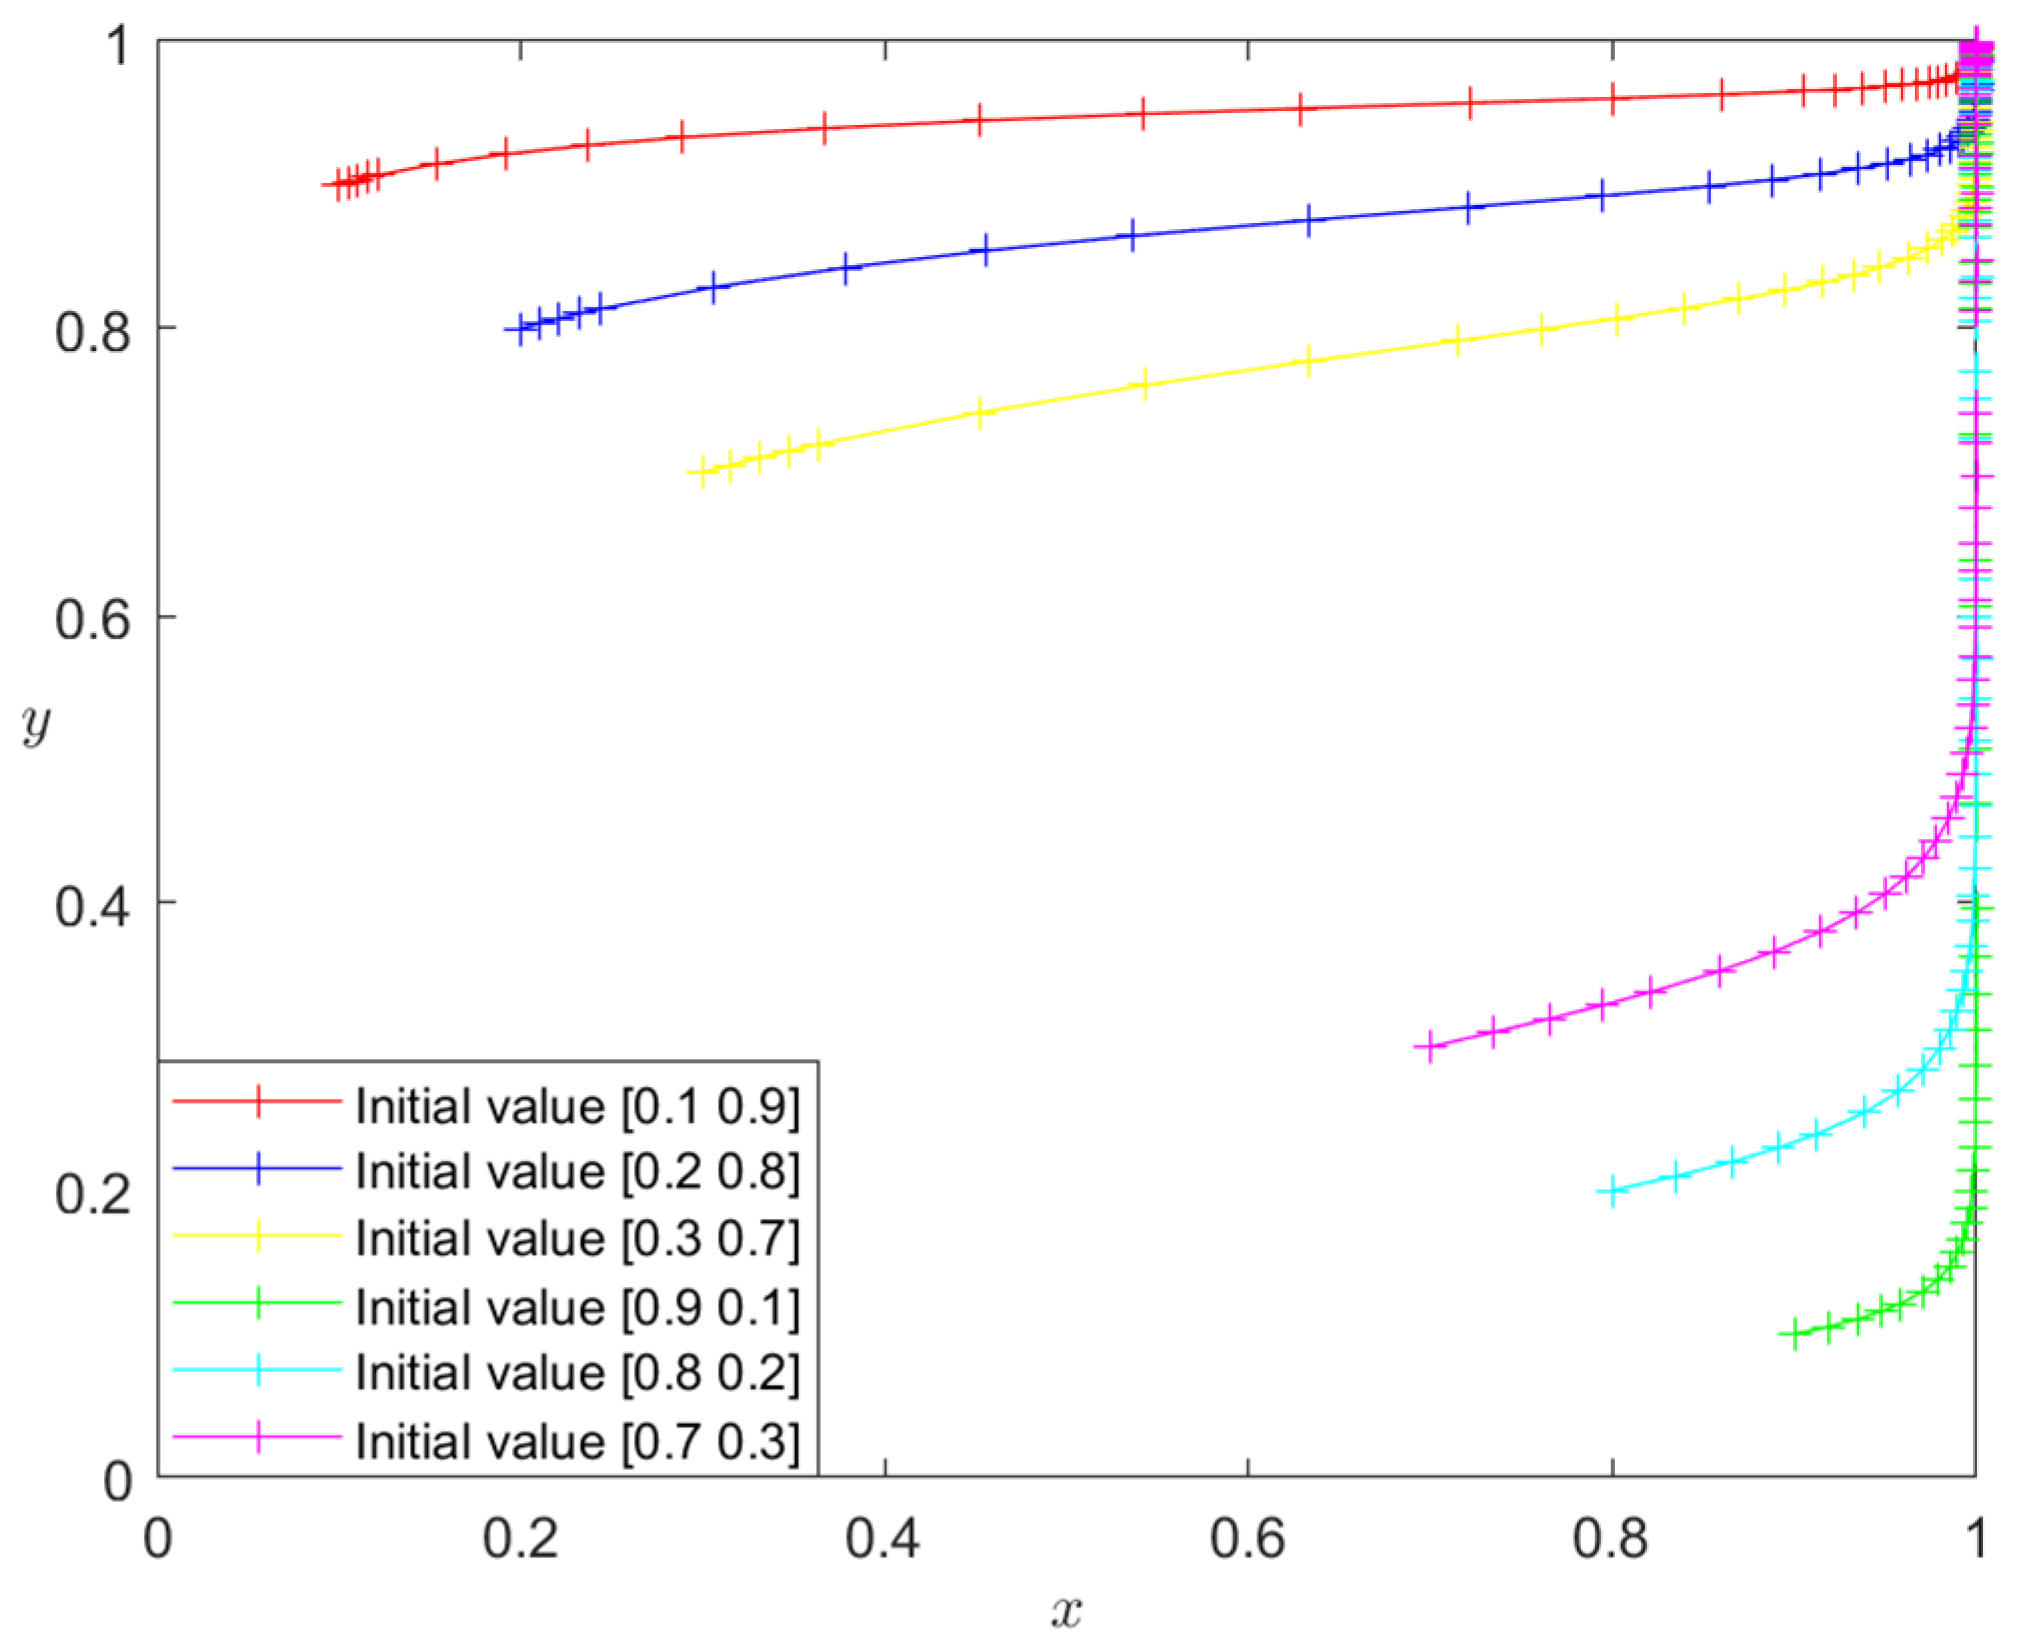
4.1.1. Initial State Simulation Analysis
4.1.2. Parametric Simulation Analysis
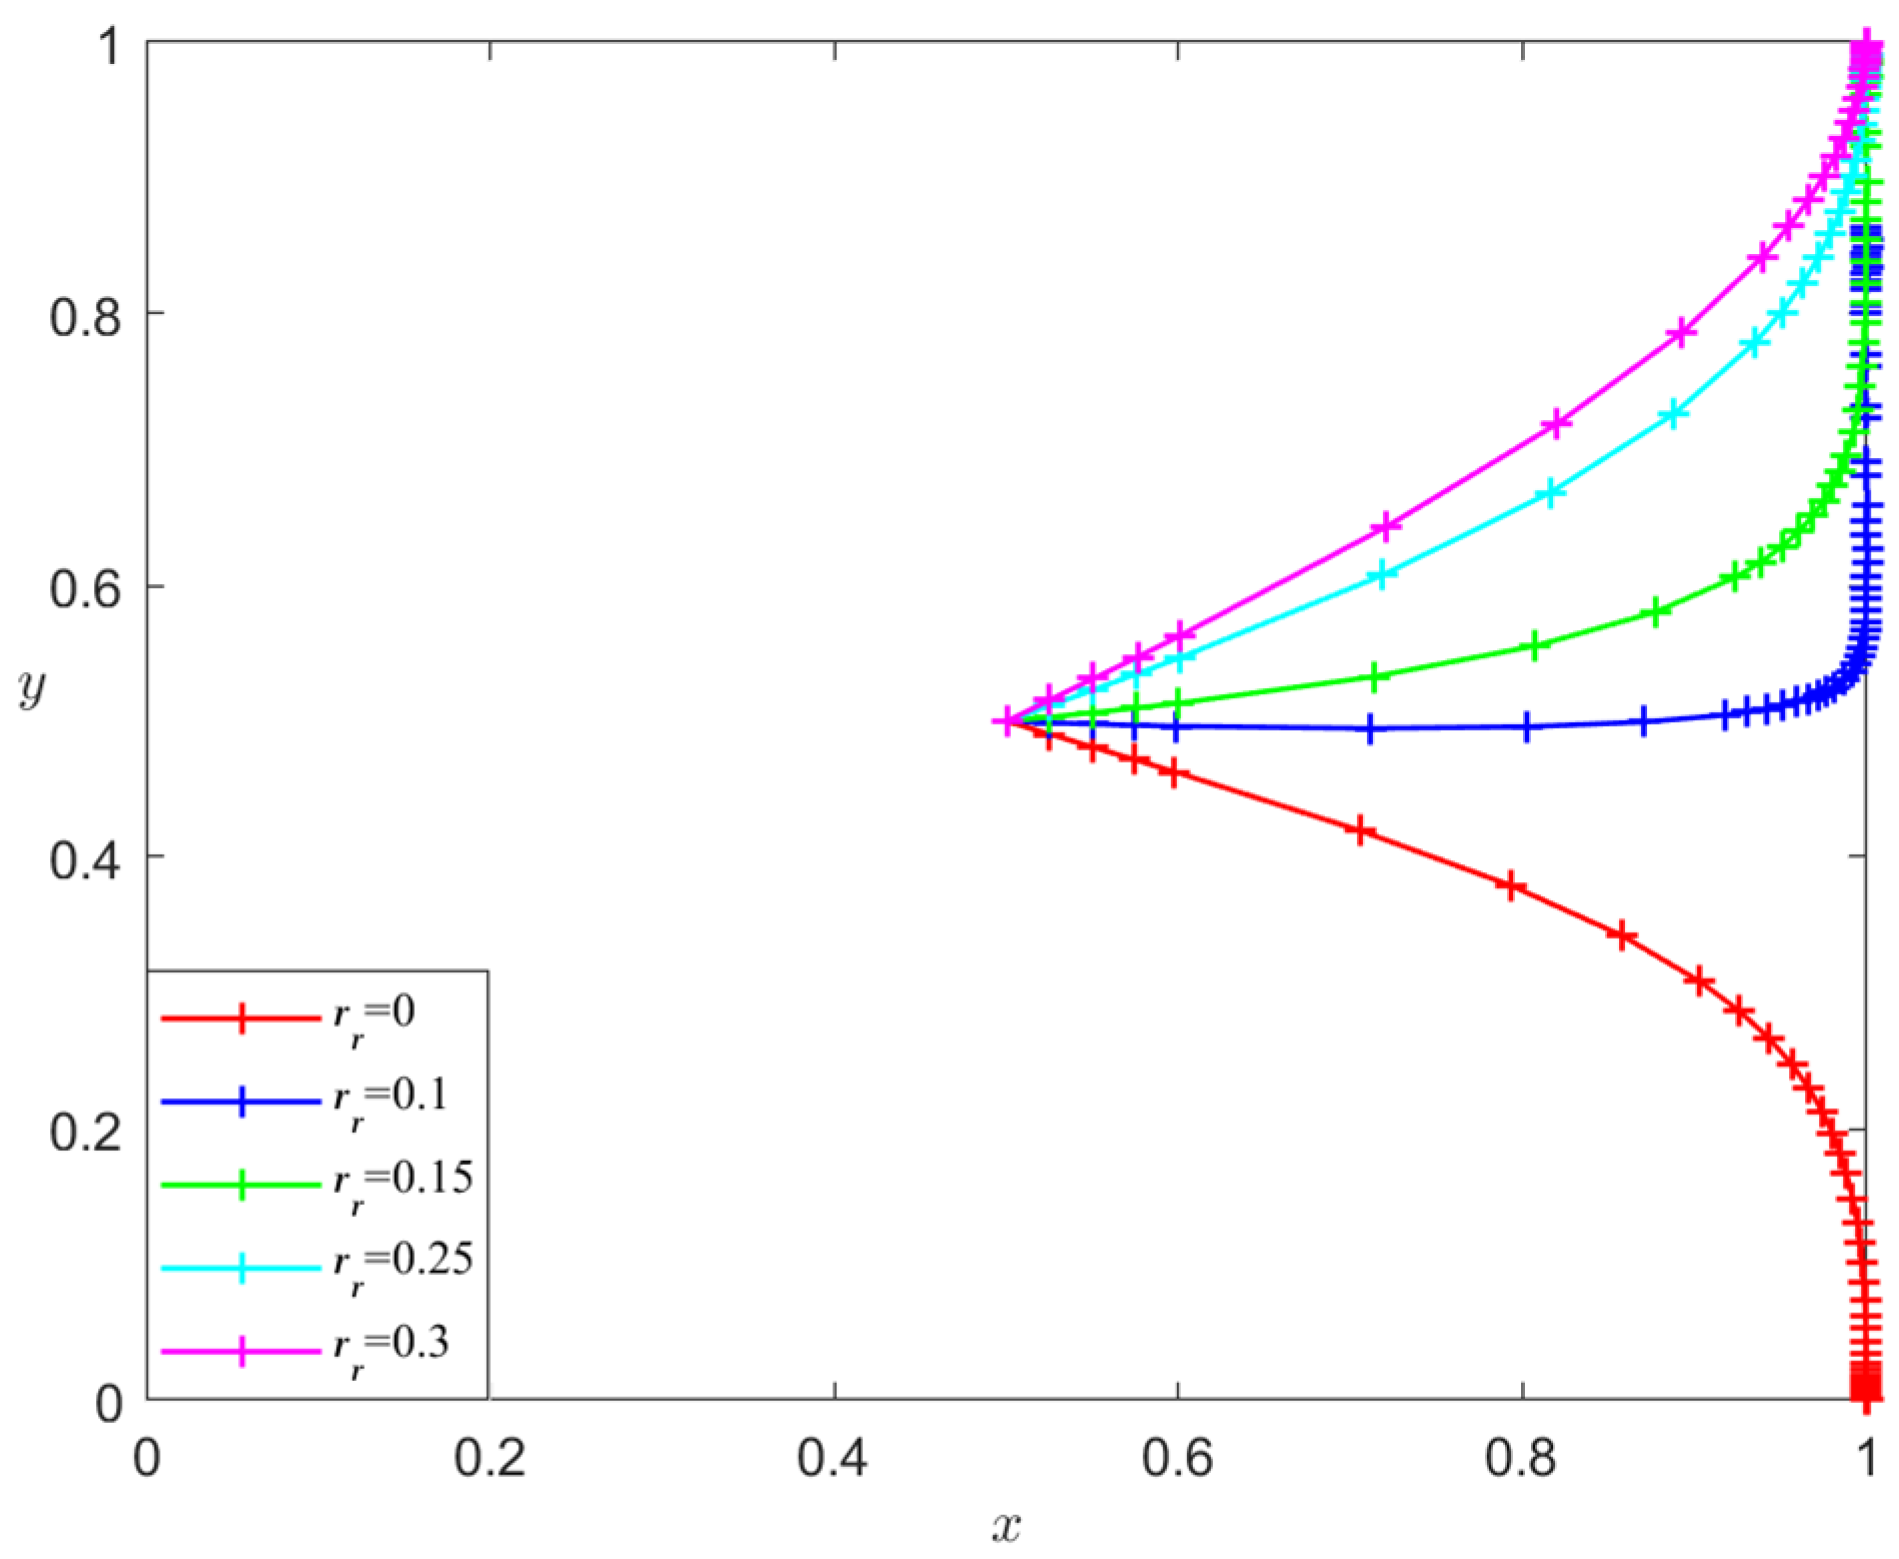
- Analysis of the influence of rm and rr on the evolutionary stability results
- 2.
- Analysis of the influence of θ on the evolutionary stability results
- 3.
- Analysis of the influence of a and b on the evolutionary stability results
- 4.
- Analysis of the influence of α and β on the evolutionary stability results
4.2. Numerical Simulation of Supply Chain Disruption Scenarios
4.2.1. Initial State Simulation Analysis
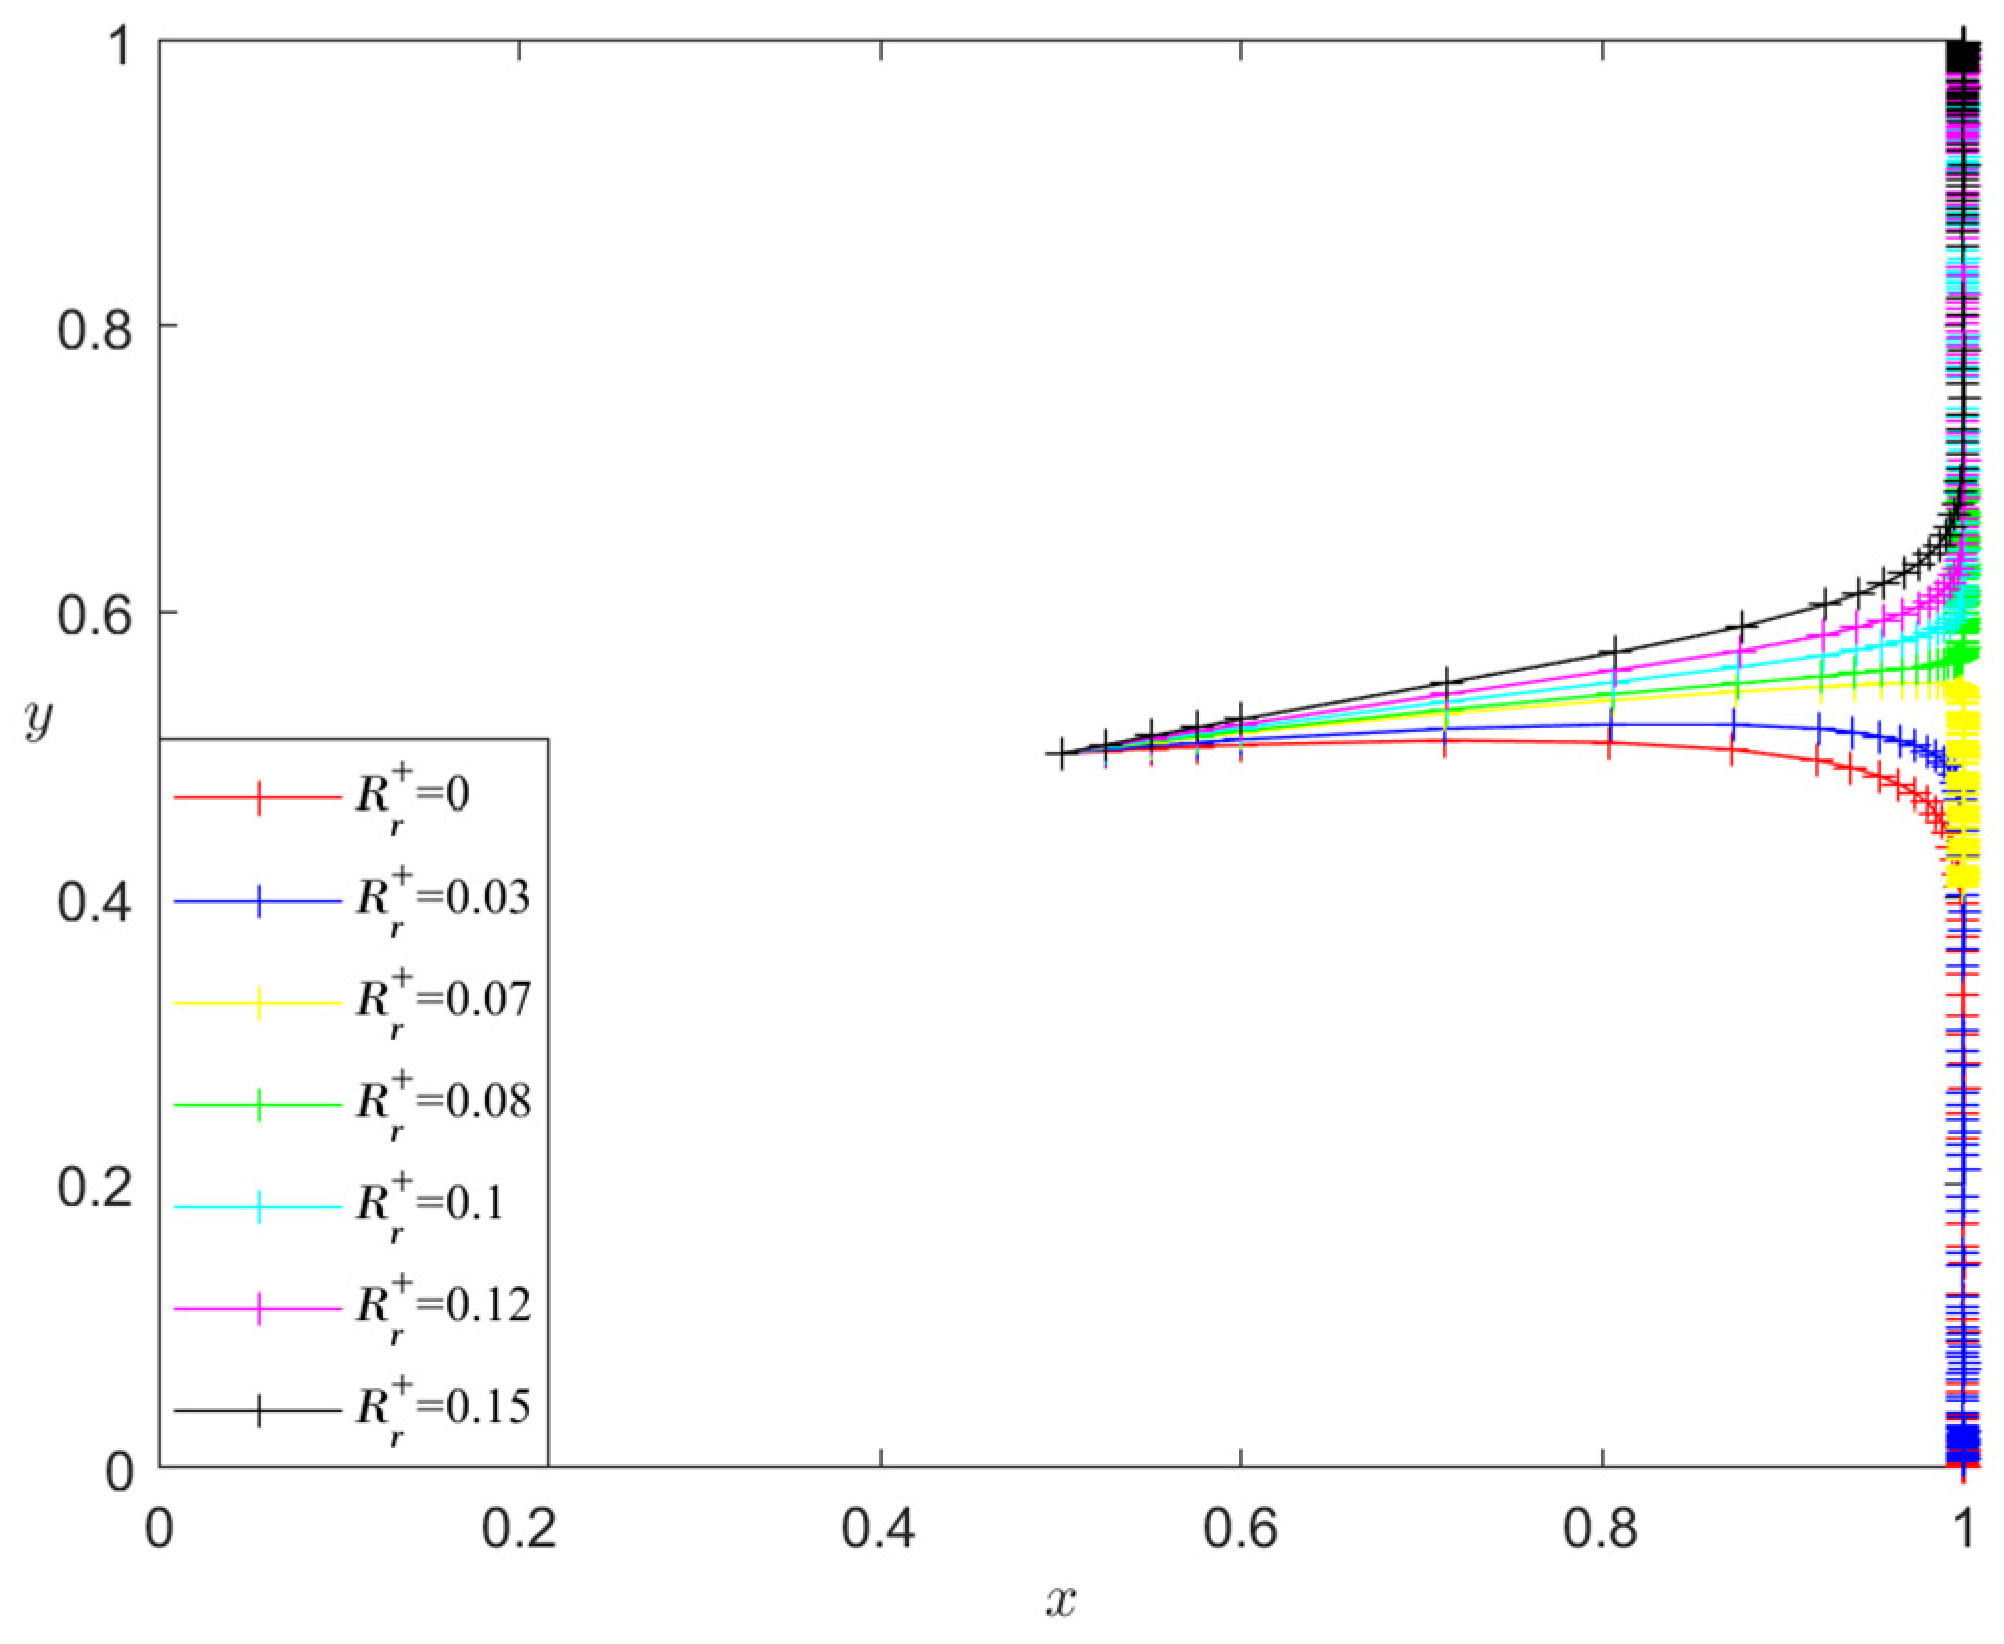
4.2.2. Parametric Simulation Analysis
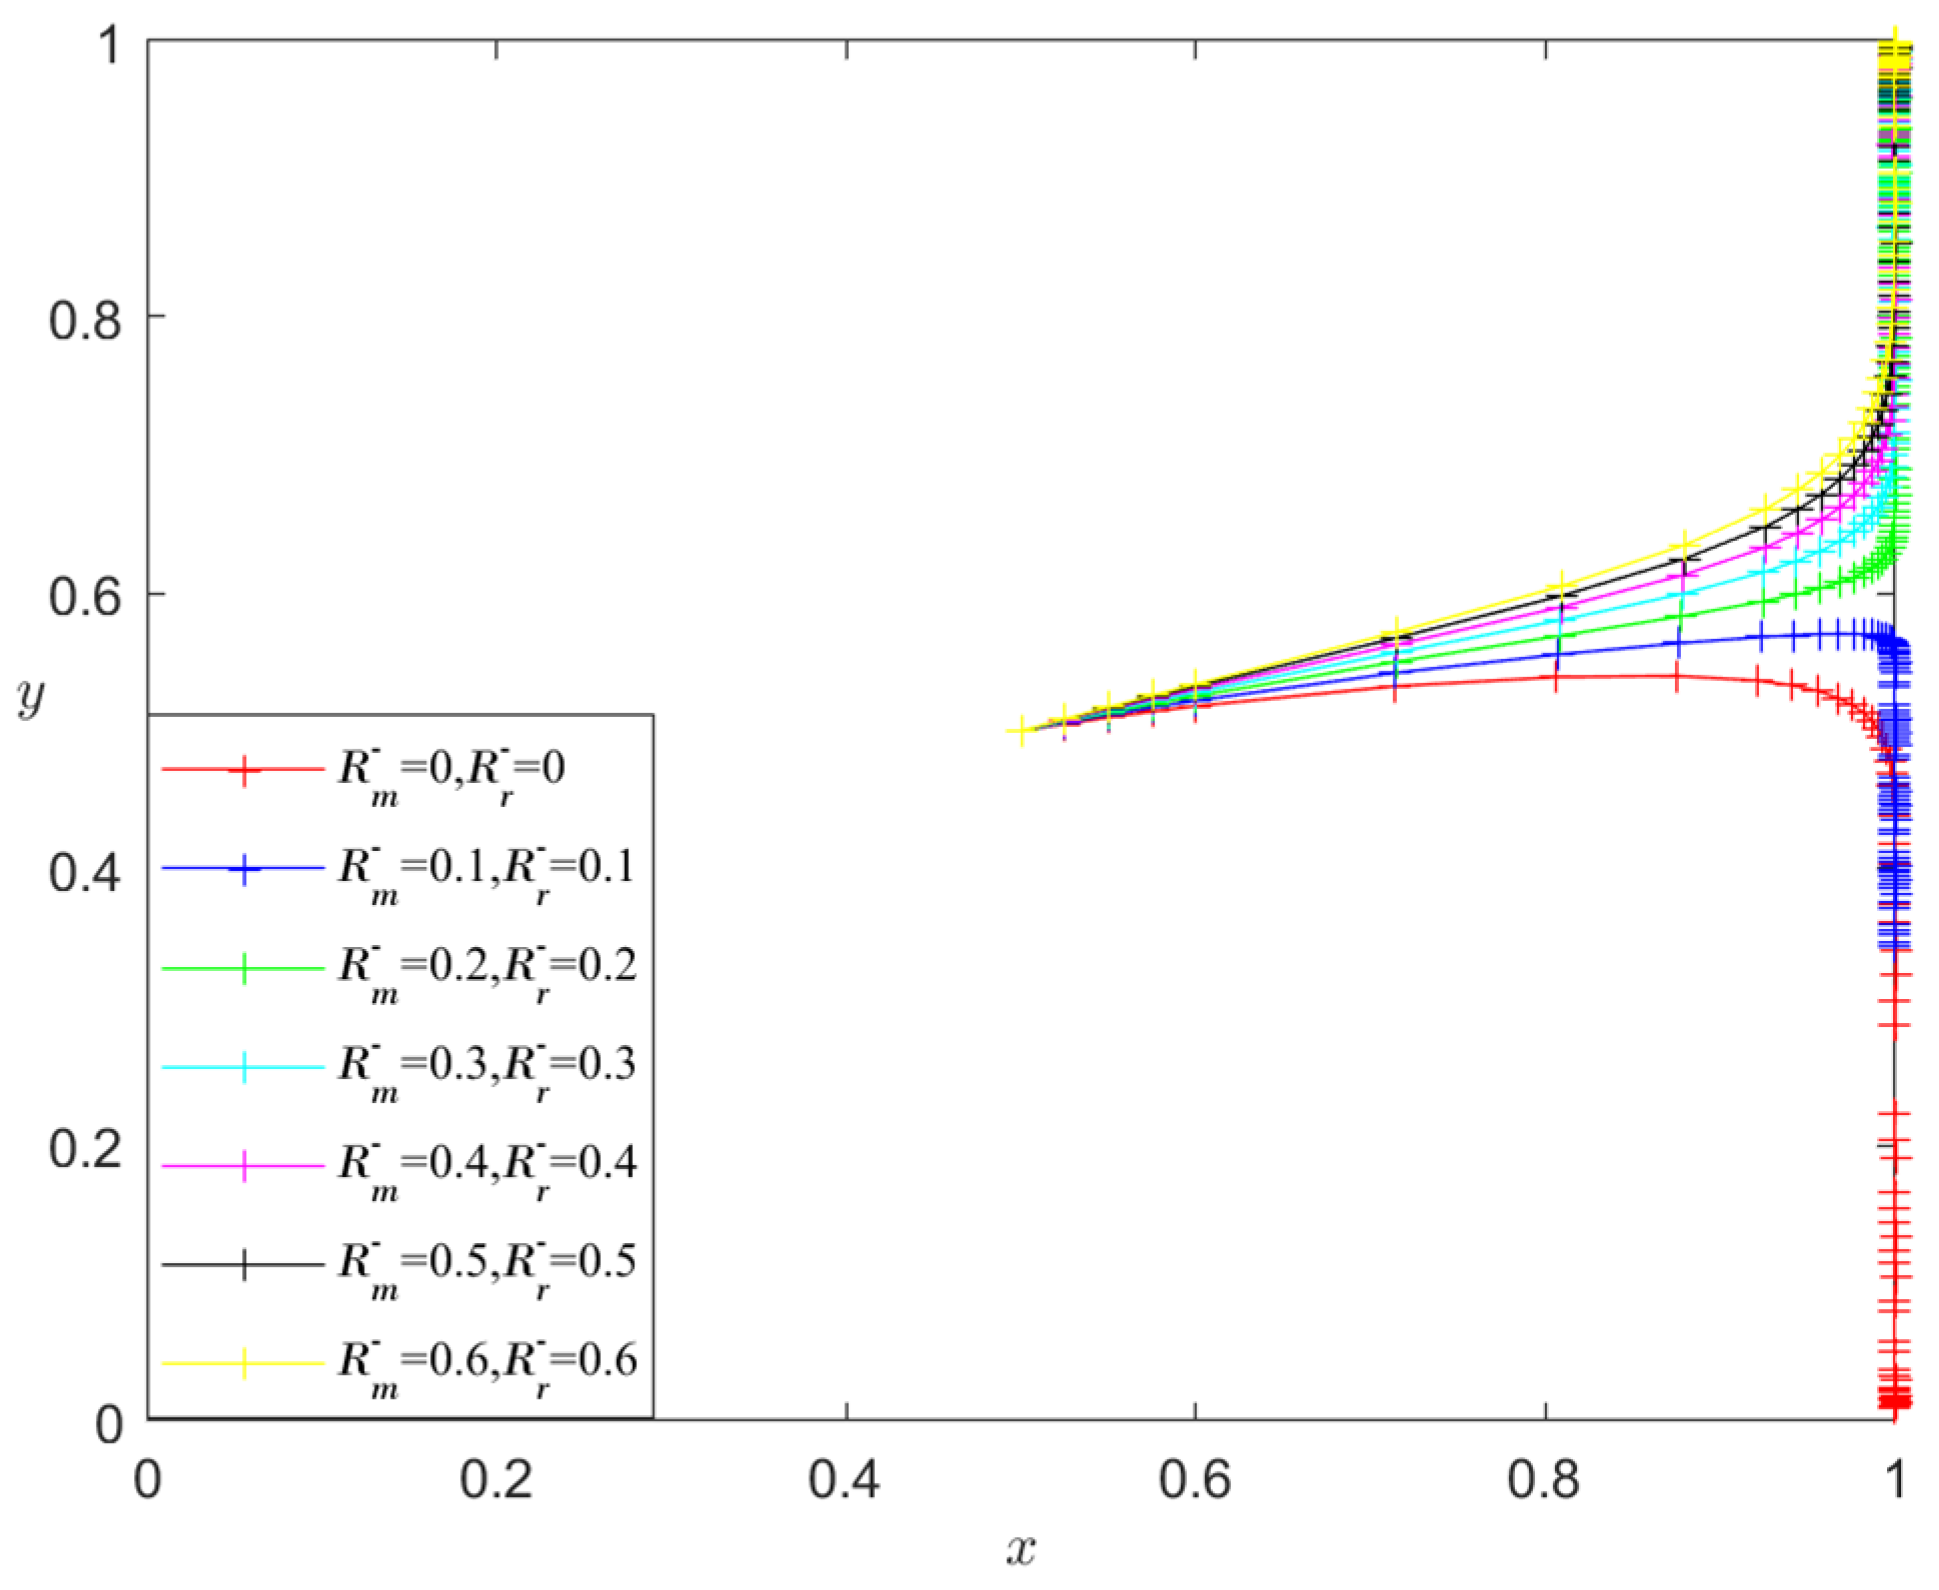
- Analysis of the influence of and on the evolutionary stability results
- 2.
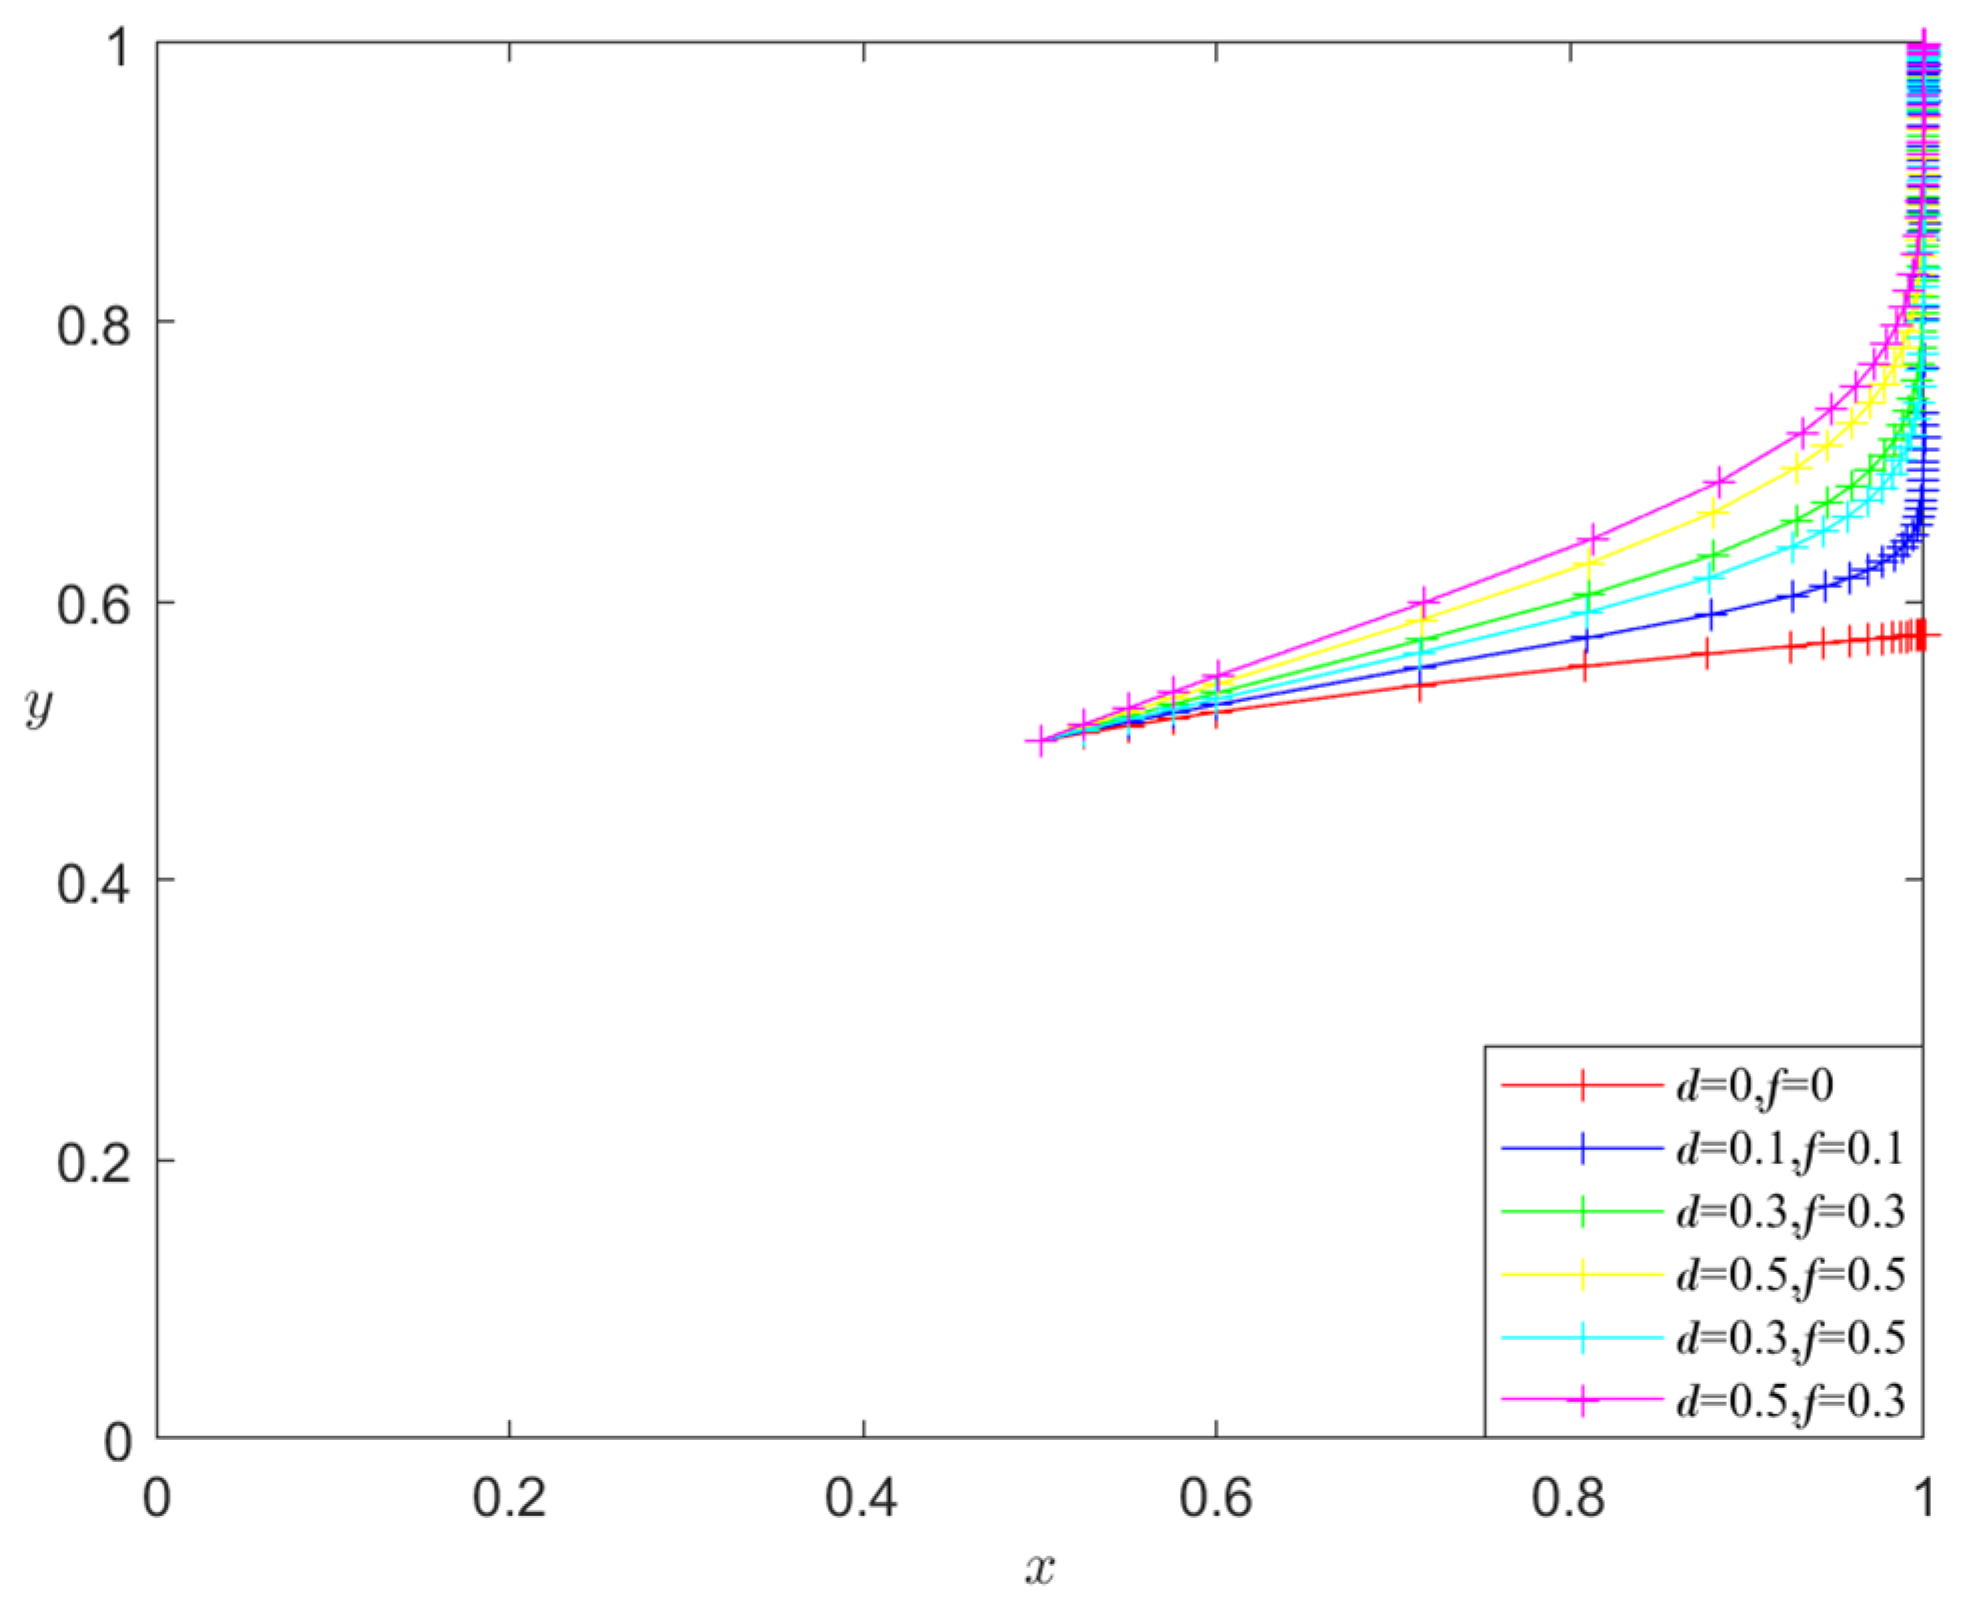
- Analysis of the influence of d and f on the evolutionary stability results
- 3.
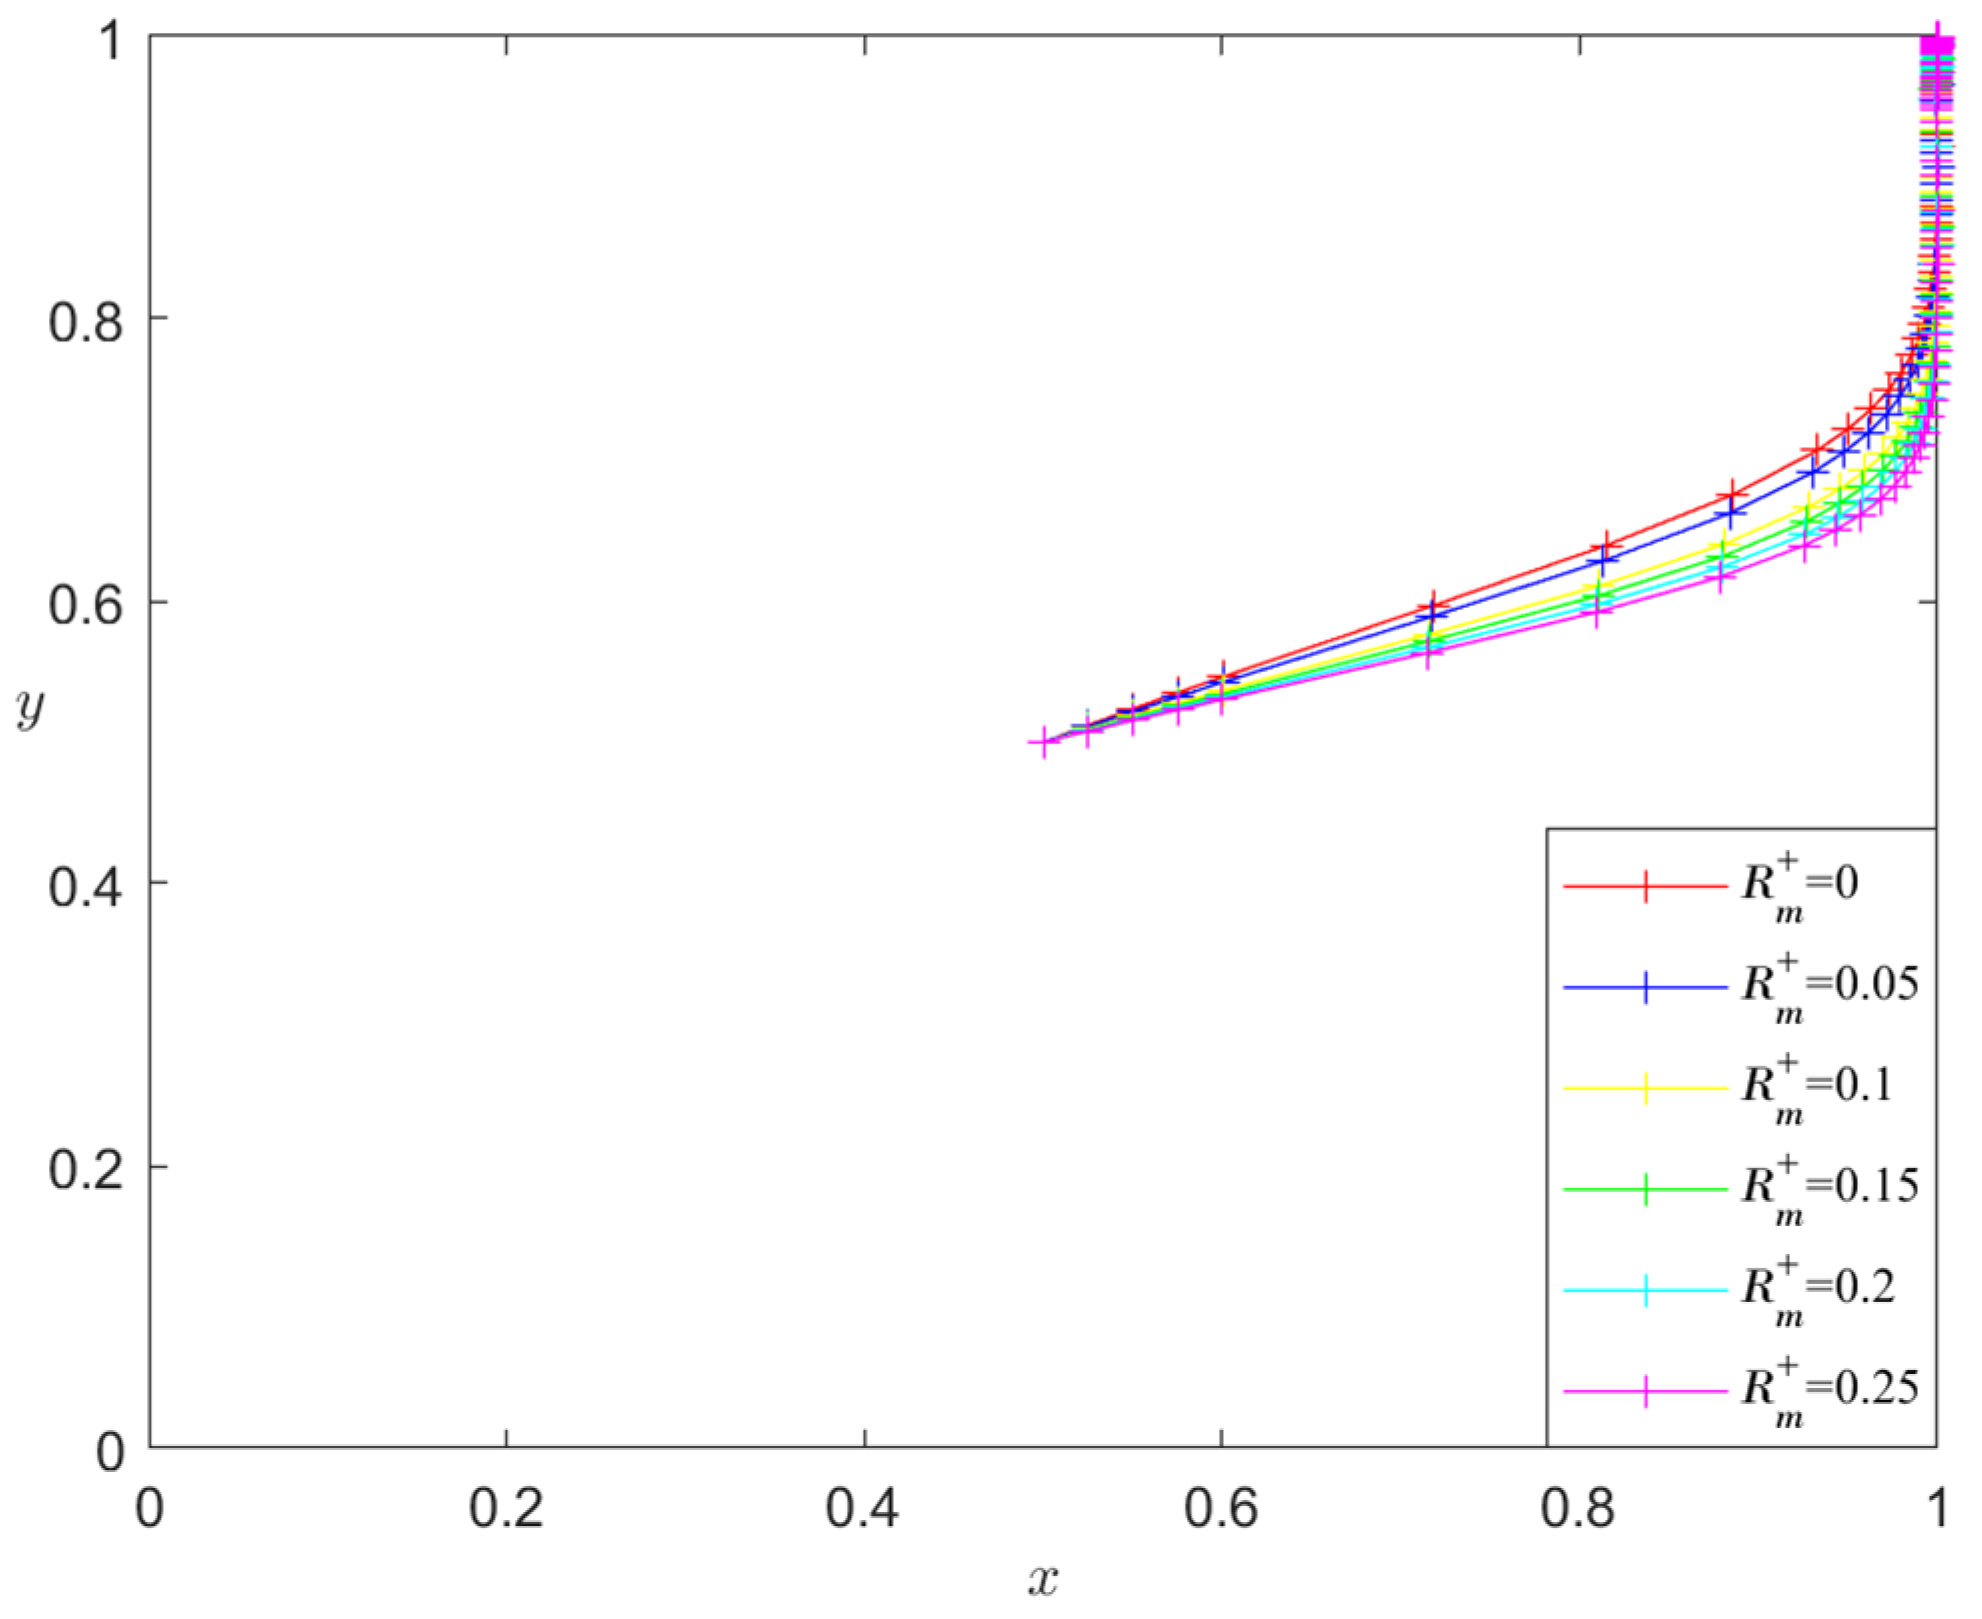
- Analysis of the influence of and on the evolutionary stability results
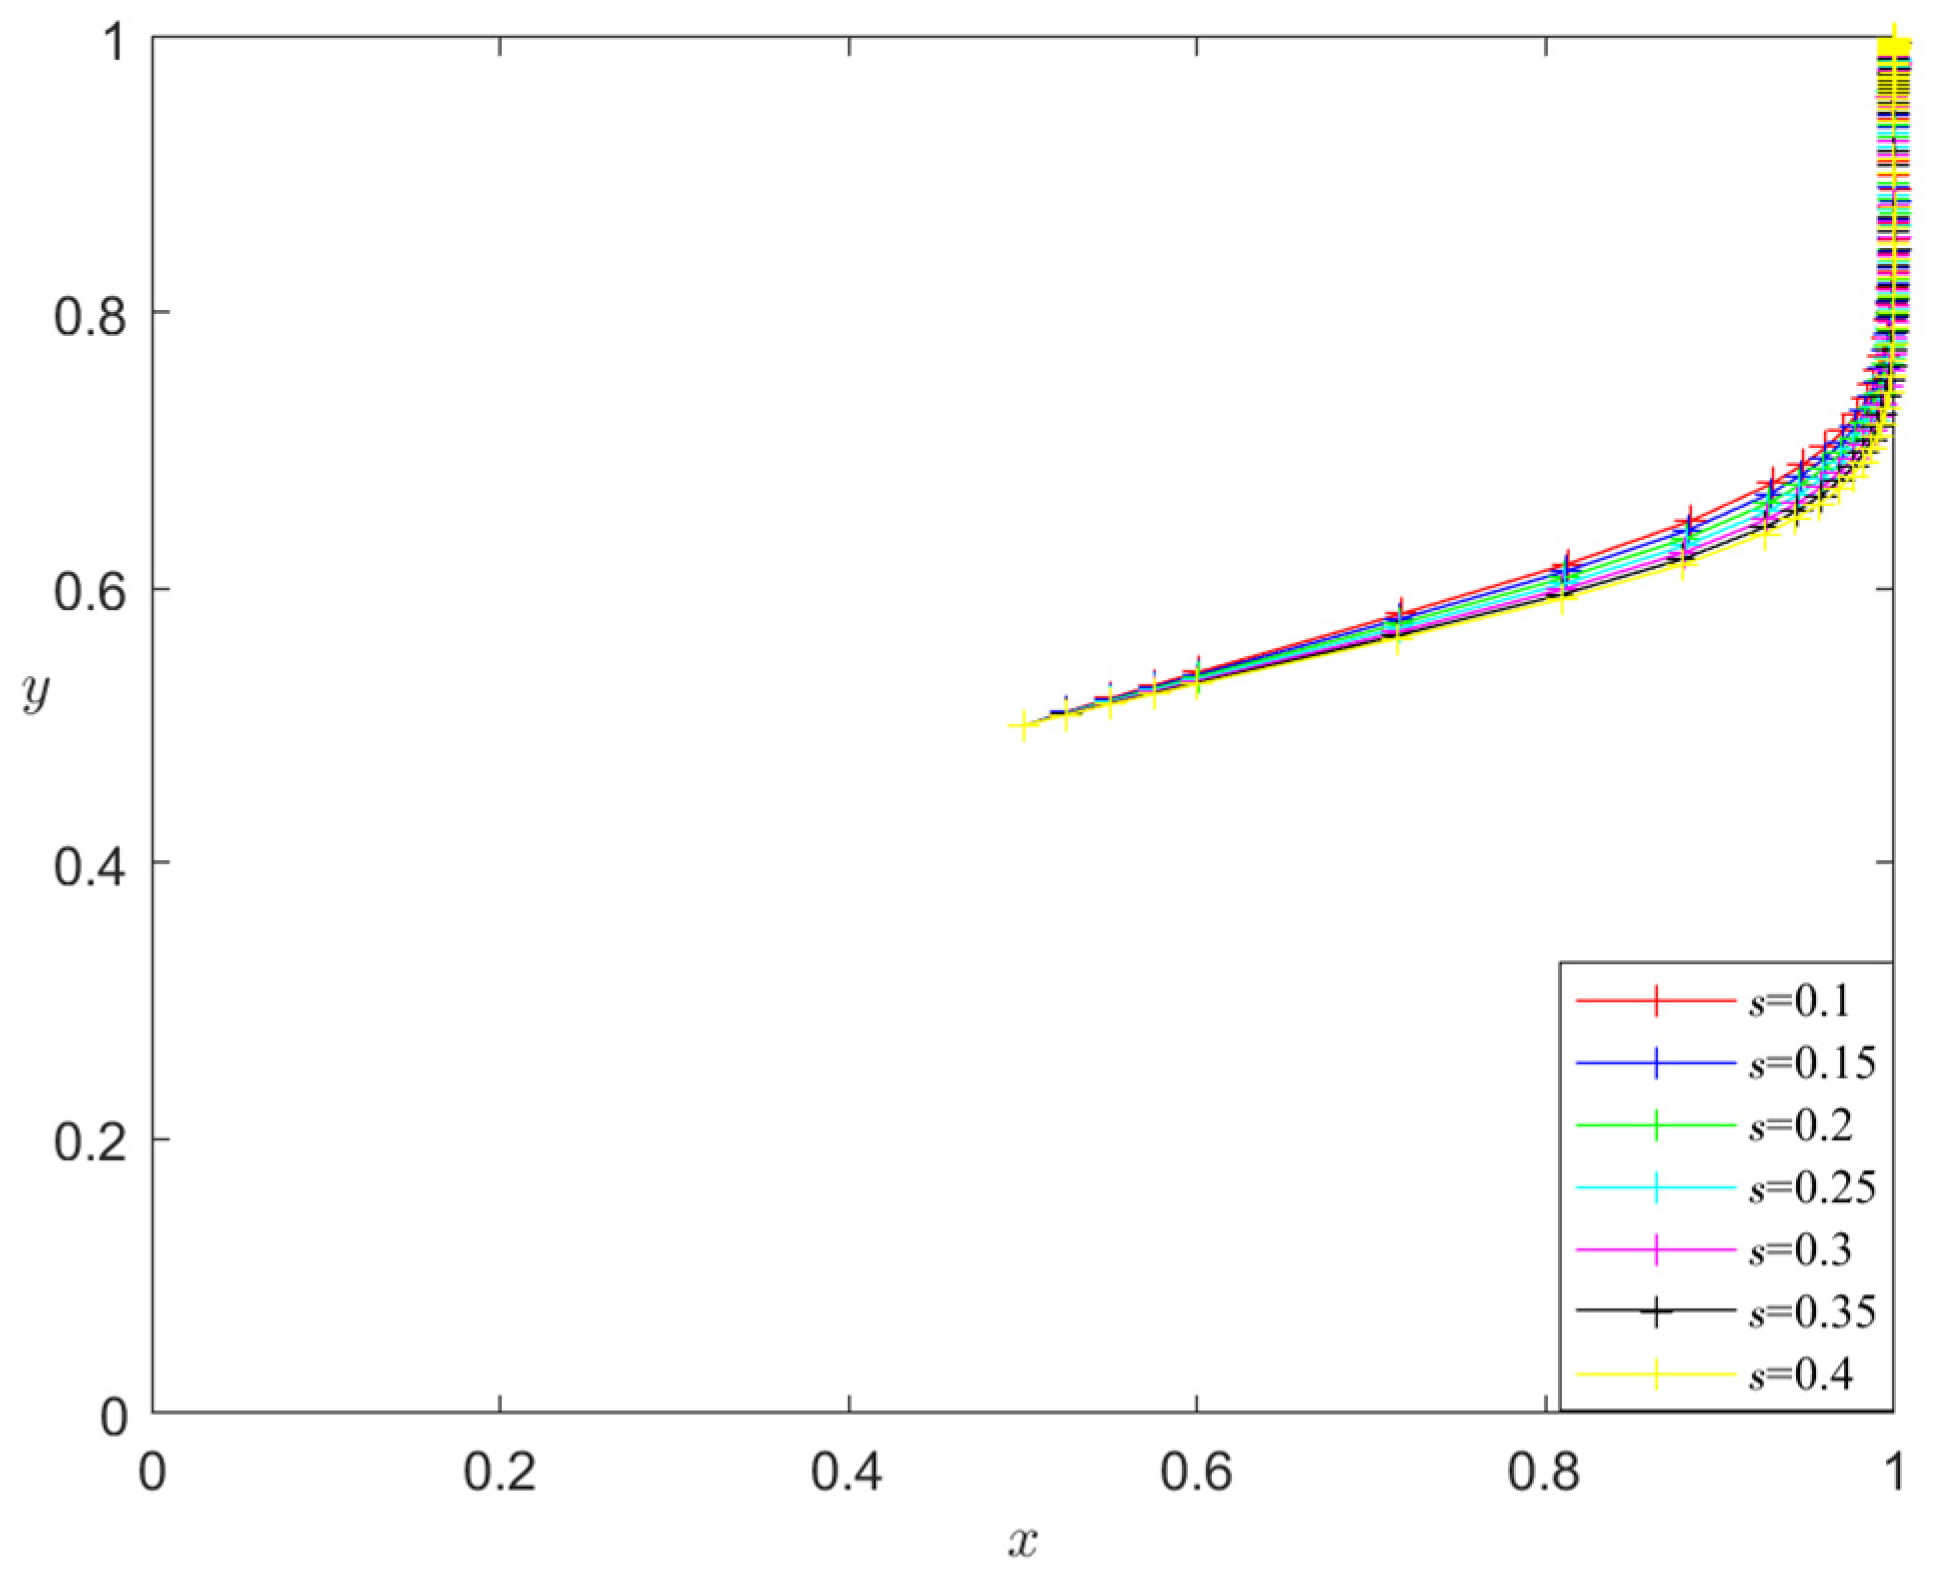
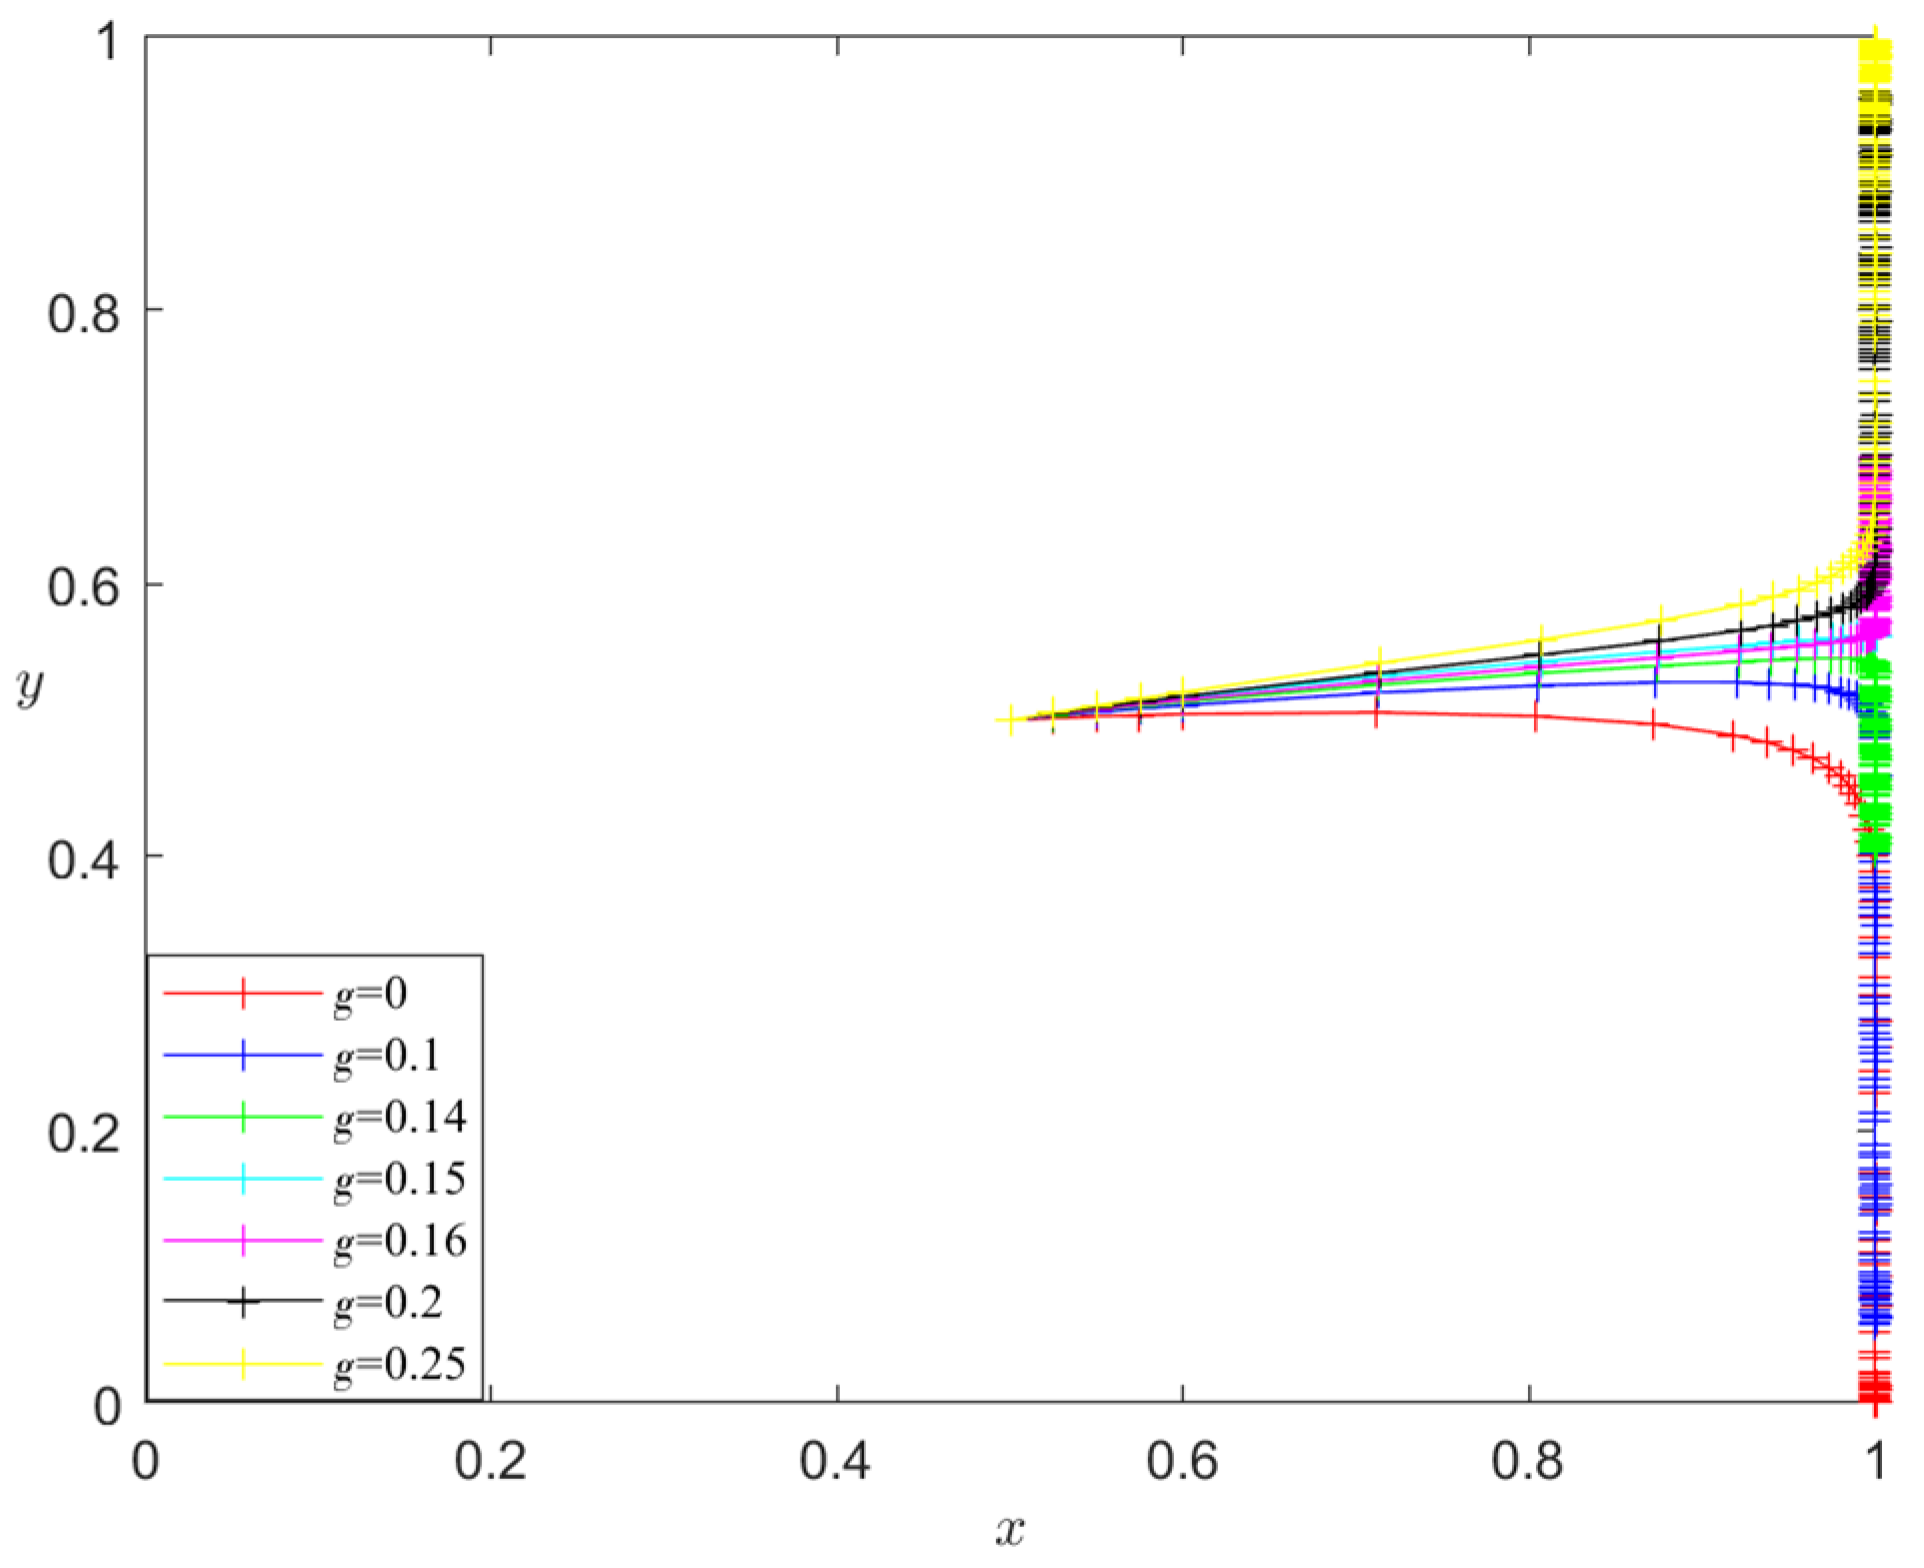
- 4.
- Analysis of the influence of s and g on the evolutionary stability results
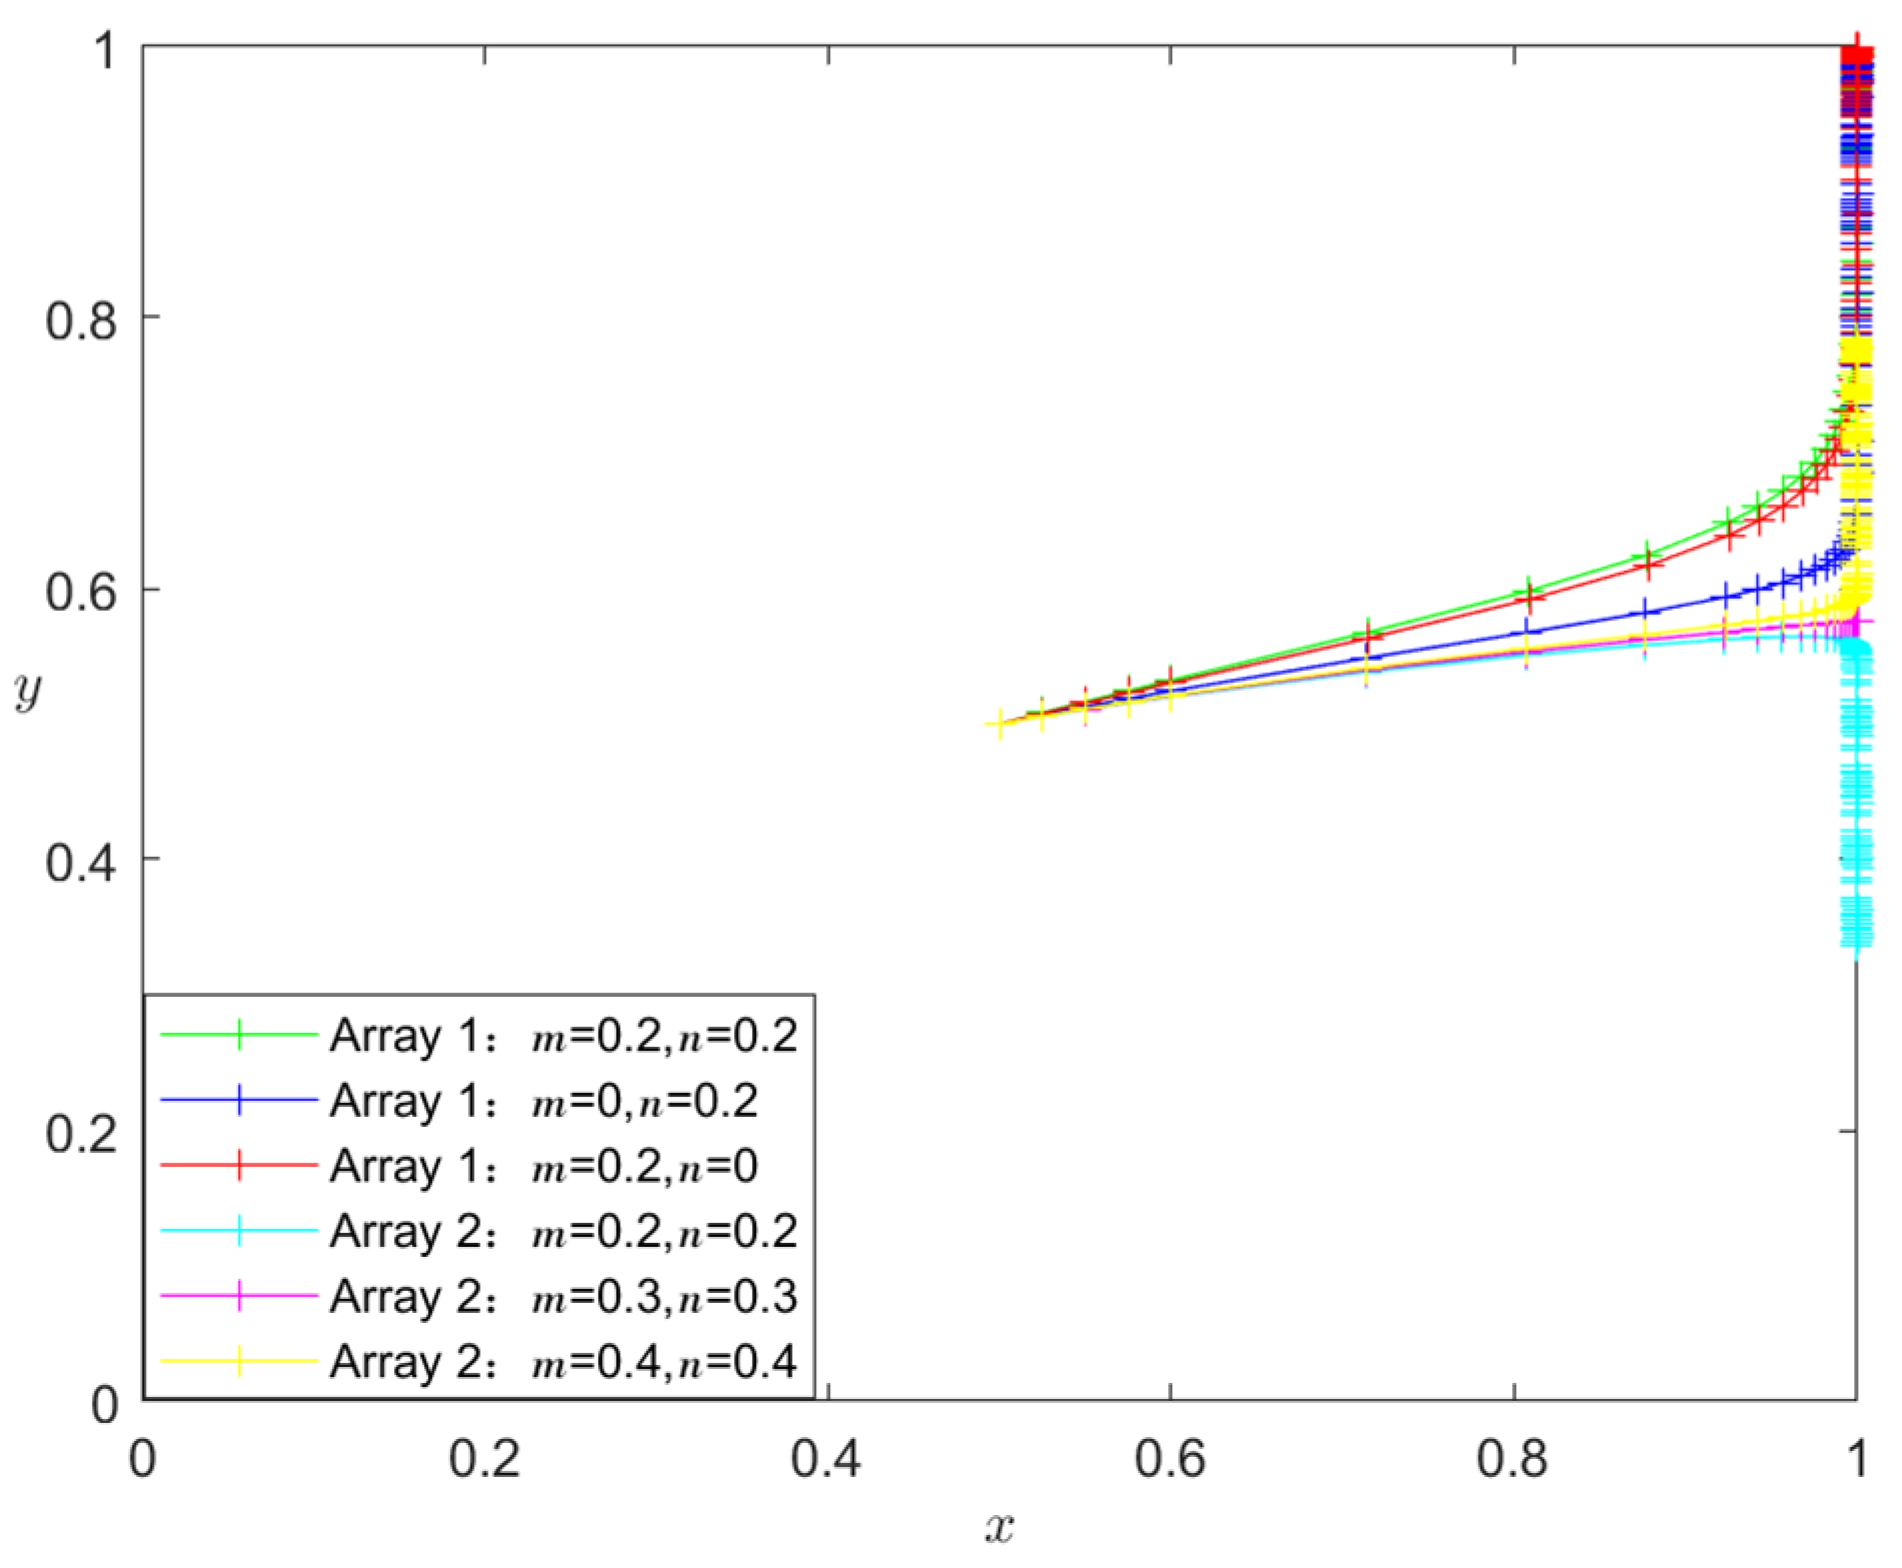
- 5.
- Analysis of the influence of m and n on the evolutionary stability results
- 6.
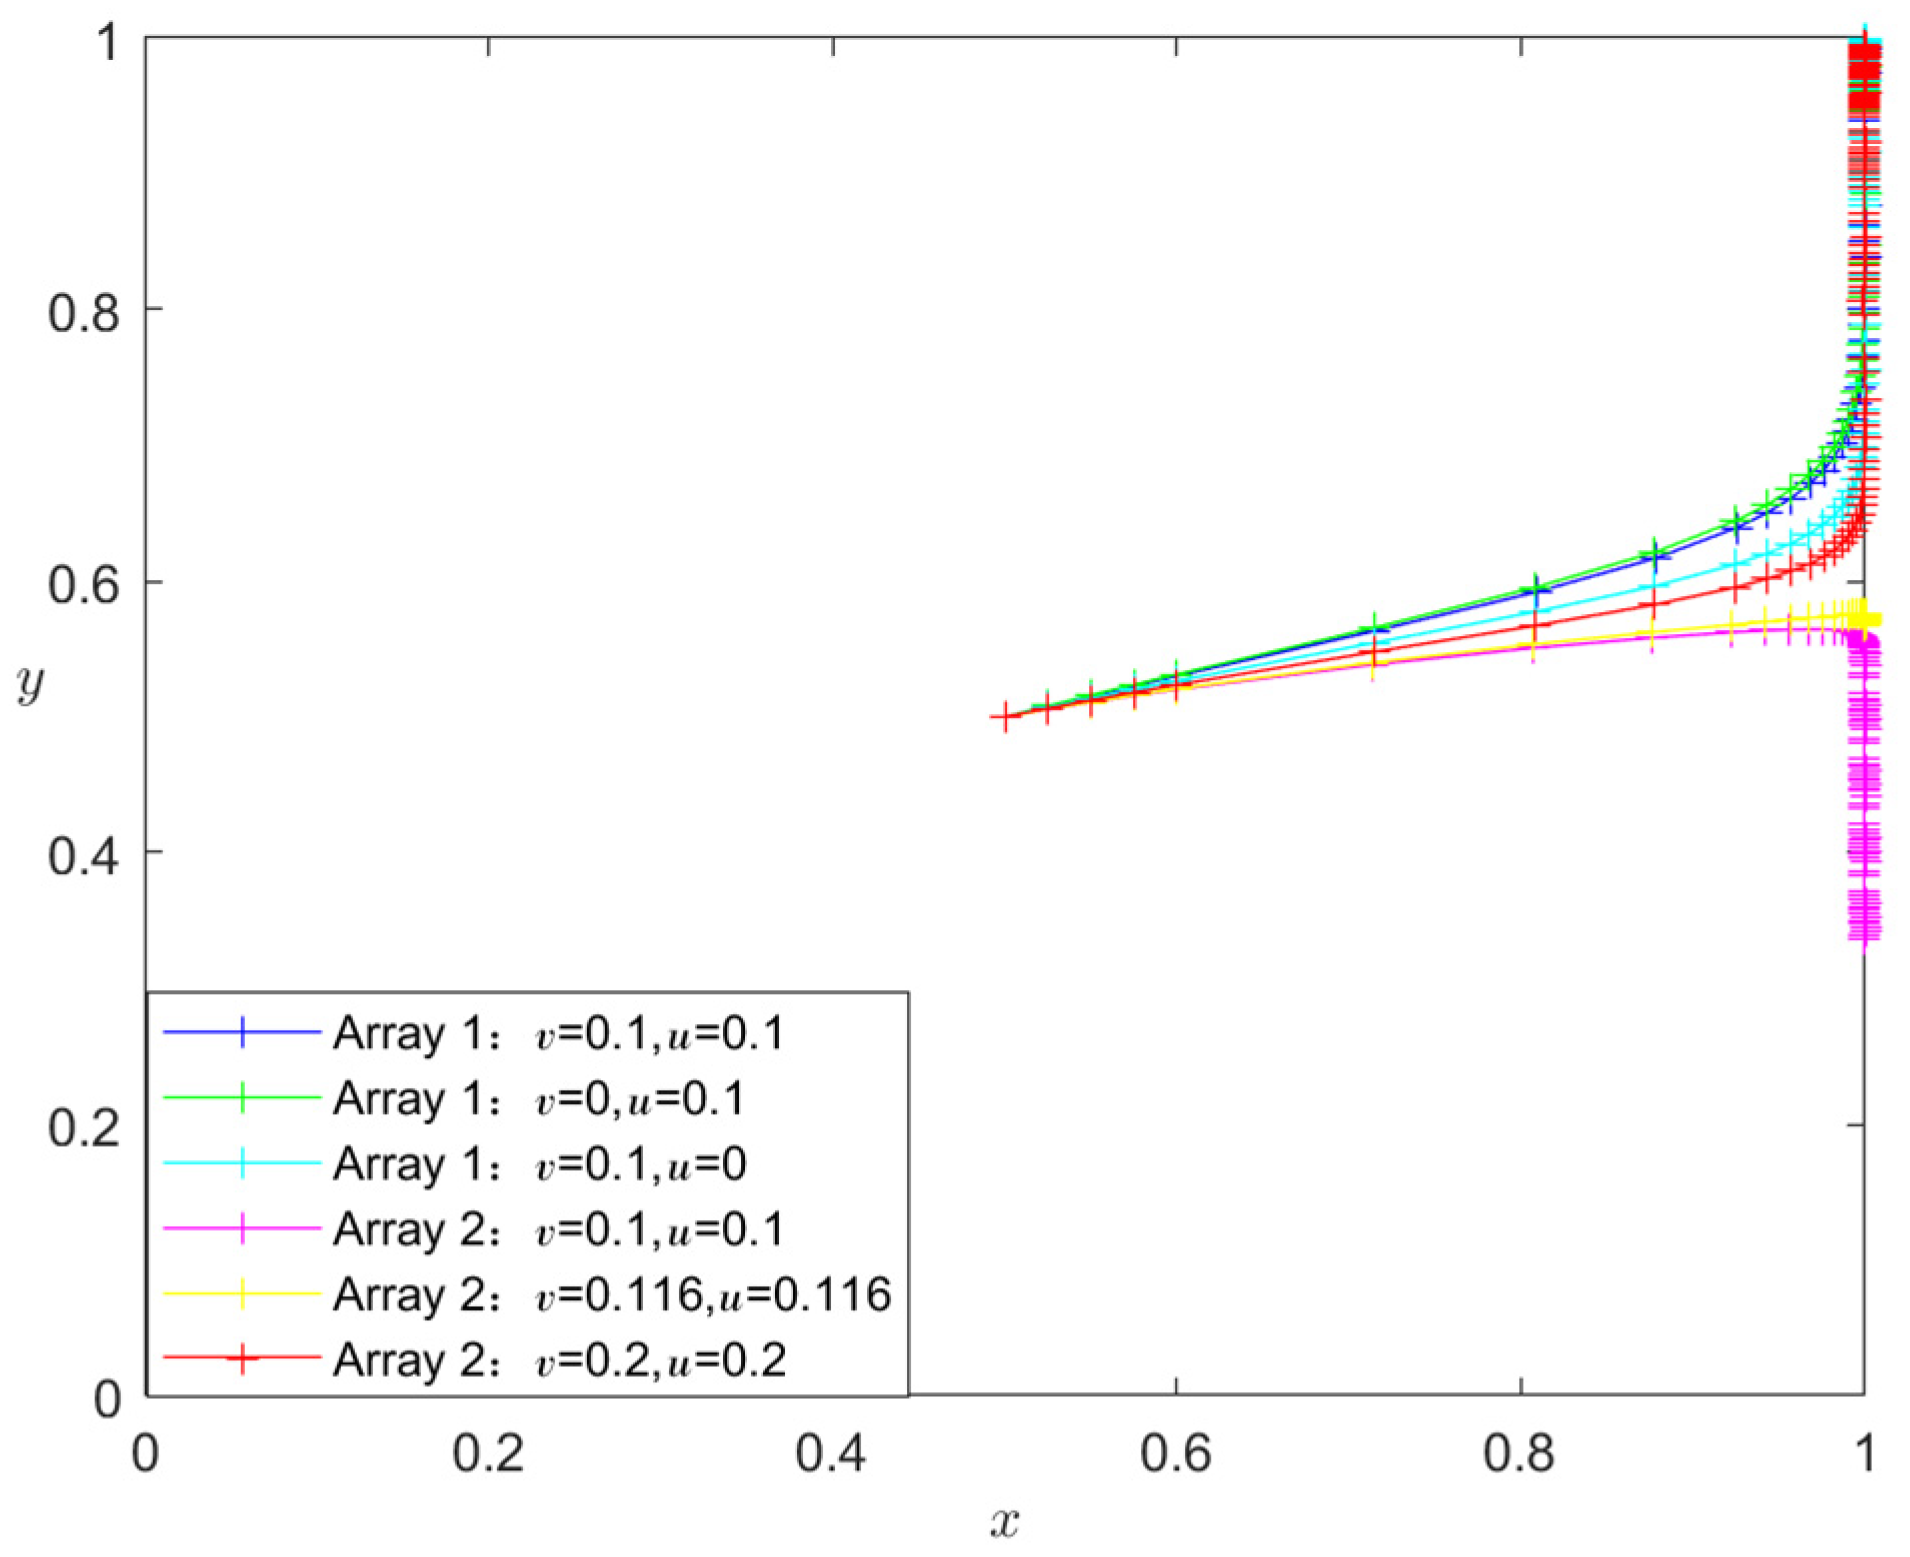
- Analysis of the influence of v and u on the evolutionary stability results
- 7.
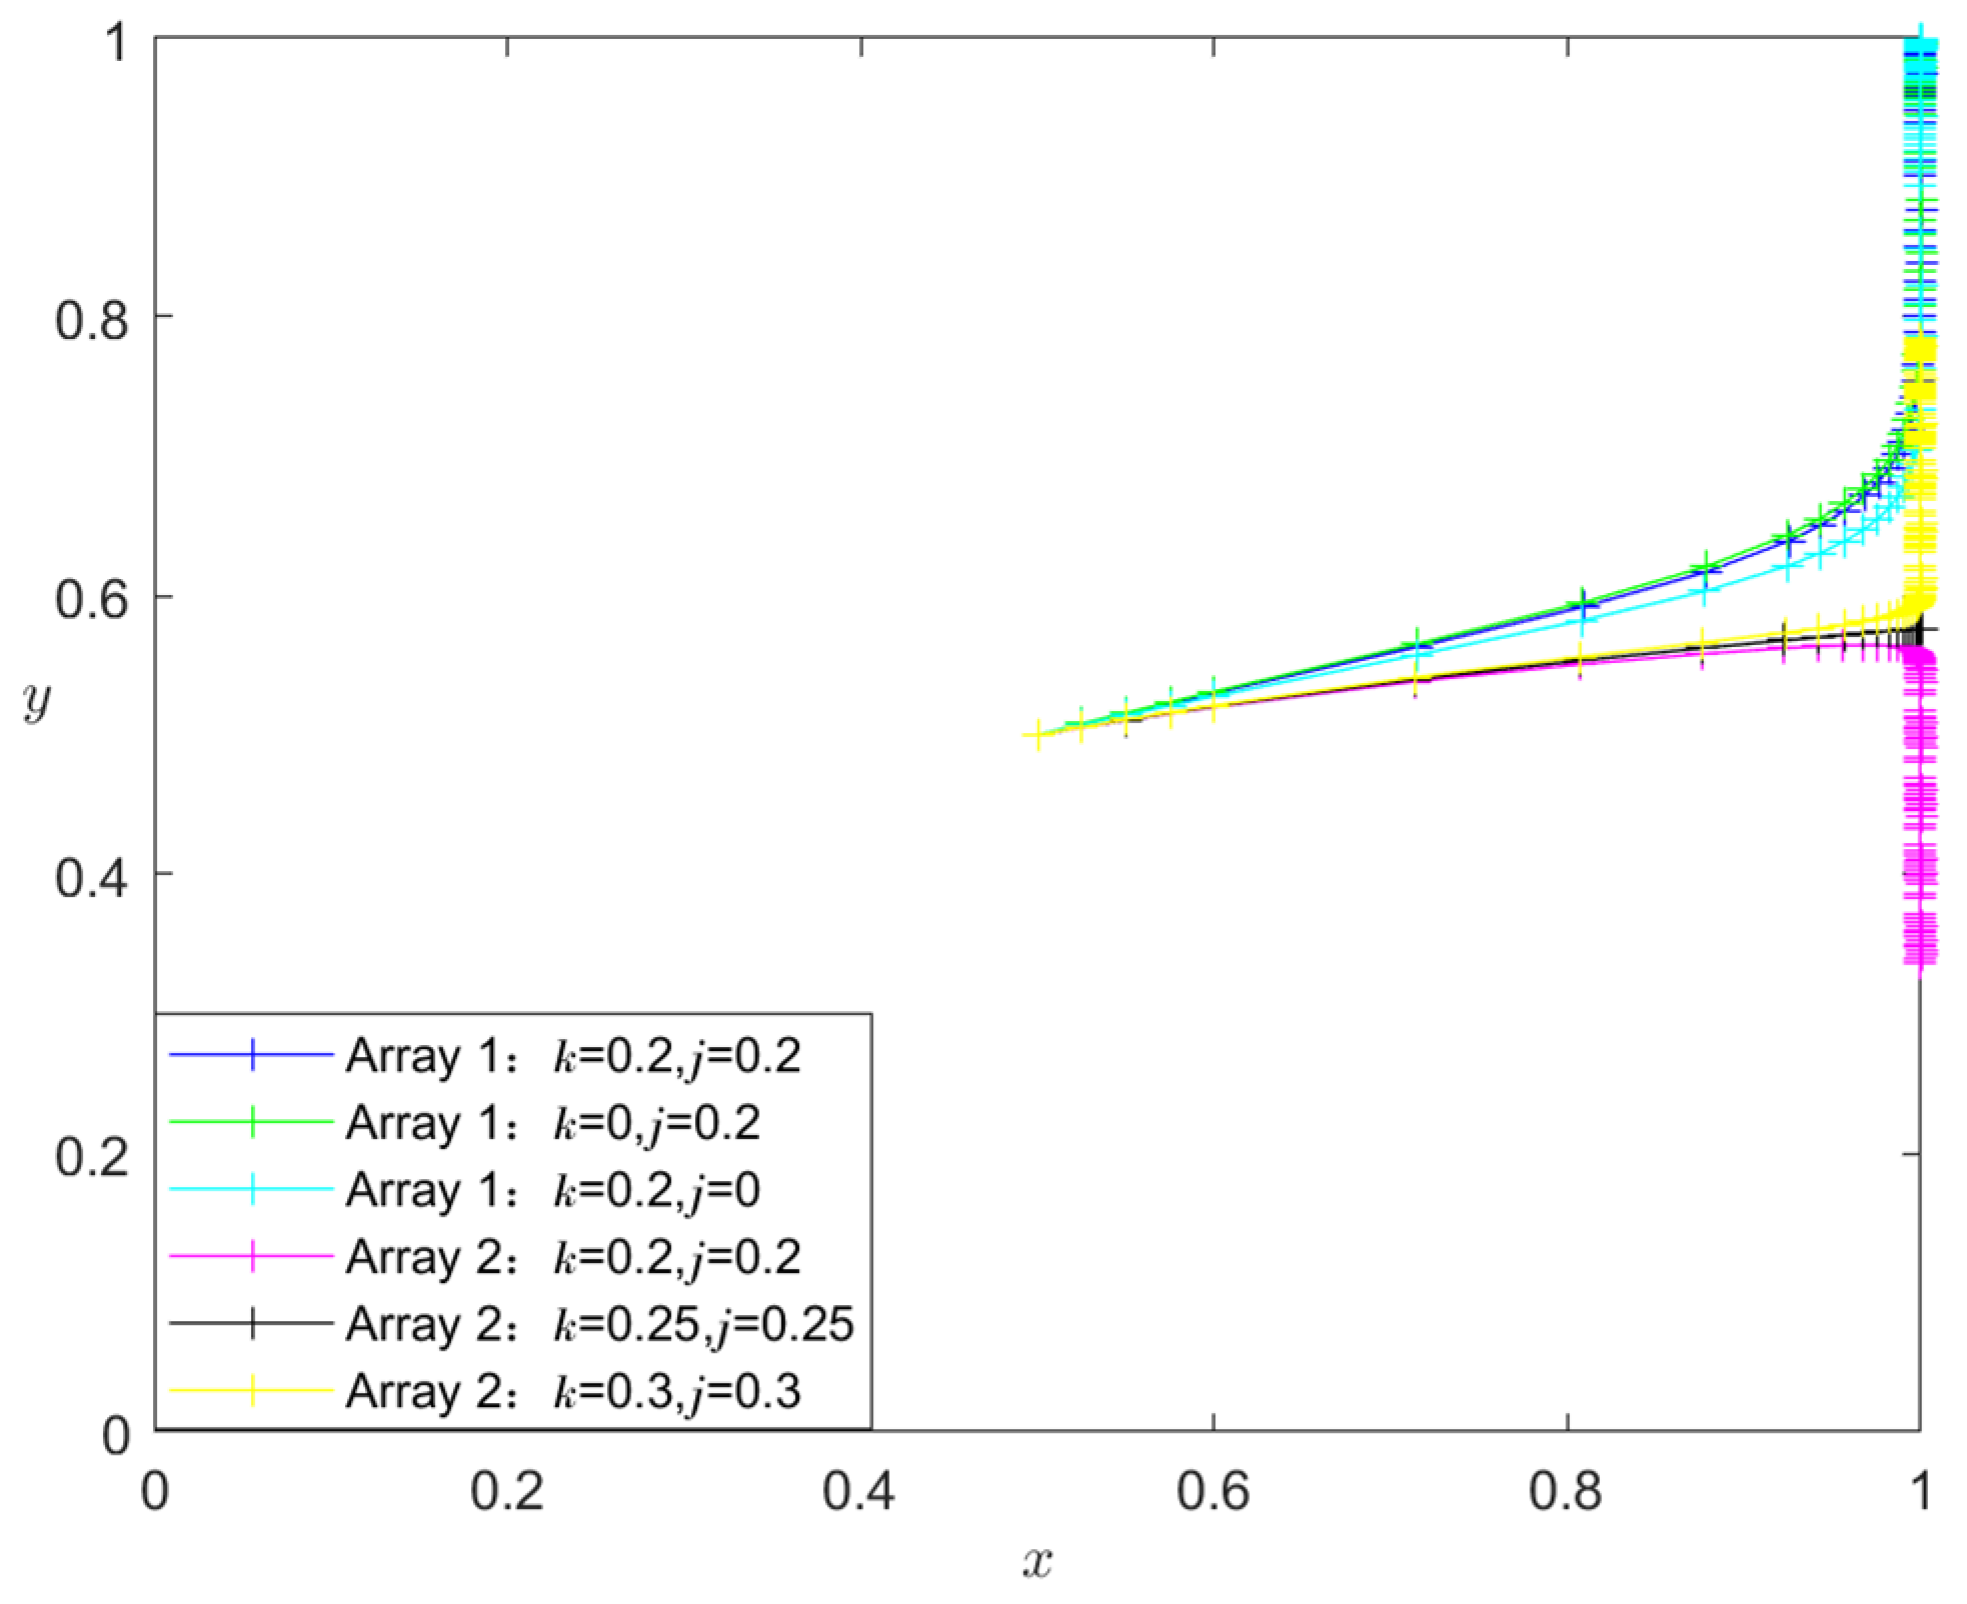
- Analysis of the influence of k and j on the evolutionary stability results
- 8.
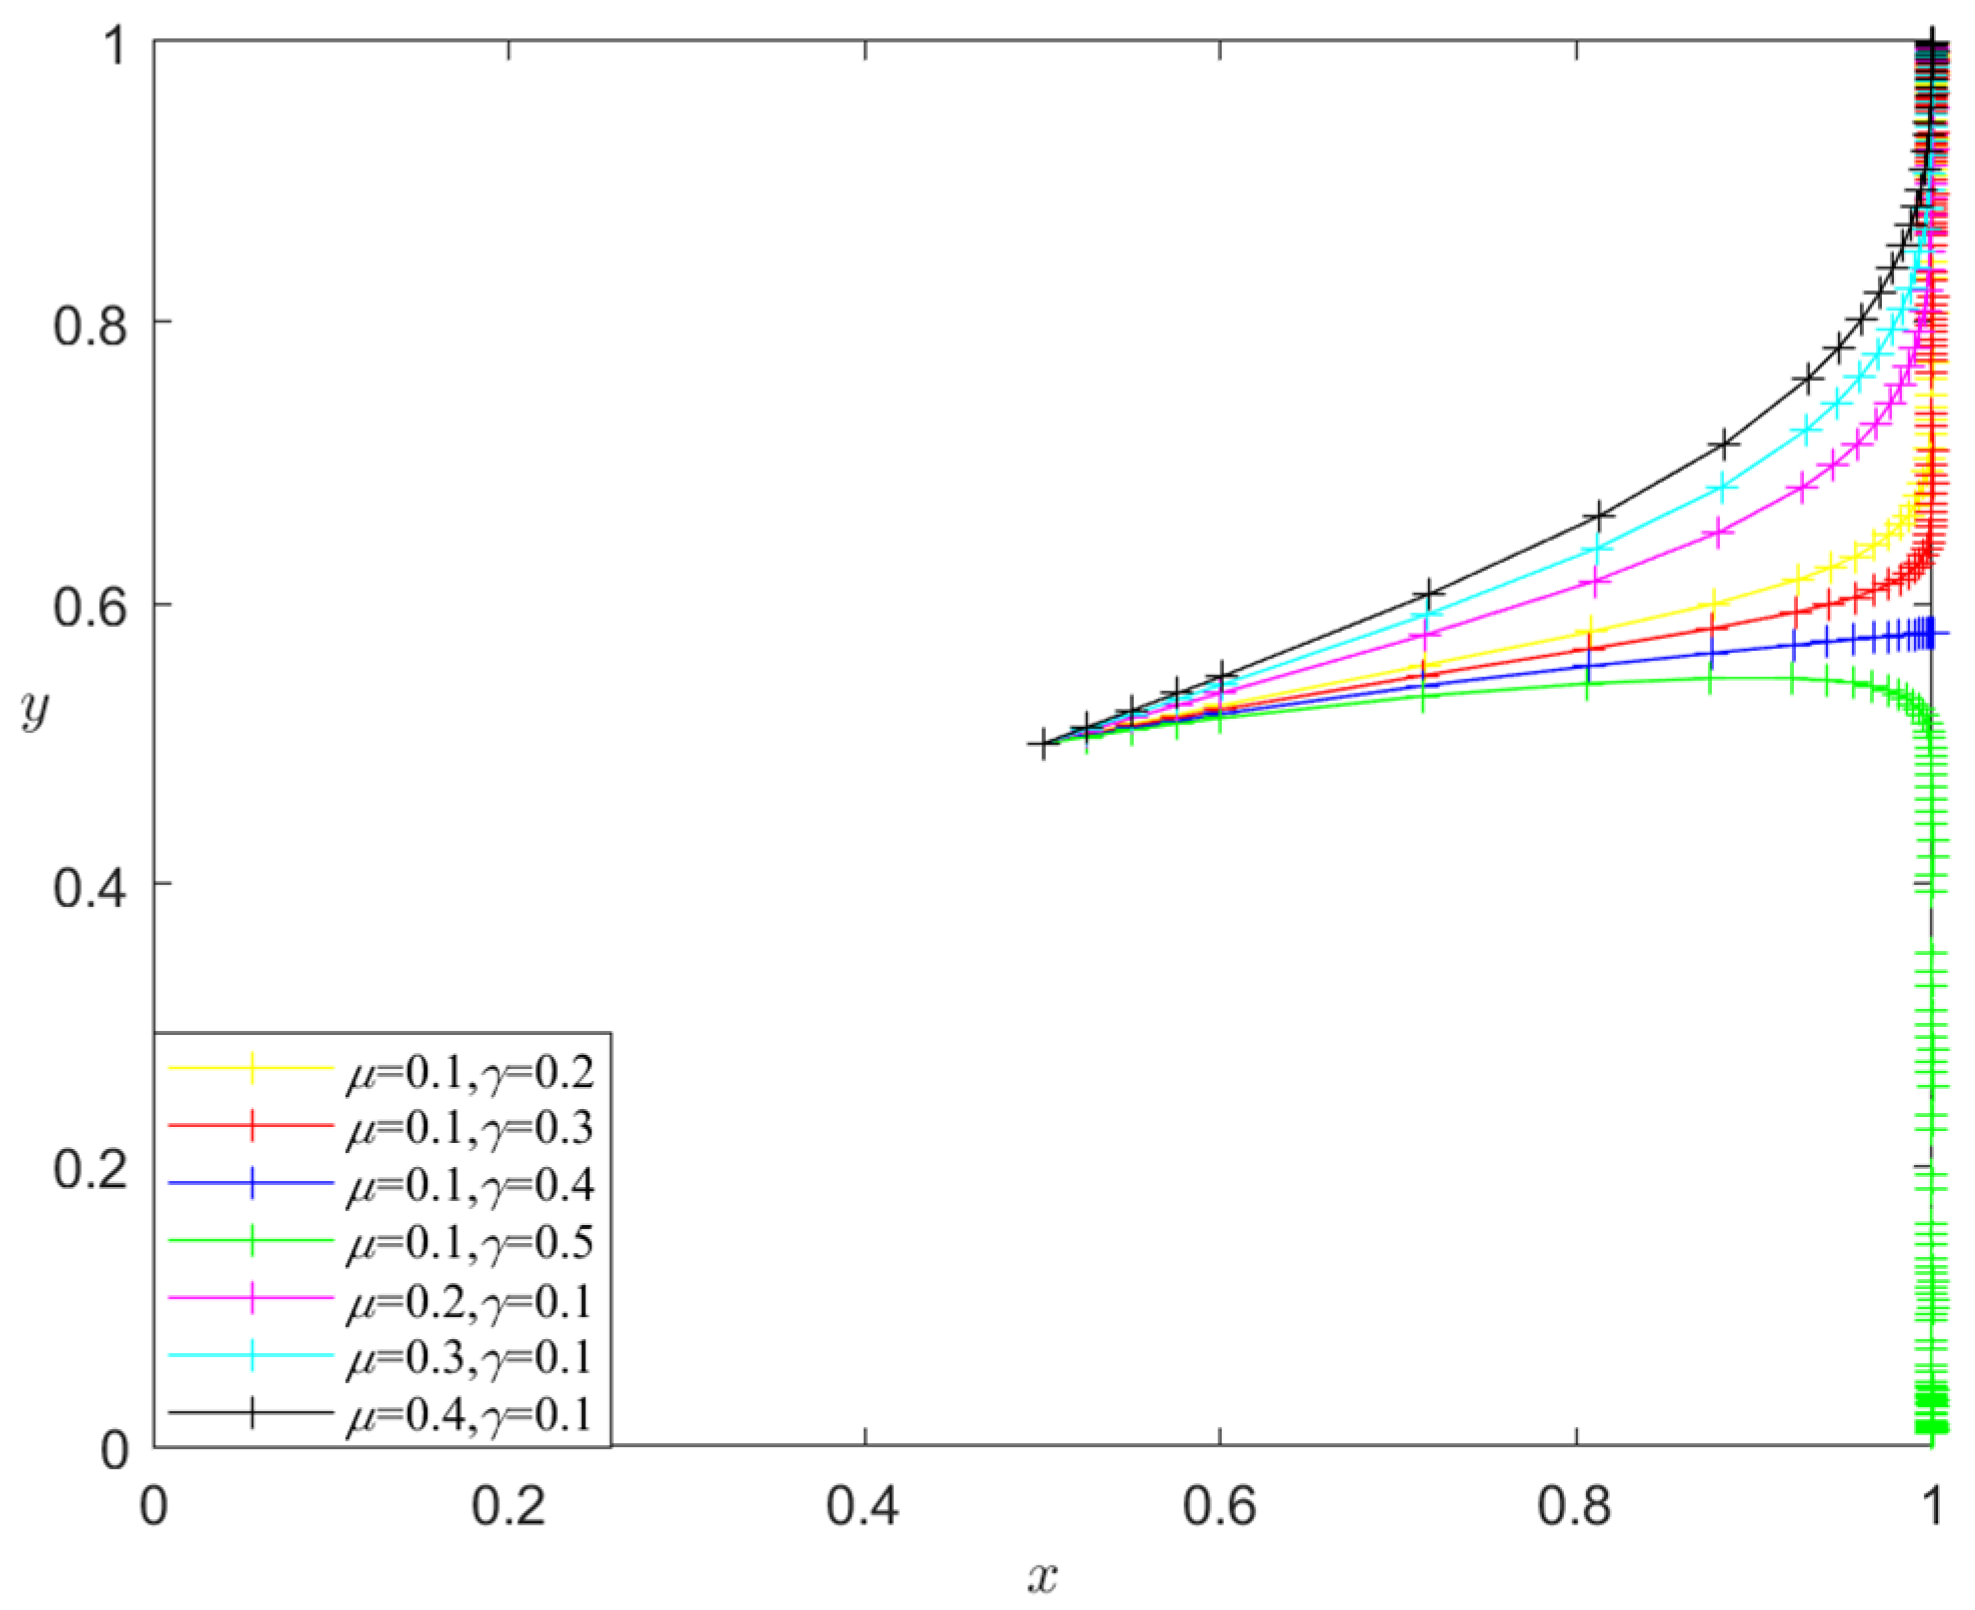
- Analysis of the influence of μ and γ on the evolutionary stability results
5. Summary
5.1. Conclusions
5.2. Suggestion
- Developing a resilient HCSC security system is crucial. First, in order to minimize the impact on healthcare services, it is essential to conduct a comprehensive assessment of the security of the HCSC system and develop a comprehensive and integrated SC security strategy that encompasses various levels, such as the government, industry, and individual enterprises. This strategy aims to efficiently address a range of changing threats and disasters, ensure the rapid recovery of the medical logistics and SC system following disruptions, and mitigate the effects of SC issues on healthcare services, industries, and enterprises to protect the uninterrupted and steady functioning of healthcare services. Furthermore, building a comprehensive HCSC risk assessment, early warning, and emergency response system is imperative. This system should be managed by a national-level organization that oversees the healthcare industry chain and guarantees the security of the SC. Simultaneously, the system should also evaluate HCSC risks and create adaptable SCRES plans based on the assessment findings to ensure that SC strategies can be promptly modified in response to different threats and disasters to protect the continuous operation of healthcare services.
- Governments should establish mechanisms to subsidize resilience investment by healthcare entities. Suppose healthcare entities are reluctant to invest in resilience due to the perceived lack of significant benefits. In that case, the government should provide subsidies to ensure that the overall benefits of resilience investment outweigh the benefits of “free-riding”. Through this mechanism, the government can provide financial assistance to evaluate the ability of the HCSC to withstand and recover from disruptions. Additionally, the government can promote and incentivize the implementation of advanced technologies like blockchain and artificial intelligence to enhance the effectiveness and transparency of the SC. This initiative helps healthcare entities strategize and efficiently equip themselves for forthcoming difficulties. Governments can also promote collaboration among HCSC stakeholders to create and execute resilience strategies. Facilitate cross-organizational cooperation by offering financial assistance to strengthen the overall resilience of the HCSC system.
- The government sets up penalty mechanisms to curb “free-riding” behavior on resilience investment. In cases where one participant in an HCSC invests in building resilience while another participant takes “free-rider” behavior, it becomes essential to establish a penalty mechanism. This mechanism ensures that the benefit received by the “free-rider” is less than the total benefit derived from the resilience investment. The penalty mechanism aims to prevent opportunistic behavior in the HCSC and ensures that all parties actively participate in enhancing the HCSCRES. Specifically, it is necessary to clearly define the responsibilities and obligations of each party involved in the SC contract, including resilience investment. Simultaneously, contractual terms should incorporate sanctions for “free-rider” behavior, enhancing members’ accountability for investing in resilience. By implementing a resilience investment penalty mechanism, members can foster a cooperative atmosphere in the HCSC that promotes collective growth and safeguards the overall SCRES. This will also help to ensure that all members fulfill their responsibility to enhance SCRE, ultimately ensuring the stability of HCSC system operations.
- Healthcare entities upgrade information technology and develop big data analytics capabilities. HCSC members are caught in a game of resilience investment due to mutual distrust, low returns, high expenses of resilience investment, and “free-rider” behavior. The significance of information transparency in the HCSC cannot be exaggerated. The extensive utilization of information technology enables the gathering of healthcare-related data, the integration of information processing and big data analytics capabilities, and SC visibility. This enhances the healthcare entities’ capacity to perceive and respond to environmental changes promptly during disruptions. Healthcare entities can gain insight into actual healthcare demands and market situations through demand visibility, while supply visibility relies on-demand visibility to assess perceived market conditions. With the assistance of information technology and big data analytics, healthcare organizations can digitize their production and delivery processes. This enables them to monitor data closely throughout the production and delivery stages, promptly respond to order demands, adjust flexibly for process optimization and efficiency improvement, and minimize losses during disruptions.
- Restructuring SC structure and optimizing partnerships. Cooperative gaming among healthcare entities tends to bring more benefits than non-cooperative gaming, favoring overall HCSC performance. During disruptions, it is advisable to modify the design of SC structures, reconfigure and improve relationships between SC partners, and establish incentives to encourage cooperation. Simultaneously, an effective communication mechanism should be implemented to facilitate the sharing of healthcare knowledge and information, enhance the visibility of the SC, monitor the operational state of the HCSC promptly, identify issues, and limit losses caused by disruptions. Inadequate collaborations might lead to logistics and information flow disruptions in the HCSC. Therefore, it is imperative to establish a close collaborative partnership, develop a reliable trust mechanism, jointly formulate production plans and demand forecasts, foster close cooperation among SC partners, enhance the extent of information sharing, and improve the responsiveness of the SC in order to safeguard people’s lives.
5.3. Research Limitations and Perspectives
Author Contributions
Funding
Data Availability Statement
Conflicts of Interest
Abbreviations
| Abbreviated alphabet | Meaning |
| SC | Supply chain |
| HCSC | Healthcare supply chain |
| SCRES | Supply chain resilience |
| HCSCRES | Healthcare supply chain resilience |
| SCM | Supply chain management |
| HCSCM | Healthcare supply chain management |
| ESS | Evolutionary stabilization strategy |
References
- Chen, J.; Liu, Y. Operations Management Innovation Enabled by Digitalization and Intellectualization: From Supply Chain to Supply Chain Ecosystem. J. Manag. World 2021, 37, 227–240. [Google Scholar]
- Scholten, K.; Stevenson, M.; van Donk, D.P. Dealing with the Unpredictable: Supply Chain Resilience. IJOPM 2019, 40, 1–10. [Google Scholar] [CrossRef]
- Zeneli, V.; Czinkota, M.R.; Knight, G. Terrorism, Competitiveness, and International Marketing: An Empirical Investigation. Int. J. Emerg. Mark. 2018, 13, 310–329. [Google Scholar] [CrossRef]
- Saha, E.; Rathore, P. The Impact of Healthcare 4.0 Technologies on Healthcare Supply Chain Performance: Extending the Organizational Information Processing Theory. Technol. Forecast. Soc. Chang. 2024, 201, 123256. [Google Scholar] [CrossRef]
- Ivanov, D.; Dolgui, A. Viability of Intertwined Supply Networks: Extending the Supply Chain Resilience Angles towards Survivability. A Position Paper Motivated by COVID-19 Outbreak. Int. J. Prod. Res. 2020, 58, 2904–2915. [Google Scholar] [CrossRef]
- Ali, I.; Kannan, D. Mapping Research on Healthcare Operations and Supply Chain Management: A Topic Modelling-Based Literature Review. Ann. Oper. Res. 2022, 315, 29–55. [Google Scholar] [CrossRef] [PubMed]
- Betto, F.; Garengo, P. A Circular Pathway for Developing Resilience in Healthcare during Pandemics. Int. J. Prod. Econ. 2023, 266, 109036. [Google Scholar] [CrossRef]
- Govindan, K.; Mina, H.; Alavi, B. A Decision Support System for Demand Management in Healthcare Supply Chains Considering the Epidemic Outbreaks: A Case Study of Coronavirus Disease 2019 (COVID-19). Transp. Res. Part E-Logist. Transp. Rev. 2020, 138, 101967. [Google Scholar] [CrossRef]
- Kholaif, M.M.N.H.K.; Xiao, M.; Tang, X. Opportunities Presented by COVID-19 for Healthcare Green Supply Chain Management and Sustainability Performance: The Moderating Effect of Social Media Usage. IEEE Trans. Eng. Manag. 2023, 71, 4441–4454. [Google Scholar] [CrossRef]
- Scala, B.; Lindsay, C.F. Supply Chain Resilience during Pandemic Disruption: Evidence from Healthcare. Supply Chain Manag. Int. J. 2021, 26, 672–688. [Google Scholar] [CrossRef]
- Zamiela, C.; Hossain, N.U.I.; Jaradat, R. Enablers of Resilience in the Healthcare Supply Chain: A Case Study of U.S Healthcare Industry during COVID-19 Pandemic. Res. Transp. Econ. 2022, 93, 101174. [Google Scholar] [CrossRef]
- Senna, P.; Reis, A.; Dias, A.; Coelho, O.; Guimarães, J.; Eliana, S. Healthcare Supply Chain Resilience Framework: Antecedents, Mediators, Consequents. Prod. Plan. Control 2023, 34, 295–309. [Google Scholar] [CrossRef]
- Sawyerr, E.; Harrison, C. Resilience in Healthcare Supply Chains: A Review of the UK’s Response to the COVID19 Pandemic. IJPDLM 2023, 53, 297–329. [Google Scholar] [CrossRef]
- Mandal, S. The Influence of Organizational Culture on Healthcare Supply Chain Resilience: Moderating Role of Technology Orientation. JBIM 2017, 32, 1021–1037. [Google Scholar] [CrossRef]
- Tortorella, G.; Prashar, A.; Samson, D.; Kurnia, S.; Fogliatto, F.S.; Capurro, D.; Antony, J. Resilience Development and Digitalization of the Healthcare Supply Chain: An Exploratory Study in Emerging Economies. Int. J. Logist. Manag. 2023, 34, 130–163. [Google Scholar] [CrossRef]
- Olson, M. The Logic of Collective Action: Public Goods and the Theory of Groups; Harvard University Press: Cambridge, UK, 1971. [Google Scholar]
- Kar, S.; Mohanty, M.K.; Thakurta, P.K.G. Efficient Healthcare Supply Chain: A Prioritized Multi-Task Learning Approach with Task-Specific Regularization. Eng. Appl. Artif. Intell. 2024, 133, 108249. [Google Scholar] [CrossRef]
- Aldrighetti, R.; Zennaro, I.; Finco, S.; Battini, D. Healthcare Supply Chain Simulation with Disruption Considerations: A Case Study from Northern Italy. Glob. J. Flex. Syst. Manag. 2019, 20, 81–102. [Google Scholar] [CrossRef]
- Kumar, V.V.; Sahoo, A.; Balasubramanian, S.K.; Gholston, S. Mitigating Healthcare Supply Chain Challenges under Disaster Conditions: A Holistic AI-Based Analysis of Social Media Data. Int. J. Prod. Res. 2024, 1–19. [Google Scholar] [CrossRef]
- Beaulieu, M.; Bentahar, O. Digitalization of the Healthcare Supply Chain: A Roadmap to Generate Benefits and Effectively Support Healthcare Delivery. Technol. Forecast. Soc. Chang. 2021, 167, 120717. [Google Scholar] [CrossRef]
- Kitsiou, S.; Matopoulos, A.; Manthou, V.; Vlachopoulou, M. Evaluation of Integration Technology Approaches in the Healthcare Supply Chain. Int. J. Value Chain Manag. 2007, 1, 325–343. [Google Scholar] [CrossRef]
- De Vries, J.; Huijsman, R. Supply Chain Management in Health Services: An Overview. Supply Chain Manag. Int. J. 2011, 16, 159–165. [Google Scholar] [CrossRef]
- Pencheon, D. Making Health Care More Sustainable: The Case of the English NHS. Public Health 2015, 129, 1335–1343. [Google Scholar] [CrossRef] [PubMed]
- Acharjya, D.; Dash, M.K. Sustainability of Healthcare Supply Chain Management: A Panoramic Approach through SLR and Bibliometric. Kybernetes, 2024; ahead-of-print. [Google Scholar]
- Seuring, S.; Gold, S. Conducting Content-Analysis Based Literature Reviews in Supply Chain Management. Supply Chain Manag. Int. J. 2012, 17, 544–555. [Google Scholar] [CrossRef]
- Chatterjee, S.; Chaudhuri, R.; Gupta, S.; Mangla, S.K.; Kamble, S. Examining the Influence of Industry 4.0 in Healthcare Supply Chain Performance: Moderating Role of Environmental Dynamism. J. Clean. Prod. 2023, 427, 139195. [Google Scholar] [CrossRef]
- Betcheva, L.; Erhun, F.; Jiang, H. OM Forum—Supply Chain Thinking in Healthcare: Lessons and Outlooks. Manuf. Serv. Oper. Manag. 2021, 23, 1333–1353. [Google Scholar] [CrossRef]
- Hussain, M.; Ajmal, M.M.; Gunasekaran, A.; Khan, M. Exploration of Social Sustainability in Healthcare Supply Chain. J. Clean. Prod. 2018, 203, 977–989. [Google Scholar] [CrossRef]
- Chang, Y.; Iakovou, E.; Shi, W. Blockchain in Global Supply Chains and Cross Border Trade: A Critical Synthesis of the State-of-the-Art, Challenges and Opportunities. Int. J. Prod. Res. 2020, 58, 2082–2099. [Google Scholar] [CrossRef]
- Shih, S.C.; Rivers, P.A.; Hsu, H.Y.S. Strategic Information Technology Alliances for Effective Health-Care Supply Chain Management. Health Serv. Manag. Res. 2009, 22, 140–150. [Google Scholar] [CrossRef] [PubMed]
- Choudhury, N.A.; Ramkumar, M.; Schoenherr, T.; Singh, S. The Role of Operations and Supply Chain Management during Epidemics and Pandemics: Potential and Future Research Opportunities. Transp. Res. Part E Logist. Transp. Rev. 2023, 175, 103139. [Google Scholar] [CrossRef]
- Scavarda, A.; Daú, G.L.; Scavarda, L.F.; Korzenowski, A.L. A Proposed Healthcare Supply Chain Management Framework in the Emerging Economies with the Sustainable Lenses: The Theory, the Practice, and the Policy. Resour. Conserv. Recycl. 2019, 141, 418–430. [Google Scholar] [CrossRef]
- Marques, L.; Martins, M.; Araújo, C. The Healthcare Supply Network: Current State of the Literature and Research Opportunities. Prod. Plan. Control 2020, 31, 590–609. [Google Scholar] [CrossRef]
- Alizadeh, M.; Makui, A.; Paydar, M.M. Forward and Reverse Supply Chain Network Design for Consumer Medical Supplies Considering Biological Risk. Comput. Ind. Eng. 2020, 140, 106229. [Google Scholar] [CrossRef]
- Sazvar, Z.; Zokaee, M.; Tavakkoli-Moghaddam, R.; Salari, S.A.; Nayeri, S. Designing a Sustainable Closed-Loop Pharmaceutical Supply Chain in a Competitive Market Considering Demand Uncertainty, Manufacturer’s Brand and Waste Management. Ann. Oper. Res. 2022, 315, 2057–2088. [Google Scholar] [CrossRef] [PubMed]
- Liu, J.; Jiang, X.; Zhao, J. Resilience of the Supply Chain System Based on Interpretative Structural Modeling. J. Syst. Manag. 2015, 24, 617–623. [Google Scholar]
- Aslam, H.; Khan, A.Q.; Rashid, K.; Rehman, S. Achieving Supply Chain Resilience: The Role of Supply Chain Ambidexterity and Supply Chain Agility. J. Manuf. Technol. Manag. 2020, 31, 1185–1204. [Google Scholar] [CrossRef]
- Christopher, M.; Peck, H. Building the Resilient Supply Chain. Int. J. Logist. Manag. 2004, 15, 1–14. [Google Scholar] [CrossRef]
- Williams, Z.; Ponder, N.; Autry, C.W. Supply Chain Security Culture: Measure Development and Validation. Int. J. Logist. Manag. 2009, 20, 243–260. [Google Scholar] [CrossRef]
- Dubey, R.; Gunasekaran, A.; Childe, S.J.; Papadopoulos, T.; Blome, C.; Luo, Z. Antecedents of Resilient Supply Chains: An Empirical Study. IEEE Trans. Eng. Manag. 2019, 66, 8–19. [Google Scholar] [CrossRef]
- Ponomarov, S.Y.; Holcomb, M.C. Understanding the Concept of Supply Chain Resilience. Int. J. Logist. Manag. 2009, 20, 124–143. [Google Scholar] [CrossRef]
- Hohenstein, N.-O.; Feisel, E.; Hartmann, E.; Giunipero, L. Research on the Phenomenon of Supply Chain Resilience: A Systematic Review and Paths for Further Investigation. Int. J. Phys. Distrib. Logist. 2015, 45, 90–117. [Google Scholar] [CrossRef]
- Chowdhury, M.M.H.; Quaddus, M. Supply Chain Resilience: Conceptualization and Scale Development Using Dynamic Capability Theory. Int. J. Product. Econ. 2017, 188, 185–204. [Google Scholar] [CrossRef]
- Kochan, C.G.; Nowicki, D.R. Supply Chain Resilience: A Systematic Literature Review and Typological Framework. Int. J. Phys. Distrib. Logist. 2018, 48, 842–865. [Google Scholar] [CrossRef]
- Hosseini, S. Review of Quantitative Methods for Supply Chain Resilience Analysis. Transp. Res. Part E Logist. Transp. Rev. 2019, 125, 285–307. [Google Scholar] [CrossRef]
- Shishodia, A.; Sharma, R.; Rajesh, R.; Munim, Z.H. Supply Chain Resilience: A Review, Conceptual Framework and Future Research. Int. J. Logist. Manag. 2023, 34, 879–908. [Google Scholar] [CrossRef]
- Ke, Y.; Lu, L.; Luo, X. Identification and Formation Mechanism of Key Elements of Supply Chain Resilience: Exploration Based on Grounded Theory and Verification of SEM. PLoS ONE 2023, 18, e0293741. [Google Scholar] [CrossRef]
- Ambulkar, S.; Blackhurst, J.; Grawe, S. Firm’s Resilience to Supply Chain Disruptions: Scale Development and Empirical Examination. J. Oper. Manag. 2015, 33–34, 111–122. [Google Scholar] [CrossRef]
- Zepeda, E.D.; Nyaga, G.N.; Young, G.J. Supply Chain Risk Management and Hospital Inventory: Effects of System Affiliation. J. Oper. Manag. 2016, 44, 30–47. [Google Scholar] [CrossRef]
- Harvey, J. Professional Service Supply Chains. J. Oper. Manag. 2016, 42–43, 52–61. [Google Scholar] [CrossRef]
- Baynes, C.; Diadhiou, M.; Lusiola, G.; O’Connell, K.; Dieng, T. Understanding the Financial Burden of Incomplete Abortion: An Analysis of the out-of-Pocket Expenditure on Postabortion Care in Eight Public-Sector Health Care Facilities in Dakar, Senegal. Glob. Public Health 2022, 17, 2206–2221. [Google Scholar] [CrossRef]
- Berke, P.R.; Chuenpagdee, R.; Juntarashote, K.; Chang, S. Human-Ecological Dimensions of Disaster Resiliency in Thailand: Social Capital and Aid Delivery. J. Environ. Plan. Manag. 2008, 51, 303–317. [Google Scholar] [CrossRef]
- Alemsan, N.; Tortorella, G.; Taboada Rodriguez, C.M.; Balouei Jamkhaneh, H.; Lima, R.M. Lean and Resilience in the Healthcare Supply Chain—A Scoping Review. Int. J. Lean Six Sigma 2022, 13, 1058–1078. [Google Scholar] [CrossRef]
- Friedman, D. Evolutionary Games in Economics. Econometrica 1991, 59, 637–666. [Google Scholar] [CrossRef]
- Lyapunov, A.M. The General Problem of the Stability of Motion. Int. J. Control 1992, 55, 531–534. [Google Scholar] [CrossRef]


| Author | Main Contribution |
|---|---|
| Hussain et al. [28] | This paper, based on stakeholder theory, identifies the incentives, barriers, and enablers of social sustainability in the HCSC. |
| Aldrighetti et al. [18] | This paper argues that enabling alternate suppliers is the most effective mitigation strategy for long-term HCSC disruption. |
| Scavarda et al. [32] | This paper analyzes the HCSC in emerging countries and proposes a management framework from a sustainability perspective. |
| Marques et al. [33] | This paper utilizes a systematic literature review approach to synthesize 74 empirical studies (2006–2016) to map the latest HCSC research. |
| Alizadeh et al. [34] | This paper considers biological risks and investigates the design of forward and reverse SC networks for medical consumer products through a programming approach. |
| Sazvar et al. [35] | This paper presents a scenario-based model of a closed-loop pharmaceutical SC network designed to improve pharmaceutical waste’s social and environmental impacts. |
| Senna et al. [12] | This paper explores the impact of supply chain risk management on HCSC performance. |
| Saha and Rathore [4] | This paper explores the impact of Healthcare 4.0 technologies on HCSC performance. |
| MSM | MSR | |
|---|---|---|
| Resilience Investment | ||
| resilience investment | , | |
| resilience non-investment | , | , |
| Equilibrium Point | Jacobi Matrix Eigenvalue | Condition | |||
|---|---|---|---|---|---|
| Sign | |||||
| (0,0) | ESS | ① | |||
| (0,1) | ESS | ② | |||
| (1,0) | ESS | ③ | |||
| (1,1) | ESS | ④ | |||
| MSM | MSR | |
|---|---|---|
| Resilience Investment | ||
| resilience investment | , | |
| resilience non-investment | , | , |
| Equilibrium Point | Jacobi Matrix Eigenvalue | Condition | |||
|---|---|---|---|---|---|
| Sign | |||||
| (0,0) | Instability | \ | |||
| (0,1) | Instability | \ | |||
| (1,0) | ESS | ⑤ | |||
| (1,1) | ESS | ⑥ | |||
Disclaimer/Publisher’s Note: The statements, opinions and data contained in all publications are solely those of the individual author(s) and contributor(s) and not of MDPI and/or the editor(s). MDPI and/or the editor(s) disclaim responsibility for any injury to people or property resulting from any ideas, methods, instructions or products referred to in the content. |
© 2024 by the authors. Licensee MDPI, Basel, Switzerland. This article is an open access article distributed under the terms and conditions of the Creative Commons Attribution (CC BY) license (https://creativecommons.org/licenses/by/4.0/).
Share and Cite
Li, C.; Ke, Y.; Lu, L.; Xu, K. Healthcare Supply Chain Resilience Investment Strategy Analysis Based on Evolutionary Game. Symmetry 2024, 16, 787. https://doi.org/10.3390/sym16070787
Li C, Ke Y, Lu L, Xu K. Healthcare Supply Chain Resilience Investment Strategy Analysis Based on Evolutionary Game. Symmetry. 2024; 16(7):787. https://doi.org/10.3390/sym16070787
Chicago/Turabian StyleLi, Chaoling, Youan Ke, Lin Lu, and Ke Xu. 2024. "Healthcare Supply Chain Resilience Investment Strategy Analysis Based on Evolutionary Game" Symmetry 16, no. 7: 787. https://doi.org/10.3390/sym16070787