Article

Study on Fault Diagnosis of Single-Group Springs of Mining Vibrating Screen

Information Engineering College, Hangzhou Dianzi University, Hangzhou 311305, China
*
Author to whom correspondence should be addressed.
Symmetry 2024, 16(7), 832; https://doi.org/10.3390/sym16070832
Submission received: 28 May 2024 / Revised: 23 June 2024 / Accepted: 29 June 2024 / Published: 2 July 2024
(This article belongs to the Section Engineering and Materials)

Abstract

:
In the mining vibrating screen’s working process, the support spring often fails due to alternating loads and a poor working environment. The six-degrees-of-freedom simplified rigid body dynamic model is established to obtain the vibration response of the mining vibrating screen with a faulty single-group spring and is verified using the ABAQUS (2020) simulation in this paper. Unlike previous studies focusing on multiple-group spring failures or using lower-degree-of-freedom models, this study addresses the common single-group spring failure with the comprehensive model capturing complex spatial motion. This study also reveals that the vibration angle can be used to diagnose the failure location, while the vibration displacement can be used to evaluate the health state of single-group springs. Based on these rules, the novel method for locating a faulty spring group and new evaluation formulas for their health states are validated by the simulations. The results indicate that the failure location is accurately diagnosed, and the errors of the health state evaluation are minimal. The evaluated values are 66.12% and 85.56% when the health states of the spring groups at the feed side and the out-feed side are 65% and 85%, respectively. Therefore, this diagnostic model provides significant theoretical assistance for diagnosing single-group spring failure in the mining vibrating screen, enhancing maintenance strategies and operational reliability.

1. Introduction

As a bridge for transmitting force between the components of a mining vibrating screen, springs are prone to failure due to alternating loads and a poor working environment [1]. The fault characteristics of springs are not obvious [2]. When the mining vibrating screen continues to operate, structures such as bottom beams and side plates are damaged, and the screening efficiency is reduced. Therefore, it is necessary to study the fault diagnosis of the springs of the mining vibrating screen.
Experimental studies on spring failure in the mining vibrating screen can be conducted by replacing the springs multiple times with different health states. However, it is generally expensive and inefficient to conduct experimental studies on large-scale equipment [3]. To overcome these limitations, many scholars have proposed theoretical models for studying spring failure in the mining vibrating screen. For example, Liu et al. established a three-degrees-of-freedom (3-DOF) dynamic model for the mining vibrating screen with damping-free vibration coupling, and discussed the downward compatibility and mutation properties of the coupled model relative to the conventional models. Then, the authors diagnosed 14 types of spring fault combinations based on the characteristics of the model mutation and vibration enhancement caused by spring faults [4]. Manuel et al. proposed a 3-DOF nonlinear dynamic model for the vibrating screens to evaluate the state of the spring. The author believed the dynamic variation of the tilt angle of the vibrating screen during the start and stop stage was significant, and the linear dynamic model could not meet the research needs of the vibrating screen during this stage. Therefore, the terms regarding the tilt angle should not be linearized in the equation. The state of the springs was evaluated by calculating the natural frequency of the system [5]. Peng established a 3-DOF four-point-elastic-support rigid plate (FERP) dynamic model that could describe the failure of the springs of the mining vibrating screen. The system stiffness matrix of the model was derived based on the constructed free vibration response matrix. Furthermore, the inversion of the stiffness of the damping spring was achieved through the decomposition of the stiffness matrix in order to identify the state of the springs quantitatively [6]. Liu et al. proposed a 6-DOF theoretical rigid body model of the mining vibrating screen to investigate the dynamic characteristics under spring failure. The transformation matrix of between-coordinate systems was obtained in the model using Tait–Bryan angles to establish and solve the dynamic equation of the system. By analyzing the combinations of different spring failures, it can be concluded that the key to spring failure diagnosis lies in obtaining the amplitude change rules [7]. Fan et al. considered each spring group to be an independent entity, and established the 6-DOF complete dynamic model of the mining vibrating screen considering the motion of spatial translation and torsion pendulum based on the Lagrangian equation to analyze the motion characteristics of the screen body accurately. It can be concluded that the parameters of the springs led to the coupled motion of the vibrating screen by comparing the vibration amplitude and the long-axis angle of the running trajectory of the feed end, the out-feed end, and the centroid [8]. The single-group spring preferentially bears more initial load and disaster load to accelerate the damage due to the uneven distribution of material and changes in operating conditions during the actual screening process. It is more common for the single-group springs to fail compared to multiple-group springs [9]. Despite the progress of these studies, the traditional fault diagnosis models for these springs typically focus on multiple-group spring failures or using lower-degree-of-freedom models, which do not adequately capture the complex spatial motions. There remains a gap in accurately diagnosing single-group spring failures.
In addition, many indicators that can reflect the spring failure of the mining vibrating screen have been proposed. Guo established a finite element model using ANSYS software (15.0) to address the problem of the permanent deformation of the springs of the mining vibrating screen. The author obtained the amplitude variation coefficients of the mining vibrating screen through simulation data, which served as the basis for judging spring failure [10]. Krot et al. proposed an approach to vibrating screen monitoring and diagnostics based on the phase space plot (PSP) of signal representation and analysis. The coordinates of the generalized variables of screen motion and their derivatives (x/(dx/dt)) were used to represent and interpret the whole portrait of the dynamic system to capture the small changes caused by spring damage [11]. Bao et al. obtained the motion trajectories of the centroid of the screen box under six kinds of spring failure models using ADAMS software (2018), and the results indicated the motion trajectory of the centroid of the screen box under different types of spring failures was entirely different [12]. Peng et al. qualitatively analyzed the dynamic characteristics of the mine vibrating screen with different damping spring health state combinations. It can be concluded that spring fault could cause the mutation of the system model towards more degrees of freedom. Meanwhile, the vibration response of the vibrating screen system becomes more intense, and the beat vibration might occur as well [13]. Chen et al. proposed the method based on chaos theory to analyze and detect the fault condition of damping springs of the mining vibration screen. The chaotic characteristic indexes (i.e., Lyapunov exponent and correlation dimension) of the vibration signal were calculated using chaos theory. It was found that the system was in the chaotic state when the damping spring failed, and there were apparent differences in these indexes under different fault conditions [14]. Pavlo et al. proposed the 6-DOF dynamical model to reflect all linear and rotational components of spatial motion of the sieving screen. The model accounts for stochastic alpha-stable distributed impacts from the material. During the analysis process, the supporting springs are represented by bilinear stiffness characteristics. The weak nonlinear characteristics of the system under conditions of small stiffness changes in springs are recognized through the specific features of the vibration signals (angle of orbit inclination, natural frequency change, harmonics of natural frequency, and phase space plots) [15]. Ahmadi et al. thought the frequency response analysis further enhanced the precision of diagnostics. The frequency response analysis focuses on detecting the minor anomalies of the system, which indicate the early stages of component failure, thereby extending the principles of vibration analysis to provide an understanding of how the frequency response correlates with structural integrity [16]. Similarly, Wen et al. investigated the impact of damage expansion on the frequency response function (FRF) using the integral differential method. The samples undergo impact damage at different locations and are tested with swept sinusoidal frequencies. Additionally, the difference of response (DoR) damage index is introduced to assess response changes before and after damage [17]. These methodologies all underscore the importance of dynamic system analysis in fault diagnosis. In addition, the spring stiffness also affects the amplitude–frequency characteristics, phase–frequency characteristics, screening performance, and processing capacity of the mining vibrating screen [18].
Therefore, the 6-DOF simplified rigid body dynamic model for the mining vibrating screen is established to discuss the impact of single-group spring failure on the dynamic characteristics of the mining vibrating screen in this paper. Unlike previous methods, the proposed method uniquely captures the comprehensive spatial motion induced by single-group spring failures, providing a theoretically more precise and detailed diagnostic tool. The main contributions of this study are twofold: first, the understanding of single-group spring failure dynamics by detailing the vibration responses in the 6-DOF simplified rigid body dynamic model; second, the practical diagnostic methods and evaluation formulas based on the relationship between vibration displacement, vibration angle, and spring health. Additionally, this model is verified using the ABAQUS simulation, ensuring its accuracy and reliability.
These novel model and diagnostic methods provide useful theoretical assistance for diagnosing the single-group spring failure of the mining vibrating screen.

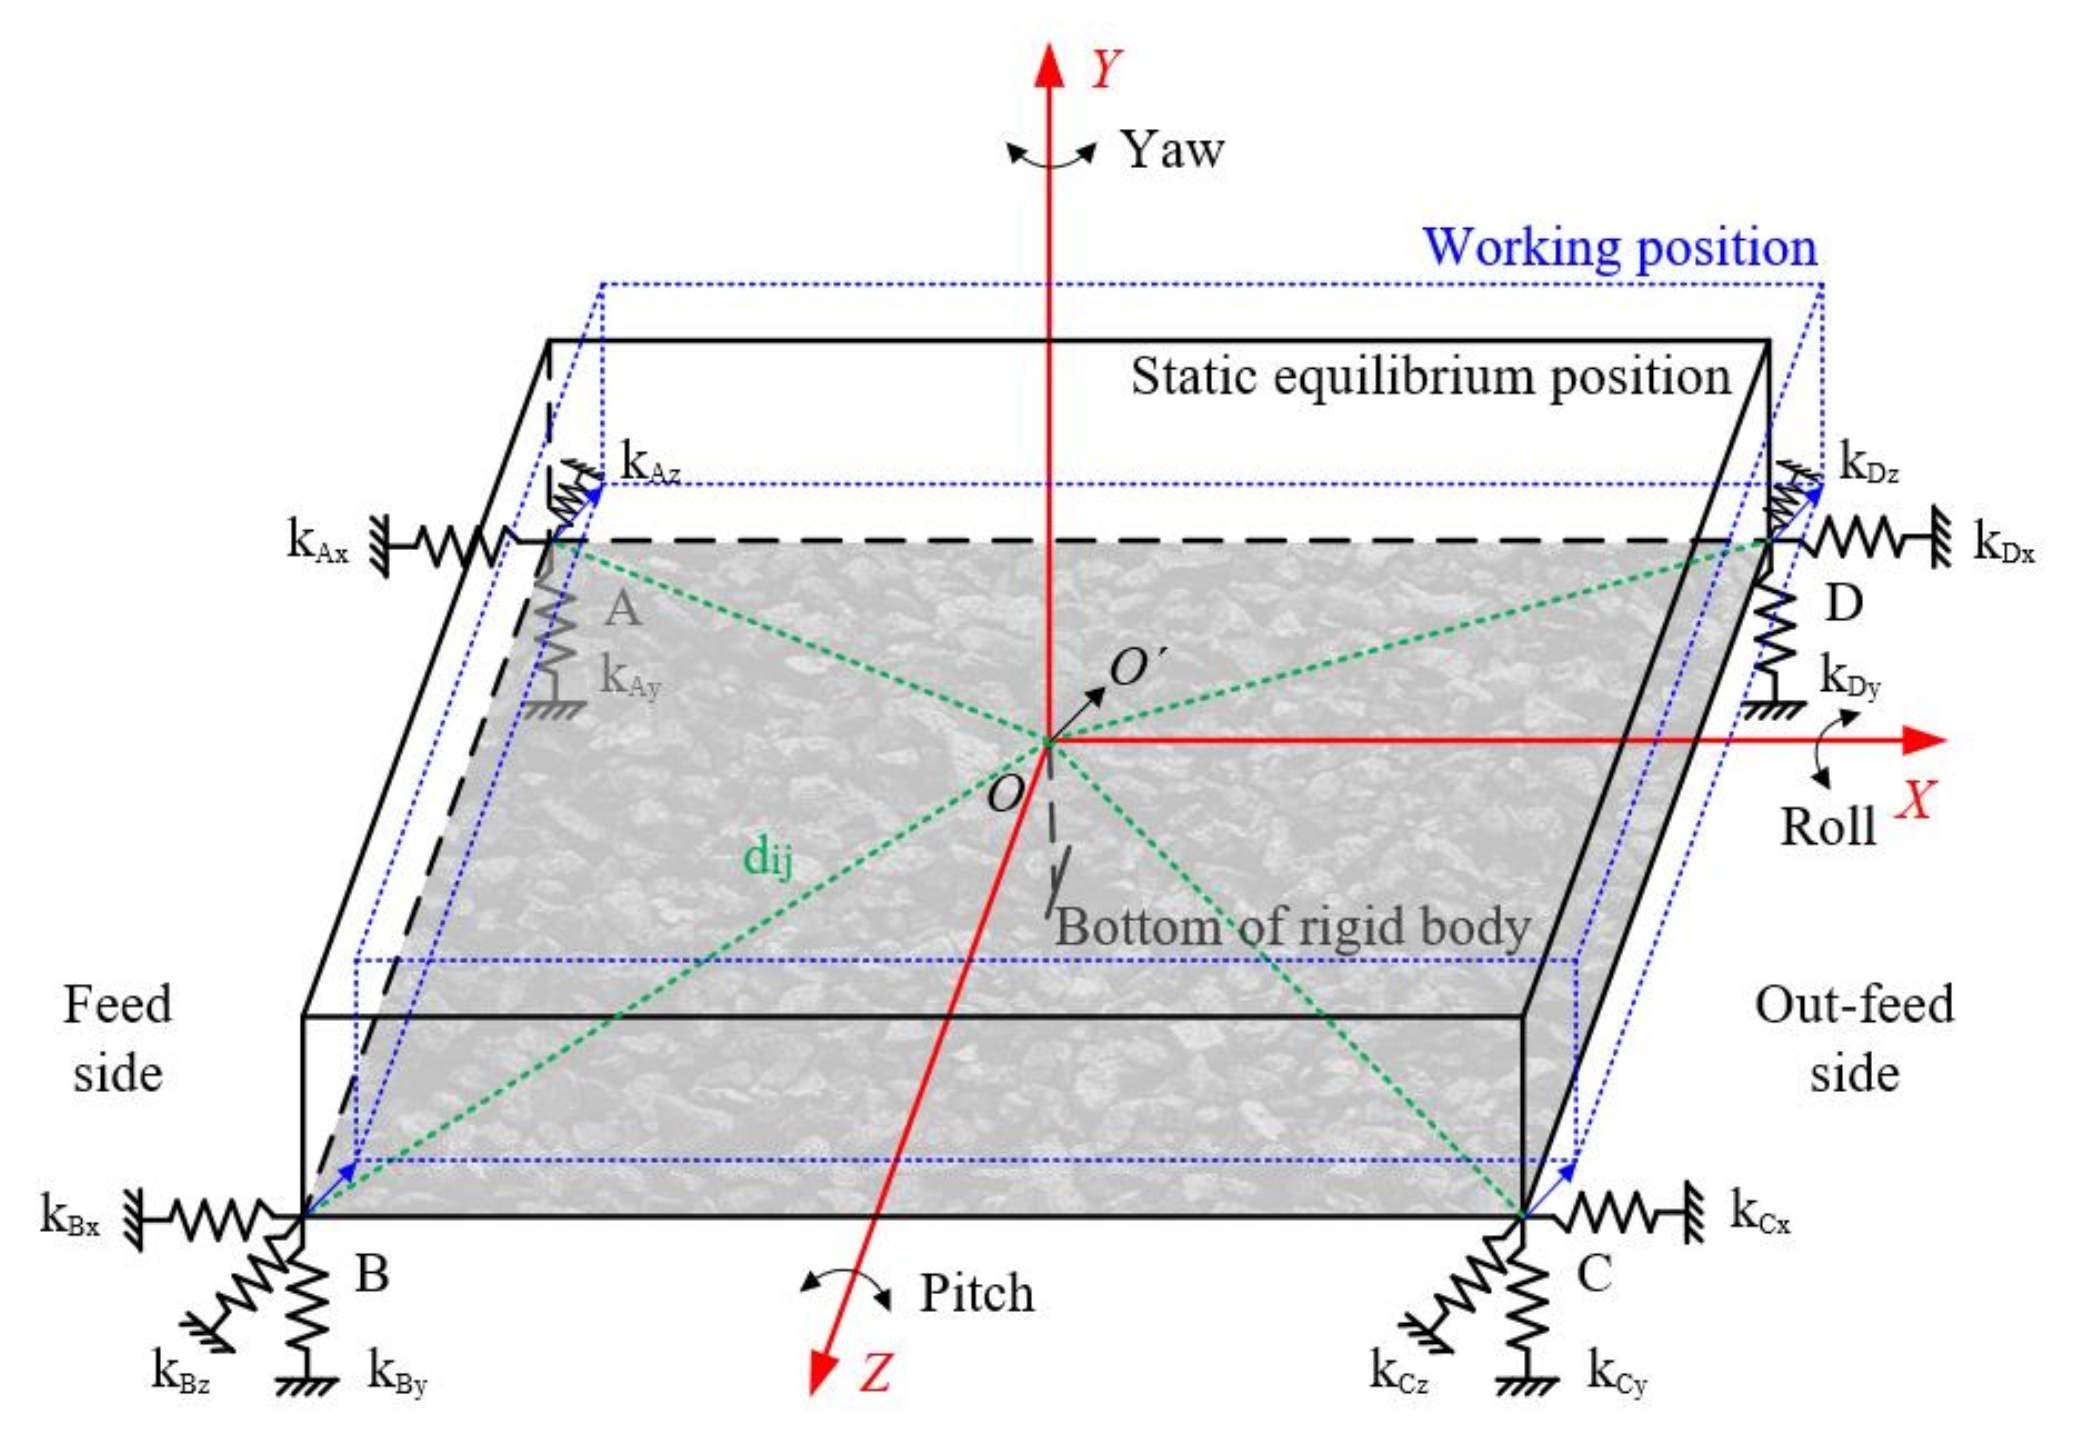
2. Rigid Body Dynamic Model of Mining Vibrating Screen

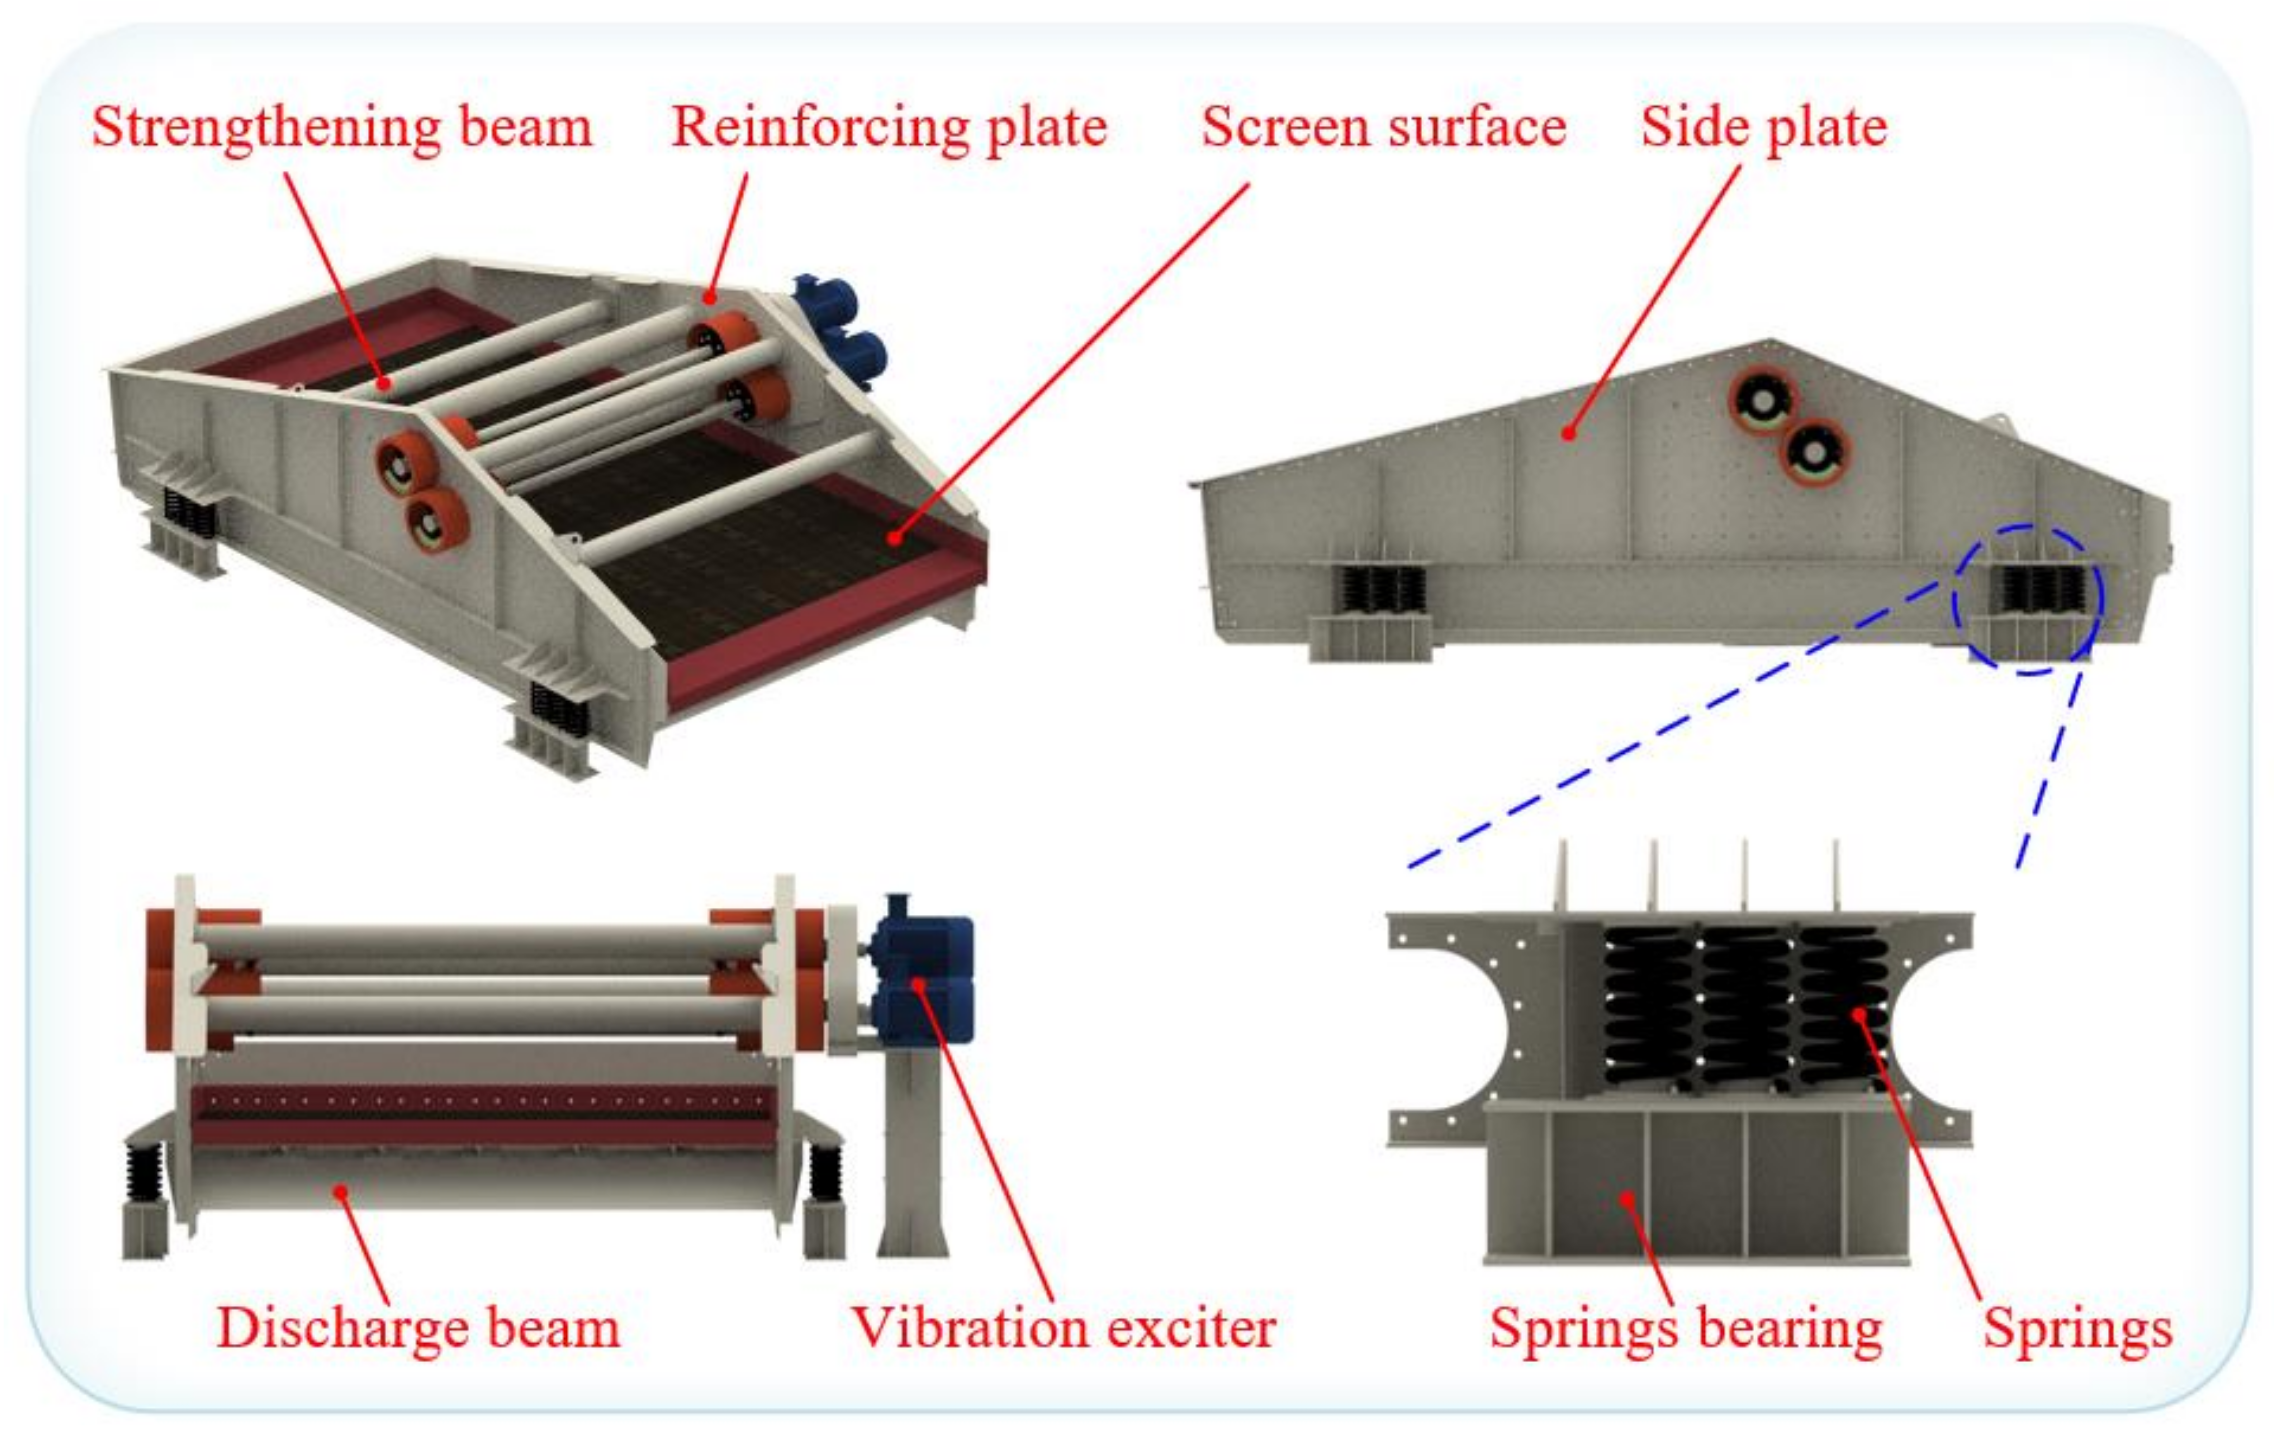
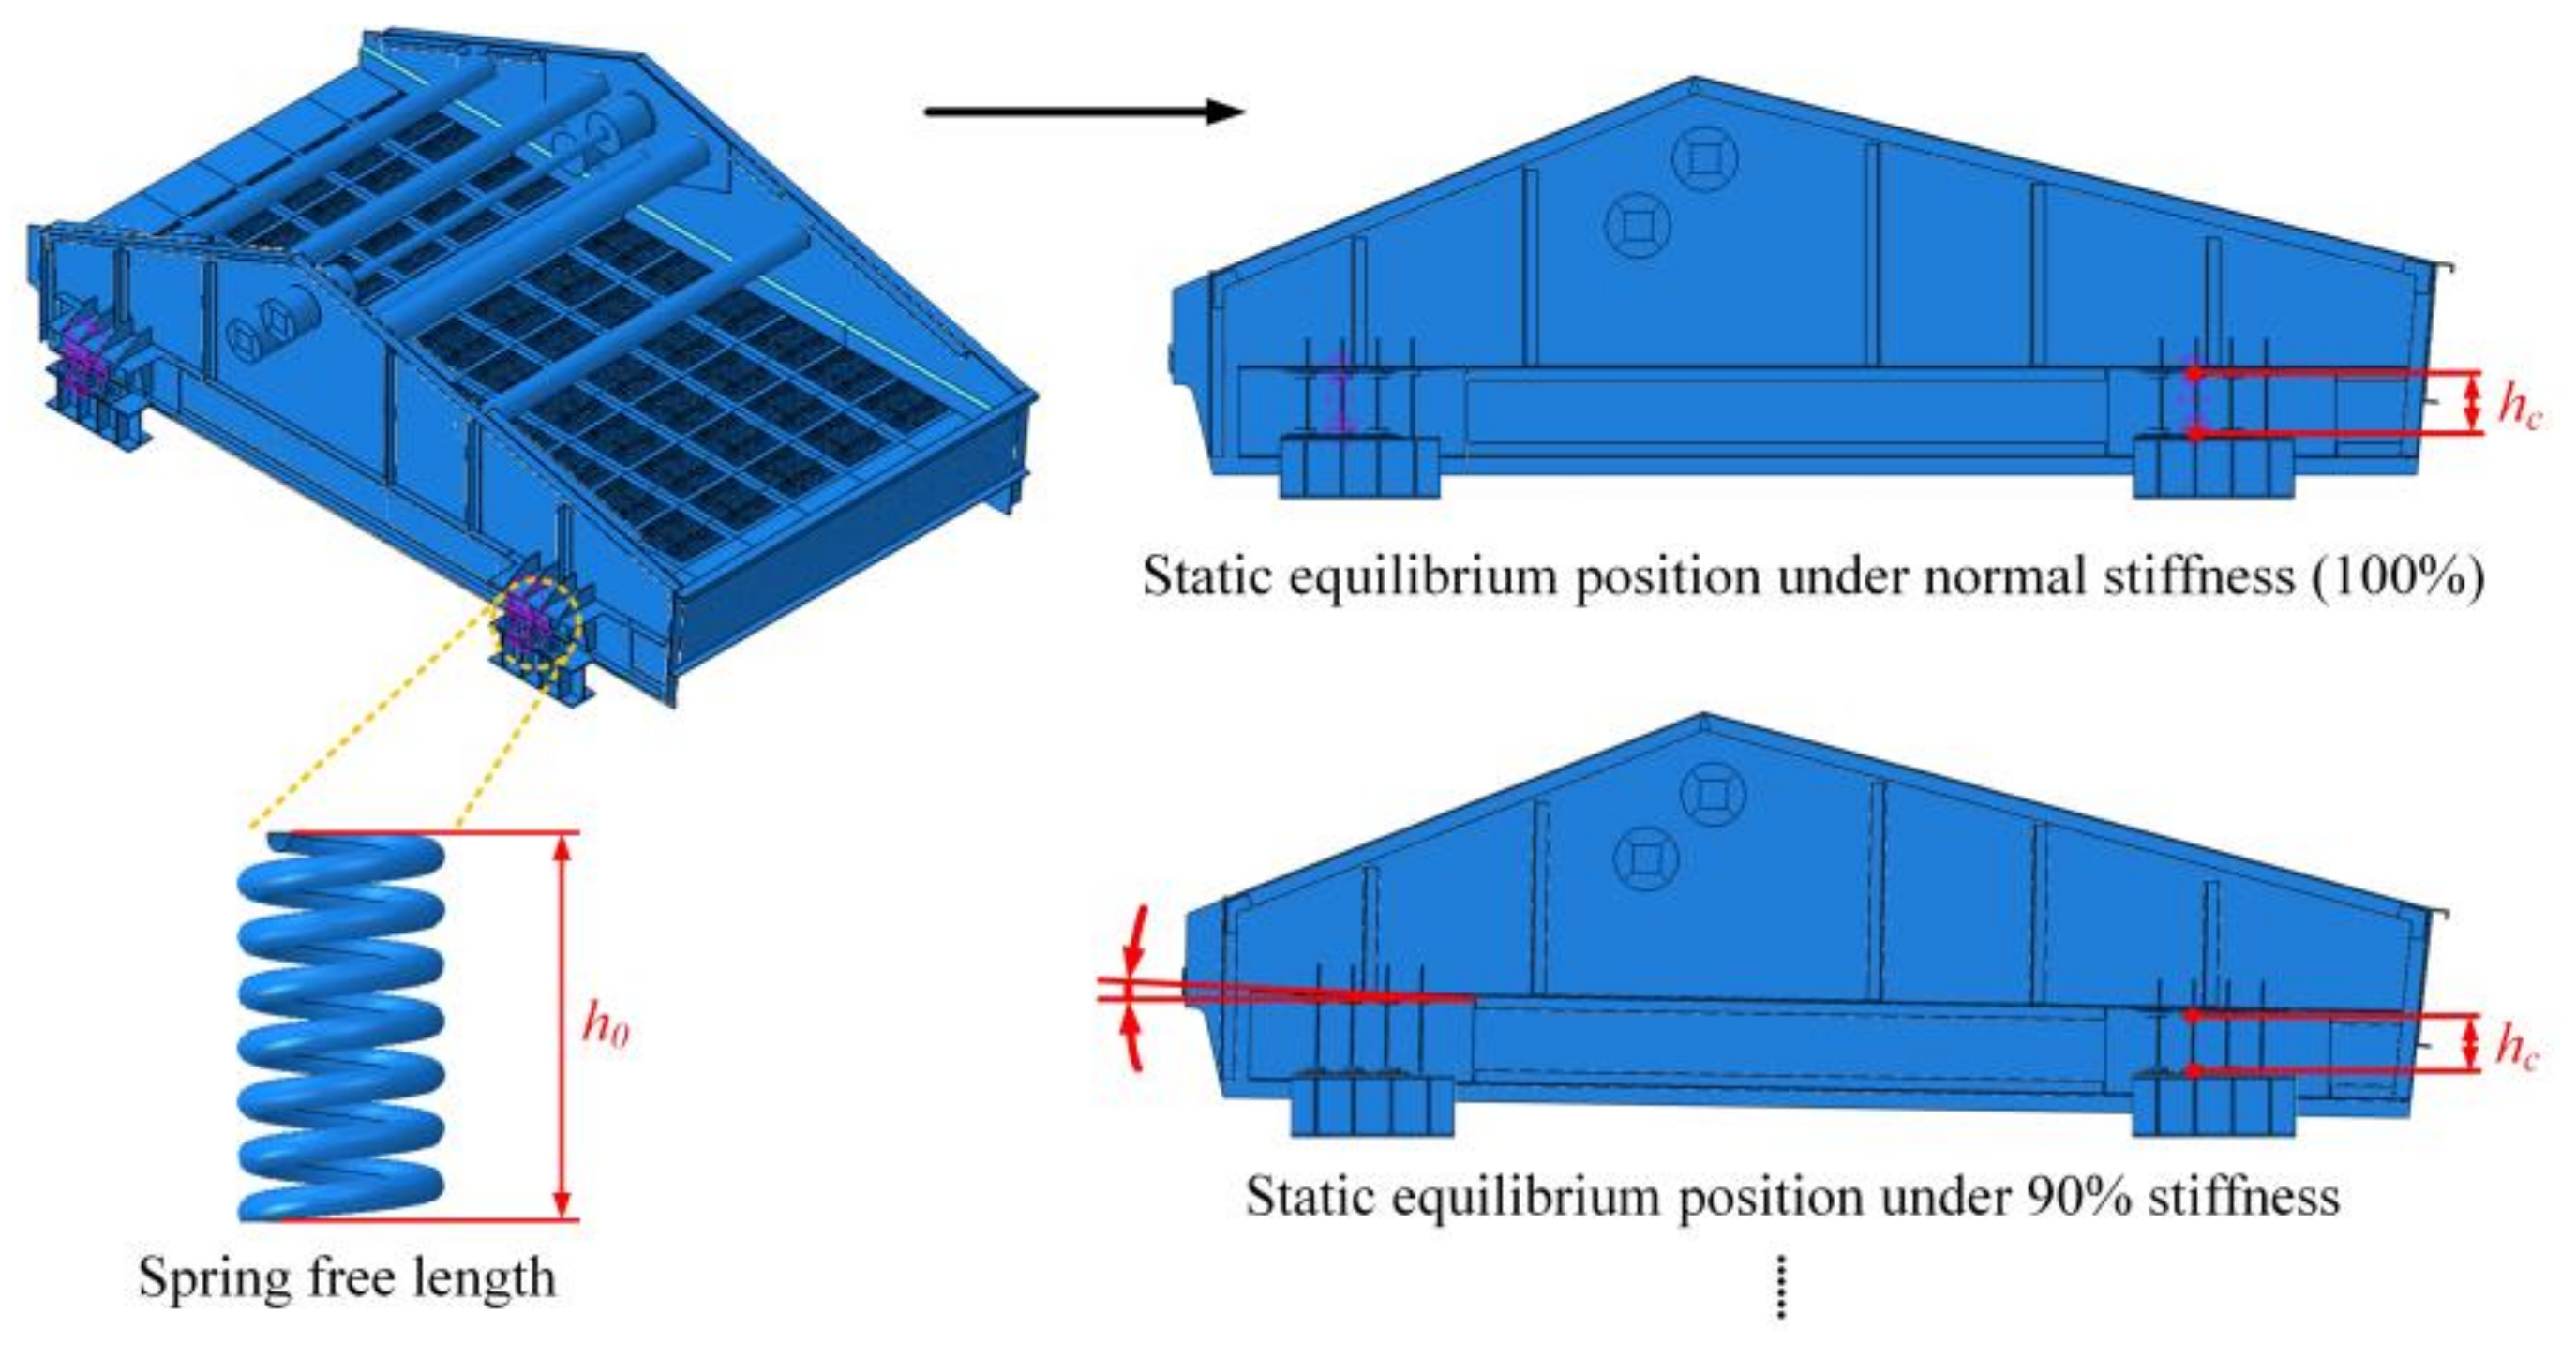
2.1. Mining Vibrating Screen Description

Figure 1 shows the structural diagram of the mining vibrating screen. The screen is designed as a symmetrical structure, which includes the screen box, vibration excites, supporting devices, and transmission devices. The supporting devices consist of the metal spiral springs, support heads, and spring bearings [19].

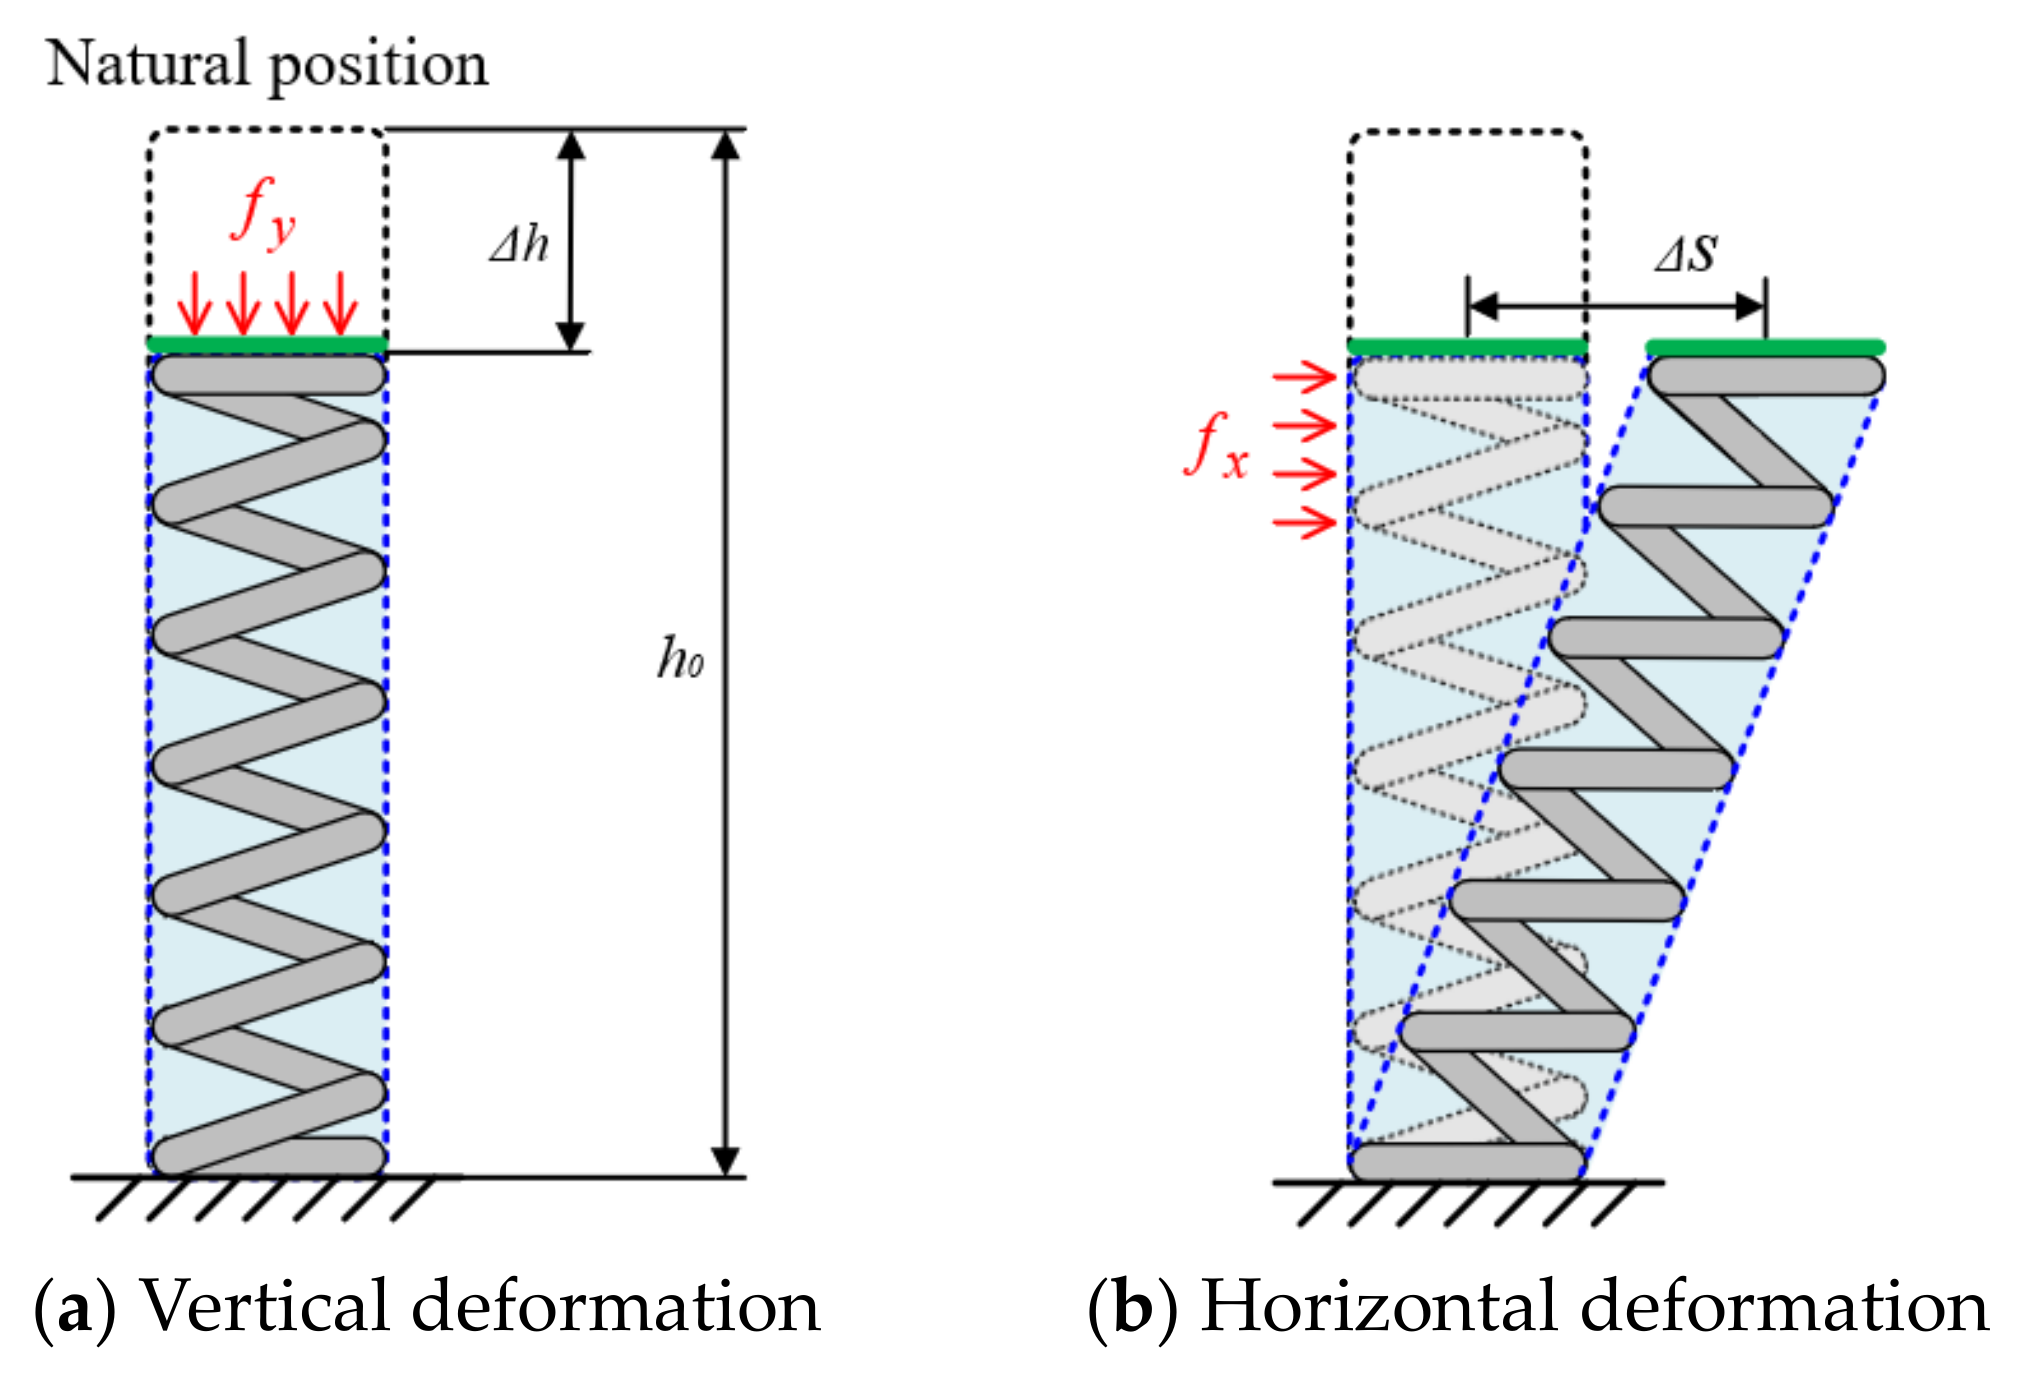
2.2. Simplified Model

The motion characteristics of the mining vibrating screen are complex and variable in practical work. The mining vibrating screen exhibits three rotational motions and translational motions in space. The vibration model with only two or three degrees of freedom cannot adequately capture its motion [20]. Therefore, the 6-DOF simplified rigid body dynamic model for the mining vibrating screen has been established as shown in Figure 2 and the local enlargement drawing is shown in Figure 3.
The coordinate system O-XYZ is established, with the origin located at the centroid of the screen box during static equilibrium. The moments of inertia at the centroid are Jx, Jy, and Jz, respectively. Moreover, the screen box and material are simplified into rigid bodies of uniform mass, with masses of m1 and m2, respectively. Each group of springs is simplified into three springs in the X, Y, and Z directions to facilitate the calculation. The stiffness is denoted as kij (where the position of the support is represented by i and the direction is represented by j). The distance from each group of springs to the centroid is dij. The motion of the mining vibrating screen can be represented by the translational motion (x, y, z) and rotational motion (θx, θy, θz) of the centroid.
The kinetic energy T and elastic potential energy U of the rigid body are expressed as:
T = 1 2 ( m 1 + m 2 ) x ˙ 2 + 1 2 ( m 1 + m 2 ) y ˙ 2 + 1 2 ( m 1 + m 2 ) z ˙ 2 + 1 2 J x θ ˙ x 2 + 1 2 J y θ ˙ y 2 + 1 2 J z θ ˙ z 2
U = 1 2 k A x [ x d A z θ y + d A y θ z ] 2 + 1 2 k B x [ x + d B z θ y + d B y θ z ] 2 + 1 2 k C x [ x + d C z θ y d C y θ z ] 2 + 1 2 k D x [ x d D z θ y d D y θ z ] 2 + 1 2 k A y [ y + d A z θ x + d A x θ z ] 2 + 1 2 k B y [ y d B z θ x + d B x θ z ] 2 + 1 2 k C y [ y d C z θ x d C x θ z ] 2 + 1 2 k D y [ y + d D z θ x d D x θ z ] 2 + 1 2 k A z [ z + d A y θ x + d A x θ y ] 2 + 1 2 k B z [ z d B y θ x + d B x θ y ] 2 + 1 2 k C z [ z d C y θ x d C x θ y ] 2 + 1 2 k D z [ z + d D y θ x d D x θ y ] 2
where x ˙ , y ˙ , and z ˙ are the linear velocities of the X, Y, and Z directions, θ ˙ x , θ ˙ y , and θ ˙ z are the angular velocities around the X, Y, and Z axes. Due to the small values of the three rotation angles, sin θ = θ and cos θ = 1 .
The vibration differential equation based on the Lagrange equation is expressed as [21]:
d d t L q ˙ L q = Q
where L is the Lagrange function, q is the generalized coordinates, q ˙ is the generalized velocity, and Q is the excitation of the system.
The dynamic equation is expressed as:
M q ¨ + K q = Q
where q ¨ is the generalized acceleration, and M and K are the mass and stiffness matrices, respectively.
M = m 1 + m 2 0 0 0 m 1 + m 2 m 1 + m 2 J x J y 0 0 0 J z
K = K 11 0 0 0 K 15 K 16 0 K 22 0 K 24 0 K 26 0 0 K 33 K 34 K 35 0 0 K 42 K 43 K 44 K 45 K 46 K 51 0 K 53 K 54 K 55 K 56 K 61 K 62 0 K 64 K 65 K 66
where the elements in the stiffness matrix are as follows:
K 11 = k A x + k B x + k C x + d D x ,
K 15 = K 51 = k A x d A z k B x d B z k C x d C z + k D x d D z ,
K 16 = K 61 = k A x d A y k B x d B y k C x d C y k D x d D y ,
K 22 = k A y + k B y + k C y + k D y ,
K 24 = K 42 = k A y d A z + k B y d B z + k C y d C z k D y d D z ,
K 26 = K 62 = k A y d A x + k B y d B x k C y d C x k D y d D x ,
K 33 = k A z + k B z + k C z + k D z ,
K 34 = K 43 = k A z d A y + k B z d B y + k C z d C y + k D z d D y ,
K 35 = K 53 = k A z d A x k B z d B x + k C z d C x + k D z d D x ,
K 44 = k A y d A z 2 + k B y d B z 2 + k C y d C z 2 + k D y d D z 2 + k A z d A y 2 + k B z d B y 2 + k C z d C y 2 + k D z d D y 2 ,
K 45 = K 54 = k A z d A x d A y + k B z d B x d B y k C z d C x d C y k D z d D x d D y ,
K 46 = K 64 = k A y d A x d A z k B y d B x d B z + k C y d C x d C z k D y d D x d D z ,
K 55 = k A x d A z 2 + k B x d B z 2 + k C x d C z 2 + k D x d D z 2 + k A z d A x 2 + k B z d B x 2 + k C z d C x 2 + k D z d D x 2 ,
K 56 = K 65 = k A x d A y d A z k B x d B y d B z k C x d C y d C z + k D x d D y d D z ,
K 66 = k A x d A y 2 + k B x d B y 2 + k C x d C y 2 + k D x d D y 2 + k A y d A x 2 + k B y d B x 2 + k C y d C x 2 + k D y d D x 2 .
The stiffness of the spring consists of vertical and horizontal stiffness [22]. The detailed calculation process is as follows:
The spring is compressed when subjected to the vertical load as shown in Figure 4a. The vertical stiffness of the spring is expressed as:
k y = f y h = G d 4 8 n e D 3
where G is the shearing modulus of the spring steel, d is the diameter of the spring wire, ne is the effective number of coils, and D is the pitching diameter of the spring.
Then, the spring is stretched after being subjected to the horizontal load as shown in Figure 4b. The horizontal stiffness of the spring is expressed as [23]:
k x , z = f x s = 0.7 × 10 10 × d 4 C s n e D ( 0.204 H 2 + 0.256 D 2 )
where Cs is the correction factor for the influence of the vertical load, and H is the difference between the free height H0 and the static deformation H1 of the spring.
The relationship between the horizontal stiffness and vertical stiffness is represented as:
k x , z = 5.6 × 10 10 D 2 G C s ( 0.204 H 2 + 0.256 D 2 ) k y
The damping matrix is indispensable to better analyze the stability and dynamic performance of the vibration system. It is a linear combination of the mass matrix and the stiffness matrix [22]. The damping matrix is expressed as:
C = a M + b K
where coefficients a and b are both 0.02 [24].
The dynamic equation can be written as:
M q ¨ + C q ˙ + K q = Q
When the resultant force of the excitation force acts on the centroid of the screen box, Q is expressed as:
Q = [ 8 m 0 r ω 2 cos β sin ω t 8 m 0 r ω 2 sin β sin ω t 0 0 0 8 m 0 r ω 2 cos β sin ω t δ ]
where m0 is the mass of the eccentric block, r is the eccentricity, ω is the angular velocity of the eccentric block, β is the vibration direction angle, and δ is the normal distance from the centroid to the active line of the excitation force.

3. Numerical Analysis

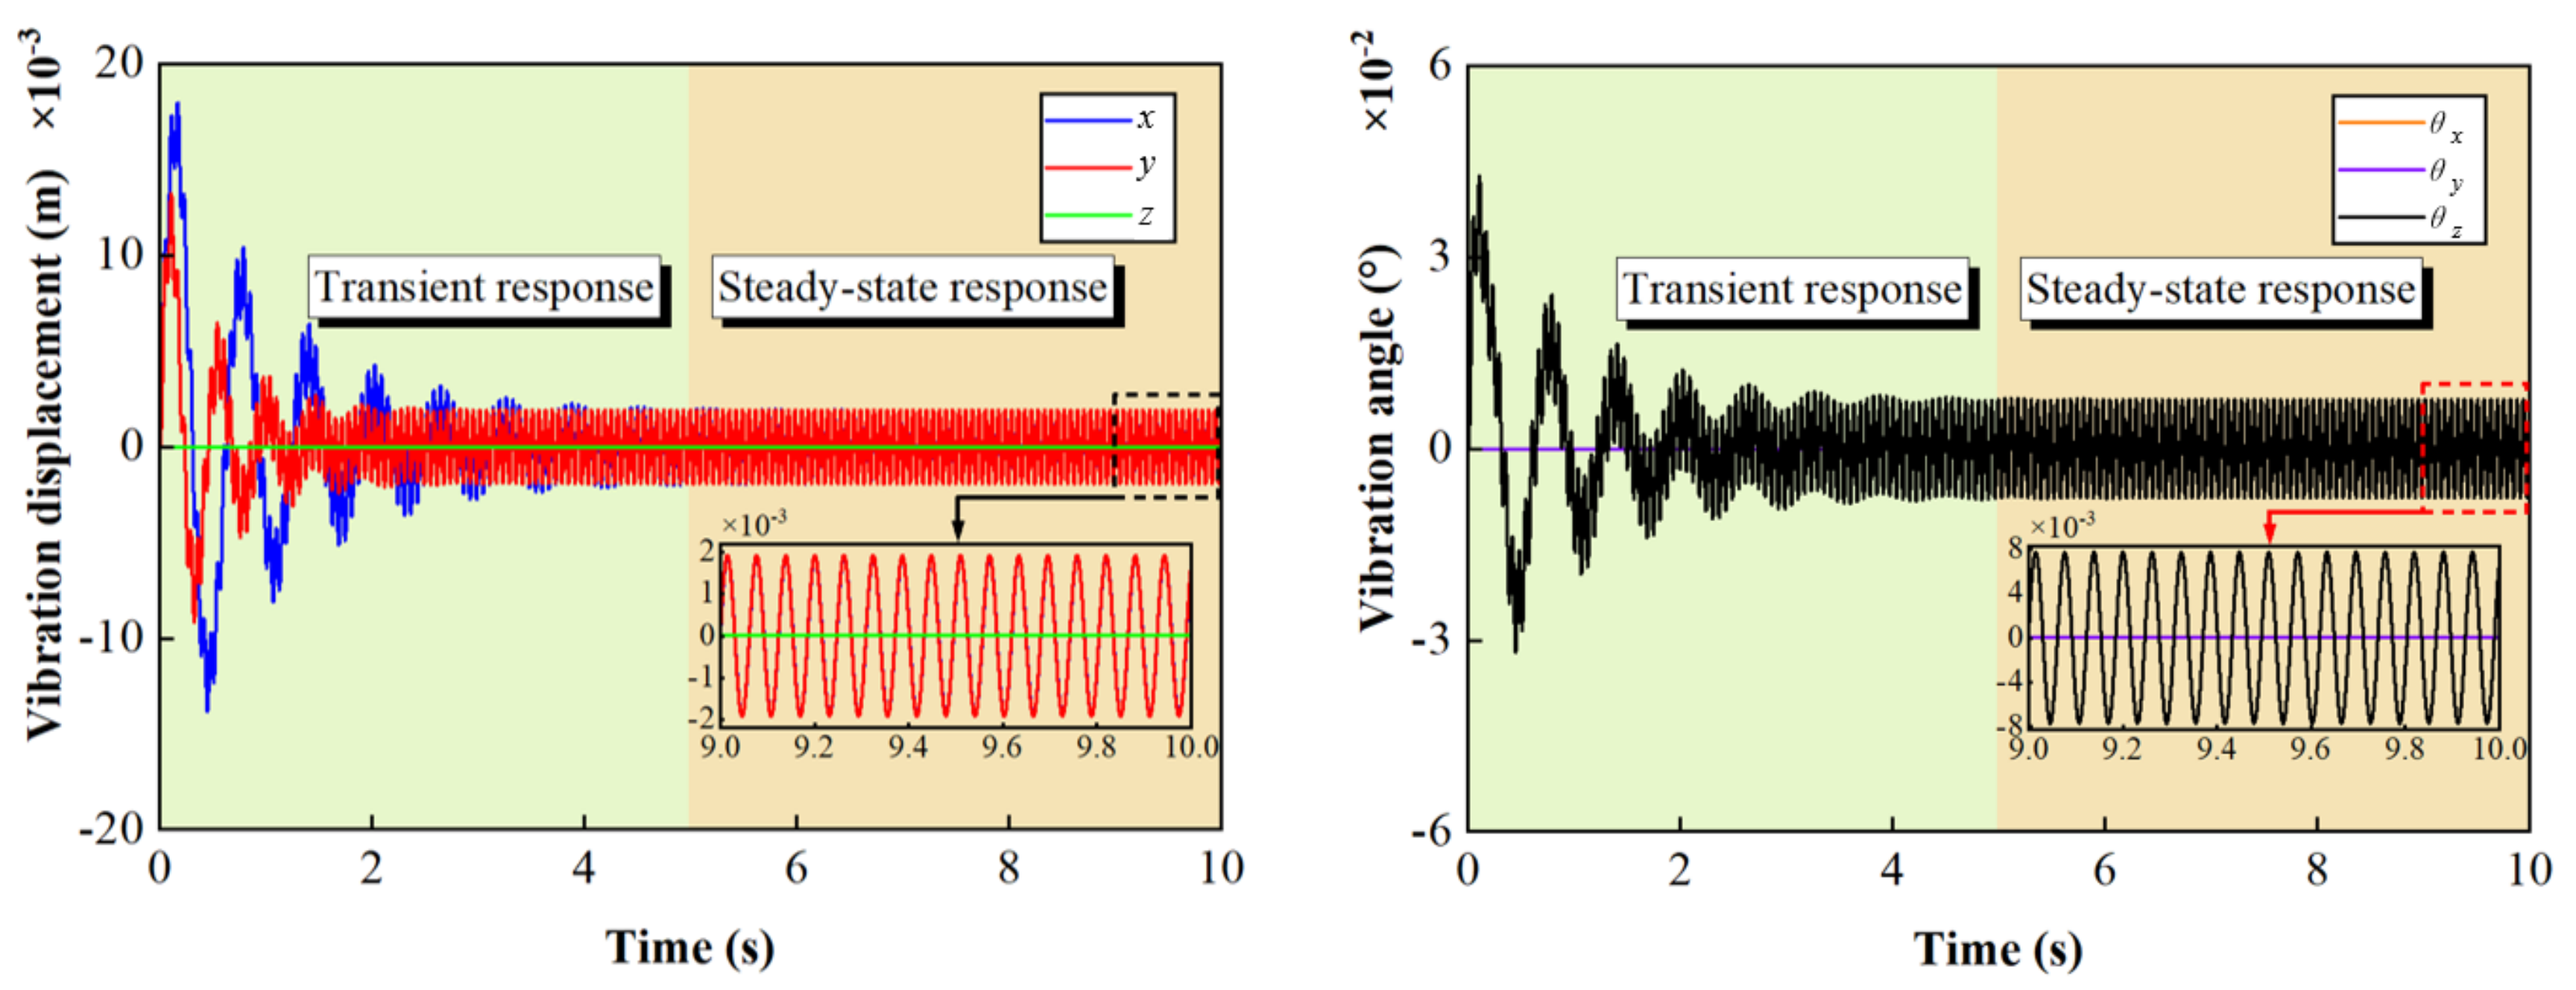
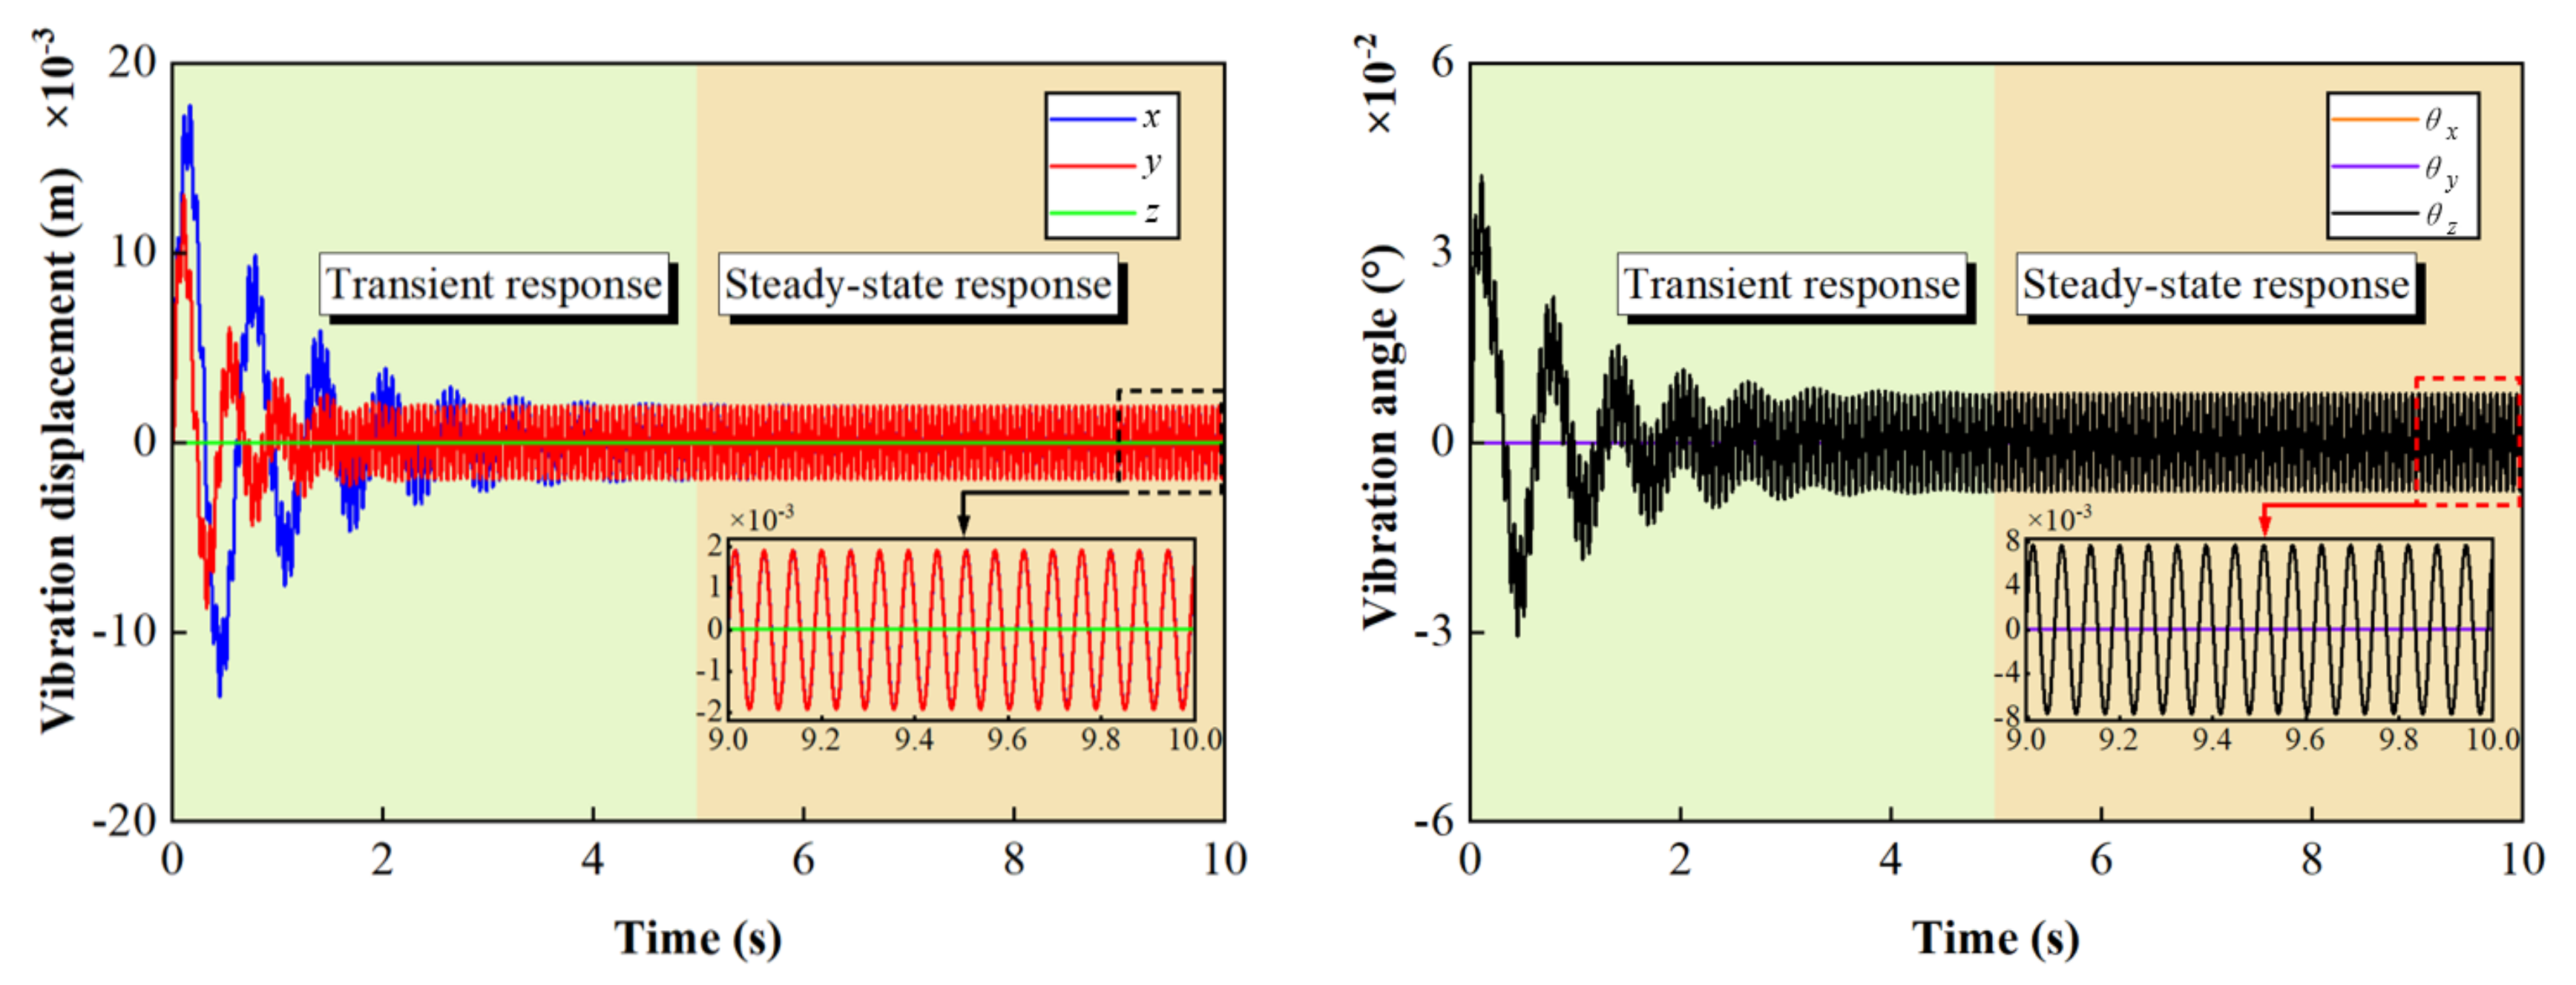
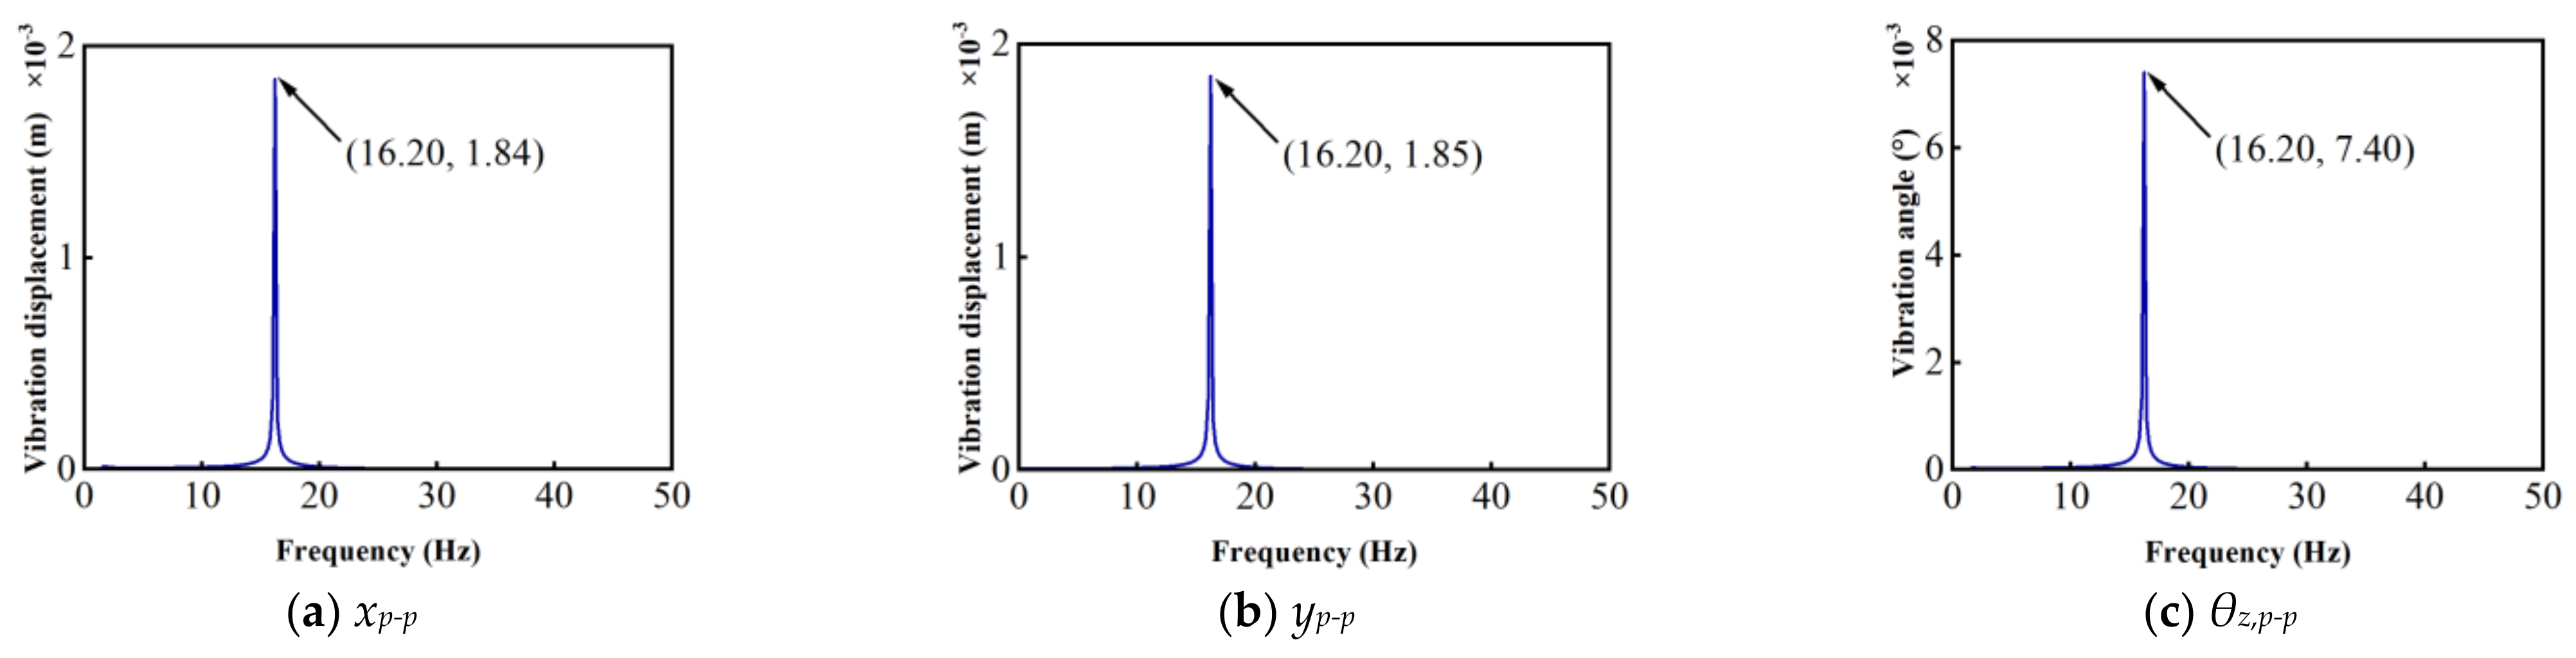
3.1. Numerical Results

The vibration response of the mining vibrating screen is obtained through the Newmark-β algorithm in MATLAB (2022). The parameters are shown in Table 1.
The vibration of the system includes x, y, and θz under the normal working condition as shown in Figure 5.
It can be seen from Figure 5 that there is a brief mutation in vibration response between 0 and 5 s caused by the presence of resonance during the initiation phase. When the mining vibrating screen is stable, the peak-to-peak values of vibration displacement (i.e., xp-p and yp-p) in the X and Y directions are 3.81 × 10⁻³ and 3.85 × 10⁻³ m, respectively, and that of the vibration angle (i.e., θz,p-p) around the Z axis is 1.542 × 10⁻²°. The spectrograms of vibration response during the stable operation phase are obtained using Fast Fourier Transform (FFT) as shown in Figure 6. The main frequencies are all 16.20 Hz.

3.2. Simulation Verification

The simulation is conducted using ABAQUS under the same operating condition to verify the effectiveness of the established model. The simulation results are shown in Figure 7.
It can be seen from Figure 7 that the xp-p and yp-p are 3.83 × 10⁻³ and 3.84 × 10⁻³ m, respectively, and θz,p-p is 1.538 × 10⁻²°. The spectrograms of the vibration response during the stable operation are obtained using FFT as shown in Figure 8. The main frequencies are also all 16.20 Hz.
The comparison of the results is shown in Table 2. It can be concluded that the error between the two calculation results is within 1%, indicating the effectiveness of the established rigid body dynamic model. Therefore, the model can be used for the fault diagnosis of springs in the mining vibration screen.

4. Fault Diagnosis Method of Single-Group Springs

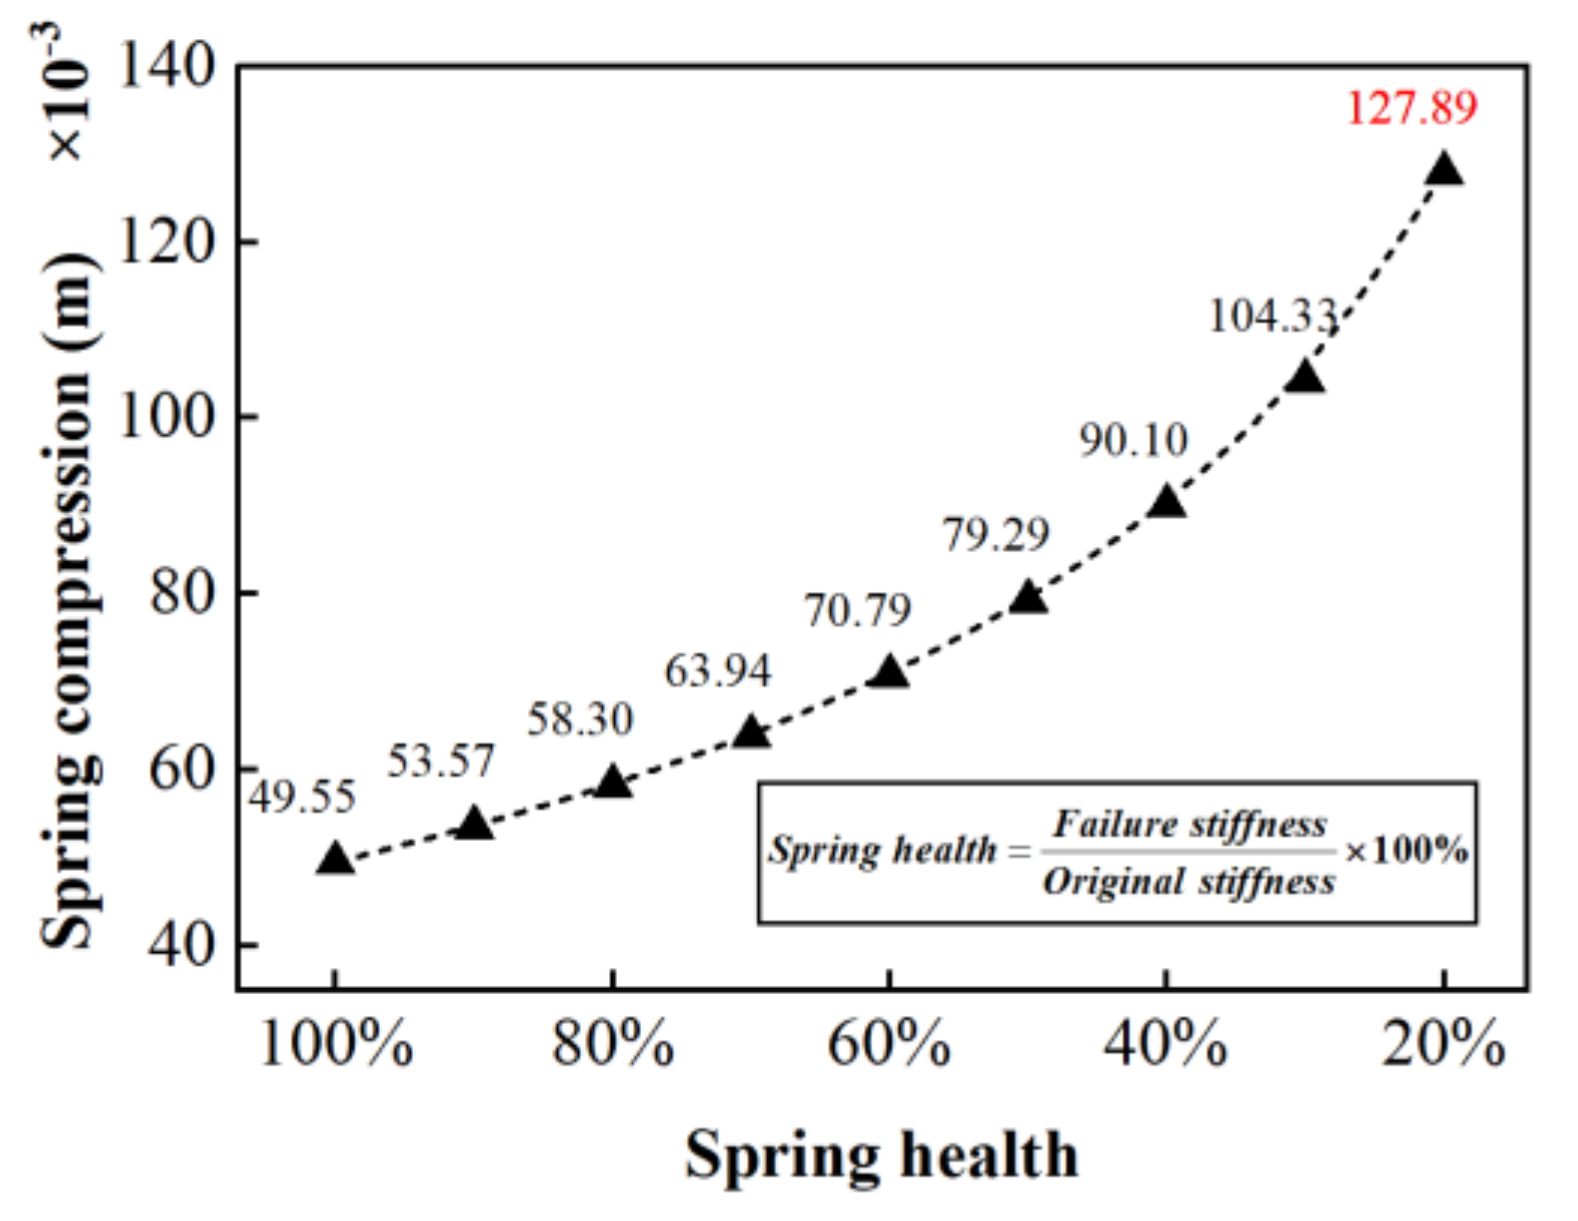
4.1. Limit of Health of Faulty Single-Group Springs

The spring of the mining vibrating screen is subject to fatigue accumulation and material aging, etc., due to the long-term exposure to alternating loads [25]. This leads to a decrease in the stiffness of the spring [26]. As the stiffness decreases, the spring health deteriorates and the compression amount of the spring increases until it reaches the maximum.
The compression amounts of the single-group springs under different health states in the static equilibrium condition are obtained by adjusting the stiffness of the single-group springs within the ABAQUS model, as shown in Figure 9. Among them, hc represents the length of the compressed spring group. The compression amounts under different health states are shown in Figure 10.
It can be seen from Figure 10 that the single-group springs are compressed to 127.89 mm when the spring health drops to 20%. The compression amount is close to the maximum designed compression amount of 127.31 mm. The spring must be replaced at this point. Therefore, the limit of health is 20%.
In order to effectively study the failure location and spring health of the single-group springs, the spring health is discretized. The flowchart is shown in Figure 11. Assuming the spring group (i.e., KB) at position B fails, the spring health of KB is discretized to obtain the vibration responses under different spring health states, which are used to diagnose the failure location and spring health of KB.

4.2. Fault Diagnosis

The vibration angle at the centroid of the mining vibrating screen is obtained through the established model as shown in Figure 12.
It can be seen from Figure 12 that the vibration angle (i.e., θx,p-p and θy,p-p) around the X and Y axes increases with the decrease in spring health, regardless of the location of the faulty spring group. This is because the decrease in spring health makes the spring more easily compressed or stretched, leading to the decrease in the natural frequency and flexibility of the system, which ultimately increases the vibration angle in the X and Y directions. However, θz,p-p decreases with the decrease in spring health when the faulty spring group is located at the feed side, while the situation is the opposite at the out-feed side. This is due to the difference between the resultant moments of force on the mining vibration screen.
The difference between θz,p-p under fault conditions and the normal condition is shown in Figure 13.
It can be seen from Figure 13 that θz,p-p at the feed side is greater than that under the normal condition. By contrast, the θz,p-p values at the out-feed side are all less than those under the normal condition. Therefore, the difference in the peak-to-peak values can be used to determine whether the failed spring group is located at the feed side or the out-feed side.
In order to determine the specific location of the faulty spring group, the relationships between the vibration angles around the X and Y axes and the vibration angle around the Z axis are shown in Figure 14, respectively.
The effect of the single-group springs with different stiffnesses on the slope of the long axis of the ellipse is further studied, as shown in Figure 15.
It can be seen from Figure 14 and Figure 15 that the slope of long axis of the ellipse, which is composed of the vibration angle around the X and Z axes, is positive when the KA or KD (i.e., the spring group of the feed side) fails. Additionally, the slope of the long axis of the ellipse increases as the stiffness increases. The slope of the long axis of the ellipse is negative when the spring group KB or KC (i.e., the spring group of the out-feed side) fails. Additionally, the slope of the long axis of the ellipse decreases as the stiffness decreases. Under the corresponding operating condition, the positive and negative of the slopes of the long axis of the ellipse composed of vibration angle around the Y and Z axes is opposite of the former. Therefore, the positive and negative of the slopes can be used to determine the specific location of the faulty spring group. The change rule of the slope is shown in Table 3 and Table 4.
The vibration displacement at the centroid of the mining vibrating screen is shown in Figure 16. The peak-to-peak values of that under different spring health states are shown in Table 5.
Due to the symmetry of the structure, the responses at the centroid of the mining vibrating screen are consistent when the spring group in the symmetrical position fails.
It can be seen from Table 5 that the peak-to-peak values change with the spring health. Specifically, xp-p decreases with the decrease in spring health. When the health of the single-group springs at the feed side and the out-feed side decreases to 20%, xp-p decreases to 3.8071 × 10⁻³ and 3.8074 × 10⁻³ m, respectively. Similarly, yp-p decreases to 3.8313 × 10⁻³ and 3.8360 × 10⁻³ m, respectively. By contrast, zp-p increases with the decrease in spring health, which increases to 0.0193 × 10⁻⁵ and 0.0385 × 10⁻⁵ m, respectively. This is because the dynamic balance of the system is disrupted, resulting in changes in energy distribution and vibration mode.
The vibration data are fitted using the least squares method to study the relationship between vibration displacement and spring health. The fitting formula is expressed as follows:
H e a l t h f e e d = 1.108 × exp ( A 5.425 0.01894 ) 2 × 100 % H e a l t h o u t f e e d = 1.104 × exp ( A 5.424 0.01512 ) 2 × 100 %
where A = x p p 2 + y p p 2 + z p p 2 .
The fitting effect is shown in Figure 17.
From the perspective of the goodness of fit R2, an R2 of 0.8 or above can achieve a good fitting effect [27]. It can be seen from Figure 15 that the R2 is above 0.9, which is much greater than 0.8. The fitted curve results can effectively represent the relationship between vibration displacement and spring health.

5. Fault Diagnosis Validation

During the ideal diagnosis process, it is possible to replace the single-group springs of the mining vibration screen and obtain the response through sensors. However, replacing the normal springs with faulty springs in existing vibration systems is not encouraged by industrial customers.
The simulations are carried out using ABAQUS to verify the proposed fault diagnosis method for single-group springs. The difference from the normal working condition is that the spring health of KB decreases to 65% (Condition 1) or KC decreases to 85% (Condition 2). Other parameters are the same as those in Table 1. The results of the steady-state response of the simulations are shown in Figure 18.
The difference between the peak-to-peak values of the vibration angle around the Z axis under fault conditions and the normal condition is shown in Figure 19a. The relationships between the vibration angles around the X and Y axes and the vibration angle around the Z axis are shown in Figure 19b.
It can be seen from Figure 19a that the θz,p-p of Condition 1 is less than that under the normal condition. However, Condition 2 is the opposite. This indicates that the faulty single-group spring is located at the feed side under Condition 1, and located at the out-feed side under Condition 2. Moreover, it can be seen from Figure 19b that the slopes of the long axis of the ellipse composed of the vibration angles around the X and Z axes are negative under both conditions, while the slopes of the long axis of the ellipse composed of the vibration angles around the Y and Z axes are positive. Corresponding to Table 3 and Table 4, it can be concluded that KB fails under Condition 1, and KC fails under Condition 2.
The results of the steady-state response are substituted into Equation (13) to calculate the health of KB and KC, which are 66.12% and 85.56%, respectively. The errors are 1.7% and 0.66%, respectively. Therefore, the proposed fault diagnosis method can provide theoretical assistance for diagnosing the single-group spring failure of the mining vibrating screen.

6. Conclusions

In the mining vibrating screen’s working process, the support spring often fails due to alternating loads and a poor working environment. It is necessary to study the fault diagnosis of the springs in the vibrating screen. Therefore, the 6-DOF simplified rigid body dynamic model is established to obtain the vibration response of the mining vibrating screen with faulty single-group springs in this paper. Additionally, the fault diagnosis method of single-group springs is proposed. The main conclusions are as follows:
(1)
The simplified model is established to analyze the vibration of the mining vibrating screen and is verified using ABAQUS simulations. The errors are all maintained within 1%, confirming the effectiveness of the simplified model.
(2)
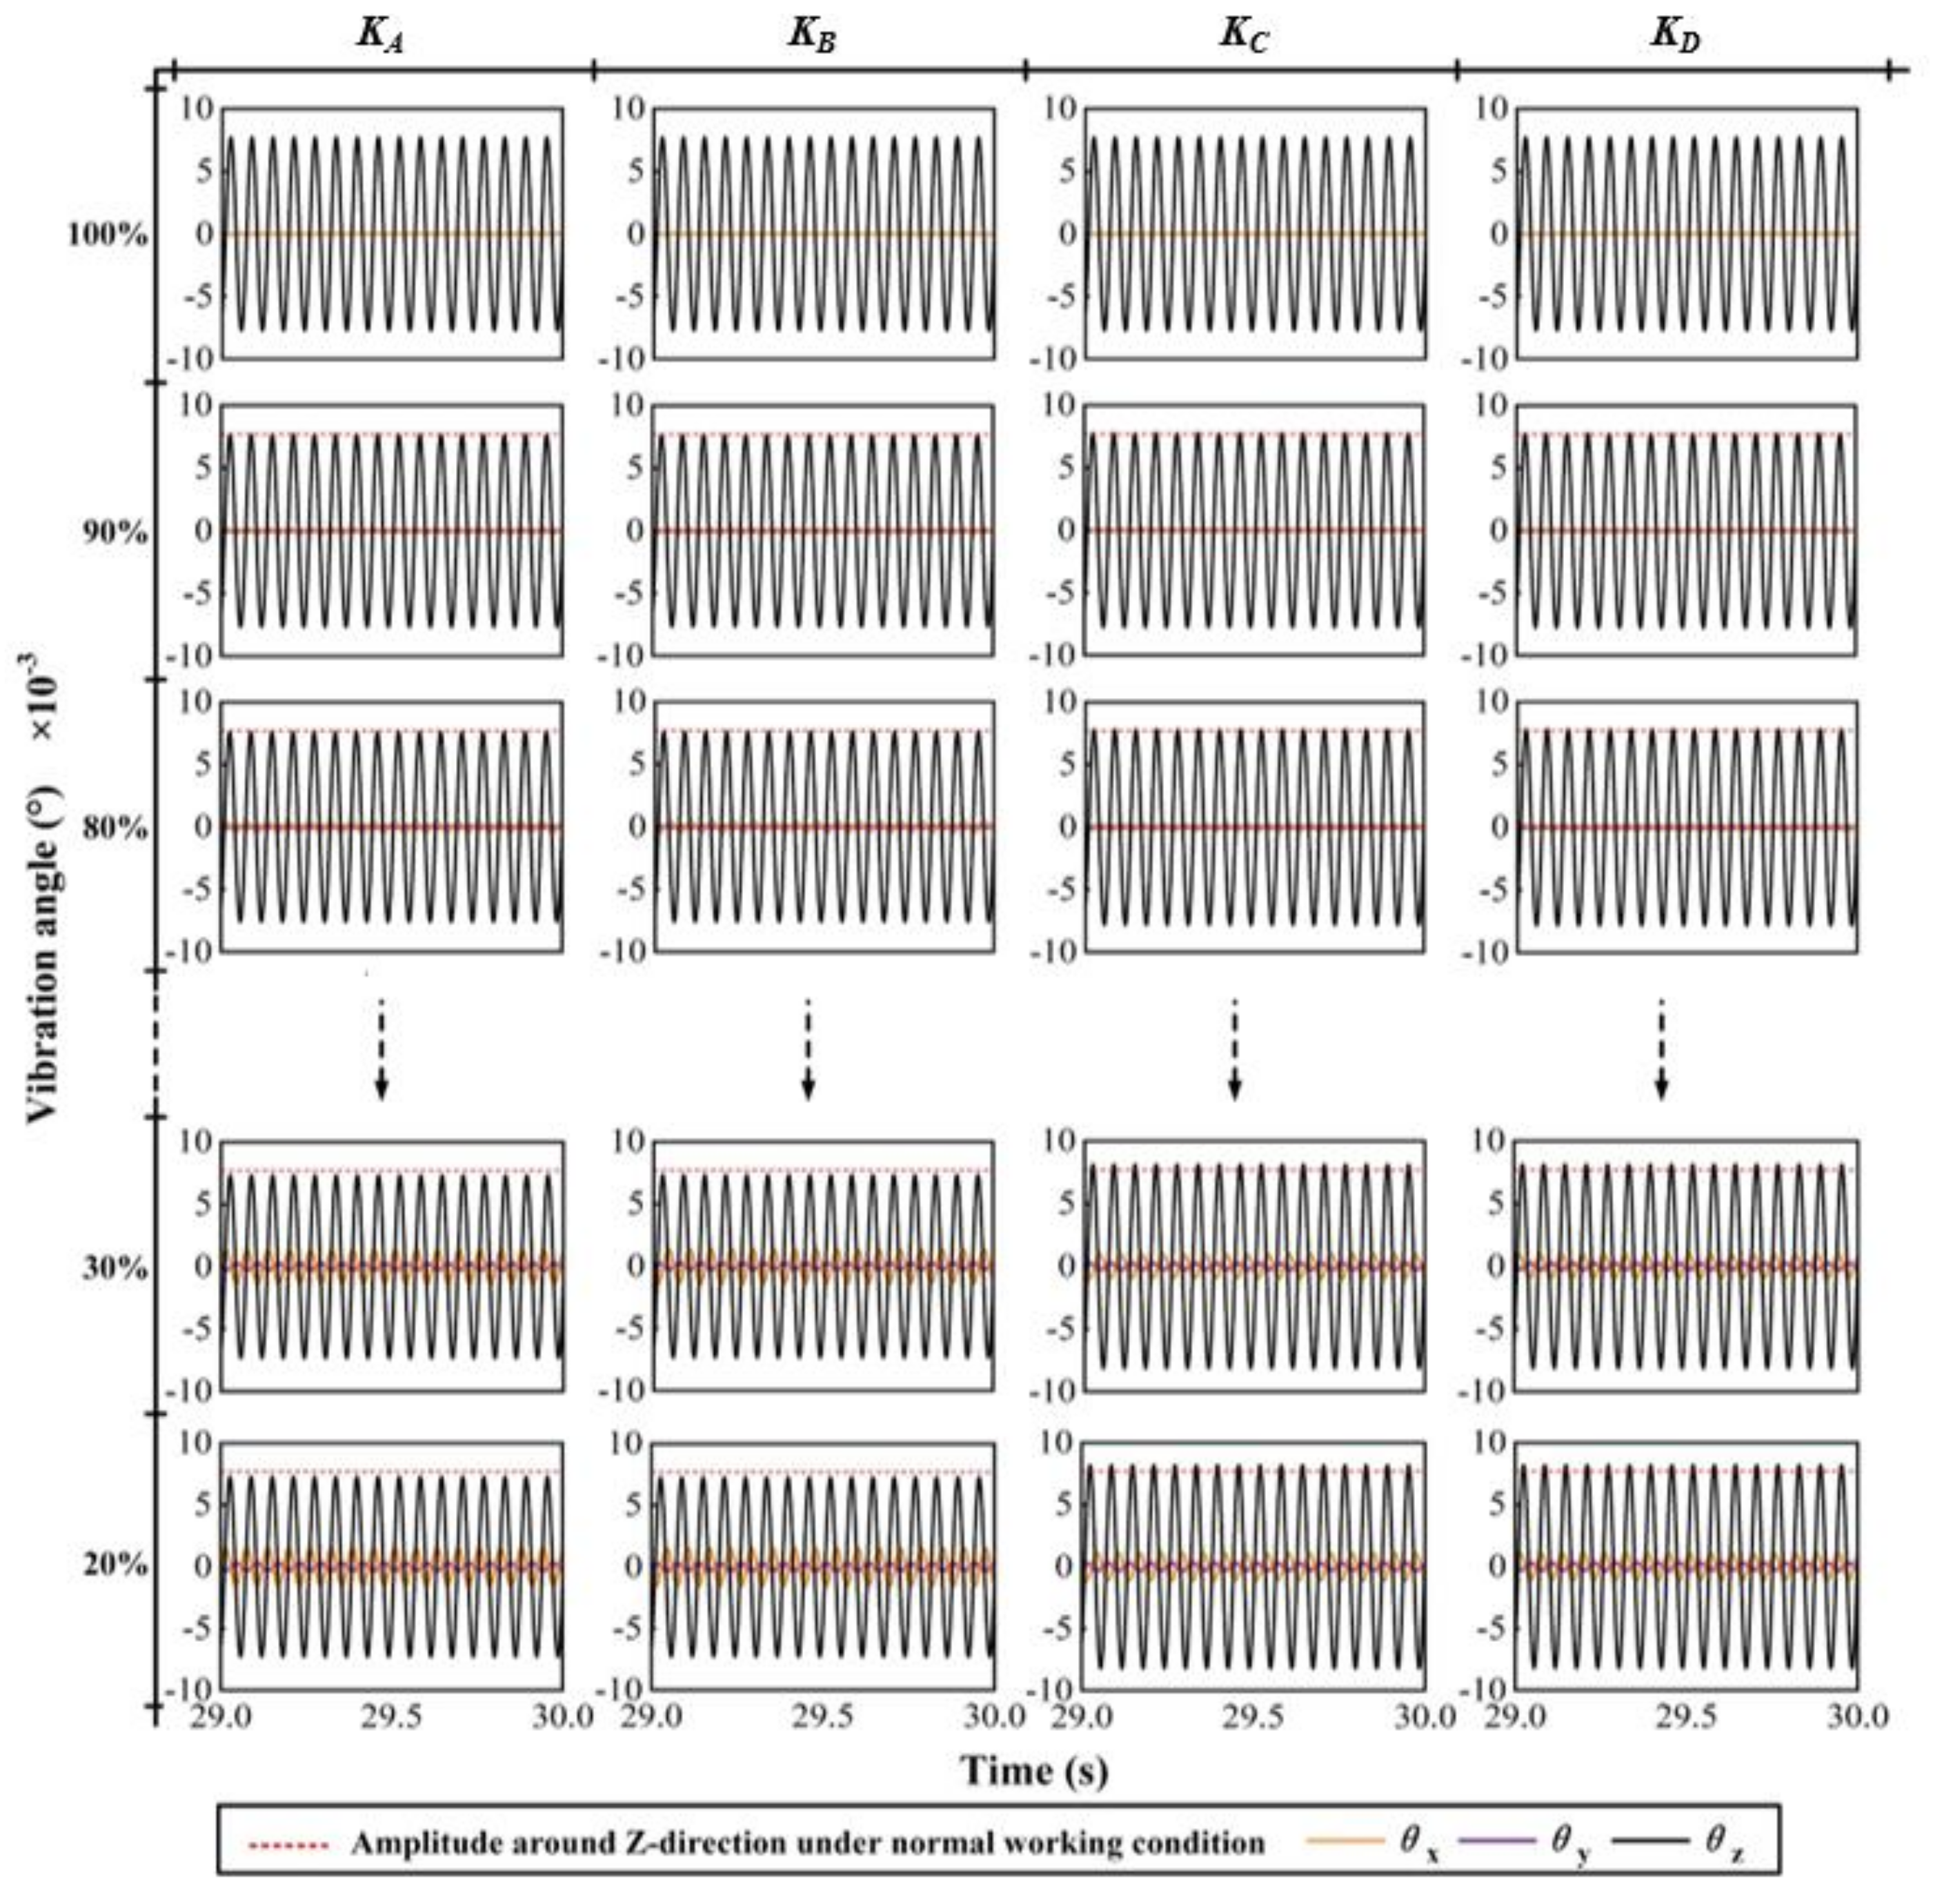
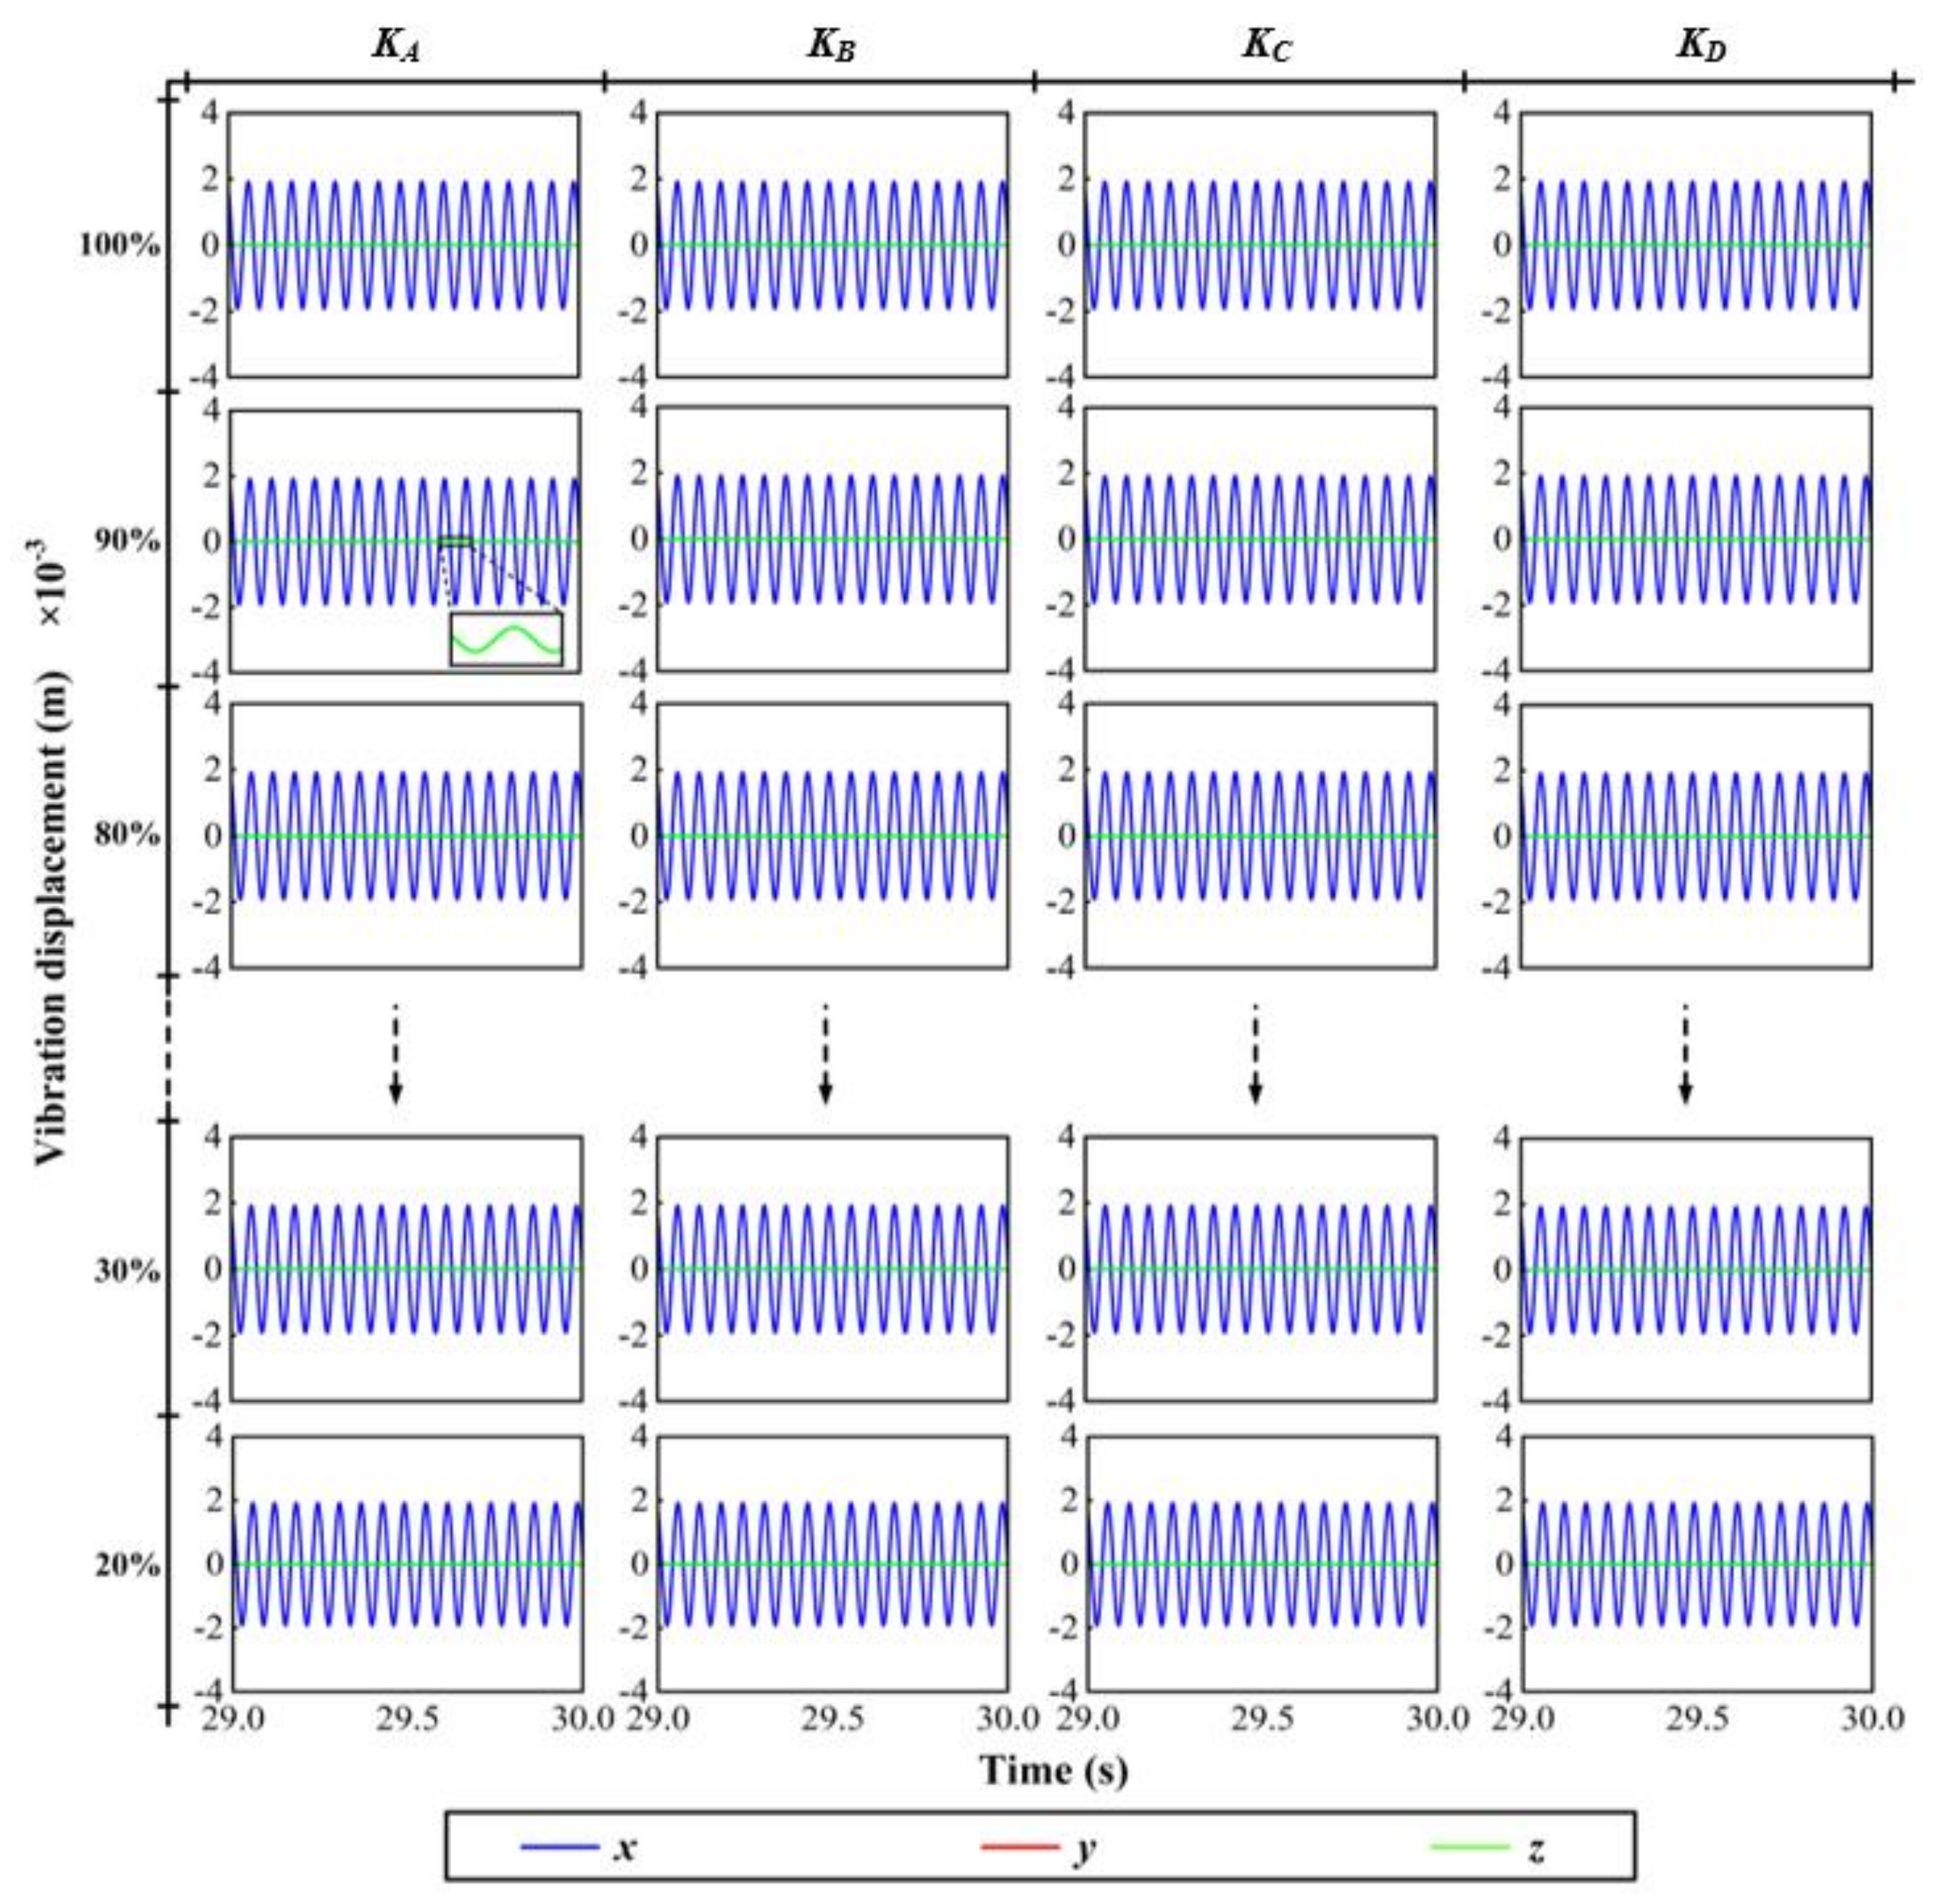
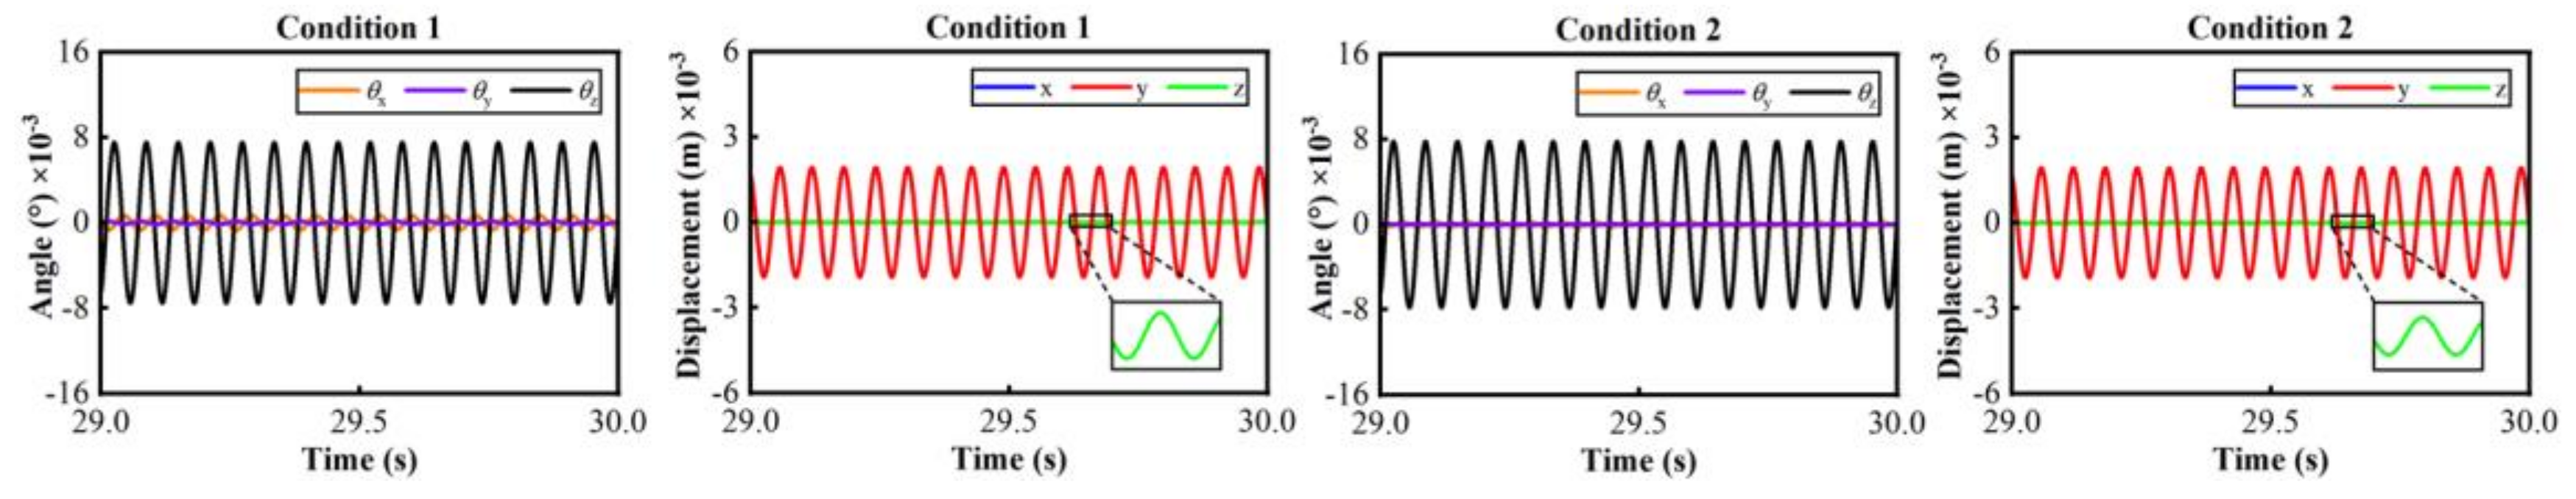
This study identified the impact of spring health on vibration displacement and vibration angle. It can be found that the vibration of the mining vibrating screen with faulty single-group springs changes into a very complicated spatial motion, which includes three translations and three rotations. Additionally, the vibration displacement in the X and Y directions decreases and that in the Z direction increases as the health of single-group springs decreases. The vibration angle around the X and Y axes increases. However, the changing trends of the vibration angle around the Z axis are different when the faulty single-group springs are located at the feed side and the out-feed side. These response changes will provide valuable insights for the fault diagnosis of single-group springs in the vibrating screen.
(3)
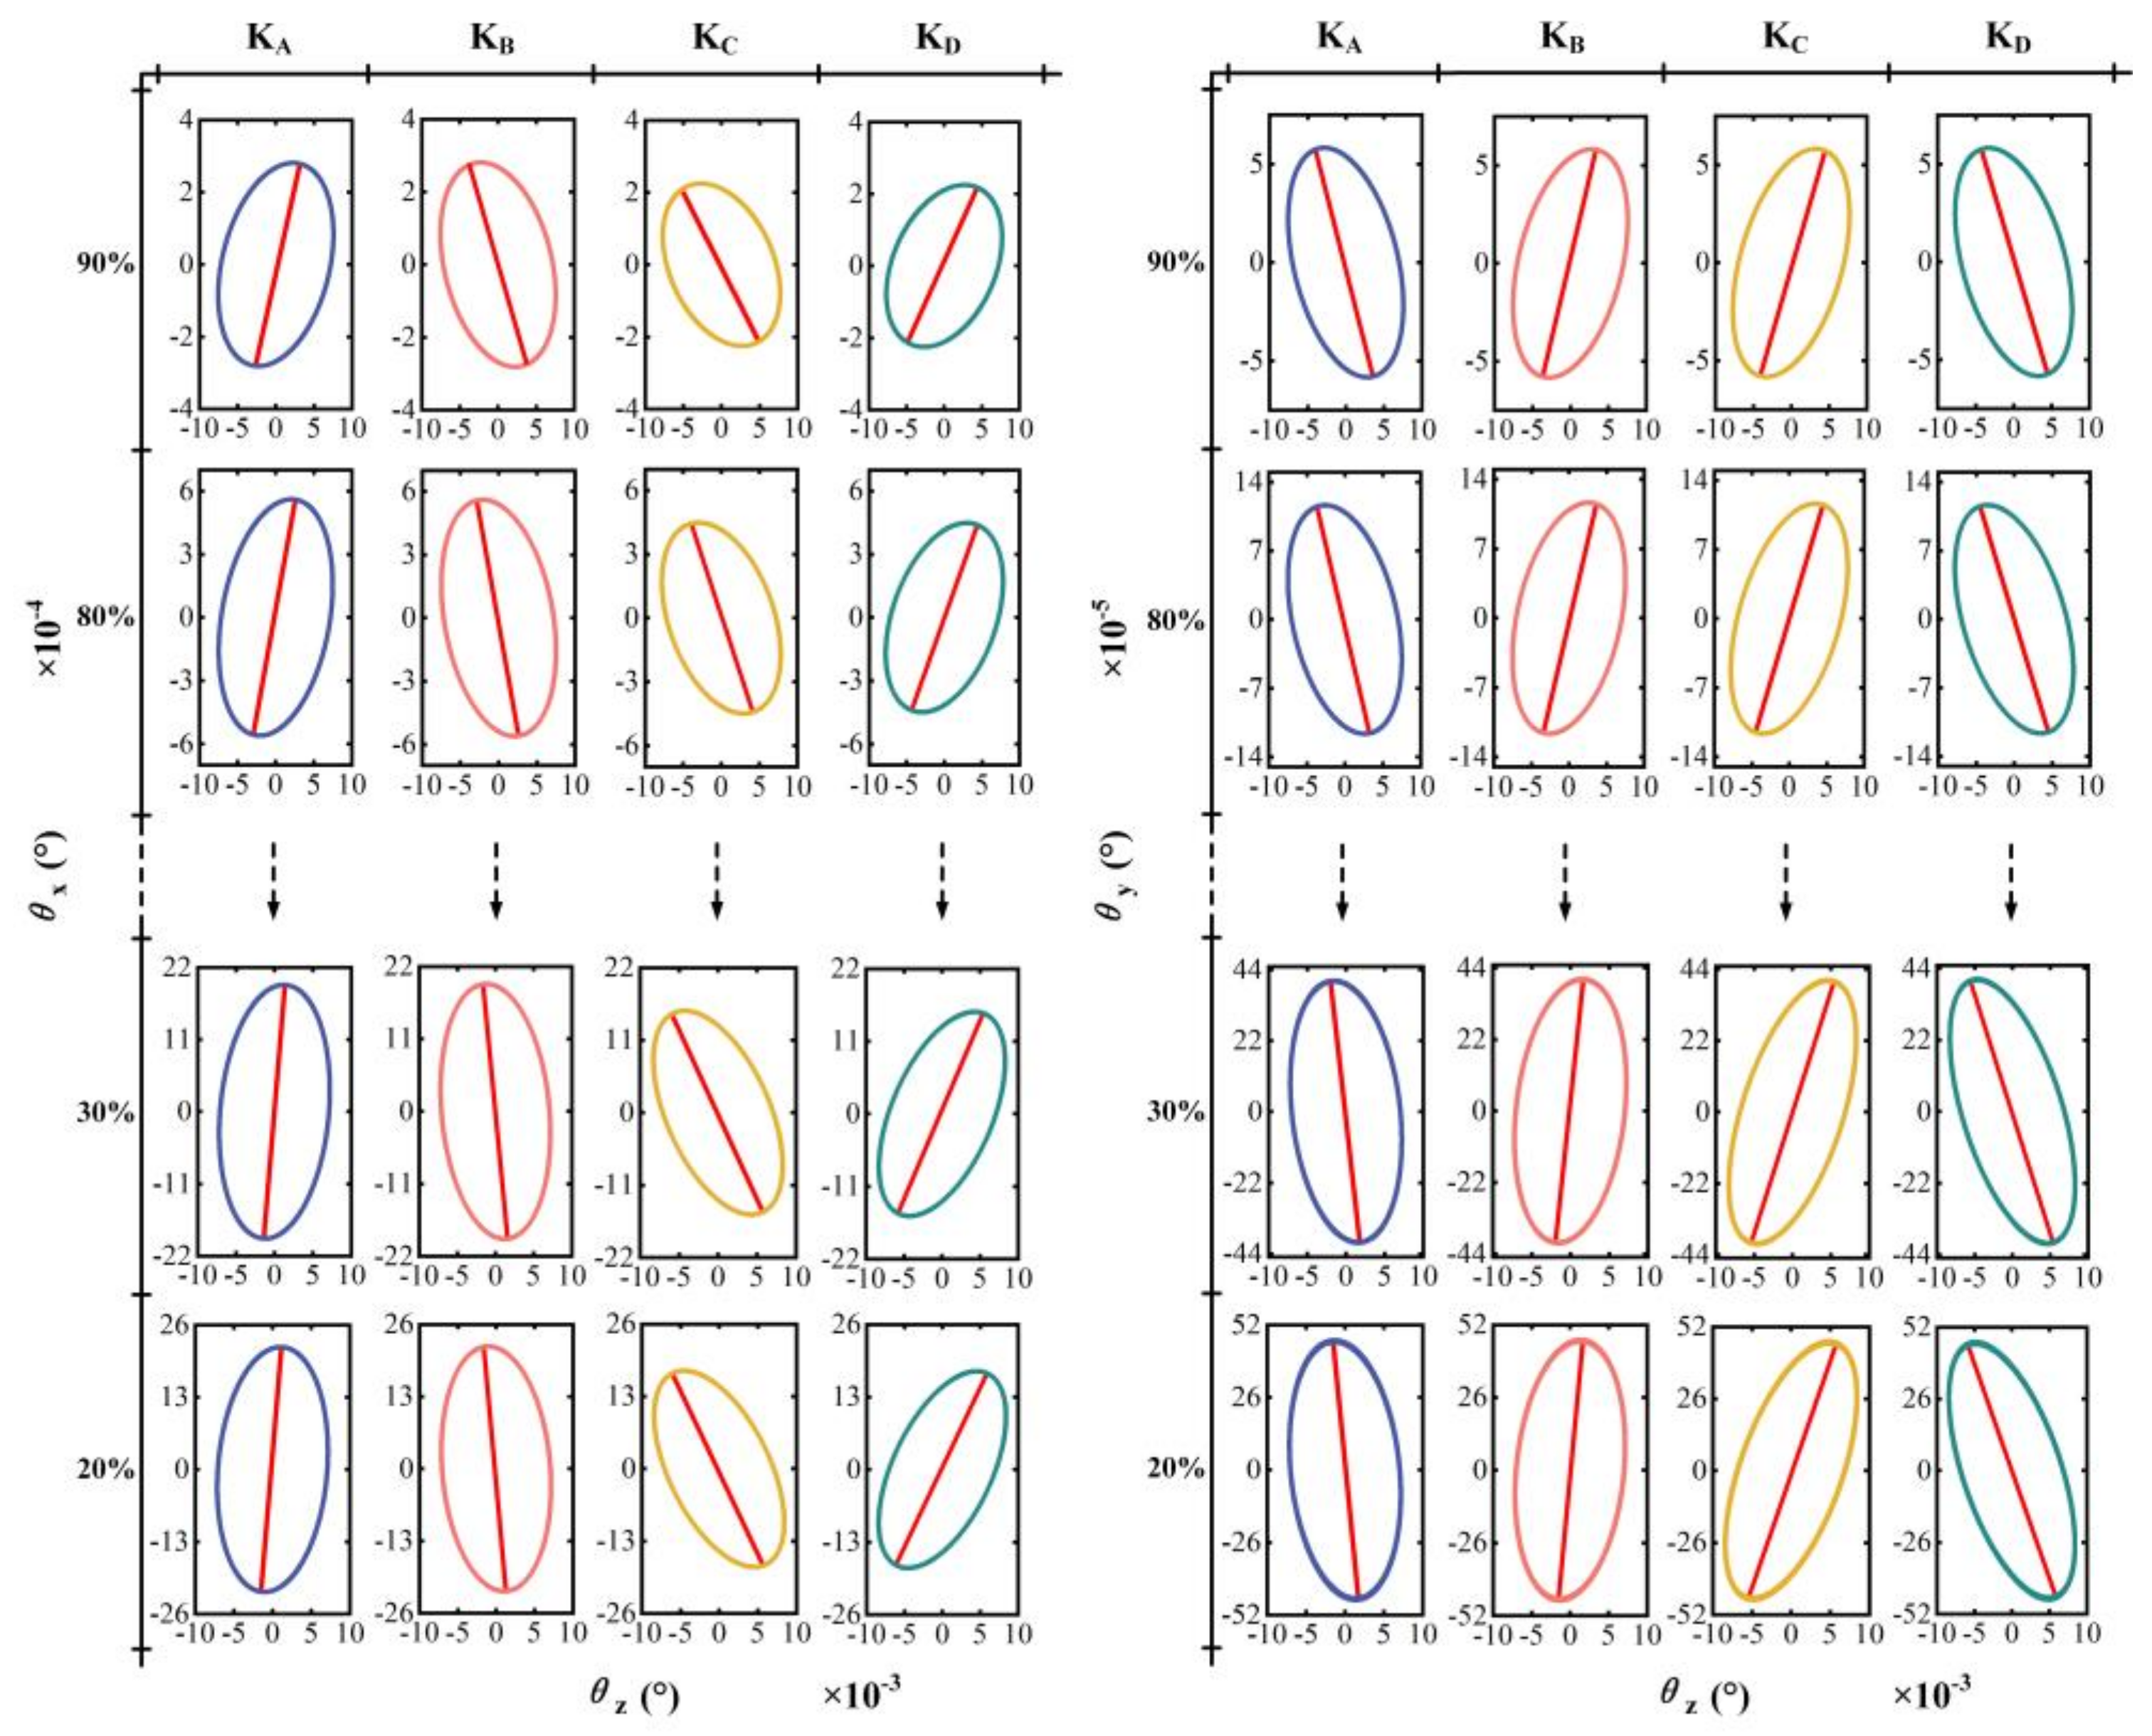
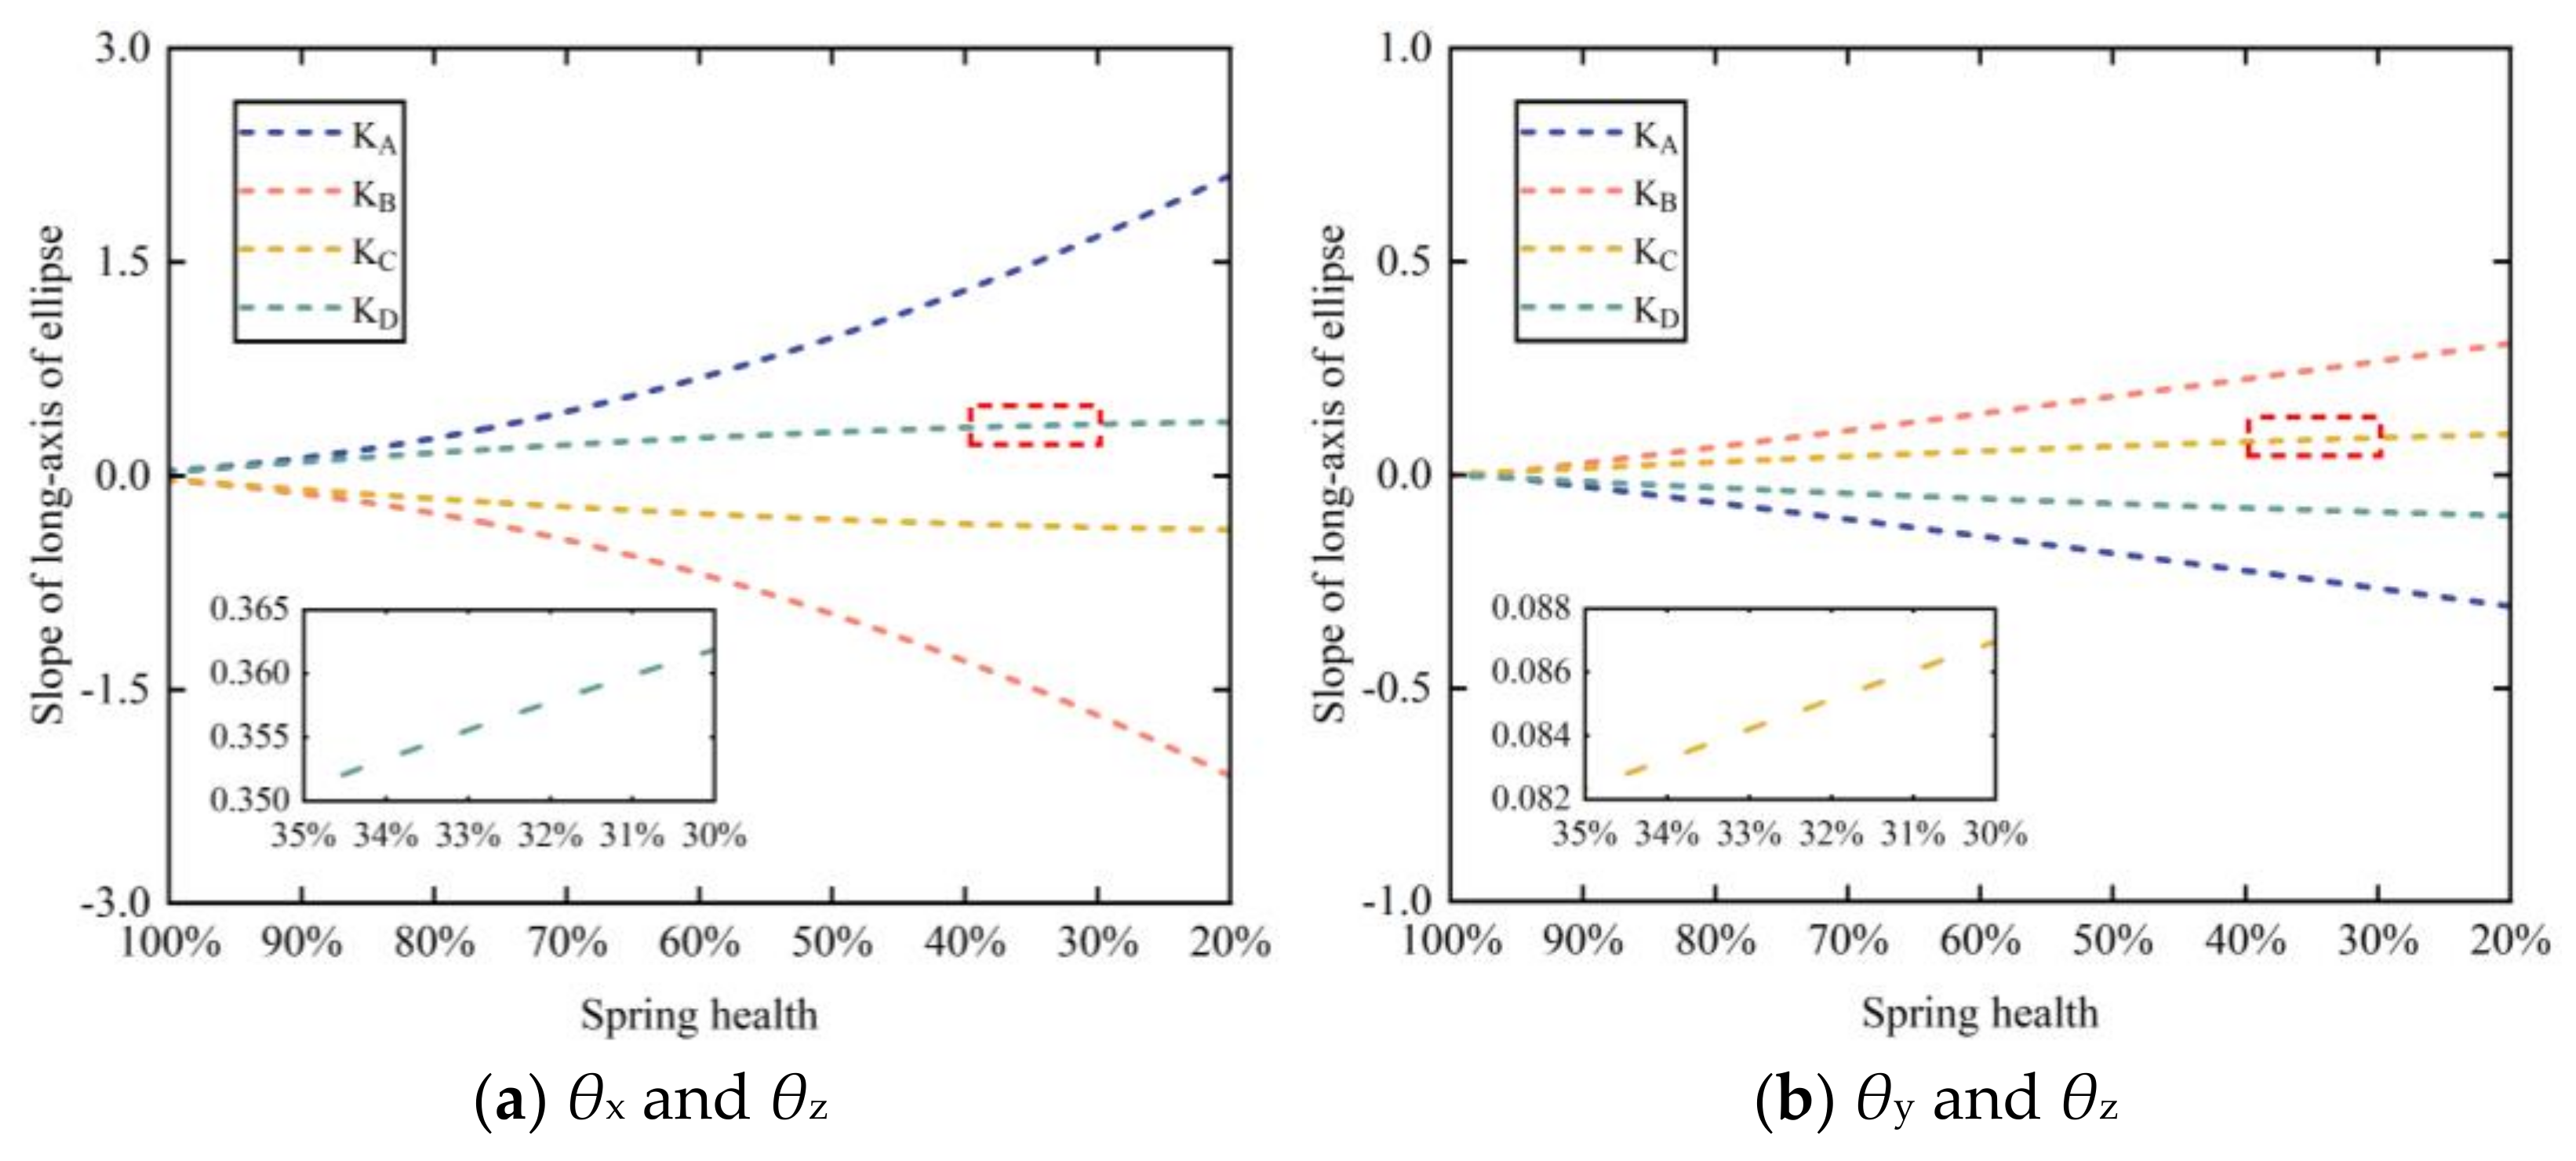
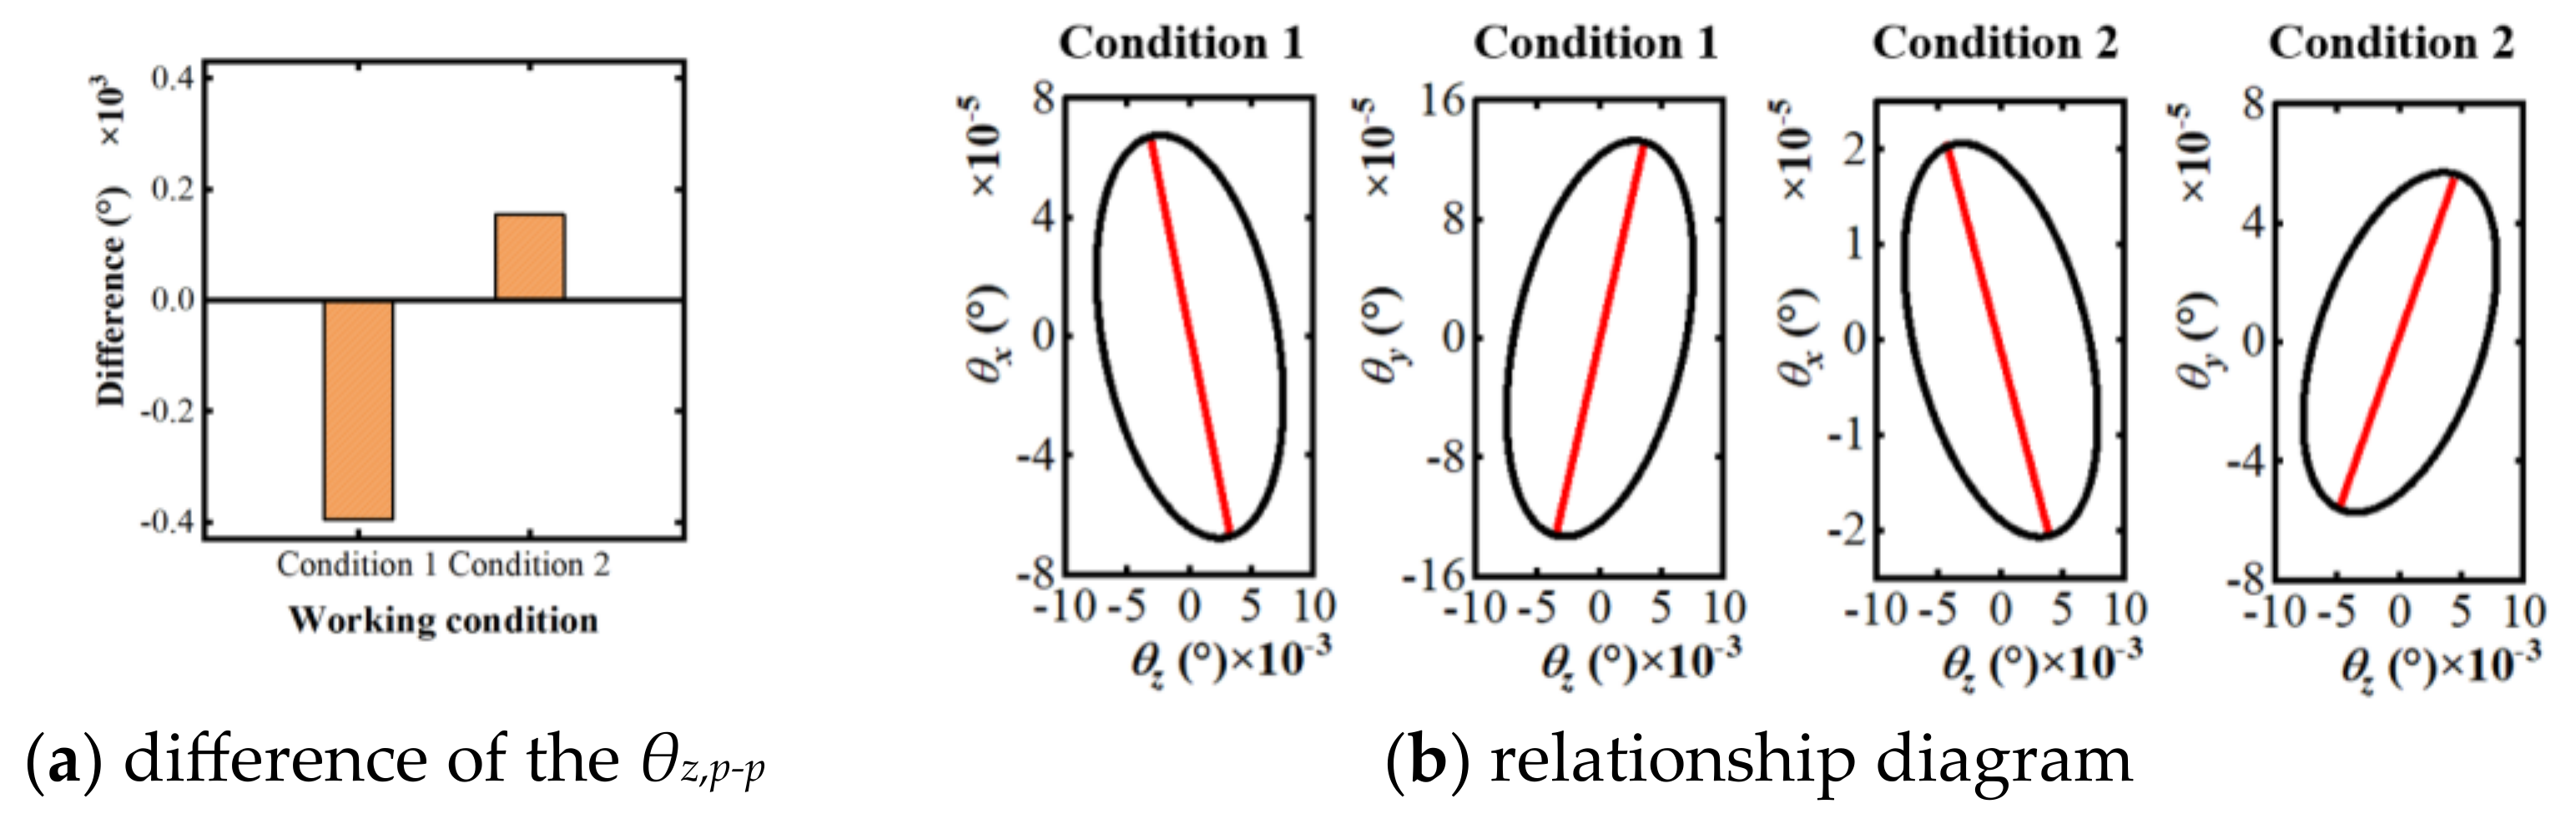
The locating method of the faulty single-group springs is proposed. The method indicates that the peak-to-peak value of the vibration angle around the Z axis can be used to determine whether the failed spring group is located at the feed side or the out-feed side. The positive and negative of the slopes of the long axis of the ellipse composed of vibration angle can be used to determine the specific location of the faulty spring group.
(4)
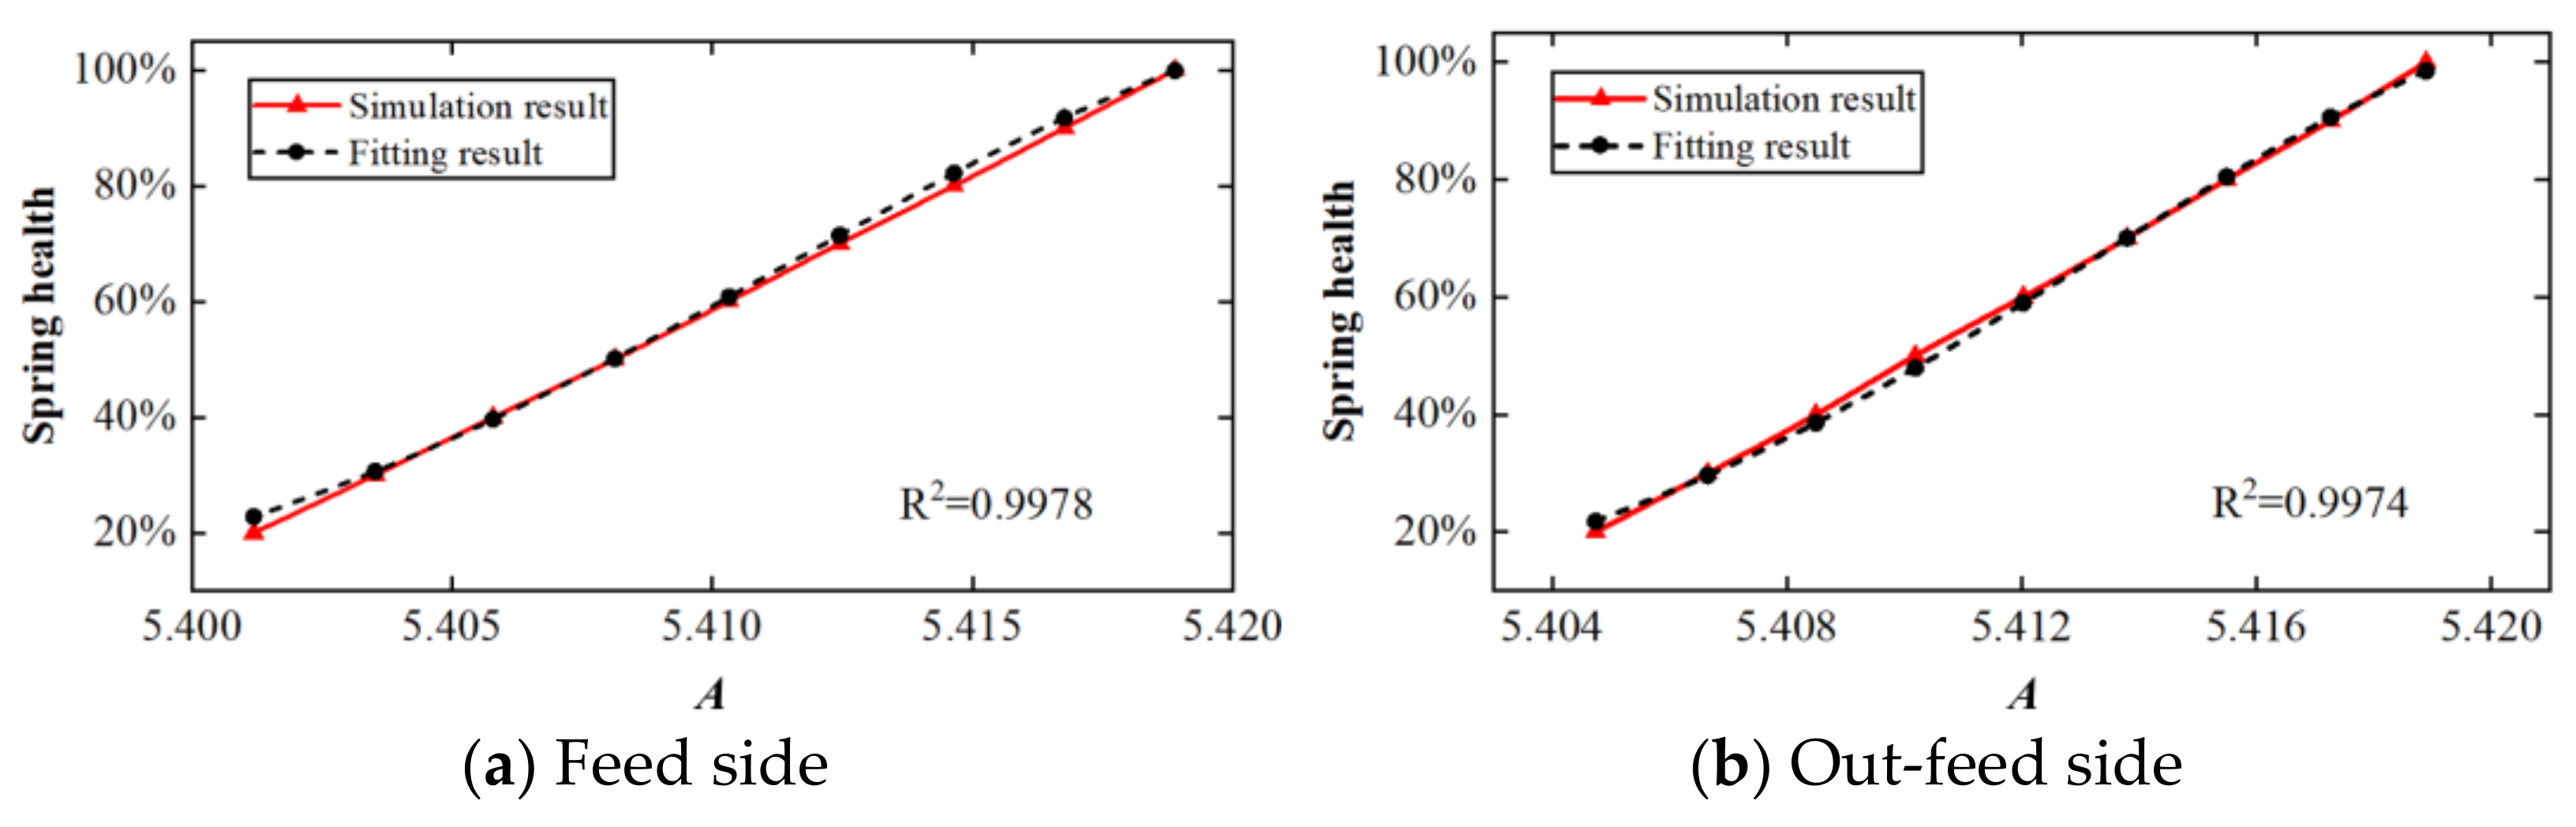
It can be found that vibration displacement varies under different spring health states. The evaluation formulas for spring health are proposed based on the relationship between vibration displacement and spring health. These formulas show a high goodness of fit (R2 > 0.9) and are verified using ABAQUS simulations, with errors of 1.7% and 0.66%, respectively.
(5)
The proposed diagnostic model provides useful theoretical assistance for diagnosing faulty single-group springs in mining vibrating screens, contributing to improved maintenance strategies and operational reliability. However, further study and experiments need to be conducted to identify whether this model can be extrapolated to actual single-group spring failure monitoring.
In conclusion, the study advances the fault diagnosis of single-group springs in the mining vibrating screen, offering a reliable diagnostic tool that can enhance the efficiency and safety of mining operations.

Author Contributions

Conceptualization, X.C. and H.L.; formal analysis, X.C. and Z.W.; investigation, X.C., C.C. and H.L.; data curation, X.C. and Z.W.; writing—original draft preparation, X.C.; writing—review and editing, Z.W. and H.L.; All authors have read and agreed to the published version of the manuscript.

Funding

This research received no external funding.

Data Availability Statement

The data used to support the findings of this study are available from the corresponding author upon request.

Conflicts of Interest

The authors declare no conflicts of interest.

References

  1. Chen, H.C. Analysis and Research on Fatigue Failure of Damping Spring of Linear Vibrating Screen; Jiangnan University: Wuxi, China, 2022. [Google Scholar]
  2. Peng, L.-P.; Liu, C.-S.; Li, J.; Wang, H. Static-deformation based fault diagnosis for damping spring of large vibrating screen. J. Cent. South Univ. 2014, 21, 1313–1321. [Google Scholar] [CrossRef]
  3. Liang, Y.M. Static analysis and research on large linear vibrating screen. Mech. Eng. 2015, 72–73. [Google Scholar] [CrossRef]
  4. Liu, C.S.; Peng, L.P.; Wang, H.; Li, J. Fault identification for spring of large vibrating screen using free response. J. Vib. Eng. 2013, 26, 9. [Google Scholar] [CrossRef]
  5. Moncada, M.; Rodríguez, C.G. Response of a vibrating screen when it loses stiffness in the supports. Ingeniare Rev. Chil. Ing. 2016, 24, 25–31. [Google Scholar] [CrossRef]
  6. Peng, L.P. Study on Stiffness Identification for Damping Springs and Dynamic Problems of Beam Structures in a Large Vibrating Screen. Ph.D. Thesis, China University of Mining and Technology, Xuzhou, China, 2015. [Google Scholar]
  7. Liu, Y.; Suo, S.; Meng, G.; Shang, D.; Bai, L.; Shi, J. A Theoretical rigid body model of vibrating screen for spring failure diagnosis. Mathematics 2019, 7, 246. [Google Scholar] [CrossRef]
  8. Fan, G.S.; Liu, C.S.; Lou, Y.L.; Wu, J.; Liu, H.; Li, S.; He, D. Research on dynamic characteristics of complete dynamic model of vibrating screen based on spatial six degrees of freedom. J. China Univ. Min. Technol. 2024, 53, 176–185. [Google Scholar] [CrossRef]
  9. Cai, P. The study of feeding bias fault in ZS2264S linear vibrating screen. China Highw. 2022, 2. [Google Scholar] [CrossRef]
  10. Guo, J.H. Test and analysis of permanent deformation of vibrating screen spring. Coal Mine Mod. 2020, 4. [Google Scholar] [CrossRef]
  11. Krot, P.; Zimroz, R. Methods of springs failures diagnostics in ore processing vibrating screens. IOP Conf. Ser. Earth Environ. Sci. 2019, 362, 012147. [Google Scholar] [CrossRef]
  12. Bao, J.H.; Su, Y.X.; Zhang, Z.X.; Li, G.Q. Research on influence of spring of linear vibrating screen on operation attitude of screen box. Coal Technol. 2022, 041. [Google Scholar] [CrossRef]
  13. Peng, L.P.; Liu, C.S.; Wang, H. Dynamic model catastrophe of a liner vibrating screen with damping spring fault. J. Vib. Shock 2012, 31, 5. [Google Scholar] [CrossRef]
  14. Chen, H.C.; Yan, J.X. Application of chaos theory in fault detection of vibration damping spring. Mach. Des. Manuf. 2024, 1–6. [Google Scholar] [CrossRef]
  15. Krot, P.; Zimroz, R.; Michalak, A.; Wodecki, J.; Ogonowski, S.; Drozda, M.; Jach, M. Development and verification of the diagnostic model of the sieving screen. Shock Vib. 2020, 2020, 8015465. [Google Scholar] [CrossRef]
  16. Ahmadi, N.; Rezazadeh, G.; Rahmani, A.; Ghanbari, M. Analyzing the effects of polymeric dielectric materials on micro capacitive pressure sensors: A model incorporating displacement-dependent porosity. Heliyon 2024, 10, e30626. [Google Scholar] [CrossRef] [PubMed]
  17. Wen, T.; Narita, F.; Kurita, H.; Jia, Y.; Shi, Y. Quantification of damage expansion influence on frequency response function of plate for structural health monitoring with integral differential method. Compos. Sci. Technol. 2023, 244, 110298. [Google Scholar] [CrossRef]
  18. Zhao, G.; Wang, X.; Lin, D.; Xu, N.; Yu, C.; Geng, R. Study of double-deck vibrating flip-flow screen based on dynamic stiffness characteristics of shear springs. Minerals 2021, 11, 928. [Google Scholar] [CrossRef]
  19. Su, R.H.; Peng, C.Y. Random Dynamic Analysis of Vibrating Screen Structure; China Coal Industry Publishing House: Beijing, China, 2012. [Google Scholar]
  20. Jiang, W.K.; Wu, H.J.; Zhou, H.T.; Zhu, B.L. Mechanical Vibration and Noise; Science Press: Beijing, China, 2020. [Google Scholar]
  21. Li, X.Y.; Zhang, M.L. Mechanical Vibrations; Tsinghua University Press: Beijing, China, 2009. [Google Scholar]
  22. Qiu, S.C.; An, Q. Calculation method of lateral stiffness of cylindrical helical spring. J. East China Univ. Sci. Technol. (Nat. Sci. Ed.) 2015, 41, 846–851. [Google Scholar] [CrossRef]
  23. Cheng, D.X. Mechanical Design Handbook; Chemical Industry Press: Beijing, China, 2008; Volume 4. [Google Scholar]
  24. Wang, B.T.; Cheng, D.K. Modal analysis by free vibration response only for discrete and continuous systems. J. Sound Vib. 2011, 330, 3913–3929. [Google Scholar] [CrossRef]
  25. Liu, Y.; Meng, G.; Suo, S.; Li, D.; Wang, A.; Cheng, X.; Yang, J. Spring failure analysis of mining vibrating screens: Numerical and experimental studies. Appl. Sci. 2019, 9, 3224. [Google Scholar] [CrossRef]
  26. Yang, X.; Wu, J.; Jiang, H.; Qiu, W.; Liu, C. Dynamic modeling and parameters optimization of large vibrating screen with full degree of freedom. Shock Vib. 2019, 2019, 1915708. [Google Scholar] [CrossRef]
  27. Liu, Q. Research on Nonlinear Dynamic Characteristics of the Stepped Mining Pipe in Deep Sea Mining; Shandong University of Science and Technology: Qingdao, China, 2023. [Google Scholar]
Figure 1. Structural diagram of the mining vibrating screen.
Symmetry 16 00832 g001
Figure 2. 6-DOF simplified rigid body dynamic model for the mining vibrating screen.
Symmetry 16 00832 g002
Figure 3. Local enlargement.
Symmetry 16 00832 g003
Figure 4. Schematic diagram of spring deformation.
Symmetry 16 00832 g004
Figure 5. Vibration response at the centroid under the normal working condition obtained by MATLAB.
Symmetry 16 00832 g005
Figure 6. Spectrograms obtained by MATLAB.
Symmetry 16 00832 g006
Figure 7. Vibration response at the centroid under the normal working condition obtained by ABAQUS.
Symmetry 16 00832 g007
Figure 8. Spectrograms obtained by ABAQUS.
Symmetry 16 00832 g008
Figure 9. Measuring spring compression in ABAQUS.
Symmetry 16 00832 g009
Figure 10. Compression amounts of single-group springs under different health states.
Symmetry 16 00832 g010
Figure 11. Flowchart.
Symmetry 16 00832 g011
Figure 12. Vibration angle at the centroid.
Symmetry 16 00832 g012
Figure 13. Difference between peak-to-peak values of vibration angle around the Z axis.
Symmetry 16 00832 g013
Figure 14. Relationship diagram.
Symmetry 16 00832 g014
Figure 15. Effect of different stiffnesses on the slope of the long axis of the ellipse.
Symmetry 16 00832 g015
Figure 16. Vibration displacement.
Symmetry 16 00832 g016
Figure 17. Fitting effect.
Symmetry 16 00832 g017
Figure 18. Results of steady-state response of simulations.
Symmetry 16 00832 g018
Figure 19. Analysis results of vibration angle.
Symmetry 16 00832 g019
Table 1. Simulation parameters.
ParametersValue
m1/kg12,210
m2/kg6232
Jx, Jy, Jz/(kg∙m2)29,900, 64,900, 38,200
knx, kny, knz (n = A, B, C, D)/(N/m)477,806, 912710, 477,806
dnx, dny, dnz (n = A, B, C, D)/m2.440, 0.318, 2.147
β/(°)45
ω/(rad/s)101.578
f/N508,280
Table 2. Comparison of calculation results.
ParametersMATLABABAQUSError/%
x/m3.81 × 10−33.83 × 10−30.52
y/m3.85 × 10−33.84 × 10−30.26
θz/(°)1.542 × 10−21.538 × 10−20.26
Table 3. Change rule of the slope at the feed side.
Failure Location Composition of Relationship Diagram
θx, θzθy, θz
KA+ 1-
KB- 2+
1 Positive slope; 2 Negative slope.
Table 4. Change rule of the slope at the out-feed side.
Failure LocationComposition of Relationship Diagram
θx, θzθy, θz
KC-+
KD+-
Table 5. Peak-to-peak values under different spring health.
Spring
Health
xp-p (m) × 10−3yp-p (m) × 10−3zp-p (m) × 10−5
KA or KBKC or KDKA or KBKC or KDKA or KBKC or KD
100%3.81473.81473.84873.848700
90%3.81373.81383.84673.84730.00470.0036
80%3.81283.81293.84463.84570.00870.0074
70%3.81183.81203.84253.84420.01200.0114
60%3.81093.81113.84043.84260.01480.0155
50%3.81003.81013.83823.84100.01700.0198
40%3.80903.80933.83593.83940.01830.0243
30%3.80813.80843.83363.83770.01910.0290
20%3.80713.80743.83133.83600.01930.0385
Disclaimer/Publisher’s Note: The statements, opinions and data contained in all publications are solely those of the individual author(s) and contributor(s) and not of MDPI and/or the editor(s). MDPI and/or the editor(s) disclaim responsibility for any injury to people or property resulting from any ideas, methods, instructions or products referred to in the content.

