Abstract
Auxiliary information sources, a subset of target recognition data sources, play a significant role in target recognition. The reliability and importance of these sources can vary, thereby affecting the effectiveness of the data provided. Consequently, it is essential to integrate these auxiliary information sources prior to their utilization for identification. The Dempster-Shafer (DS) evidence theory, a well-established data-fusion method, offers distinct advantages in handling and combining uncertain information. In cases where conflicting evidence sources and minimal disparities in fundamental probability allocation are present, the implementation of DS evidence theory may demonstrate deficiencies. To address these concerns, this study refined DS evidence theory by introducing the notion of invalid evidence sources and determining the similarity weight of evidence sources through the Pearson correlation coefficient, reflecting the credibility of the evidence. The significance of evidence is characterized by entropy weights, taking into account the uncertainty of the evidence source. The proposed asymptotic adjustment compression function adjusts the basic probability allocation of evidence sources using comprehensive weights, leading to symmetric compression and control of the influence of evidence sources in data fusion. The simulation results and their application in ship target recognition demonstrate that the proposed method successfully incorporates basic probability allocation calculations for ship targets in various environments. In addition, the method effectively integrates data from multiple auxiliary information sources to produce accurate fusion results within an acceptable margin of error, thus validating its efficacy. The superiority of the proposed method is proved by comparing it with other methods that use the calculated weights to weight the basic probability allocation of the evidence sources.
1. Introduction
A plethora of data sources is available in the realm of target recognition, with certain sources serving as primary providers of high-dimensional data, such as one-dimensional range profiles of targets [1,2], optoelectronic signals [3], and synthetic aperture radar (SAR) [4,5,6]. The High Resolution Range Profile (HRRP) is the distribution of the target’s Radar Cross Section (RCS) in the radar radial line of sight, the RCS can clearly show the distribution of the target’s scattering center position and other structural information, and at the same time, it is relatively easy to obtain. In practical applications, the target ship attitude angle and sea surface undulation instability, as well as the sea surface air humidity for the electromagnetic environment, radar bandwidth carrier frequency signal perturbation, and other practical factors will bring interference to the HRRP, resulting in errors. Conversely, there exists a subset of data sources that offers low-dimensional information, including sea conditions, seasonal variations, target velocity, and other factors relevant to the recognition of sea surface targets. In contemporary recognition systems, numerous algorithms prioritize primary information sources owing to their ability to yield high recognition rates [7,8,9]. However, the utilization of auxiliary information sources and target identification methods is crucial because they offer essential data support. Hence, in presenting the ultimate target recognition outcomes, it is imperative to not only rely on the primary information sources for discrimination but also to consider the auxiliary information sources [10]. The optimal amalgamation of these auxiliary sources of information holds significant importance as the validity of their outcomes contributes to offering a more thorough information foundation for the ensuing identification procedure, thereby enhancing the precision and dependability of identification.
This study utilizes the similarity and information entropy of evidence sources to obtain two weights, which are then weighted and averaged to obtain a comprehensive weight. The Basic Probability Assignment (BPA) preprocessing of evidence sources is carried out using the comprehensive weight and the proposed symmetric compression model, thereby improving the DS evidence theory. The notion of invalid evidence sources facilitates the convergence of the initial evidence towards invalid sources. This convergence is accomplished through the proposed asymptotic adjustment compression function, thereby addressing the issue arising from the direct weighting processing. The level of convergence was established by weighting the similarity and entropy of the evidence sources. The primary contributions of this study are as follows:
- Incorporating information entropy [11] as a metric for assessing the significance of evidence enhances the differentiation between evidence, and addresses the issue of accuracy in fusion outcomes when the BPA of evidence is minimally distinct. Entropy, as a measure of uncertainty for each source of evidence, determines the weighting of individual evidence by reflecting the level of uncertainty. Consequently, evidence with higher uncertainty is assigned greater entropy and consequently, a reduced weight in the process of data fusion.
- Introducing an asymptotic adjustment compression function to effectively modify the comprehensive weight of evidence sources on the BPA, thereby addressing the issue of evidence probability skewing towards reversal during weight introduction. This model enables the adjustment of evidence source directionality, regulation of their impact on data fusion, and preservation of the original bias of evidence sources towards propositions.
- The modelling and quantification of different types of factors affecting the probability of occurrence of ship targets are given, and the enhanced DS evidence theory has been effectively utilized to determine the likelihood of ship targets appearing in specific maritime regions. This methodology has enabled the integration of data from various supplementary sources and has the ability to forecast the category and likelihood of ship targets.
The subsequent sections of this article are structured as follows. Section 2 provides an overview of related works. Section 3 provides an overview of the theoretical underpinnings of DS evidence theory, highlighting key areas for improvement, including the consideration of similarity weight and entropy weight for evidence sources. Section 4 presents the simulation results and the corresponding analysis. Section 5 utilizes enhanced DS evidence theory in the context of ship target recognition, thereby reinforcing the efficacy of our approach. Section 6 discusses the proposed methodology. Section 7 presents a comprehensive overview of this document.
2. Related Works
The data-fusion method has garnered significant interest from scholars. Traditional approaches to data fusion include the weighted average method [12], Kalman filter [13], wavelet transform [14], principal component analysis [15], Bayesian networks [16], and Dempster-Shafer (DS) evidence theory [17]. Contemporary data-fusion techniques such as neural networks [18] and ensemble learning methods [19] have gained traction in recent years. The selected data-fusion methods are different for different goals of data fusion. In this paper, we aim to fuse multiple data sources, mainly probabilistic data with uncertainty, so DS evidence theory is more appropriate. The DS evidence theory, initially introduced by Dempster in 1967 and subsequently refined by Shafer, is a mathematical framework designed to address uncertainty in decision-making processes. By integrating evidence from diverse sources, this theory enables a thorough and precise analysis of uncertainty-related matters, leading to its widespread application across various disciplines [20,21].
In engineering applications involving uncertain information, DS evidence theory is frequently employed to achieve more precise outcomes. Khan et al. [22] utilized the DS evidence theory for multisensor data fusion, which can handle conflicting sensor inputs and can be applied without any prior information. As a result, DS-based information fusion is very popular in decision-making applications. Lu, JJ [23] introduced a novel distributed Kernel Extreme Learning Machine (KELM) algorithm. The application of DS evidence theory addresses the challenge faced by the original KELM in meeting real-time demands for aircraft engine onboard conditions when dealing with extensive sample sizes, which applied DS evidence theory to aeronautical alternator fault diagnosis. These studies not only promote its in-depth development in specific areas but also validate the effectiveness of the DS evidence theory in practical applications.
The traditional DS evidence theory exhibits limitations in practical applications, particularly in cases of high evidence conflicts and deficiencies in usage. Two primary approaches have been proposed to address these challenges: alternative combination rules and adjustments to the evidence source model by preprocessing the original evidence.
A lot of scholars have conducted in-depth studies on the modification of combination rules. For instance, Yager [24] proposed a method of transferring conflicts to unknown propositions, theoretically resolving conflict situations, but the uncertainty within the system persists. Sun et al. [25] introduced a novel combination rule that incorporated the notion of evidence credibility and addressed local conflicts using the fusion method. Wang et al. [26] proposed to combine fuzzy set theory with DS evidence theory, and established a real-time monitoring system for water inrush in tunnels. These methods overcome the limitations in the traditional DS evidence theory and achieve more reliable fusion of conflicting multi-sensor information.
Although modifying the combination rule solves the highly conflicting situation, the amount of conflicting allocations can easily be assigned to unknown propositions, leading to failure to produce results. Therefore more research has focused on modifying the evidence source model.
There are two main types of existing improvement methods in modifying evidence source models. One is to introduce new concepts, such as the compatibility coefficient between evidence [27], credibility [28], conflict intensity [29], etc. Tong et al. [29] defined the classification conflict coefficients between the basic classifiers and selected different fusion methods accordingly. Fan et al. [30] proposed to introduce a conflict metric based on K and to assess the importance of each piece of evidence in the fusion decision-making process by addressing the similarity between the evidence, but it suffers from the drawbacks of complex computational process and poor focusing ability.
The other is to introduce methods such as BPA functions based on the number of intervals [31], different distance functions [32], etc. Ga and colleagues [33] proposed a fault diagnosis decision fusion algorithm based on proximity and DS theory. They established weights for each piece of evidence based on the product of its closeness and the harmonic mean, and optimized the classification probability values of various samples for a basic classifier. Lin and colleagues [34] introduced the Markov distance function to compute the degree of distance in the evidence, thereby determining the reliability of the evidence via the distance matrix. Wei et al. [35] determined the significance of each piece of evidence by calculating the degree of difference and exclusion between them, and after weighting and averaging the pieces of evidence with different weights, the weighted pieces of evidence were combined to make a decision and a further diagnosis, which proved that the method has better diagnostic performance and reliability. Lu et al. [36] proposed a novel method for the correct and incorrect classification of balanced classification structure information. This method is based on the DS evidence theory and introduces a method based on inertia weight normalization in a confusion matrix, which effectively improves the accuracy of decision fusion. Zhang et al. [37] proposed the enhanced DS evidence theory method. This method is based on the Chebyshev distance and zero-divisor-corrected evidence source method. It was designed to integrate conflicting multivariate monitoring data. Each of these methods provides ideas for assigning weights to the BPA of evidence sources.
Since there are multiple propositions in the DS evidence theory, it gives a relative fusion result when applied to it, but the magnitude of this value itself reflects the likelihood of the proposition being valid to some extent, so it is fine for the current improved methods to seek to make the likelihood more and more certain. However, when the BPA of the evidence source is relatively average and using these methods still gives an extremely certain result, then this should be considered with caution. Since the credibility of the evidence source itself is reduced, it is not reasonable to give an extremely positive conclusion at this point. Current improvement methods are at risk of overestimating certainty by disregarding evidence with average BPA for propositions. It is unreasonable to assume that such evidence does not contribute to the fusion process, as each source can influence the outcome and should be considered in data fusion [37].
Employing weighted processing to preprocess the belief of evidence in current enhanced methods may not yield favorable results when incorporating relatively average evidence from these BPAs. For instance, evidence that was initially perceived to have a lesser impact on the data-fusion process was assigned lower weights. Using smaller weights to assign a value to the evidence source may result in a reversal of the probability direction of the evidence, potentially leading to contradictions [35,38]. Therefore, it is essential to enhance the differentiation between evidence when the variances in BPA are negligible and to make necessary adjustments to the BPA of the evidence source through the use of appropriate weights. This article enhances DS evidence theory by addressing the aforementioned issues, facilitating the fusion of evidence within a cohesive framework that considers all relevant evidence and automatically eliminates invalid sources, resulting in a more universally applicable approach.
3. Improved DS Evidence Theory
3.1. Traditional DS Evidence Theory
The utilization of DS evidence theory for problem of uncertain information fusion necessitates the initial establishment of an identification framework, followed by the modeling of uncertain information. This involves the conversion of objective observed data into a fundamental probability function within the DS evidence theory framework. Subsequently, the Dempster combination rule is employed to sequentially integrate the produced basic probability functions. Ultimately, the decisions were made based on the amalgamated results.
In DS evidence theory [39], is the identification framework, and is the entire subset of . Any proposition A belongs to the power set if the function satisfies the following conditions.
In Equation (1), is referred to as the basic probability allocation function of the recognition framework , also known as the mass function. represents BPA for Proposition A, which is the degree to which evidence suggests that Proposition A has occurred. is constructed from the data obtained from detection or provided by people based on experience. indicates that the trust of evidence in empty propositions is zero, whereas indicates that the sum of trust in all propositions under the recognition framework is 1. If and , then A is called the focal element and the set of all focal elements is called the kernel.
Under the recognition framework , for proposition A, if there are multiple sets of evidence and the corresponding probability allocation function is , the synthesis rule of the DS theoretical evidence is:
In Equation (2), is the conflict coefficient, which indicates the magnitude of the conflict between evidence.
Here, is the criterion for determining the acceptability of highly contradictory evidence. When is reached, it indicates that the conflict will not affect the accuracy of fusion results, and evidence sources can be directly fused using the Dempster rule [40,41,42]. Otherwise, it is necessary to preprocess the conflicting evidence before fusion.
3.2. Validity of Evidence Sources
When the BPA of an evidence source for a proposition reaches a value of one, it signifies that the BPA implies the evidence sources strongly support the proposition. At this point the evidence source is most valid. Nevertheless, there exists a scenario in which disparities in BPA among multiple propositions diminish or become equivalent as a result of evidence sources. For instance, in the context of ship target recognition, unfavorable sea conditions, all categories of ships sizes and categories are deemed likely to appear, leading to identical BPA values for sea conditions across various ship sizes. The identical nature of BPA indicates that the evidence source does not exhibit a preference for any particular proposition, but rather considering them to occur with equal probability. Evidence sources possessing this attribute have demonstrated no alterations in fusion outcomes pre- and post-data fusion, rendering them ineffective in the fusion process. Consequently, the entropy (and hence uncertainty) associated with such evidence sources are maximized. Thus, the efficacy of evidence sources in data fusion can be evaluated by assessing the magnitude of entropy.
Entropy is utilized as a metric to quantify a level of uncertainty associated with an event [43]. As uncertainty increases, so does entropy; and vice versa. In the scenario where a random variable D can take on K possible values, with denoting the probability of the kth possible value occurring, the formula [43] for computing its entropy is as follows:
This study attempts to assign weights to evidence sources based on the value of entropy. In the context of binary categorization, it has been observed that as the probability of belonging to one category approaches 0.5, the uncertainty increases, reflecting a state of randomness [43]. Conversely, as this probability deviates further from 0.5 to either extreme (0 or 1), the uncertainty decreases. This observation is consistent with the principle of entropy.
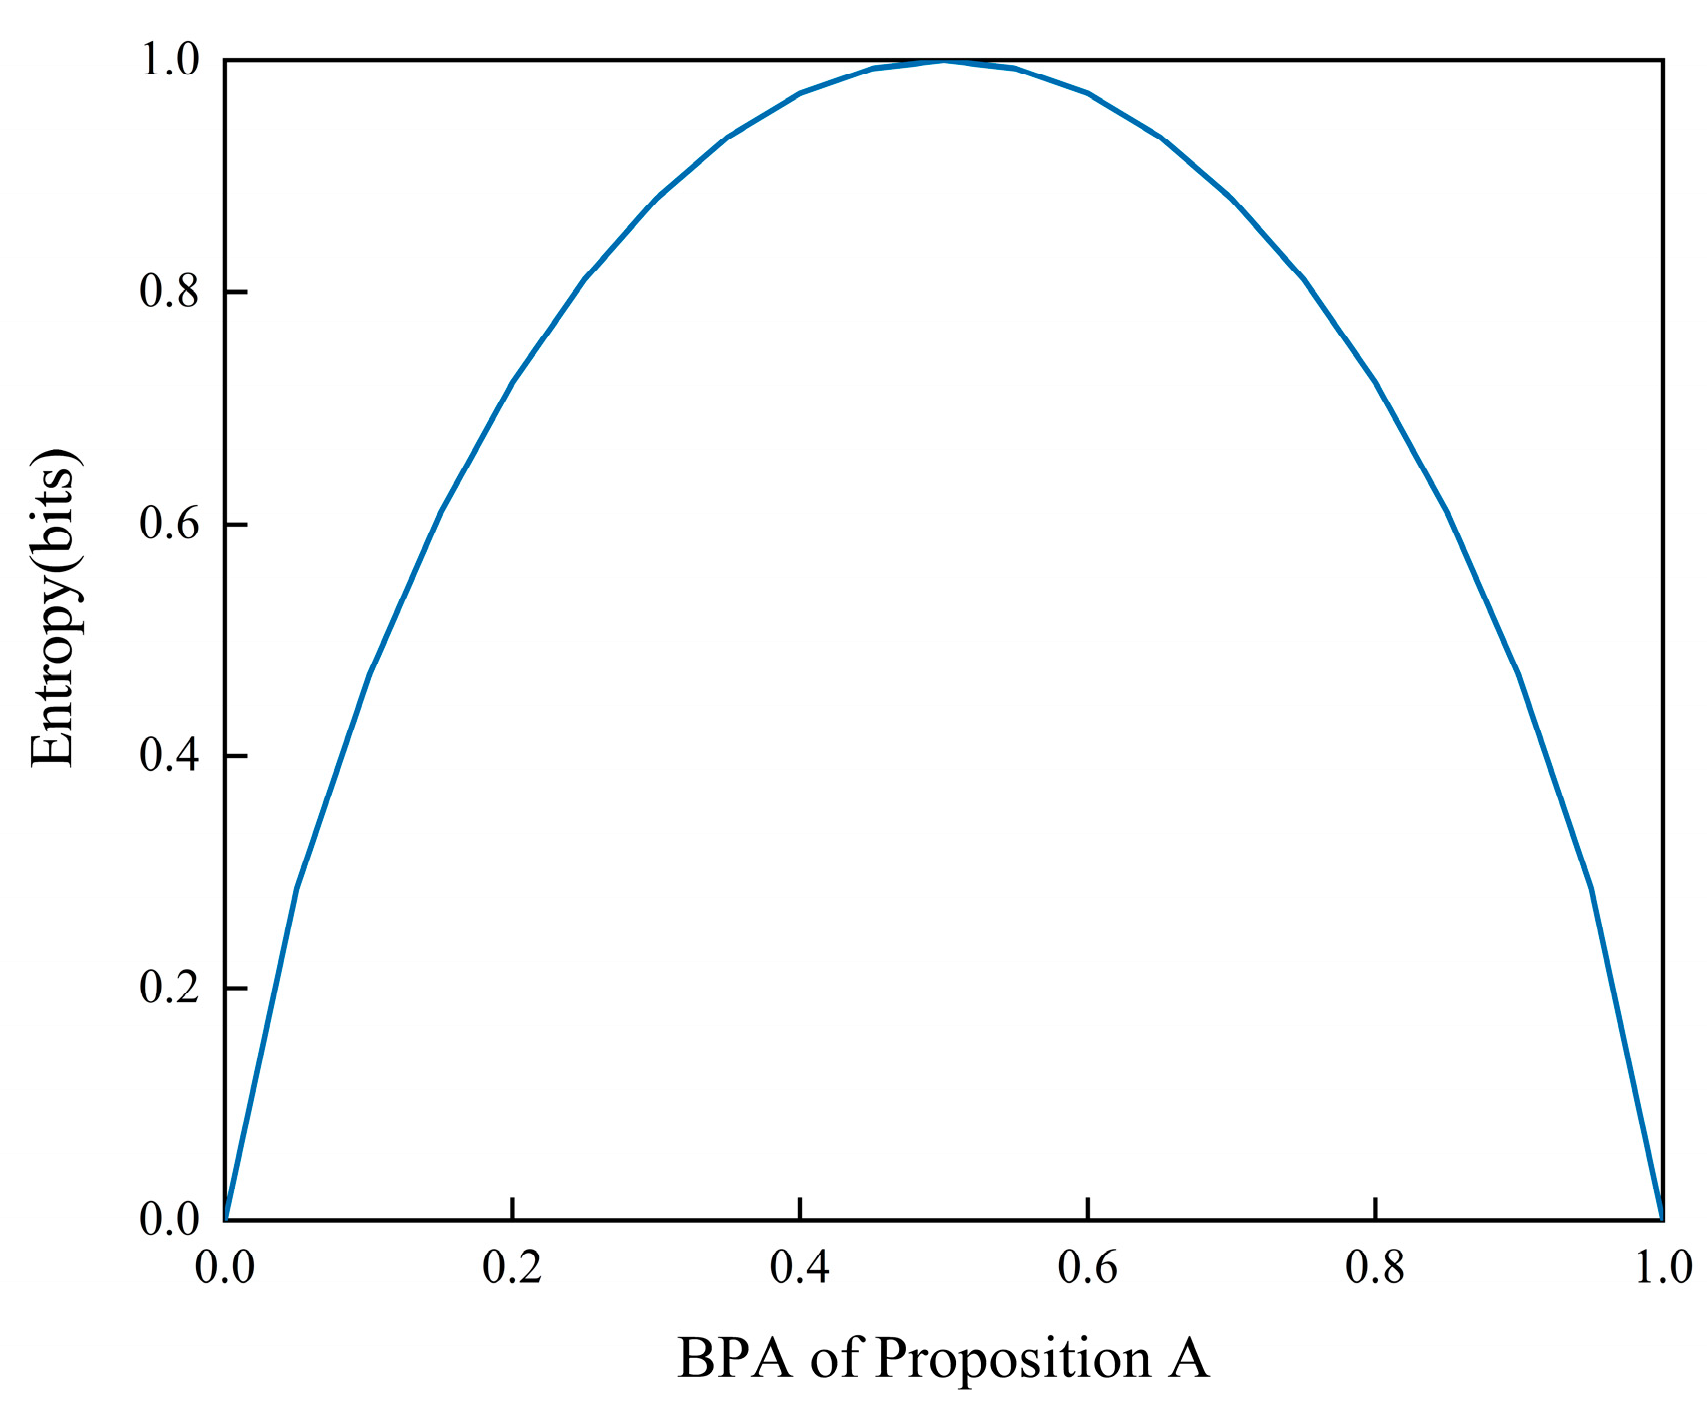
The magnitude of entropy in the evidence source is indicative of its level of uncertainty in mass allocation. Assuming that there are only two propositions, A and B, which are subsets within the recognition framework, Figure 1 illustrates the correlation between the belief mass allocation of the evidence source for proposition A and the magnitude of entropy. Based on the data presented in Figure 1, it is evident that the entropy attains a maximum value of 1 when the BPA of the evidence sources is uniformly distributed. Conversely, when the BPA allocation for a proposition is highly certain, entropy reaches its minimum value of 0. Therefore, the entropy values can be predicted using the BPA of the evidence source.
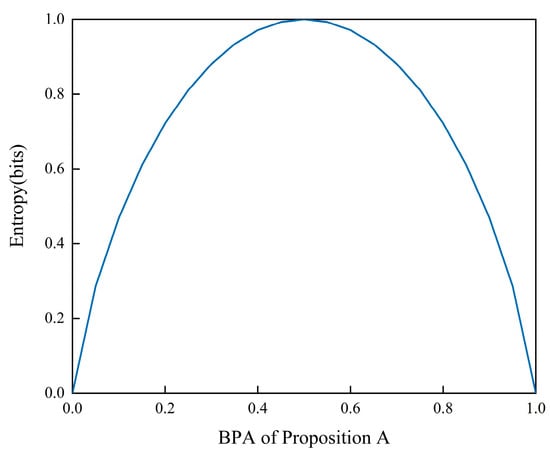
Figure 1.
The relationship between BPA and entropy.
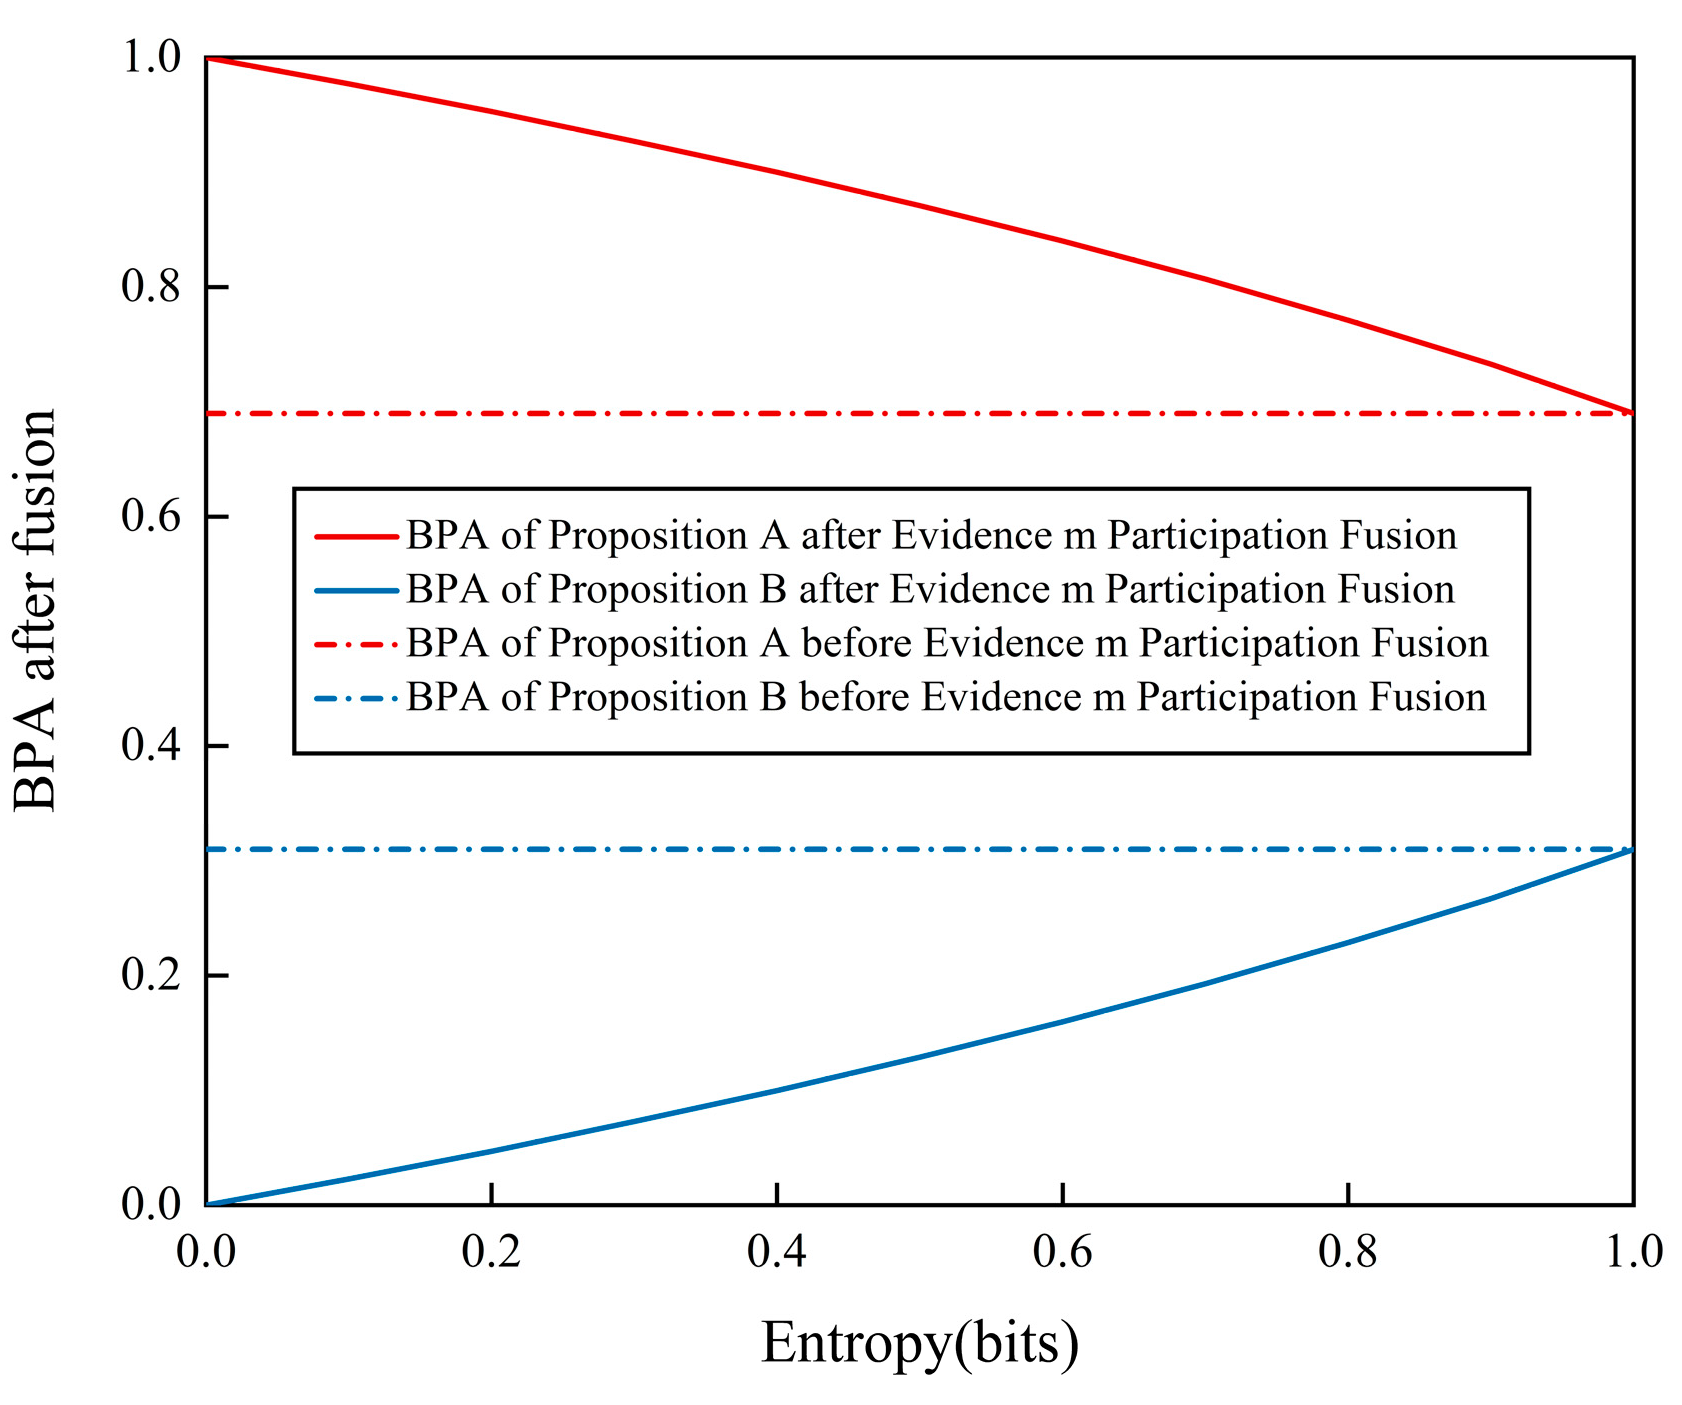
Figure 2 illustrates the correlation between the entropy size of the evidence source and its impact on the data-fusion outcomes. As depicted in the figure, an increase in the entropy of the evidence source m diminishes the effectiveness of data fusion. When entropy reaches its maximum, the third evidence source does not contribute effectively to the data-fusion process. Therefore, the entropy of a source of evidence increases as it approaches invalidity in DS evidence theory.
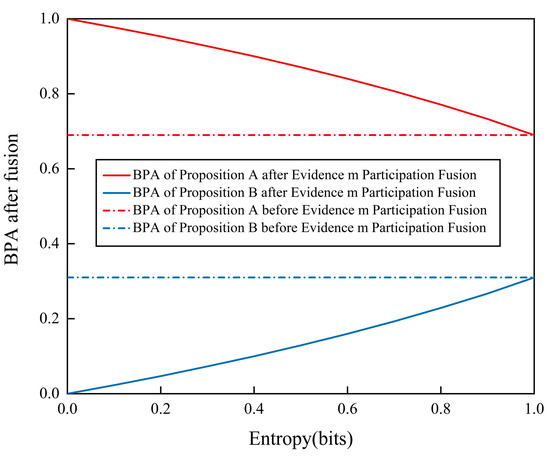
Figure 2.
The impact of entropy changes on fusion values.
Hence, altering the efficacy of the evidence source can impact the entropy of the evidence source, leading to the convergence of an evidence source towards an unreliable state and ultimately regulating the extent of the evidence source’s contribution to data fusion.
3.3. Similarity Weight and Entropy Weight of Evidence Sources
In the context of a recognition framework, the presence of a similarity relationship between pieces of evidence may result in imprecise calculation outcomes. This study evaluates evidence similarity using the Pearson correlation coefficient [44] and assigns a similarity weight denoted as , indicative of evidence credibility. Furthermore, the significance of evidence varies not only based on its inherent reliability but also on its relative importance. The assessor must allocate distinct weights to individual pieces of evidence, represented as . The weight assigned to each piece of evidence is contingent on the entropy of the evidence source. A higher entropy value indicates an increased uncertainty of the evidence, resulting in a lower weight in the overall evidence analysis. This weight is defined as the entropy weight and its calculation process is outlined in detail below [45].
- Similarity weight
- Calculate the degree of relevance of the evidence. The correlation between pairwise evidence was calculated based on Pearson’s correlation coefficient. Taking the correlation between evidence and as an example, the formula is:In the Equation (5), E is the mathematical expectation. represents the i-th piece of evidence and represents the j-th piece of evidence.
- We establish a correlation matrix, S, composed of the correlation coefficients of pairwise evidence:Since , when indicates a negative correlation between these two pieces of evidence. To ensure the accuracy of the weight calculation and reduce the impact of high conflict evidence, this article uniformly assigns a value of 0.001 to the result when .
- Calculate the similarity weight of the evidence. This study defines the similarity of evidence as , and , and the formula.
- Entropy weight
The entropy weight of the evidence source is defined as , which represents the proportion of a certain evidence source to all evidence sources. According to the relationship between the entropy and weight of the evidence source, the formula for calculating the entropy weight of the i-th evidence is defined as follows:
In the Equation (8), represents the entropy of the i-th piece of evidence and n represents the total number of evidences. It is found that when is taken as 5, it gives maximum weight to the evidence sources with small entropy, so in this paper the value of is 5.
3.4. Asymptotically Adjustable Compression Function
An asymptotically adjusted compression function is proposed in this study to enhance the uncertainty and diminish the sensitivity of the evidence in constructing a refined model. The asymptotic adjustment compression function outlined in this study aligns the evidence source with an invalid evidence source, consequently mitigating its influence on data fusion.
The weighted average of the similarity weight and entropy weight of a certain evidence source was used to obtain the comprehensive weight of a certain evidence source. The formula used is as follows:
This study employs the asymptotic adjustment compression function to achieve BPA adjustment, thereby guiding the evidence source towards the direction of invalid evidence sources. The formula for this adjustment is as follows:
In the Equation (10), represents the number of propositions within the recognition framework and P represents BPA before preprocessing. represents the degree of convergence, and when , the BPA of the evidence to the proposition remains unchanged; When , BPA is compressed to , meaning that entropy reaches its maximum and uncertainty is maximized, and the evidence source becomes completely invalid. Regardless of the value of P, symmetric compression of P with respect to was achieved using the asymptotic adjustment of the compression function.
3.5. Decompression Function
The purpose of linear compression of the BPA of the evidence source is to pre-process the evidence source, then after the data fusion is completed it should be linearly amplified accordingly for the fusion result to be reasonable.
where denotes the BPA of the fused result, denotes the general understanding for making probabilistic judgements, which is taken as 0.5. denotes the number of propositions in the recognition framework, denotes the number of BPAs within the corresponding range of values, and denotes the i-th BPA within the corresponding range of values. by using the inverse compression model, it is possible to make a linear amplification of the fused result corresponding to the time when it was compressed.
4. Simulation Results and Analysis
4.1. Basic Settings
The simulations conducted in this study were implemented using the Python 3.9 programming language.
Various comparison methods were employed to assess the efficacy of the proposed method. In addition to the traditional DS evidence theory [46] and Yager’s rule [24], the enhanced methods are denoted as Contradictory coefficient [38], Importance-based weight [35], and Chebyshev distance [47] based on their respective enhancements.
4.2. Fusion Results of Different Combinations of Evidence
To assess the efficacy of the method outlined in this article in diminishing the influence of specific evidence sources in data fusion, as opposed to outright disregarding them, a selection of evidence sources with ambiguous BPA was provided for examination. Assuming a recognition framework denoted as and an evidence set denoted as , and assuming the true target is denoted as “A”, the conflicting information is detailed in Table 1.

Table 1.
Evidence Combination 1.
The fusion results of the comparison method and the method proposed in this paper are displayed in Table 2 when there is an evidence source that presents significant conflicts with other sources, and the BPA of the latter is ambiguous. The traditional DS evidence theory completely rejects proposition A based on , leading to the fusion result also negating proposition A. Yager’s rule, faced with substantial conflicts, opts to assign a higher BPA to an uncertain proposition, thereby failing to provide a conclusive judgment, such as the value of 0.9919 in Table 2.
Table 2.
Comparison of Fusion Results of Evidence Combination 1.
The Chebyshev distance method reallocates the sum of BPAs based on the credibility of the individual pieces of evidence. Consequently, when the combined BPAs for the two propositions are equal, the fusion results cannot be differentiated. Moreover, this approach may lead to instances where the total BPAs in the evidence exceed or fall short of one following preprocessing, thus giving results that are inconsistent with the assumption. On the other hand, the Importance-based weight involves directly multiplying weights with BPAs, potentially providing evidence that supports a proposition to become unsupportive.
The Contradictory coefficient method calculates the conflict coefficient to give a contradiction matrix, which indicates the degree to which different pieces of evidence are in conflict with each other. Based on the contradiction matrix, the mutual contradiction coefficient of each piece of evidence is obtained, and then the weight of each piece of evidence is obtained. The mechanism of action of the Contradictory coefficient method can appear to fail to give fusion results. The proposed method introduced a comprehensive weight to compress the BPA of the evidence source without changing the judgement of the proposition by the evidence source, maintaining the integrity of the evidence’s assessment of the propositions.
Based on the findings from the simulation results, it is evident that the effectiveness of the evidence diminishes when BPA is ambiguous. Employing entropy weights to assess the significance of evidence enhances discrimination between sources of evidence and addresses inaccuracies in fusion outcomes resulting from similar BPAs. Additionally, the utilization of comprehensive weights to condense the BPA of evidence sources mitigates the issue of evidence probability pointing towards reversal.
To enhance the thoroughness of the simulation verification process outlined in this study, the data fusion of evidence sources with explicit BPA was examined. Assuming that A represents the actual target, conflicting information is presented in Table 3.
Table 3.
Evidence Combination 2.
When conflicting evidence is juxtaposed with other sources with clear BPA, the fusion outcomes of the comparison method and the novel method outlined in this study are presented in Table 4. The table demonstrates that the proposed method not only yields the same conclusion as the assumption but also generates more rational outcomes. Our method’s fusion result for target A’s BPA may be modest compared to other methods, but it effectively decreases the sensitivity of BPA and enhances the robustness of evidence fusion. Excessively positive outcomes can breed overconfidence among decision-makers, potentially blinding them to potential uncertainties or unknown variables. The methodology outlined in this article demonstrates the potential for yielding favorable outcomes in the specified scenario. Given the inherent uncertainty associated with individual pieces of evidence in supporting BPA, it is advisable to exercise caution when interpreting the final fusion result. Consequently, it is recommended to place a higher degree of trust in fusion results derived from unambiguous sources of BPA, while also approaching decision-making with prudence.
Table 4.
Comparison of Fusion Results of Evidence Combination 2.
This approach employs weighted compression of the BPA of evidence sources to mitigate the issue of evidence probability leading to reversal, thereby enabling control over the contribution of evidence sources to data fusion. In addition, it enhances the discrimination of evidence sources with ambiguous BPA, decreases the sensitivity of BPA, improves the robustness of evidence fusion, and yields accurate fusion outcomes within a rational scope.
4.3. Influence of Similarity Weight
To assess the impact of similarity weights on the fusion results, a dataset of evidence information is presented in Table 5, assuming A to be the true target. Utilizing the Pearson correlation coefficient, the similarity weights of evidence sources were determined to [0.25, 0.2496, 0.0003, 0.2495, and 0.25]. To mitigate the influence of entropy weights from evidence sources, an equal distribution was established at [0.2, 0.2, 0.2, 0.2, 0.2], according that entropy weight represents the importance of an evidence in all evidence.
Table 5.
Evidence Combination 3.
The fusion outcomes of the different enhancement techniques are presented in Table 6. The analysis of the table reveals that the conventional DS method yields inaccurate fusion outcomes, whereas Yager’s rule fails to produce fusion results. Conversely, alternative methods can generate precise fusion outcomes, albeit within a specified range of reasonableness.
Table 6.
Comparison of Fusion Results of Evidence Combination 3.
In the calculation of total system reliability, the reliability calculation formulas for parallel systems are as follows [46]:
In the Equation (12), represents the reliability of the subsystem.
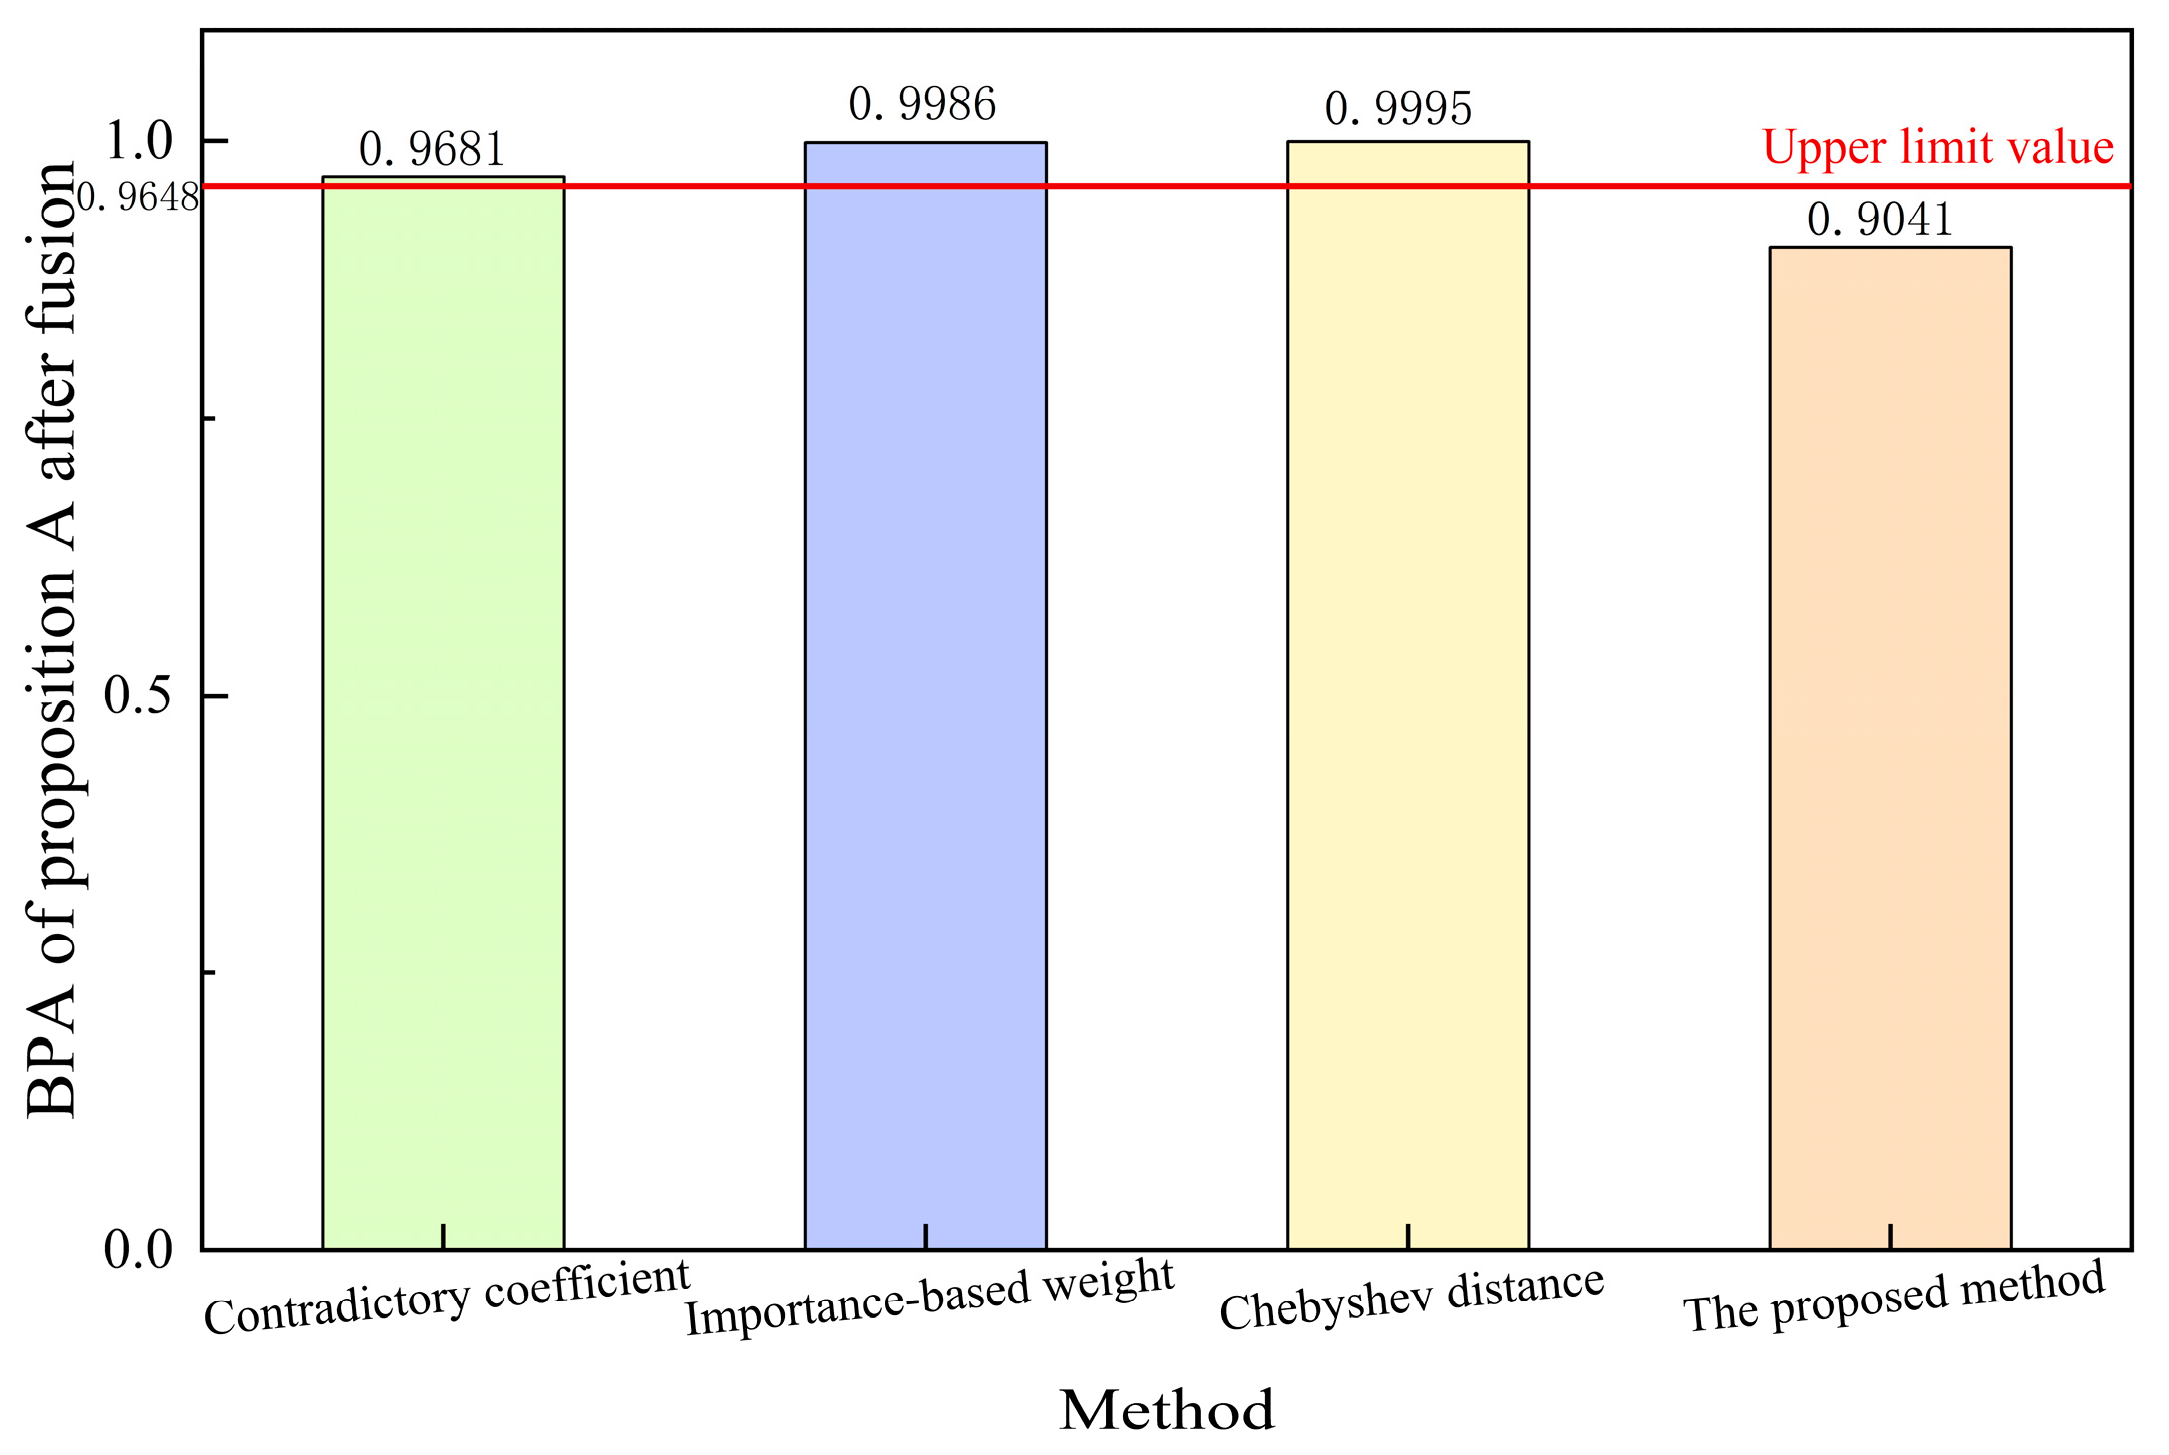
This study examined the relationship between the credibility of the evidence source and the reliability of the subsystem. There was no direct correlation between the sources of evidence. Therefore, in line with the concept of calculating system reliability, the similarity weight is utilized as the maximum limit of the BPA based on the outcomes derived from the parallel system. Given the uncertainty associated with each piece of evidence in determining the BPA, it is logical that the fusion result does not surpass this upper limit. Figure 3 shows the BPA of proposition A after fusion for each method and the upper limit value calculated according to Equation (18), which represents the maximum value of the result obtained from data fusion of the evidence source. The data indicate that only the method posited in this study remained within the prescribed upper limit, as opposed to other methodologies that surpassed this threshold owing to the BPA limit of 1. Incorporating similarity weights can facilitate the generation of fusion outcomes that are conducive to informed decision making within an acceptable range. Consequently, employing the approach delineated in this research can assure the precision and dependability of fusion results.
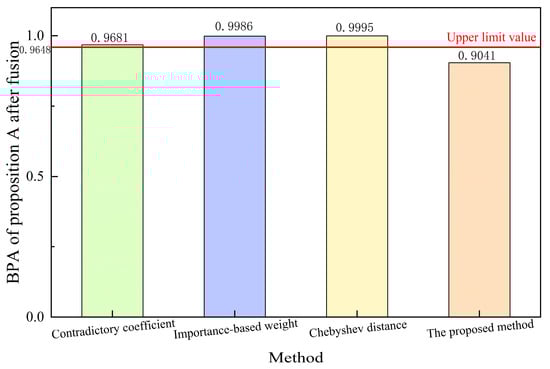
Figure 3.
BPA of Proposition A after Fusion of Different Methods.
4.4. Influence of Entropy Weight
To evaluate the influence of entropy weight on fusion outcomes, a collection of evidential data is presented in Table 7, under the assumption that A represents the true target. The allocation of weights was determined based on the entropy values of the evidence sources, resulting in a distribution of [0.23, 0.078, 0.31, 0.078, 0.151, 0.153]. To mitigate the impact of similarity weights from the evidence sources, all evidence was assigned a uniform similarity weight of [1, 1, 1, 1, 1, 1], indicating full reliability on each piece of evidence itself. Table 7 shows that , , and support Proposition A, while , , and support Proposition B. In cases where the amount of supporting evidence for each proposition is equal, the fusion result may be uncertain and susceptible to errors.
Table 7.
Evidence Combination 4.
The fusion outcomes for each technique are presented in Table 8. In contrast to other enhanced methods that overlook the uncertainty inherent in the evidence sources and prioritize fusion, the approach outlined in this study allocates weights based on the entropy of the evidence sources. This methodology ensures that evidence sources with lower entropy receive greater weight, thereby maximizing the utilization of pertinent information within the evidence sources and yielding the same conclusion as the assumption.
Table 8.
Comparison of Fusion Results of Evidence Combination 4.
The findings in Table 8 demonstrate that our method yields the same conclusion as the assumption, indicating a preference for the BPA of the evidence source with the highest entropy weight. Consequently, when faced with an equal number of incompatible evidence sources, our method prioritizes evidence with lower entropy, amplifying its significance, and increasing reliance on evidence sources with greater weight.
5. Results: Probability of Ship Detection
In the realm of ship target recognition, the likelihood of a particular ship type manifesting in a designated maritime region is instrumental in facilitating informed decision making regarding recognition outcomes. In practical scenarios, it is imperative to offer probabilities of ship-type targets across varying-size categories, encompassing large, medium, and small vessels. This section utilizes the improvement method outlined in the aforementioned article, considering the perspectives of varying scales and incorporating empirical data pertaining to environmental conditions and the motion characteristics of the target to estimate the likelihood of ship type targets manifesting.
5.1. Quantification of Influencing Factors
The assessment of the likelihood of the presence of maritime vessels of varying sizes is instrumental in enabling decision makers to devise appropriate response strategies. Table 9 provides the definition, size, and speed of maritime vessels of varying sizes [47].
Table 9.
Maritime Vessels of Varying Sizes.
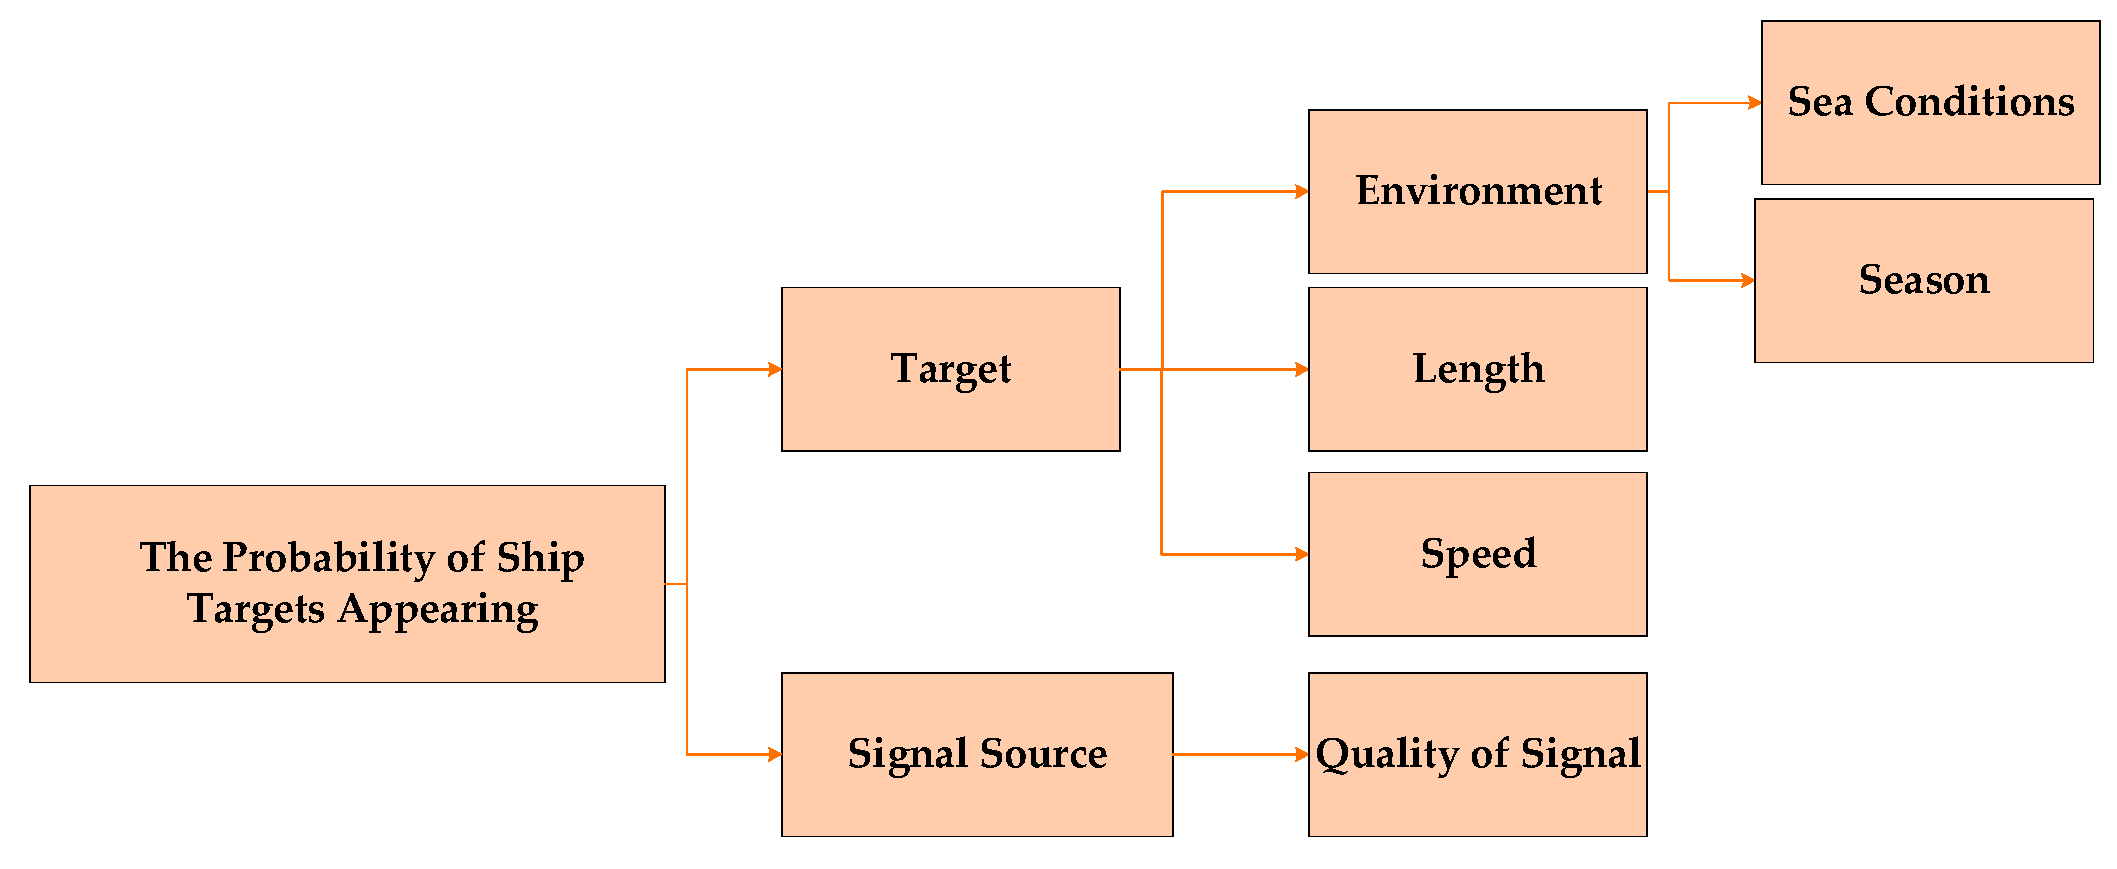
The computation of the probability of the presence of these vessels necessitates consideration of multiple influencing factors. These include environmental conditions, speed and length of the target vessel, and information derived from various data sources. These factors are divided into target-related and data source-related factors, each contributing independently to BPA. As depicted in Figure 4, the Analytic Hierarchy Process (AHP) is employed to classify these influencing factors, thereby facilitating their integration into the data-fusion process. This approach provides a more appropriate way of categorising factors.
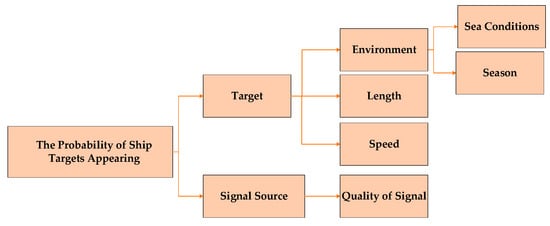
Figure 4.
Influence Factor.
By quantifying the factors according to their acquisition methods and data characteristics, the probability distribution of the ship under each factor was obtained.
- Sea conditions
Within the scope of environmental factors, the impact of weather is predominantly manifested in the state of the sea [48]; hence, the primary focus is on the sea conditions. Existing research [49] categorizes sea conditions ranging from 0 to 9 into four distinct levels based on the significant wave height: normal, high, severe, and hazardous sea conditions, as shown in Table 10. Generally, we postulate the likelihood of the presence of large, medium, and small vessels is relatively high under favorable sea conditions. Conversely, under adverse sea conditions, the probability of vessel presence is comparatively low. Under moderate sea conditions, the probability of a large vessel presence increases, whereas the likelihood of a small vessel presence decreases. Utilizing the empirical data provided by the National Marine Science Data Center, piecewise linear fitting was conducted to calculate the annual probability of occurrence for each sea condition level. This calculated probability is subsequently utilized as the BPA for sea conditions, and is represented as follows:
Table 10.
Sea State Classification.
In the Equation (13), represents the sea state level and represents the length of the target to be identified.
- Speed and length
The velocities of the different types of ships exhibited variability and distinct ranges. Ships of different sizes are categorized based on their length divisions with the assumption that they conform to a normal distribution [50]. Using the velocity of sea vessel as a specific example, the central tendency of this variable acts as the focal point of the distribution. Consequently, the probability density function of a specific velocity for the navigation of diverse ship types can be derived.
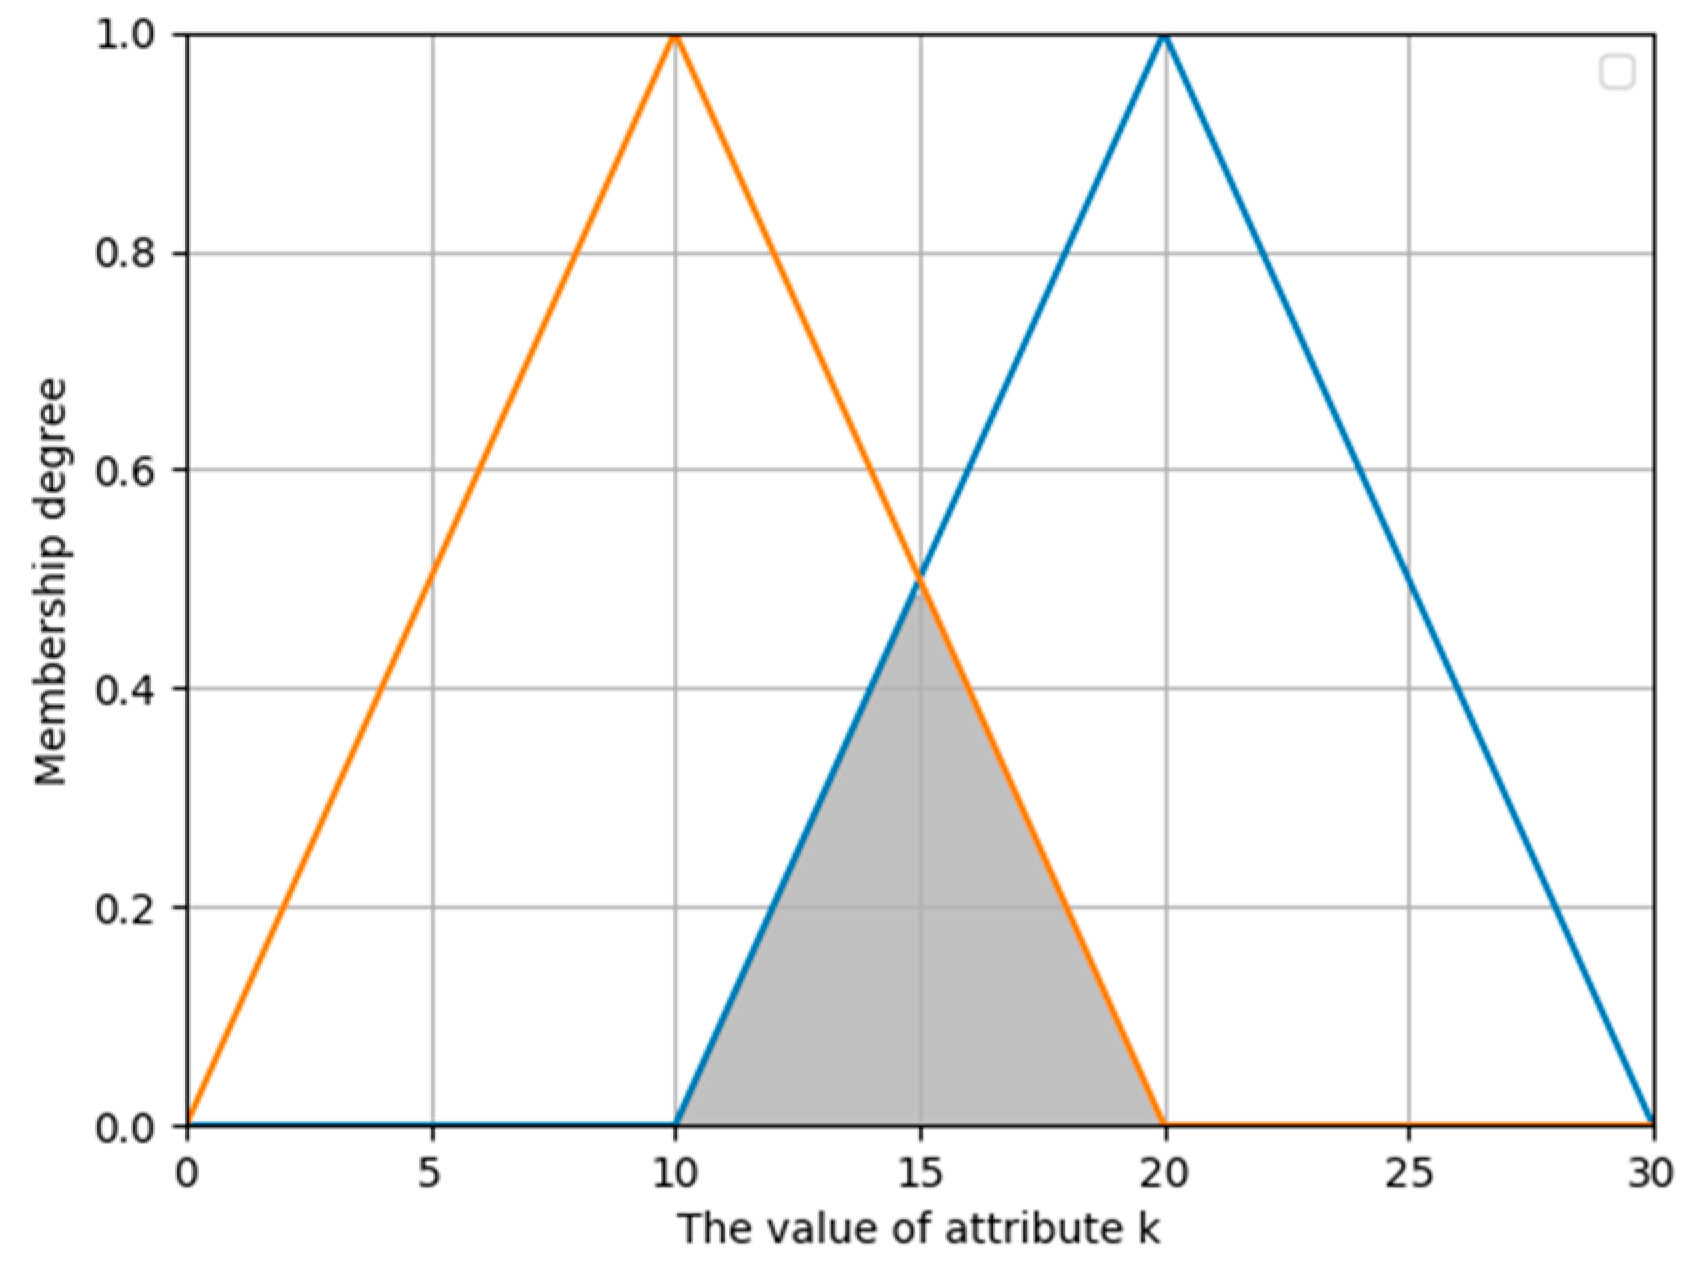
In the Equation (14), is the mean velocity, and is the variance. The probability density function of a normal distribution is generally used as a membership function for target classification based on the velocity. Therefore, based on the value of attribute k, the Gaussian membership function classified as A is shown in Figure 5, and the calculation formula [50] is as follows:

Figure 5.
Membership Function.
In the Equation (15), , and represent the sample mean and standard deviation of attribute k. x is the value of the target attribute k. For any target, reflects the degree to which it belongs to category A from the perspective of attribute k. In this article, it reflects the probability that the target belongs to a large ship from the perspective of speed. And use it as the BPA provided by the evidence of velocity information.
- Season
Seasonal factors primarily consider the likelihood of vessels embarking on sea voyages during various months as well as the constraints imposed by fishing moratoriums. Broadly speaking, ships are more prevalent in the summer and autumn months because of the impact of tourism and commercial activities. For instance, in the Northern Hemisphere, the likelihood of ship sightings is notably higher from June to November, with varying probabilities for different vessel types. Study [51] has indicated that the likelihood of ships embarking on sea voyages within a year typically conforms to a normal distribution; thus, the aforementioned membership function can be utilized to quantify BPA as . The restriction of fishing activities pertains solely to fishing vessels, the majority of which are small in size; thus, this factor is only considered when assessing the probability of small vessels being present. Generally, fishermen are expected to comply with fishing ban regulations and refrain from engaging in fishing activities at sea. This study posits that the likelihood of ships appearing during the fishing ban period is minimal, with a probability set at 0.05. Other ship categories are exempt from fishing bans; thus, their occurrence is deemed to have a probability of 1. The fishing ban period is assumed to extend until a specified time, such as in the waters of China, where the requirements for fishing bans in each sea area are denoted as and [52]. The period from March to June was designated as the fishing ban period. In conclusion, the probability of small boats appearing is determined by the BPA derived from seasonal factors, which can be expressed by the following equation:
In the Equation (16), represents the month. When calculating the probability of the appearance of non-small-size boats, the formula for calculating BPA is:
In the Equation (17), represents the month.
- Quality of signal
Signal quality can be standardized by calculating the signal-to-noise ratio (SNR) of the data originating from the signal source to derive the BPA. The SNR represents the ratio of signal power or amplitude to noise and serves as a metric to assess the strength and clarity of useful signals in comparison to background noise. Signals that convey desired information may be disrupted by noise and extraneous interference stemming from sources, such as electromagnetic interference and atmospheric disturbances. The larger the signal-to-noise ratio, the better is the quality of the signal relative to the noise.
5.2. Calculation and Analysis
Potential scenarios were analyzed to assess the practical applicability of the proposed method outlined in this article. The recognition framework is established as , and the individual probabilities of large, medium, and small ships appearing are calculated. It is worth noting that certain sources suggest that under specific conditions, such as favorable sea conditions, the likelihood of large, medium, and small ships appearing may be equal, with a probability of 0.8. In accordance with the principles of the DS evidence theory, it is necessary for the recognition framework to consist of a comprehensive set of mutually exclusive basic propositions, leading to the normalization of BPA during the process of data fusion. For instance, the normalization formula of large ship for the first evidence presented in Table 11 is as follows:
Table 11.
The fusion result of Non-conflicting evidence.
5.2.1. Non-Conflicting Evidence
In practical applications, evidence often does not conflict. An example of this can be seen in a specific probability calculation related to ship occurrences, where the sea condition was categorized as level 4, which took place in May during a fishing ban. The ship was traveling at a speed of approximately 24 nautical miles per hour, and had a length of approximately 200 m. These factors were utilized to determine the membership degree for obtaining BPA with high-quality data acquired from the signal source. BPA was subsequently derived by calculating the signal-to-noise ratio. The analysis suggests that the intended target is a medium-sized vessel, as indicated by the evidence of participation in the evaluation, its BPA, and the fusion results presented in Table 11.
The proposed method obtains the composite weight of each evidence source by calculating the similarity weight and entropy weight of each evidence source, and preprocesses the evidence sources using the composite weight and the asymptotic adjustment compression function. Since there is no conflict between the evidence, the method in this paper gives fusion results that are consistent with common sense.
In practical scenarios, conflicts may arise between evidence as a result of uncertain events. This analysis examines the application of the proposed method to address potential conflicts that may arise in practice [53].
5.2.2. Conflict with Zero Confidence
A sea-condition level of 7 results in significant wave interference that obstructs data collection and renders the signal quality unreliable. Consequently, the signal cannot be considered as a valid source of evidence for data fusion. This observation was made in June during a fishing ban period, with the ship’s speed recorded at approximately 27 nautical miles per hour. Following the calculation using the membership function, the BPA for a large ship was determined to be 0. A length of approximately 120 m was utilized in conjunction with other factors to determine membership for the purpose of obtaining BPA in the context of a medium-sized ship. The evaluation included evidence of participation, BPA, and fusion results, as shown in Table 12. The analysis in Table 12 reveals that the fusion results generated by this method pertain to large ships. Therefore, in light of conflicting evidence and evidence with moderate BPA values, a comprehensive consideration of all evidence is necessary to overcome the limitations of the traditional DS evidence theory and produce an accurate fusion result.
Table 12.
The fusion result of Conflict with 0 Confidence.
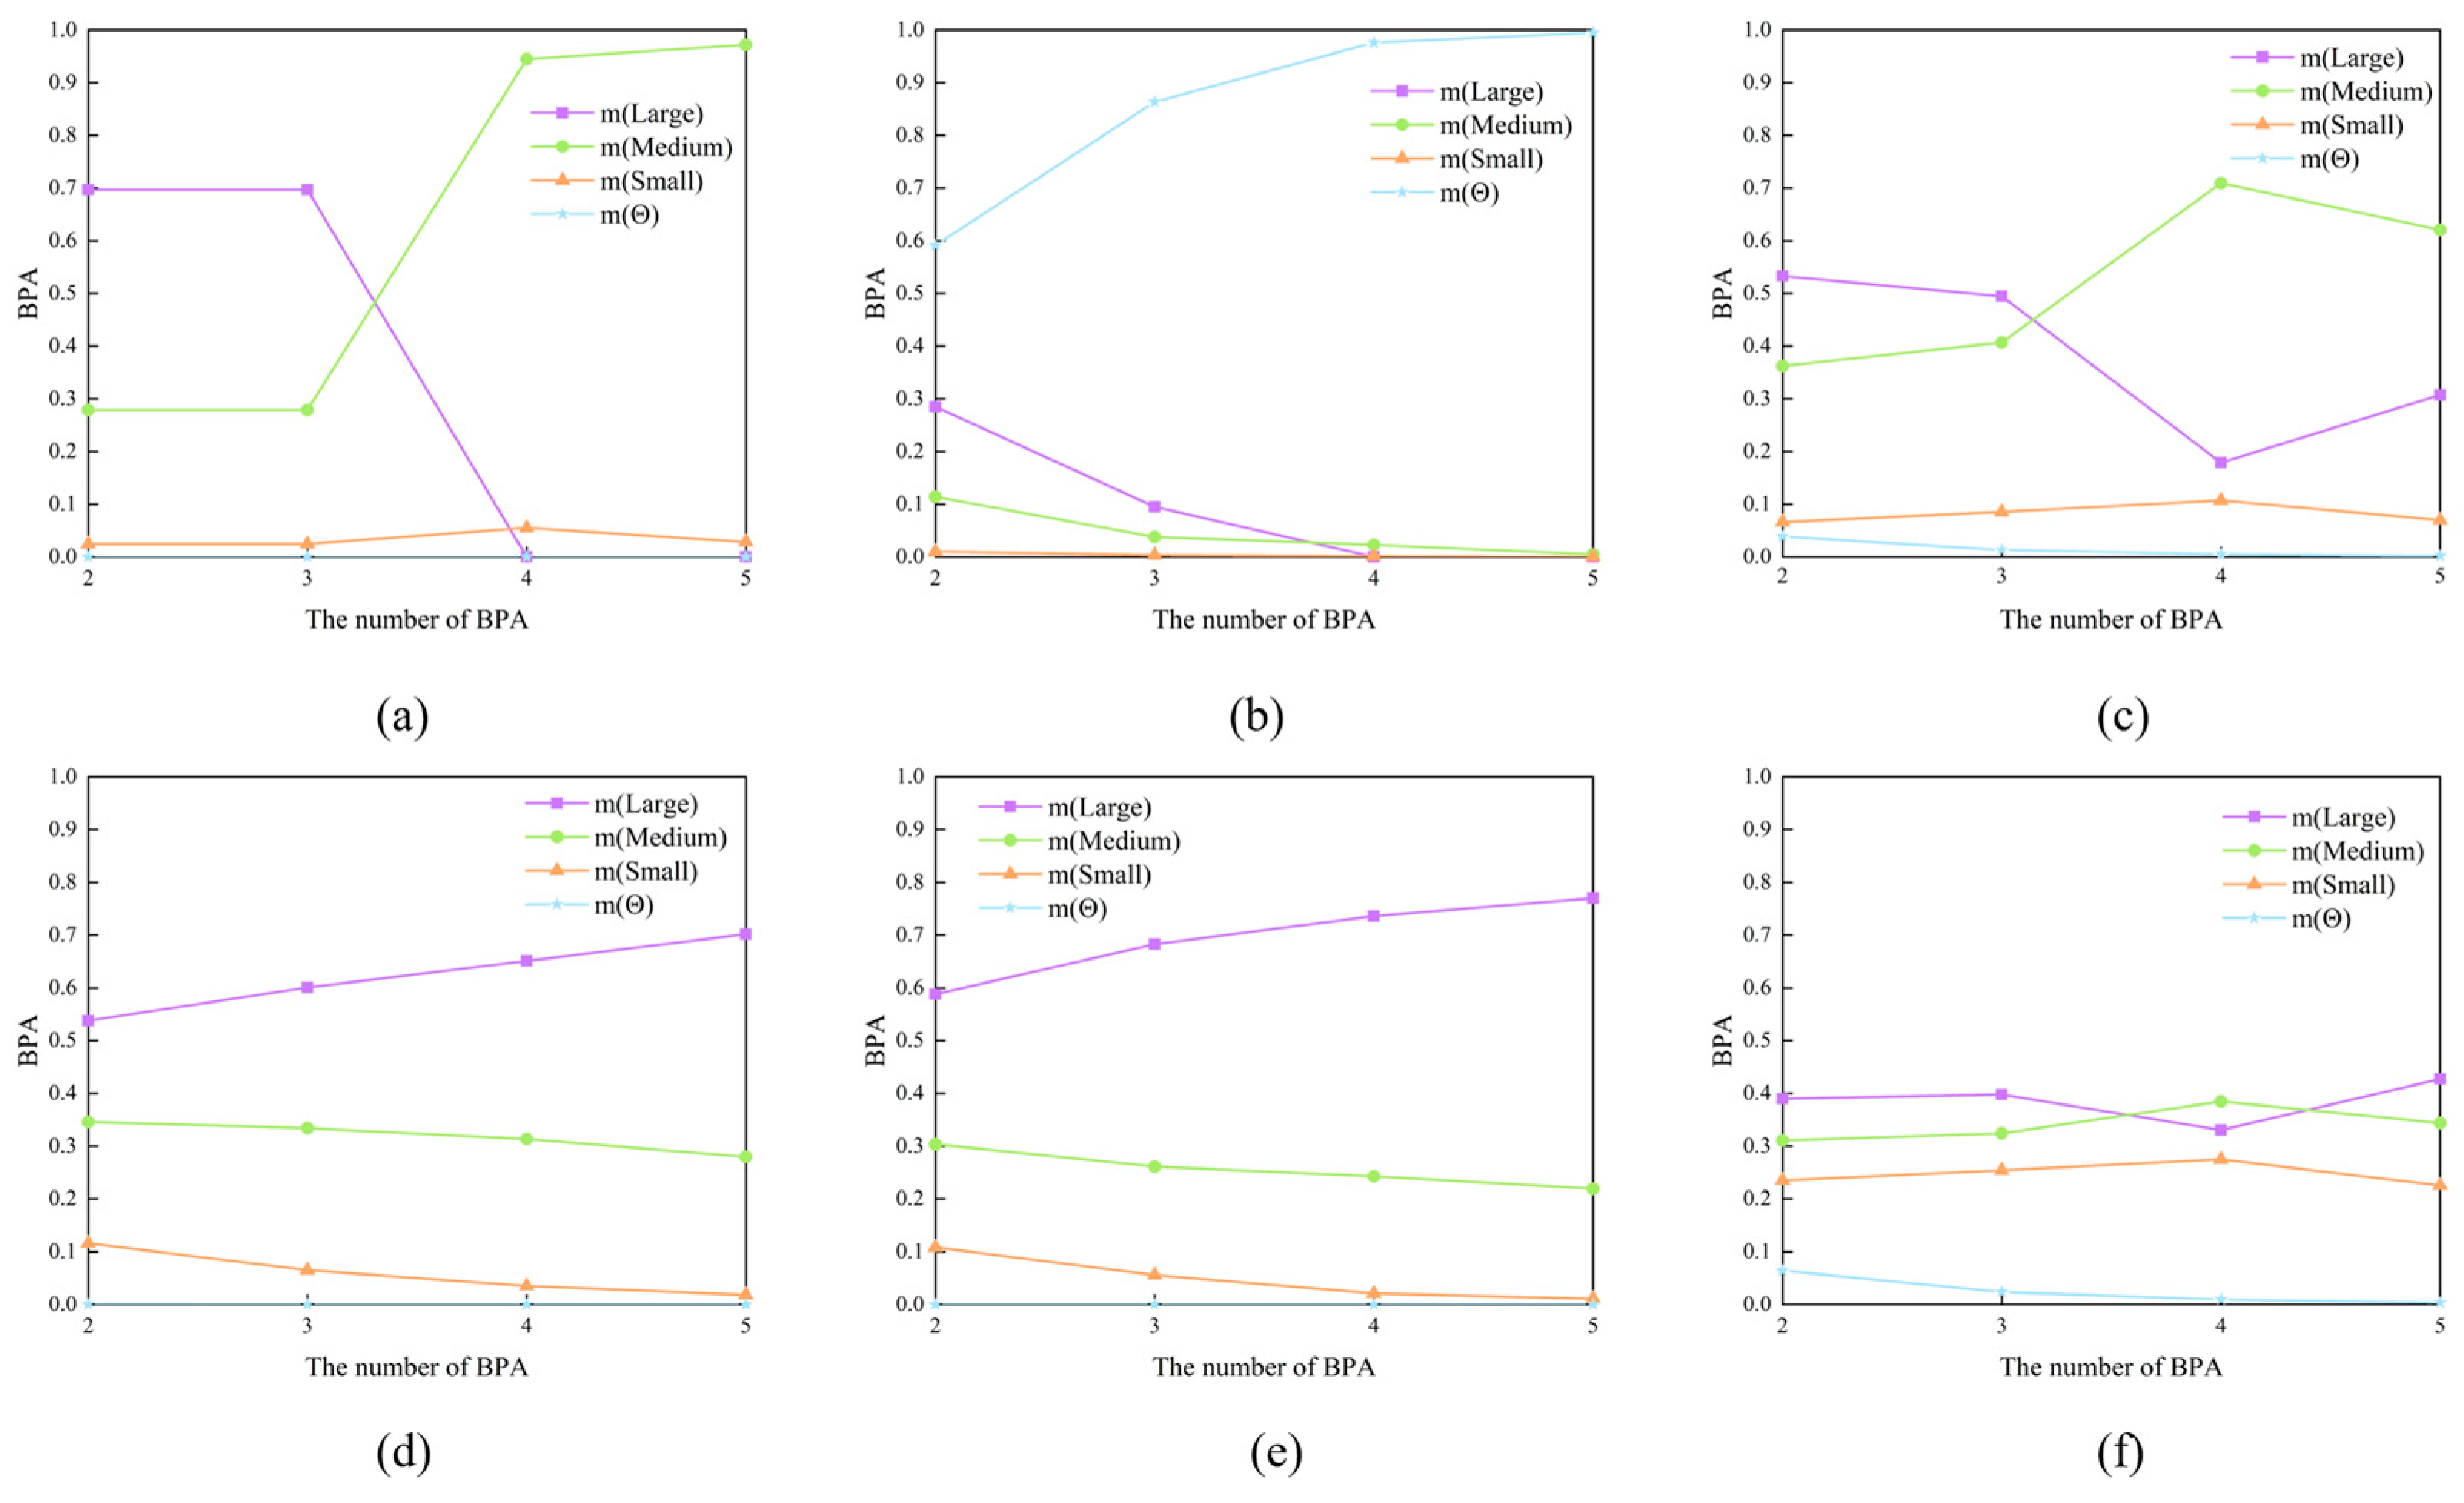
An in-depth examination of the data-fusion process is outlined in Table 12. In this study, data fusion was conducted sequentially, based on the evidence presented in Table 12. Theoretically, the presence of contradictory information, such as speed, suggests that the BPA of large vessels decreases when this evidence is integrated into the data-fusion process. Figure 6 illustrates the variation in the BPA values of the fusion outcomes as the number of BPAs incorporated in the fusion process increases. Figure 6 illustrates that neither the traditional DS evidence theory nor Yager’s rule yielded the same conclusion as the assumption. Specifically, when the number of BPAs is four, there is an anomalous increase in the BPA of large ships, contradicting Importance-based weight method and Chebyshev distance method. Only the method proposed in this study and the Contradictory coefficient method showed a decreasing trend. However, the final fusion outcome of the Contradictory coefficient method was inaccurate, indicating that medium-sized ships had the highest likelihood of occurrence.
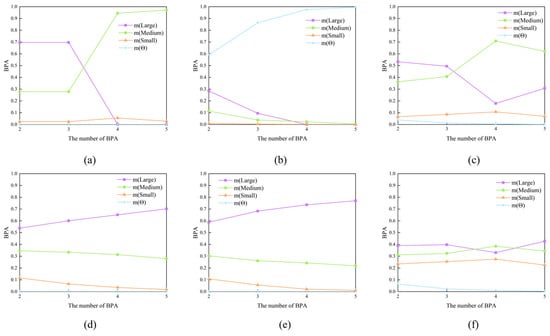
Figure 6.
The impact of the number of evidence sources involved in fusion on BPA. (a) DS combination; (b) Yager’s rule; (c) Contradictory coefficient; (d) Importance-based weight; (e) Chebyshev distance; (f) Proposed.
Hence, in cases where conflicting evidence arises in the fusion process, the BPA of large ships decreases; however, the approach outlined in this study ultimately yields an accurate fusion outcome, offering distinct advantages in addressing challenges associated with multi-evidence fusion issues.
5.3. Effect of Time
The experimental simulation presented in Table 13 utilizes data obtained from a real large-ship target. The BPA of various evidences assigned to ships of different sizes over consecutive months within a year was examined. Sea-state data were derived from measurements provided by the National Marine Science Data Center. It is noted that June to August mark the typhoon season in Chinese waters annually, whereas November to February of the following year is characterized by strong winds in northern waters, leading to unfavorable sea conditions. Seasonal factors are determined by analyzing the likelihood of ships departing in various months, whereas Bayesian probability analysis incorporates empirical data collected over multiple months.
Table 13.
Evidence combination for different months.
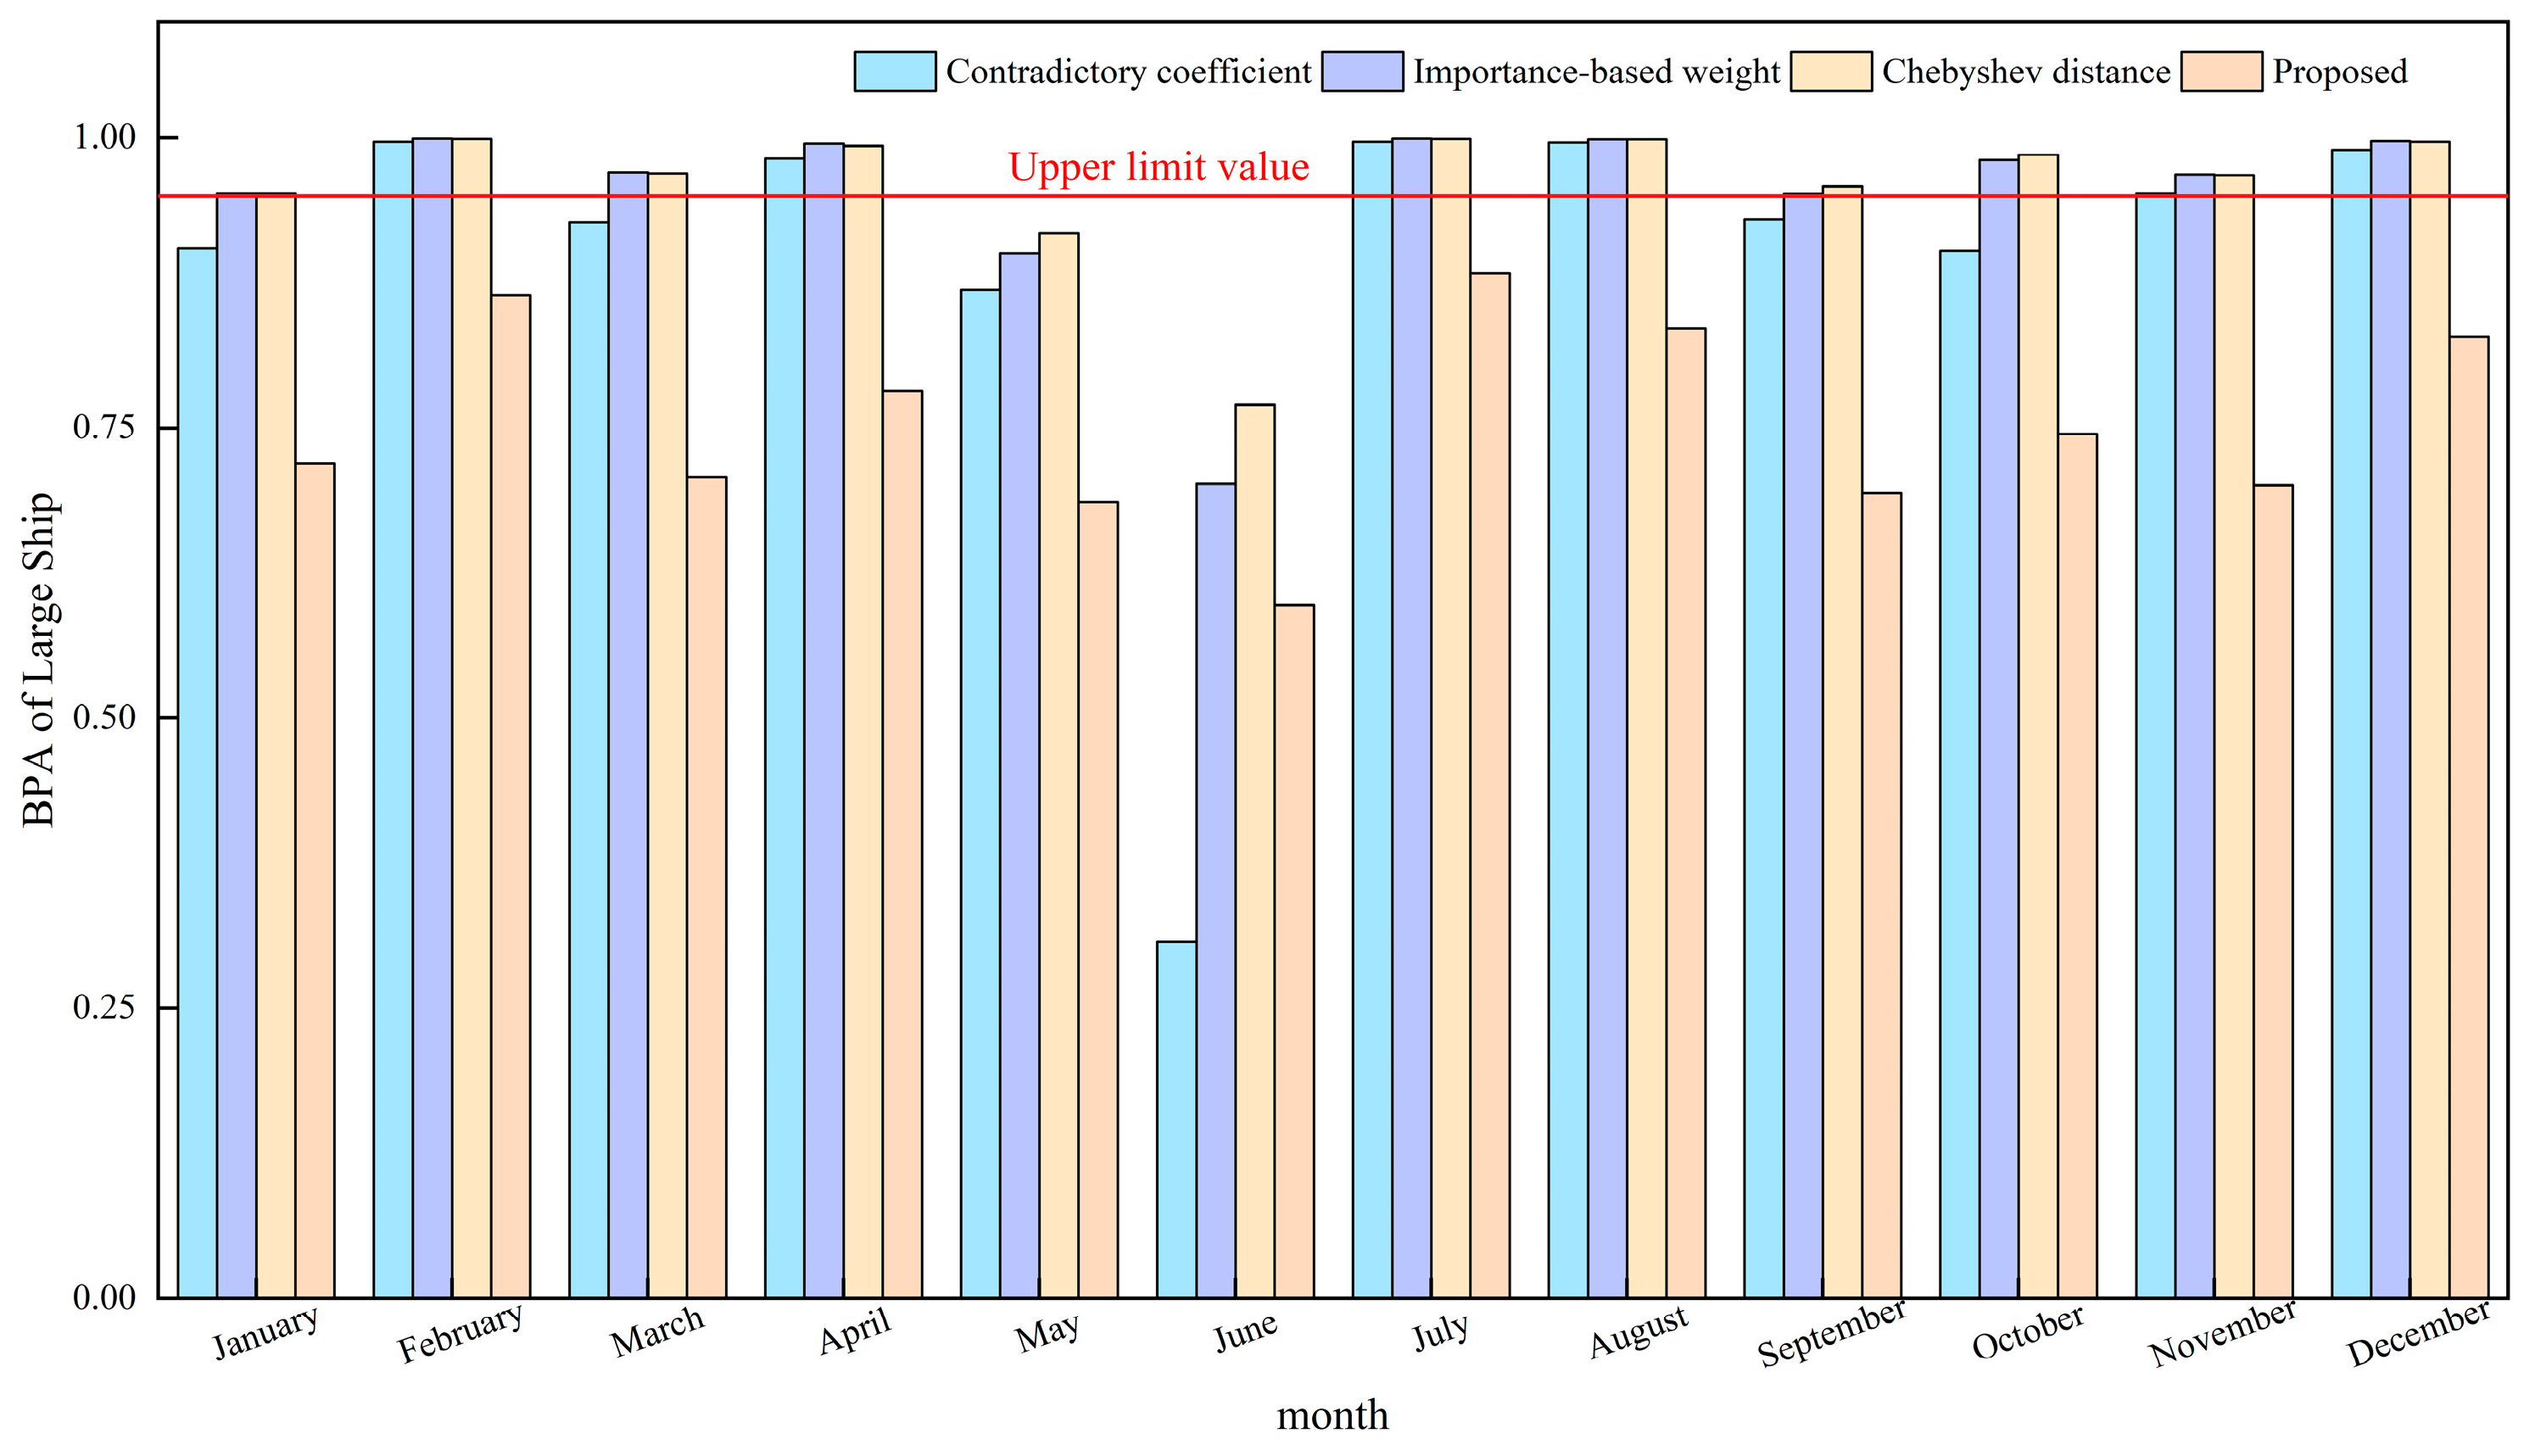
The probability outcomes regarding the presence of large ships, as determined through data fusion employing various enhancement techniques, are shown in Figure 7. Analysis of Figure 7 reveals that the fusion outcomes of the Contradictory coefficient method in June were inaccurate, with other methodologies surpassing the upper threshold to varying extents. Notably, only the fusion outcomes of this particular method were accurate and fell within the acceptable range, which refers to the upper limit value which represents the maximum value of the result obtained from data fusion of the evidence source.
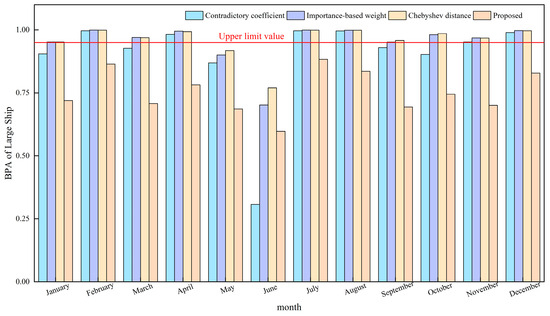
Figure 7.
The BPA of large ships in the fusion results of different methods in different months.
Hence, in real-world scenarios, the methodology presented in this study has the capability to regulate the directionality of evidence sources, manage their influence in data integration, and uphold the inherent biases of evidence sources towards propositions, thereby ensuring the precision of fusion outcomes and offering a level of data reliability.
6. Discussion
Many fusion methods aim to minimize uncertainty in fusion results, with traditional synthesis rules of DS evidence theory proving effective in achieving this goal. To fully capitalize on these methods, a clear distinction must be made between the evidence, particularly in cases where the BPAs are ambiguous. This paper proposes a method to enhance differentiation between evidence from an entropy perspective. When there is only one piece of evidence, its entropy weight is 1, and the entropy value of the evidence source does not impact the BPA. With two pieces of evidence, the BPAs transition from being identical to completely conflicting, meaning that while one piece of evidence remains unchanged, the BPA of the other piece becomes increasingly antagonistic towards the proposition. If a linear relationship exists between the change in BPA and the change in weights, subsequent preprocessing using the asymptotic adjustment compression function results in a minimal alteration in the evidence’s BPA, leading to insignificant differentiation. In the proposed methodology, it is observed that a linear increase in BPA results in an exponential increase in entropy weights. The weights obtained are larger when the entropy of the evidence is smaller, and the rate of weight increase accelerates as the entropy approaches zero. By employing the asymptotic adjustment compression function to preprocess the evidence, the BPA undergoes more significant changes, leading to enhanced differentiation between evidence and assigning larger weights to more certain evidence. The outcomes of data fusion using DS evidence theory are found to be more reliant on the evidence with greater weights. Hence, the proposed methodology effectively achieves accurate results through enhancing the distinction between evidence sources and integrating data.
7. Conclusions
This article introduces a modification to DS evidence theory as a solution to this challenge. Asymptotic adjustment compression function is used to achieve symmetric compression of the integrated weights of the evidence sources on the BPA of the evidence sources and to control the degree of their influence in data fusion, which is a new preprocessing method of the evidence sources and solves the problem of the reversal of the probabilistic pointing of the evidence in the process of the introduction of the weights. By comparing with the existing methods, the proposed method assigns different weights to each evidence source by calculating similarity weights and entropy weights, which in turn have different degrees of influence in data fusion. The mechanism of the proposed method makes the fusion result more dependent on the evidence sources with higher weights, which helps to get the correct fusion result.
In the domain of ship target recognition, the effective integration of auxiliary information sources that influence the probability of ship appearance is imperative. The rationality of these methods contributes significantly to providing comprehensive information support for subsequent ship identification processes, thereby enhancing accuracy and reliability in identification. Given the differing levels of effectiveness exhibited by these auxiliary information sources, their fusion to yield precise results has emerged as a pivotal focus of research. The modelling and quantification of different types of factors affecting the probability of occurrence of ship targets are given, and the enhanced DS evidence theory has been effectively utilized to determine the likelihood of ship targets appearing in specific maritime regions. This methodology has enabled the integration of data from various supplementary sources. This study provides data support for the recognition method using primary information sources when the target recognition results are finally given. With the advancement of technology, the number of information sources influencing ship probability will continue to grow, increasing the factors involved in decision-making. Therefore, this paper proposes an effective method for data fusion. By integrating identification results from algorithms suitable for different information sources, this study also offers a sound strategy. Future research will incorporate the identification algorithms themselves into data fusion to assess the credibility of identification results. Currently, this methodology exclusively evaluates certain static variables; however, there is potential for future development to incorporate dynamic, real-time recognition sequences that evolve over time. This evolution necessitates the use of stable, quantitative recognition algorithms.
Author Contributions
Conceptualization, N.F. and J.C.; software, J.C.; validation, N.F.; formal analysis, J.C.; investigation, J.C.; data curation, J.C.; writing—original draft preparation, J.C.; writing—review and editing, N.F.; visualization, J.C.; supervision, N.F.; project administration, N.F. All authors have read and agreed to the published version of the manuscript.
Funding
This research received no external funding.
Data Availability Statement
The raw data supporting the conclusions of this article will be made available by the authors on request.
Conflicts of Interest
The authors declare no conflicts of interest.
References
- Gegen, T.; Zhong, K.; Qiao, H.-Z.; Zhang, X.-Z.; Li, J.-N.; Xu, D.-G.; Yao, J.-Q. Broadband One-Dimensional Range Profiles Characteristic of Rough Surface in Terahertz Band. Acta Phys. Sin. 2023, 72, 184101. [Google Scholar] [CrossRef]
- Sui, R.; Wang, J.; Xu, Y.; Feng, D. High-Resolution Range Profile Feature Transformation Method Based on Amplitude-Phase Modulation Metasurface. Electronics 2022, 11, 3020. [Google Scholar] [CrossRef]
- Niu, Y.; Gao, P.P.; Gao, X. Recognition of DC01 Mild Steel Laser Welding Penetration Status Based on Photoelectric Signal and Neural Network. Metals 2023, 13, 871. [Google Scholar] [CrossRef]
- Sun, Y.; Jiang, W.; Yang, J.; Li, W. SAR Target Recognition Using cGAN-Based SAR-to-Optical Image Translation. Remote Sens. 2022, 14, 1793. [Google Scholar] [CrossRef]
- Huan, R.-H.; Ge, L.-Q.; Yang, P.; Xie, C.-J.; Chi, K.-K.; Mao, K.-J.; Pan, Y. SAR Multi-target Interactive Motion Recognition Based on Convolutional Neural Networks. IET Image Process. 2020, 14, 2567–2578. [Google Scholar] [CrossRef]
- Zhan, R.; Cui, Z. Ship Recognition for SAR Scene Images under Imbalance Data. Remote Sens. 2022, 14, 6294. [Google Scholar] [CrossRef]
- Zhang, C.; Zhang, X.; Zhang, J.; Gao, G.; Dai, Y.; Liu, G.; Jia, Y.; Wang, X.; Zhang, Y.; Bao, M. Evaluation and Improvement of Generalization Performance of SAR Ship Recognition Algorithms. IEEE J. Sel. Top. Appl. Earth Obs. Remote Sens. 2022, 15, 9311–9326. [Google Scholar] [CrossRef]
- Li, H.; Pan, D. Multi-Photoelectric Detection Sensor Target Information Recognition Method Based on D-S Data Fusion. Sens. Actuators A Phys. 2017, 264, 117–122. [Google Scholar] [CrossRef]
- Feng, B.; Chen, B.; Liu, H. Radar HRRP Target Recognition with Deep Networks. Pattern Recognit. 2017, 61, 379–393. [Google Scholar] [CrossRef]
- Wang, X.; Song, X.; Zhao, Y. Identification and Positioning of Abnormal Maritime Targets Based on AIS and Remote-Sensing Image Fusion. Sensors 2024, 24, 2443. [Google Scholar] [CrossRef]
- Cover, T.M.; Thomas, J.A. Elements of Information Theory; Wiley-Interscience: Hoboken, NJ, USA, 2006. [Google Scholar]
- Huang, Y.; Jiang, K.; Yi, N. Some Weighted Averaging Methods for Gradient Recovery. Adv. Appl. Math. Mech. 2012, 4, 131–155. [Google Scholar] [CrossRef]
- Zhang, J.; Liu, H.; Sun, X.; Liu, S. Processing of Building Subsidence Monitoring Data Based on Fusion Kalman Filtering Algorithm. Alex. Eng. J. 2021, 60, 3353–3360. [Google Scholar] [CrossRef]
- Zhu, X.; Bao, W. Performance Comparison of Image Fusion Alternatives Combining PCA with Multi-Resolution Wavelet Transforms. J. Indian Soc. Remote Sens. 2024, 52, 943–956. [Google Scholar] [CrossRef]
- Zheng, C.; Jiang, X.; Liu, X. Generalized Synthetic Aperture Radar Automatic Target Recognition by Convolutional Neural Network with Joint Use of Two-Dimensional Principal Component Analysis and Support Vector Machine. J. Appl. Remote Sens. 2017, 11, 046007. [Google Scholar] [CrossRef]
- Izadi, S.; Ahmadi, M.; Rajabzadeh, A. Network Traffic Classification Using Deep Learning Networks and Bayesian Data Fusion. J. Netw. Syst. Manag. 2022, 30, 25. [Google Scholar] [CrossRef]
- Lefèvre, E.; Elouedi, Z. How to Preserve the Conflict as an Alarm in the Combination of Belief Functions? Decis. Support Syst. 2013, 56, 326–333. [Google Scholar] [CrossRef]
- Sun, G.; Wang, J.; Qin, S.; Na, J. Radar Target Recognition Based on the Multi-Resolution Analysis Theory and Neural Network. Pattern Recognit. Lett. 2008, 29, 2109–2115. [Google Scholar] [CrossRef]
- Abbas, S.; Aftab, S.; Adnan Khan, M.; Ghazal, T.M.; Al Hamadi, H.; Yeun, C.Y. Data and Ensemble Machine Learning Fusion Based Intelligent Software Defect Prediction System. Comput. Mater. Contin. 2023, 75, 6083–6100. [Google Scholar] [CrossRef]
- Ye, F.; Chen, J.; Li, Y.; Kang, J. Decision-Making Algorithm for Multisensor Fusion Based on Grey Relation and DS Evidence Theory. J. Sens. 2016, 2016, 3954573. [Google Scholar] [CrossRef]
- Xu, B.; Sun, Y. Cutting-State Identification of Machine Tools Based on Improved Dempster-Shafer Evidence Theory. Int. J. Adv. Manuf. Technol. 2023, 124, 4099–4106. [Google Scholar] [CrossRef]
- Khan, M.N.; Anwar, S. Paradox Elimination in Dempster–Shafer Combination Rule with Novel Entropy Function: Application in Decision-Level Multi-Sensor Fusion. Sensors 2019, 19, 4810. [Google Scholar] [CrossRef] [PubMed]
- Lu, J.; Huang, J.; Lu, F. Distributed Kernel Extreme Learning Machines for Aircraft Engine Failure Diagnostics. Appl. Sci. 2019, 9, 1707. [Google Scholar] [CrossRef]
- Yager, R.R. On the Dempster-Shafer Framework and New Combination Rules. Inf. Sci. 1987, 41, 93–137. [Google Scholar] [CrossRef]
- Sun, Q.; Ye, X.; Gu, W. A New Combination Rules of Evidence Theory. Acta Electron. Sin. 2000, 28, 117–119. [Google Scholar]
- Wang, S.; Li, L.; Cheng, S.; Yang, J.; Jin, H.; Gao, S.; Wen, T. Study on an Improved Real-Time Monitoring and Fusion Prewarning Method for Water Inrush in Tunnels. Tunn. Undergr. Space Technol. 2021, 112, 103884. [Google Scholar] [CrossRef]
- Li, L.; Ma, D.; Wang, C.; Gu, X. New method for conflict evidence processing in D-S theory. Appl. Res. Comput. 2011, 28, 4528–4531. [Google Scholar]
- Wang, L.; Bai, J.; Zhang, Y. A New Approach to DS Evidence Theory Conflicts. Sci. Technol. Eng. 2013, 13, 8497–8501. [Google Scholar]
- Tong, X.-Y.; Xia, G.-S.; Lu, Q.; Shen, H.; Li, S.; You, S.; Zhang, L. Land-Cover Classification with High-Resolution Remote Sensing Images Using Transferable Deep Models. Remote Sens. Environ. 2020, 237, 111322. [Google Scholar] [CrossRef]
- Fan, J.; Qi, Y.; Liu, L.; Gao, X.; Li, Y. Application of an Information Fusion Scheme for Rolling Element Bearing Fault Diagnosis. Meas. Sci. Technol. 2021, 32, 075013. [Google Scholar] [CrossRef]
- Ye, Q.; Wu, X.; Guo, Z. Combination method for Dempster-Shafer theory of evidence based on interval numbers. J. Nav. Univ. Eng. 2009, 21, 1–5. [Google Scholar]
- Chen, J.; Li, Y.; Zhao, M.; Huang, K.; Wu, K. The Application of Different Distance Functions in DS Evidence Theory. In Proceedings of the 2022 IEEE 5th International Conference on Electronics Technology (ICET), Chengdu, China, 13–16 May 2022; pp. 544–547. [Google Scholar]
- Gao, X.; Jiang, P.; Xie, W.; Chen, Y.; Zhou, S.; Chen, B. Decision Fusion Method for Fault Diagnosis Based on Closeness and Dempster-Shafer Theory. J. Intell. Fuzzy Syst. 2021, 40, 12185–12194. [Google Scholar] [CrossRef]
- Lin, Y.; Wang, C.; Ma, C.; Dou, Z.; Ma, X. A New Combination Method for Multisensor Conflict Information. J. Supercomput. 2016, 72, 2874–2890. [Google Scholar] [CrossRef]
- Wei, J.; Zhang, F.; Lu, J.; Yang, X.; Yan, Y. Fault Diagnosis Method for Machinery Based on Multi-Source Conflict Information Fusion. Meas. Sci. Technol. 2022, 33, 115007. [Google Scholar] [CrossRef]
- Lu, S.; Li, P.; Li, M. An Improved Multi-Modal Data Decision Fusion Method Based on DS Evidence Theory. In Proceedings of the 2020 IEEE 4th Information Technology, Networking, Electronic and Automation Control Conference (ITNEC), Chongqing, China, 12–14 June 2020; pp. 1684–1690. [Google Scholar]
- Zhang, F.; Zhang, L.; Liu, Z.; Meng, F.; Wang, X.; Wen, J.; Gao, L. An Improved Dempster–Shafer Evidence Theory Based on the Chebyshev Distance and Its Application in Rock Burst Prewarnings. ASCE-ASME J. Risk Uncertain. Eng. Syst. Part A Civ. Eng. 2024, 10, 04023055. [Google Scholar] [CrossRef]
- Fei, X.; Zhou, J. A D-S Evidence Weight Computing Method for Conflict Evidence. Comput. Eng. 2016, 42, 142–145. [Google Scholar]
- Inglis, J. A Mathematical Theory of Evidence. Technometrics 1978, 20, 106. [Google Scholar] [CrossRef]
- Peng, Y.; Lin, J.-R.; Zhang, J.-P.; Hu, Z.-Z. A Hybrid Data Mining Approach on BIM-Based Building Operation and Maintenance. Build. Environ. 2017, 126, 483–495. [Google Scholar] [CrossRef]
- Pławiak, P. Novel Genetic Ensembles of Classifiers Applied to Myocardium Dysfunction Recognition Based on ECG Signals. Swarm Evol. Comput. 2018, 39, 192–208. [Google Scholar] [CrossRef]
- Sagi, O.; Rokach, L. Ensemble Learning: A Survey. WIREs Data Min. Knowl. Discov. 2018, 8, e1249. [Google Scholar] [CrossRef]
- Shannon, C.E. A Mathematical Theory of Communication. Bell Syst. Tech. J. 1948, 27, 379–423. [Google Scholar] [CrossRef]
- Burgund, D.; Nikolovski, S.; Galić, D.; Maravić, N. Pearson Correlation in Determination of Quality of Current Transformers. Sensors 2023, 23, 2704. [Google Scholar] [CrossRef] [PubMed]
- Xu, J.; Tian, W.; Shi, J.; Chen, Y.; Wang, X. A High-Conflict Evidence Fusion Method Based on Game Theory. Electron. Opt. Control 2022, 29, 7–11. [Google Scholar]
- Yin, S.; Ruan, X.; Manzanares, A.; Qin, X.; Li, K. MINT: A Reliability Modeling Frameworkfor Energy-Efficient Parallel Disk Systems. IEEE Trans. Dependable Secur. Comput. 2014, 11, 345–360. [Google Scholar] [CrossRef]
- Kim, D.; Kim, J.-S.; Kim, J.-H.; Im, N.-K. Development of Ship Collision Avoidance System and Sea Trial Test for Autonomous Ship. Ocean Eng. 2022, 266, 113120. [Google Scholar] [CrossRef]
- Janssen, P.A.E.M.; Bidlot, J.-R. Wind–Wave Interaction for Strong Winds. J. Phys. Oceanogr. 2023, 53, 779–804. [Google Scholar] [CrossRef]
- Ma, L.; Yang, J.; Jian, J. On Academic Meaning of Severe Weather and Severe Sea Condition. Navig. China 2021, 44, 14–20. [Google Scholar]
- Liu, Y. The Flight Target Recognition Model Based on Credibility; Harbin Engineering University: Harbin, China, 2018. [Google Scholar]
- Shanthikumar, J.G.; Sumita, U. (Eds.) Applied Probability and Stochastic Processes; International Series in Operations Research & Management Science; Springer: Boston, MA, USA, 1999; Volume 19, ISBN 978-1-4613-7364-3. [Google Scholar]
- Tang, Y.; Zou, W.; Hu, Z. Statistical data-based analysis of China’s marine fishery resource utilisation status and management. Resour. Sci. 2009, 31, 1061–1068. [Google Scholar]
- Zhang, H.; Lu, J.; Tang, X. An improved DS evidence theory algorithm for conflict evidence. J. Beijing Univ. Aeronaut. Astronaut. 2020, 46, 616–623. [Google Scholar]
Disclaimer/Publisher’s Note: The statements, opinions and data contained in all publications are solely those of the individual author(s) and contributor(s) and not of MDPI and/or the editor(s). MDPI and/or the editor(s) disclaim responsibility for any injury to people or property resulting from any ideas, methods, instructions or products referred to in the content. |
© 2024 by the authors. Licensee MDPI, Basel, Switzerland. This article is an open access article distributed under the terms and conditions of the Creative Commons Attribution (CC BY) license (https://creativecommons.org/licenses/by/4.0/).