Article

Dynamic Analysis and Optimization of the Coupling System of Vibrating Flip-Flow Screen and Material Group

1
School of Mechanical and Power Engineering, Henan Polytechnic University, Jiaozuo 454003, China
2
School of Chemical and Environmental Engineering, China University of Mining and Technology (Beijing), Beijing 100083, China
*
Author to whom correspondence should be addressed.
Symmetry 2024, 16(7), 913; https://doi.org/10.3390/sym16070913
Submission received: 3 June 2024 / Revised: 4 July 2024 / Accepted: 11 July 2024 / Published: 17 July 2024
(This article belongs to the Section Engineering and Materials)

Abstract

:
Vibrating flip-flow screens (VFFSs) provide an effective solution for deeply screening moist and fine-grained minerals, and an accurate dynamic model of VFFSs is critical for its dynamic analysis and optimization, thereby improving the vibration stability and symmetry of VFFSs. In this paper, uniaxial tension, uniaxial compression, plane tension, and shear stress relaxation experiments were conducted on screen panel samples to illustrate that the third-order Ogden model and the generalized Maxwell model can accurately describe the hyperelasticity and viscoelasticity of screen panels. Then, the coupling method of finite element and discrete element was adopted to establish the simulation model of the screen panel and material group coupling system, and the dynamics of the coupling system under different loading conditions were explored. Finally, the dynamic model of the coupling system of VFFSs mass, screen panel, and material group was proposed, and the non-dominated sorting genetic algorithm II was applied to optimize the system’s dynamic response. The results reveal that the use of optimized shear springs can reduce the relative amplitude change rate of the main and floating screen frame by 44.30% while maintaining the periodic motion of the VFFSs under operation conditions, greatly enhancing the stability of the VFFSs system.

1. Introduction

Deep screening of moist fine minerals is an urgent problem to be solved in the mineral separation industry [1,2]. However, conventional vibrating screens, used for classifying viscous fine minerals, often encounters the phenomenon of the screen panel sticking and rapid blockage of screen’s apertures, which seriously affects the screening performance [3,4]. Vibrating flip-flow screens (VFFSs) employ a periodically slackening and stretching elastic screen panel during operation located in the floating screen frame connected to the main screen frame. Large panel accelerations, essential for high screening efficiency and crucial for processing fine and moist materials, are generated [5,6]. To achieve stable and efficient screening performance, a better understanding and optimization of VFFS’s dynamics is necessary.
Xiong et al. [7] assumed that a VFFS is a linear system and analyzed the impact of the rotation speed of exciters, the incline angle and the slack length under non-loading material conditions, and the vibration mechanism and the reasonable operation region of the VFFS were revealed. Gong et al. proposed a nonlinear dynamic model of VFFS using a new shear spring model that can accurately describe the amplitude and frequency-dependent behavior of shear springs, and experimental tests were conducted to verify the reasonability of the proposed dynamic model of VFFS [8]. Lin et al. took the influence of screen panel tension on VFFS system dynamics into account and established a dynamic model of VFFS considering the screen panel’s dynamics, which were described by the Kevin–Voigt model, and investigated the influence of related parameters on the system’s dynamics [9]. These studies can accurately describe the dynamic response of VFFSs under non-loading material conditions and reveal the operating mechanism of VFFSs. However, the influence of random changes in material groups on the screen panel during the screening process on the dynamic response of VFFSs was not considered in the above studies.
The dynamic interaction between the screen panel and material group produces important effects on the dynamic response of the VFFS [10,11]. As the screen panel generates complex forces after being impacted by the material group, it is difficult to collect test data. Therefore, simulation analysis methods are usually used in this research area. Zhang et al. assumed that the screen panel was composed of multiple rigid bodies and used a piecewise linear-interpolation method to approximate the flexibility of the screen panel [12,13]. Then, the discrete element method and multiple bodies dynamics (DEM-MBD) coupling method were used to achieve bidirectional coupling between the material group and screen panel, and the effects of the eccentric block mass, screen panel inclination, feed particle size, and motor speed on screening performance were analyzed. Wang et al. [14] adopted the DEM-MBD coupling method to simulate the screening process of a four-degree-of-freedom flip-flow screen, investigated the motion law of the material group on the screen panel, and analyzed the influence of different factors on the screening efficiency. Although this simulation method can intuitively describe the interaction between the screen panel and the material group, it cannot accurately predict the flexible motion of an operating screen panel. Therefore, Xu et al. combined the finite element method and discrete element method (FEM-DEM), used the FEM to simulate the movement of the screen panel, and established the simulation model of the coupling system of the material group and screen panel using the FEM-DEM coupling method [15]. Zhao et al. analyzed the screening effect of VFFSs under different conditions of single-layer and double-layer screen panels using FEM-DEM coupling [16]. Compared with the DEM-MBD coupling method, the FEM-DEM coupling method could more accurately analyze the dynamic interaction between the screen panel and material group. However, the constitutive model and parameters of the screen panel material are based on empirical equations in the above research, and a constitutive model that can accurately describe the hyperelasticity and viscoelasticity of the screen panel was not proposed alongside experimental tests, with the result that the dynamic characteristics of the screen panel cannot be accurately described.
Screen panels are made of a polyurethane rubber material, which exhibits obvious hyperelasticity and viscoelasticity, and extensive research on the dynamic characteristics of rubber materials has been conducted by many researchers. The Ogden model, with its adjustable number of summation terms, offers great flexibility and is widely used in describing the hyperelasticity of rubber materials. The generalized Maxwell model, which consists of multiple Maxwell models in parallel with a spring, can effectively predict the viscoelastic properties of rubber materials. Hamza et al. compared the tensile test data of one rubber material with the Mooney–Rivlin model and Ogden mode and analyzed the performance of the two models in describing the hyperelastic properties of rubber materials under different deformation conditions [17]. Dal evaluated the hyperelastic constitutive models of forty-four kinds of elastomers through a number of tensile tests and discussed the fitting effects of these different experimental data [18]. Yang proposed a visco-hyperelastic constitutive equation to describe the large deformation response of rubber material and verified its accuracy by comparing the experimental and simulation results [19]. Cao et al. used Hookean and generalized Maxwell models to describe the hyperelastic and viscoelastic characteristics of rubber materials and investigated the influence of rubber geometry on the dynamic characteristics of rubber bushings using FEM [20]. Therefore, the above research indicates that the constitutive model, accurately describing the hyperelasticity and viscoelasticity of rubber materials, can be identified using mechanical tests of rubber materials.
This paper applies the experimental test of mechanical properties of the screen panel to identify its hyperelastic and viscoelastic constitutive models and related parameters, which are suitable for finite element analysis of the screen panel. A simulation model of the coupling system between the screen panel and material group is established using the FEM-DEM coupling, the dynamic response of the coupling system between screen panel and material group under different loading material conditions are analyzed, and a dynamic model of the coupling system between screen panel and the material group is proposed. Then, the dynamic model of the coupling system of the VFFSs mass, screen panel, and material group is established; the influence of dynamic parameters on the system’s dynamic response is analyzed; and the vibration mechanism of the coupling system of the VFFSs is revealed. Finally, the non-dominated sorting genetic algorithm II (NSGA-II) is adopted to optimize the system’s dynamic response, and the optimal dynamic parameters that can improve the stability of the system are revealed.

2. Constitutive Model of Screen Panel

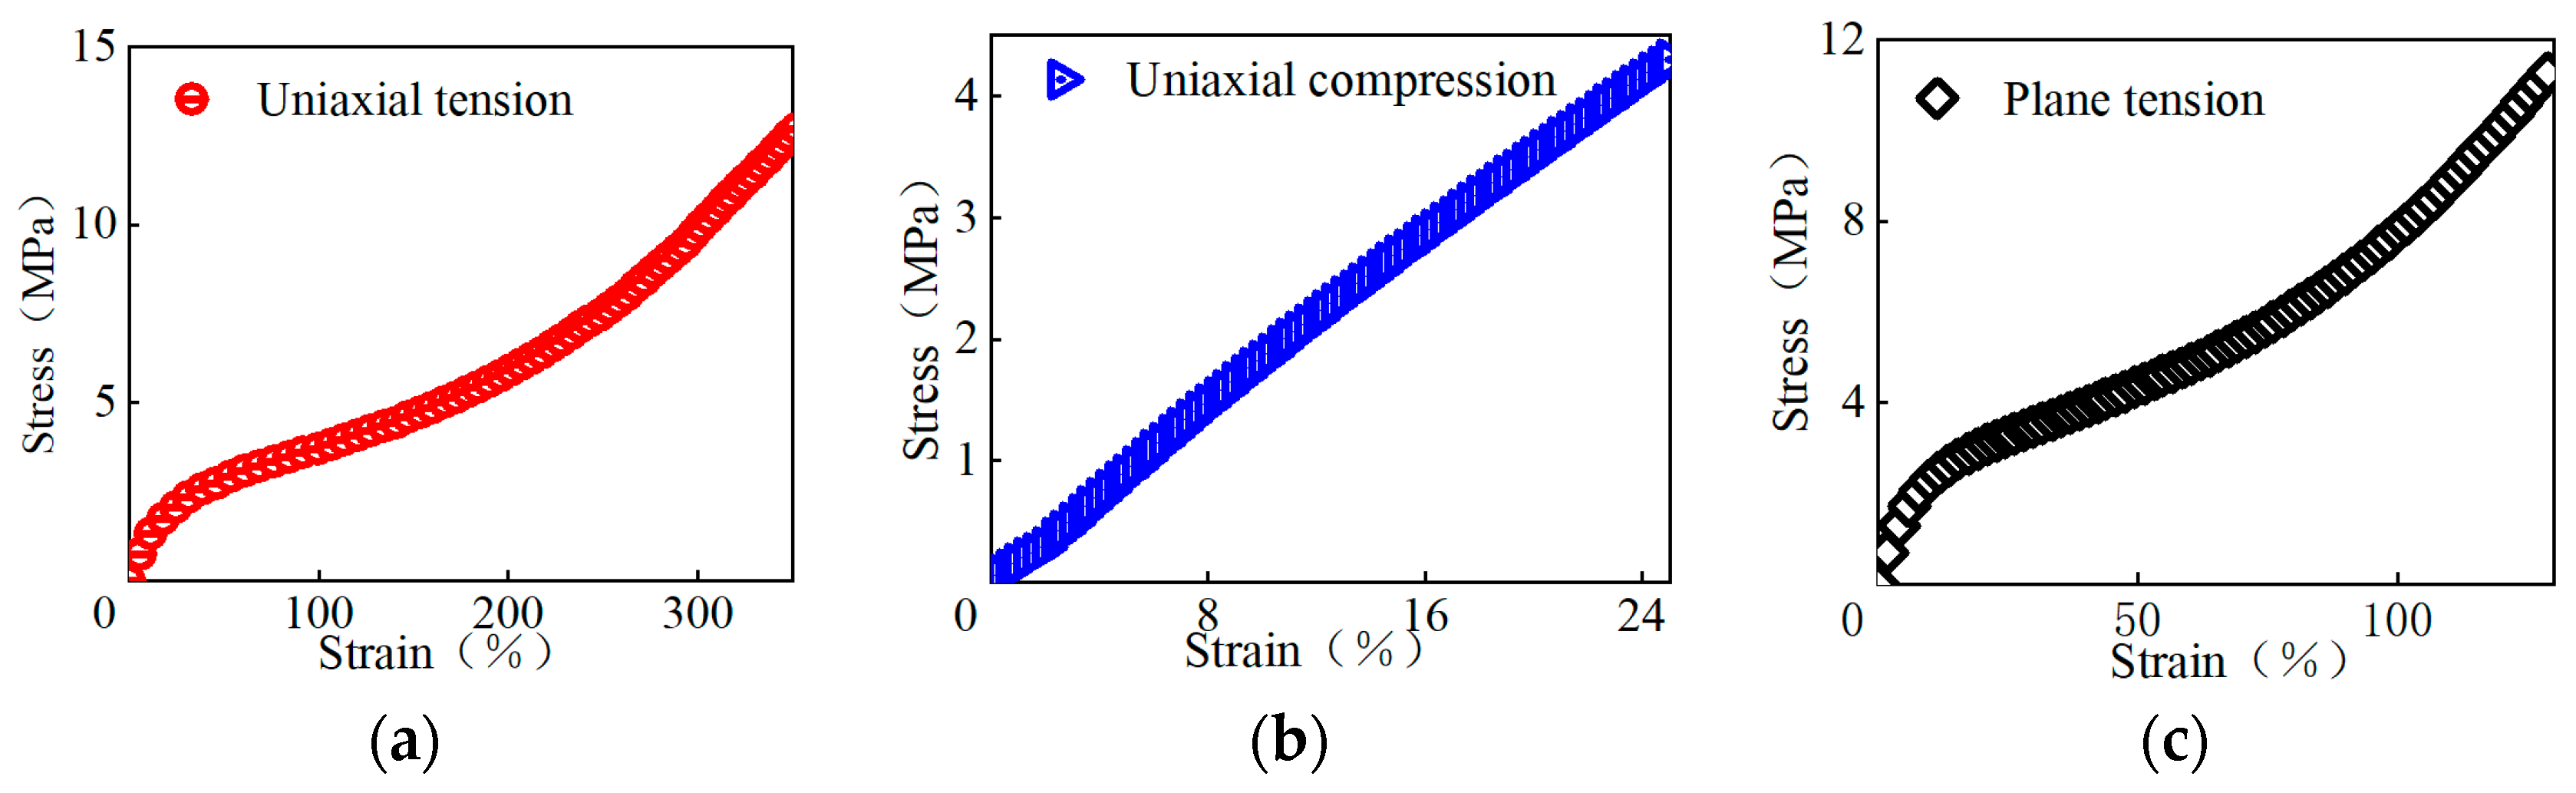
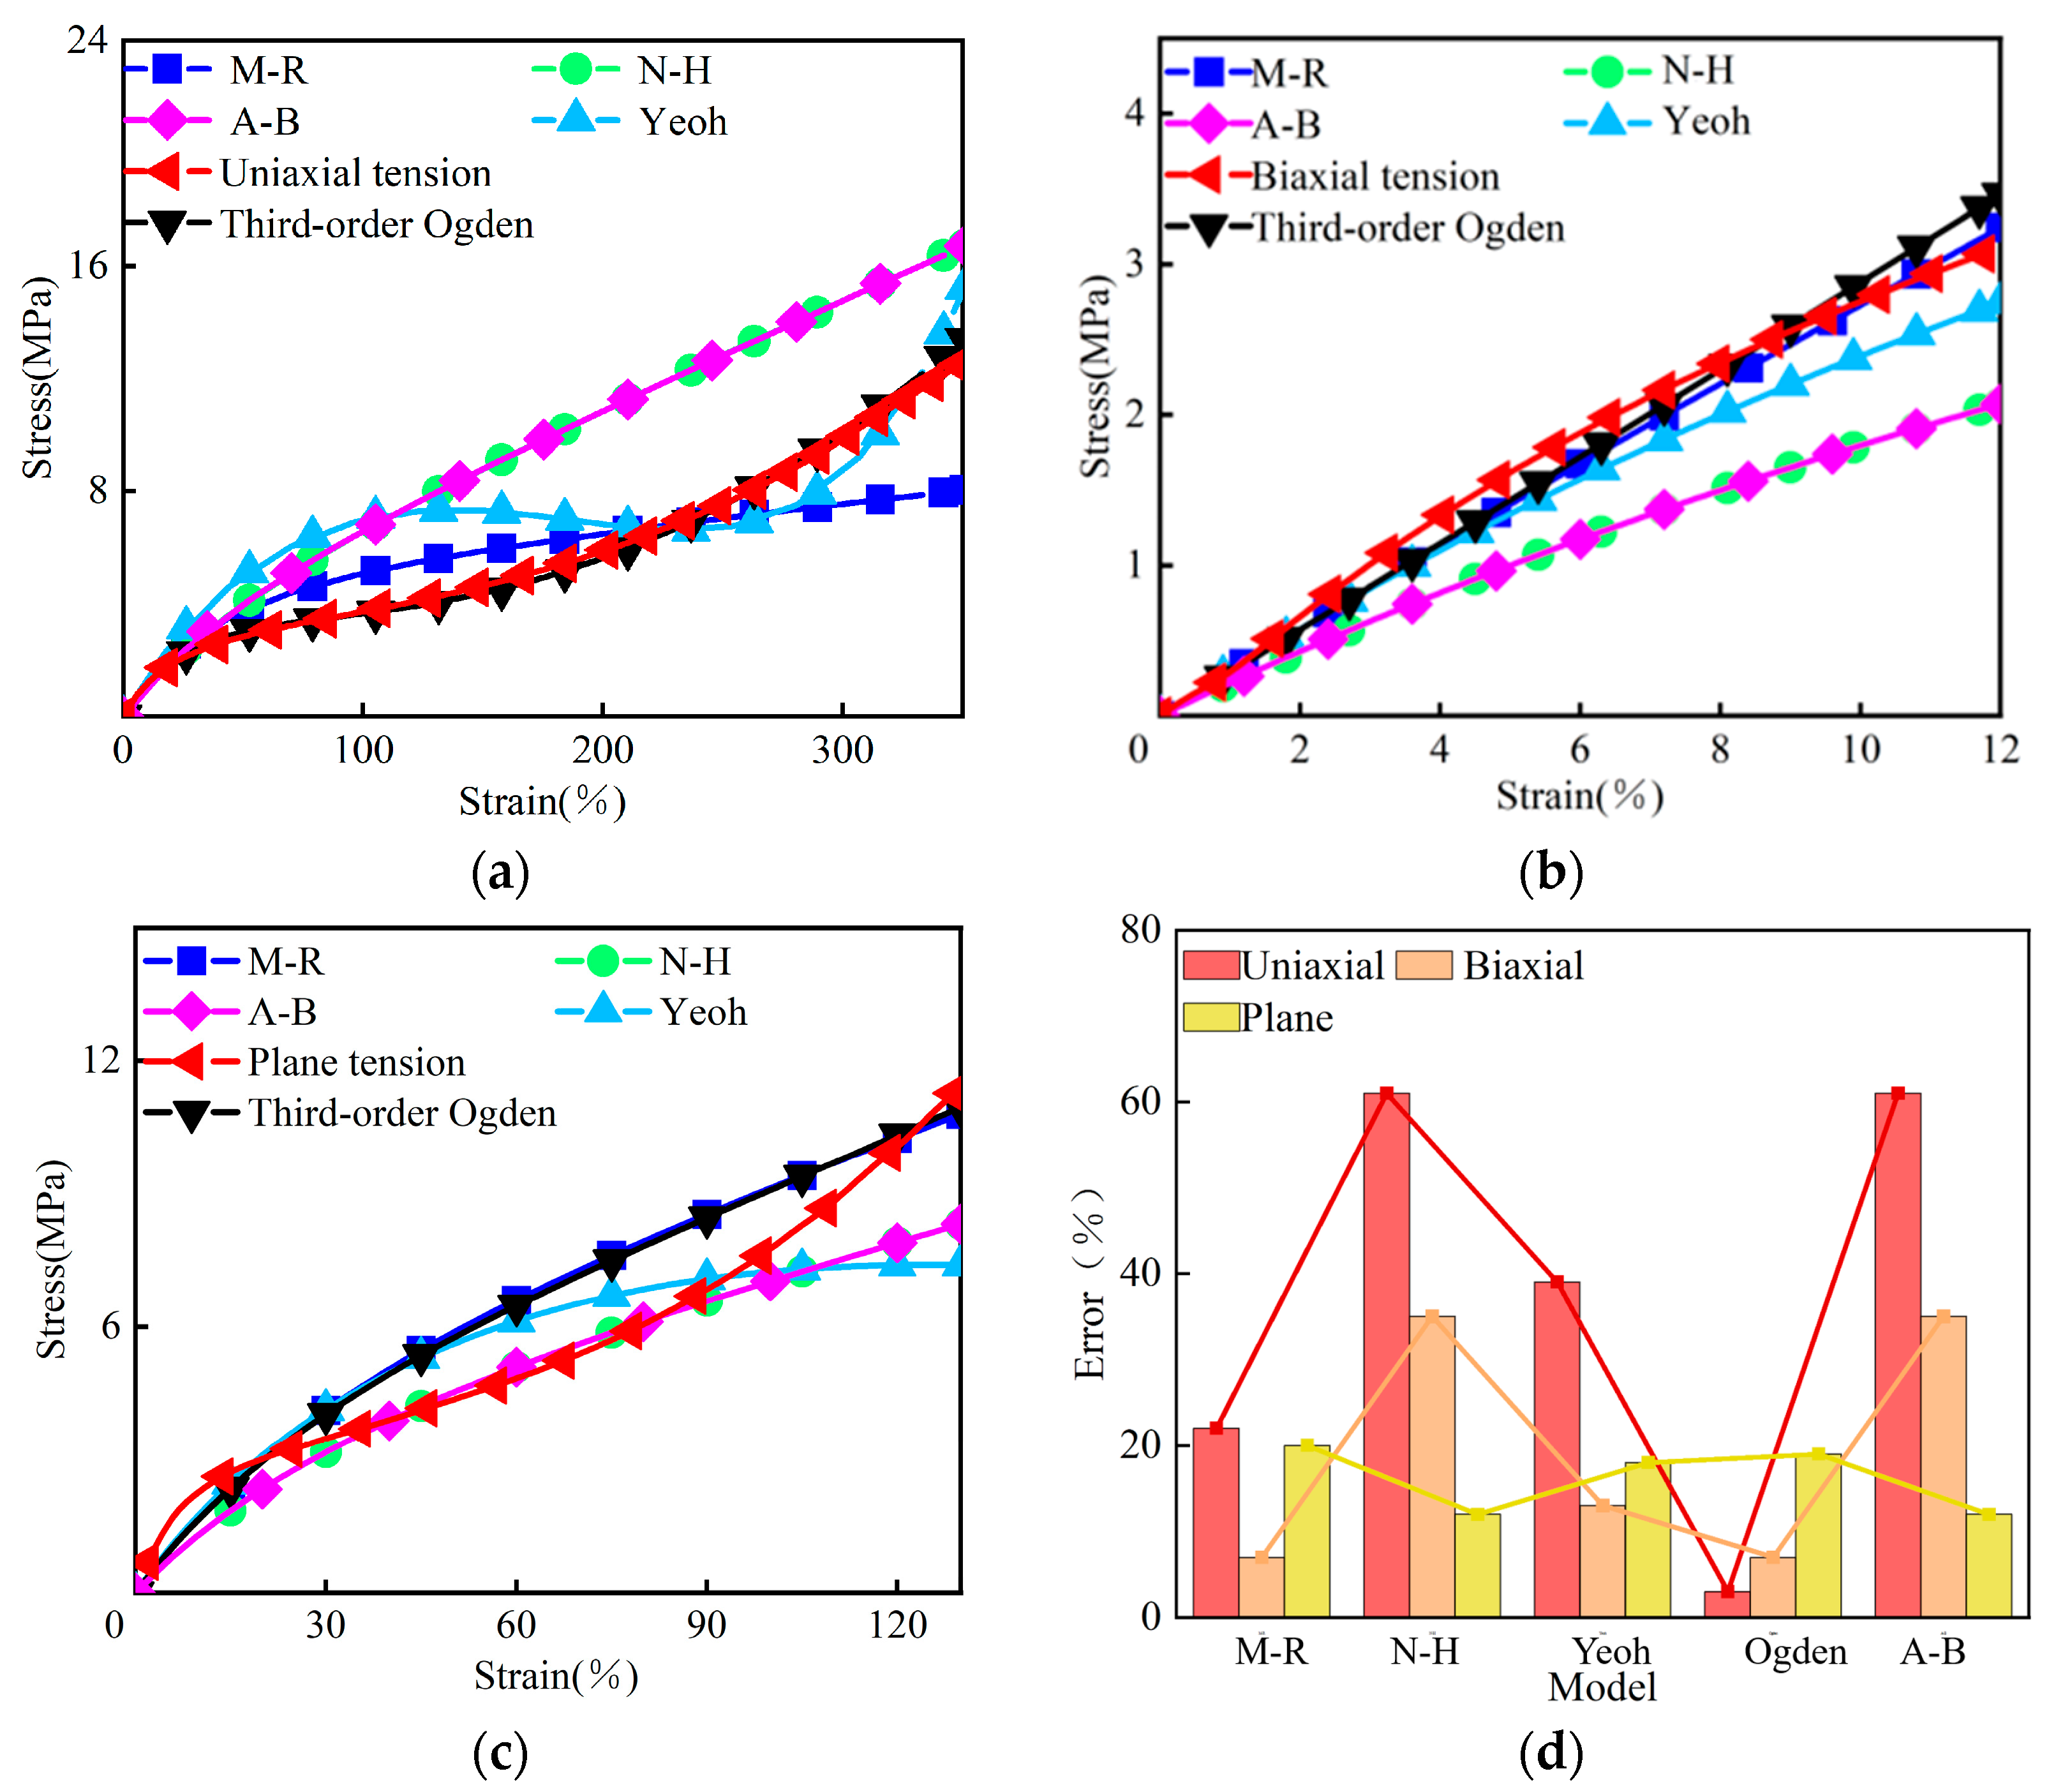
2.1. Hyperelastic Constitutive Model

The material of the screen panel is polyurethane rubber, which exhibits hyperelastic properties. The hyperelastic constitutive models of the rubber materials mainly include Mooney–Rivlin, Ogden and reduced polynomial constitutive models based on phenomenological theory, as well as Arruda–Boyce and Van der Waals constitutive models according to molecular thermodynamic statistics theory [21]. Based on the stress–strain relationship, the constitutive relationship of polyurethane rubber hyperelastic material can be expressed as a function of three invariants of deformation tensor using strain energy density function:
W = I 1 , I 2 , I 3
where I 1 = λ 1 2 + λ 2 2 + λ 3 2 , I 2 = λ 1 2 λ 2 2 + λ 2 2 λ 3 2 + λ 1 2 λ 3 2 , I 3 = λ 1 2 λ 2 2 λ 3 2 , with I i being the invariant of deformation tensor and λ i being principal stretch ratios.
The strain energy function of the Mooney–Rivlin model can be expressed as
W = C 10 I 1 3 + C 01 I 2 3
Here, C 10 and C 01 are the material constitutive model parameters. The Neo-Hooke model and the Yeoh model are reduced polynomial models, and their strain energy functions are N order degree functions of the first deformation tensor. The strain energy functions are as follows:
W = i = 1 N C i 0 I 1 3 i
Here, C i 0 is the material’s constitutive model parameters. When N = 1 and N = 3, it is the Neo-Hooke model and the Yeoh model, respectively. The Ogden model takes the three principal stretch ratios λ 1 , λ 2 , λ 3 as independent variables, and the expression for the strain energy function is
W = i = 1 N 2 μ i α i 2 λ 1 α i + λ 2 α i + λ 3 α i 3
where μ i and α i are material parameters. The strain energy function expression for the Arruda–Boyce model is
W = μ i i = 1 5 C I λ m 2 i 2 I 1 i 3 i
Here, μ i and λ m are material constants determined by experimental data; generally, N = 5 is choosen, at which point all have fixed values, and these parameters are obtained through thermodynamic statistical methods and have clear physical meanings.
In order to accurately indentify the hyperelastic constitutive model of screen panel, six pure strain state mechanical tests need to be conducted. As the screen panel materials are of incompressibility, uniaxial tension is equivalent to equal biaxial compression, uniaxial compression and equal biaxial tension are equivalent, and plane tension is amount to plane compression [18]. Therefore, the hyperelastic constitutive model of the screen panel material can be determined by uniaxial tensile, equal biaxial tensile, and plane tensile tests [21]. However, the experimental conditions of equal biaxial tension are complex, and its experimental results can be transformed by uniaxial compression test data. The stress–strain relationship is
σ E b = σ E c 1 + ε E c 3 ε E b = 1 + ε E c 1
where σEc and εEc are the principal stress and principal strain of uniaxial compression test, respectively; σEb and εEb denote the principal stress and principal strain of the equivalent biaxial tensile test, respectively.
Therefore, experimental tests of uniaxial tension, uniaxial compression, and plane tension were adopted for the screen panel sample to determine its optimal hyperelastic constitutive model. All experiments were conducted on the MTS-E43.104 electronic universal testing machine, with different fixtures used for each test. According to the testing standards ISO 527-2 standard [22], each test was conducted three times, with a testing environment temperature of 24 °C. The tests for uniaxial tension, uniaxial compression, and plane tension were conducted with speeds of 10 mm/min, 10 mm/min, and 5 mm/min, respectively, as shown in Figure 1.
In order to minimize the influence of experimental errors, each test was carried out several times to obtain the average value, and the stress and strain for each test (uniaxial tension, uniaxial compression, and plane tension) were recorded, as shown in Figure 2.
Different constitutive models show the various description performances of the mechanical properties of rubber materials. Many researchers investigated the effect of several hyperelastic models on describing the hyperelasticity of rubber materials using experimental results, and results show that the Mooney-Rivlin (M-R) model, Neo-Hooke (N-H) model, Yeoh model, third-order Ogden model, and Arruda-Boyce (A-B) model exhibit a good description of the rubber materials’ hyperelasticity [23]. Here, these models were adopted to approximate the hyperelastic test results of screen panel materials, and the least square method was used to evaluate the overall effect of the above five hyperelastic models on describing the hyperelasticity of the screen panel (Figure 3).
In regard to the uniaxial tensile test, the Mooney–Rivlin, Neo-Hooke, and Arruda–Boyce models show a good prediction only in the small strain stage, while the Yeoh model has a better approximating effect in the large stain stage, and the third-order Ogden model performs well in the overall strain of the sample. In detail, the fitting errors for the Mooney–Rivlin, Neo-Hooke, Yeoh, third-order Ogden, and Arruda–Boyce models are 22%, 61%, 39%, 3%, and 61%, respectively. For the biaxial tensile test, it can seen that the errors between the experiments and the Mooney–Rivlin, Neo-Hooke, Yeoh, third-order Ogden, and Arruda–Boyce models are 7%, 35%, 13%, 7%, and 35%, respectively. This means that the Mooney–Rivlin and third-order Ogden models can well match the experimental results in the entire strain stage. In addition, the simulation results of the Yeoh model are slightly smaller than the overall experimental data. With the strain increase, the deviation between the experimental data and simulation results produced by Neo-Hooke and Arruda–Boyce models increases gradually; regarding the plane tensile test, the errors between experiments and the Mooney–Rivlin, Neo-Hooke, Yeoh, third-order Ogden, and Arruda–Boyce models produced 20%, 12%, 18%, 19%, and 12%, respectively. It can be found that the Mooney–Rivlin and Yeoh models perform well in the small-strain stage. The Neo-Hooke and Arruda–Boyce models exhibit an excellent description in the small- and medium-strain stage. The third-order Ogden model has good prediction both in the small-strain and large-strain stages. In addition, when selecting a suitable hyperelastic constitutive model for the rubber materials, the effectiveness of the model in describing the results of uniaxial and equibiaxial tensile tests needs to be given priority consideration. Here, combined with the overall experimental error analysis (Figure 3d), the third-order Ogden model shows the best fit to the measured results of uniaxial tensile, biaxial tensile, and plane tensile tests, as well as its model parameters αi and μi (see Table 1).

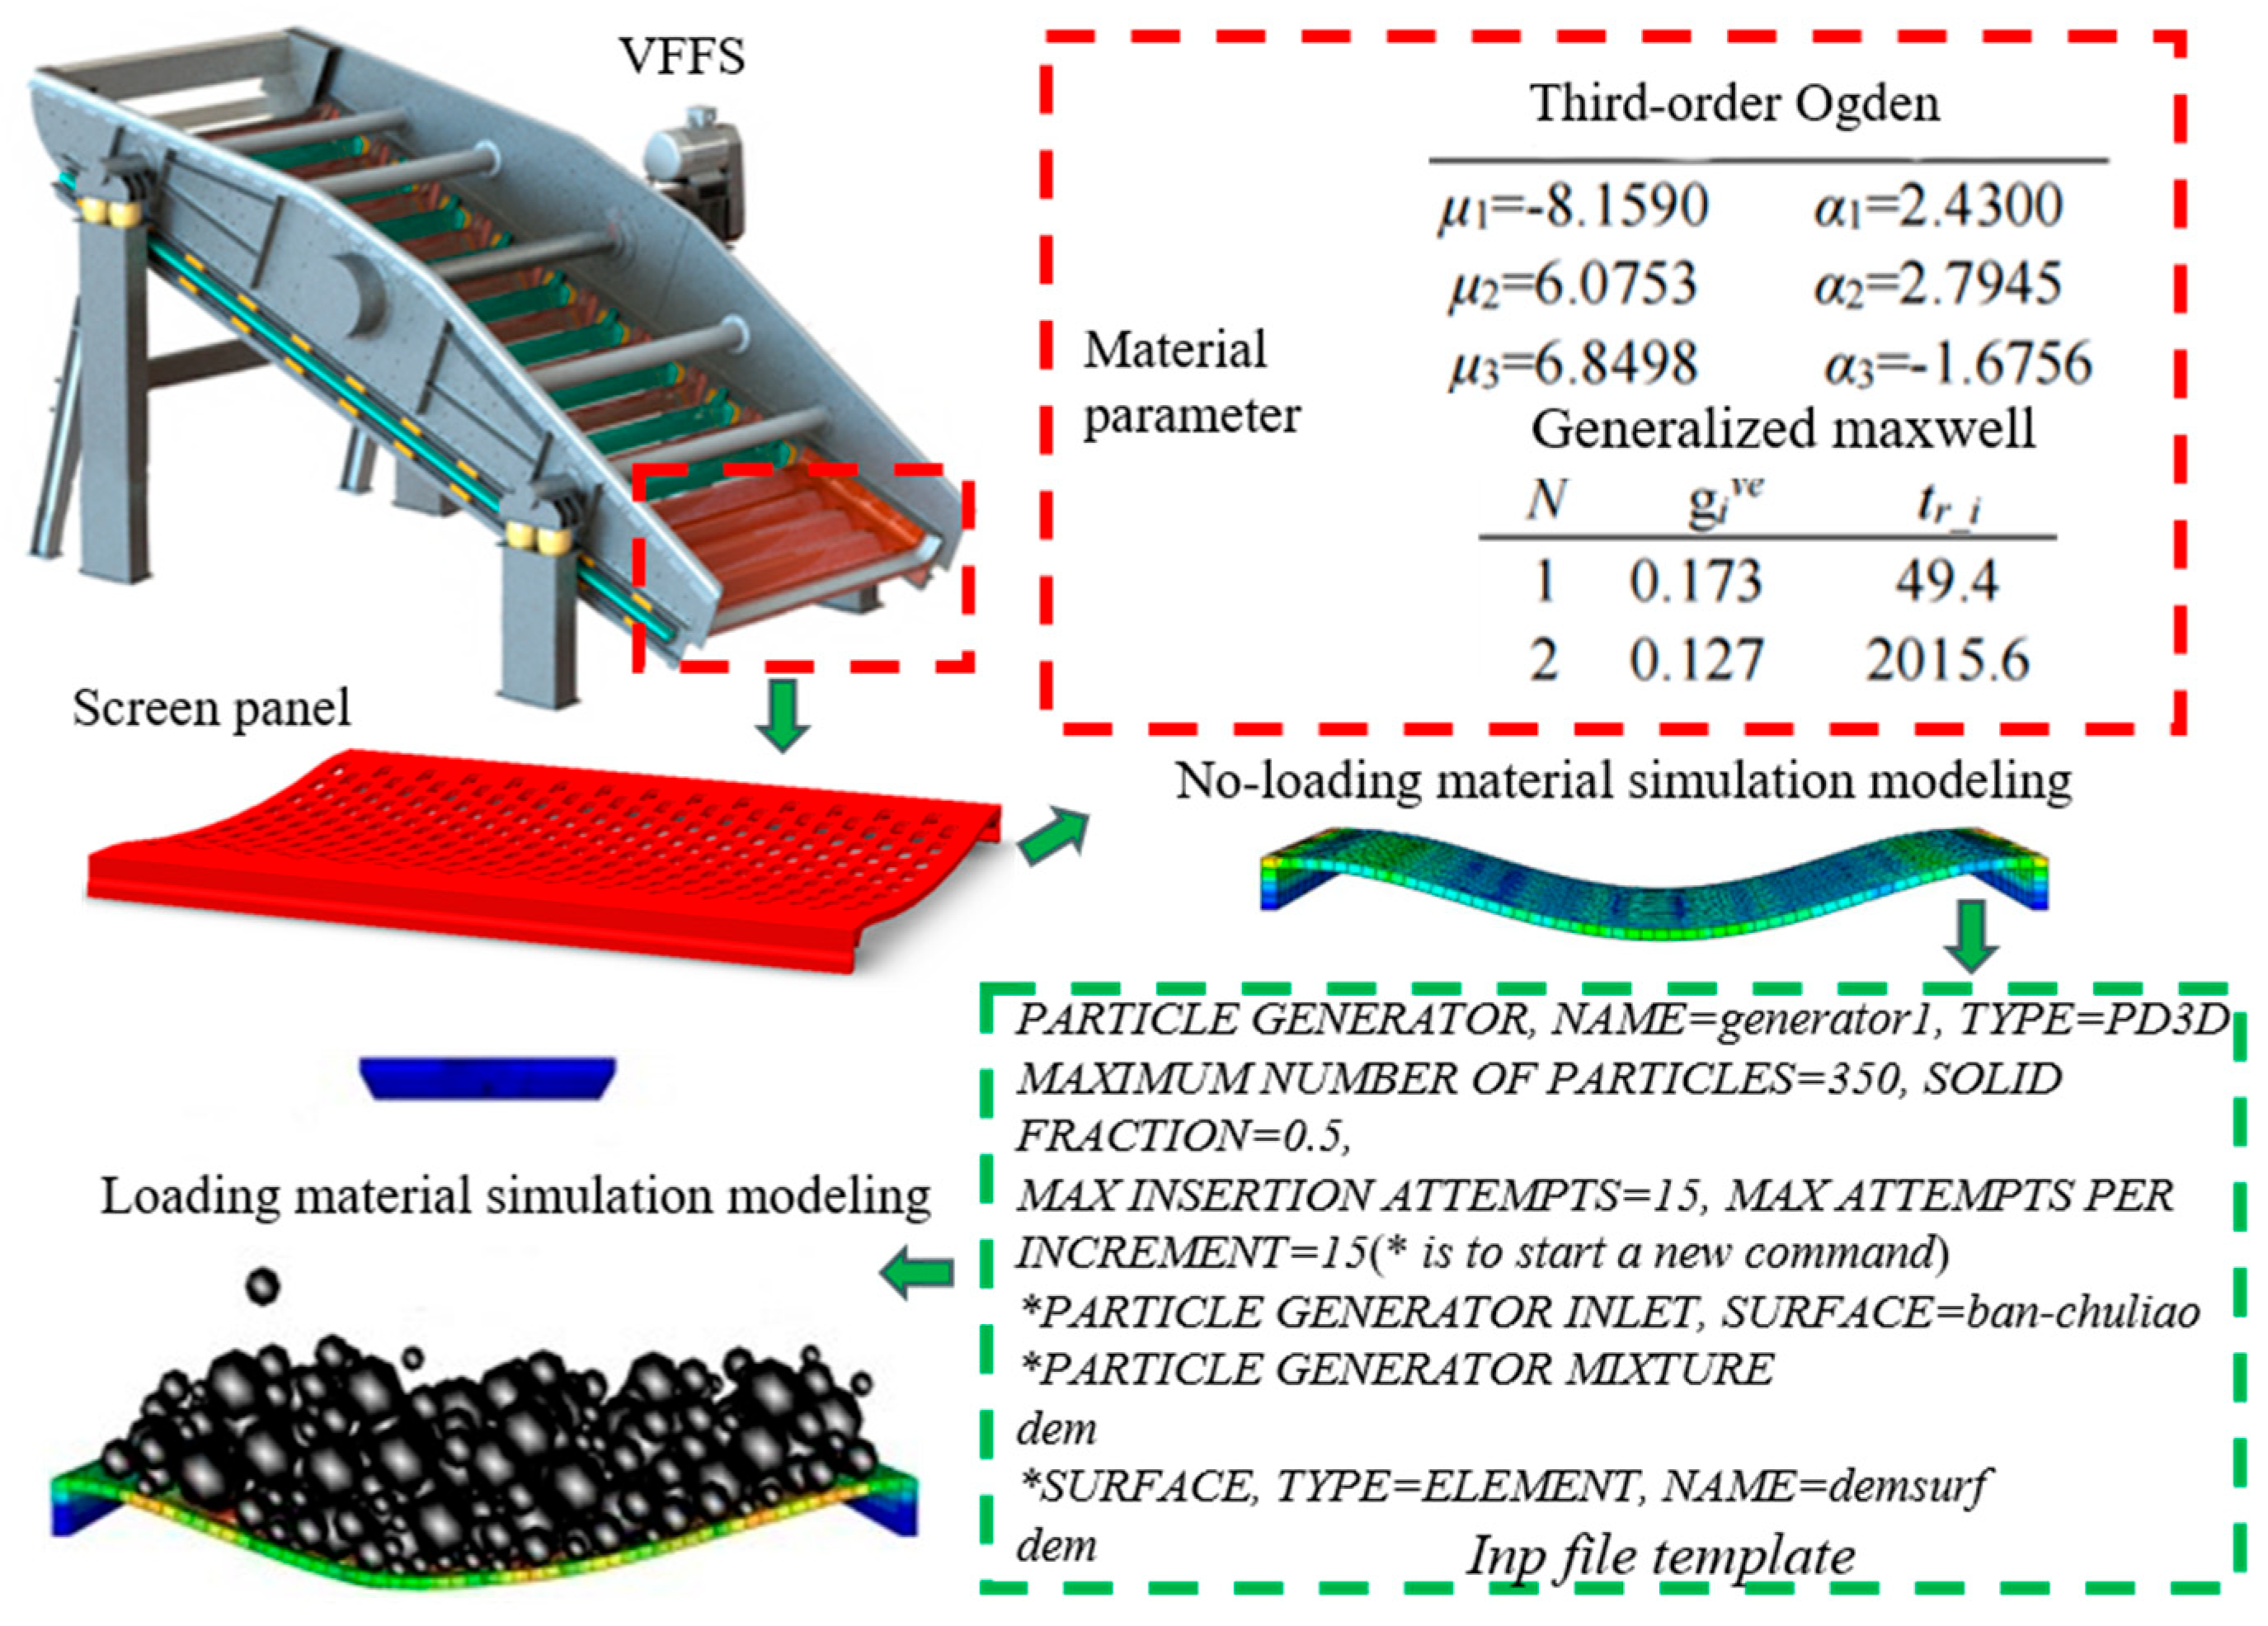
2.2. Viscoelastic Constitutive Model

The screen panel material not only shows hyperelasticity but also exhibits viscoelasticity. Classical integer constitutive models, such as the Maxwell model, Kelvin–Voigt model, and generalized Maxwell model, are commonly used to describe the viscoelastic properties of rubber materials. However, the Maxwell model is insufficient to grasp the creep process of viscoelastic materials, and the Kelvin–Voigt model cannot accurately capture the stress relaxation process of the viscoelastic materials [24]. The generalized Maxwell model, composed of multiple Maxwell models with multiple relaxation times, can accurately describe the stress relaxation, creep process, and mechanical behavior of the viscoelastic material. This model has been widely used in finite element analysis of the viscoelastic materials [25], and its constitutive model can be defined by the dimensionless stress relaxation modulus of the Prony series.
g R t = 1 i = 1 N g i v e ( 1 e t t r i )
Here, t r i and g i v e are the relaxation time and elastic modulus ratio coefficient of each Maxwell viscoelastic element, respectively; N denotes the order of the generalized Maxwell model. These parameters are obtained by the least square method using the shear relaxation test data of the viscoelastic materials [19].
Test specifications. The screen panel sample (size 20 mm × 20 mm × 5 mm) was tested on an electronic universal testing machine (MTS, Type E43.104, accuracy ±1%, Eden Prairie, MN, USA). In order to test the stress of the screen panel sample after shear deformation, a constant displacement input was applied to the actuator bearing system, which was connected with the screen panel sample through a fixture. Another fixture was installed on the load cell to measure the output force. The test results produced Figure 4b: at the beginning of the test, the sample was subjected to a rapidly increasing shear force in a short time. Then, the shear force gradually decreased with an increase in time, and finally reached a steady state.
Then, the variation of force F(t) with time t can be obtained by the shear stress relaxation test, and the corresponding shear modulus G(t) can be written as
G t = F t / 2 ( a × b ) / γ
where a and b are the length and width of the stress relaxation sample, respectively;
The normalized shear relaxation function g R t can be expressed as
g R t = G t G 0 = F t 2 a × b γ F 0 2 a × b γ = F t F 0
The g R t -t data of the shear stress relaxation test can be obtained from Equation (9), substituting it into Equation (7), and the constitutive parameters of the generalized Maxwell model can be obtained using the least square method (see Table 2). The comparison between the simulation results of the model and the experimental results produces Figure 5.
The results indicate that the second-order generalized Maxwell model can accurately match the experimental results. When the fitting order is greater than 2, the description effect will not improve significantly, but the complexity of the model increases, leading to increased computational difficulty. Therefore, the second-order generalized Maxwell model is selected to describe the viscoelasticity of the screen panel.

3. Dynamic Analysis of the Coupling System of VFFS and Material Group

3.1. Simulation Modeling of the Coupling System of the Screen Panel and Material Group

To investigate the dynamic characteristics of the coupled system consisting of the screen panel and the material group, Abaqus 2020 software was chosen to simulate the dynamics of the screen panel and material group coupling system, as Abaqus has a powerful capability to analyze the static and dynamic stress/displacement of complex engineering problems [16].
Considering the calculation time and the accuracy of simulation results, the size of the simulation model of the investigated screen panel was set as 150 mm × 328 mm × 4 mm, and the screen’s aperture size was 8 mm × 25 mm. The third-order Odgen model was used to describe the hyperelasticity of the screen panel material, and the generalized Maxwell model was used to describe the viscoelasticity of the screen panel material. We adopted hexahedral elements, with the element type being reduced integral to divide mess, so the simulation model of the screen panel without loading materials can be established. Then, the particle-generation technology in the display dynamics analysis was used to generate the material group on the screen panel via encoding, and the dynamic simulation model of the coupling system between the screen panel and the material group was established [26] (see Figure 6).

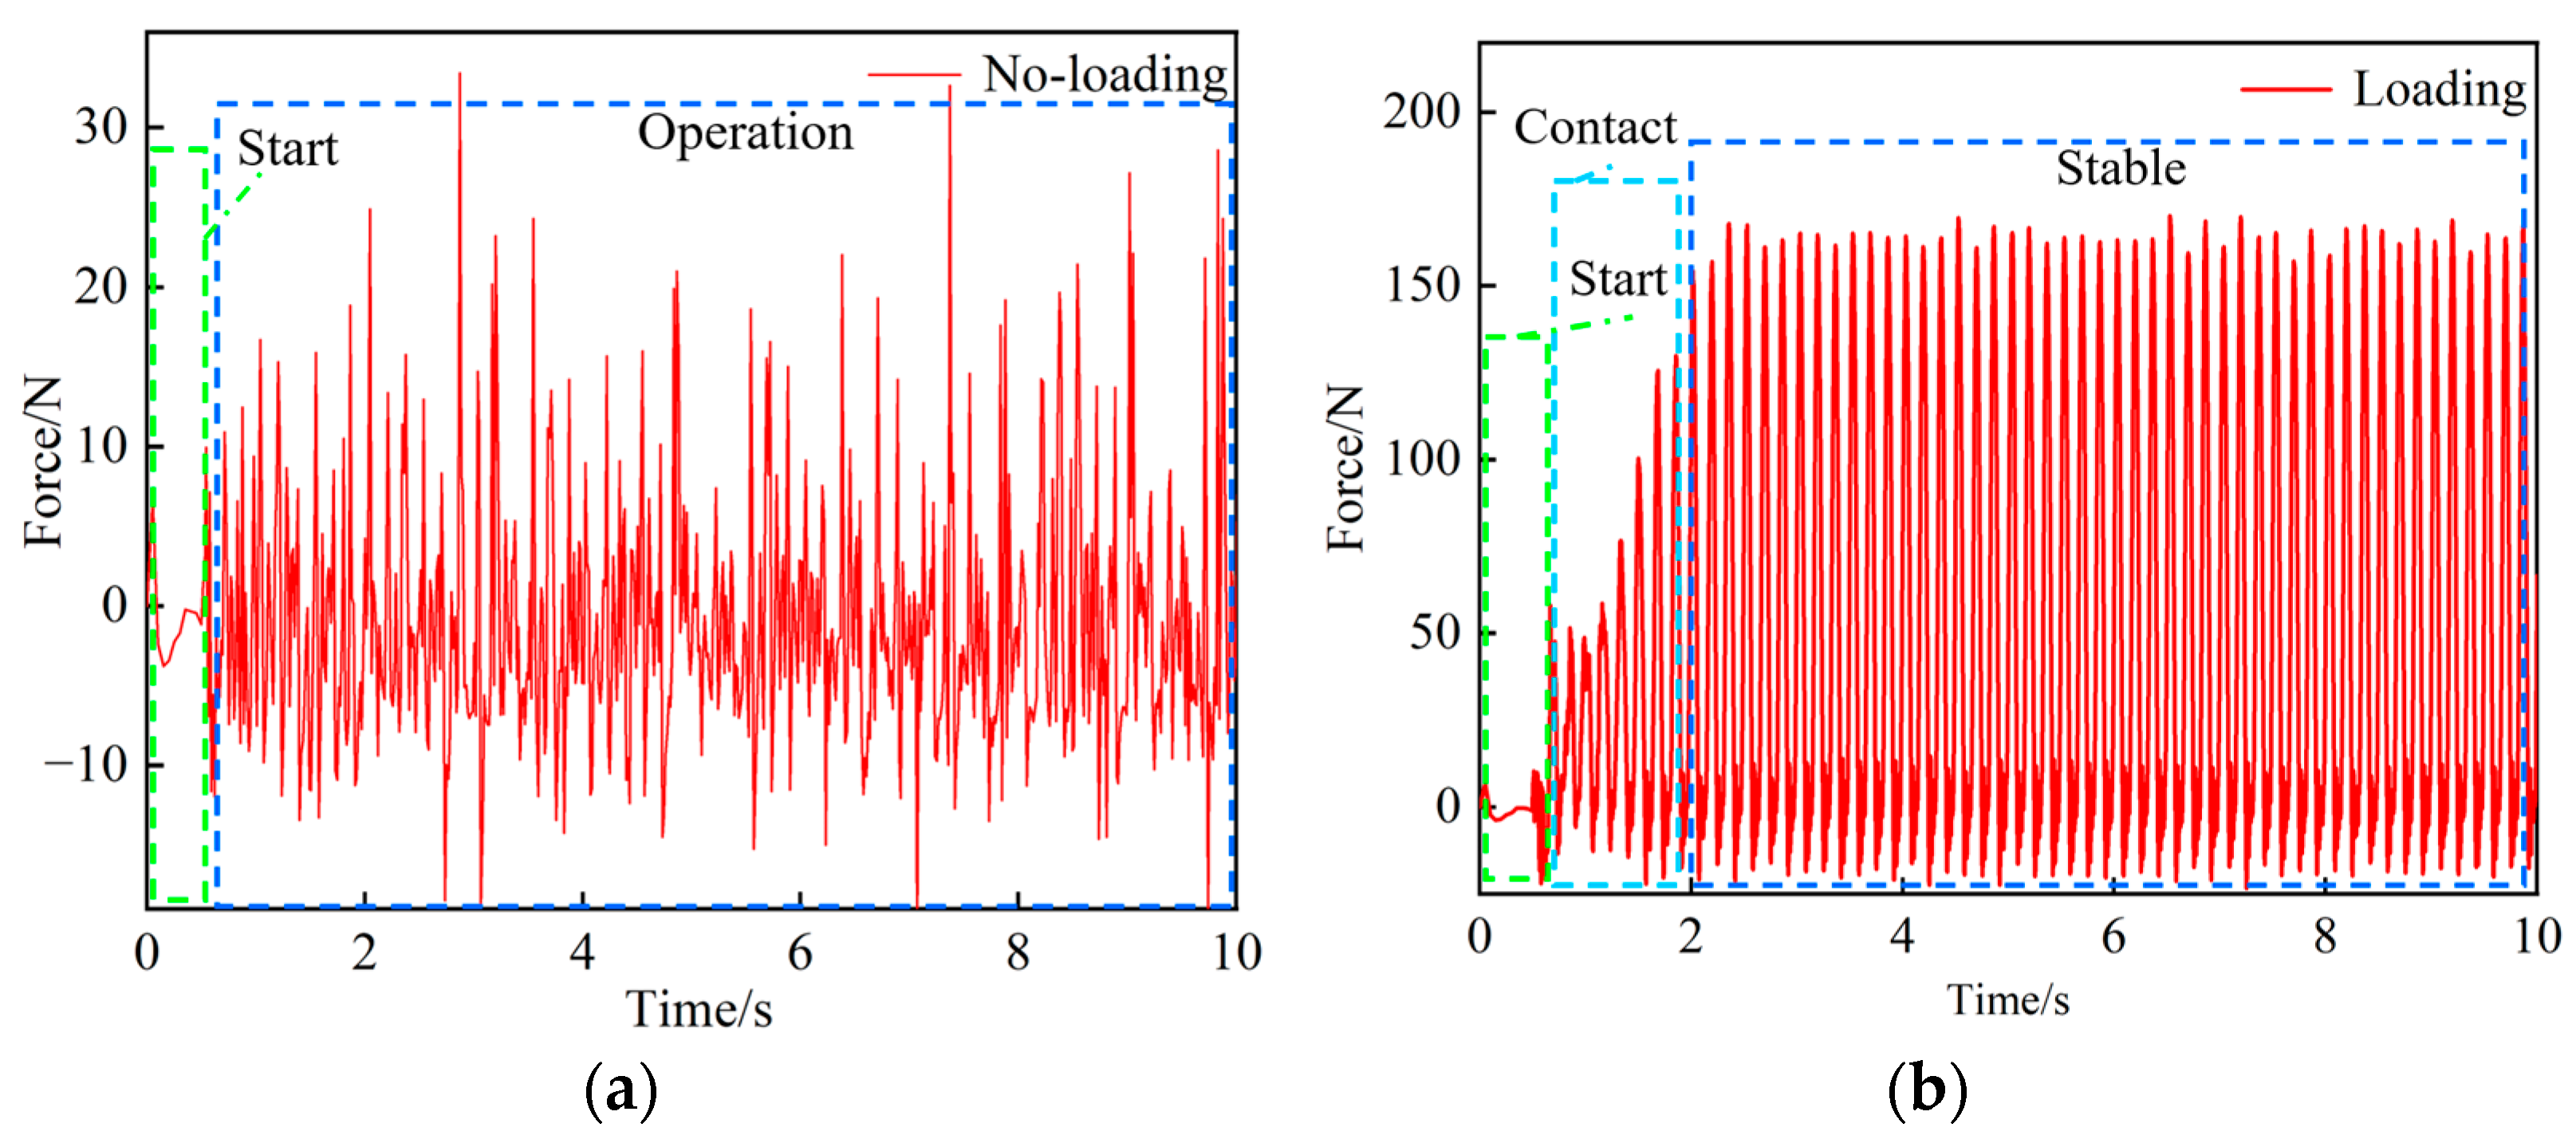
3.2. Dynamics of Screen Panel under Different Conditions

According to the establishment process of the simulation model of the screen panel without loading materials, a harmonic displacement excitation was applied to the screen panel, and the third-order Ogden model and generalized Maxwell model were used to describe the hyperelasticity and viscoelasticity of the screen panel, respectively. Related model parameters (see Table 1 and Table 2) and the relationship between the force and displacement of the screen panel can be obtained (Figure 7a). Then, we established the coupling system of the screen panel and material group, with particle parameters being set (density: 2860 kg·m−3; elastic modulus: 1200 MPa; Poisson’s ratio: 0.25; friction coefficient between particles, screen panel, and baffle: 0.45, 0.48, and 0.63 [26]; particle number: 800; particle radius: 4.5 mm, 7.5 mm, and 12.5 mm), and the relationship between the force and displacement of screen panel with loading materials produced Figure 7b.
It can be observed in Figure 7 that the force on both ends of the screen panel is small, and the fluctuation is obvious in the no-loading state. However, when loading materials on the screen panel, the force obviously increases and reaches a stable state. This means that the materials on the screen panel have a significant effect on the dynamics of the screen panel.

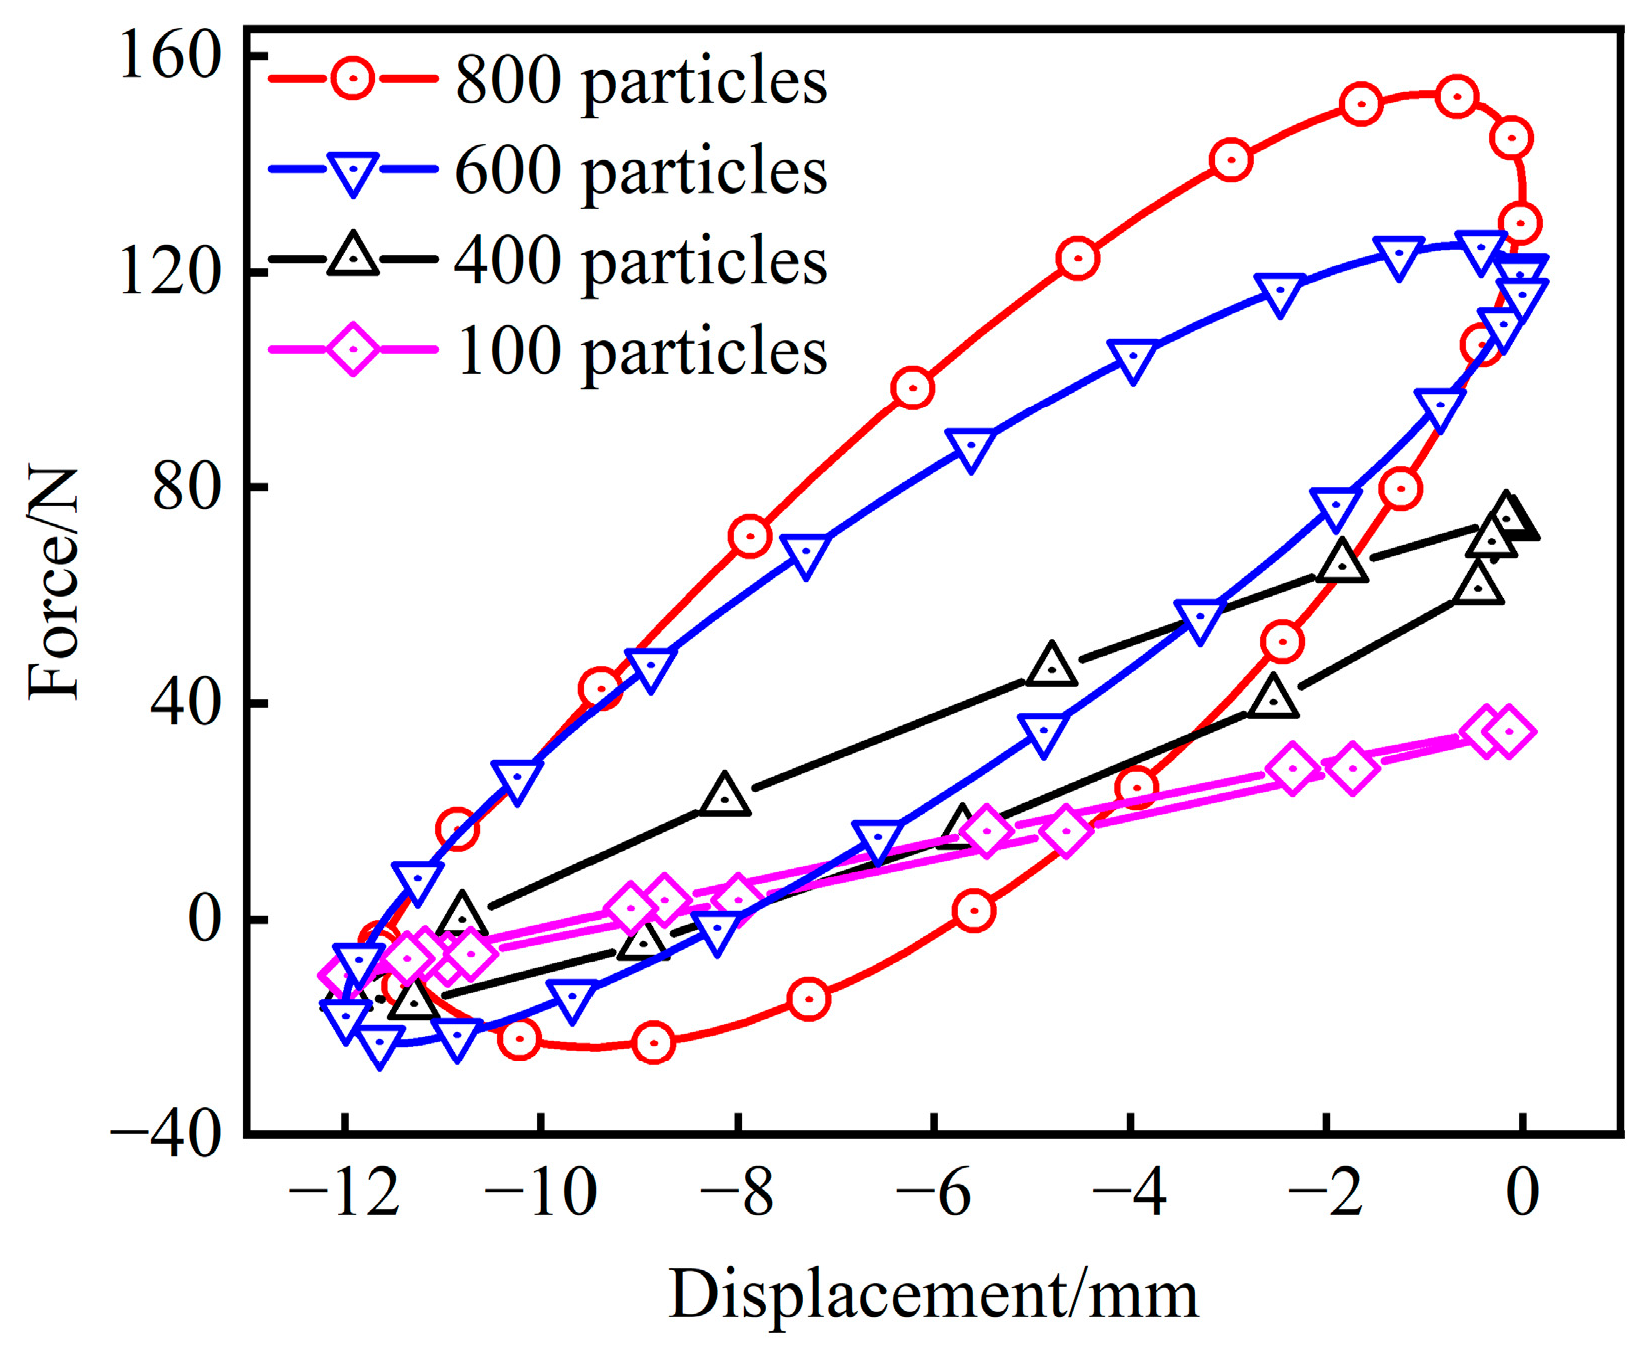
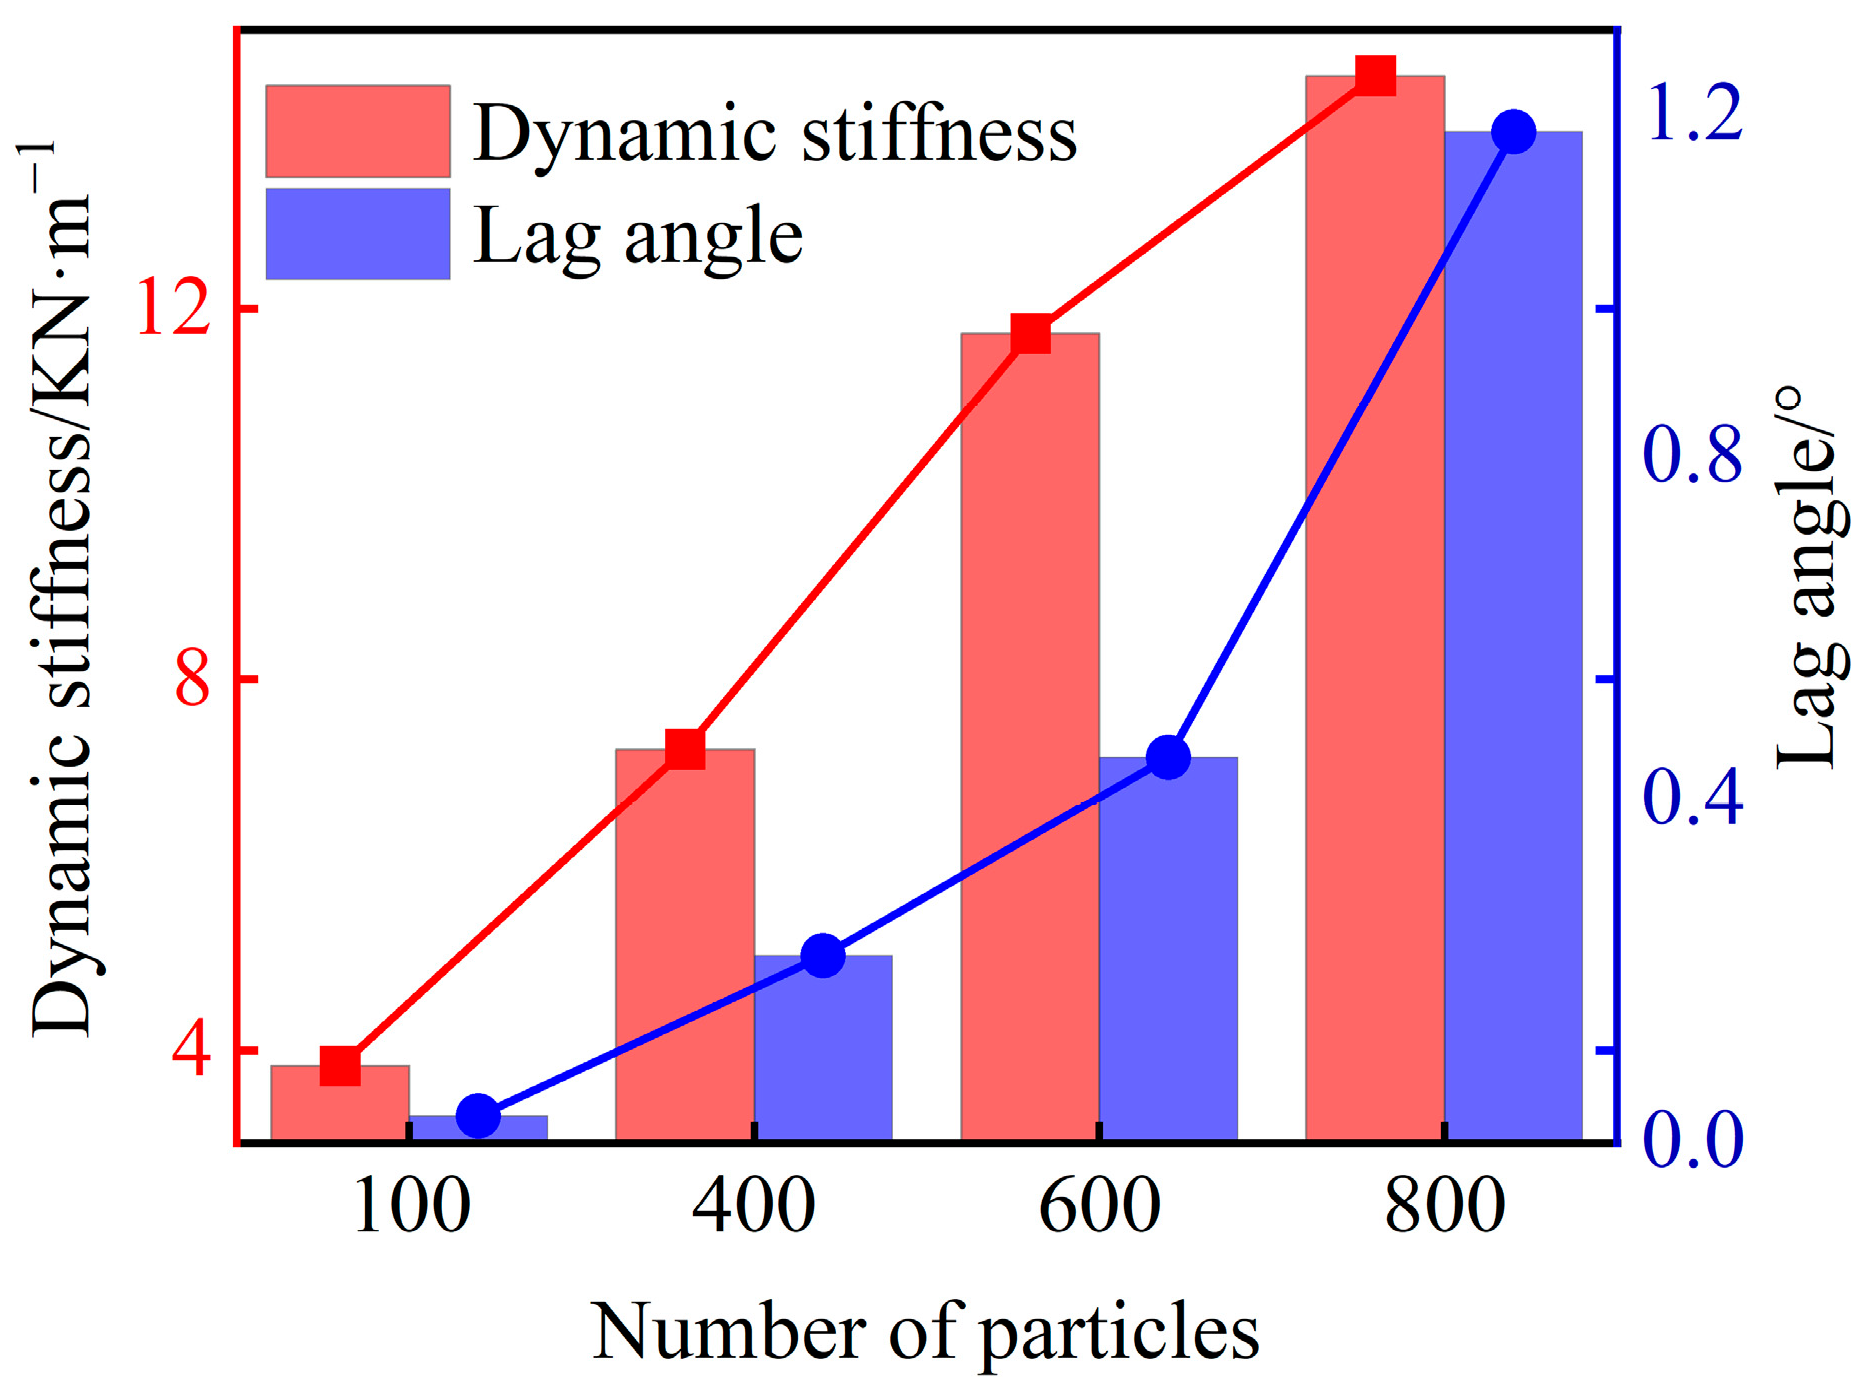
3.3. Dynamic Analysis of Screen Panel with Loading Materials

To investigate the effect of the number of the material groups on the dynamic characteristics of the screen panel, 100, 400, 600, and 800 particles were generated on the screen panel, respectively, and the displacement and force of the screen panel under different numbers of particles were recorded. As the force signal of the screen panel is unstable, it needs to be filtered. Then, the hysteresis loops of the screen panel and material group coupling system under different loading material conditions can be obtained, as shown in Figure 8.
Figure 8 illustrates that an increase in numbers of particles causes the hysteresis loop to rotate in the counterclockwise direction, and the overall slope of the hysteresis increases, which means that the dynamic stiffness of the screen panel increases. In addition, with the increase in the number of particles, the area (energy consumption) of the hysteresis loop increases obviously, which means that the damping of the screen panel and material group coupling system increases. The results mean that the screen panel exhibits significant dynamic stiffness and damping under material-loading conditions.
So as to accurately analyze the influence of the number of particles on the dynamic stiffness and damping of the coupling system of the screen panel and material group, according to Equations (10) and (11), the dynamic stiffness K and hysteresis angle θ of the coupling system of the screen panel and material group under different numbers of particles can be obtained from its simulated hysteresis loops (Figure 9). The results illustrate that the dynamic stiffness and damping of the screen panel and material group coupling system increase with the increase in the number of particles on the screen panel.
K = 1 n i = 1 n F max , i F min , i X max , i X min , i
θ = arcsin D
D = 1 n i = 1 n E i π ( F max , i F min , i ) ( X max , i X min , i ) / 4
where X m a x , i , X m i n , i , F m a x , i , and F m i n , i represent the maximum displacement, minimum displacement, maximum force, and minimum force of each hysteresis loop, respectively. Ei is the area of the hysteresis loop, and n stands for the number of hysteresis loops in the stable state.

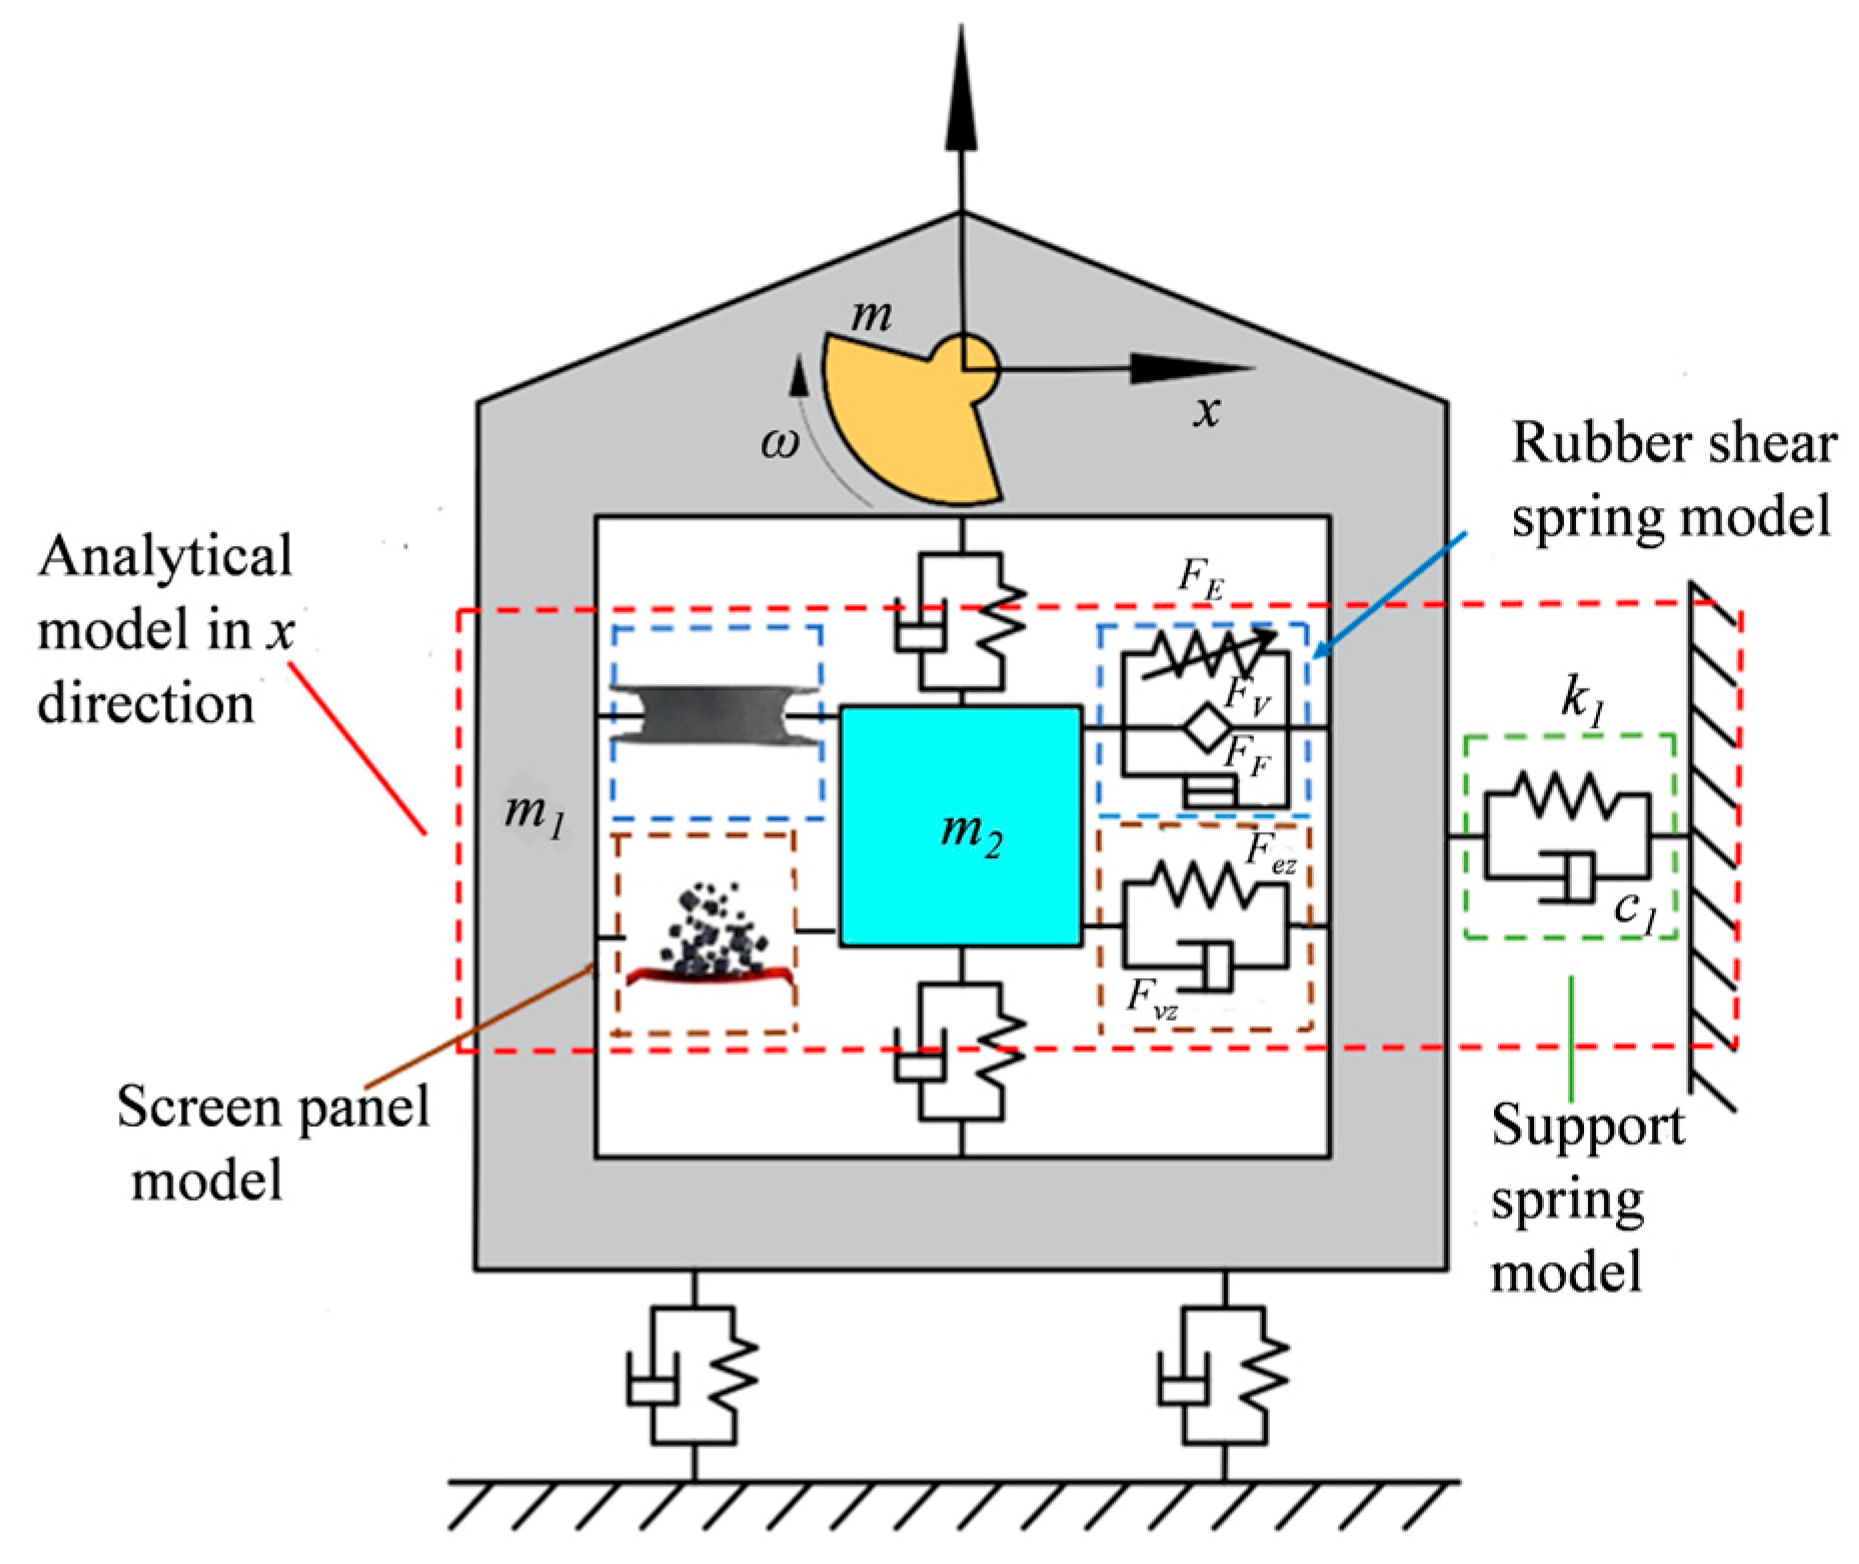
3.4. Dynamic Model of the Screen Panel and Material Group Coupling System

The above study shows that the screen panel has obvious dynamic stiffness and damping characteristics, which are related to the number of particles. In order to describe the dynamic characteristics of the coupling system of the screen panel and material group as well as to analyze its influence on the dynamics of the VFFS system, the Kelvin–Voigt model was chosen to describe the dynamics of the screen panel under loading material conditions.
The elastic force in the dynamic model of the screen panel and material group coupling system is denoted by a commonly used linear spring, and the relation between the elastic force F e z generated in the model and excitation displacement x is represented by the following equation:
F e z = k e z x
where k e z represents the elastic stiffness, which can be obtained from Equation (10). Because the k e z measured under different loading material conditions is changing, and is related to the number of particles, k e z is fitted as a function of the particle number n k :
k e z = k e z ( n k )
The viscous force is represented by the commonly used linear damper, and the relationship between the viscous force F v z and the excitation displacement x can be expressed by the following equation:
F v z = C d z x ˙
Here, C d z is the damping coefficient of the hysteresis loop under different loading material conditions. As parameter C d z will change under different loading material conditions, similarly, C d z need to be fitted as a function of the particle number n k :
C d z = 2 D k e z n k m
where m is the mass connected by the screen panel, and D represents the damping under different loading material conditions and is related to the number of particles in the following equation:
D = D ( n k )

3.5. Dynamic Model of VFFSs under Loading Material Conditions

The above proposed dynamic model of the coupling system of the screen panel and material group is applied to the dynamic model of the VFFSs without considering the function of the screen panel and materials, and the coupling system dynamics of the VFFSs mass, screen panel, and material group can be established (Figure 10). Here, a nonlinear rubber shear spring model proposed in [8] is used to describe the dynamic behavior of the rubber shear spring.
The x-axis and y-axis are parallel and perpendicular to the direction of the screen panel, respectively. As the vibration in y direction produces little effect on the performance of VFFSs [8], here, only the dynamics in x-axis direction are analyzed using the following equations:
( m 1 + m 2 ) x ¨ 1 + m 2 x ¨ 2 + c 1 x ˙ 1 + k 1 x 1 = F 0 cos ω t m 2 x ¨ 1 + m 2 x ¨ 2 + F E + F F + F V + F e z + F v z = 0
where x1 and x2 stand for the displacement of the main screen frame and its relative displacement to the floating screen frame, respectively; F 0 = m r ω 2 is the excitation force, with m, r, and ω being the mass, the eccentricity, and the angular frequency of the eccentric block. m1 and m2 represent the mass of the main and the floating screen frame, respectively; k1 and c1 are the stiffness and damping coefficient of support springs, respectively; Fez and Fvz stand for the elastic force and viscous force of the screen panel under loading material condition, respectively; and F E = 24 F e , F F = 24 F f , F V = 24 F v are the elastic, the friction, and the viscous forces of all rubber shear springs installed on the VFFSs. The elastic force F e of a rubber shear spring element is expressed as F e = k e x 2 , with model parameter k e being the elastic stiffness of each hysteresis loop. The friction force F f of a rubber shear element can be described as [8]:
  • for x2 = xs
    F f = F f s
  • for x2 > xs
    F f = F f s + x 2 x s a 2 ( 1 ε ) + ( x 2 x s ) ( F f m a x F f s )
  • for x2 < xs
F f = F f s + x 2 x s a 2 ( 1 + ε ) ( x 2 x s ) ( F f m a x + F f s )
with x s , F f s , and ε = F f s / F f m a x representing a reference displacement, a force, and the instantaneous friction coefficient, respectively [27,28]. The model parameters F f m a x and a 2 represent the maximum friction force and the corresponding displacement for each hysteresis loop. The viscoelastic force F v of a rubber shear spring element is written by a function of a α-order fractional derivative:
F v = b D α x t = b d α x t d t α
with model parameters α ( 0,1 ) and b > 0 representing the order of the derivative and the coefficient of the viscoelastic force [29,30]. In accordance with Riemann–Liouville, the expression for the fractional derivative is formulated as follows:
d α x t d t α = 1 Γ 1 α d d t α t x t t τ α d τ
where Γ is a gamma function.
Since the elastic, frictional, and viscous forces of the shear spring are nonlinear, segmented, and fractional derivative functions, it is difficult to solve Equation (18) using a conventional method. Therefore, the Newmark-β method is used here, which needs to be transformed into the matrix form:
M X ¨ n + C X ˙ n + K X n = F n
where M , K , and C represent matrices of mass, stiffness, and damping coefficients of the VFFS system, respectively; and F n and X n are the force and displacement vector of the VFFS system, respectively.
An appropriate selection of the stable control parameter can allow the Newmark algorithm to solve Equation (24), resulting in the following equations [8]:
X n = X n 1 + t X ˙ n 1 + 1 2 t 2 X ¨ n 1
X ˙ n = X ˙ n 1 + t 1 β X ¨ n 1 + β X ¨ n
where X n , X ˙ n , and X ¨ n are the vector forms of displacement, velocity, and acceleration in the system, respectively; β is an independent parameter of the characteristics of the control method. The algorithm is conditionally stable for β 1 / 2 with the critical time step t c r i t = 1 / ω m a x β / 2 , where ω m a x represents the highest undamped natural frequency of the system. The algorithmic damping can be eliminated by letting β = 1 / 2 , which occurs for β > 1 / 2 . When the initial displacement and velocity of the system are known, the dynamic response of the investigated VFFSs can be achieved, as illustrated in the following flowchart (Figure 11):

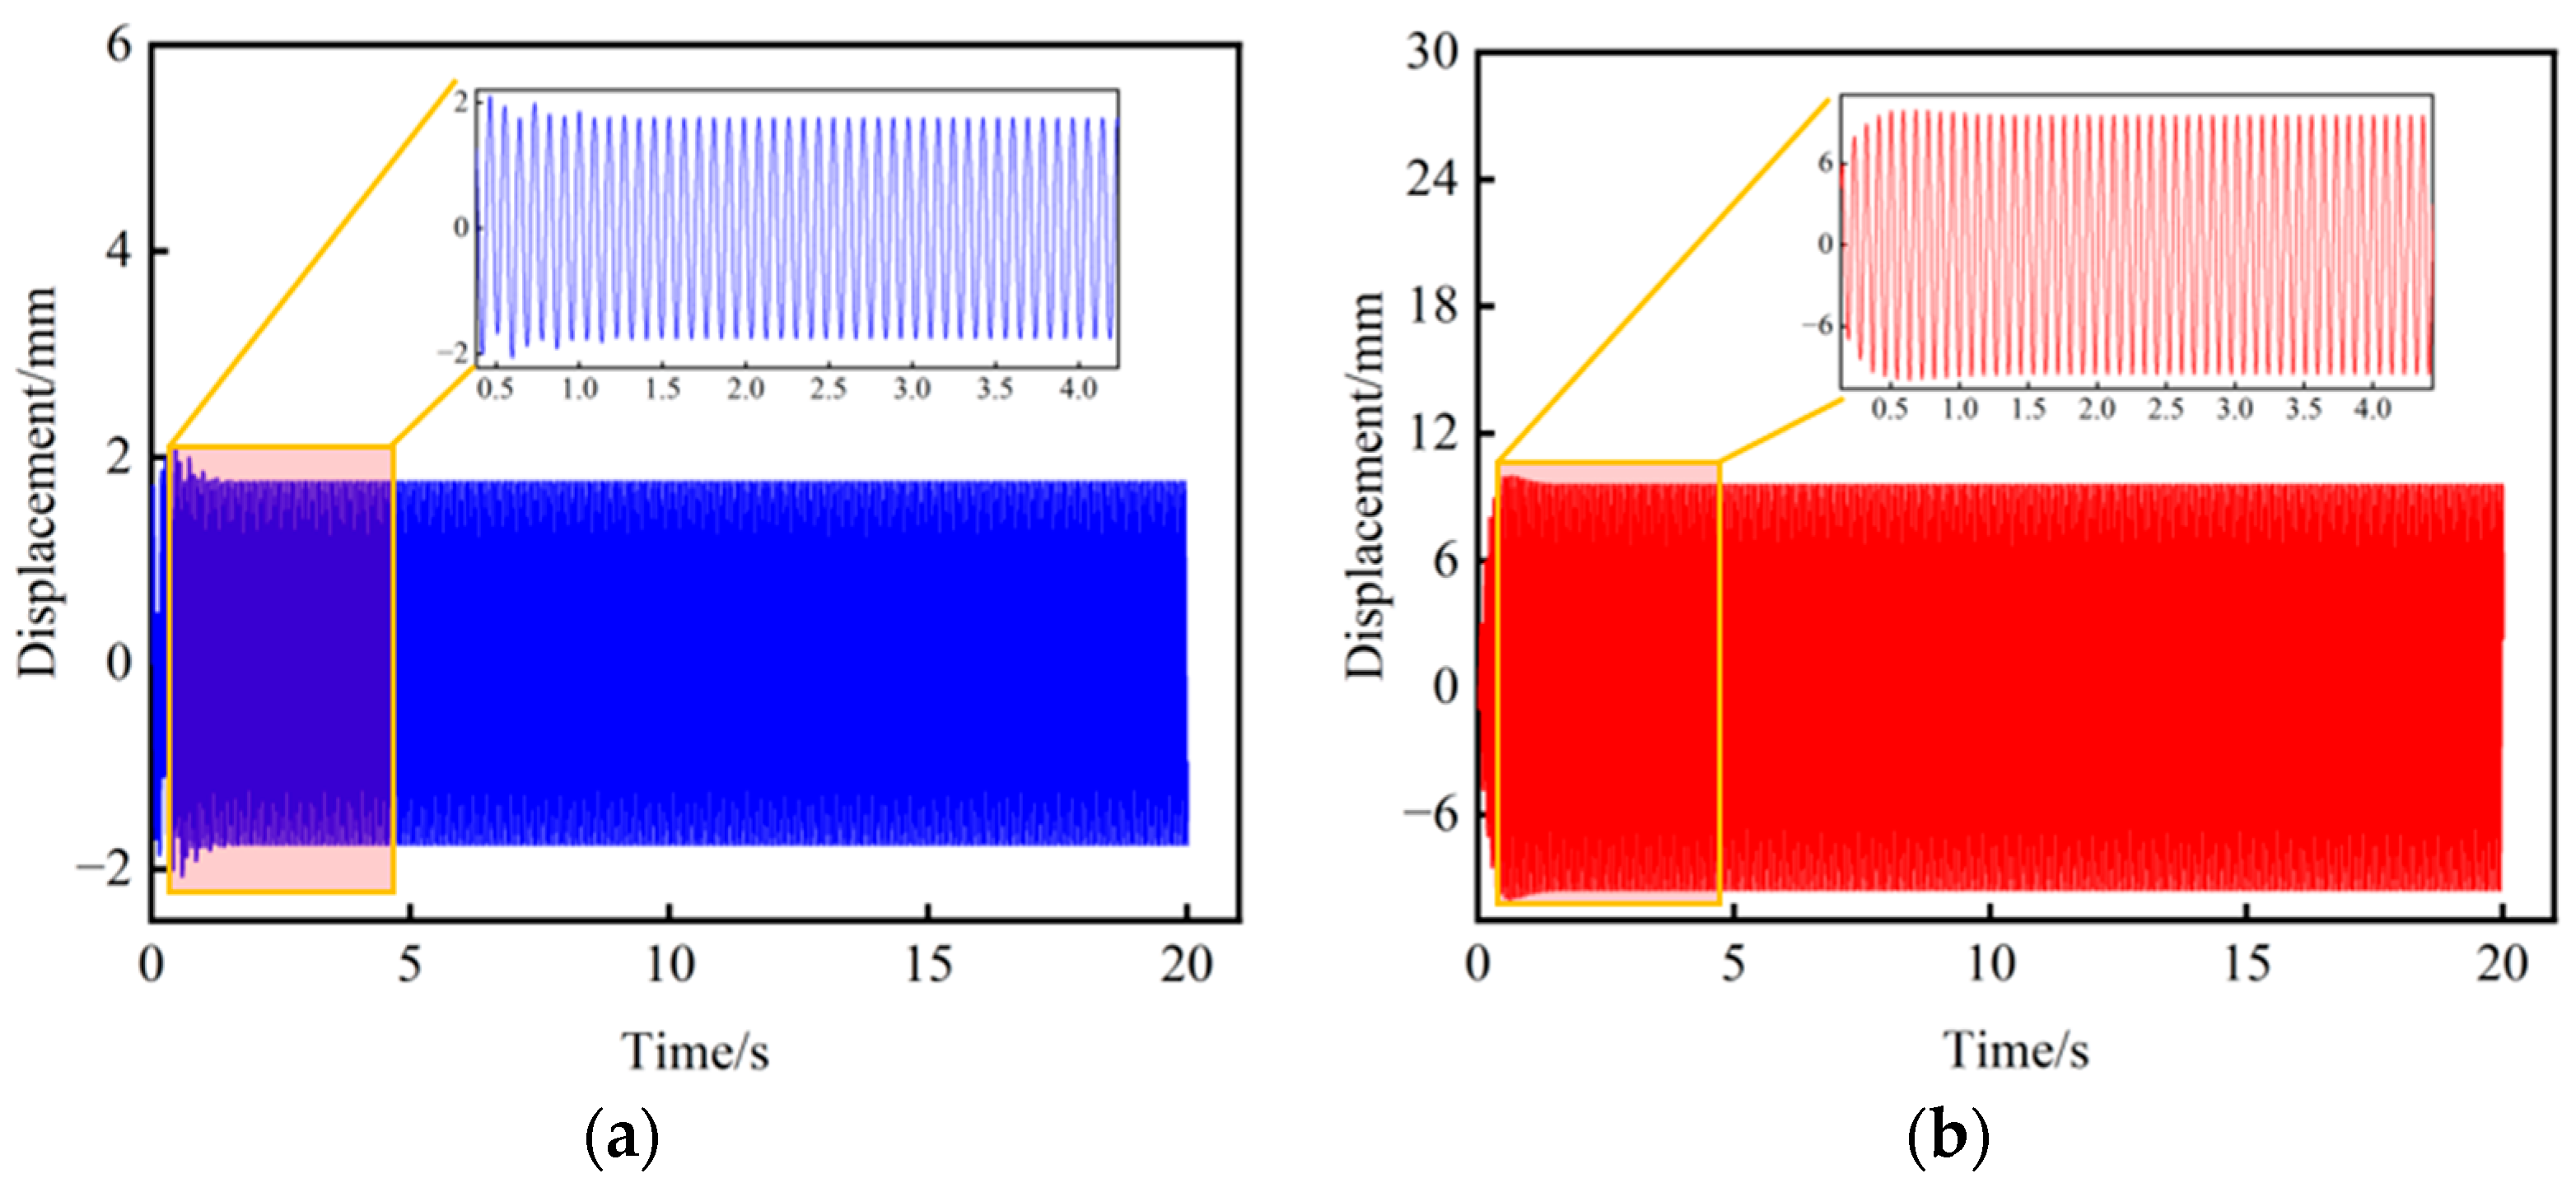
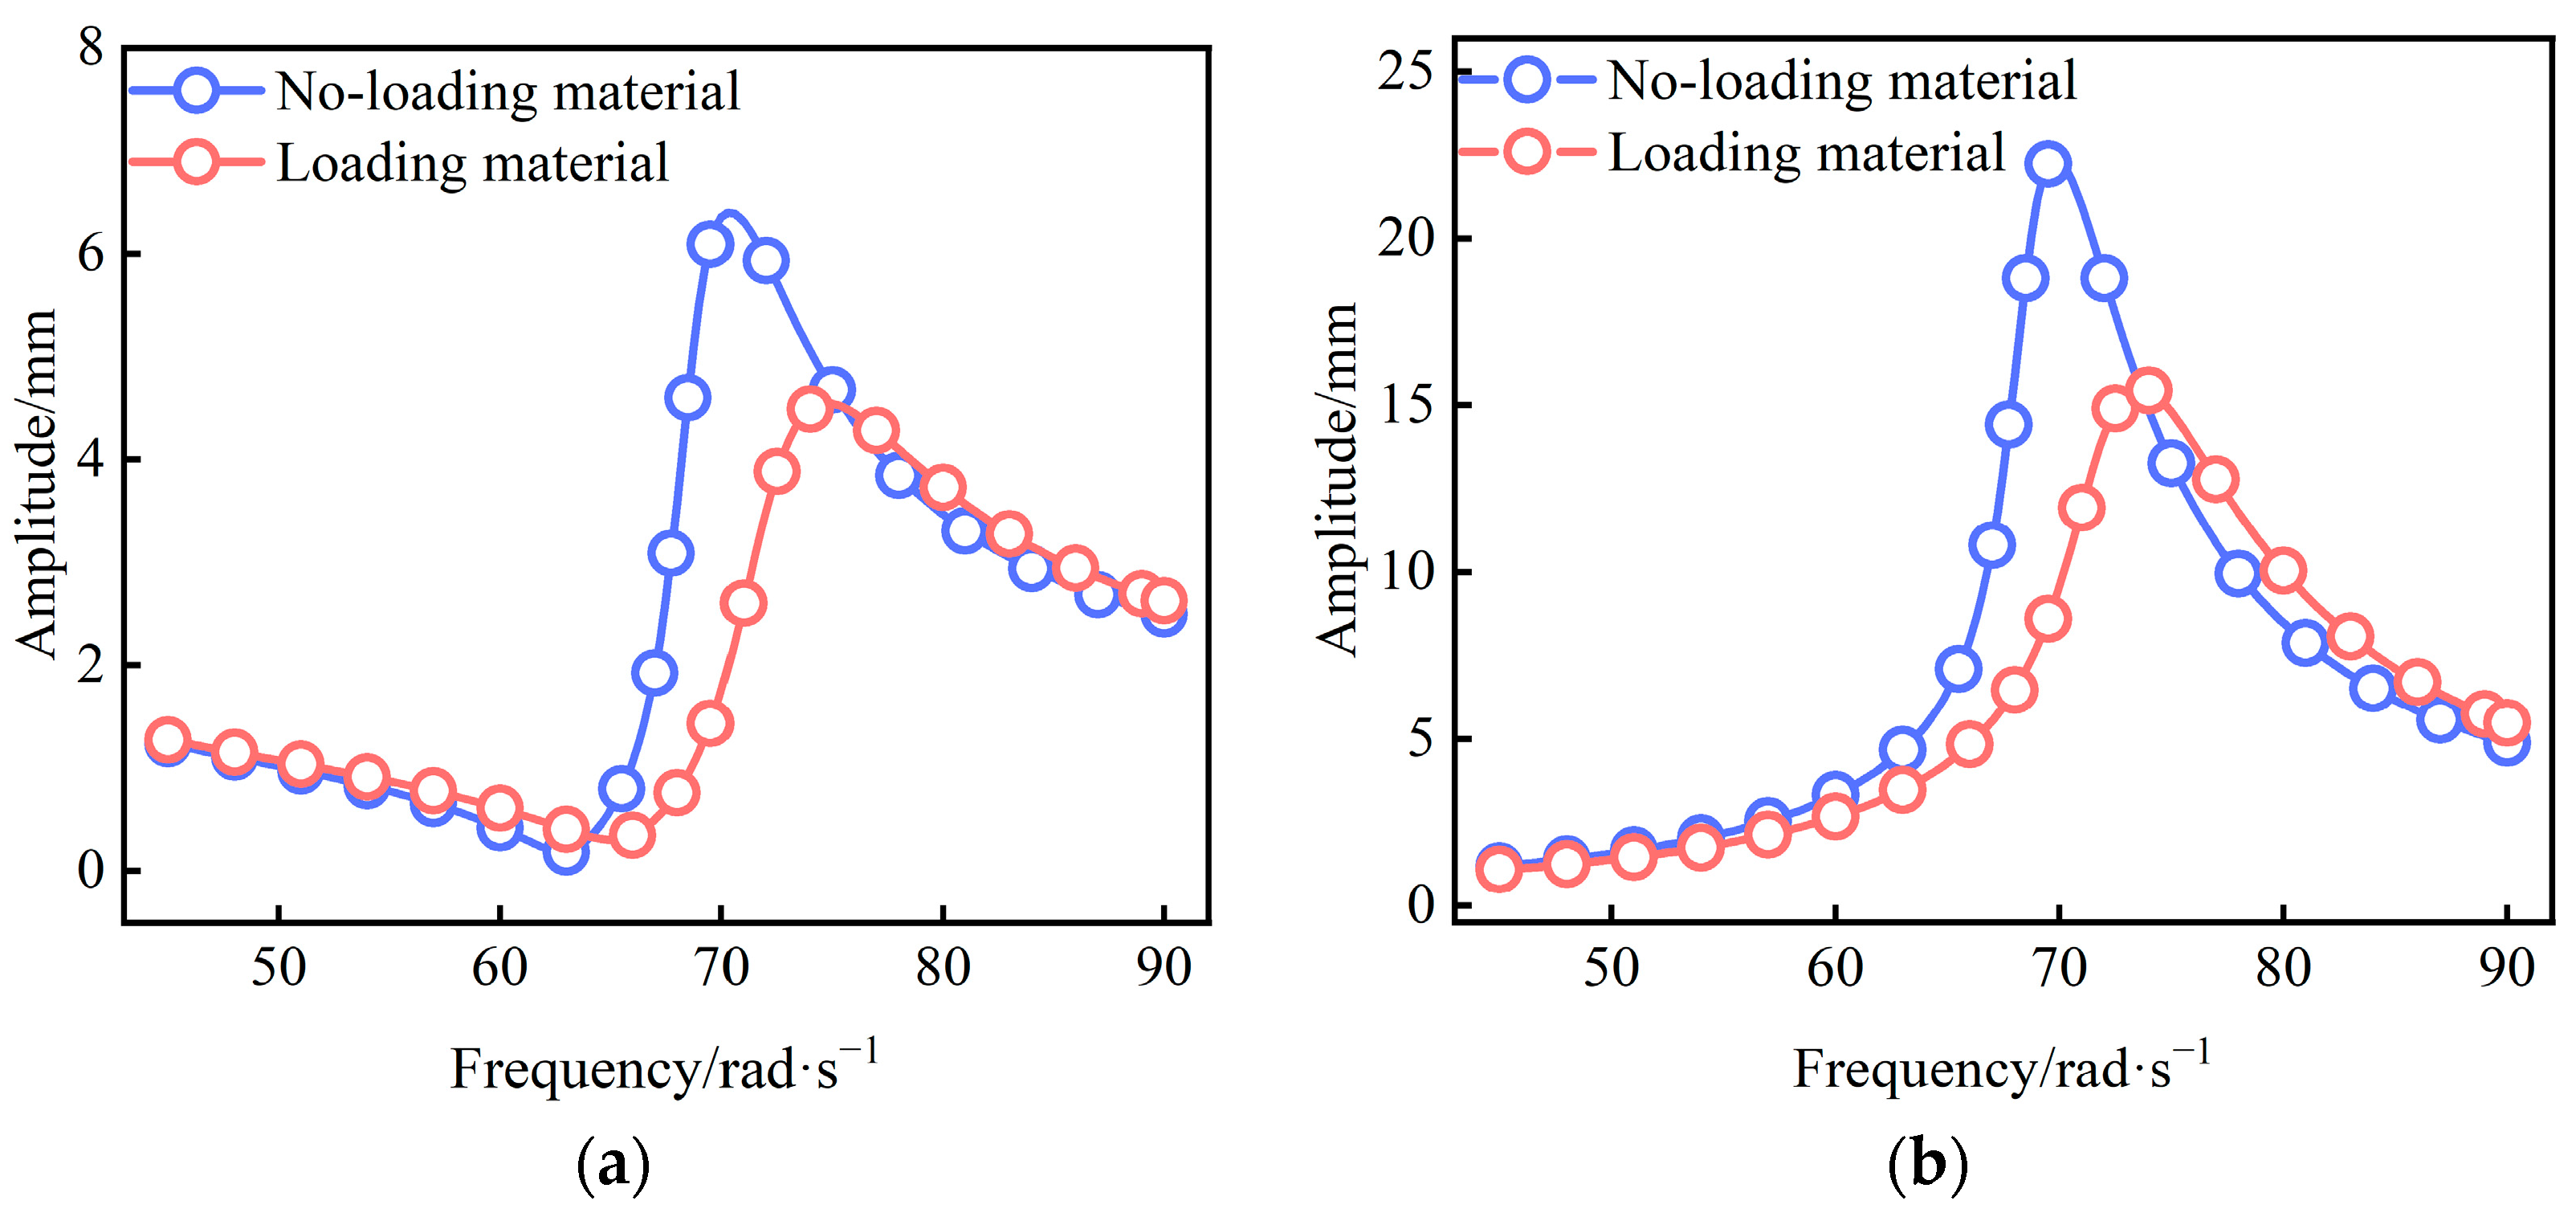
3.6. Analysis of Dynamic Response of VFFSs under Loading Material Condition

According to the research results of Section 3.4, the stiffness coefficient k e z and damping coefficient c d z of the coupling system of the screen panel and material group can be chosen as 7.2 kN/m and 50 N·s/m, respectively, and other related parameters of the dynamic model of the VFFSs are shown in Table 3. The initial values of displacement and velocity of the dynamic system of the VFFSs are both 0. According to the steps of the flowchart (Figure 11), the dynamics of x 1 and x 2 in the time region for an operating VFFS with a frequency of 70 rad·s−1 can be obtained, as shown in Figure 12.
It can be seen in Figure 12 that the dynamic response of x 1 and x 2 in the time region gradually reaches a stable state after experiencing an unstable state for a period of time. Here, only the steady-state data were used for the theoretical analysis, and the amplitude of x 1 and x 2 for an excitation frequency can be obtained. After the calculation of a set of data is completed, changing the angular frequency and considering the effect of materials on the screen panel, the dynamic response of x 1 and x 2 in the frequency region produce Figure 13.
Figure 13 illustrates that the stiffness produced by materials on the screen panel results in the resonance zone moving to the right, and the damping generated by materials on the screen panel causes the amplitude of the dynamic response of VFFS without loading materials to decrease. This means that elastic and damping forces generated by the screen panel under loading material conditions have a significant influence on the dynamic response of x 1 and x 2 in the frequency region.

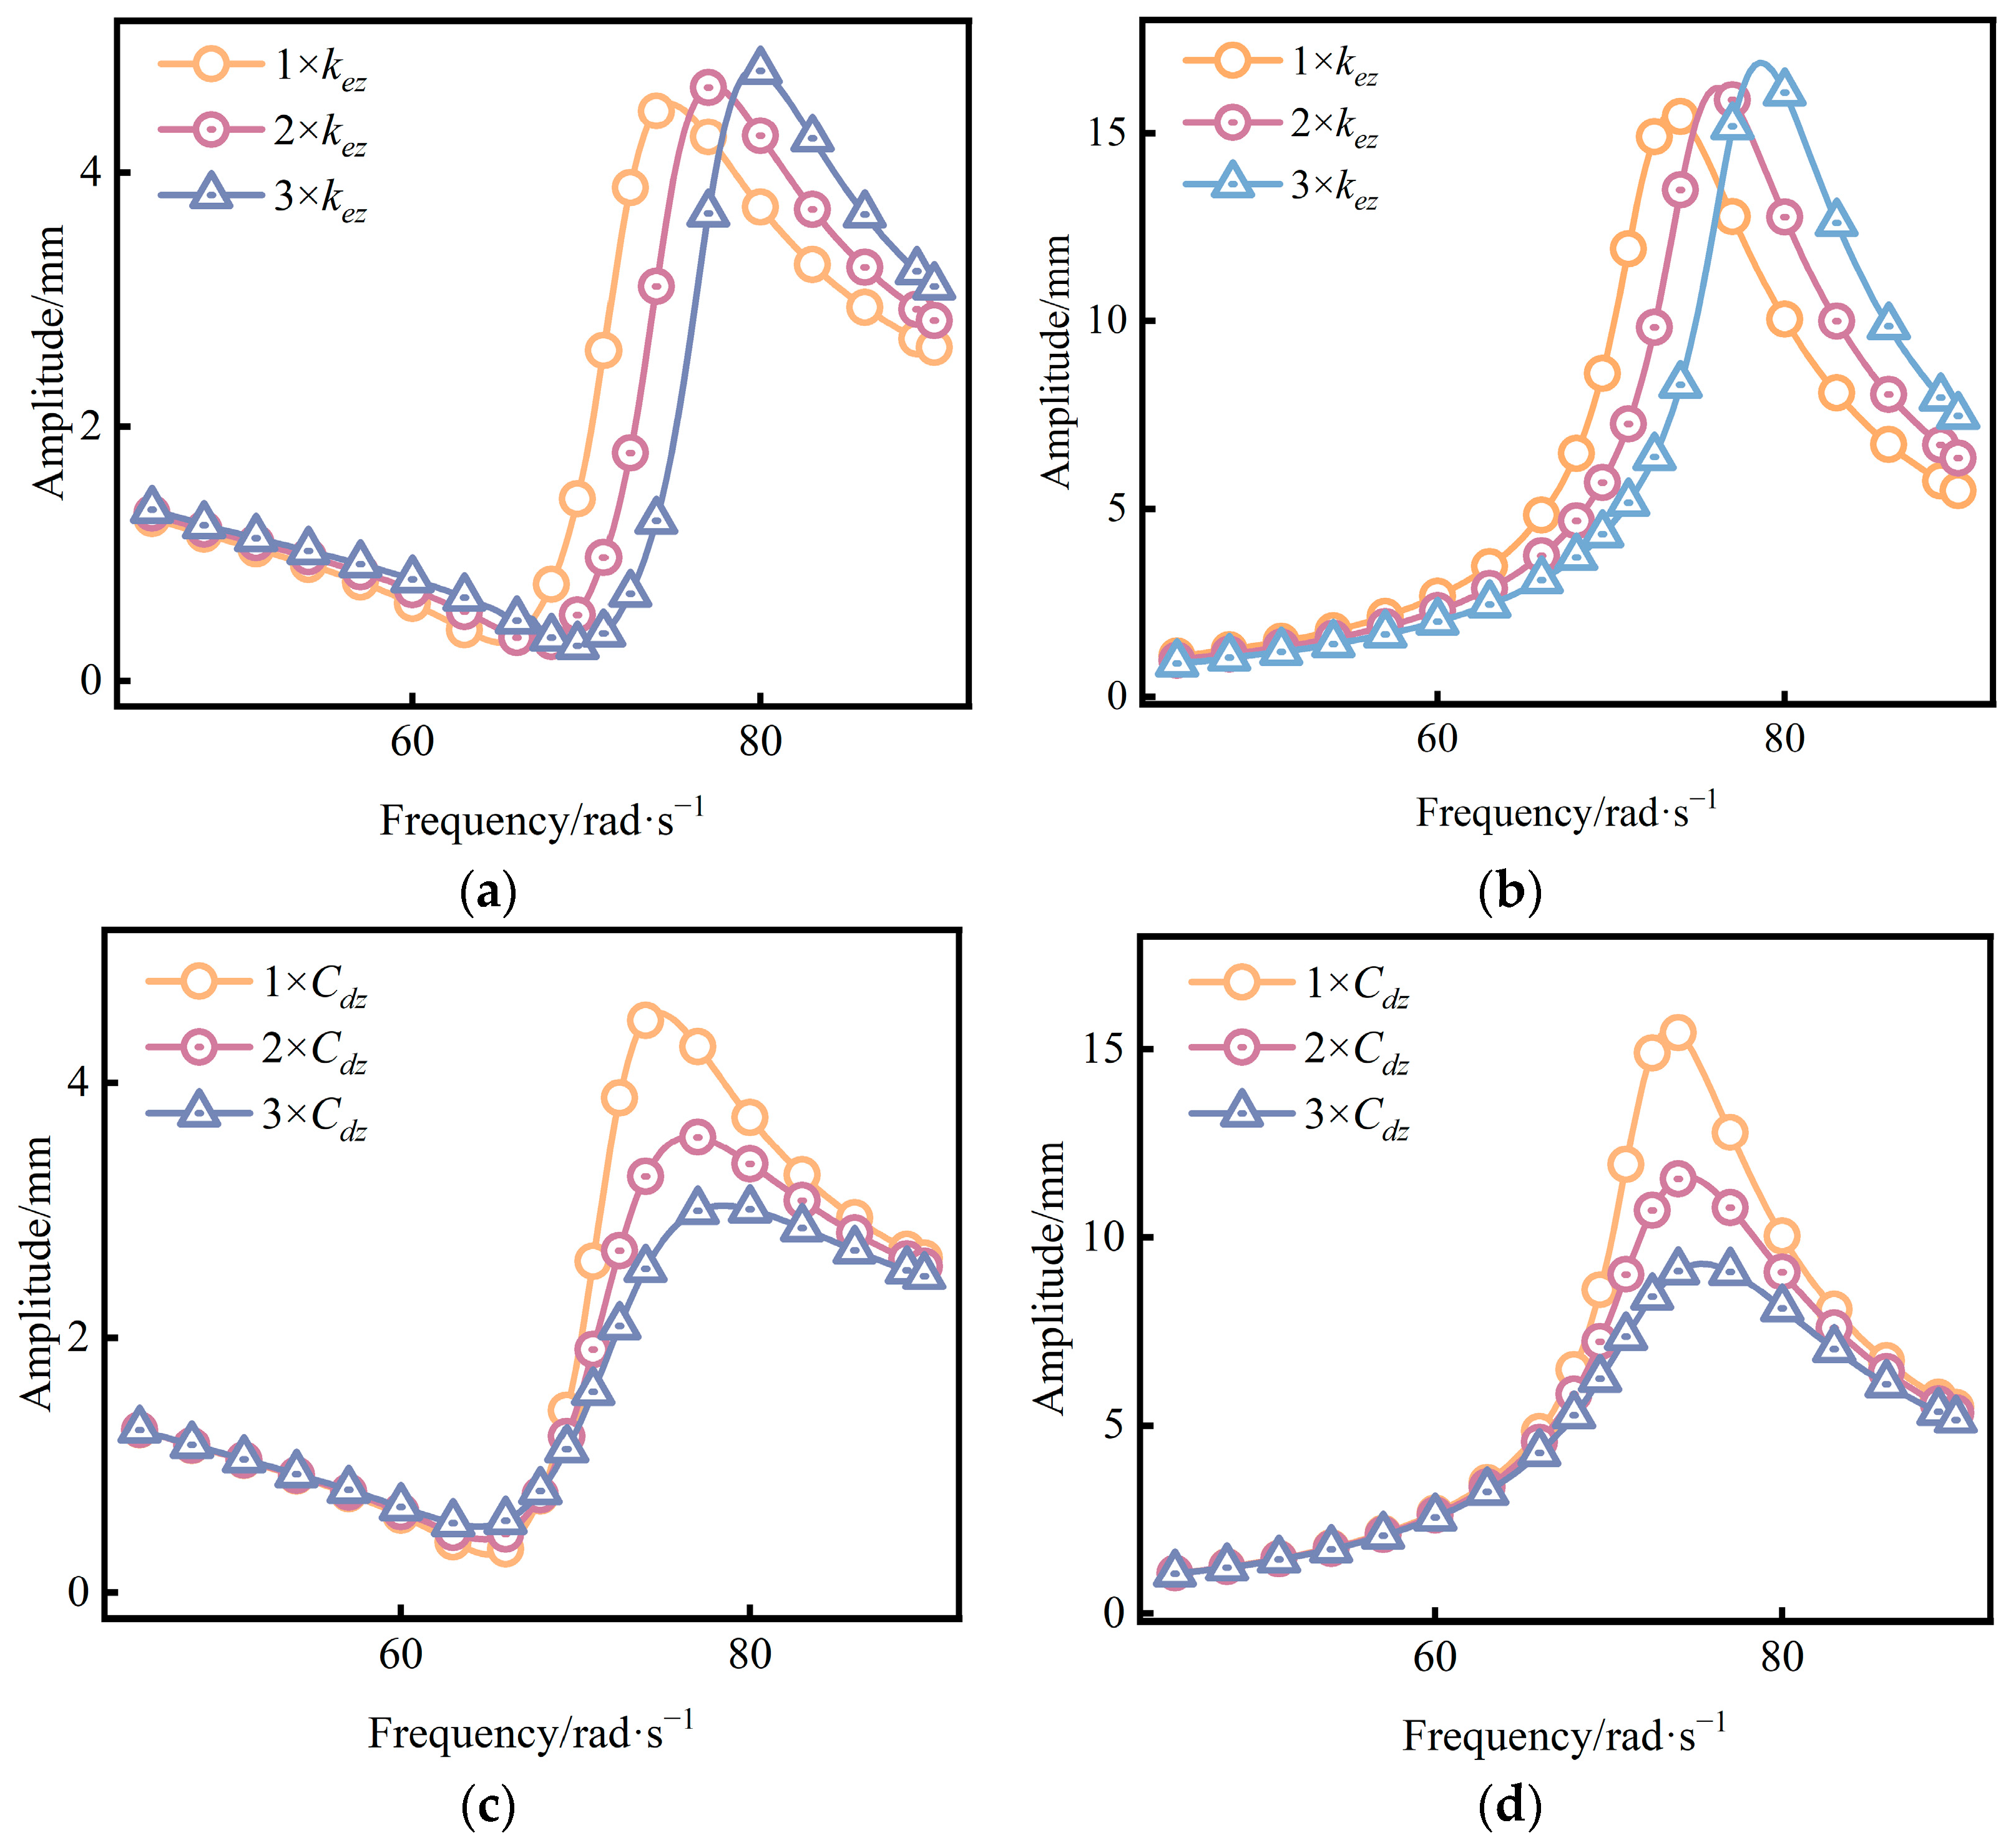
3.7. The Influence of Model Parameters on the Dynamic Response of VFFS under Loading Material Conditions

The parameters k e z and C d z in the dynamic model of the screen panel reflect the size of the elastic force and damping force of the screen panel under loading material conditions. Changing the size of k e z and C d z while keeping other parameters constant, the influence of the elastic force and the damping force of the screen panel on the dynamic response of x1 and x2 in the system under different loading material conditions can be obtained, as shown in Figure 14.
Figure 14a,b show that an increase in the elastic force of the screen panel results in an increasing anti-resonance frequency and resonance frequency of the dynamic response of x 1 and x 2 in the frequency region, and the peak in the resonance region increases and moves to the right. This means that the amplitudes of x 1 and x 2 decrease significantly for a constant excitation angular frequency in the near-resonance region. Figure 14c,d illustrate that with the increase in the damping force, the resonance frequency of the dynamic response of x 1 and x 2 in the frequency region increases, and the peak in the resonance region decreases and moves to the right. This is because a decrease in the amplitude of x 2 results in an increasing stiffness of the shear spring [7], resulting in the resonance of the system increasing. In summary, the elastic force and viscous force of the screen panel have a significant effect on the dynamic response of VFFSs under loading material conditions.

4. Dynamic Optimization of the VFFSs Coupling System

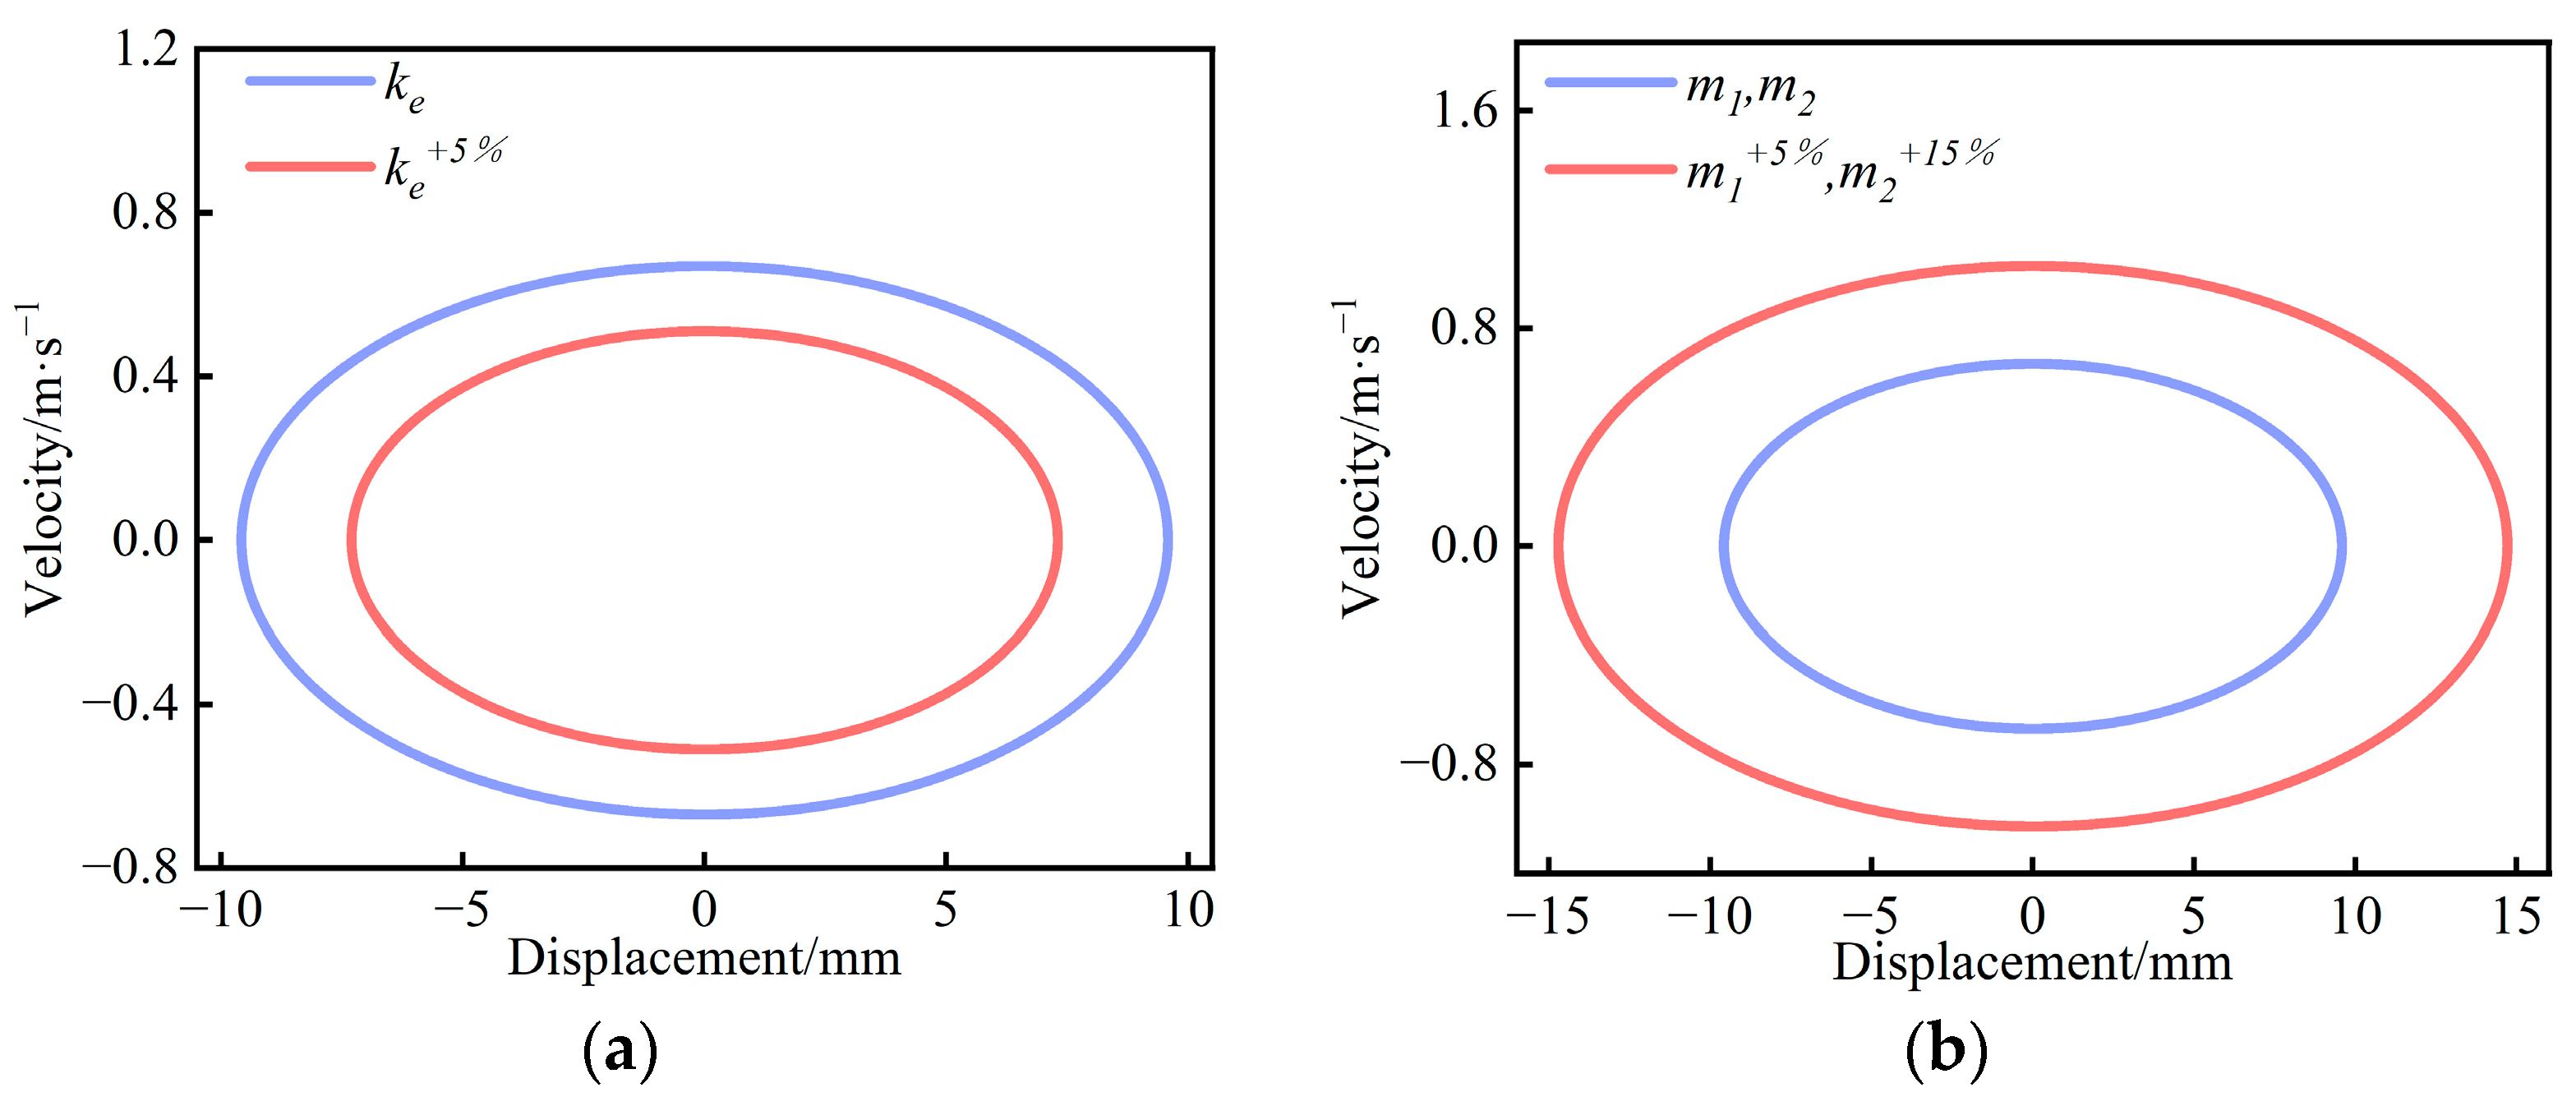
4.1. The Influence of External Conditions on the Dynamic Response of x2

The shear spring is the dominant component for the dynamic response of VFFSs system [8], and its stiffness is easily effected by the temperature. An experimental test of a rubber shear spring showed that a decrease in temperature from 35 °C to 10 °C results in an increase in the elastic stiffness of a rubber shear spring element of about 5%. Through loading materials on the screen panel, m 1 and m 2 may increase by about 5% and 15%. The effects of changing these parameters on the dynamic response x 2 of an operating VFFS (ω = 70 rad·s−1) are shown in Figure 15, respectively.
Figure 15 illustrates that the operating VFFSs remains in a periodic-1 motion although the parameters ( k e , m 1 and m 2 ) are changed. However, the range of amplitude in x 2 caused by parameters k e by 5% and m 1 and m 2 by 5% and 15% are significant with [7.31 mm, 9.58 mm] and [9.58 mm, 14.72 mm], respectively. The corresponding maximum change rates in amplitude are 23.70% (Figure 15a) and 53.65% (Figure 15b). The results illustrate that the changes in parameters k e , m1 and m2 caused by external conditions show an over-proportional effect on the amplitude of x2.

4.2. Multi-Objective Optimization Design of Dynamic Response of VFFSs

A multi-objective optimization problem (MOP) of mechanical design can be described as follows [31,32]:
min k Q F k   with   f i : Q R 1 , F : Q R k   and   F k = f 1 k , , f k k
with f i representing the objective functions, and k Q standing for a q-dimensional vector of design variables. The domain Q R q is described by equality and inequality constraints:
Q = k R q | h j k = 0 , j = 1 , , m , a n d g i k 0 , i = 1 , , l
The concept of dominance [33] defines the optimal solutions of a MOP: for k Q , which dominates k ^ in the sense that f i k f i ( k ^ ) ( i = 1,2 , , k ) and F ( k ) F ( k ^ ) , a point k ^ Q is called a Pareto point (Pareto optimal solution) of Equation (4). All Pareto optimal solutions are called a Pareto set [34]:
p : = x Q : k is a pareto point of   ( 4 )
The image of p is called the Pareto front.
The elastic stiffness k e of the rubber shear spring (RSS) is the most dominant parameter for the dynamic response of VFFSs [8] with nonlinear characteristics. Here, regarding k e = 207.77 4.504 x 0 + 0.192 x 0 2 0.0031 x 0 3 of the baseline RSS as a reference, we take the optimized nonlinear stiffness k e of the shear spring as the optimization factor to design the optimization scheme of a dynamic system of VFFSs.
The goal of this study is to minimize the influence of external conditions on the rate of change of the amplitude of x 2 , which is critical for a VFFS’s lifetime and screen performance. However, reducing the rate of change of displacement amplitude by changing the nonlinear stiffness characteristics k e of RSS may result in changed quality of the dynamics, which could change to higher periodic, quasi-periodic (toroidal), or even chaotic motions. Hence, two objective functions, including the rate of change of the displacement amplitude as a robustness measure and the complexity of the dynamics as a measure to control the vibrations, are equations in this study; for details, see Table 4.

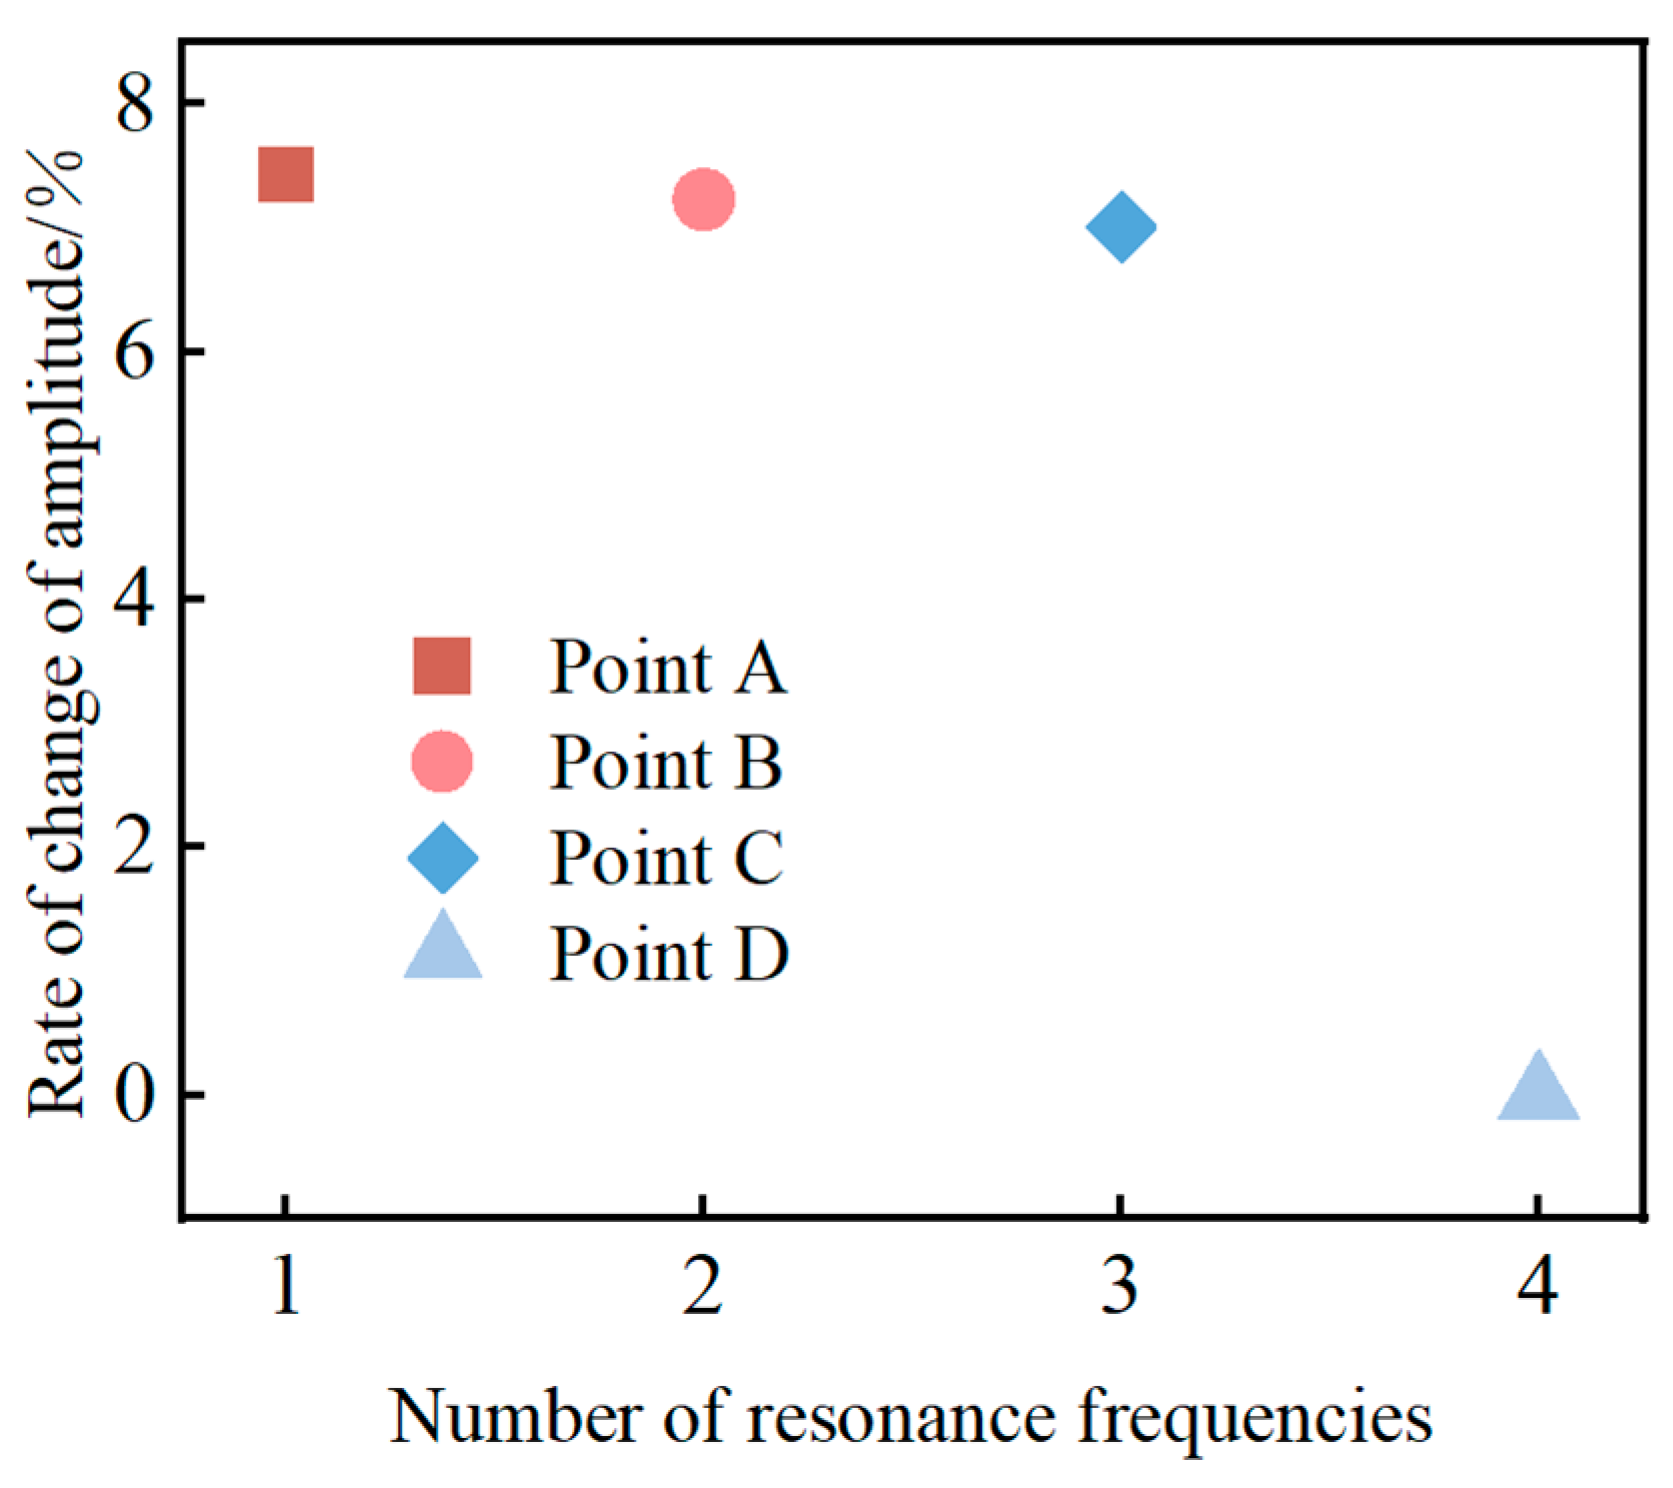
4.3. Multi-Objective Optimization Results and Analysis of Dynamic Response of VFFSs

A method of NSGA-II implemented in Matlab 2023a was used to find combinations of solutions for both objective functions, with the parameters listed in Table 5. The optimization was conducted iteratively while considering both the computational time and the accuracy of solutions using a value of function tolerance (10−4) as a termination criterion. To compare the performance of the baseline RSS with that of the optimized RSSs, parameters ke, m1, and m2 with changed parameters were used at a VFFSs operating frequency of 70 rad·s−1, as discussed in Section 4.1). The generated Pareto is shown in Figure 16.
Figure 16 indicates that the Pareto front consists of four isolated points, which are described as points A, B, C, and D, respectively. The solution in point A has a low complexity of motion but a large rate of the change of amplitude; solutions in points B and C increase the complexity of motion but slightly decrease the rate of the change of amplitude compared with the solution in point A; the solution in point D shows a slight rate of change of amplitude but indicates that the complexity of motion is further increased.
Since only one solution of the Pareto front is required for the design of the shear spring, VFFS designers can evaluate the Pareto set of solutions according to their experience and the requirements of each optimization problem and choose one as the final solution for the specific problem. Next, the performance of four virtual rubber shear springs, RSS (A), RSS (B), RSS (C), and RSS (D), with parameters according to the Pareto optimal solutions in A, B, C, and D (Figure 16), was studied by simulating the dynamics of a VFFSs at ω = 70 rad·s−1 equipped with those springs (see Figure 17).
It can be observed in Figure 17a that the motion state of VFFSs equipped with RSS (A) is maintained to be a periodic-1 motion. Figure 17b–d indicates, however, that by implementing RSS (B), RSS (C), or RSS (D), respectively, the VFFS’s dynamics is attributed to more complex quasi-periodicity with toroidal attractors formed in phase space. The results illustrate that the motion state of the VFFSs equipped with the baseline RSS can be maintained by using RSS (A) but that the complexity of the motion state of the system is gradually increased by using RSS (B), RSS (C), and RSS (D).
For comparing the performance of the baseline rubber shear spring (BRSS) and the optimized RSSs on γ 2 (the rate of change of amplitude of x 2 ) caused by external conditions, the effects of change in parameters k e , m 1 and m 2 on γ 2 of an operating VFFSs equipped with different RSSs are calculated, cf. Figure 18. Here, parameters k e , m 1 , and m 2 also increase by 5%, 5%, and 15%, respectively, and the excitation angular frequency 70 rad·s−1 are considered, cf. Section 4.3.
Figure 18 depicts the rate of change of amplitude of x2 caused by the change in parameters Ke, m1, and m2 decrease from 51.84% (the baseline RSS) to 7.54%, 6.92%, 6.72%, and 0.061% using RSS (A), RSS (B), RSS (C), and RSS (D), respectively. The results illustrate that if the operation stability of an industrial VFFS can be reduced, RSS (D) can be employed, which has the best performance with regard to the rate of change in amplitude, followed by RSS (C), RSS (B), and RSS (A), which perform essentially identical.
As the dynamic stiffness is the dominant parameter for the dynamics of VFFSs [8], the dynamic stiffness characteristics of the baseline and the four optimized RSSs for different excitation amplitudes are described and compared in the following, as shown in Figure 19. Its dynamic stiffness is defined as Equation (10).
Figure 19 shows that an increase in amplitude results in a decrease in the dynamic stiffness of the baseline RSS. However, the dynamic stiffness of the optimized RSSs increases with the increase in amplitude, and the dynamic stiffness of RSS (D) increases fastest, followed by RSS (C), RSS (B), and RSS (A). These results illustrate that the baseline RSS shows softening characteristics, and the optimized RSSs show hardening characteristics, respectively. RSS (A) with suitable hardening characteristics can improve the amplitude stability of the VFFSs caused by external conditions while maintaining the periodic−1 motion.

5. Conclusions

In this paper, by applying mechanical tests (uniaxial tension, uniaxial compression, plane tension, and shear stress relaxation) to the screen panel samples, the hyperelastic and viscoelastic constative models of screen panel material were identified. Compared with other models (Mooney–Rivlin, Neo-Hooke, Yeoh, Arruda–Boyce, Kevin–Voigt model), the third-order Ogden model and the Generalized Maxwell model can accurately describe the hyperelasticity and viscoelasticity of the screen panel, respectively.
Then, a new dynamic model of the coupling system of the VFFSs mass, screen panel, and material group is proposed, and the dynamics of the VFFSs under different loading conditions are revealed: with the increase in the elastic force of the screen panel, anti-resonance frequency and resonance frequency of the VFFSs dynamic system increase, and the peak in the resonance region increases and moves to the right. An increase in the damping force results in an increasing resonance frequency of the dynamic system, and the peak in the resonance region decreases and moves to the right. This means that the elastic force and viscous force of the screen panel produce a significant effect on the dynamic response of VFFS under loading material conditions.
Finally, the NSGA-II is applied to optimize the dynamic response of the VFFSs system, and the results reveal that the use of optimized shear springs (RSS (A)) with suitable hardening characteristics can reduce the relative amplitude change rate of the main and floating screen fame by 44.30% while maintaining periodic-1 motion of the VFFSs, which greatly improve the vibration stability of the VFFSs system under loading material condition.

Author Contributions

Conceptualization, S.G. and C.W.; methodology, S.G.; software, C.W. and J.G.; validation, Z.Q.; formal analysis, C.W. and Z.Q.; investigation, S.G. and C.W.; resources, S.G. and J.F.; data curation, S.G. and G.Z.; writing—original draft preparation, S.G. and C.W.; writing—review and editing, S.G., J.F. and N.X.; visualization, C.W., J.G. and Z.Q.; supervision, S.G. and X.W.; project administration, S.G.; funding acquisition, S.G. and G.Z. All authors have read and agreed to the published version of the manuscript.

Funding

This research was funded by the National Natural Science Foundation of China, grant number 52204267; the Key Scientific and Technological Project of Henan Province, grant number 212102210006 and 242102220007; and the Doctoral Fund of Henan Polytechnic University, grant number B2021-29.

Data Availability Statement

Data are contained within the article.

Acknowledgments

The authors would like to thank C.W. and everyone for their valuable comments and suggestions that helped us improve the quality of this paper.

Conflicts of Interest

The authors declare no conflicts of interest.

References

  1. Duan, C.; Yuan, J.; Pan, M.; Huang, T.; Jiang, H.; Zhao, Y.; Qiao, J.; Wang, W.; Yu, S.; Lu, J. Variable elliptical vibrating screen: Particles kinematics and industrial application. Int. J. Min. Sci. Technol. 2021, 31, 1013–1022. [Google Scholar] [CrossRef]
  2. Fan, J.; He, Z.; Zhang, Y.; Wang, M. A Novel Kinematics Model of Flip-Flow Screen Panel: Inclined Catenary Model. Mathematics 2023, 11, 2028. [Google Scholar] [CrossRef]
  3. Wang, W.; Duan, C.; Jiang, H.; Yu, S.; Zhou, Z.; Qiao, J.; Zhao, Y.; Pan, M. Mechanism of overcoming plugging and optimization of parameters for rigid-flexible coupled elastic screening of moist fine coal. Powder Technol. 2020, 376, 113–125. [Google Scholar] [CrossRef]
  4. Jiang, H.; Wang, W.; Zhou, Z.; Jun, H.; Wen, P.; Zhao, Y.; Duan, C.; Zhao, L.; Luo, Z.; Liu, C. Simultaneous multiple parameter optimization of variable-amplitude equal-thickness elastic screening of moist coal. Powder Powder Technol. 2019, 346, 217–227. [Google Scholar] [CrossRef]
  5. Yu, S.; Li, S.; Guo, P.; Zhang, Y.; Li, W.; Wang, H.; Shi, W.; Jiang, H.; Duan, C. Research on highly efficient quality improvement process and product blending scheme for fine coal. Powder Technol. 2023, 430, 119011. [Google Scholar] [CrossRef]
  6. Wang, W.; Lu, J.; Wang, C.; Yuan, J.; Hou, X.; Pan, M.; Jiang, H.; Qiao, J.; Duan, C.; Dombon, E. Study on screening probability model and particle-size effect of flip-flow screen. Adv. Powder Technol. 2022, 33, 103668. [Google Scholar] [CrossRef]
  7. Xiong, X.; Niu, L.; Gu, C.; Wang, Y. Vibration characteristics of an inclined flip-flow screen panel in banana flip-flow screens. J. Sound Vib. 2017, 411, 108–128. [Google Scholar] [CrossRef]
  8. Gong, S.; Oberst, S.; Wang, X. An experimentally validated rubber shear spring model for vibrating flip-flow screens. Mech. Syst. Signal Process. 2020, 139, 106619. [Google Scholar] [CrossRef]
  9. Lin, D.; Ji, J.; Yu, C.; Wang, X.; Xu, N. A non-linear model of screen panel for dynamics analysis of a flip-flow vibrating screen. Powder Technol. 2023, 418, 118312. [Google Scholar] [CrossRef]
  10. Hou, X.; Wang, W.; Pan, J.; Mao, P.; Zhang, S.; Duan, C. Optimization of flip-flow screen plate based on DEM-FEM coupling model and screening performance of fine minerals. Miner. Eng. 2024, 211, 108694. [Google Scholar] [CrossRef]
  11. Wang, W.; Hou, X.; Mao, P.; Pan, M.; Yu, S.; Jiang, H.; Qiao, J.; Duan, C. Kinematic characteristics of key structures and time evolution law of material distribution characteristics during flip-flow screening. Miner. Eng. 2023, 201, 108241. [Google Scholar] [CrossRef]
  12. Zhang, X.; Wu, B.; Niu, L.; Xiong, X.; Dong, Z. Dynamic characteristics of two-way coupling between flip-flow screen and particles based on DEM. J. China Coal Soc. 2019, 44, 1930–1940. [Google Scholar]
  13. Wu, B.; Zhang, X.; Niu, L.; Xiong, X.; Dong, Z.; Tang, J. Research on sieving performance of flip-flow screen using two-way particles-screen panels coupling strategy. IEEE Access 2019, 7, 124461–124473. [Google Scholar] [CrossRef]
  14. Wang, C.; Liu, Q.; Yang, L. The MFBD-DEM coupling simulation approach for the investigation of granules screening efficiency in 4-DOF Flip-Flow Screen. Granul. Matter 2024, 26, 5. [Google Scholar] [CrossRef]
  15. Xu, N.; Yu, C.; Gong, S.; Zhao, G.; Lin, D.; Wang, X. Numerical study and multi-objective optimization of flexible screening process of flip-flow screen: A DEM-FEM approach. Adv. Powder Technol. 2022, 33, 103650. [Google Scholar] [CrossRef]
  16. Zhao, G.; Pu, K.; Xu, N.; Gong, S.; Wang, X. Simulation of particles motion on a double vibrating flip-flow screen surface based on FEM and DEM coupling. Powder Technol. 2023, 421, 118422. [Google Scholar] [CrossRef]
  17. Hamza, M.; Alwan, H. Hyperelastic constitutive modeling of rubber and rubber- like materials under finite strain. ETJ 2010, 28, 2560–2575. [Google Scholar]
  18. Dal, H.; Acikgoz, K.; Badienia, Y. On the performance of isotropic hyperelastic constitutive models for rubber-like materials: A state of the art review. Appl. Mech. Rev. 2021, 73, 020802. [Google Scholar] [CrossRef]
  19. Yang, L.M.; Shim, V.P.W.; Lim, C.T. A visco-hyperelastic approach to modelling the constitutive behaviour of rubber. Int. J. Impact Eng. 2000, 24, 545–560. [Google Scholar] [CrossRef]
  20. Cao, L.; Sadeghi, F.; Stacke, L.-E. An explicit finite-element model to investigate the effects of elastomeric bushing on bearing dynamics. J. Tribol.-Trans. ASME 2016, 138, 031104. [Google Scholar] [CrossRef]
  21. Seibert, D.J.; Schoeche, N. Direct comparison of some recent rubber elasticity models. Rubber Chem. Technol. 2000, 73, 366–384. [Google Scholar] [CrossRef]
  22. Hu, X.; Liu, X.; Li, M.; Luo, W. Selection strategies of hyperelastic constitutive models for carbon black filled rubber. Eng. Mech. 2014, 31, 34–42. [Google Scholar]
  23. Lin, C.; Chen, Y.; Lin, C.; Chang, K. Constitutive equations for analyzing stress relaxation and creep of viscoelastic materials based on standard linear solid model derived with finite loading rate. Polymers 2022, 14, 2124. [Google Scholar] [CrossRef]
  24. Gil-Negrete, N.; Vinolas, J.; Kari, L. A simplified methodology to predict the dynamic stiffness of carbon-black filled rubber isolators using a finite element code. J. Sound Vib. 2006, 296, 757–776. [Google Scholar] [CrossRef]
  25. Gong, S.; Wu, T.; Gao, Y.; Ming, P.; Zhang, J.; Zhang, Y.; Wang, X. Study on dynamic characteristics of the coupling system of flip-flow screen panel and material group based on FEM-DEM. J. China Coal Soc. 2023, 48, 381–391. [Google Scholar]
  26. Shi, H.; Wu, P. A nonlinear rubber spring model containing fractional derivatives for use in railroad vehicle dynamic analysis. Proc. Inst. Mech. Eng. Part F-J. Rail Rapid Transit 2016, 230, 1745–1759. [Google Scholar] [CrossRef]
  27. Zhu, S.; Cai, C.; Spanos, P.D. A nonlinear and fractional derivative viscoelastic model for rail pads in the dynamic analysis of coupled vehicle-slab track systems. J. Sound Vib. 2015, 335, 304–320. [Google Scholar] [CrossRef]
  28. Sjöberg, M.M.; Kari, L. Non-linear behavior of a rubber isolator system using fractional derivatives. Vehicle Syst. Dyn. 2002, 37, 217–236. [Google Scholar] [CrossRef]
  29. Zhu, H.; Yang, J.; Zhang, Y.; Feng, X. A novel air spring dynamic model with pneumatic thermodynamics, effective friction and viscoelastic damping. J. Sound Vib. 2017, 408, 87–104. [Google Scholar] [CrossRef]
  30. Wang, P.; Bai, Y.; Lin, C.; Han, X. A hybrid criterion-based sample infilling strategy for surrogate-assisted multi-objective optimization. Struct. Multidiscip. Optim. 2024, 67, 44. [Google Scholar] [CrossRef]
  31. Lu, J.; Lei, Z. Multi-objective optimization design of post-soil system for enhanced w-beam guardrail containment performance. Int. J. Crashworthiness 2023, 28, 116–126. [Google Scholar]
  32. Carvalho, É.C.R.; Carvalho, J.P.G.; Bernardino, H.S.; Lemonge, A.C.C.; Hallak, P.H.; Vargas, D.E.C. Solving multi-objective truss structural optimization problems considering natural frequencies of vibration and automatic member grouping. Evol. Intell. 2024, 17, 653–678. [Google Scholar] [CrossRef]
  33. Tong, S.; Guo, M.; Tian, Y.; Le, J.; Zhang, D.; Zhang, H. Multi-objective optimization design of scramjet nozzle based on grey wolf optimization algorithm and kernel extreme learning machine surrogate model. Phys. Fluids 2024, 36, 025104. [Google Scholar] [CrossRef]
  34. Cheng, F.; Liu, H. Surrogate model-based multi-objective optimization algorithm for train-ballast turnout system: Balancing safety and vibration damping in parameter design. Eng. Struct. 2024, 304, 117685. [Google Scholar] [CrossRef]
Figure 1. Mechanical test of screen panel samples.
Symmetry 16 00913 g001
Figure 2. Mechanical test results of screen panel samples: (a) uniaxial tension, (b) uniaxial compression, (c) plane tension.
Symmetry 16 00913 g002
Figure 3. Comparison between experiment and simulation results: (a) uniaxial tension, (b) biaxial tension, (c) plane tension, and (d) error analysis.
Symmetry 16 00913 g003
Figure 4. Stress relaxation test of screen panel: (a) experimental setup and (b) experimental data.
Symmetry 16 00913 g004
Figure 5. Comparison of simulation results of generalized Maxwell model and test data.
Symmetry 16 00913 g005
Figure 6. Establishment process of simulation model of screen panel and material group coupling system.
Symmetry 16 00913 g006
Figure 7. Stress of the screen panel versus time: (a) no loading material and (b) loading material.
Symmetry 16 00913 g007
Figure 8. Hysteresis loops of the coupling system under different loading material conditions.
Symmetry 16 00913 g008
Figure 9. Dynamic stiffness and lag angle of the screen panel with loading of different numbers of particles.
Symmetry 16 00913 g009
Figure 10. New dynamic model of an industrial VFFSs.
Symmetry 16 00913 g010
Figure 11. Flowchart used for calculating the dynamic response of the VFFSs system.
Symmetry 16 00913 g011
Figure 12. Simulation results of dynamic response of VFFS under loading material conditions: (a) x1 and (b) x2.
Symmetry 16 00913 g012
Figure 13. Dynamic response of VFFS system in frequency region: (a) x1 and (b) x2.
Symmetry 16 00913 g013
Figure 14. Dynamic response of VFFSs versus stiffness: (a) x1 and (b) x2, and versus damping: (c) x1 and (d) x2.
Symmetry 16 00913 g014
Figure 15. Phase portrait of x2 using the baseline rubber shear spring while changing (a) the rubber shear spring elastic stiffness k e , and (b) main screen frame mass m1 and floating screen frame mass m2.
Symmetry 16 00913 g015
Figure 16. Pareto optimal solution of objective functions.
Symmetry 16 00913 g016
Figure 17. Phase portraits of x2 using (a) RSS (A), (b) RSS (B), (c) RSS (C), and (d) RSS (D).
Symmetry 16 00913 g017aSymmetry 16 00913 g017b
Figure 18. The rate of change of amplitude of x2 using different RSSs caused by external conditions.
Symmetry 16 00913 g018
Figure 19. Dynamic stiffness characteristics of the baseline and optimized RSSs for different amplitudes, with angular frequency ω of the investigated VFFS being 70 rad·s−1.
Symmetry 16 00913 g019
Table 1. Parameters for third-order Ogden model.
iαiμi
12.4300−8.1590
22.79456.0753
3−1.67566.8498
Table 2. Parameters for the generalized Maxwell model.
Ngivetr−i
10.17349.4
20.1272015.6
Table 3. Parameters for the dynamic model of VFFSs [8].
SymbolParameter ValueUnit
ke−0.0031 x03 + 0.192 x02 − 4.504 x0 + 207.77N/mm
Ffmax0.0077 x03 − 0.519 x02 + 16.322 x0 − 10.547N
a2−0.0047 x02 + 0.583 x0 − 0.561mm
α0.16-
b9.9N·sɑ/mm
m14130kg
m21309kg
k13,606,700N/m
c136614N·s/m
m242.24kg
Table 4. Optimization plan for dynamic system of VFFSs.
Optimising factors: k e = 207.77 + a x 0 + b x 0 2 + c x 0 3 Optimisation variables: a , b , c Variable range: Ω = x R 3 | a , b , c 0
Objective functionEquationFunction description
Relative amplitude change rate of main float screen frame γ γ = A a A b A a
× 100 %
A a and A b are the average value of all the amplitudes of x2 in the steady state with A a = 1 n i n a i and A b = 1 n j n b j , respectively. Here, a i is the amplitude of x2 during the ith period in the steady state without external conditions changed, and b j represents the amplitude of the jth period in the steady state of x2 with external conditions changed.
Complexity of system’s motion state N N = n u m b e r ( F ) F : One-dimensional vector of resonance frequency
Table 5. NSGA-II parameters.
Population SizeSelect FunctionCrossover
Fraction
Mutation
Function
Crossover
Function
Pareto Front
Fraction
150Tournament0.8Adaptive feasibleintermediate0.20
Disclaimer/Publisher’s Note: The statements, opinions and data contained in all publications are solely those of the individual author(s) and contributor(s) and not of MDPI and/or the editor(s). MDPI and/or the editor(s) disclaim responsibility for any injury to people or property resulting from any ideas, methods, instructions or products referred to in the content.

