Abstract
Collaborative designing of service networks using multiple logistics carriers can bring advantages in both economic and environmental terms, and these carriers have symmetry in their service areas. To enable such a collaborative service network and the corresponding benefits, this study proposes a problem of collaborative service network design (CSND) considering demand uncertainty. This problem is formulated as a two-stage robust optimization model using a budget uncertainty set to handle the uncertain demand. A column-and-constraint generation algorithm is developed to accurately solve the robust model. Numerical experiments show that the proposed algorithm outperforms the Benders decomposition algorithm in terms of solving efficiency and quality. Through comparative experiments, this research validates the advantages of collaborative designing and the robustness of model solutions. In addition, three allocation mechanisms are tested to investigate the importance of allocation in CSND.
1. Introduction
Service network design (SND) is a key class of fundamental problems facing the logistics industry [1], which aims to provide consolidation carriers with an economical and efficient transportation service system. This system can satisfy the shipper’s freight demand (origin–destination demand) with high resource utilization [2]. Service network design is usually used to solve tactical planning problems in logistics operations, including the selection of service lines, the scheduling of resources (such as vehicles, ships, and drivers), and the planning of freight flow [3]. Intercity less-than-truckload (LTL) freight is a typical application of this problem, with transportation modes including road, railroad, and maritime.
Recently, the volume of LTL shipments is growing dramatically and the logistics and transportation market is facing great changes. Timely delivery and low cost have become the core requirements in the design of service networks. These new trends create stringent challenges and require significant adjustments for the logistics carriers. In this situation, it has become very difficult for logistics carriers to independently design their service network to achieve low operating costs and high service quality.
Multi-carrier alliances to design a shared service network can bring significant economic and environmental benefits for enterprises. Due to the enormous cost of trucks, cargo ships, and other resources, their low utilization results in significant waste. Through sharing and service synergies, collaborative alliances can realize the integration of freight orders from different carriers, significantly improving the efficiency and service level of logistics carriers [4]. In fact, a multi-carrier sharing of service networks through collaboration is not a new concept. As early as 1875, logistics firms engaged in maritime transportation began to hold meetings to limit inter-firm competition [5]. In 1990, Sea-Land and Maersk reached a consensus on collaboration to realize joint shipping [5]. In road LTL freight, there is also a huge application prospect for collaboration. In 2013, Henan Changtong Logistics, together with Shandong Jiayi, Anhui Dazhongyuan, and other logistics carriers, set up the Central China Logistics Alliance to realize efficient joint freight. It can be seen that the collaborative design of service networks by multiple carriers has a broad application prospect in multiple fields.
In the related research on SND, scholars have investigated it from various perspectives [2]. For example, Crainic and Rousseau studied the problem of service network design for multi-commodity, multi-transportation modes [6]. Bai et al., Lium et al., Wang and Qi considered the service network design problem under demand uncertainty [1,3,7]. Hewitt investigated the problem of flexible service network design [8]. Pedersen et al. and Andersen et al. considered the management of resources in SND [9,10]. The limitation of these studies is that they all ignored the benefits of sharing service networks among multiple carriers. To the best of our knowledge, in existing studies, only Agarwal and Ergun considered the liner-sharing problem in maritime transportation and designed the corresponding allocation mechanism based on the inverse optimization method [4,5]. In their research, the liner resources of all carriers are centralized by establishing an alliance, i.e., no liner scheduling is restricted by geography, and can provide services on any routes meeting the capacity requirements. The executing enterprise on each service route is planned using an assignment model. Summarizing the existing studies, there is no research that can be applied to scenarios where the vehicles of each carrier can only serve in a specific area in road freight, i.e., the carrier’s service areas are geographically symmetrical, and demand is uncertain. To fill this research gap, this study proposes the problem of collaborative service network design (CSND) for multiple logistics carriers considering demand uncertainty.
In the problem of CSND considering demand uncertainty, each carrier has its own service area. Freight orders whose supply and demand points are not within one carrier’s service area, which is defined as cross-regional orders, will be fulfilled through trans-shipment. Specifically, the shipments of a cross-regional order will first be transported by one carrier that has access to its supply point to an area shared by multiple carriers, and then the carrier with access to the demand point will pick up the shipments and complete the order. The interaction between vehicles of different carriers significantly increases the computational complexity of the problem CSND. To effectively solve this problem, a column-and-constraint generation (CCG) algorithm is proposed. The purpose of this study is to provide a mathematical programming model and an effective solution algorithm for the collaborative design of a service network among multiple regional logistics carriers, investigate the benefits of collaboration in SND and examine the importance of a well-designed allocation mechanism.
The contributions of this study are threefold. First, a multi-carrier collaborative service network problem considering demand uncertainty is proposed, and a two-stage robust optimization model is developed for it, where the uncertain demand is described using the budget uncertainty set. The proposed model can serve as a modeling framework for carriers to carry out the collaboration and can be extended to more practical scenarios. Second, an exact column-and-constraint generation algorithm is provided for solving the problem CSND. The proposed algorithm outperforms the Benders decomposition algorithm in efficiency and effectiveness. The algorithm can also be the basic decomposition scheme and adapt to more variants of problem SND. Finally, this paper reveals the advantages of designing a multi-carrier collaborative service network and using the robust optimization method under demand uncertainty and investigates the impact of allocation mechanisms of cost savings on the collaboration incentive of individual carriers. The findings indicate that carriers should choose suitable partners to form alliances and design specific allocation mechanisms for the CSND problem in practice.
The remainder of this paper is organized as follows. In Section 2, we review the relevant literature. In Section 3, the collaborative service network design problem (CSND) under demand uncertainty is defined, and a two-stage robust optimization formulation is introduced. In Section 4, we elaborate on the column-and-constraint generation algorithm for the CSND problem. In Section 5, we test the algorithm, investigate the advantages of collaboration and a robust optimization method, and examine the impact of the allocation of cost savings through computational experiments. Section 6 concludes this paper.
2. Literature Review
As an important part of the supply chain, SND is mainly used to solve the problem of long-distance transportation of various raw materials or finished products. Different from the network design problem, which needs to decide the facility locations, SND makes decisions on service route selection, transportation resource scheduling, and cargo flow on the basis of existing facilities. Existing studies have investigated this classical combinatorial optimization problem from a variety of perspectives. Crainic and Wieberneit provided a comprehensive review of related studies [2,11]. In this section, we provide a brief overview of the existing literature in two aspects: one is the problem of SND under deterministic environments, and the other is studies considering uncertainty.
2.1. SND in Deterministic Environment
Initially, scholars studied the SND problem in deterministic environments, and many studies focusing on service scheduling and cargo flow planning have been proposed. For example, Kim et al. considered a large-scale multimodal express parcel transportation problem [12]. This research can be applied to scenarios with a tight service time window, limited parcel sorting capacity, and a limited number of vehicles and aircraft. To efficiently solve this problem, the authors presented a solution algorithm that mixes a column-and-constraint generation technique with a heuristic method. Armacost et al. proposed a new composite variable modeling approach for the express SND problem [13]. The method is effective at improving the lower bound given by the linear relaxation model. To efficiently solve the SND problem considering fixed costs and capacity constraints, Ghamlouche et al. proposed a heuristic solution method based on the ring neighborhood structure [14]. This method improved the efficiency of solving the SND problem. Later, Ghamlouche et al. and Yaghini et al. proposed a path reconnection-based approach and a cutting plane-based neighborhood search algorithm, respectively, which further improved the algorithm performance for solving the SND problem considering fixed costs and capacity constraints [15,16]. These researchers studied the variants of the SND problem from different perspectives and provided various solving algorithms based on the characteristics of the problem, but they ignored the management and efficient utilization of resources and focused on a single carrier planning a service network within its own service area.
In addition to service scheduling and cargo flow planning, the management of assets such as vehicles and personnel also plays a key role in the efficiency and cost of the service network [2]. How to rationally allocate and reposition assets has become a major concern for enterprises and has been the focus of related research in recent years. Smilowitz et al. investigated the possibility of long-distance transportation integration in terms of both mode of transportation and service level [17]. By reasonably allocating orders that can be delayed to the transportation modes’ existing surplus capacity, this research achieved an improvement in resource utilization and a reduction in transportation costs. In contrast to the focus on integrating transportation modes, Pedersen et al. considered asset balance constraints in the design of service networks [9]. The balance constraint specifies that the number of assets entering and leaving each point during a scheduled cycle is kept equal. The inclusion of such a constraint allows for a comprehensive consideration of asset usage over multiple cycles, allowing assets to form circulation loops in the service network. In addition to the balancing constraint, Andersen et al. considered multimodal transportation and multi-fleet collaboration in SND and explored the potential of collaborative services in improving resource utilization [18]. This further expanded the research on the SND problem. For efficiently solving the SND problem considering resource balancing, Andersen et al. proposed a branch-and-bound solution algorithm, which is able to solve large-scale instances efficiently [19]. While these studies considered improving resource utilization in the SND problem from various perspectives, they all focused on the SND including a single carrier and did not consider the effects of demand uncertainty.
On the basis of resource balancing, many researchers added different practical constraints or needs to further deepen the research on the SND problem. For example, Crainic et al. added the consideration of facility capacity in the design of a service network, which limits the maximum number of resources available at each point [20]. Wang et al. investigated the SND problem by considering heterogeneous vehicles [21]. The problem requires decisions not only about service routes and cargo flows but also about the types and numbers of vehicles on the service routes. Through these studies, the authors provided some managerial insights for carriers to manage their service network. In response to the situation where the time window of some freight orders may change, Hewitt proposed a service network design problem with flexible scheduling [8]. Flexible scheduling refers to allowing carriers to change the time window of some freight orders to reduce the transportation cost of the service system. To efficiently solve these SND problems, Hewitt and Lehuédé proposed a new modeling approach for the SND problem [22]. This modeling approach can provide better linear relaxation models and effectively reduce the number of symmetric solutions compared to traditional methods. Different from these studies, Agarwal and Ergun considered the liner-sharing problem in maritime transportation, which includes multiple carriers [4,5]. By considering the different requirements, including capacity constraints, multi-type vehicle and flexible time windows, these works make SND research more closely related to practical scenarios. However, no research considered the practical need for the collaborative design of service networks by multiple carriers.
In addition to the research, where the supply points for all demands are given, some scholars have also investigated an extended service network design problem that requires deciding on the supply point for each demand, often called logistics service network design (LSND) problems. The LSND problem usually assumes that decisions are made on a multi-level network structure [23]. Dufour et al. studied the humanitarian logistics service network for a real case of humanitarian relief in East Africa in order to obtain an efficient service solution to better respond to the humanitarian crisis [24]. Belieres et al. proposed an algorithm based on Benders decomposition to accurately solve the LSND problem [23]. Later, Belieres et al. proposed a partial Benders decomposition algorithm to further improve the efficiency of solving the LSND problem [25]. The limitations of these studies are that they ignore the advantages of collaborative design and the impacts of uncertainty.
Summarizing the existing research on SND in a deterministic environment, it is found that although existing studies have investigated the service network design problem from various perspectives, only Agarwal and Ergun considered the scenario where multiple carriers jointly design the service network [4,5]. However, different from our study, the work of Agarwal and Ergun did not consider the issue that each carrier only serves a portion of the area, nor did they investigate the benefits of collaboration [4,5].
2.2. SND Considering Uncertainty
In reality, the operation of a supply chain is often affected by a variety of uncertainties, and how to reduce the impact of uncertainty on the performance of a supply chain has become a popular research direction in recent years [26,27]. In the studies of the SND problem, the ways of dealing with uncertainties are mainly categorized into two types: stochastic programming and robust optimization [28].
In the related studies on stochastic programming, Lium et al. verified the importance of taking stochastic factors into account in the SND problem [3]. By comparing the service network structure under uncertain and deterministic demand, the advantages of cargo consolidation and route sharing in dealing with uncertainty are analyzed. Based on the work of Lium et al., Bai et al. included the option of vehicle rescheduling in a stochastic programming model for the design of the service network [1,3]. The authors investigated under what circumstances vehicle rescheduling will change the network structure and the impact of vehicle rescheduling on the flexibility of a service network. This study provided a favorable guarantee for improving resource utilization. Different from these above studies focusing on the efficiency of service networks, Wang et al. investigated the exploitable value of a deterministic solution in solving the stochastic programming model of the SND problem [29]. In these studies, the authors assume that the distribution information of uncertain parameters is known while ignoring the situation where the distribution information is unknown.
In the studies of using a robust optimization method to solve the SND problem in uncertain environments, Ng and Lo developed two robust optimization models for the maritime SND problem with uncertain demand and made a comparative analysis of the two models [30]. This informed the development of robust models for future SND studies. Different from the mathematical model of Ng and Lo, Wang and Qi developed a two-stage robust optimization model for the SND problem considering multiple types of services and developed a column-and-constraint generation algorithm [31]. The experimental results show that considering multiple services can reduce the number of vehicles and the total cost of the transportation network. Later, Wang gave the corresponding two-stage robust optimization models and column-and-constraint generation algorithms for SND problems in more scenarios [7]. Facing the problem of a short-term surge in demand for express delivery brought about by online shopping festivals, Zhang and Liu conducted research on the design of an express delivery service network under demand surge [32]. Their proposed strategy involves temporarily upgrading selected terminal nodes to transfer nodes, effectively enhancing the service network’s processing capacity. Ma et al. considered the design of a cross-border multimodal container transport network and developed an uncertain programming model [33]. While these studies used the robust optimization method to deal with demand uncertainty under various scenarios, none of them considered the scenario of multi-carrier collaborative design of a service network like our research did and investigated the advantages of collaboration.
Summarizing the existing research of SND considering uncertainty, there is currently no research that investigates the design of service networks from the collaboration perspective of multiple symmetric enterprises. Our research considers the service network design under demand uncertainty from the perspective of collaboration.
3. Problem Description and Formulation
3.1. Problem Description
Multiple regional logistics carriers need to design a freight service network for fulfilling the given freight orders. These carriers exhibit symmetry in service areas, business capabilities, and other aspects. The set of carriers is denoted by K, and N is the set of all points in the network. The problem specifies that each carrier has its own vehicle resources and service area, and denotes the set of points that can be accessed by vehicles of carrier , and . A freight order consists of a supply point and a demand point , which is denoted by . Each freight order has its own delivery time window , where denotes the start available time at the supply point and denotes the deadline for the demand point. is the set of all freight orders. The goal of each logistics carrier is to complete the freight orders at the lowest possible costs.
If regional logistics carriers design their service network independently, each carrier would need to solve an SND problem. Furthermore, many freight orders involve supply and demand points that cannot be accessed by a vehicle of the same logistics carrier, and consequently, these freight orders will not be fulfilled when carriers design their network individually. If multiple logistics carriers can work together to design and operate a shared service network, it will effectively improve the transportation efficiency. For example, a freight order, for which the supply point and demand point belong to the service area of different carriers, can be transported by one carrier to a point, which can be accessed by another carrier, and then transferred by another carrier to the demand point. Through the trans-shipment method, collaborative designing of the service network can effectively enhance the ability of carriers to serve orders and achieve economies of scale. For this reason, this paper proposes a modeling framework for a collaborative design of service networks using multiple logistics carriers.
The collaborative service network design (CSND) problem can be specifically described as regional logistics carriers forming a cooperative alliance to design and share a service network. The vehicles of each carrier can only move within their own service area. Through the centralized programming method, the alliance makes decisions on service routes, resource scheduling, and cargo flow to transport cargo to the demand point within the required time window of orders. The demand for a freight order is uncertain, and the distribution function is unknown. In this study, the objective function is to minimize the worst-case total cost of the service network.
The CSND problem is defined in a directed graph , where E is the set of connected edges. The cyclic transportation planning is discretized into T equal-length time periods, and T also denotes the set of discretized time periods. Each point and connected edge in the service network has a corresponding copy at different time periods. Each edge of the service network has a fixed opening cost and a variable transportation cost, denotes the fixed opening cost of edge , and is the per unit transportation cost on edge . All carriers have the same type of vehicle with capacity Q.
Figure 1 gives an example of two logistics carriers collaboratively designing a service network, and the symmetry of carriers in a service area is clearly shown. The network consists of 4 points; the points accessible by carrier 1 are A, B, and C, and the points accessible by carrier 2 are B, C, and D. The whole transportation planning cycle is divided into 5 time periods. There are four freight orders in the service network: , , and , whose freight volumes are 10, 11, 8 and 7, and the transportation time windows are , , and , respectively. It can be seen from this figure that if two carriers do not implement joint freight transportation, order can be accomplished by any one of them, and order can only be accomplished by carrier 1, whereas orders and are unable to find a feasible service route. However, when the two carriers design the service network collaboratively, orders and can be accomplished by selecting point C as a transfer point. Through collaborative design, the carriers can effectively expand the service area of each individual and improve the resource utilization and service level with limited resources.
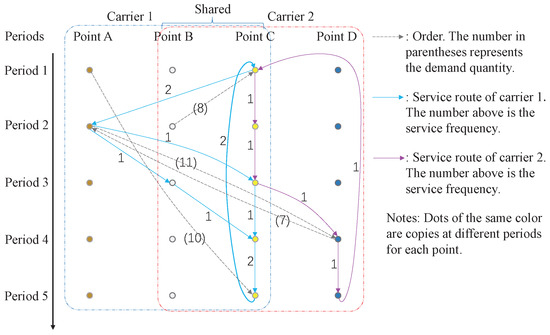
Figure 1.
Example of collaborative freight service network.
The assumptions of this research are as follows:
- Each logistics carrier has a sufficient number of homogeneous vehicles.
- The scenarios considered in this paper are less-than-truckload (LTL) freight with vehicle capacity sufficient to fulfill any freight order.
- The scheduling of vehicles needs to satisfy balanced constraints.
- Splitting is allowed for every freight order.
- Freight orders are allowed to be outsourced, and the cost of outsourcing per unit of cargo is .
3.2. Mathematical Formulation
In order to effectively deal with the effect of demand uncertainty and design a collaborative service network with good performance in any situation, this paper adopts a budget uncertainty set to handle the uncertain demand and formulates a two-stage robust optimization model. The budget uncertainty set method was proposed by Bertsimas and Sim in 2004, which is different from the previous box uncertainty and ellipsoid uncertainty methods. The box uncertainty method can give a linearized optimization model by considering all possible values of demand, but the resulting solutions are too conservative, which leads to sacrificing too much optimality. The ellipsoid uncertainty method addresses the issue of overconservatism by solving a conic quadratic problem. However, this method has a practical drawback that solving the nonlinear model demands more computational power. The budget uncertainty set method retains the advantages of the linear optimization model of box uncertainty and can regulate the degree of conservatism by adjusting the budget value [34].
In this research, the uncertain demand of freight order is defined as , with a value range of , where is the nominal value of the uncertain demand , and is its maximum deviation. In this study, only when there is a positive fluctuation in uncertain demand, it will have a negative impact on the service network system, so we only need to consider the range of fluctuation in uncertain demand as . Corresponding to the variable , denotes the degree of its fluctuation. In addition, we define the previous period of period t as . Since the period is cyclic, the value of is not always . When , .
In the two-stage robust optimization model, the first stage is to find a feasible planning of the service route and scheduling of vehicles. Based on the given service network, the second stage performs recourse operations based on demand uncertainty, i.e., cargo flow and outsourcing decisions are made and recourse costs are calculated.
The decision variables used in the two-stage decision-making are as follows.
is a positive integer decision variable, which indicates the frequency of the service provided by carrier k on edge at period t. This variable can also be understood as the number of vehicles deployed by the carrier k on edge during the period t. is a positive decision variable denoting the cargo flow of order on edge at period t. Since orders can be split, the variable does not necessarily equal the demand of order . represents the freight volume outsourced for order .
Based on the problem definition and the given decision variables, the two-stage robust optimization model formulated for the problem CSND considering demand uncertainty is as follows:
where is the recourse cost given by the second-stage optimization model . Model is as follows:
In the second-stage model RP, z is the vector consisting of all variables and is the uncertainty set. The parameter is the budget, which has values in the range of .
In this formulation, the objective function (1) is to minimize the worst-case total cost of the collaborative service network, which consists of both the opening cost of the service route and the recourse cost of the second-stage model. Constraint (2) is the design-balanced constraint, which specifies that in each period, each carrier has equal vehicle entry and exit at each point. This constraint ensures that the routes of vehicles form a closed loop in a service network, thereby avoiding the accumulation of vehicles. Constraint (3) states that the vehicles of each carrier can only visit points within their service area. This constraint indicates that each carrier can only serve its own area. The objective function (5) of the second stage is to calculate the recourse cost, which includes the transportation cost and outsourcing cost of cargo. In this research, outsourcing of cargo is allowed. Constraint (6) specifies that the total service capacity on each service route at each period has to satisfy the freight demand. In other words, the flow of cargo on each edge of each period cannot exceed the capacity of the vehicles on this edge. Constraint (7) is the cargo flow balance constraint. If a point is a supply point for order , then that point has no inflow of cargo of this order. If cargo arrive at a demand point, they will no longer flow out. If cargo reaches a point that is neither its supply point nor its demand point, then the cargo must flow out from this point. Constraint (8) ensures that the fulfillment of freight orders cannot be later than their deadlines. Constraints (4), (9), and (10) specify the range of decision variables.
There are some limitations in the above two-stage robust optimization model, and we can make some adjustments to make it applicable to more scenarios. For example, if the processing capacity of each point is limited in the network, we need to add constraint to limit the number of vehicles entering each point in each period, where is the processing capacity of point i. If carriers have a heterogeneous fleet, we need to add vehicle type set H and replace the decision variable with . indicates the number of vehicles with respect to type h deployed by the carrier k on edge during the period t, where . Consequently, the constraints (1), (2), (3), (4) and (6) need to be adjusted to reflect this change. These modifications of the two-stage robust optimization model increase the number of variables and constraints, but the algorithm will not have much difference.
According to Ben-Tal et al., even a simple two-stage robust optimization problem is NP-hard [35]. To efficiently solve the two-stage robust optimization model, our research proposes a CCG algorithm to accurately solve the design problem of a collaborative service network considering demand uncertainty. The details of the CCG algorithm are given in Section 4.
4. Algorithm Design
In the existing research, the algorithms for solving the two-stage robust optimization model mainly include two categories: approximate algorithms and exact algorithms. The exact algorithm contains two methods, one is the column-and-constraint generation (CCG) algorithm proposed by Zeng and Zhao, and the other is the Benders decomposition (BD) algorithm [36]. Compared with the BD algorithm, the CCG algorithm has a better performance when dealing with the two-stage robust optimization model. For this reason, the CCG algorithm is chosen to solve the problem of CSND considering demand uncertainty. According to the CCG algorithm, the master problem of CSND is firstly solved to obtain the optimal service scheduling, including routes and frequency. Based on the incumbent solution of the master problem, the subproblem will decide the cargo flow and the amount of outsourced freight. In this research, since outsourcing of freight orders is allowed, the subproblem is always feasible. The algorithm stops when the upper and lower bounds are equal or the gap is less than a set threshold; otherwise, the subproblem will generate the corresponding constraints and return to the master problem. In our algorithm, the Maximize–Minimize problem in the second stage is converted to a Maximize–Maximize problem by dual theory, thereby constructing the subproblem required by the CCG algorithm.
4.1. Column-and-Constraint Generation Algorithm
According to the CCG algorithm, the two-stage robust optimization model of the CSND problem is decomposed into a master problem and a subproblem. In each iteration (the number of iterations is labeled as r), based on the incumbent optimal solution of the master problem, the subproblem will find the possible worst-case combination of freight orders and return the worst-case cargo flow , the outsourcing volume and the corresponding constraints to the master problem. In the CCG algorithm, the master problem () can be specified as:
In the , the variable is the intermediate decision variable and constraints (12)∼(17) are the constraints generated by the subproblems in r iterations. The upper and lower bounds of the CSND problem are defined as and , respectively, and the optimality gap between the upper and lower bounds is . The framework of the column-and-constraint generation algorithm can be expressed as follows:
4.2. Subproblem of CCG Algorithm
Since the second-stage model is a “Maximize–Minimize” problem that cannot be solved directly, its inner minimization problem is transformed using the dual theory to reformulate the into a solvable maximization problem. Specifically, when the worst-case scenario and service frequency are given, we take the dual of the inner problem to obtain a maximization problem. Then, the second-stage model is reformulated into a “Maximize–Maximize” problem. Because the optimal solution of the dual model of the inner problem is an extreme point of its feasible region, the “Maximize–Maximize” problem can be equivalently transformed into a maximization problem. At this point, we can solve the second-stage problem directly, i.e., establish the subproblem of the CCG algorithm.
Fixed variables and , the inner minimization problem () of the second-stage model is as follows:
According to the dual theory, the dual model () of the inner problem is formulated as follows:
where , and are the dual variables corresponding to constraints (19)∼(21), respectively.
Through dual transformation, the second-stage inner programming problem is transformed into a linear maximization problem based on which the second-stage model can be equivalently transformed from a “Maximize–Minimize” problem to a maximization problem, i.e., the subproblem required by the CCG algorithm. The model is shown below:
In the second term of the objective function of model , there is a nonlinear term, which can lead to difficulties in computation. To efficiently solve the model , the method used by Wang and Qi is adopted to deal with the nonlinear terms [7]. In the linear programming, the optimal solution must exist at the vertex of the solution space. Based on this, when the budget is a positive integer, there are only two optimal values of 0 and 1 for the decision variable z. In this case, the decision variable z is equivalent to a binary variable. Based on these properties, the nonlinear term in objective (31) can be linearized by introducing a new continuous decision variable and the corresponding constraints, such that when , otherwise, . The constraints introduced are as follows:
Through the above linearization, the subproblem is reformulated into a linear programming model () that can be directly solved. is as follows:
5. Computational Experiments
In this section, the effectiveness of the CCG algorithm in solving the collaborative service network design (CSND) problem considering demand uncertainty is verified by comparing it with the BD algorithm. Based on the accurate solution of the CSND problem, the advantages of collaborative design of a service network are investigated by comparing it with the model of carriers designing their networks individually. The robustness of the proposed robust model in coping with demand uncertainty is evaluated. Moreover, three allocation mechanisms of cost-saving are tested to investigate whether a simple allocation mechanism can incentivize the carriers to participate in collaboration. All experiments were conducted on a desktop computer with an Intel Core i7-10700 2.90 GHZ and 16 GB RAM.
5.1. Instance and Parameter Settings
Since no existing data instances were available, we created six groups of instances with different settings for the CSND problem considering demand uncertainty based on the parameter settings given by Wang and Qi [7,31]. Each group includes six tables of freight orders and six cost matrices. By combining the order tables and cost matrices, we can create 36 different instances for each group of instances. The tables of freight orders contain the supply and demand points, the delivery time windows, and the nominal value of demand. The cost matrix contains information about the fixed opening costs and the transportation costs. The six groups of instances are named I1, I2, … I6. Table 1 gives the settings of each group, including the number of carriers (), the number of network points (), the number of periods (T) and the number of freight orders (#Orders).

Table 1.
Scale information of the instances.
For the experiments, the vehicle capacity Q is set to 20. The outsourcing cost per unit of cargo . The fixed opening cost is randomly generated in and the transportation cost is randomly generated in . The nominal value of each demand is randomly generated in , and the maximum deviation is equal to the product of the parameter and its nominal value, i.e., . The parameter indicates the degree of deviation of freight order. In all instances, all points of the service network are equally divided into copies. The first copy is shared by all carriers, meaning that all vehicles can access these points. The remaining copies of the point will belong to carriers in turn.
5.2. Efficiency of Algorithm
Based on instances I1∼I6, we compare the performance of the CCG algorithm and the BD algorithm in solving the problem CSND considering demand uncertainty, and the results are given in Table 2. In the solving of instances, the violation probability of robust optimization is set to 1%, the demand deviation , and the maximum running time of both algorithms is set to 1 h. Notice that the algorithms may run longer than 1 h as the algorithms will complete the current iteration before stopping when the running time reaches 1 h. Both algorithms are implemented using Java calling CPLEX 12.10. Four metrics are used to compare the two algorithms, including the average running time (T(s)) on 36 instances, the number of instances where the optimal solution is obtained (#Opt), the number of instances obtaining a feasible solution (#Fs), the average optimality gap (Gap(%)) on 36 instances and the difference in objective value between the CCG and BD algorithm (Diff(%)).
Table 2.
The performance of two algorithms on instances I1∼I6.
The experimental results show that the CCG algorithm significantly outperforms the BD algorithm in all instances, and the difference in solution results between the two algorithms can reach 56.23%. The BD algorithm finds the optimal solution for only 1 instance of I1 within the limited time, and the average optimality gap is greater than 28% on instance I1. In instances I2∼I6, the average optimality gap of the BD algorithm exceeds 60%. In contrast, the CCG algorithm can quickly obtain the optimal solutions for small-scale instances (such as for instances I1, I2, and I4). In instance I6, the CCG algorithm still performs strongly, with an average optimality gap of 3.66%, even though it only solves the optimal solution for one instance.
Moreover, it should be noted that the performance of the CCG algorithm will be impacted by the computational environment. However, fortunately, algorithm performance will be positively correlated with the computational environment. This research will not discuss this impact in detail because it cannot be covered by the algorithm itself.
5.3. Analysis of Collaboration
The numerical experiments in the previous section verified the effectiveness of the proposed CCG algorithm. Based on the favorable performance of the CCG algorithm, this section investigates the advantages of the collaborative design of a service network among multiple carriers. The experiments are based on the instances I1 (two carriers collaborate) and I4 (three carriers collaborate), and the carriers individually design the service network as the benchmark. In the carrier-alone mode, i.e., non-collaboration (NC) mode, the freight order will first be assigned to the corresponding carrier according to the area of the supply point. When the supply point is a shared point among multiple carriers, the freight order will be assigned to the corresponding carrier according to the area of the demand point. If the demand point is also a shared point, the freight order will be randomly assigned to a carrier. In this experiment, it is assumed that the penalty cost incurred when a freight order cannot be fulfilled is the same as the outsourcing cost.
5.3.1. Cost Savings of Collaboration
This section investigates the cost benefits of collaboration. Figure 2 and Figure 3 show the cost savings of collaborative design compared to the NC mode under different demand fluctuations (i.e., the parameter has different values). The results of instance I1 are given in Figure 2, and Figure 3 shows the results of instance I4. The total cost of the NC model is the sum of the costs individually designed by each carrier.

Figure 2.
The advantages of collaboration between two carriers.
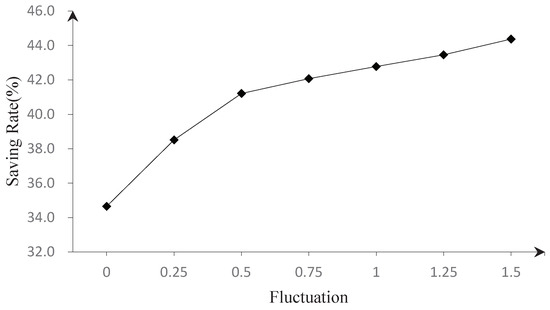
Figure 3.
The advantages of collaboration among three carriers.
The results in Figure 2 and Figure 3 indicate that under any demand fluctuation, the collaborative design of a service network by multiple carriers can lead to considerable cost savings. When the demand fluctuation is 0, i.e., the demand of freight order is determined, the cost savings brought by collaboration is relatively low. As demand fluctuation increases, the cost savings brought about by collaboration show a growing trend. When the demand fluctuation exceeds 0.5, the growth trend slows down. The reason is that the collaborative robust optimization model can utilize the synergies between carriers to design a robust service network, which can effectively cope with the impact of uncertain demand and improve resource utilization. When the demand fluctuation increases to a certain level, the structure of the collaborative service network tends to stabilize, and the benefits brought about by the synergies no longer significantly increase. Therefore, the growth trend of the cost savings slows down.
The curves of cost-saving in Figure 2 and Figure 3 all show some fluctuations. The reason is that due to the influence of network layout and data, the cost savings of collaboration caused by fluctuating growth in demand will vary at different stages. Therefore, these curves will show some volatility, but this does not affect the overall trend.
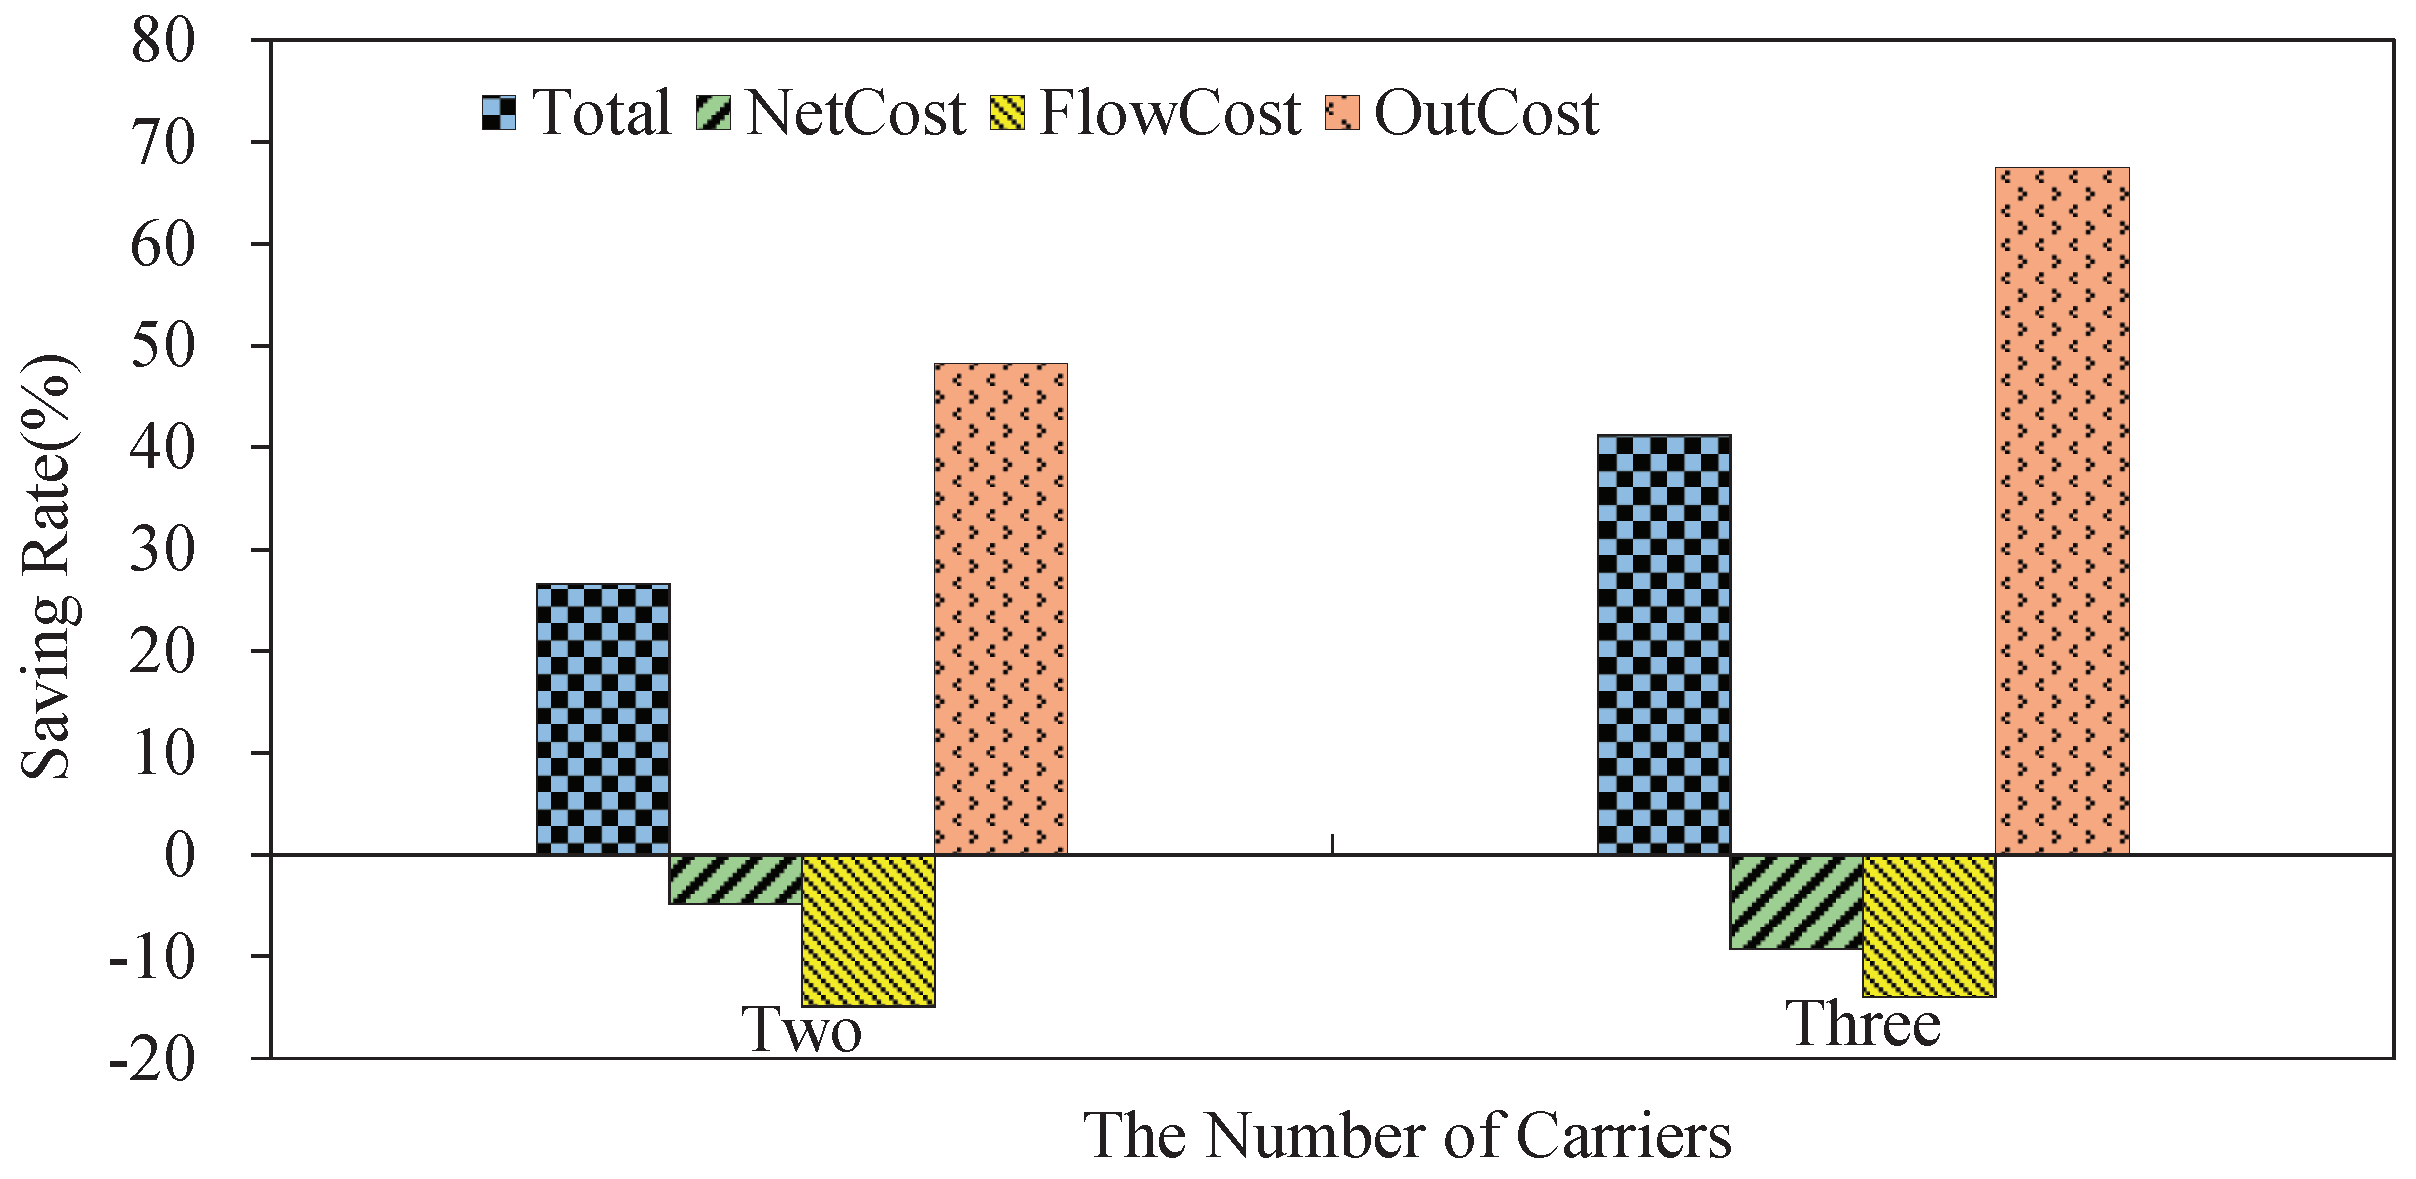
5.3.2. Composition of Cost Savings
To further investigate how collaboration reduces the total cost of the service network, we analyze the optimal solution composition of instances I1 and I4 and calculate the relative cost savings of the opening cost of service lines (NetCost), transportation cost (FlowCost), and outsourcing cost (OutCost), respectively. The results are given in Figure 4, where “Total” indicates the total cost-saving brought about by collaboration. The results show that the cost savings brought about by collaboration are mainly the reduction in outsourcing costs, while the opening cost of service lines and transportation costs will increase in the case of collaborative design. The reason is that the collaborative design of multiple carriers can effectively expand the coverage of the service network and reduce the outsourcing of freight orders. To serve the freight orders that were previously outsourced, the collaborative service network has to increase the service routes and frequency. Therefore, compared with the non-collaboration model, the collaborative design will cause an increase in the opening cost of service routes and the transportation cost, but this increase is much lower than the savings in outsourcing costs.

Figure 4.
The composition of total cost-saving.
5.3.3. Discussion
The above experiments demonstrate that the collaborative design of a service network provides a new model for logistics carriers when they are limited by factors such as investment and risk. Collaborative designing can effectively improve the resource utilization and reduce the operating costs of the service system.
5.4. Analysis of Robust Optimization
In addition to the collaboration, using robust optimization to cope with the demand uncertainty is also the focus of this study. In this section, the two-stage robust optimization model given in Section 3.2 is compared with the deterministic model to verify the advantages of robust optimization in solving the CSND problem. Based on instance I1, the experiments are carried out to investigate the differences between the two models in terms of total costs under different demand fluctuations and uncertainty budgets.
The total cost of the deterministic model is calculated as follows: firstly, the service network is designed based on the nominal demand of freight orders, and then the real cost of the network under demand uncertainty is re-evaluated. The specific calculation steps are as follows: set the demand fluctuation of all freight orders as 0, and decide the collaborative service network. Then, based on the incumbent service network, the subproblem of the CCG algorithm is called to obtain the corresponding transportation cost and outsourcing cost for the uncertain demand. The total cost of the deterministic model is the sum of the opening cost under nominal demand and the transportation and outsourcing cost generated when uncertain demand occurs. This calculation indicates that the deterministic model did not consider demand uncertainty when designing the service network but only responded when demand fluctuated.
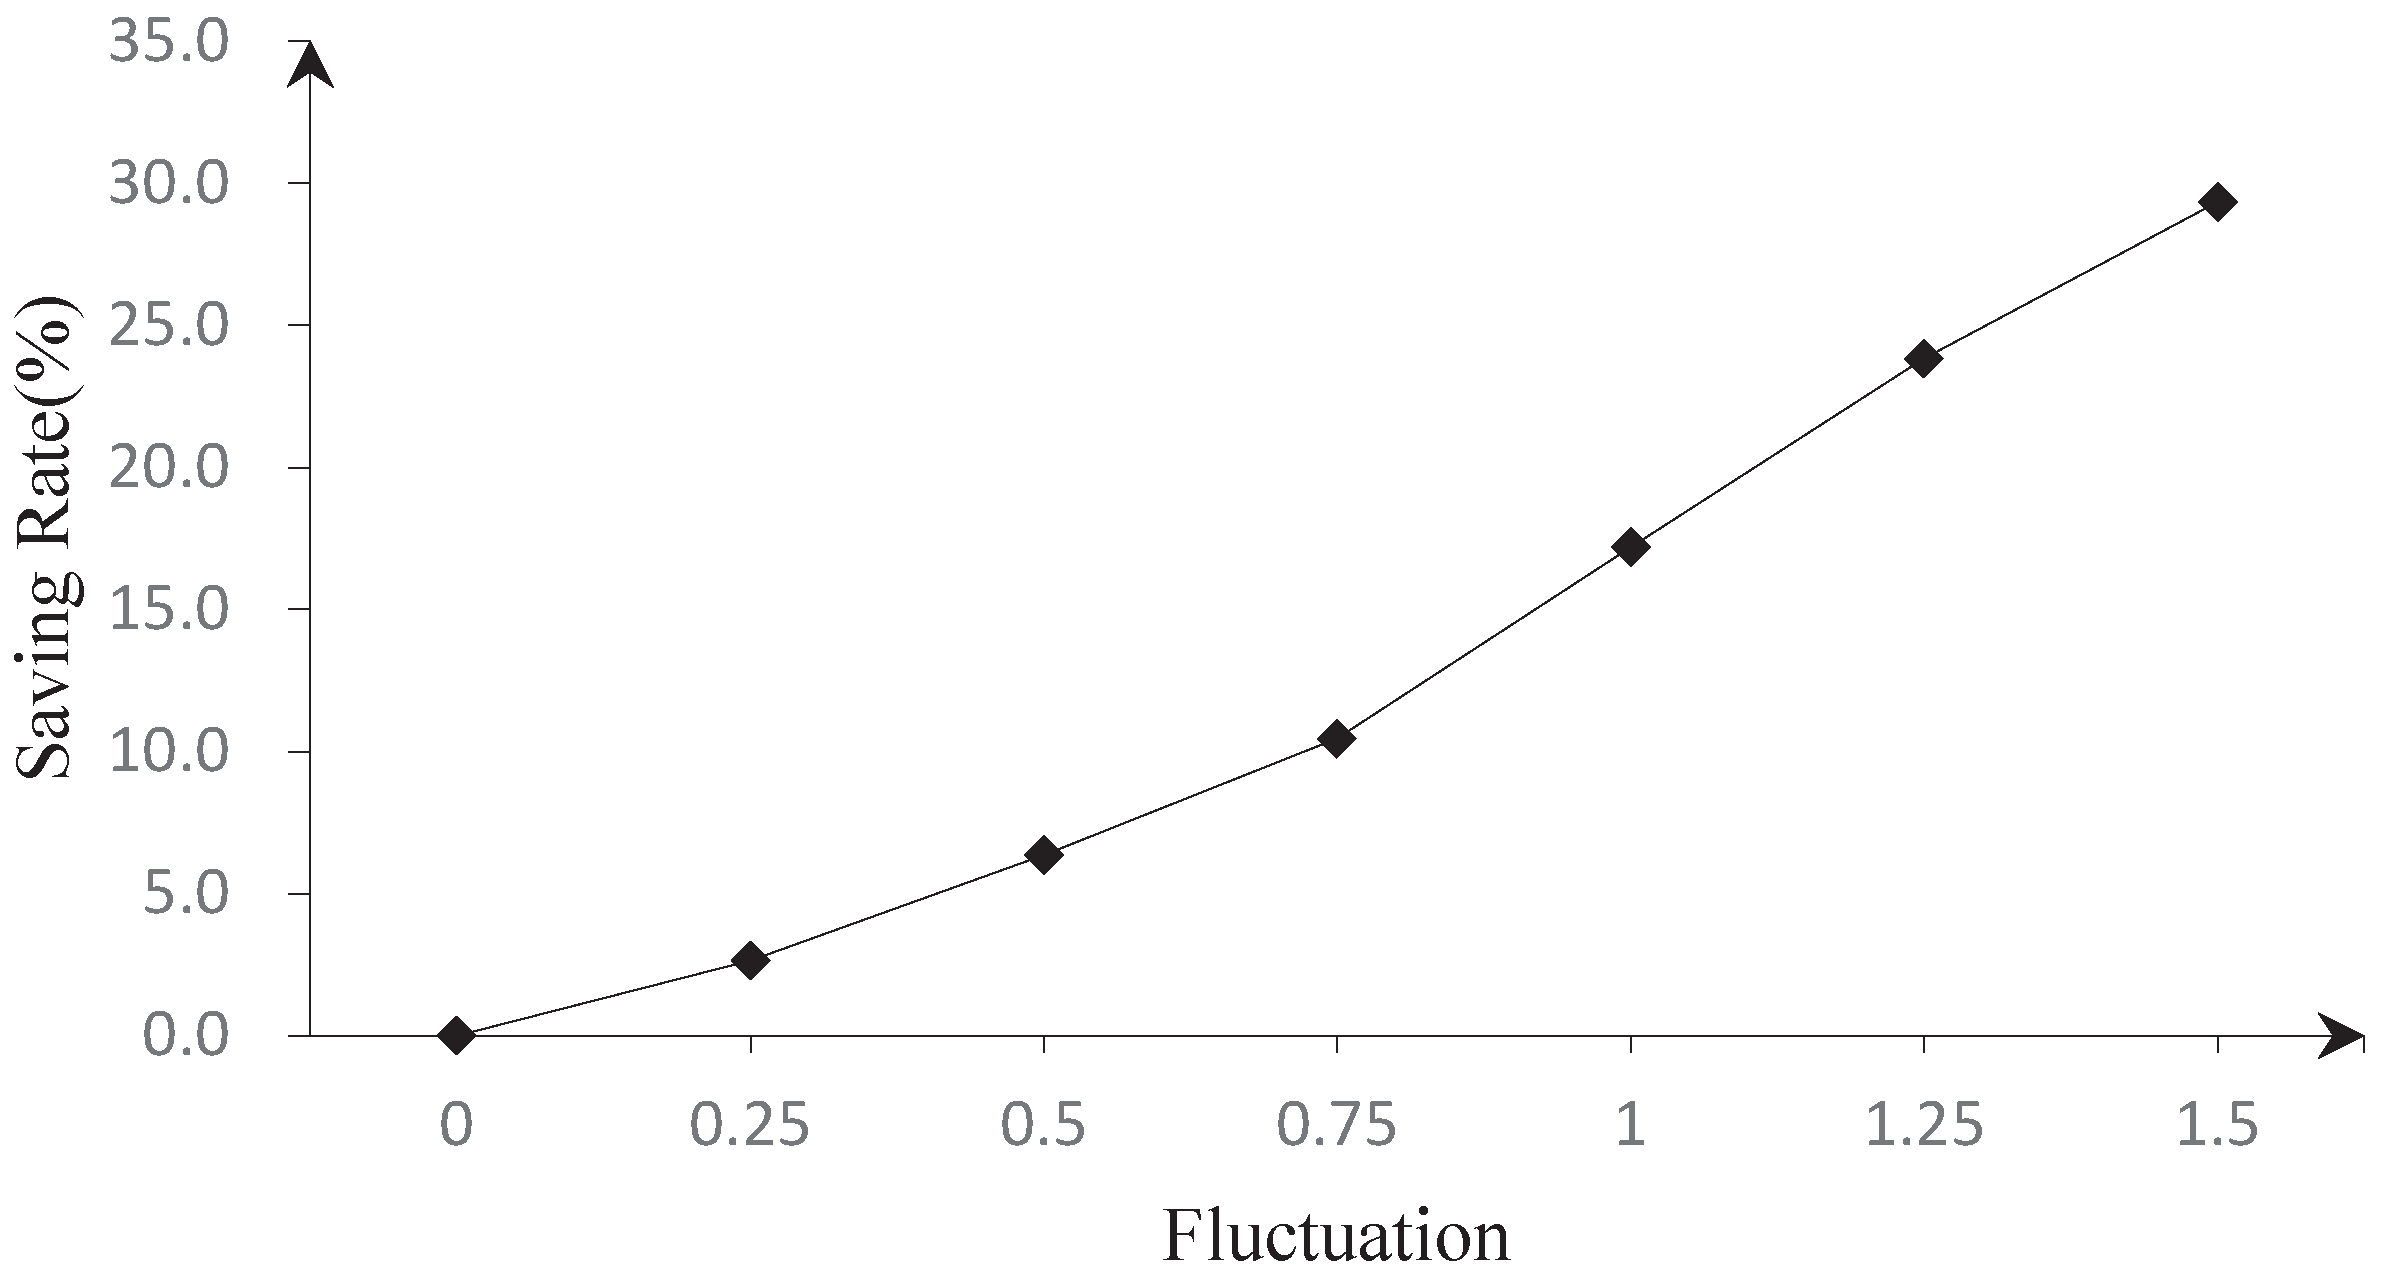
5.4.1. Advantages under Different Demand Fluctuation
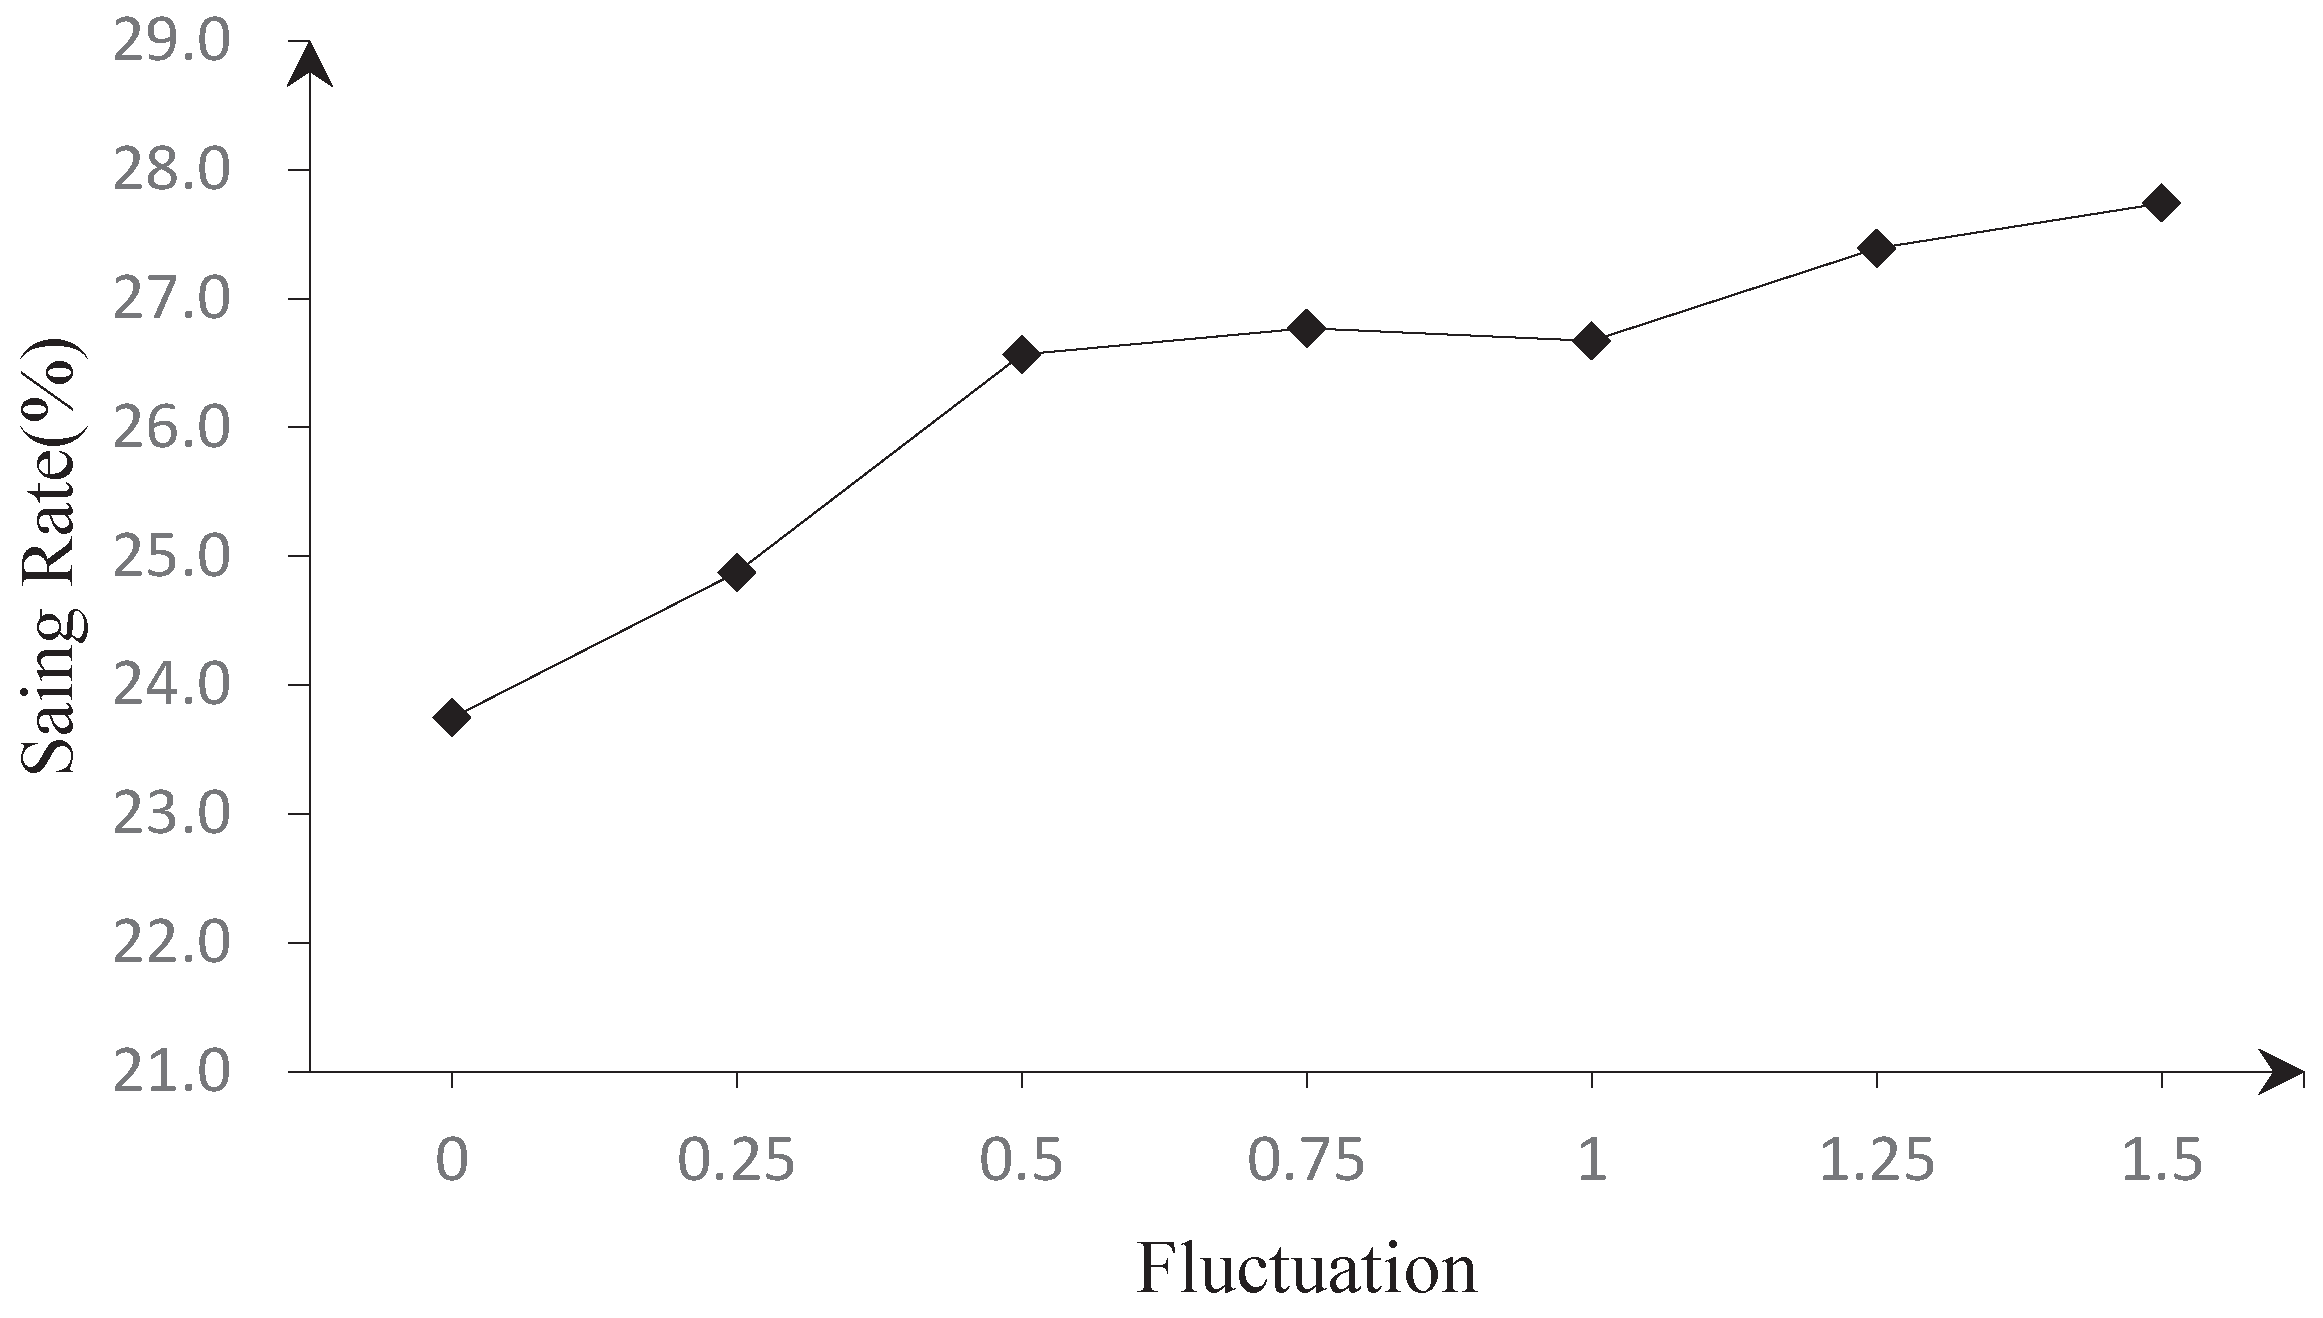
The results given in Figure 5 show the cost savings of the two-stage robust optimization model compared to the deterministic model under different demand fluctuations (demand fluctuation increasing from 0 to 1.5). The uncertainty budget in this experiment is set to 8. The results show that, compared with the deterministic model, the two-stage robust optimization model can effectively cope with the impact of demand uncertainty and reduce the total cost of freight enterprises. The cost savings brought by the robust optimization will increase with the increase in demand fluctuations. This result fully demonstrates the robustness and superiority of the solution obtained by the robust optimization model in dealing with demand uncertainty. Especially in scenarios with high demand fluctuations, it is more important for carriers to adopt robust optimization to design the service network.

Figure 5.
The advantages of robust optimization under different fluctuations.
5.4.2. Advantages under Different Uncertainty Budget
To further investigate the effects of an uncertainty budget on cost savings, Figure 6 shows the change curve of the cost-saving of the two-stage robust optimization model compared with the deterministic model when the uncertainty budget increases gradually. In this experiment, the parameter is set to 0.5. The experimental results show that the robust optimization model can effectively deal with the impact of uncertain demand and reduce freight costs under different budget settings. With the increase in the budget, the cost savings generated by the two-stage robust optimization model show an increasing trend and tend to stabilize after the budget reaches 4. The reason for this phenomenon is that when the budget value is low, the service network system believes that the probability of demand changes is small. In this case, using a robust optimization model to design a service network will not bring about large benefits. As the budget increases, the uncertainty considered in designing a service network increases, and consequently, the advantages of robust optimization in designing a service network become more obvious. When the budget increases to a certain stage, the service network obtained by robust optimization becomes sufficiently robust to cope with more uncertainty, and the network structure tends to remain unchanged. Therefore, the cost savings will tend to be stable.
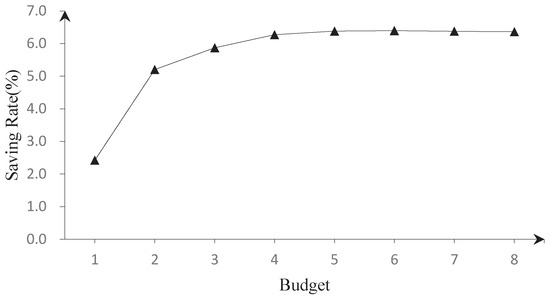
Figure 6.
The saving rate under different budgets.
5.4.3. Discussion
The curves of Figure 5 and Figure 6 all show some small fluctuations. This is because, affected by the same factors as in Figure 2 and Figure 3, the cost savings of robust optimization caused by fluctuating growth in demand or uncertainty budget may vary at different stages.
These experiments indicate that ignoring demand uncertainty in the design phase can lead to a significant increase in total costs. When the probability distribution of demand cannot be accurately obtained, decision-makers can use the robust optimization method to design a robust service network for effectively coping with the impact of uncertainty. In robust optimization, by adjusting the uncertainty budget, decision-makers can design a collaborative robust service network with different levels of conservatism.
5.5. Allocation of Cost Savings
The numerical experiments in the above sections indicate that the collaborative design of a robust service network can bring considerable cost savings for carriers. However, in addition to the cost-saving, the stability of a collaborative robust service network is also affected by the allocation of cost savings. Consequently, how to fairly allocate the cost savings for the participants is another issue worth studying. Carriers are often selfish, and their biggest motivation for joining the alliance is to achieve maximum cost reduction. Therefore, the allocation mechanism should ensure that the most attractive benefits are provided to all collaborative participants, thereby encouraging them to stay in the alliance. In cooperative game theory, the allocations in the core can ensure that the benefits provided by the grand alliance to the carriers are not less than any sub-alliance, thereby ensuring the stability of the grand alliance.
Based on instances I4 and I5, three allocation mechanisms are tested to investigate the stability of the collaborative freight services provided by multiple carriers. The three mechanisms are “Equal”, “Investment” and “Shapley” allocation mechanisms. “Equal” is an equalization method, which stipulates that the total cost-saving will be equally distributed to the alliance members. The “Investment” method allocates the total cost-saving based on the carrier’s share of the opening costs of service routes in the collaborative network. The “Shapley” method allocates the total savings based on the Shapley value. We counted the number of instances where the allocations are in the core, and the results are given in Table 3.
Table 3.
The number of instances whose allocation belongs to the core.
The results show that multi-carrier alliances are less likely to stabilize. When logistics carriers are free to choose their partners, some carriers are prone to break away from the grand alliance and form smaller ones that have greater benefits. In order to stabilize the operation of a grand alliance, the relevant authorities may consider providing appropriate economic subsidies to carriers participating in the collaboration. From the perspective of enterprises, logistics carriers carrying out collaborative activities can start with the selection of suitable partners and the design of reasonable allocation mechanisms to provide assurance for the stability of collaboration. Suitable partner selection can bring about more cost savings, while the reasonable allocation mechanism can fairly assess the contribution of each participant.
6. Managerial Implications and Theoretical Contributions
Based on a clear identification of the advantages of collaboratively designing a robust service network, this section provides managerial insights and practical implications for managers. This study proposes a novel method for the service network design under demand uncertainty and carriers that have specific service areas. A distinctive aspect of this study is that collaboration and robust optimization are simultaneously considered to improve the performance of the service network.
This work provides a set of policies for carriers to expand the market and improve their service levels through collaboration and effectively share resources with partners when their financial and resource constraints are limited. It is advised to collaboratively design the robust service network using robust optimization methods when the demand is uncertain and its distribution information is not known. This research indicates that robust optimization can effectively mitigate the impacts of uncertainty and decrease the operation costs in the CSND problem.
Moreover, carriers should select suitable partners and design reasonable allocation mechanisms when collaborating. If the allocation is not stable and carriers belong to one parent company, carriers can consider applying for subsidies to enable the parent company to achieve cost savings. Perhaps, at some point, carriers could consider applying for compensation from government agencies, since collaboration is beneficial to the community.
In summary, constructing a collaborative robust service network can enhance the performance of the freight service network and bring about benefits for carriers.
7. Conclusions
Collaborative designing of a service network under demand uncertainty by multiple symmetric logistics carriers can effectively integrate resources, improve resource utilization, and reduce the impact of uncertain demand on a service system. In this study, a model for the collaborative design of a service network considering demand uncertainty is proposed. To efficiently solve this problem, a two-stage robust optimization model is formulated, and an exact CCG algorithm is implemented. The numerical experiments show that the CCG algorithm is significantly superior to the BD method in efficiency and effectiveness.
The analysis of the advantages of collaboration and robust optimization shows that the collaborative design of a service network by multiple symmetric carriers can effectively reduce the total cost of a service network, and the cost-saving generated by the collaboration will increase with the increase in demand fluctuation. The robust optimization method can take the demand uncertainty into account in the design stage, so as to design a robust and resilient service network.
Cost-saving allocation is an important factor affecting the stability of a collaborative service network. The experimental results show that a simple allocation mechanism cannot provide a stable allocation for the CSND problem. In practice, we can ensure the stability of collaboration from aspects such as economic subsidies, selection of suitable partners, and reasonable allocation mechanisms.
In future research, we can incorporate the selection of resource types in the design of collaborative service networks. Due to the varying capabilities and costs of different types of resources, a reasonable selection of resource types can effectively reduce the total cost of collaborative service networks. Considering the carbon emissions of a collaborative service network is also a good research direction. We can investigate how the structure of a collaborative service network will change when considering carbon emissions.
Author Contributions
Conceptualization, Q.Z., M.H. and H.W.; methodology, Q.Z. and M.H.; software, Q.Z.; validation, Q.Z., M.H. and H.W.; resources, M.H.; data curation, Q.Z.; writing—original draft preparation, Q.Z.; writing—review and editing, Q.Z., M.H. and H.W.; supervision, M.H.; project administration, M.H.; funding acquisition, M.H. All authors have read and agreed to the published version of the manuscript.
Funding
This work is supported by the NSFC Key Supported Project of the Major Research Plan Grant No. 92267206; the NSFC Grant No. 62032013; the Liaoning Revitalizing Talent Program No. XLYC2202045.
Data Availability Statement
The process of generating data has been provided in the article, and further inquiries can be directed to the corresponding author.
Conflicts of Interest
The authors declare no conflicts of interest.
References
- Bai, R.; Wallace, S.W.; Li, J.; Chong, A.Y.L. Stochastic service network design with rerouting. Transp. Res. Part B Methodol. 2014, 60, 50–65. [Google Scholar] [CrossRef]
- Crainic, T.G. Service network design in freight transportation. Eur. J. Oper. Res. 2000, 122, 272–288. [Google Scholar] [CrossRef]
- Lium, A.G.; Crainic, T.G.; Wallace, S.W. A study of demand stochasticity in service network design. Transp. Sci. 2009, 43, 144–157. [Google Scholar] [CrossRef]
- Agarwal, R.; Ergun, Ö. Network design and allocation mechanisms for carrier alliances in liner shipping. Oper. Res. 2010, 58, 1726–1742. [Google Scholar] [CrossRef]
- Agarwal, R.; Ergun, Ö. Ship scheduling and network design for cargo routing in liner shipping. Transp. Sci. 2008, 42, 175–196. [Google Scholar] [CrossRef]
- Crainic, T.G.; Rousseau, J.M. Multicommodity, multimode freight transportation: A general modeling and algorithmic framework for the service network design problem. Transp. Res. Part B Methodol. 1986, 20, 225–242. [Google Scholar] [CrossRef]
- Wang, Z.; Qi, M. Robust service network design under demand uncertainty. Transp. Sci. 2020, 54, 676–689. [Google Scholar] [CrossRef]
- Hewitt, M. The flexible scheduled service network design problem. Transp. Sci. 2022, 56, 1000–1021. [Google Scholar] [CrossRef]
- Pedersen, M.B.; Crainic, T.G.; Madsen, O.B. Models and tabu search metaheuristics for service network design with asset-balance requirements. Transp. Sci. 2009, 43, 158–177. [Google Scholar] [CrossRef]
- Andersen, J.; Crainic, T.G.; Christiansen, M. Service network design with asset management: Formulations and comparative analyses. Transp. Res. Part C Emerg. Technol. 2009, 17, 197–207. [Google Scholar] [CrossRef]
- Wieberneit, N. Service network design for freight transportation: A review. OR Spectr. 2008, 30, 77–112. [Google Scholar] [CrossRef]
- Kim, D.; Barnhart, C.; Ware, K.; Reinhardt, G. Multimodal express package delivery: A service network design application. Transp. Sci. 1999, 33, 391–407. [Google Scholar] [CrossRef]
- Armacost, A.P.; Barnhart, C.; Ware, K.A. Composite variable formulations for express shipment service network design. Transp. Sci. 2002, 36, 1–20. [Google Scholar] [CrossRef]
- Ghamlouche, I.; Crainic, T.G.; Gendreau, M. Cycle-based neighborhoods for fixed-charge capacitated multicommodity network design. Oper. Res. 2003, 51, 655–667. [Google Scholar] [CrossRef]
- Ghamlouche, I.; Crainic, T.G.; Gendreau, M. Path relinking, cycle-based neighbourhoods and capacitated multicommodity network design. Ann. Oper. Res. 2004, 131, 109–133. [Google Scholar] [CrossRef]
- Yaghini, M.; Karimi, M.; Rahbar, M.; Sharifitabar, M.H. A cutting-plane neighborhood structure for fixed-charge capacitated multicommodity network design problem. INFORMS J. Comput. 2015, 27, 48–58. [Google Scholar] [CrossRef]
- Smilowitz, K.R.; Atamtürk, A.; Daganzo, C.F. Deferred item and vehicle routing within integrated networks. Transp. Res. Part E Logist. Transp. Rev. 2003, 39, 305–323. [Google Scholar] [CrossRef]
- Andersen, J.; Crainic, T.G.; Christiansen, M. Service network design with management and coordination of multiple fleets. Eur. J. Oper. Res. 2009, 193, 377–389. [Google Scholar] [CrossRef]
- Andersen, J.; Christiansen, M.; Crainic, T.G.; Grønhaug, R. Branch and price for service network design with asset management constraints. Transp. Sci. 2011, 45, 33–49. [Google Scholar] [CrossRef]
- Crainic, T.G.; Hewitt, M.; Toulouse, M.; Vu, D.M. Service network design with resource constraints. Transp. Sci. 2016, 50, 1380–1393. [Google Scholar] [CrossRef]
- Wang, Z.; Qi, M.; Cheng, C.; Zhang, C. A hybrid algorithm for large-scale service network design considering a heterogeneous fleet. Eur. J. Oper. Res. 2019, 276, 483–494. [Google Scholar] [CrossRef]
- Hewitt, M.; Lehuédé, F. New formulations for the scheduled service network design problem. Transp. Res. Part B Methodol. 2023, 172, 117–133. [Google Scholar] [CrossRef]
- Belieres, S.; Hewitt, M.; Jozefowiez, N.; Semet, F.; Van Woensel, T. A Benders decomposition-based approach for logistics service network design. Eur. J. Oper. Res. 2020, 286, 523–537. [Google Scholar] [CrossRef]
- Dufour, É.; Laporte, G.; Paquette, J.; Rancourt, M.È. Logistics service network design for humanitarian response in East Africa. Omega 2018, 74, 1–14. [Google Scholar] [CrossRef]
- Belieres, S.; Hewitt, M.; Jozefowiez, N.; Semet, F. Meta partial benders decomposition for the logistics service network design problem. Eur. J. Oper. Res. 2022, 300, 473–489. [Google Scholar] [CrossRef]
- Ulutaş, A.; Kiridena, S.; Shukla, N.; Topal, A. A New Fuzzy Stochastic Integrated Model for Evaluation and Selection of Suppliers. Axioms 2023, 12, 1070. [Google Scholar] [CrossRef]
- Niu, K.; Liu, J.; Wang, Y. Research methodology: Application of railway luggage and package transportation scheme formulation based on a dynamic time–space service network. Symmetry 2019, 11, 1226. [Google Scholar] [CrossRef]
- Xiang, X.; Fang, T.; Liu, C.; Pei, Z. Robust service network design problem under uncertain demand. Comput. Ind. Eng. 2022, 172, 108615. [Google Scholar] [CrossRef]
- Wang, X.; Crainic, T.G.; Wallace, S.W. Stochastic network design for planning scheduled transportation services: The value of deterministic solutions. INFORMS J. Comput. 2019, 31, 153–170. [Google Scholar] [CrossRef]
- Ng, M.; Lo, H.K. Robust models for transportation service network design. Transp. Res. Part B Methodol. 2016, 94, 378–386. [Google Scholar] [CrossRef]
- Wang, Z.; Qi, M. Service network design considering multiple types of services. Transp. Res. Part E Logist. Transp. Rev. 2019, 126, 1–14. [Google Scholar] [CrossRef]
- Zhang, X.; Liu, X. A two-stage robust model for express service network design with surging demand. Eur. J. Oper. Res. 2022, 299, 154–167. [Google Scholar] [CrossRef]
- Ma, J.; Wang, X.; Yang, K.; Jiang, L. Uncertain programming model for the cross-border multimodal container transport system based on inland ports. Axioms 2023, 12, 132. [Google Scholar] [CrossRef]
- Bertsimas, D.; Sim, M. The price of robustness. Oper. Res. 2004, 52, 35–53. [Google Scholar] [CrossRef]
- Ben-Tal, A.; Goryashko, A.; Guslitzer, E.; Nemirovski, A. Adjustable robust solutions of uncertain linear programs. Math. Program. 2004, 99, 351–376. [Google Scholar] [CrossRef]
- Zeng, B.; Zhao, L. Solving two-stage robust optimization problems using a column-and-constraint generation method. Oper. Res. Lett. 2013, 41, 457–461. [Google Scholar] [CrossRef]


Disclaimer/Publisher’s Note: The statements, opinions and data contained in all publications are solely those of the individual author(s) and contributor(s) and not of MDPI and/or the editor(s). MDPI and/or the editor(s) disclaim responsibility for any injury to people or property resulting from any ideas, methods, instructions or products referred to in the content. |
© 2024 by the authors. Licensee MDPI, Basel, Switzerland. This article is an open access article distributed under the terms and conditions of the Creative Commons Attribution (CC BY) license (https://creativecommons.org/licenses/by/4.0/).