Article

Expressions for Stress Concentration Factors for T-Joints of Hollow and Concrete-Filled Square Cross-Sections for In-Plane Axial and Bending Loads

by
Liyong Gao
1,2,
Lei Jiang
3,*,
Xingzheng Wang
1,2,
Sheng Gao
1,2,
Hongxu Cui
1,2,
Jun Liu
4 and
Hekuan Zhou
5
1
Shandong Expressway Infrastructure Construction Co., Ltd., Jinan 250014, China
2
Shandong Hi-Speed Talent Development Institute, Jinan 250101, China
3
School of Highway, Chang’an University, Xi’an 710064, China
4
Henan Jiaotou Jiaozheng Expressway Co., Ltd., Zhengzhou 450016, China
5
Henan Province Highway Engineering Bureau Group Co., Ltd., Zhengzhou 450052, China
*
Author to whom correspondence should be addressed.
Symmetry 2024, 16(8), 1082; https://doi.org/10.3390/sym16081082
Submission received: 12 June 2024 / Revised: 29 July 2024 / Accepted: 9 August 2024 / Published: 21 August 2024
(This article belongs to the Section Engineering and Materials)

Abstract

:
In recent years, square hollow section (SHS) joints with concrete-filled square hollow section (CFSHS) chords have increasingly been used in truss bridges where the fatigue life reliability is a critical issue. In this paper, a finite element analysis was performed to investigate the SCFs in SHS-CFSHS T-joints under in-plane bending in the brace, axial force in the chord and in-plane bending in the chord. The finite element models were developed and validated with experimental results. Then a parametric study was conducted with a reasonable range of three key non-dimensional parameters, i.e., β (width ratio between brace and chord), 2γ (width–to–wall thickness ratio of the chord) and τ (wall thickness ratio between brace and chord). Consequently, the stress concentration factor formulae for the fatigue design of SHS-CFSHS T-joints were proposed through multiple regression analysis. For in-plane bending in the brace, the maximum stress concentration factors were found at lines B and C for thick-walled chords (2γ = 25.0), while the stress concentration factors at all the lines need to be checked for thin-walled chords (2γ < 16.0). Under axial force in the chord and in-plane bending in the chord, only stress concentration factors at lines C and D needed to be considered. A comparison of stress concentration factors between SHS-SHS and SHS-CFSHS joints showed reductions of 10~26% and 14~31% in stress concentration factors in SHS-CFSHS joints under axial force in the brace and in-plane bending in the brace, respectively. In addition, it showed a general increase in stress concentration factors in SHS-CFSHS joints under axial force and in-plane bending in the chord. This reduction is attributed to the reduction in chord face deformation benefiting from the in-filled concrete. Meanwhile, the stress concentration factors caused by loads in the chord are much lower than those caused by loads in the brace. This work complements earlier studies on SHS-CFSHS T-joints under axial force.

1. Introduction

Tubular structures are widely used in offshore and onshore structures, owing to their excellent structural properties and aesthetic shape. Previous research has been carried out on the fatigue behavior of empty welded tubular joints and this has been reported by van Wingerde et al. [1,2,3,4], Packer et al. [5], Mashiri et al. [6], Chiew et al. [7,8], Morgan et al. [9,10], Matti and Mashiri [11] and Shao [12] among others. The fatigue cracks of welded tubular joints are commonly initiated in the intersection of chord and brace due to high stress concentrations at the weld toes. High stress concentrations are principally caused by notch effects at the intersection and shell bending stress, resulting from the face deformation for square hollow section (SHS) joints and the ovalization for circular hollow section (CHS) joints. As the latest fatigue design approach, the hot spot stress method has been adopted by different design guides (IIW [13], EC3 [14], CIDECT [15]). The hot spot stress method applies the stress concentration factor (SCF), which is the ratio between maximum stress at the weld toe and the applied nominal stress, taking the degree of stress concentration into account.
One of the effective methods to reduce the stress concentrations in the chord is suppressing the face deformation and ovalization through concrete-filling of the chord. So far, the tubular truss structures with concrete-filled chords have been increasingly used in construction, especially in the truss bridges, as reported by Liu et al. [16]. A review of the current literature indicated that the concrete-filled welded tubular joints have the lower SCFs and a longer fatigue life compared with the corresponding empty welded tubular joints [17,18,19,20,21,22,23,24,25,26,27,28]. Chen et al. [17,18] performed experiments on CHS T-, Y-, K- and KT-joints with concrete-filled circular hollow section (CFCHS) chords and compared SCFs determined from the test results against predictions from existing formulae for empty tubular joints. It was found the predictions from those formulae were too conservative. Similar conclusions were drawn by Wang et al. [19] for CHS-CFCHS T-joints in that CHS-CFCHS T-joints had much lower SCFs and consequently a higher fatigue life than CHS-CHS T-joints. Udomworarat et al. [20,21] pointed out that in-filled concrete reduced the SCFs at the intersection position and better fatigue strength was obtained based on the tests on CHS-CFCHS K-joints. For the design purpose, very limited SCF formulae were proposed for only a few types of joints through finite element (FE) analysis. Kim et al. [22] presented the formulae to derive the SCFs of CHS-CFCHS N-joints under axial force in the brace. Tong et al. [23,24] established the SCF formulae of CHS-CFSHS T-joints corresponding to typical load conditions (axial tension and in-plane bending in the brace, axial force and in-plane bending in the chord). Unfortunately, there are no systematic design formulae to calculate the SCFs of SHS-CFSHS joints.
Typically used tubular sections in offshore structures are circular hollow sections. However, square hollow sections are easier to connect, which is attributed to only the straight cuts essentially required at the member end preparation. Therefore, they are well-suited for application in onshore structures, just as for truss bridges and high-rise buildings. Jiang et al. [29,30], Matti and Mashiri [31] and Lan et al. [32] have focused on the fatigue behavior of concrete-filled steel tubular joints using square or rectangular hollow sections. In an earlier paper, Jiang et al. [33] have proposed the SCF formulae for SHS-CFSHS T-joints subjected to axial force in the brace, based on the multiple regression analysis of FE results. In this paper, analogous FE models were established and validated, to carry out the parametric analysis on SHS-CFSHS joints subjected to in-plane bending in the brace, axial force in the chord and in-plane bending in the chord. Later, the corresponding SCF formulae were proposed through multiple regression analysis on numerous FE results to supplement the fatigue design method of SHS-CFSHS T-joints. Finally, the comparisons between SCFs on SHS-CFSHS joints predicated by proposed formulae and SHS-SHS joints calculated by CIDECT formulae were made.

2. Hot Spot Stress

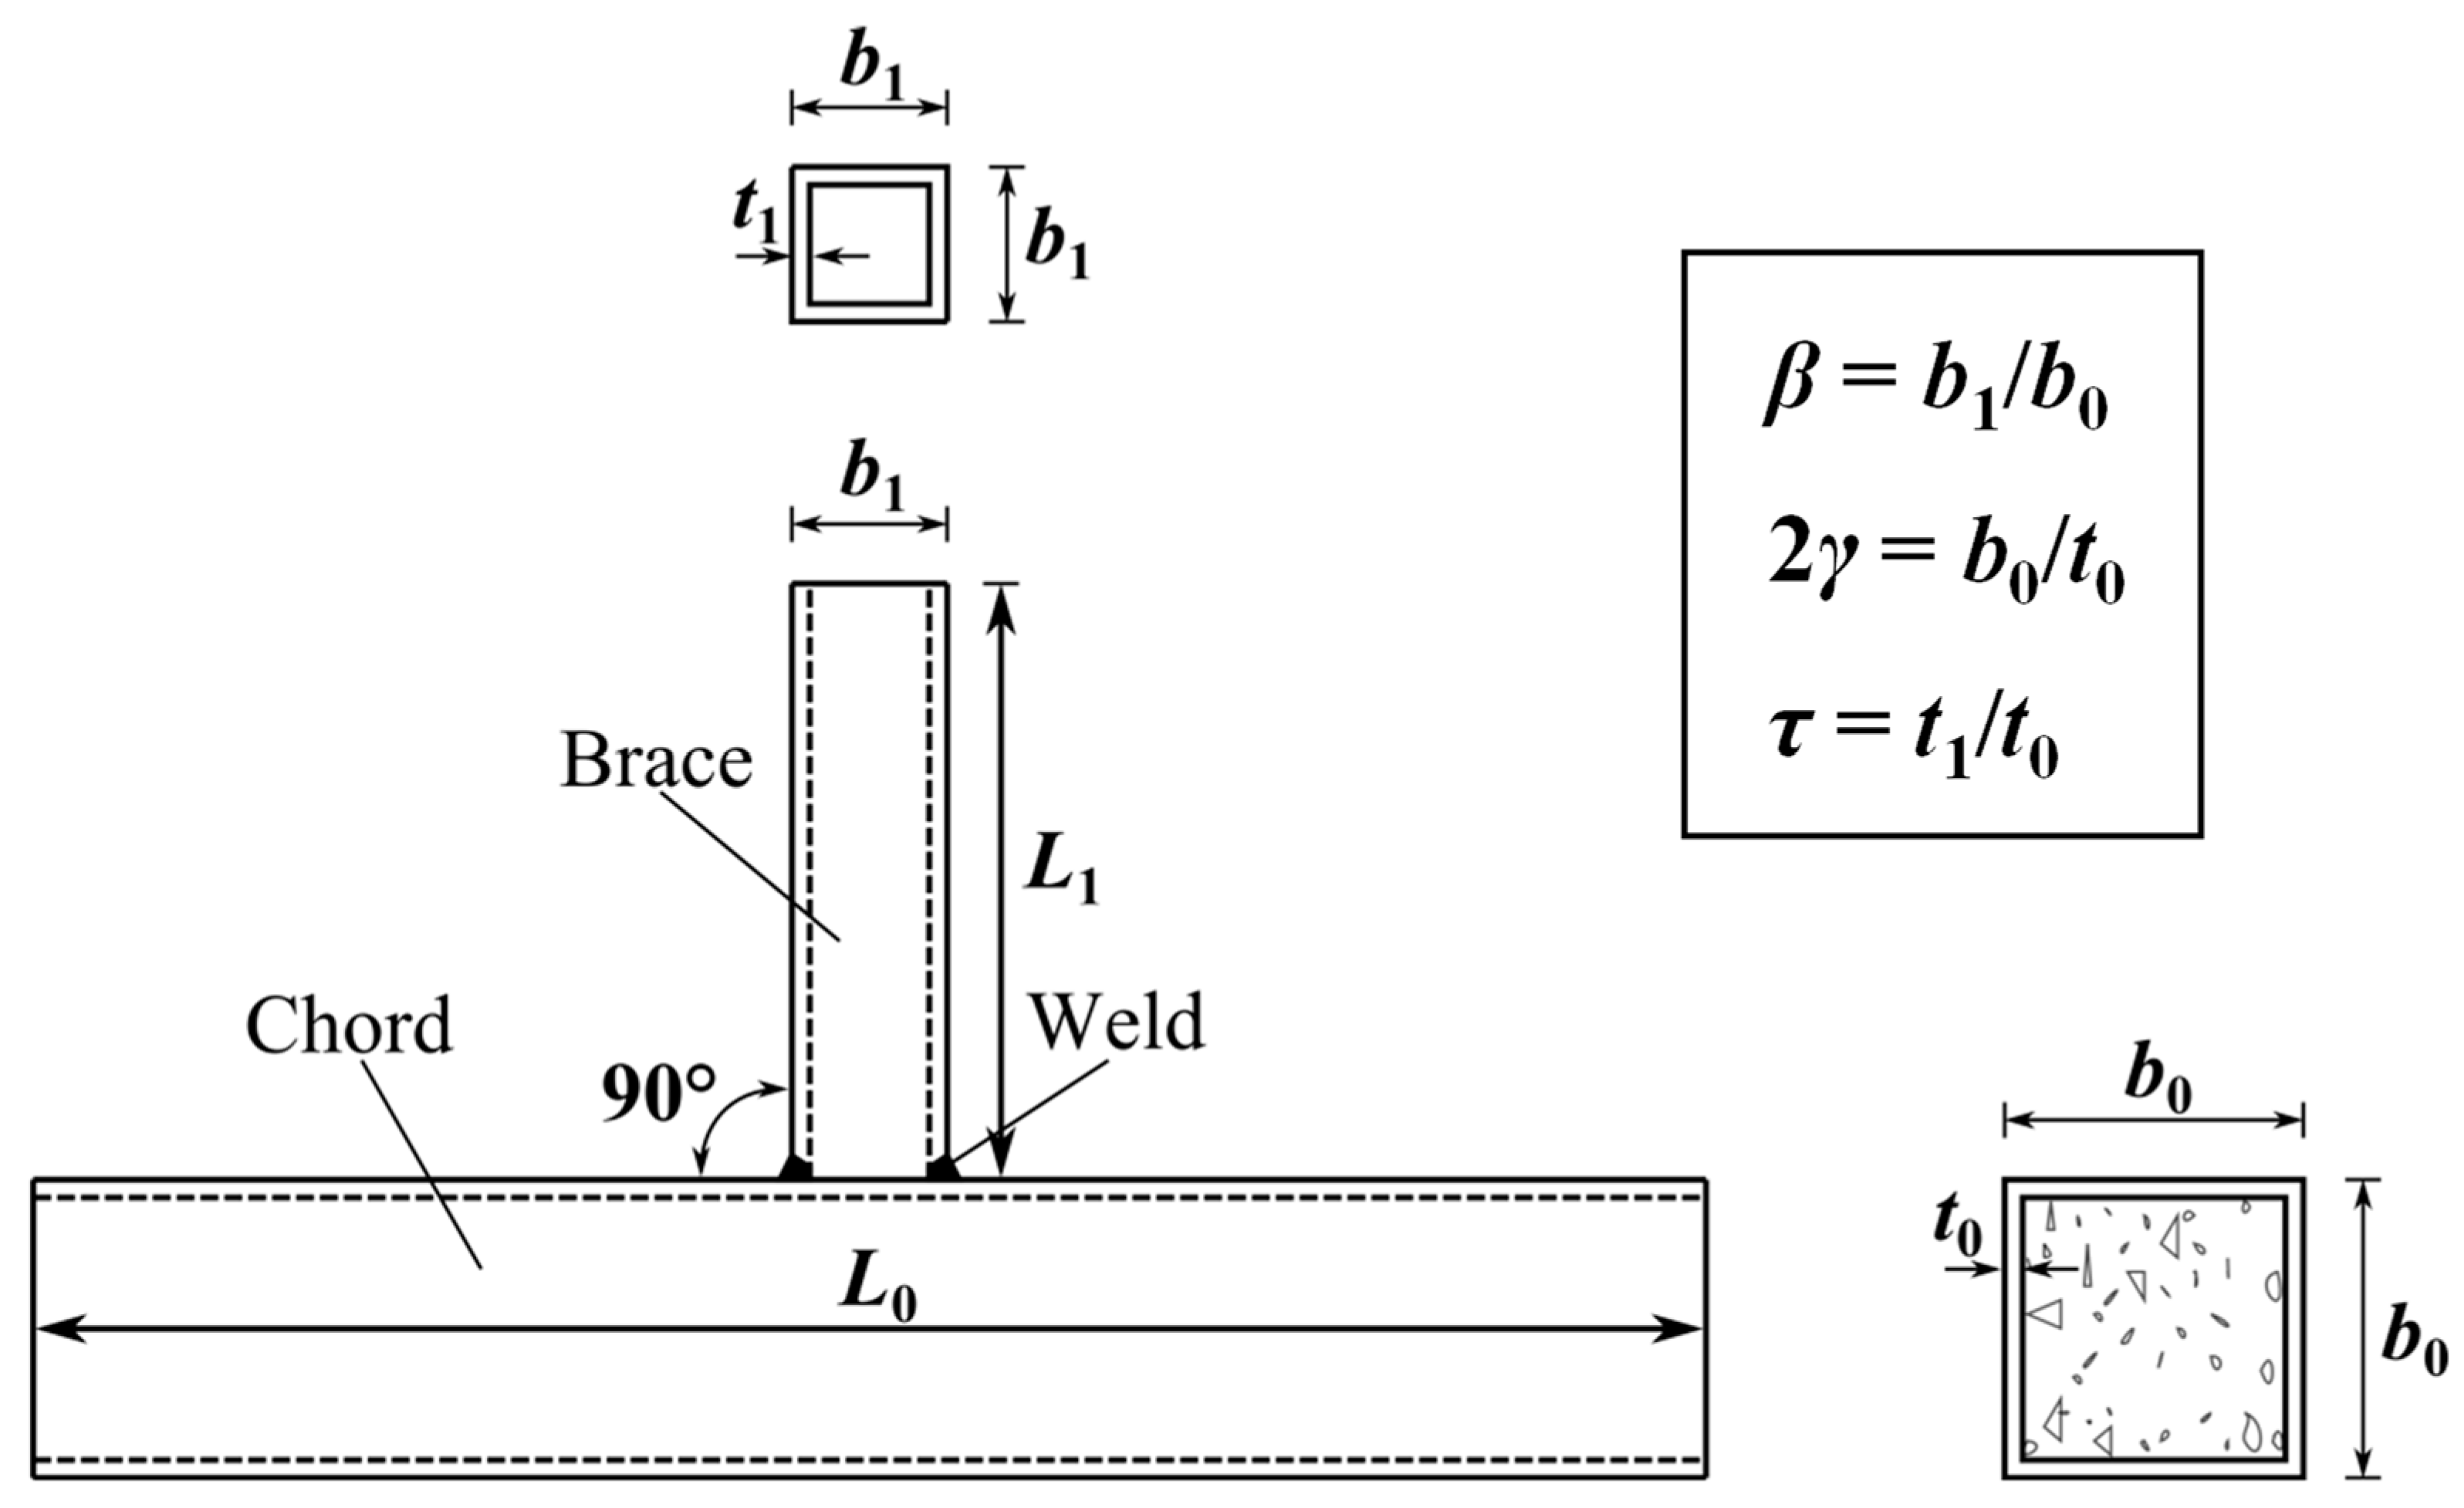
2.1. Geometrical Details of T-Joints
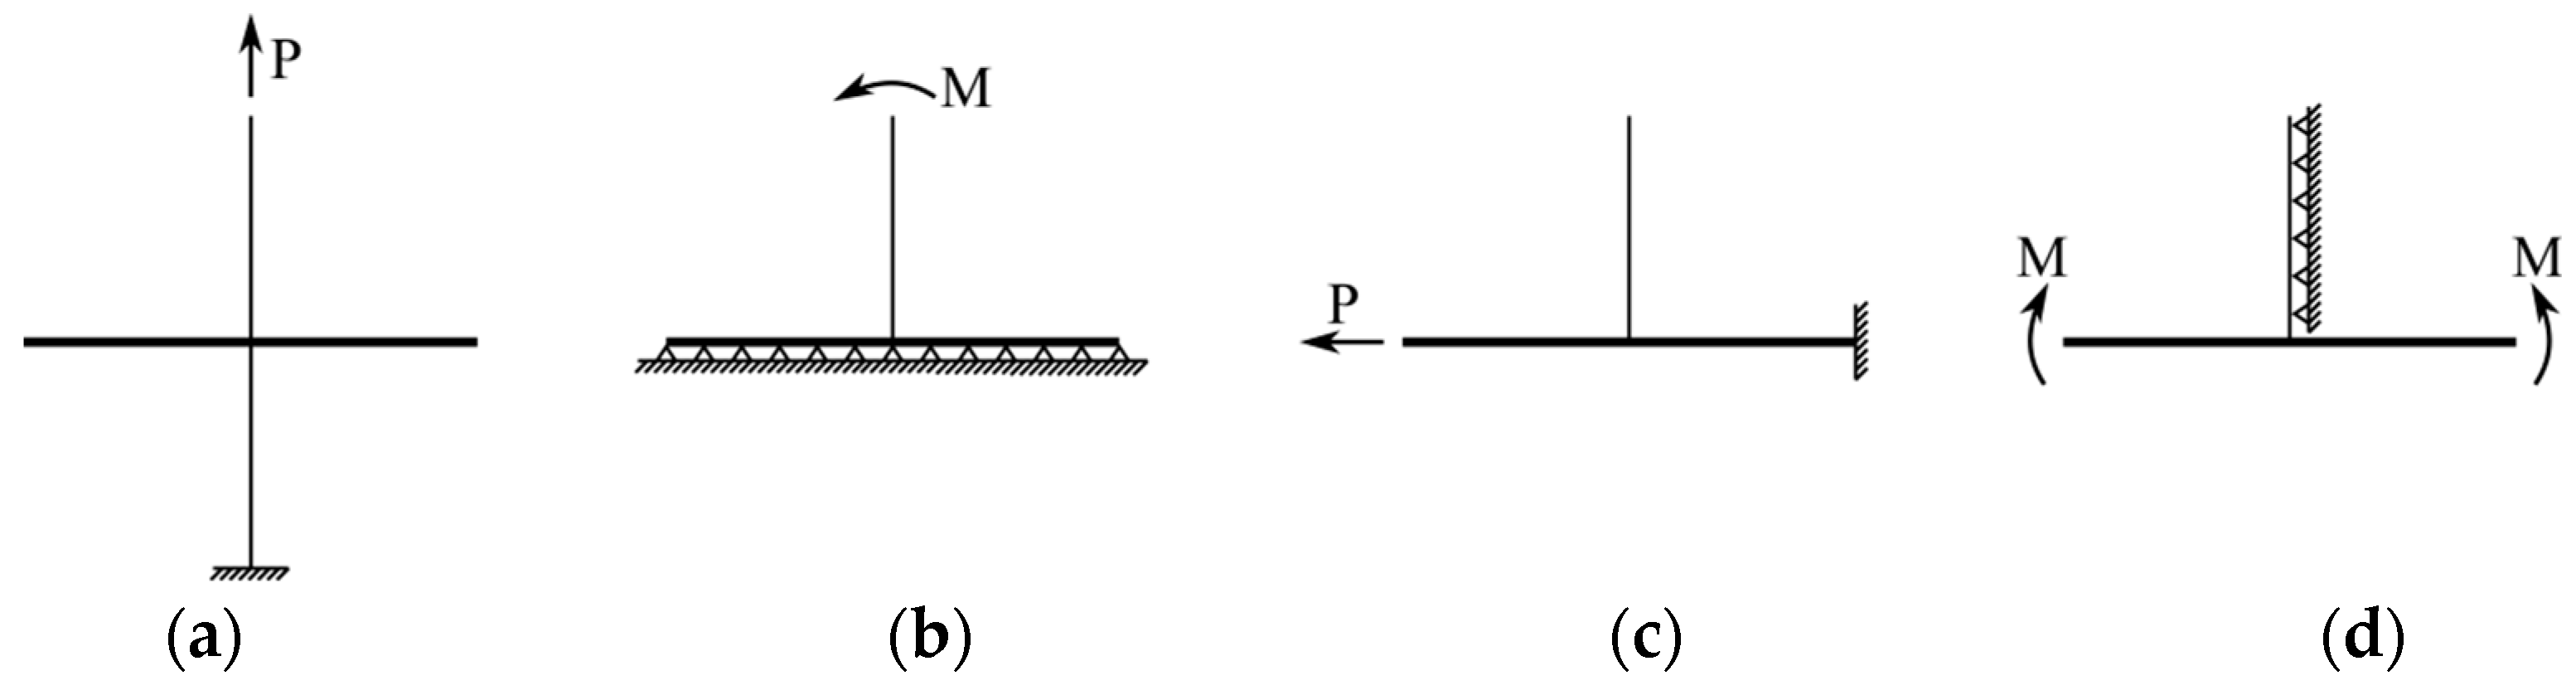
In current design guides, the same SCF formulae are specified for both T-joints and X-joints [15]. Accordingly, only SHS-CFSHS T-joints were employed in this research. The hot spot stress method considers stress-raising effects, involving the effects related to the non-dimensional geometrical parameters and load cases, but excluding the influence of fabrication such as the configuration of the welds and the local condition of the weld toes. Thus, non-dimensional geometrical parameters and load cases were selected in the parameter analysis. The definitions of geometrical parameters are illustrated in Figure 1. L0 and L1 are the length of chord and brace; b0 and b1 are the sectional width of chord and brace; and t0 and t1 are the wall thickness of chord and brace. Three principal non-dimensional geometrical parameters affecting the SCFs of SHS-CFSHS T-joints were defined as the width ratio between brace and chord β = b1/b0, the width–to–wall thickness ratio of the chord 2γ = b0/t0, and the wall thickness ratio between brace and chord τ = t1/t0.

2.2. Load Cases

For the joints in practical applications, the combined load can be isolated into four basic load cases: axial force in the brace, in-plane bending in the brace, axial force in the chord and in-plane bending in the chord. The hot spot stress at one location under one basic load case is the result of the nominal stress caused by this basic load multiplying the relevant SCF. Consequently, SCFs for any arbitrary loading combination can be estimated by superposing SCFs at the same location under different basic load cases, as follows:
σ h = σ n , A B S C F A B + σ n , I B S C F I B + σ n , A C S C F A C + σ n , I C S C F I C
where σh is the hot spot stress, σn,AB is the nominal axial stress in the brace, σn,IB is the nominal in-plane bending stress in the brace, σn,AC is the nominal axial stress in the chord and σn,IC is the nominal in-plane bending stress in the chord. SCFAB, SCFIB, SCFAC and SCFIC are the relevant SCFs.
It should be noted that the above equations are only valid for linear elastic analysis.

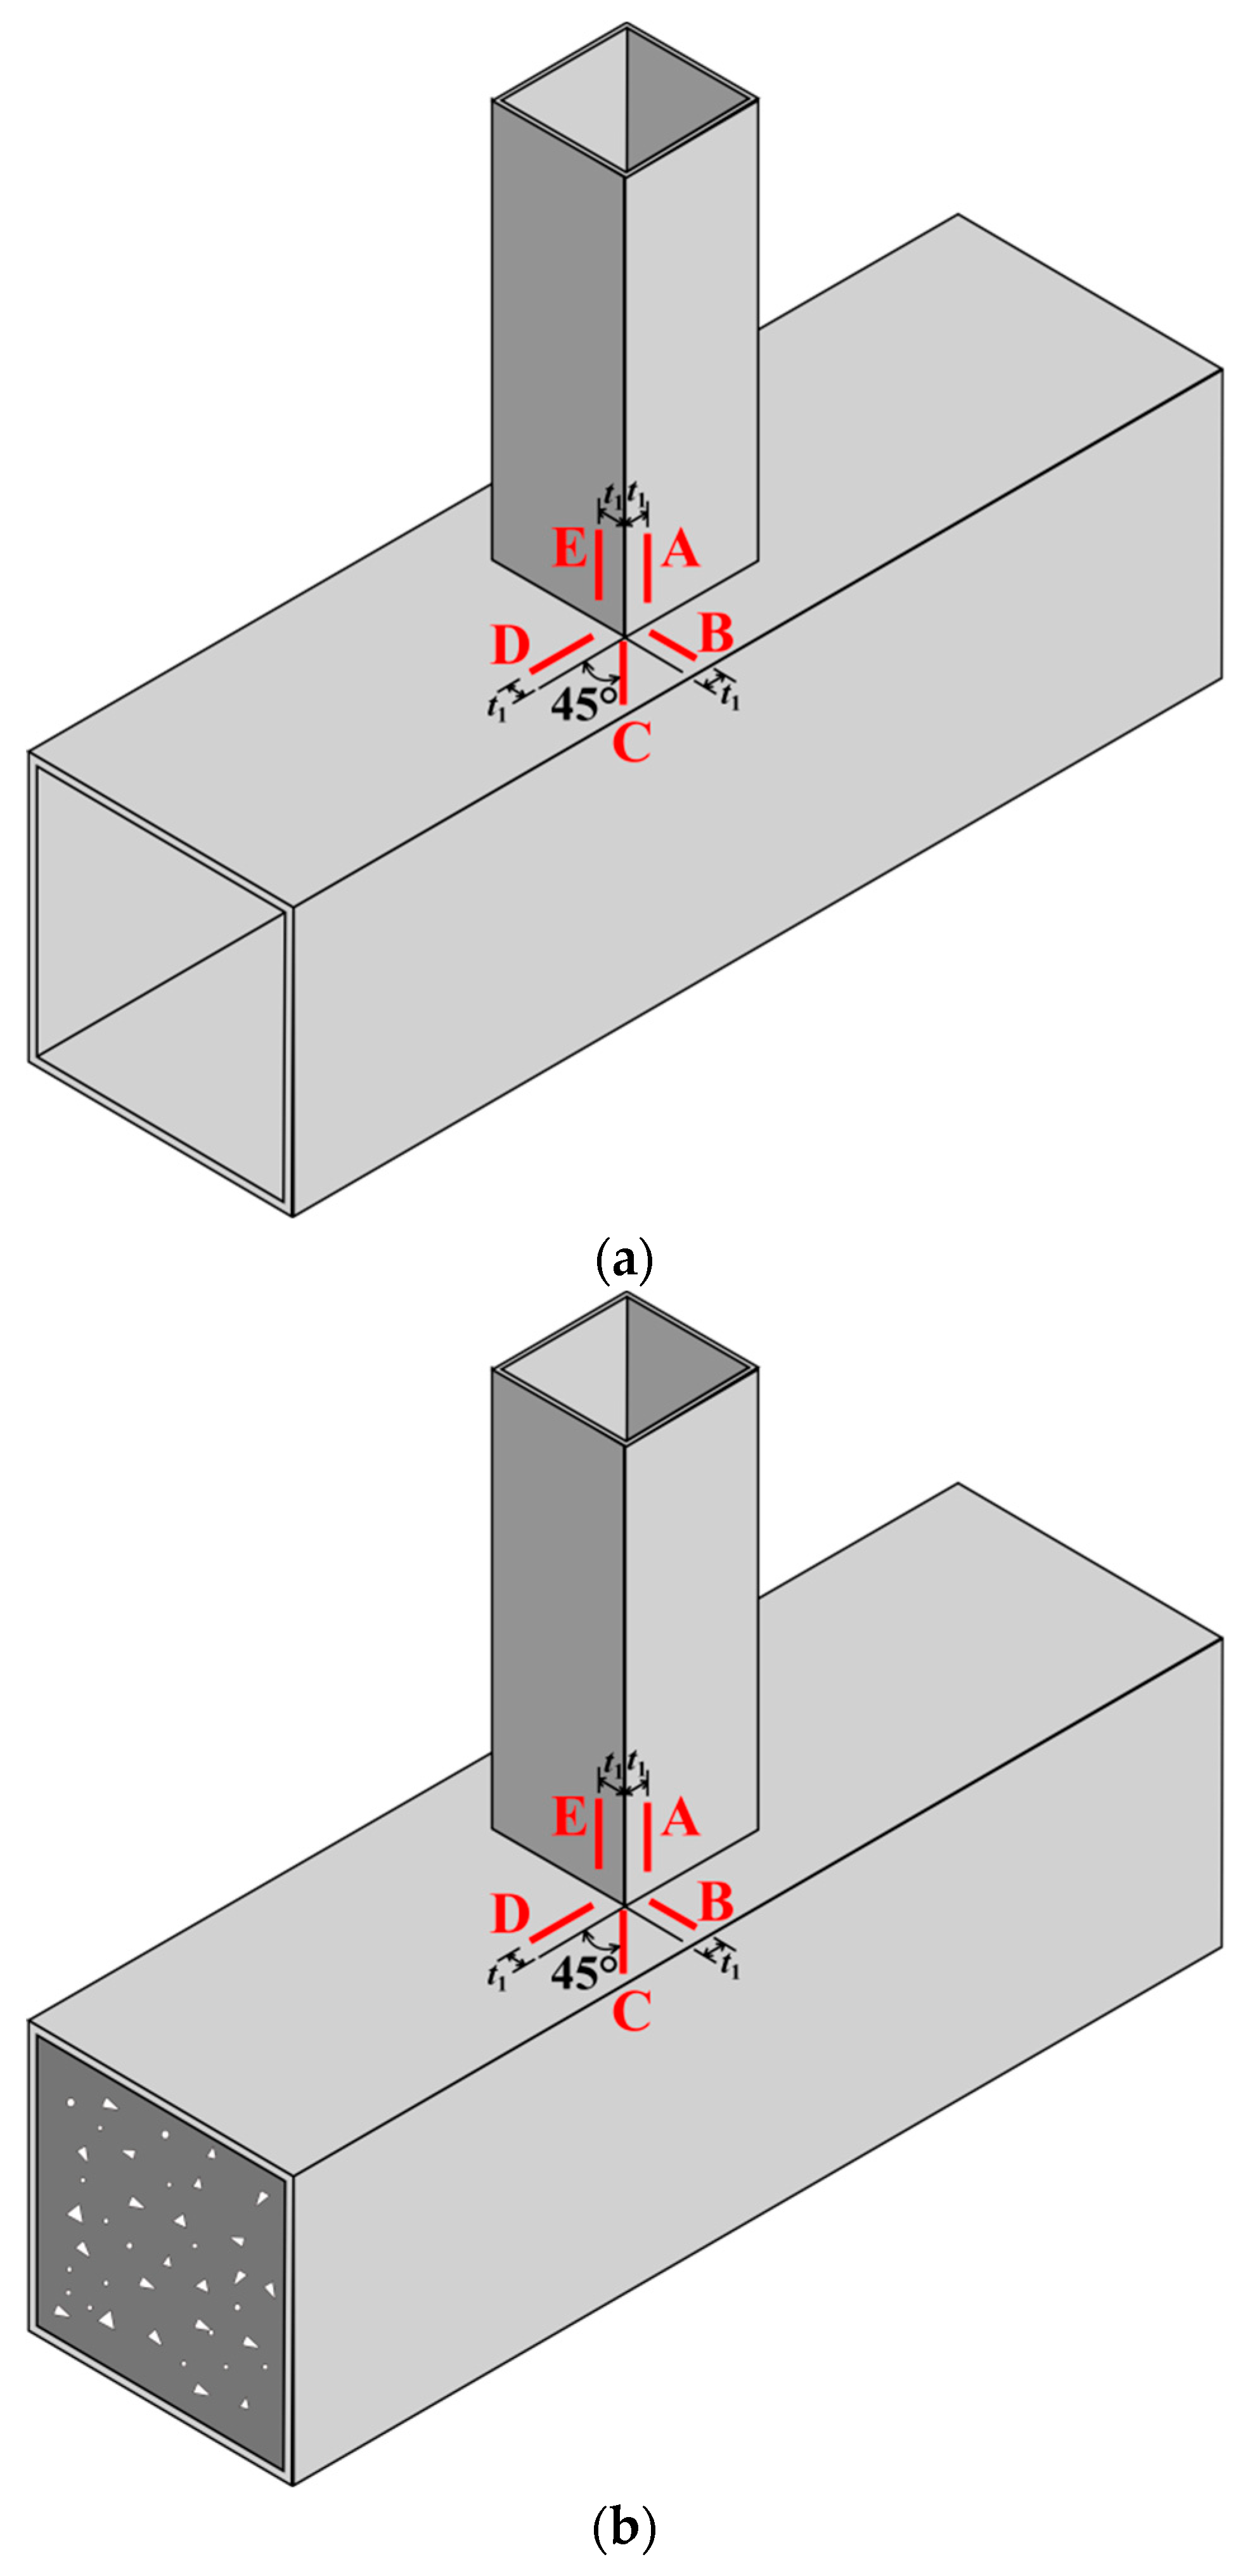
2.3. Hot Spot Locations

The local stresses at weld toes of empty SHS joints have been extensively studied, and in consequence, two brace locations (A, E) and three chord locations (B, C and D) at each corner of the intersection were assumed as hot spots (Figure 2a). With the FE analysis of SHS-CFSHS joints in this study, the same hot spot locations were identified, as shown in Figure 2b. In order to exclude local stress concentrations due to fabrication, a quadratic extrapolation method was adopted for evaluating SCFs.

2.4. Brief Introduction about SCFs in SHS-CFSHS Joints Subjected to Axial Force in the Brace

Due to the in-filled concrete, the inward deformation of square hollow section chords is restricted, resulting in lower SCFs. For the axial force in the brace, joints are more prone to fatigue failures under tension. In the previous paper, Jiang et al. [33] mainly focused on the SCFs on the 90° SHS-CFSHS joints subjected to axial tension in the brace. A series of 80 numerical models with β = 0.40~1.00, 2γ = 12.50~25.00 and τ = 0.25~1.00 were carried out, and consequently SCF formulae were given as follows:
Line A in the brace:
S C F A = 0.870 + 3.533 β 2.585 β 2 × 2 γ 2.372 3.380 β + 2.143 β 2 × τ 0.002 + 0.374 β
Line E in the brace:
S C F E = 0.143 + 0.429 β + 0.224 β 2 × 2 γ 2.276 2.205 β + 0.547 β 2 × τ 0.297 + 0.425 β
Line B in the chord:
S C F B = 0.131 0.095 β 0.052 β 2 × 2 γ 1.512 + 0.734 β 0.343 β 2 × τ 0.927 0.128 β
Line C in the chord:
S C F C = 0.069 + 0.537 β 0.526 β 2 + 0.0005 × 2 γ × 2 γ 2.205 1.566 β + 1.161 β 2 × τ 0.774 + 0.047 β
Line D in the chord:
S C F D = 0.108 0.241 β + 0.150 β 2 × 2 γ 0.934 + 3.324 β 2.651 β 2 × τ 0.918 0.314 β

3. Finite Element Model and Validation

3.1. Establishment of Finite Element Models

Three-dimensional FE models were established using the FE package ABAQUS. Since estimated SCFs are based on material elasticity and small deformation, both material nonlinearity and geometrical nonlinearity were neglected. Specifically, Young’s modulus of 2 × 10⁵ MPa and Poisson’s ratio of 0.283 were assigned to steel tubes and welds; the Young’s modulus of in-filled concrete was referred to the Chinese standard GB50010-2010 [34] according to the strength grade and a Poisson’s ratio of 0.167 was assigned. For the engineering application, the normally used concrete of C50 with the Young’s modulus of 3.45 × 10⁴ MPa was used. As argued by van Wingerde [1], the weld geometries had obvious influences on SCFs, and thereby should be modeled. The profiles and geometries of welds were assigned as prescribed in the Chinese standard GB50661-2011 [35], as illustrated in Figure 3. The weld parameters are shown in Table 1. The parameters of ω0 and ω1 were used to deflect the weld dimensions.
In consideration of the high requirements of accuracy, convergence and computational cost, three-dimensional 20-node solid elements with an integration scheme of 2 × 2 × 2 (C3D20R) were employed for the steel tube, weld profile and in-fill concrete. The refined mesh was configured near the weld junction, because it was the concerned region from which to derive accurate data for extrapolating hot spot stress. Meanwhile, the coarse mesh was configured for the concrete and steel tube except for the refined region to save computational time, which has negligible effects on hot spot stresses. The mesh size recommended in Feng et al. [36] and Choo et al. [37] was employed. Two layers of solid elements were configured across the wall thickness for thin-walled tubular members with b0/t0 > 20 for chord and b1/t1 > 20 for brace. Four layers of solid elements were configured across the wall thickness for thick-walled tubular members with b0/t0 ≤ 20 for chord and b1/t1 ≤ 20 for brace. The FE model of a SHS-CFSHS T joint is illustrated in Figure 4.
Owing to the symmetry in the geometries, boundary and loading conditions, only half of the SHS-CFSHS T joint was expected to create, as shown in Figure 4. The displacements perpendicular to the symmetry plane of all the nodes on the plane were restrained. As previously mentioned, the SCFs under different basic load cases needed obtaining, and then the superposition as in Equation (1) was used to estimate the total SCFs under combined loads. The load conditions for different basic load cases without the interaction effects of other load cases were employed in the models as shown in Figure 5. Axial force and the in-plane bending moment was applied on the brace and chord, respectively, which generated 1 MPa nominal stress distribution on the brace and chord. Consequently, the magnitude of directly measured hot spot stress was equal to the magnitude of SCFs.
A general “hard contact” with Coulomb friction was employed to simulate the contact at steel-concrete interface. A friction coefficient of 0.3 was assigned. The cohesion at steel-concrete interface was not considered, because the cohesive strength was relatively low.

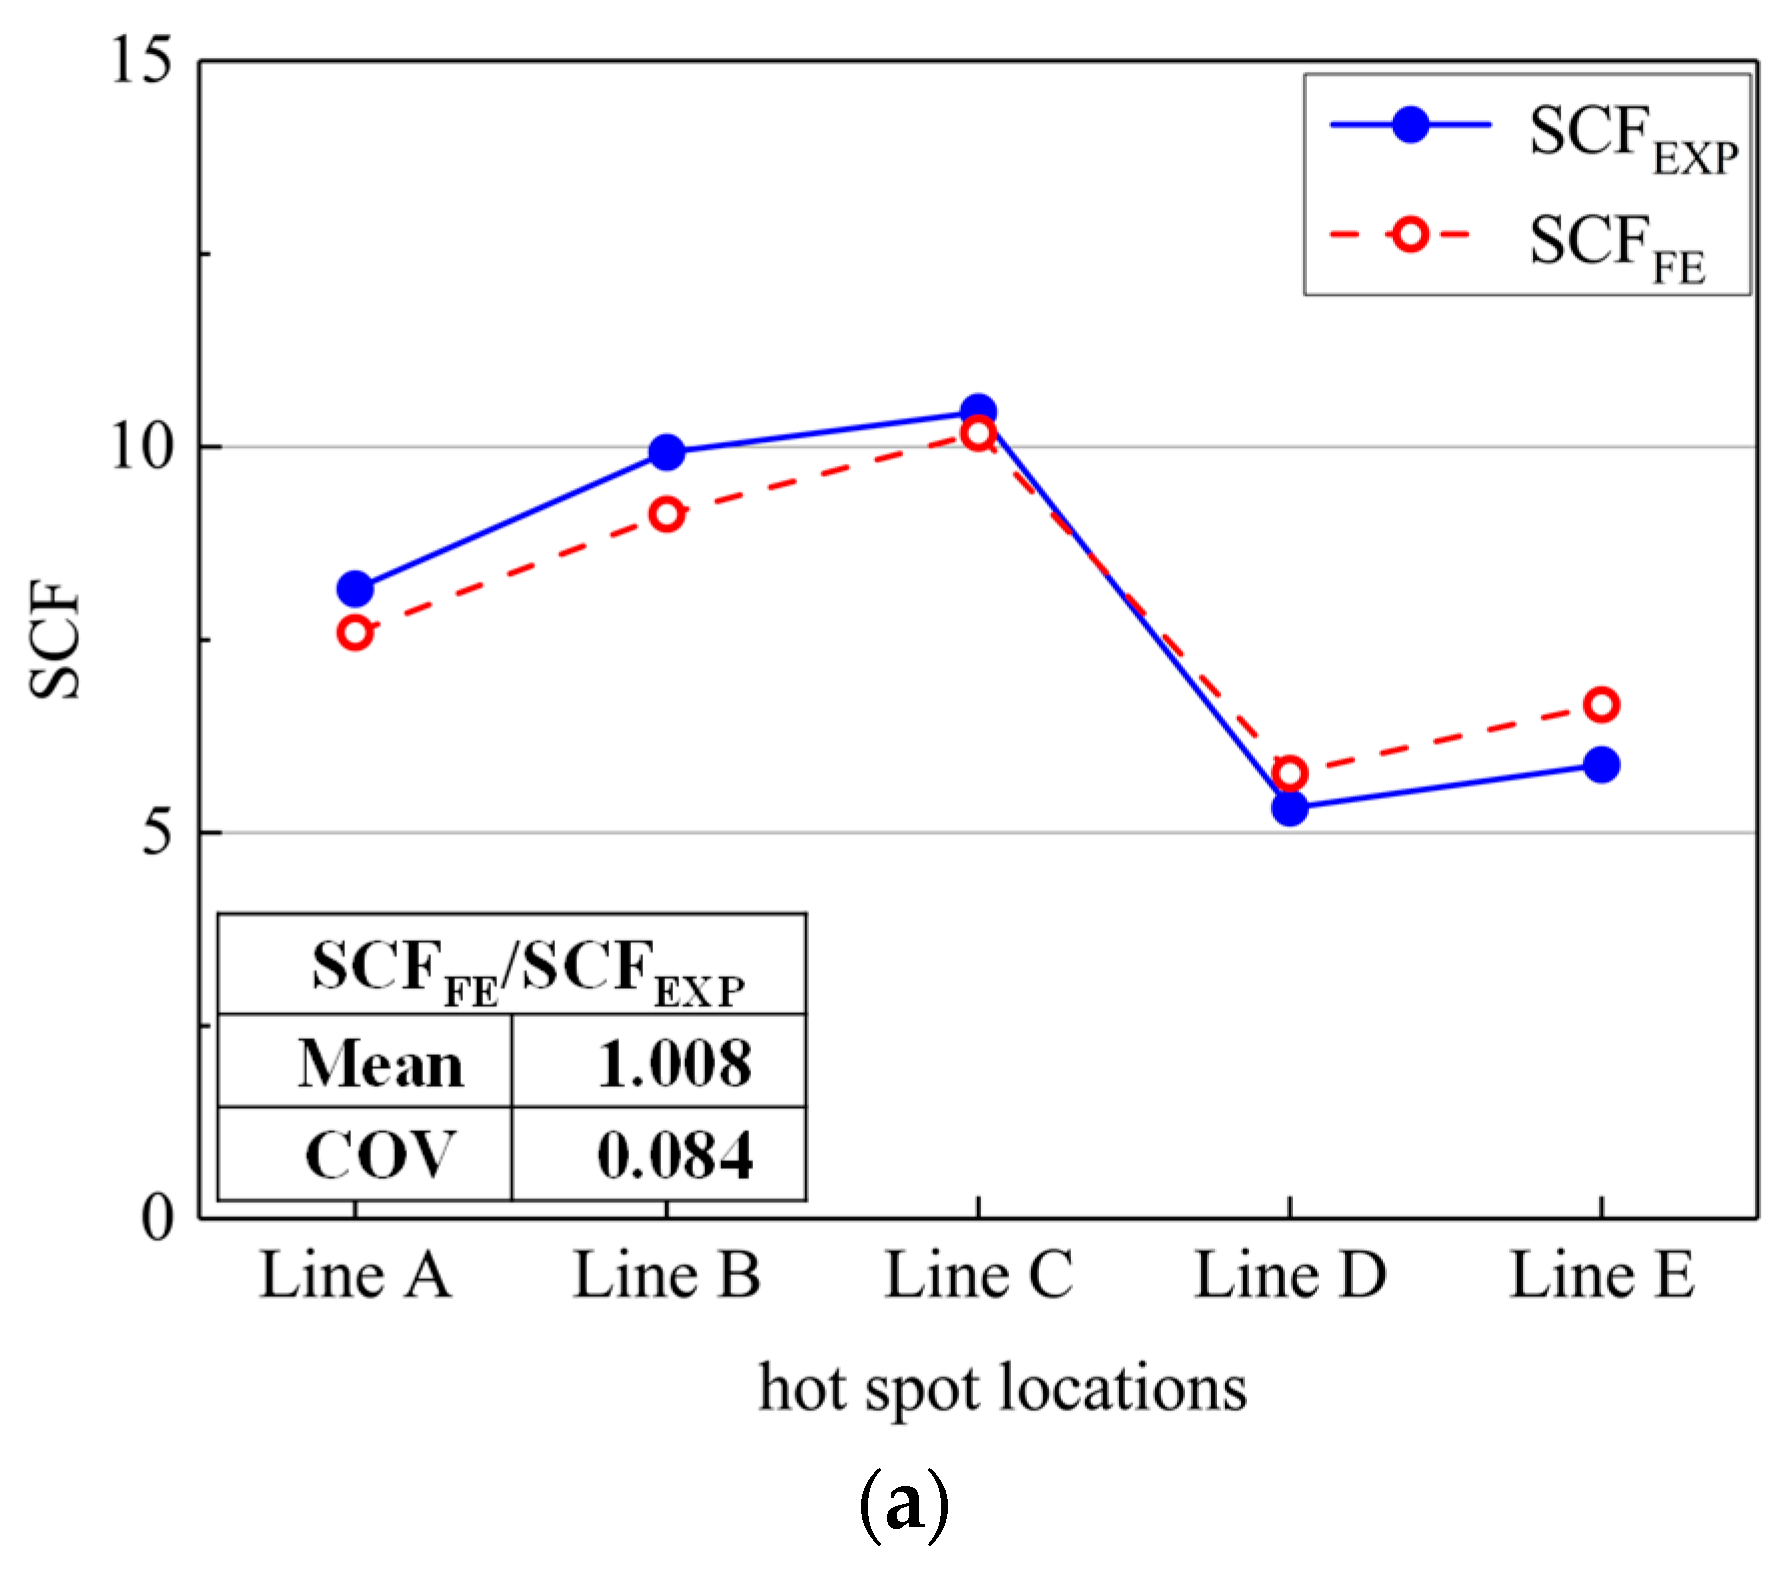
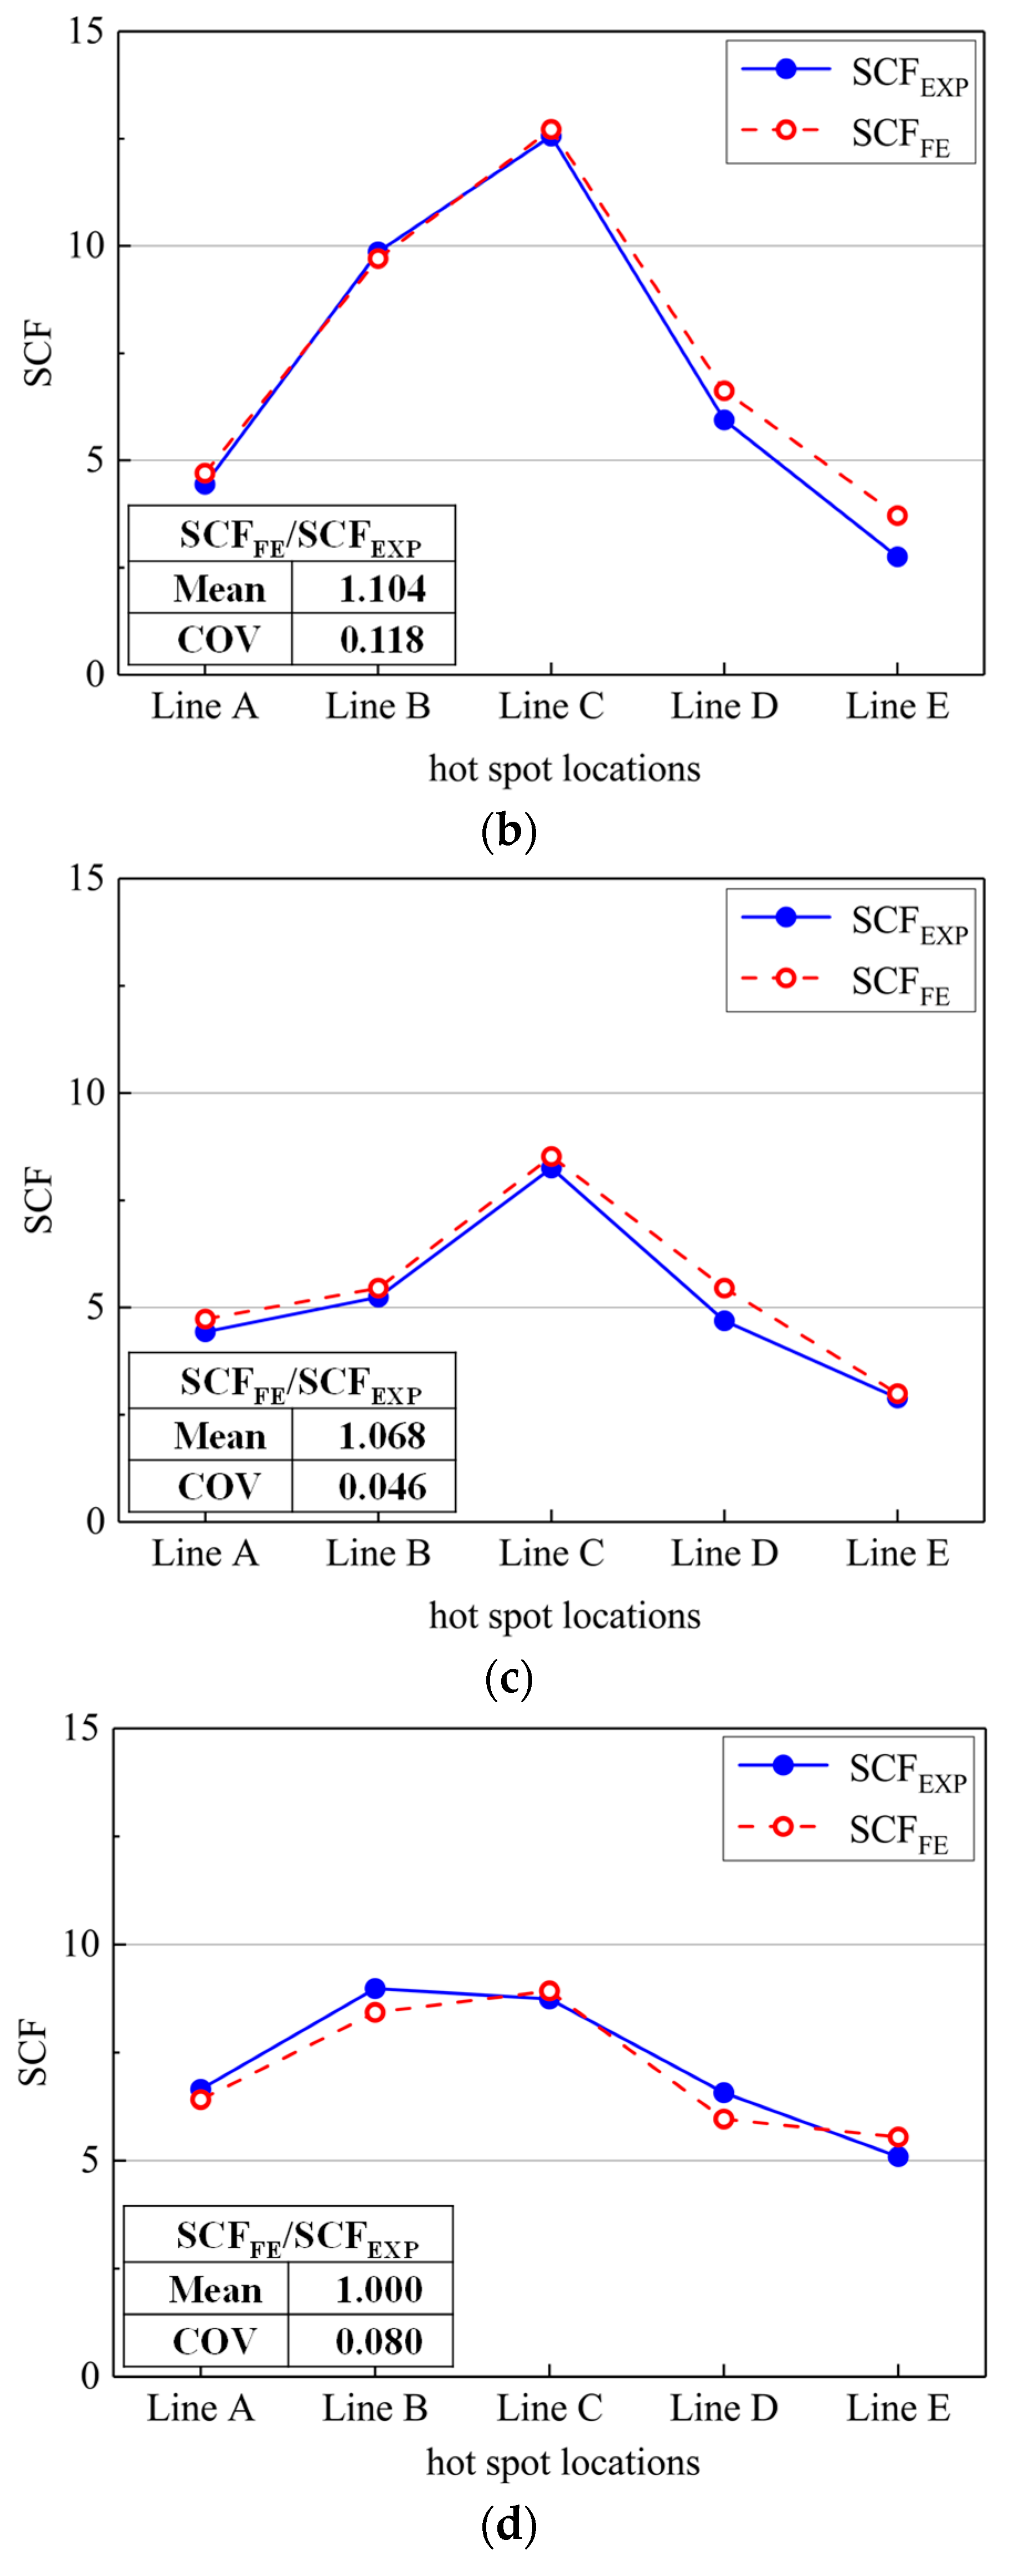
3.2. Validation of Finite Element Models

The experimental data of four empty SHS T-joints that had been tested by Chiew [7] were selected to validate the FE models, because no proper data on SHS-CFSHS T-joints could be found. In the experiments, the SCFs under axial force in the brace as well as under in-plane bending in the brace were separately measured. Three strain gauges were arranged at each location along the line perpendicular to the weld toe at distances equal to 0.4 t, 0.9 t and 1.4 t (t is the thickness of members) from the weld toe. The hot spot stresses were determined through the quadratic extrapolation method. The comparisons of numerical SCFs and experimental SCFs under axial force were carried out and a good agreement was concluded as reported in [33]. In this research, the comparisons under in-plane bending were presented. The dimensions of specimens and experimental SCFs are listed in Table 2.
For the validation of FE models, the boundary conditions were the same as the specimens in the test. Figure 6 shows the comparisons of SCFs between FE results and experimental results. It was found that the FE models could capture the SCF values as well as distribute in all the hot spot locations. The statistical results of SCFs calculated by the FE models (SCFFE) to SCFs measured by experiments (SCFEXP) with a ratio for specimen 1~4 showed a good correlation between FE results and experimental results, with 1.008, 1.104, 1.068 and 1.000, respectively. In conclusion, the FE models developed in this research are accurate to estimate the SCFs in all the locations.

4. Parametric Study and Proposed Design Equations

4.1. Parameter Selection

After the development and validation of FE models, the next area of work was the SCFs’ analysis based on an extensive review of geometrical parameters and load cases to propose the parametric formulae. The non-dimensional geometrical parameters β, 2γ and τ were the key parameters, which uniquely defined the overall geometries of an SHS-CFSHS joint. The ranges of validity for these three non-dimensional geometrical parameters in CIDECT Design Guide No.8 [15] are listed as follows: 0.35 ≤ β ≤ 1.0; 12.5 ≤ 2γ ≤ 25.0 and 0.25 ≤ τ ≤ 1.0.
An overview of the geometrical parameters identified in this parametric study is listed as follows: for β = 0.40/0.55/0.70/0.85/1.00, four values of 2γ were analyzed, each with four values of τ, resulting in 80 FE models for one basic load case. Three different basic load cases, in-plane bending in the brace, axial force in the chord and in-plane bending in the chord, were considered, and a total of 240 FE models were analyzed. The geometrical dimensions of all the FE models were varied on the basis of a practical SHS chord with a width of 400 mm and a length of 3000 mm (>6b0). The length of the brace was selected as 1200 mm (≥3b1). Hence, the boundary effects of member ends on the stress measurement in the joint core zone could be eliminated.

4.2. General Parametric Formulae for SCFs

Through the results of parametric analysis as well as the parametric formulae for SHS-SHS joints [15] and CHS-CFSHS joints [23], the type of general function most suitable for the parametric formulae are given as follows:
When the load is applied in the brace
S C F = A + B × β + C × β 2 + D × 2 γ × 2 γ E + F β + G β 2 × τ H + I β
where the constants A~I change for line A~E and D equals 0 for lines A, B, D and E.
When the load is applied in the chord
S C F = A × 2 γ E β τ H

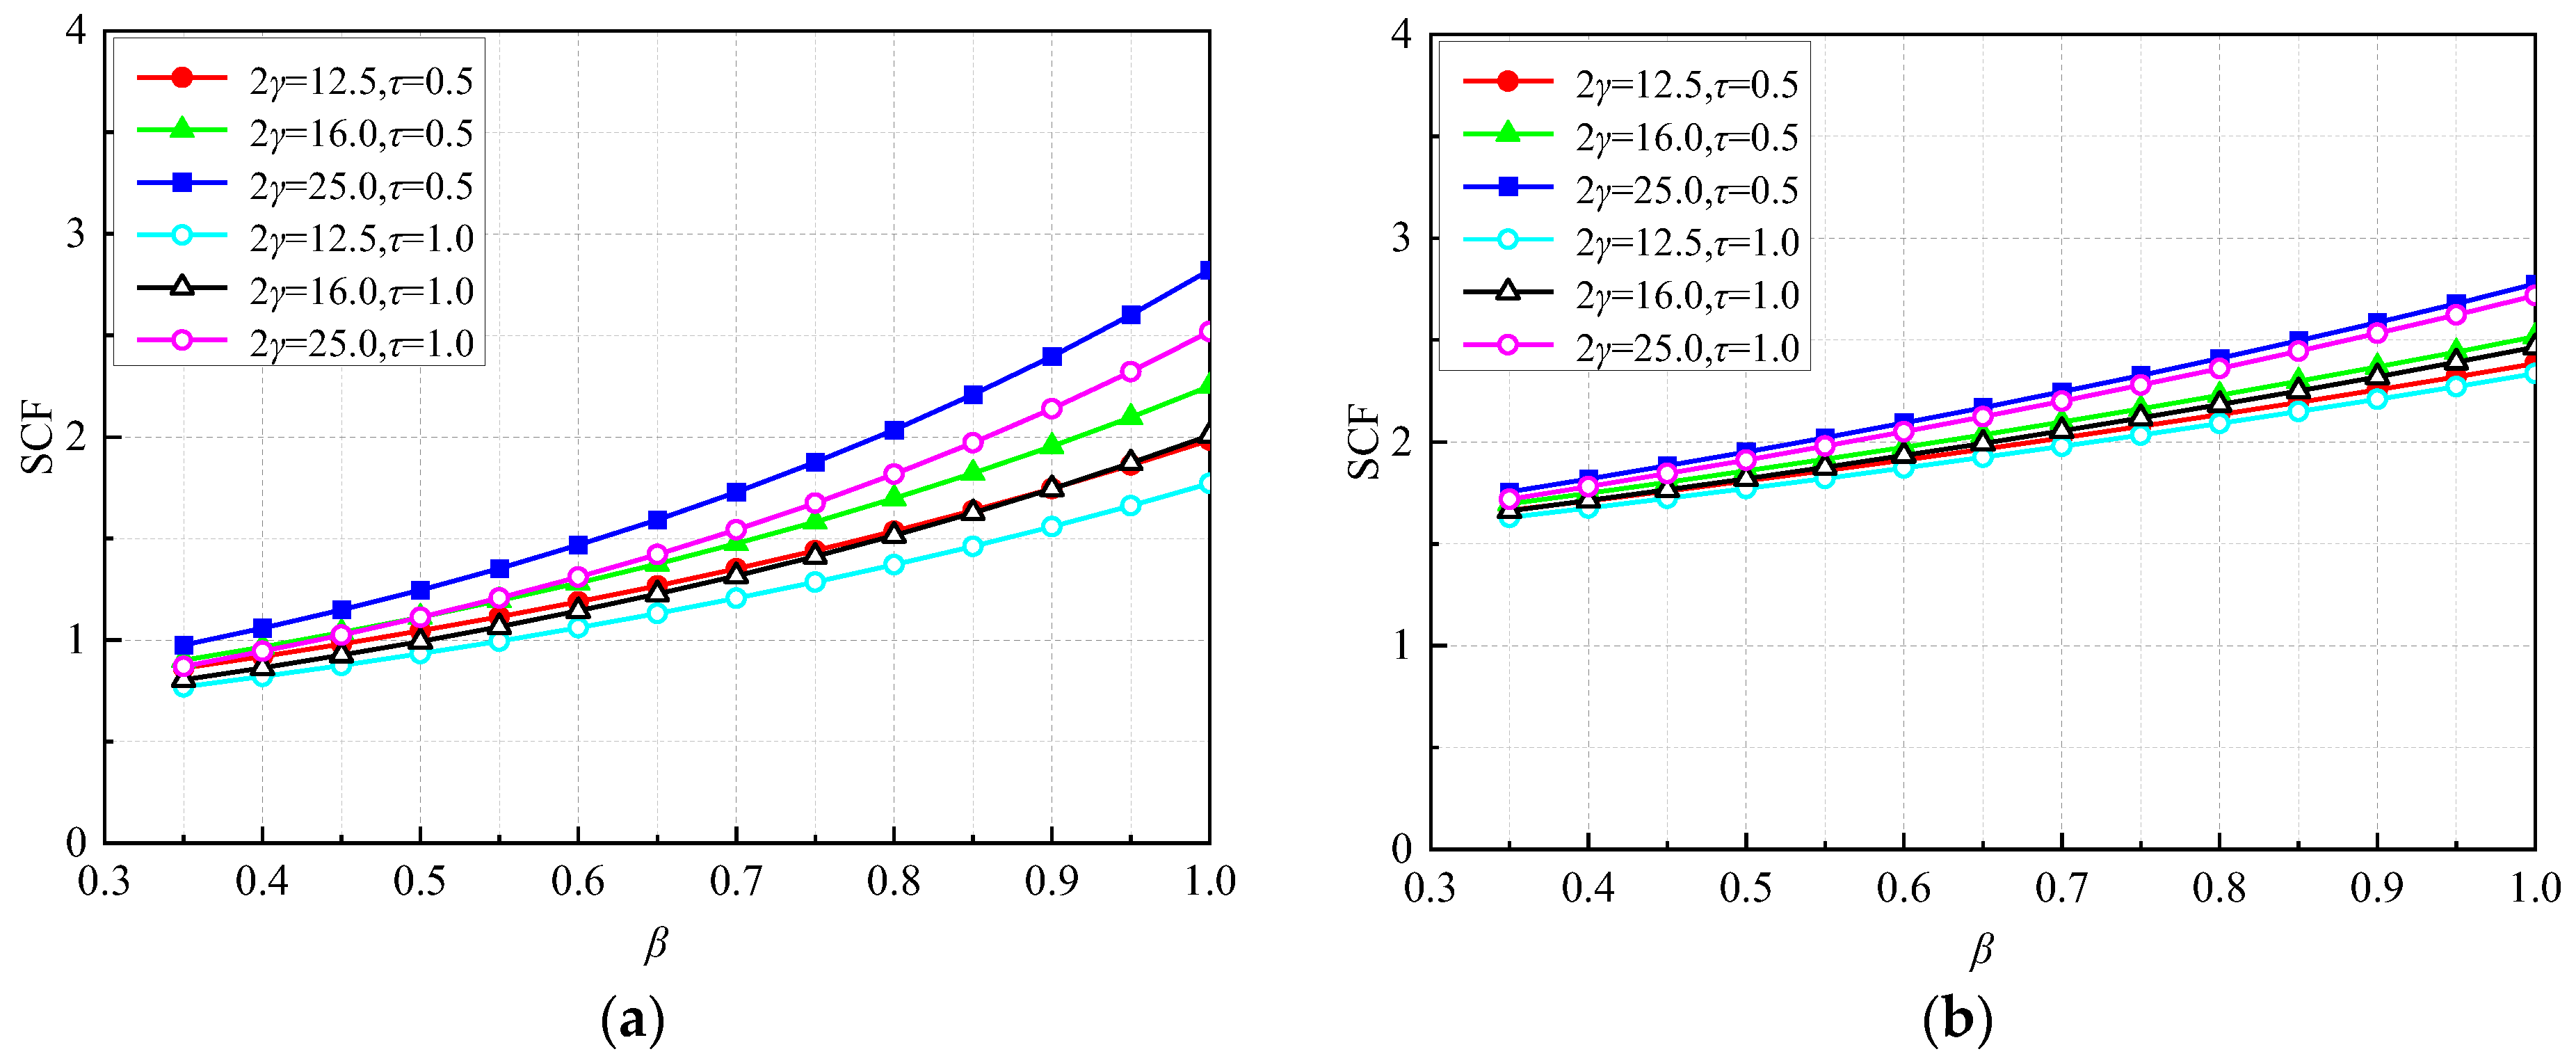
4.3. SCF Formulae and Graphs for In-Plane Bending in the Brace

Based on the results of the multiple regression analysis, the SCF formulae for SHS-CFSHS T-joints under in-plane bending in the brace are proposed as follows:
Line A in the brace:
S C F A = 0.635 1.849 β + 1.495 β 2 × 2 γ 1.349 + 8.650 β 6.739 β 2 × τ 0.304 + 0.291 β
Line E in the brace:
S C F E = 0.196 0.998 β + 1.689 β 2 × 2 γ 1.629 0.815 β 0.498 β 2 × τ 0.274 + 0.113 β
Line B in the chord:
S C F B = 0.109 + 0.437 β 0.357 β 2 × 2 γ 3.750 5.933 β + 4.799 β 2 × τ 0.740 0.139 β
Line C in the chord:
S C F C = 0.436 1.121 β + 1.617 β 2 + 0.097 · 2 γ × 2 γ 0.431 + 3.976 β 3.708 β 2 × τ 0.803 0.177 β
Line D in the chord:
S C F D = 0.133 0.355 β + 0.281 β 2 × 2 γ 0.008 + 6.305 β 5.407 β 2 × τ 0.825 0.394 β
Using the proposed SCF formulae, graphs can be drawn for engineers to evaluate the SCFs in practical use. Figure 7 illustrates the SCFs against the non-dimensional parameter β, simultaneously keeping 2γ and τ constant. As indicated in Figure 7, the following observations can be made:
(1)
While keeping 2γ and τ constant, the parabola-like curves of SCFs can be found with the increase of β. The maximum SCFs are found for the medium β values.
(2)
While keeping β and τ constant, the higher the 2γ value, the higher the SCF, due to the higher bending deformation. For the higher 2γ value (2γ = 25.0), the maximum SCFs generally occur in the chord at lines B and C. For the lower 2γ value (2γ ≤ 16.0), comparable SCFs can be found in the chord and brace, thereby the SCFs at all the lines need to be checked.
(3)
While keeping β and 2γ constant, different influences of τ on the SCFs can be found. The higher the τ value, the lower the SCF in the brace, whereas it has opposite trend in the chord. Moreover, τ has less influence on the brace.

4.4. SCF Formulae and Graphs for Axial Force in the Chord

According to the parametric analysis, the SCF formulae of SHS-CFSHS T-joints under axial force in the chord are summarized in Equations (14) and (15). Among these, the SCFs on lines A, B and E are specified as 0, due to their negligible results in FE analysis.
Line A, B, E:
S C F A = S C F B = S C F E = 0   ( n e g l i g i b l e )
Line C in the chord:
S C F C = 1.006 × 2 γ 0.243 β × τ 0.047
Line D in the chord:
S C F D = 1.416 × 2 γ 0.135 β × τ 0.133
Figure 8 illustrates the graphs for the SCFs in SHS-CFSHS T-joints under axial force in the chord. The following phenomena can be found:
(1)
While keeping 2γ and τ constant, the SCFs increase with the increase of β values, which approximately keeps a linear relationship.
(2)
While keeping β constant, the higher the 2γ value and τ value, the higher the SCF at lines C and D.
(3)
All the non-dimensional parameters have less influence on the SCFs in the chord.

4.5. SCF Formulae and Graphs for In-Plane Bending in the Chord

For the load case of in-plane bending in the chord, the SCFs on lines A, B and E were also relatively lower, which can be neglected. The SCF formulae are given as follows:
Lines A, B, E:
S C F A = S C F B = S C F E = 0   ( n e g l i g i b l e )
Line C in the chord:
S C F C = 0.491 × 2 γ 0.508 β × τ 0.164
Line D in the chord:
S C F D = 1.343 × 2 γ 0.219 β × τ 0.030
The ranges of validity for all the Equations (9)–(19) are as follows: 0.35 ≤ β ≤ 1.0; 12.5 ≤ 2γ ≤ 25.0 and 0.25 ≤ τ≤ 1.0.
Figure 9 shows the graphs for the SCFs in SHS-CFSHS T-joints under in-plane bending in the chord. The following conclusions can be obtained:
(1)
The SCFs increase as the values of β and 2γ increase separately, similar to the conclusions of axial force in the chord. However, the SCFs are negatively correlated with τ, contrary to the axial force in the chord.
(2)
All the non-dimensional parameters have a much larger influence at line C compared with line D.

5. Comparisons of SCFs Derived from Formulae and FE Analysis

The SCFs derived using the proposed formulae (SCFProposed) were compared with the SCFs estimated from the FE analysis (SCFFE). Figure 10a–c show the comparisons of SCFs in both the chord and brace under in-plane bending in the brace, axial force in the chord and in-plane bending in the chord, respectively. As for the in-plane bending in the brace, the mean values of SCFProposed to SCFFE for lines A to E were 1.01, 1.02, 0.98, 1.01 and 1.01, respectively. As for the axial force, the mean values of SCFProposed to SCFFE for lines C and D were 1.01 and 1.01, respectively. As for the axial force, the mean values of SCFProposed to SCFFE for lines C and D were 1.00 and 1.00. Therefore, a good accuracy of multiple regression analysis was indicated.

6. Comparisons of SCF Formulae between SHS-CFSHS T-Joints and Empty SHS T-Joints

Currently, SCF formulae of conventional SHS-SHS T-joints are available in the CIDECT Design Guide No.8 [15]. A comparison of the SCFs between conventional SHS-SHS joints calculated from CIDECT formulae and SHS-CFSHS joints calculated from proposed formulae was made. The SCFs of SHS-CFSHS joints under axial force in the brace were calculated using Equations (2)–(6). Four basic load cases were considered and 80 joints with the parameters stated in Section 4.1 were selected for each load case. Figure 11a,b illustrate the comparisons of the SCFs for both the chord and brace under axial force in the brace and in-plane bending in the brace, respectively. For axial force in the brace, the SCFs of SHS-CFSHS joints were 18%, 23%, 26%, 10% and 25% lower than the SCFs of SHS-SHS joints at lines A~E, respectively. For in-plane bending in the brace, the SCFs of SHS-CFSHS joints were 21%, 14%, 31%, 26% and 21% lower than the SCFs of SHS-SHS joints at lines A~E, respectively. This reduction was attributed to the reduction in chord face deformation benefiting from the in-filled concrete. Figure 11c,d show the comparisons of the SCFs for both the chord and brace under axial force in the chord and in-plane bending in the chord, respectively. A general increase in the SCFs of SHS-CFSHS joints was found when comparing with SHS-SHS joints. For axial force in the chord, there was a 50% increase at line C. For in-plane bending in the chord, there were 45% and 19% increases at lines C and line D, respectively. Moreover, there was a reduction of 4% at line D for axial force in the chord. It should be noted that the SCFs caused by loads in the chord were much lower than those caused by loads in the brace.

7. Conclusions

(1)
A good agreement with the experimental results indicated that three-dimensional FE models developed by ABAQUS were accurate to capture the SCFs at all hot spot locations.
(2)
For in-plane bending in the brace, the maximum SCFs were found to occur at lines B and C for the tick-walled chord (2γ = 25.0). Meanwhile, for the thin-walled (2γ ≤ 16.0) chord, the SCFs at all the lines needed to be checked.
(3)
Under axial force in the chord and in-plane bending in the chord, only SCFs at lines C and D needed to be considered. There was a similar trend for SCFs which were positive which correlated with β and 2γ for both load cases. However, for in-plane bending in the chord, the SCFs were negatively correlated with τ, contrary to the axial force in the chord.
(4)
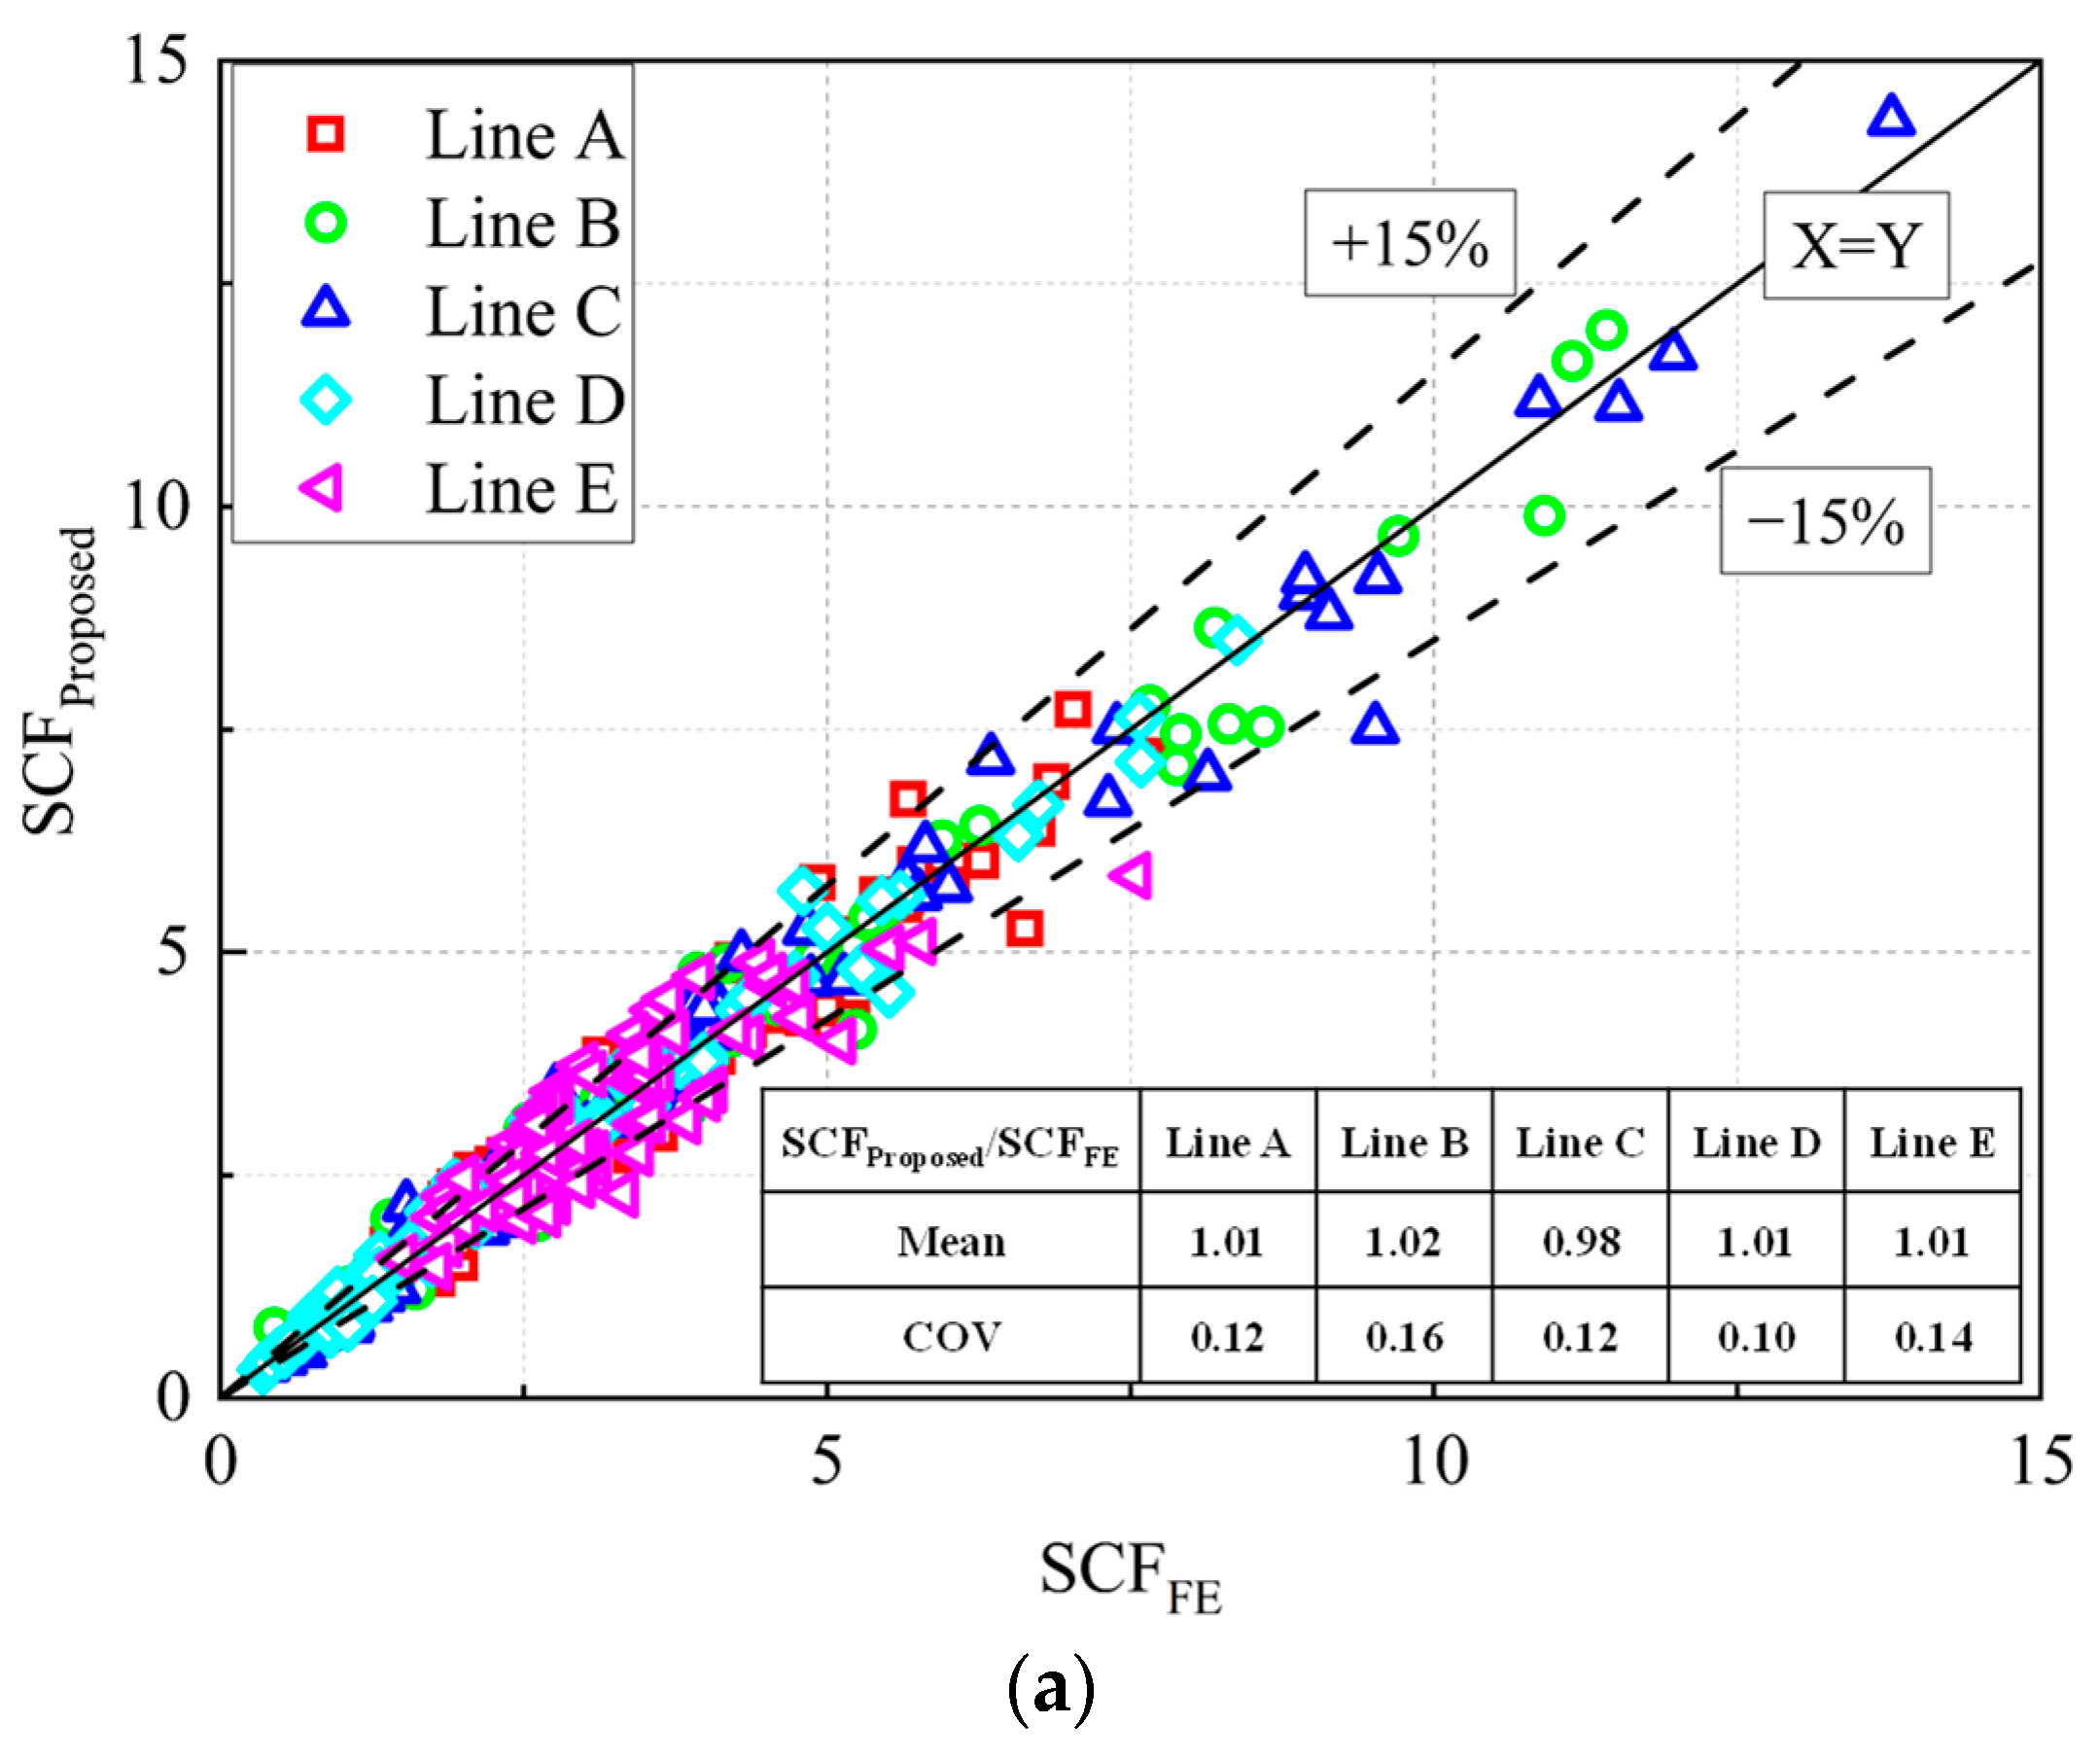
The comparisons of the SCFs derived from proposed formulae and the FE analysis indicated a good accuracy of multiple regression analysis. The proposed equations are applicable to the following range of parameters: 0.35 ≤ β ≤ 1.0; 12.5 ≤ 2γ ≤ 25.0 and 0.25 ≤ τ ≤ 1.0.
(5)
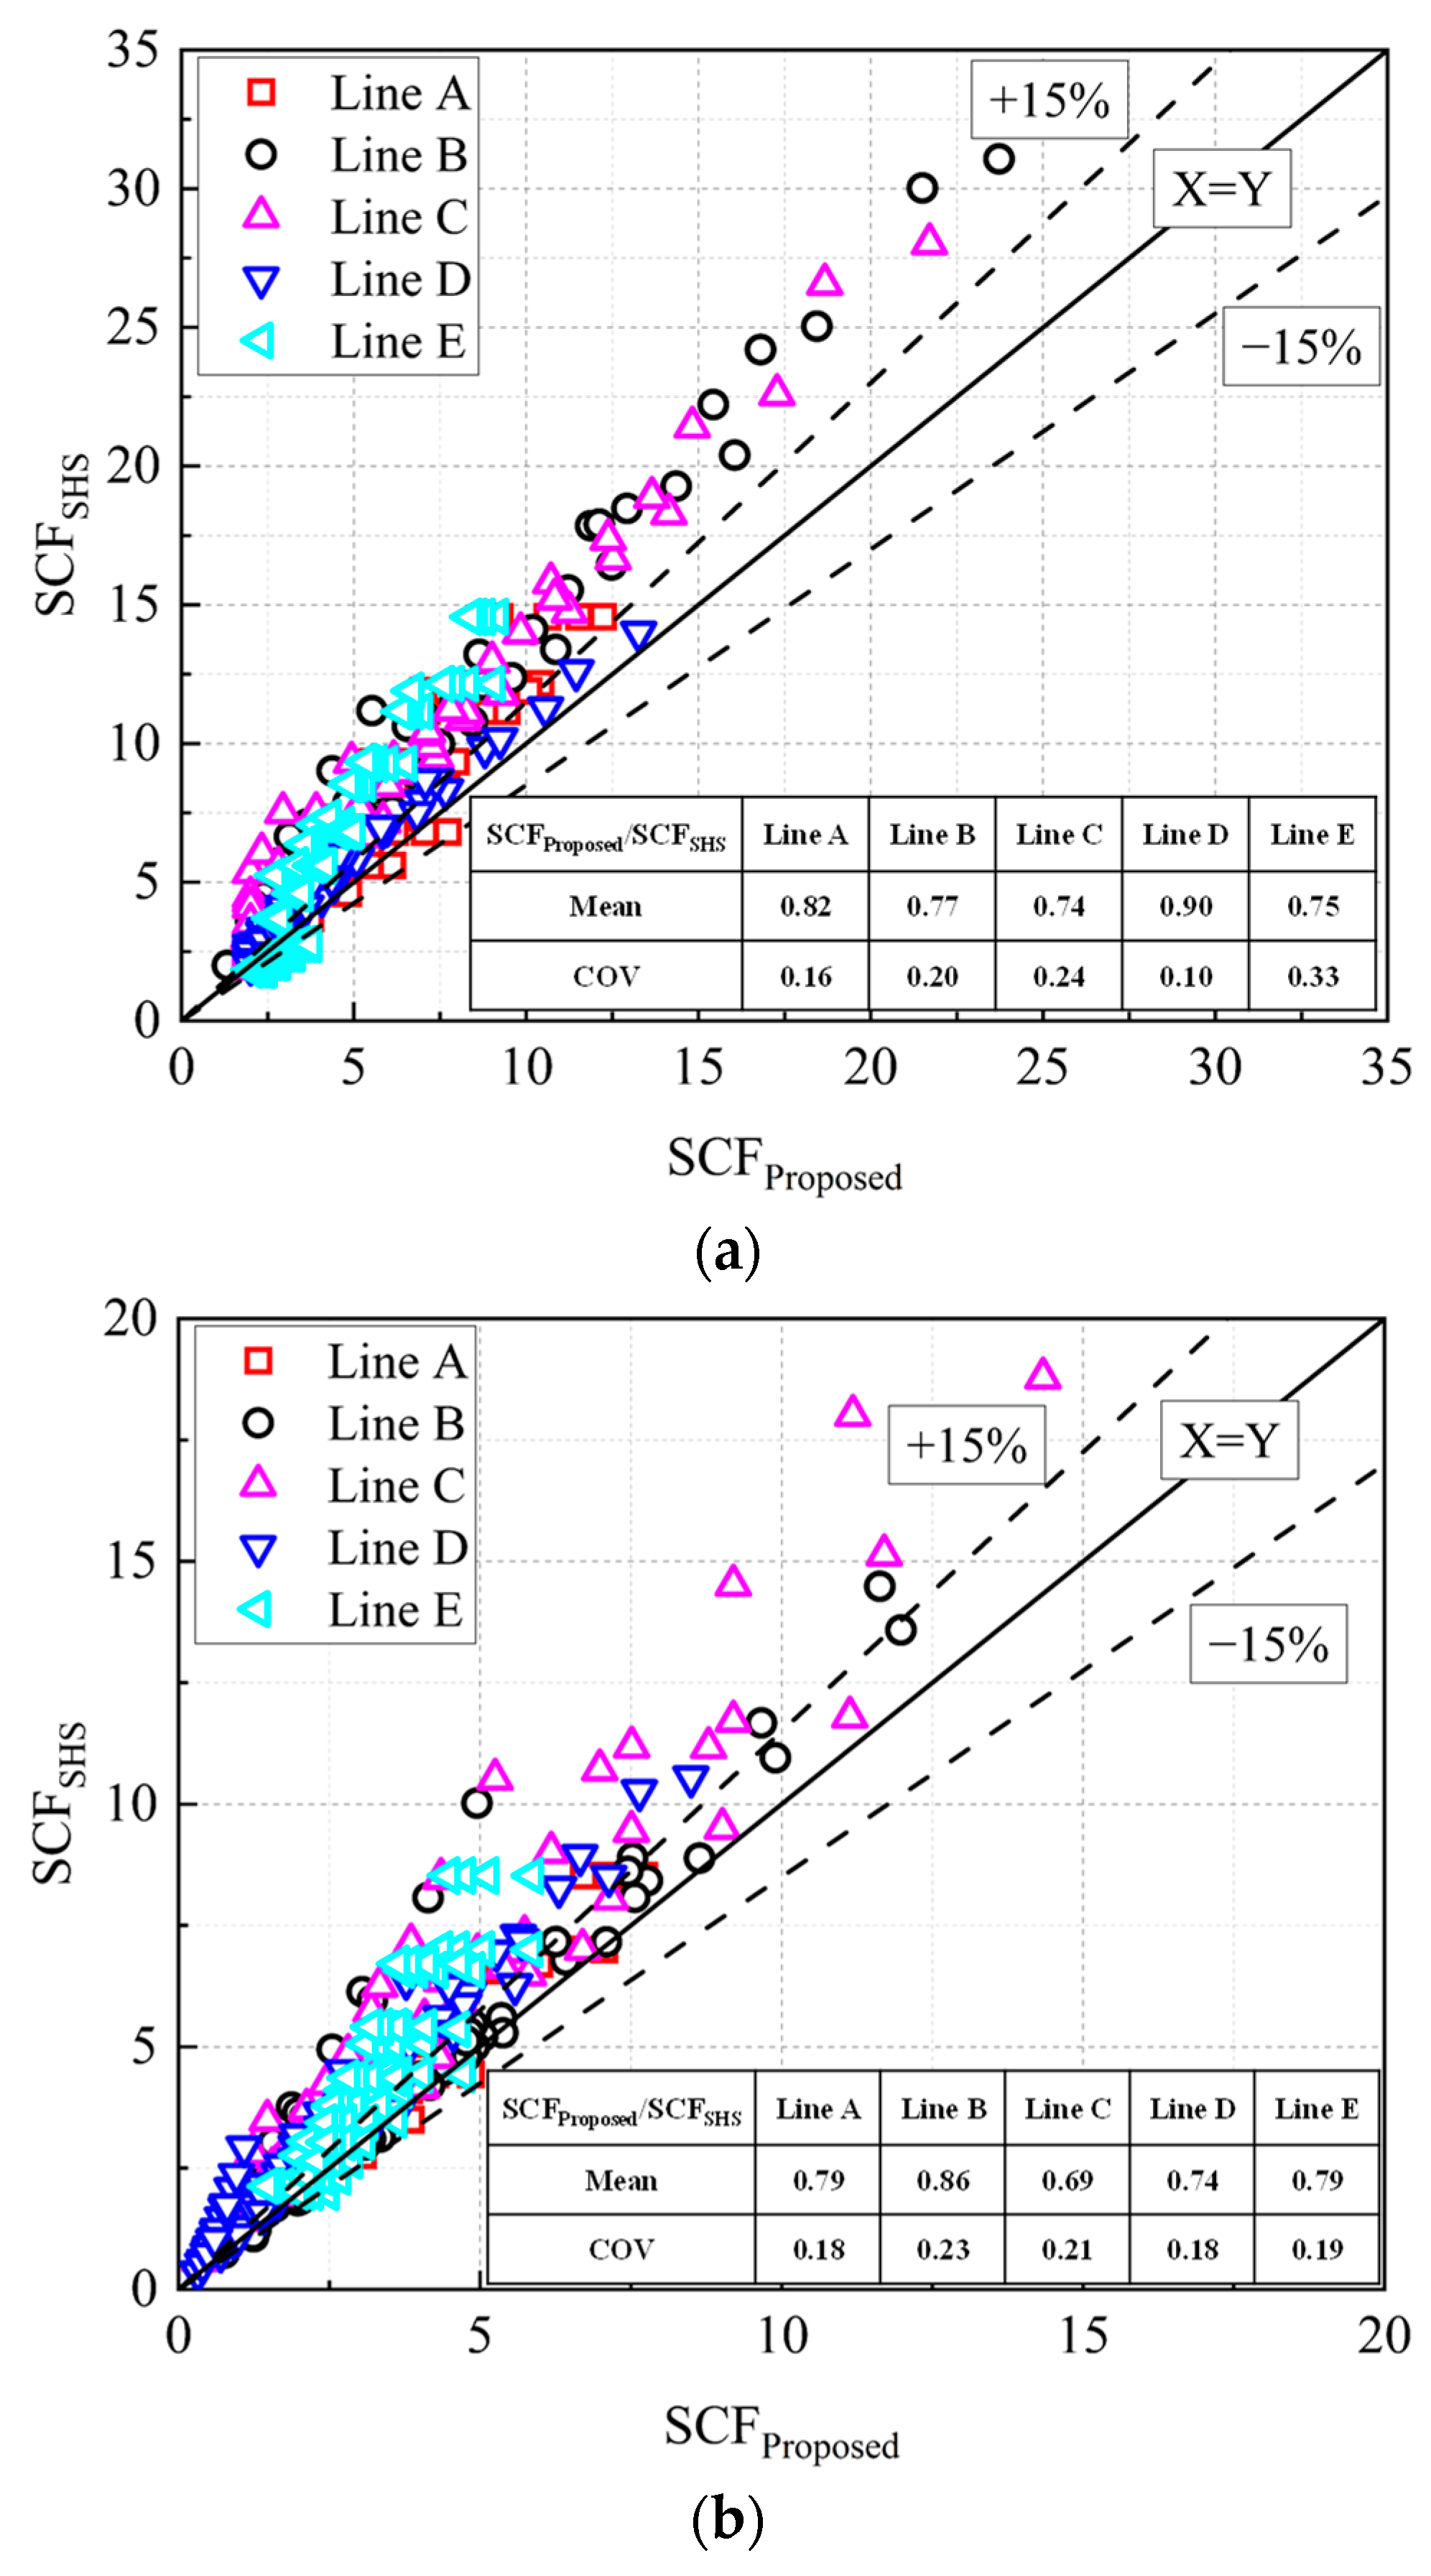
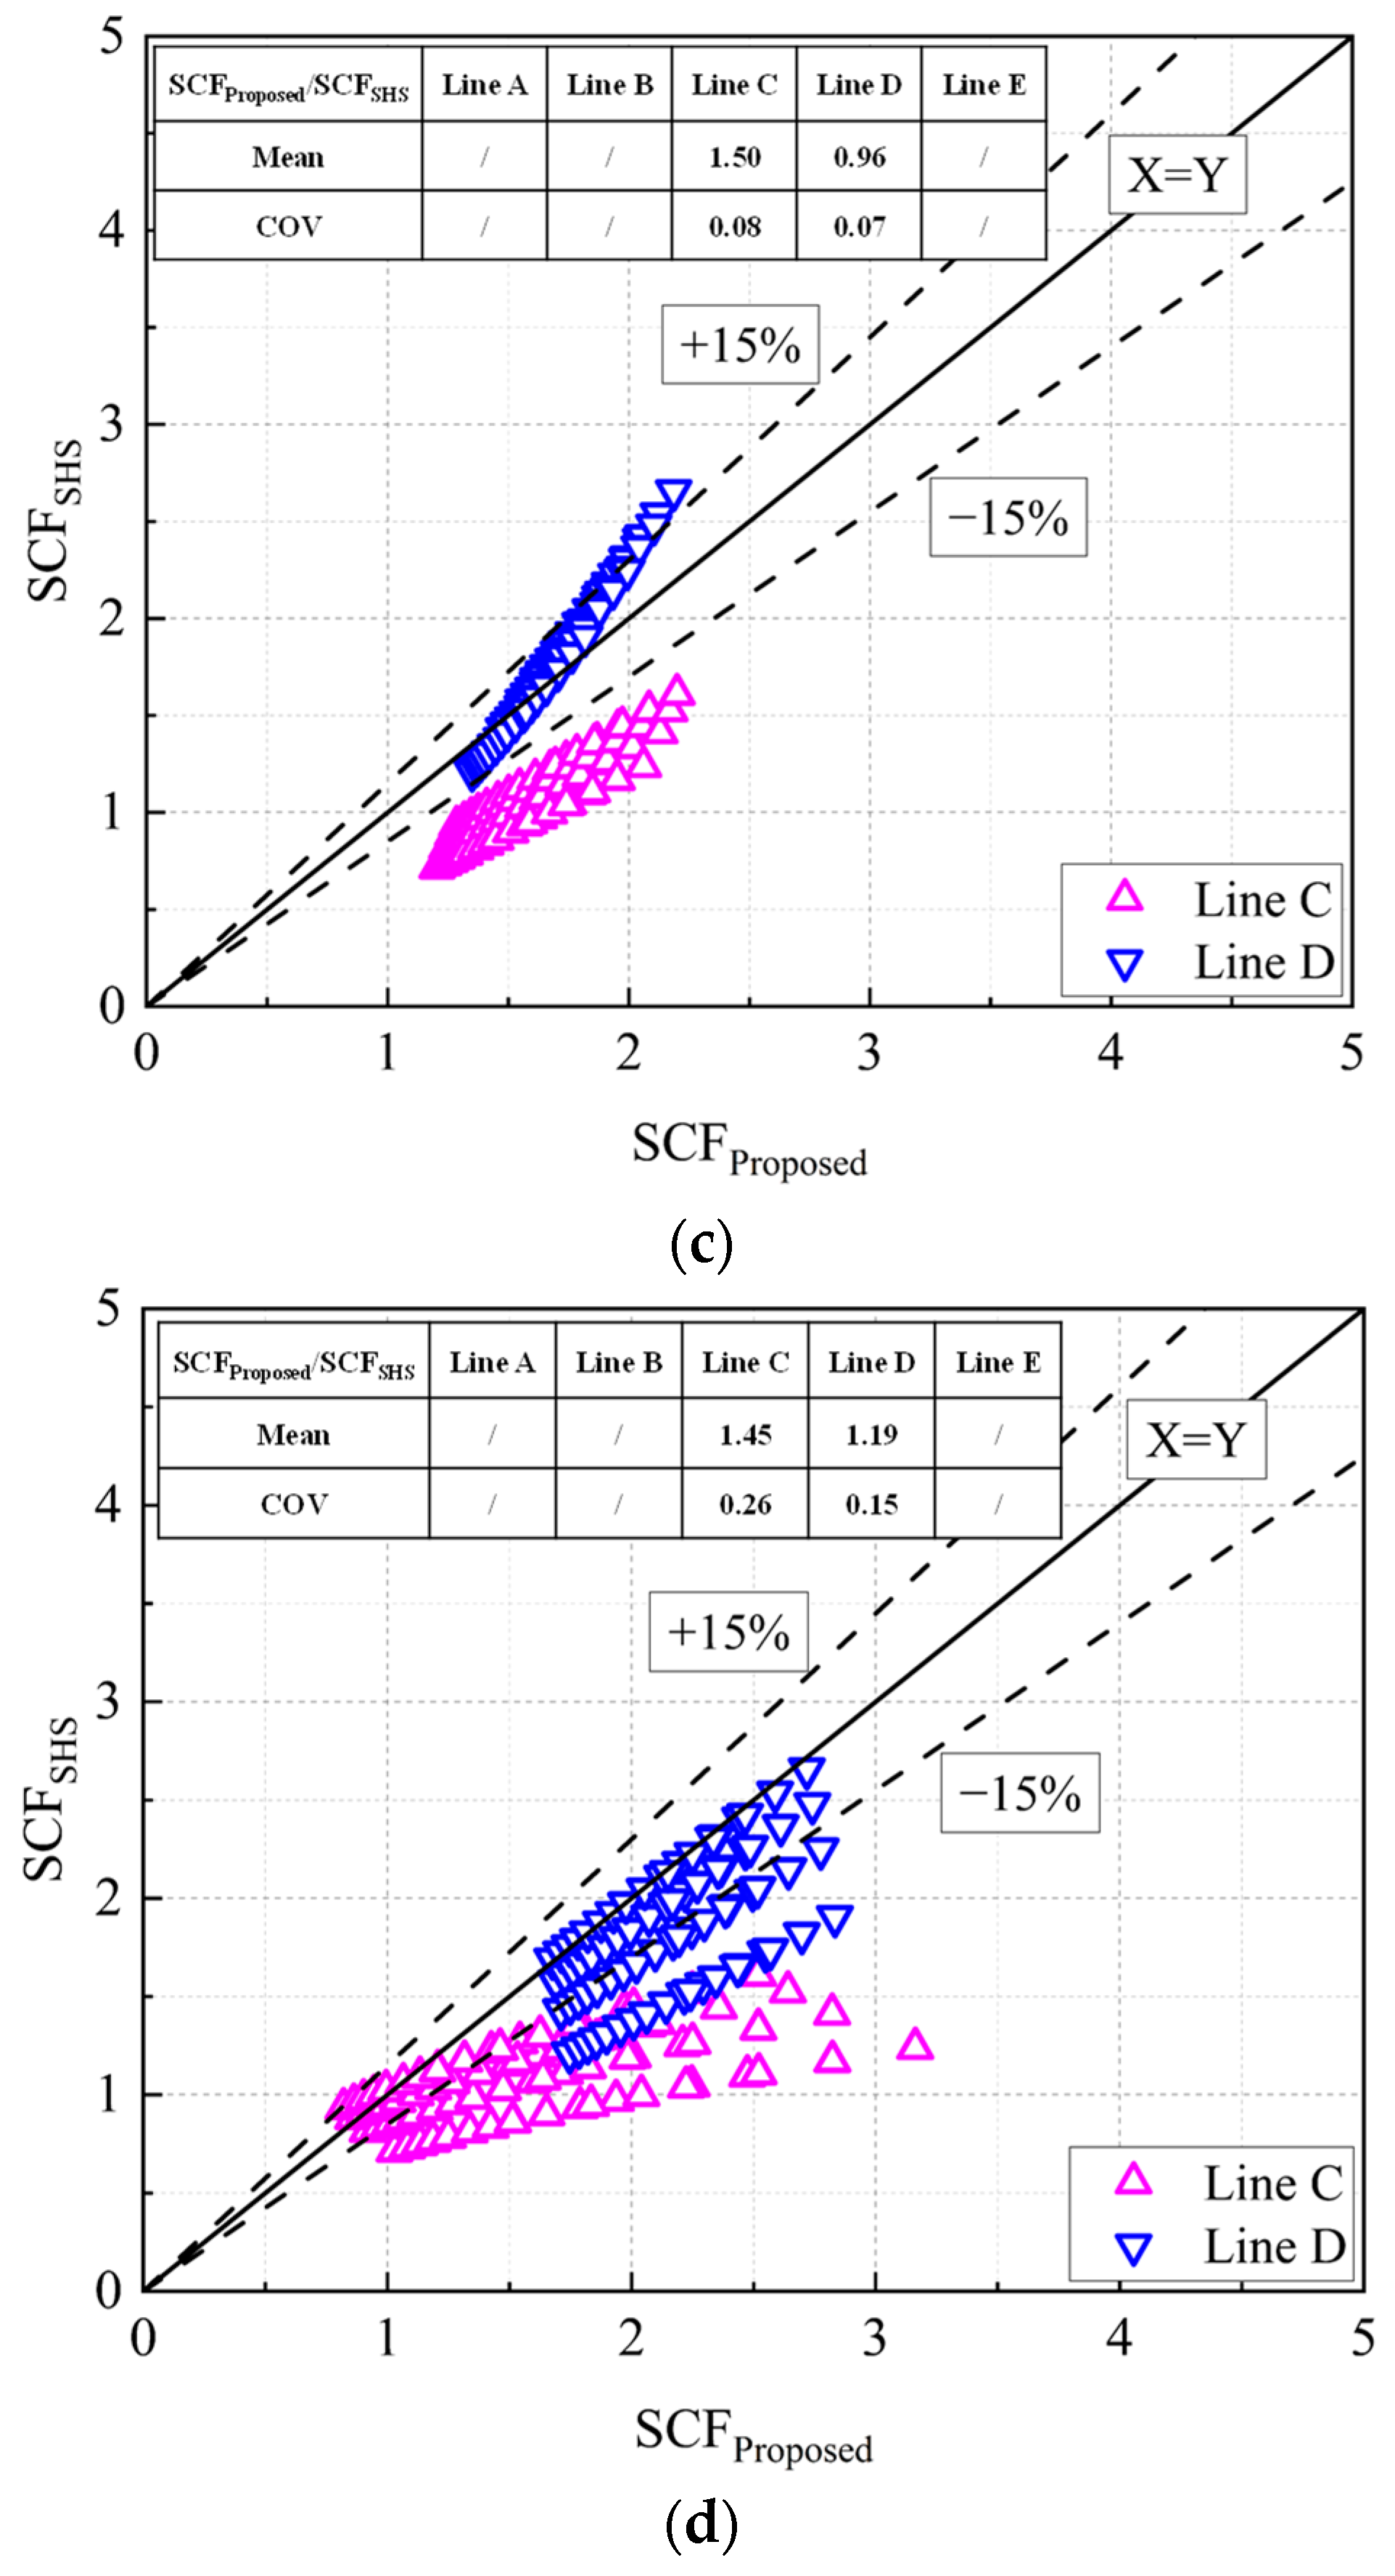
The comparisons of SCFs between SHS-CFSHS joints based on proposed formulae and empty SHS joints using CIDECT formulae were carried out. There were reductions of 10~26% and 14~31% in the SCFs in SHS-CFSHS joints compared to empty SHS joints for axial force in the brace and in-plane bending in the brace, respectively. In addition, a general increase was found for the loads in the chord. It should be noted that the SCFs caused by loads in the chord were much lower than those caused by loads in the brace.
(6)
This investigation focused on the SCF of SHS-CFSHS joints under the in-plane bending moment in the brace, axial force in the chord and the in-plane bending moment in the chord, and proposed corresponding design equations. The debonding between the concrete infill and steel tube should be considered in future work.

Author Contributions

Conceptualization, L.J.; methodology, L.G.; software, L.G. and L.J.; validation, X.W., S.G. and H.C.; formal analysis, J.L.; investigation, H.Z.; resources, L.G. and L.J.; data curation, L.J., X.W. and S.G.; writing—original draft preparation, L.G.; writing—review and editing, L.J.; visualization, X.W.; supervision, L.J.; project administration, L.G., J.L. and H.Z.; funding acquisition, L.J. All authors have read and agreed to the published version of the manuscript.

Funding

This project was funded by Overseas Students Science and Technology Activities Project Merit Funding in Shaanxi Province (2021-11), the Fundamental Research Funds for Central Universities, CHD (300102213207), Gansu Provincial Department of Housing and Urban-Rural Development Construction Science and Technology Project Plan (JK2023-31 and JK2023-39).

Data Availability Statement

Data are contained within the manuscript.

Conflicts of Interest

The authors declare no conflicts of interest.

References

  1. van Wingerde, A.M. The fatigue behaviour of T- and X-joint made of square hollow sections. HERON 1992, 37, 1–182. [Google Scholar]
  2. van Wingerde, A.M.; Packer, J.A.; Wardenier, J. New guidelines for fatigue design of HSS connections. J. Struct. Eng. 1996, 122, 125–132. [Google Scholar]
  3. van Wingerde, A.M.; Packer, J.A.; Wardenier, J. Criteria for the fatigue assessment of hollow structural section connections. J. Constr. Steel Res. 1995, 35, 71–115. [Google Scholar]
  4. van Wingerde, A.M.; Packer, J.A.; Wardenier, J. SCF formulae for fatigue design of K-connections between square hollow sections. J. Constr. Steel Res. 1997, 43, 87–118. [Google Scholar]
  5. Packer, J.A.; Wardenier, J. Stress connectration facors for non-90° X-connections made of square hollow sections. Can. J. Civ. Eng. 1998, 25, 370–375. [Google Scholar]
  6. Mashiri, F.R.; Zhao, X.L.; Grundy, P. Fatigue tests and design of welded T connections in thin cold-formed square hollow sections under in-plane bending. J. Struct. Eng. 2002, 128, 1413–1422. [Google Scholar]
  7. Chiew, S.P.; Lee, C.K.; Lie, S.T.; Ji, H.L. Fatigue behaviors of square-to-square hollow section T-joint with corner crack. I: Experimental studies. Eng. Fract. Mech. 2007, 74, 703–720. [Google Scholar]
  8. Lee, C.K.; Chiew, S.P.; Lie, S.T.; Ji, H.L. Fatigue behaviors of square-to-square hollow section T-joint with corner crack. II: Numerical modeling. Eng. Fract. Mech. 2007, 74, 721–738. [Google Scholar]
  9. Morgan, M.R.; Lee, M.M.K. Stress concentration factors in tubular K-joints under in-plane moment loading. J. Struct. Eng. 1998, 124, 382–390. [Google Scholar]
  10. Morgan, M.R.; Lee, M.M.K. Parametric equations for distributions of stress concentration factors in tubular K-joints under out-of-plane moment loading. Int. J. Fatigue 1998, 20, 449–461. [Google Scholar]
  11. Matti, F.N.; Mashiri, F.R. Experimental and numerical studies on SCFs of SHS T-joints subjected to static out-of-plane bending. Thin Walled Struct. 2020, 146, 106453. [Google Scholar]
  12. Shao, Y.B. Geometrical effect on the stress distribution along weld toe for tubular T- and K-joints under axial loading. J. Constr. Steel Res. 2007, 63, 1351–1360. [Google Scholar]
  13. Zhao, X.L.; Packer, J.A. (Eds.) Recommended Fatigue Design Procedure for Welded Hollow Section Joints; IIW doc. XV-1035-99; Elsevier: Amsterdam, The Netherlands, 2000. [Google Scholar]
  14. EN 1993-1-9; Eurocode 3(EC3). Design of Steel Structures—Part 1–9: Fatigue. European Committee for Standardization: Brussels, Belgium, 2005.
  15. Zhao, X.L.; Herion, S.; Packer, J.A.; Puthli, R.S.; Sedlacek, G.; Wardenier, J.; Weynand, K.; Van Wingerde, A.M.; Yeomans, N.F. Design Guide for Circular and Rectangular Hollow Section Welded Joints under Fatigue Loading; CIDECT Design Guide No.8; TÜV-Verlag: Cologne, Germany, 2000. [Google Scholar]
  16. Liu, Y.; Xiong, Z.; Luo, Y.; Cheng, G.; Liu, G.; Yang, J. Double-composite rectangular truss bridge and its joint analysis. J. Traffic Transp. Eng. 2015, 2, 249–257. [Google Scholar]
  17. Chen, J.; Chen, J.; Jin, W.L. Experiment investigation of stress concentration factor of concrete-filled tubular T joints. J. Constr. Steel Res. 2010, 66, 1510–1515. [Google Scholar]
  18. Xu, F.; Chen, J.; Jin, W.L. Experimental investigation of SCF distribution for thin-walled concrete-filled CHS joints under axial tension loading. Thin Walled Struct. 2015, 93, 149–157. [Google Scholar]
  19. Wang, K.; Tong, L.W.; Zhu, J.; Zhao, X.L.; Mashiri, F.R. Fatigue behavior of welded T-joints with a CHS brace and CFCHS chord under axial loading in the brace. J. Bridge Eng. 2013, 18, 142–152. [Google Scholar]
  20. Udomworarat, P.; Miki, C.; Ichikawa, A.; Sasaki, E.; Sakamoto, T.; Mitsuki, K.; Hosaka, T. Fatigue and ultimate strengths of concrete filled tubular K-joints on truss girder. J. Struct. Eng. 2000, 46A, 1627–1635. [Google Scholar]
  21. Udomworarat, P.; Miki, C.; Ichikawa, A.; Komechi, M.; Mitsuki, K.; Hosaka, T. Fatigue performance of composite tubular K-joints for truss type bridge. Struct. Eng. Earthq. Eng. 2002, 19, 65s–79s. [Google Scholar]
  22. Kim, I.G.; Chung, C.H.; Shim, C.S.; Kim, Y.J. Stress concentration factors of N-joints of concrete-filled tubes subjected to axial loads. Int. Steel Struct. 2014, 14, 1–11. [Google Scholar]
  23. Tong, L.W.; Xu, G.W.; Yang, D.L.; Mashiri, F.R.; Zhao, X.L. Stress concentration factors in CHS-CFSHS T-joints: Experiments, FE analysis and formulae. Eng. Struct. 2017, 151, 406–421. [Google Scholar]
  24. Tong, L.W.; Xu, G.W.; Yang, D.L.; Mashiri, F.R.; Zhao, X.L. Fatigue behavior and design of welded tubular T-joints with CHS brace and concrete-filled chord. Thin Walled Struct. 2017, 120, 180–190. [Google Scholar]
  25. Chen, K.; Huang, H.; Zheng, Q.; Wu, Q.; Nakamura, S. Experimental Research on the Calculating Method of Stress Concentration Factor for CFST K-Joint. J. Struct. Eng. 2023, 149, 04023006. [Google Scholar]
  26. Matti, F.; Mashiri, F. Stress concentration factors of concrete-filled T-joints under in-plane bending: Experiments, FE analysis and formulae. Materials 2022, 15, 6421. [Google Scholar] [CrossRef]
  27. Zhao, J.; Xiao, L.; Wei, X.; Li, X. Parametric study and neural network-based prediction for stress concentration factor of concrete-filled steel tubular T-joint. Ocean Eng. 2024, 305, 117972. [Google Scholar]
  28. Xiao, L.; Wei, X.; Zhao, J.; Wu, C. Hot spot stress concentration factor of CFST T/Y joints based on modified equivalent thickness. Structures 2023, 51, 910–925. [Google Scholar]
  29. Jiang, L.; Liu, Y.; Fam, A.; Liu, J.; Liu, B. Stress concentration factor parametric formulae for concrete-filled rectangular hollow section K-joints with perfobond ribs. J. Constr. Steel Res. 2019, 160, 579–597. [Google Scholar]
  30. Jiang, L.; Liu, Y.; Fam, A.; Liu, B.; Pu, B.; Zhao, R. Experimental and numerical analyses on stress concentration factors of concrete-filled welded integral K-joints in steel truss bridges. Thin Walled Struct. 2023, 183, 110347. [Google Scholar]
  31. Matti, F.N.; Mashiri, F.R. Design formulae for predicting the stress concentration factors of concrete-filled T-joints under out-of-plane bending. Structures 2020, 28, 2073–2095. [Google Scholar]
  32. Lan, X.; Chan, T.M.; Young, B. Experimental and numerical studies on stress concentration factors of high strength steel fabricated box X-joints. Thin Walled Struct. 2021, 164, 107858. [Google Scholar]
  33. Jiang, L.; Liu, Y.J.; Fam, A. Stress concentration factors in joints of square hollow section (SHS) brace and concrete-filled SHS chord under axial tension in brace. Thin Walled Struct. 2018, 132, 79–92. [Google Scholar]
  34. GB50010-2010; Chinese Standard: Code for Design of Concrete Structures. China Standards Press: Beijing, China, 2010. (In Chinese)
  35. GB50661-2011; Chinese Standard: Code for Welding of Steel Structures. China Architecture & Building Press: Beijing, China, 2011. (In Chinese)
  36. Feng, R.; Young, B. Design of cold-formed stainless steel tubular T- and X-joints. J. Constr. Steel Res. 2011, 67, 421–436. [Google Scholar]
  37. Choo, Y.S.; Qian, X.D.; Liew, J.Y.R.; Wardenier, J. Static strength of thick-walled CHS X-joints—Part I. New approach in strength definition. J. Constr. Steel Res. 2003, 59, 1201–1228. [Google Scholar]
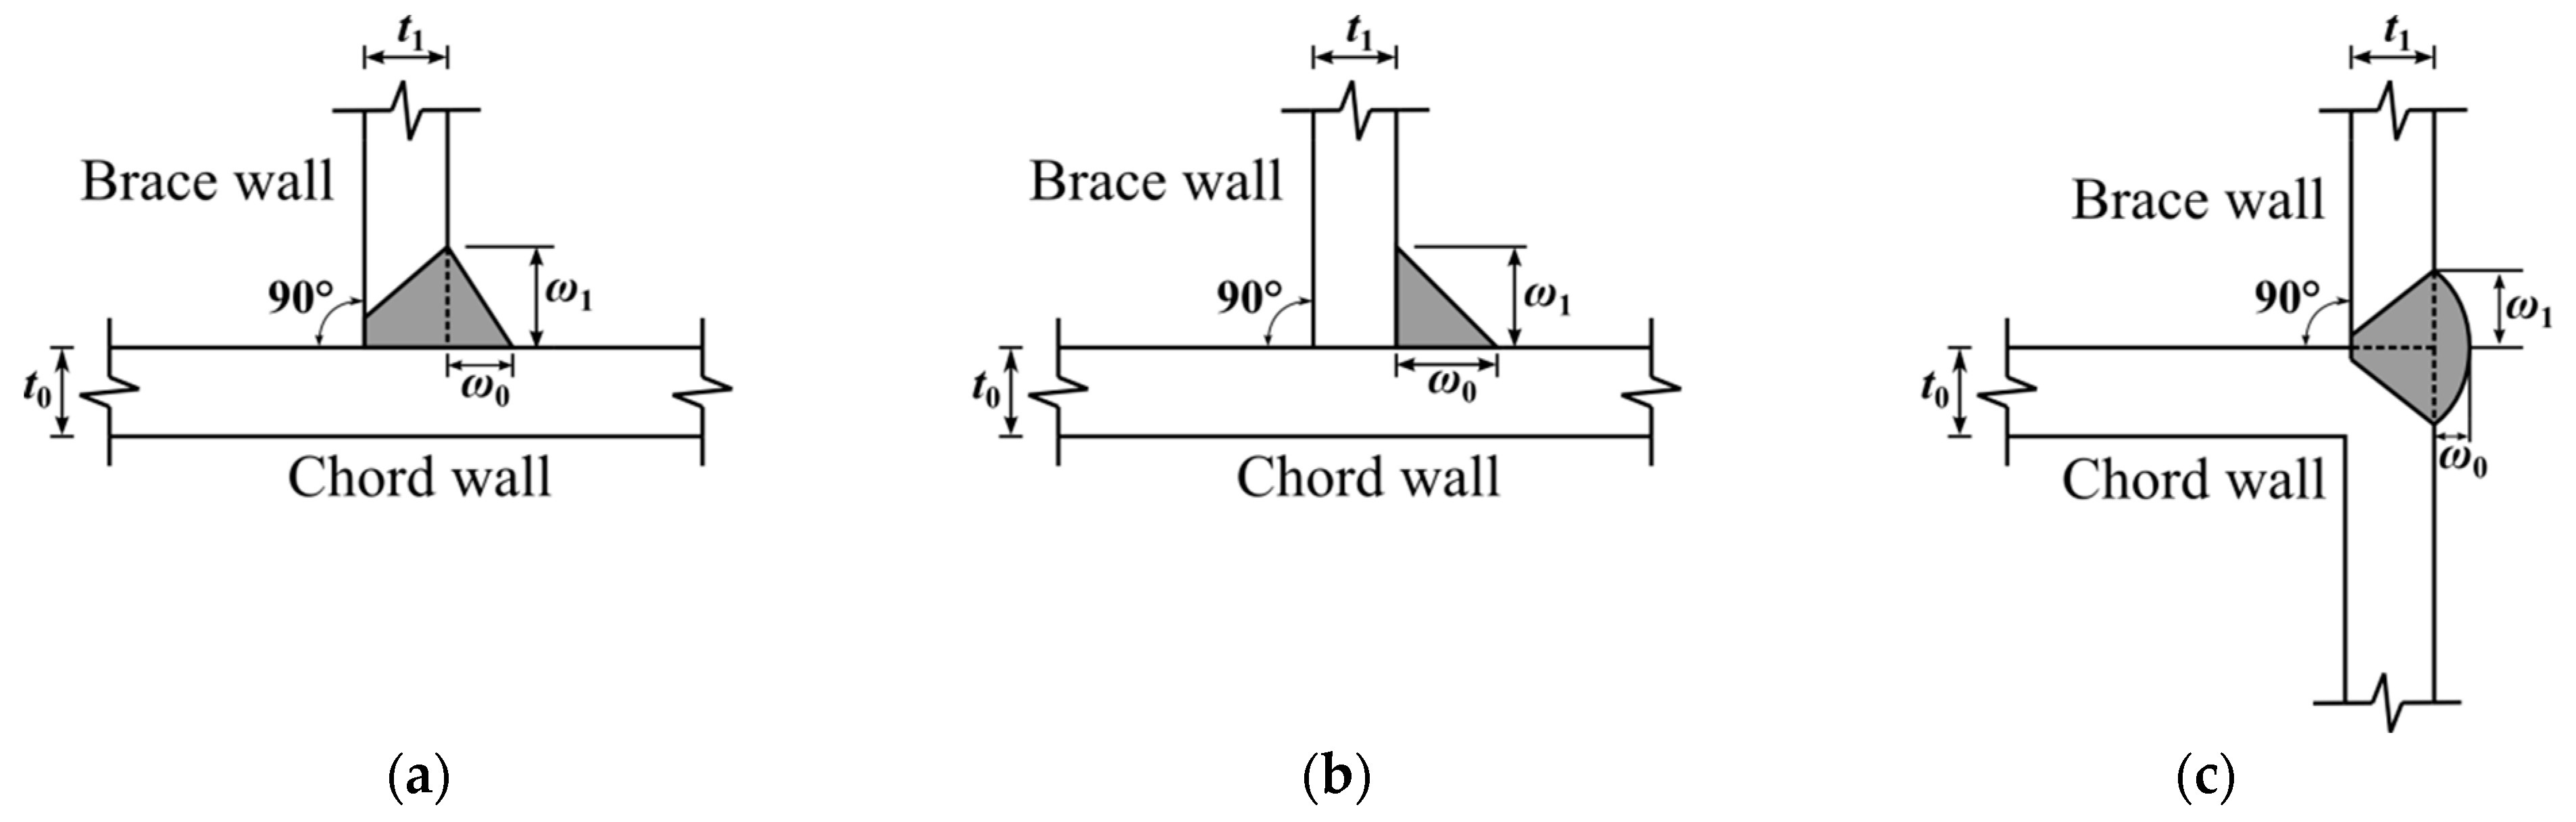
Figure 1. Definitions of geometrical parameters.
Symmetry 16 01082 g001
Figure 2. Hot spot locations: (a) SHS-SHS joint; (b) SHS-CFSHS joint.
Symmetry 16 01082 g002
Figure 3. Profiles and geometries of weld: (a) Butt weld; (b) Fillet weld; (c) Weld for full width joints.
Symmetry 16 01082 g003
Figure 4. FE model of a SHS-CFSHS T-joint.
Symmetry 16 01082 g004
Figure 5. Boundary conditions: (a) Axial force in the brace; (b) In-plane bending in the brace; (c) Axial force in the chord; (d) In-plane bending in the chord.
Symmetry 16 01082 g005
Figure 6. Comparisons of SCFs between FE results and experimental results: (a) Specimen 1; (b) Specimen 2; (c) Specimen 3; (d) Specimen 4.
Symmetry 16 01082 g006aSymmetry 16 01082 g006b
Figure 7. Graphs for SCFs in SHS-CFSHS T-joints under in-plane bending in the brace: (a) Line A; (b) Line B; (c) Line C; (d) Line D; (e) Line E.
Symmetry 16 01082 g007
Figure 8. Graphs for SCFs in SHS-CFSHS T-joints under axial force in the chord: (a) Line C; (b) Line D.
Symmetry 16 01082 g008
Figure 9. Graphs for SCFs in SHS-CFSHS T-joints under in-plane bending in the chord: (a) Line C; (b) Line D.
Symmetry 16 01082 g009
Figure 10. Comparisons of SCFs between proposed formulae and FE analysis: (a) In-plane bending in the brace; (b) Axial force in the chord; (c) In-plane bending in the chord.
Symmetry 16 01082 g010aSymmetry 16 01082 g010b
Figure 11. Comparisons of SCFs between SHS-SHS joints and SHS-CFSHS joints: (a) Axial force in the brace; (b) In-plane bending in the brace; (c) Axial force in the chord; (d) In-plane bending in the chord.
Symmetry 16 01082 g011aSymmetry 16 01082 g011b
Table 1. Weld parameters.
TypesApplication Conditionsω0ω1
Butt weldt1 > 8 mmt1/2t1
Fillet weldt1 ≤ 8 mm 2 t 1 2 t 1
Weld for full width jointsfull width joints≥3 mmt1
Table 2. Specimens’ dimensions and measured SCF values by Chiew et al. (2007) [7].
Specimen No.Chord Dimensions (mm)Brace Dimensions (mm)SCFEXP
b0h0t0L0b1h1t1L1ABCDE
135035016413025025016216512.4815.2517.5215.266.26
23503501641302002001621659.3921.8421.7412.062.00
335035016413020020012216510.4813.0615.4010.522.94
435035016413020020010216511.8514.0613.3111.645.36
Disclaimer/Publisher’s Note: The statements, opinions and data contained in all publications are solely those of the individual author(s) and contributor(s) and not of MDPI and/or the editor(s). MDPI and/or the editor(s) disclaim responsibility for any injury to people or property resulting from any ideas, methods, instructions or products referred to in the content.

