Article

Blood Damage Analysis within the FDA Benchmark Nozzle Geometry at Laminar Conditions: Prediction Sensitivities to Software and Non-Newtonian Viscosity Models

by
Gautham Krishnamoorthy
* and
Nasim Gholizadeh
Department of Chemical Engineering, University of North Dakota, Grand Forks, ND 58202-7101, USA
*
Author to whom correspondence should be addressed.
Symmetry 2024, 16(9), 1165; https://doi.org/10.3390/sym16091165
Submission received: 11 July 2024 / Revised: 3 August 2024 / Accepted: 5 August 2024 / Published: 6 September 2024
(This article belongs to the Special Issue Applications Based on Symmetry/Asymmetry in Fluid Mechanics)

Abstract

:
There is a prevailing consensus that most Computational Fluid Dynamics (CFD) frameworks can accurately predict global variables under laminar flow conditions within the Food and Drug Administration (FDA) benchmark nozzle geometry. However, variations in derived variables, such as strain rate and vorticity, may arise due to differences in numerical solvers and gradient evaluation methods, which can subsequently impact predictions related to blood damage and non-Newtonian flow behavior. To examine this, flow symmetry indices, vortex characteristics, and blood damage—were assessed using Newtonian and four non-Newtonian viscosity models with CFD codes Ansys Fluent and OpenFOAM on identical meshes. At Reynolds number (Re) 500, symmetry breakdown and complex vortex shapes were predicted with some non-Newtonian models in both OpenFOAM and Ansys Fluent, whereas these phenomena were not observed with the Newtonian model. This contradicted the expectation that employing a non-Newtonian model would delay the onset of turbulence. Similarly, at Re 2000, symmetry breakdown occurred sooner (following the sudden expansion section) with the non-Newtonian models in both Ansys Fluent and OpenFOAM. Vortex identification based on the Q-criterion resulted in distinctly different vortex shapes in Ansys Fluent and OpenFOAM. Blood damage assessments showed greater prediction variations among the non-Newtonian models at lower Reynolds numbers.

1. Introduction

Numerical simulations aimed at predicting the transition from laminar to turbulent flow (with throat Reynolds numbers (Re) ranging from 2000 to 3500) within the Food and Drug Administration (FDA) benchmark nozzle geometry (Figure 1a) face considerable challenges. However, there is a general consensus that laminar flow behavior (Re < 2000) within the FDA benchmark nozzle geometry can be accurately predicted. This has been demonstrated through various computational fluid dynamics (CFD) methodologies and has been summarized in Table 1. However, just as small variations in geometric configuration (such as eccentricity) and disturbances in inflow conditions can trigger a transition to turbulence, subtle differences in derived variable predictions, such as strain rates and vorticities resulting from differences in numerical solvers and gradient evaluation methods among different CFD solvers can result in vortex shape differences and transition onset identification. These differences in the derived variables may be further exacerbated when non-Newtonian models are employed to model the blood viscosity.
Therefore, this paper presents a numerical simulation study that highlights the challenges and complexities associated with predicting the transition from laminar to turbulent flow within the FDA benchmark nozzle geometry, focusing on Reynolds numbers (Re) ranging from 500 to 2000 employing only laminar models to simulate the flow. Additionally, prediction sensitivities to modeling blood viscosity using different non-Newtonian model formulations were explored. The importance of this study lies in its focus on the complexities and challenges of accurately predicting the transition from laminar to turbulent flow within the FDA benchmark nozzle geometry.

1.1. Flow Symmetry within the FDA Benchmark Nozzle in the Laminar Regime (Re < 2000)

As detailed in Table 1, flow conditions at Reynolds number (Re) 500 within the FDA benchmark nozzle are expected to remain symmetric throughout. However, jet breakdown or asymmetry has been observed at Re 2000, occurring between 0.032 m and 0.06 m of the sudden expansion region. In the biomedical field, flow symmetry is crucial for achieving harmonious biological flow patterns ensuring the safety and efficacy of medical procedures and outcomes for patients. For instance, symmetric flow is essential to minimize turbulence and reduce the risk of damage to cells and vessel walls. Disruptions in flow symmetry can alter the forces and velocities within the fluid, potentially leading to cell deformation, blood clot formation (thrombosis), or cell damage (hemolysis).
Studies by Sobey and Drazin [20] demonstrate that a symmetric flow through a channel with an expanding throat becomes asymmetrical as the Reynolds number increases (Re = 384). Although the studies listed in Table 1 report a general agreement on global flow variables (such as velocity profiles) in this regime, variations in symmetry breakdown and vortex shape predictions can arise due to differences in numerical solvers and gradient evaluation methods. These variations, which are dependent on velocity derivatives like strain rate and vorticity, can occur even after achieving grid-independent results for global variables such as velocity and pressure. Recognizing these prediction variations among different CFD frameworks is important, particularly when CFD predictions are used to optimize device geometry based on the identification of stagnation zones or vortices that could promote hemolysis.
Contribution #1 of this study: To address the identified gap, this study first examines symmetry breakdown and vortex predictions for a Newtonian fluid using the commercial code Ansys Fluent [21] and OpenFOAM [22] on identical meshes. The analysis is limited to steady-state, laminar flow solvers in both frameworks to eliminate the effects of turbulent wall functions and time discretization variations.

1.2. Newtonian vs. Non-Newtonian Viscosity Model Effects in the Laminar Regime (Re < 2000)

Even within the laminar regime (Re < 2000), predicting clot formation (thrombosis) in blood-contacting devices remains challenging. From a fluid mechanics perspective, shear stresses and viscosity are critical in the thrombosis process, which involves platelet aggregation, platelet activation, and the formation of a gel-like mesh by fibrin proteins in blood plasma. The viscosity of red blood cells, which depends on hematocrit content, influences the flow and transport characteristics of platelets in recirculation zones resulting from abrupt changes in flow direction or cross-section. While various Newtonian and non-Newtonian viscosity models have been proposed to characterize blood’s transport properties, the choice of model can affect flow characteristics and thrombosis prediction, as summarized in Table 2. Key conclusions from Table 2 include: non-Newtonian viscosity models have been shown to delay thrombus formation due to their shear-thinning behavior, and flow geometry and inlet boundary conditions have a more significant impact on flow characteristics than the choice of non-Newtonian model. There is no consensus on which non-Newtonian model formulation offers the highest fidelity.
Contribution #2 of this study: This study investigates the sensitivity of symmetry breakdown and vortex shapes to four non-Newtonian (shear-thinning) viscosity models in both Ansys Fluent and OpenFOAM. The study aims to explore prediction variations across both frameworks regarding symmetry breakdown and vortex shapes as indicators of thrombus formation. Additionally, since non-Newtonian viscosities depend on strain rates, the study examines whether symmetry and vortex shape prediction variations between the two frameworks are exacerbated in non-Newtonian simulations.

1.3. Non-Newtonian Simulations of the FDA Nozzle

Non-Newtonian model studies conducted within the FDA nozzle geometry under well-characterized inflow conditions are summarized in Table 3. From this table, it is evident that while differences between Newtonian and non-Newtonian models become more pronounced at lower Reynolds numbers (Re) within this device, there is no consensus on the impact of viscosity models on shear stresses, pressure drop, and hemolysis.
Contribution #3 of this study: To address this gap, this study examines the sensitivity of hemolysis predictions to non-Newtonian models within the Ansys Fluent framework.

1.4. Prediction Sensitivity to Software

While Table 1 demonstrates that various CFD methodologies can adequately represent global variables and overall flow characteristics (at Re < 2000) within the FDA nozzle, subtle differences in vortex identification may arise due to variations in gradient prediction methods among CFD frameworks. These differences are illustrated in Table 4, which compares two established CFD codes, Ansys Fluent [21] and OpenFOAM [22]. Recognizing these variations is crucial, particularly when optimizing device geometry based on the identification of stagnation zones or vortices that could promote hemolysis. Examining these prediction variations is especially important in the context of vortex identification, as highlighted in Table 5, given its increasingly significant role when CFD simulations are being employed to guide the design of medical devices.

2. Materials and Methods

Detailed dimensions and specifications of the FDA benchmark nozzle geometry are shown in Figure 1a, along with different axial distances following the sudden expansion where the results of this study are reported. Fully developed flow velocity profiles were imposed for both Newtonian and non-Newtonian scenarios by simulating a straight pipe (diameter: 0.012 m) with a constant velocity at the inlet and allowing the velocity profiles to evolve to fully developed conditions at the outlet by making the pipe sufficiently long. The velocity profiles at the outlet were then imposed at the inlet of the FDA nozzle simulations. Three hexahedral-dominant mesh configurations with cell counts—coarse [231 K], medium [439 K], and fine [966 K]—were used to discretize the domain and were employed in both Ansys Fluent and OpenFOAM. The simulations were performed at Reynolds numbers (Re) 500 and 2000, incorporating both Newtonian and non-Newtonian fluid properties. For Newtonian fluid simulations, constant density (1056 kg/m³) and viscosity (0.0035 cp) were assumed, while non-Newtonian fluid properties were evaluated using four commonly used viscosity models: Cross, Power Law, Carreau–Yasuda (CY), and Casson, to account for variations in fluid behavior. The non-Newtonian viscosity models were implemented in Ansys Fluent as user-defined functions. The different non-Newtonian viscosity model formulations and corresponding parameters are summarized in Table 6. The shear-thinning viscosity predicted by the different models is shown in Figure 1b.

3. Results

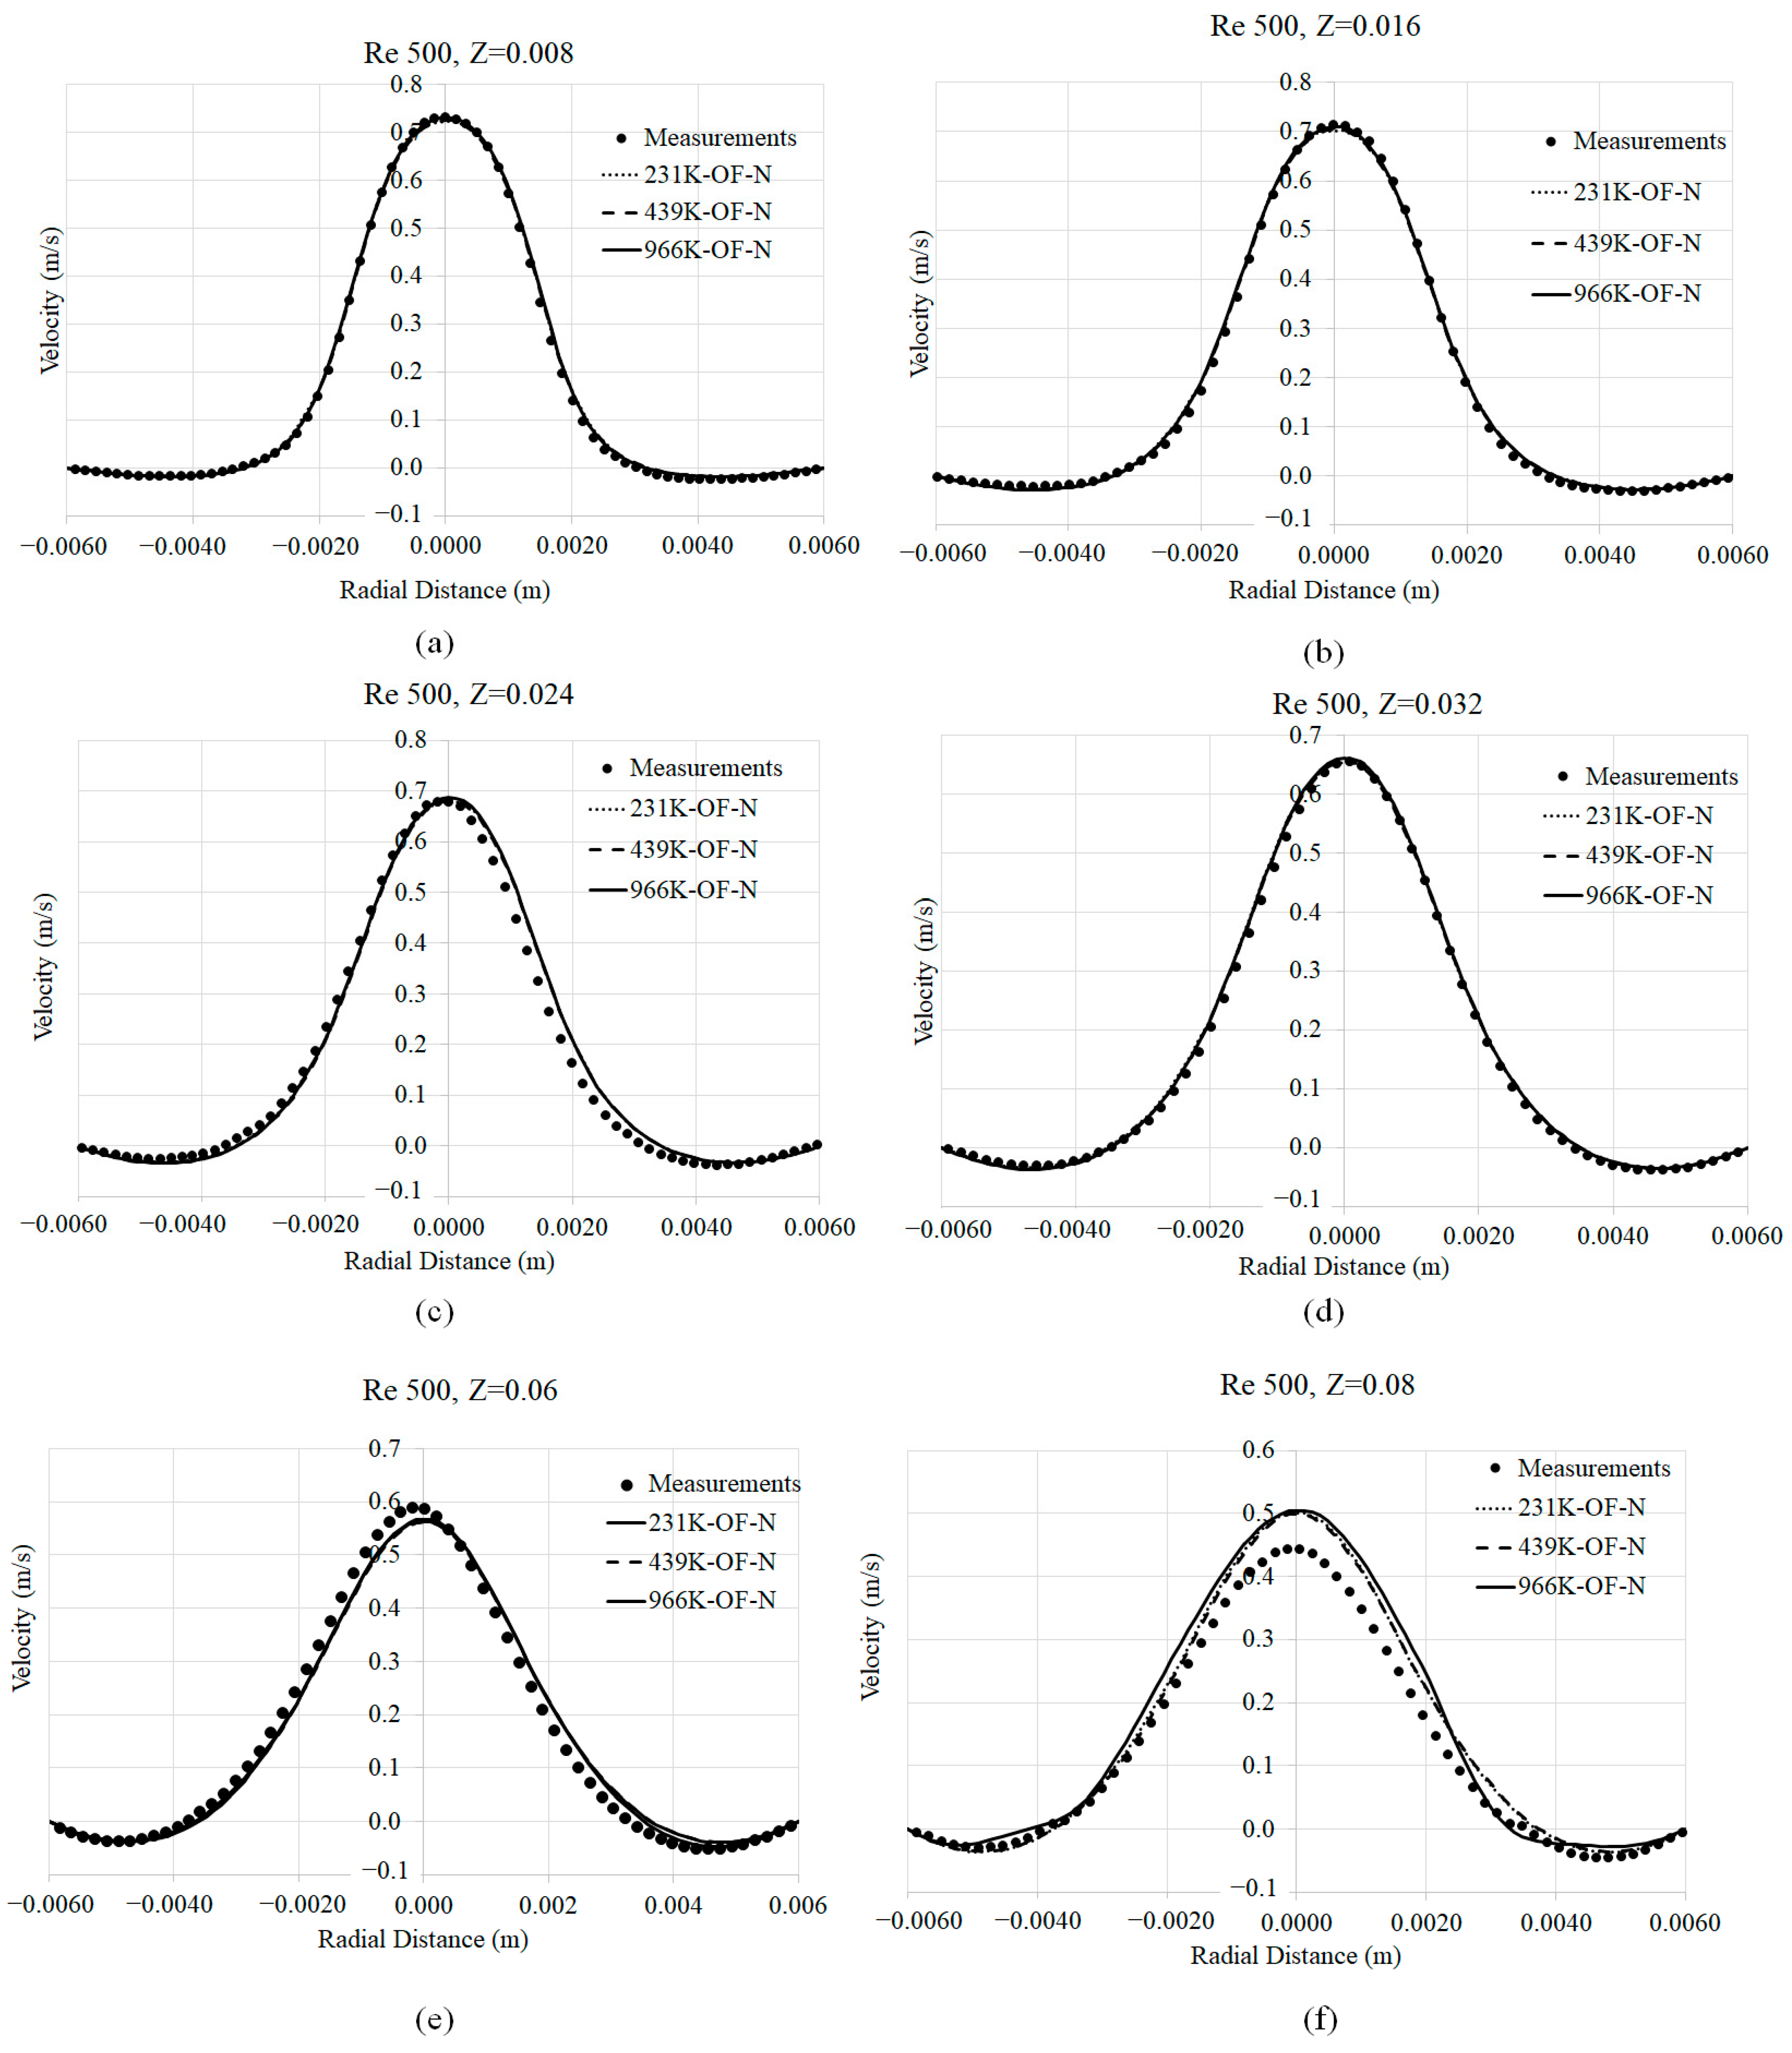
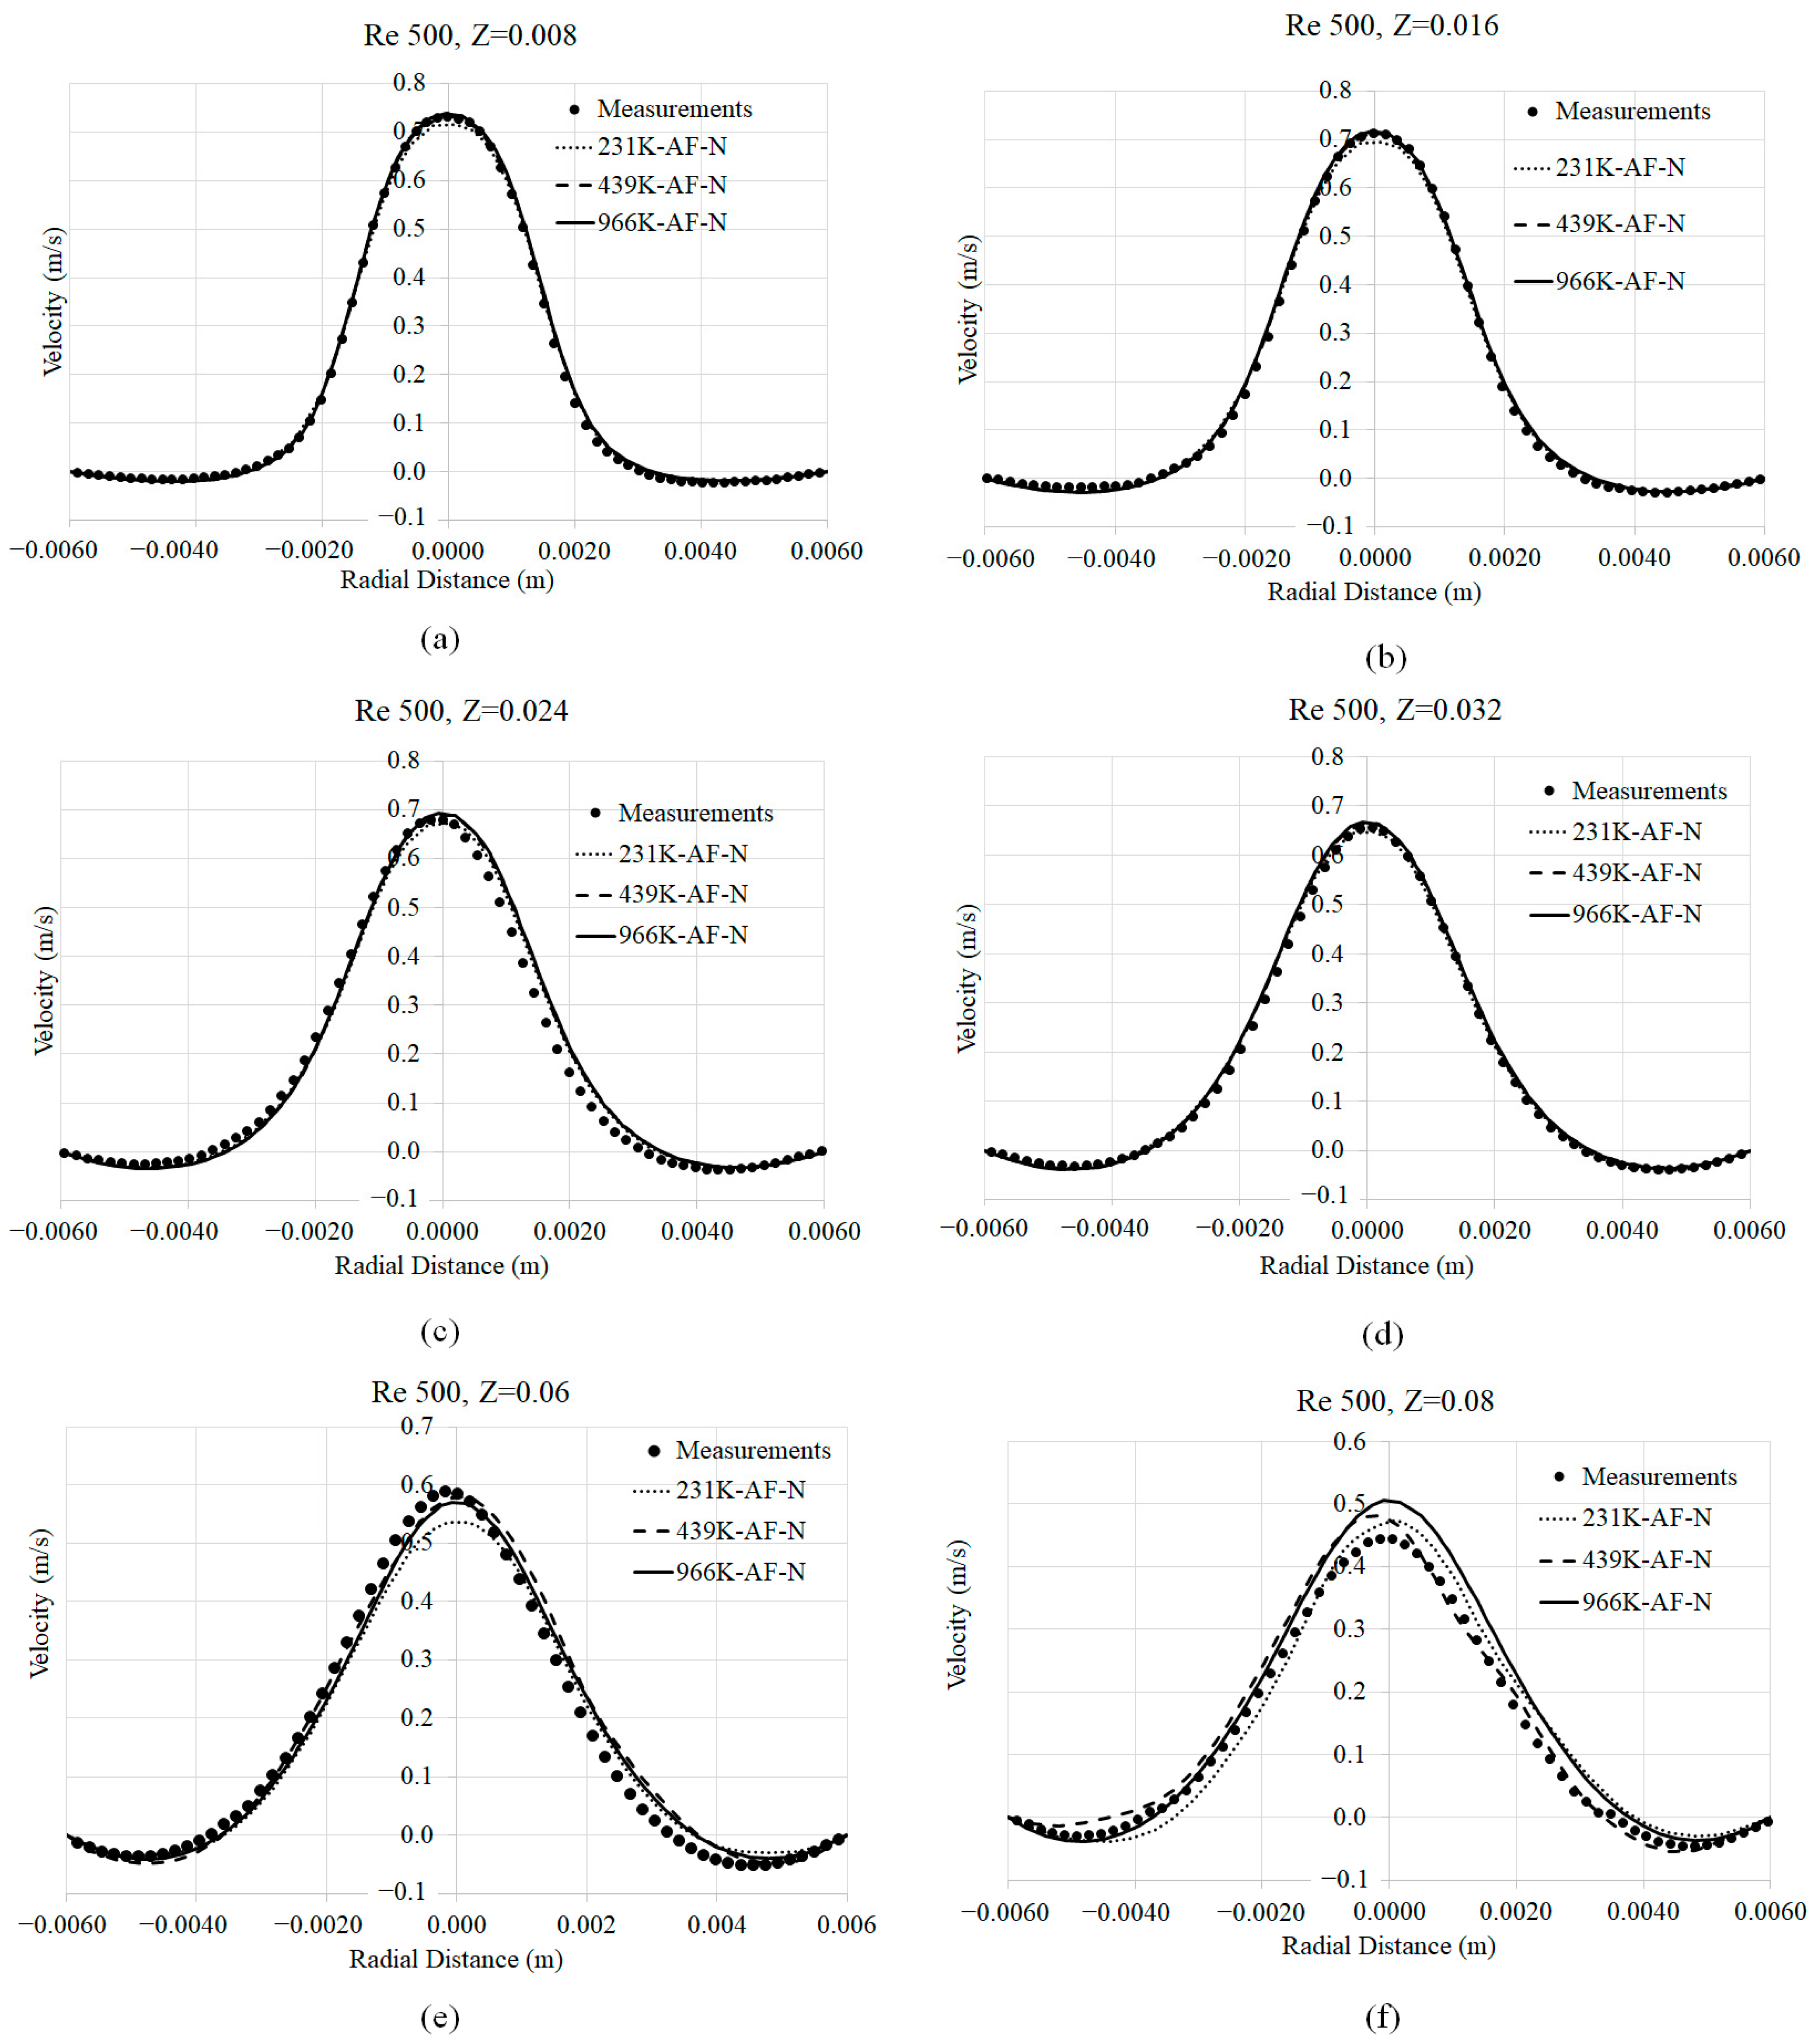
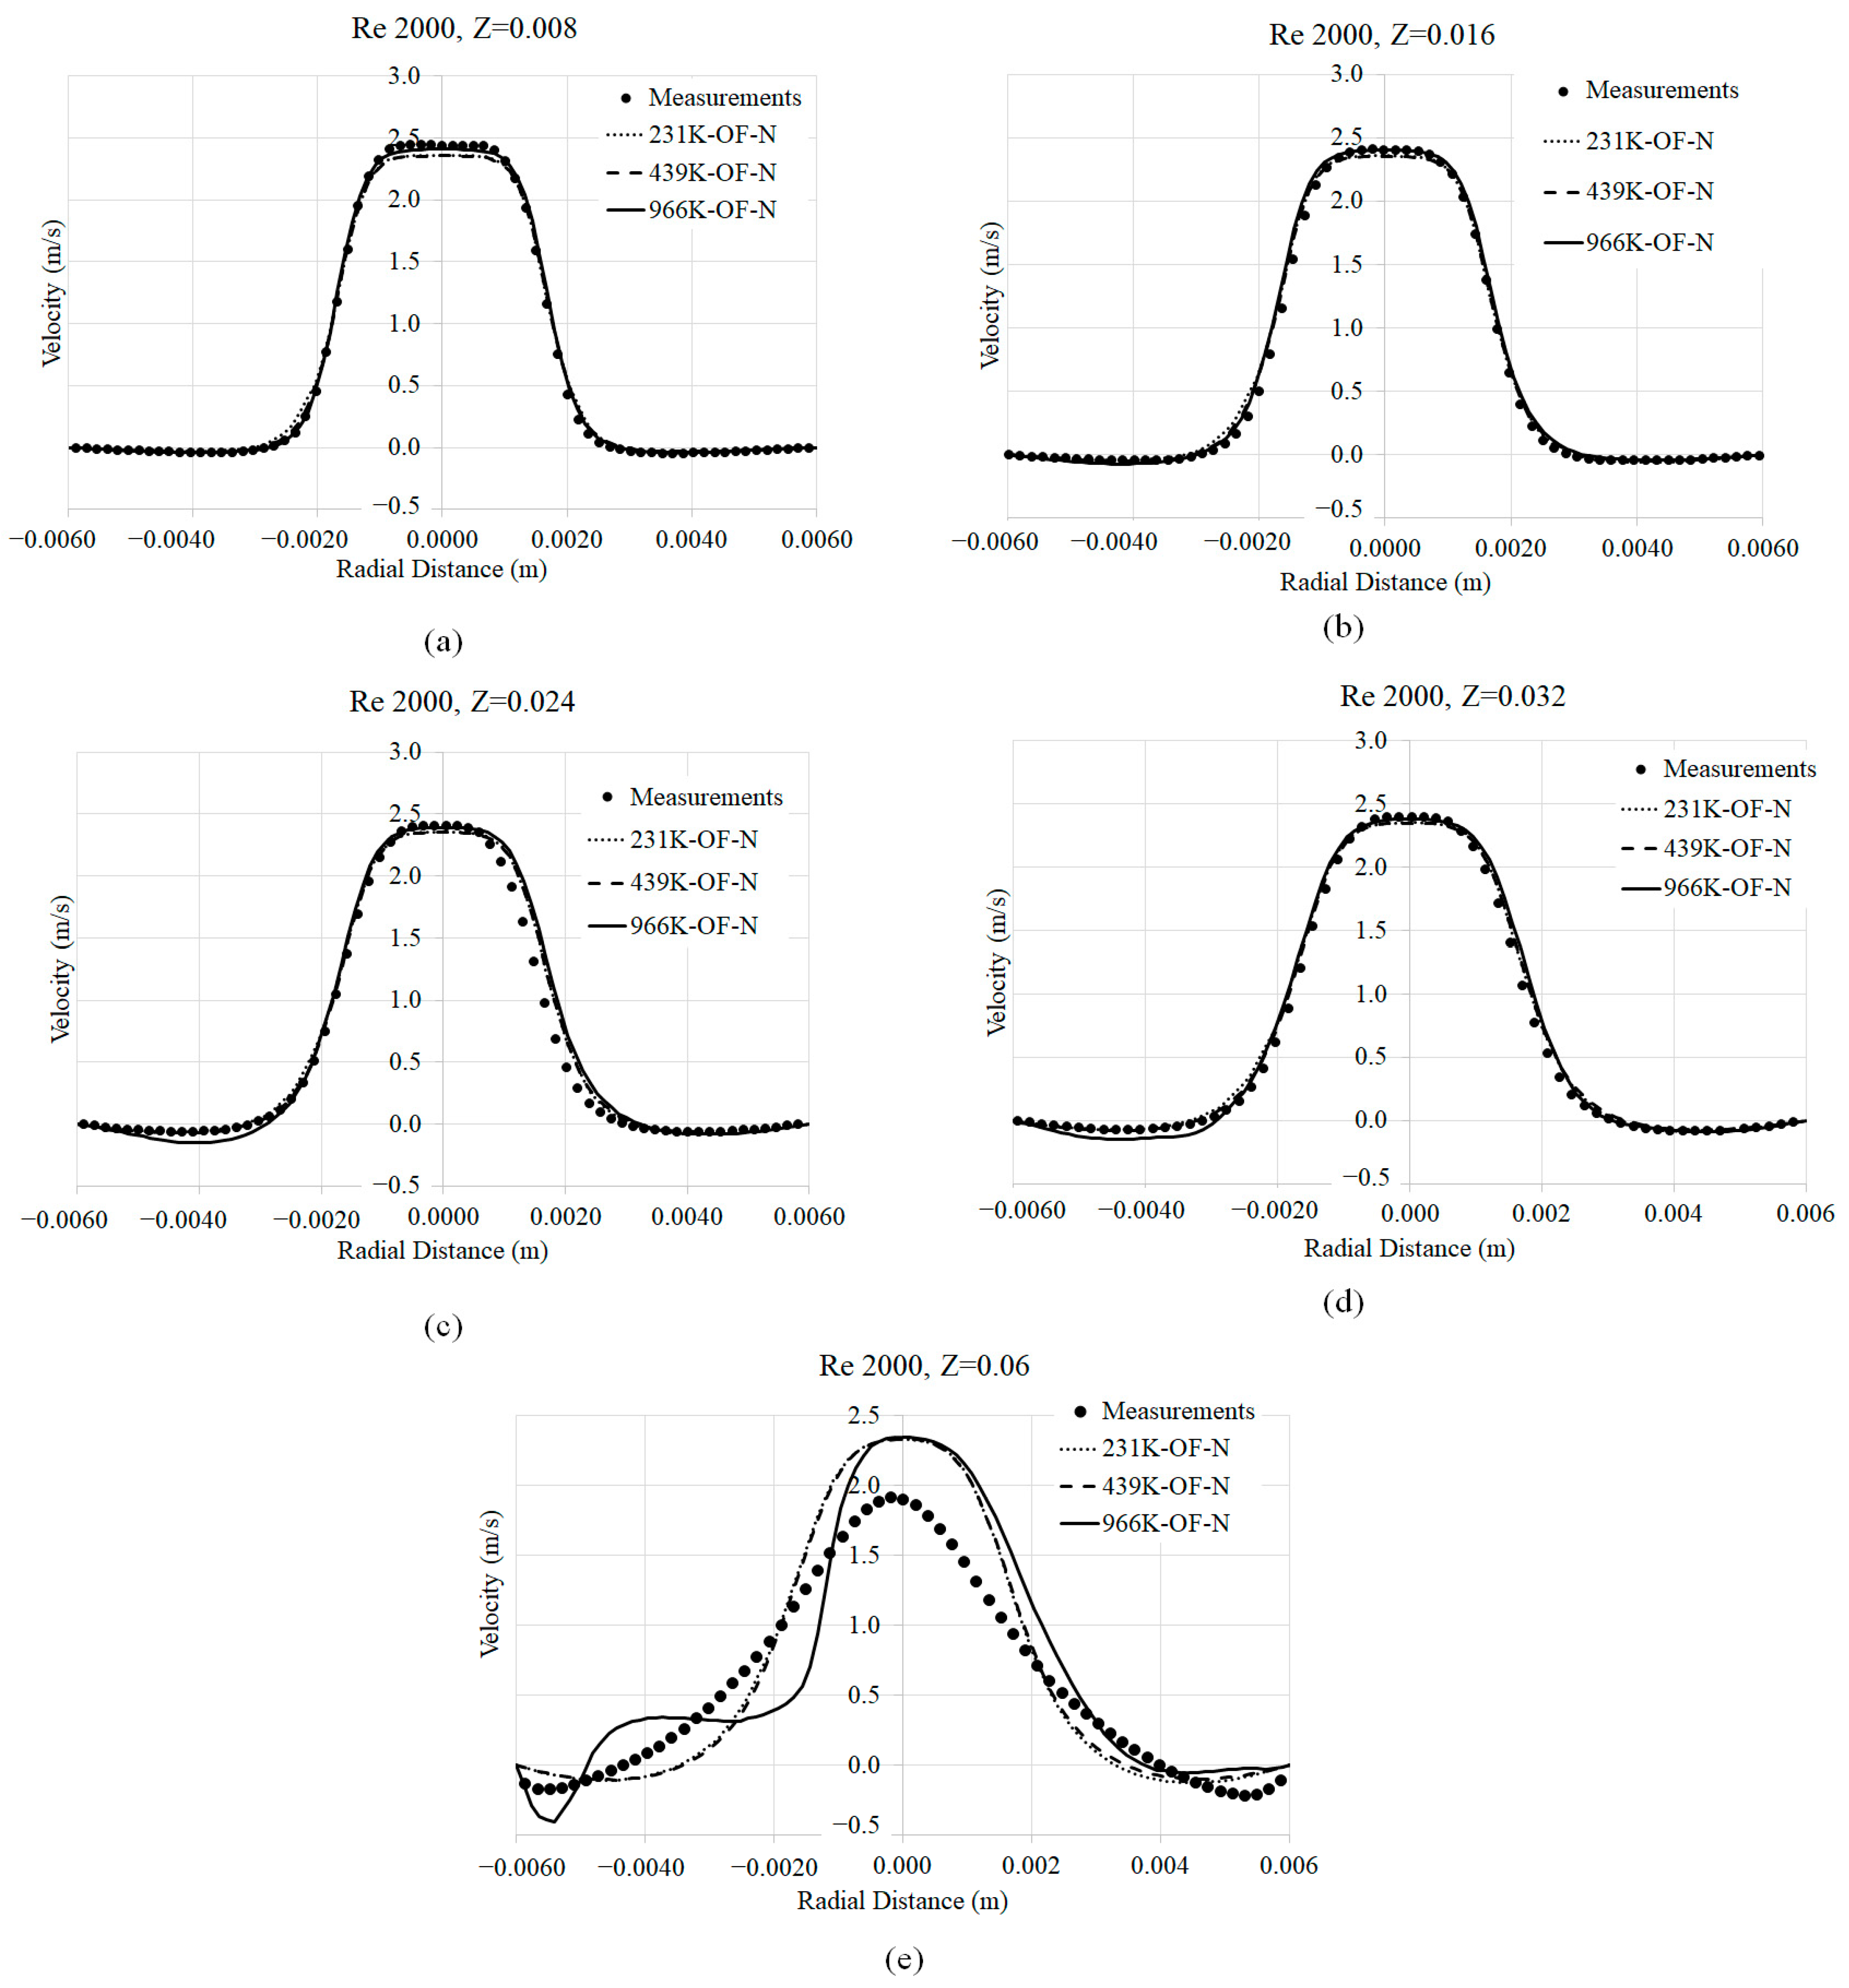
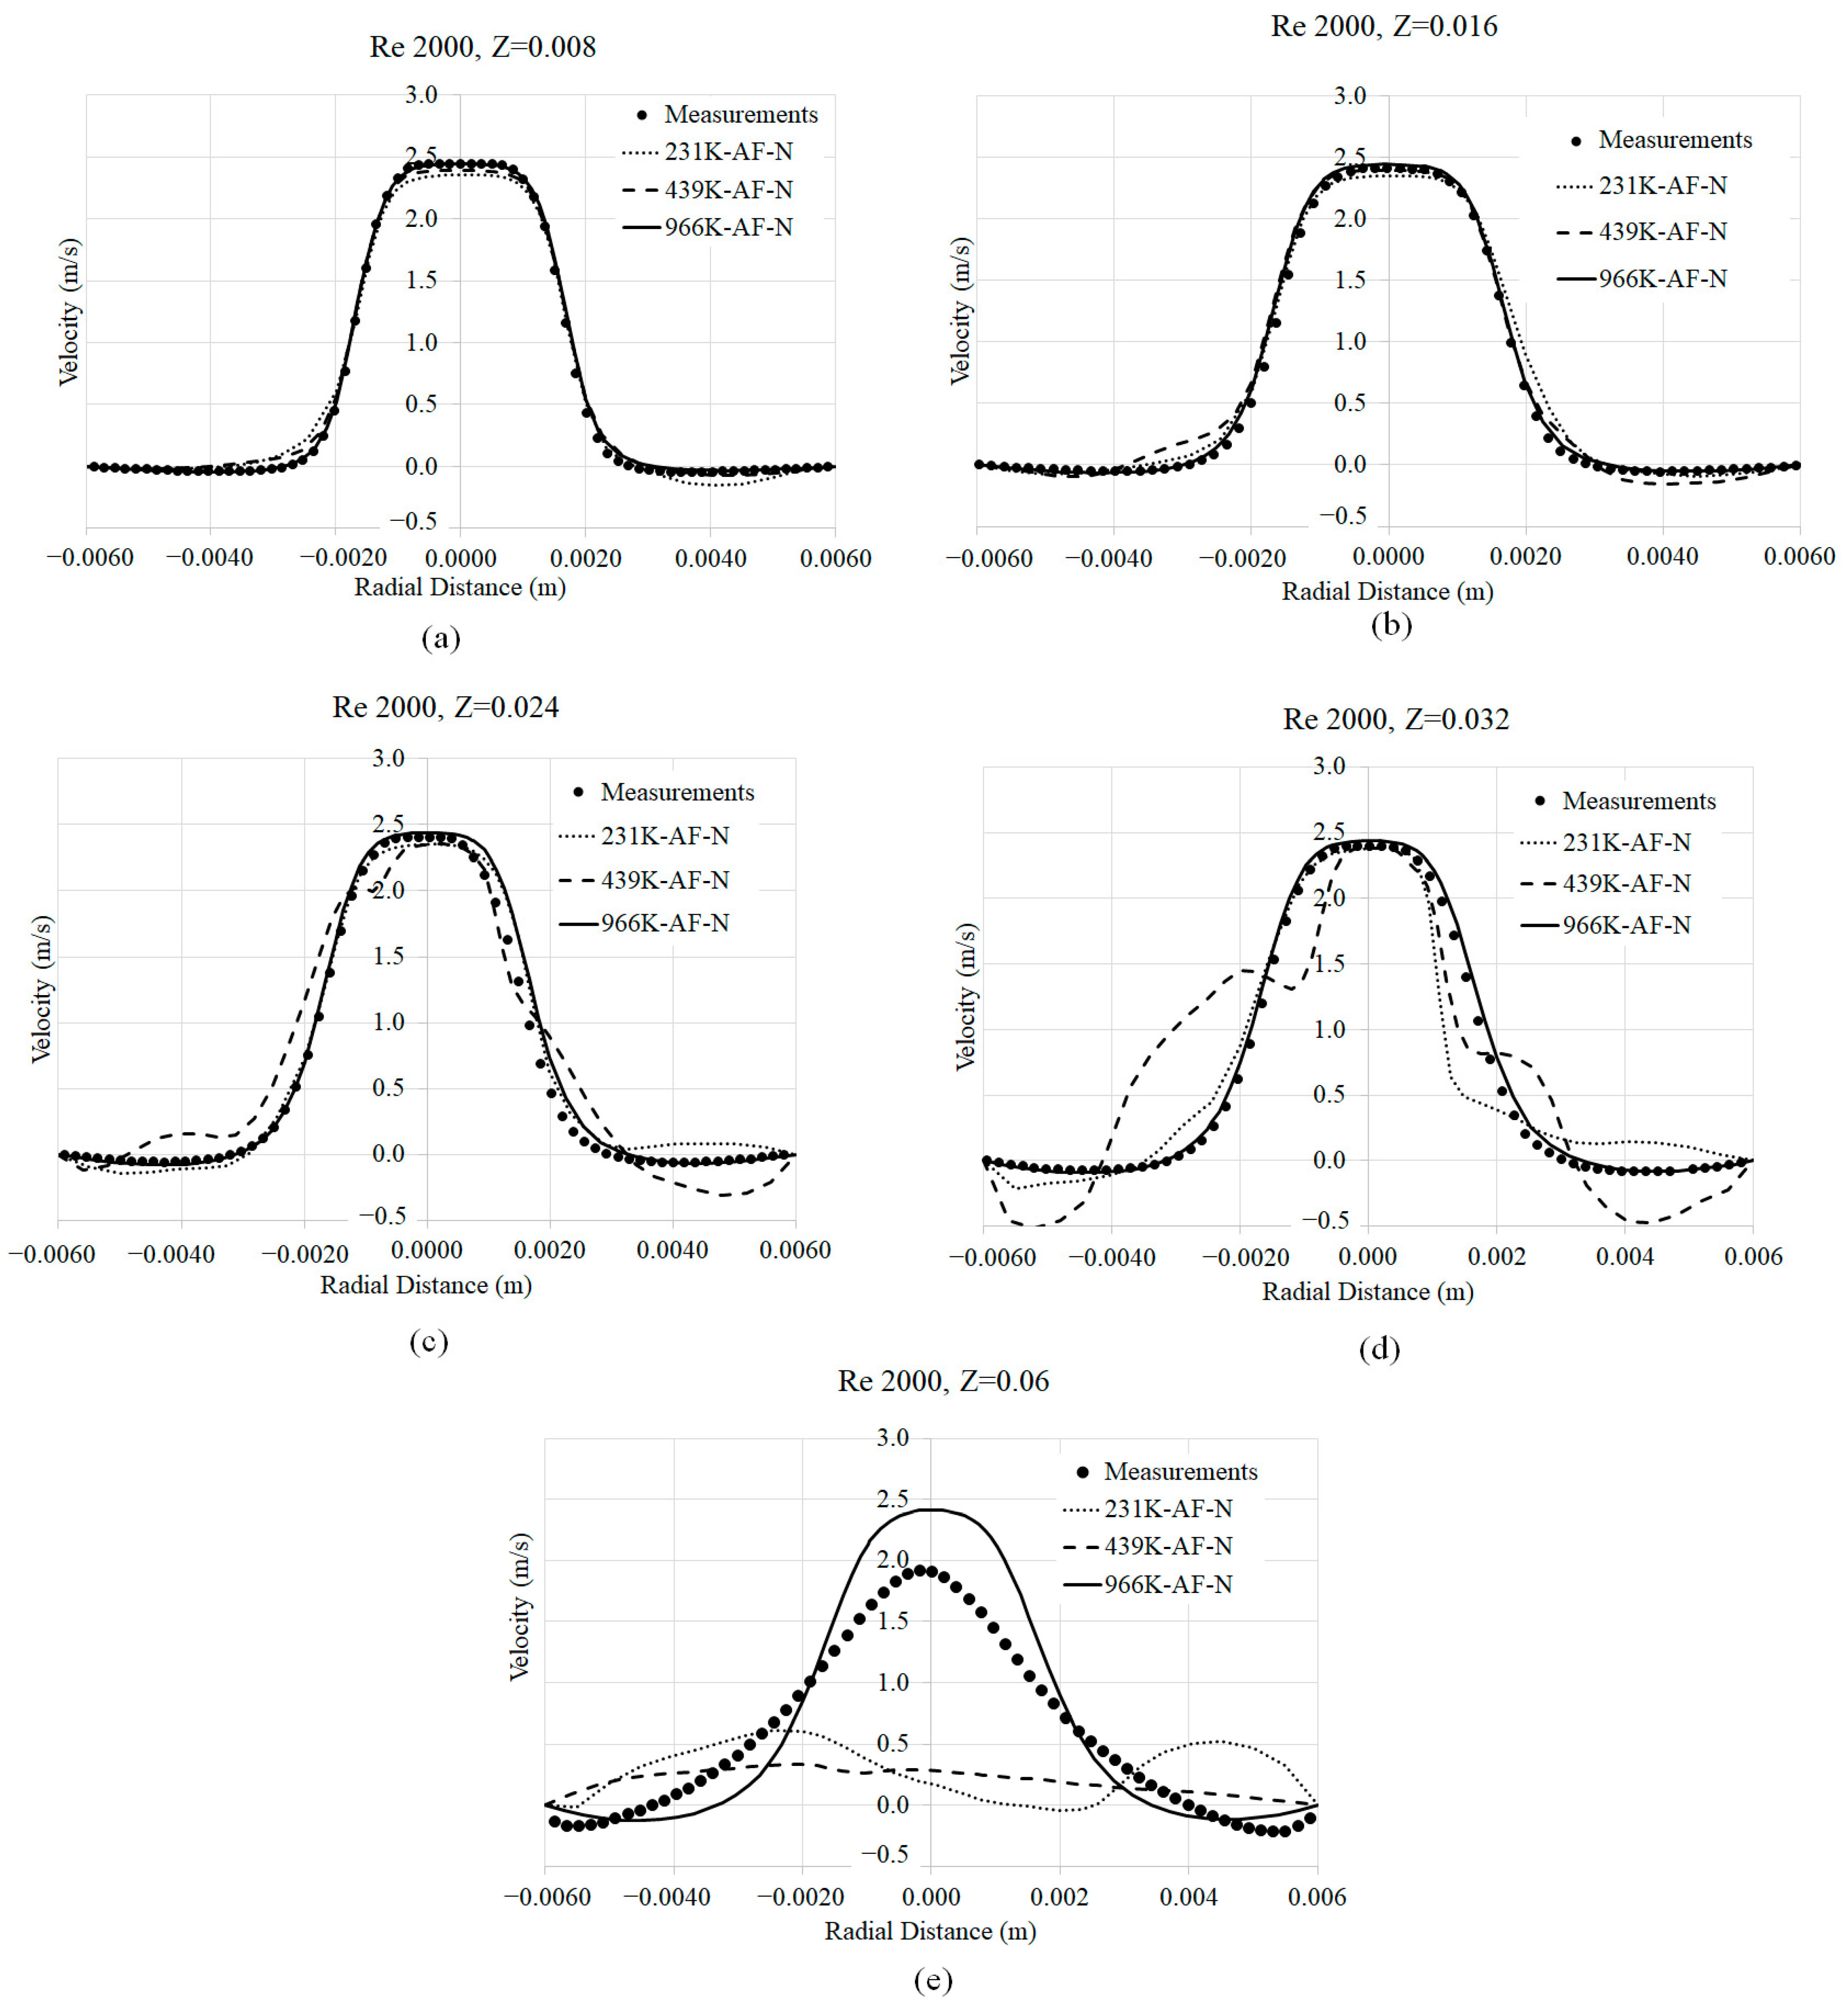
3.1. Mesh Convergence

Convergence in the axial velocity across both Ansys Fluent and OpenFOAM frameworks at the three mesh resolutions is showcased in Figure 2, Figure 3, Figure 4 and Figure 5.
At Re 500, velocity predictions from both OpenFOAM (Figure 2) and Ansys Fluent (Figure 3) are in good agreement with experimental measurements [13,14] at all three mesh resolutions, with a radially symmetric profile being maintained through z = 0.06 m. At Re 500, slight differences in the velocity profiles at z = 0.06 m between the coarse and medium/fine mesh simulations are observed in Ansys Fluent; the symmetry indices, vortex identification and blood damage calculations are all reported in the finest mesh (966K) employed in this study.
Similarly, at Re 2000, data shows good agreement with experimental results for both CFD software platforms OpenFOAM version 9 and Ansys Fluent version 2023 R2 (Figure 4 and Figure 5). In the case of Ansys Fluent prediction, results start to deviate at Z = 0.032, whereas, in OpenFOAM, similar symmetry degeneration occurs at Z = 0.06 m.
Axial velocities (shown in Figure 2, Figure 3, Figure 4 and Figure 5) indicate that grid-independent results have been obtained employing the 966 K mesh up to an axial distance of Z = 0.06 in most cases. Therefore, all subsequent analyses were performed at this mesh resolution.

3.2. Axial Velocity Prediction Sensitivity to Viscosity Models

Axial velocity prediction variations with the non-Newtonian models are shown in Figure 6 and Figure 7. The profiles align with our expectations, indicating that non-Newtonian models predict lower peak velocities at Re 500 due to enhanced momentum diffusion resulting from higher viscosity. However, a consistent trend in peak velocity variations with non-Newtonian models is not observed across both frameworks. This inconsistency may result from differences in strain rate predictions between the frameworks, which subsequently impact the non-Newtonian viscosity. This will be examined in the context of vortex formation in Section 3.4. At Re 2000, however, the variations in axial velocity predictions between the non-Newtonian models are minimized as the importance of convection relative to diffusion becomes more significant.

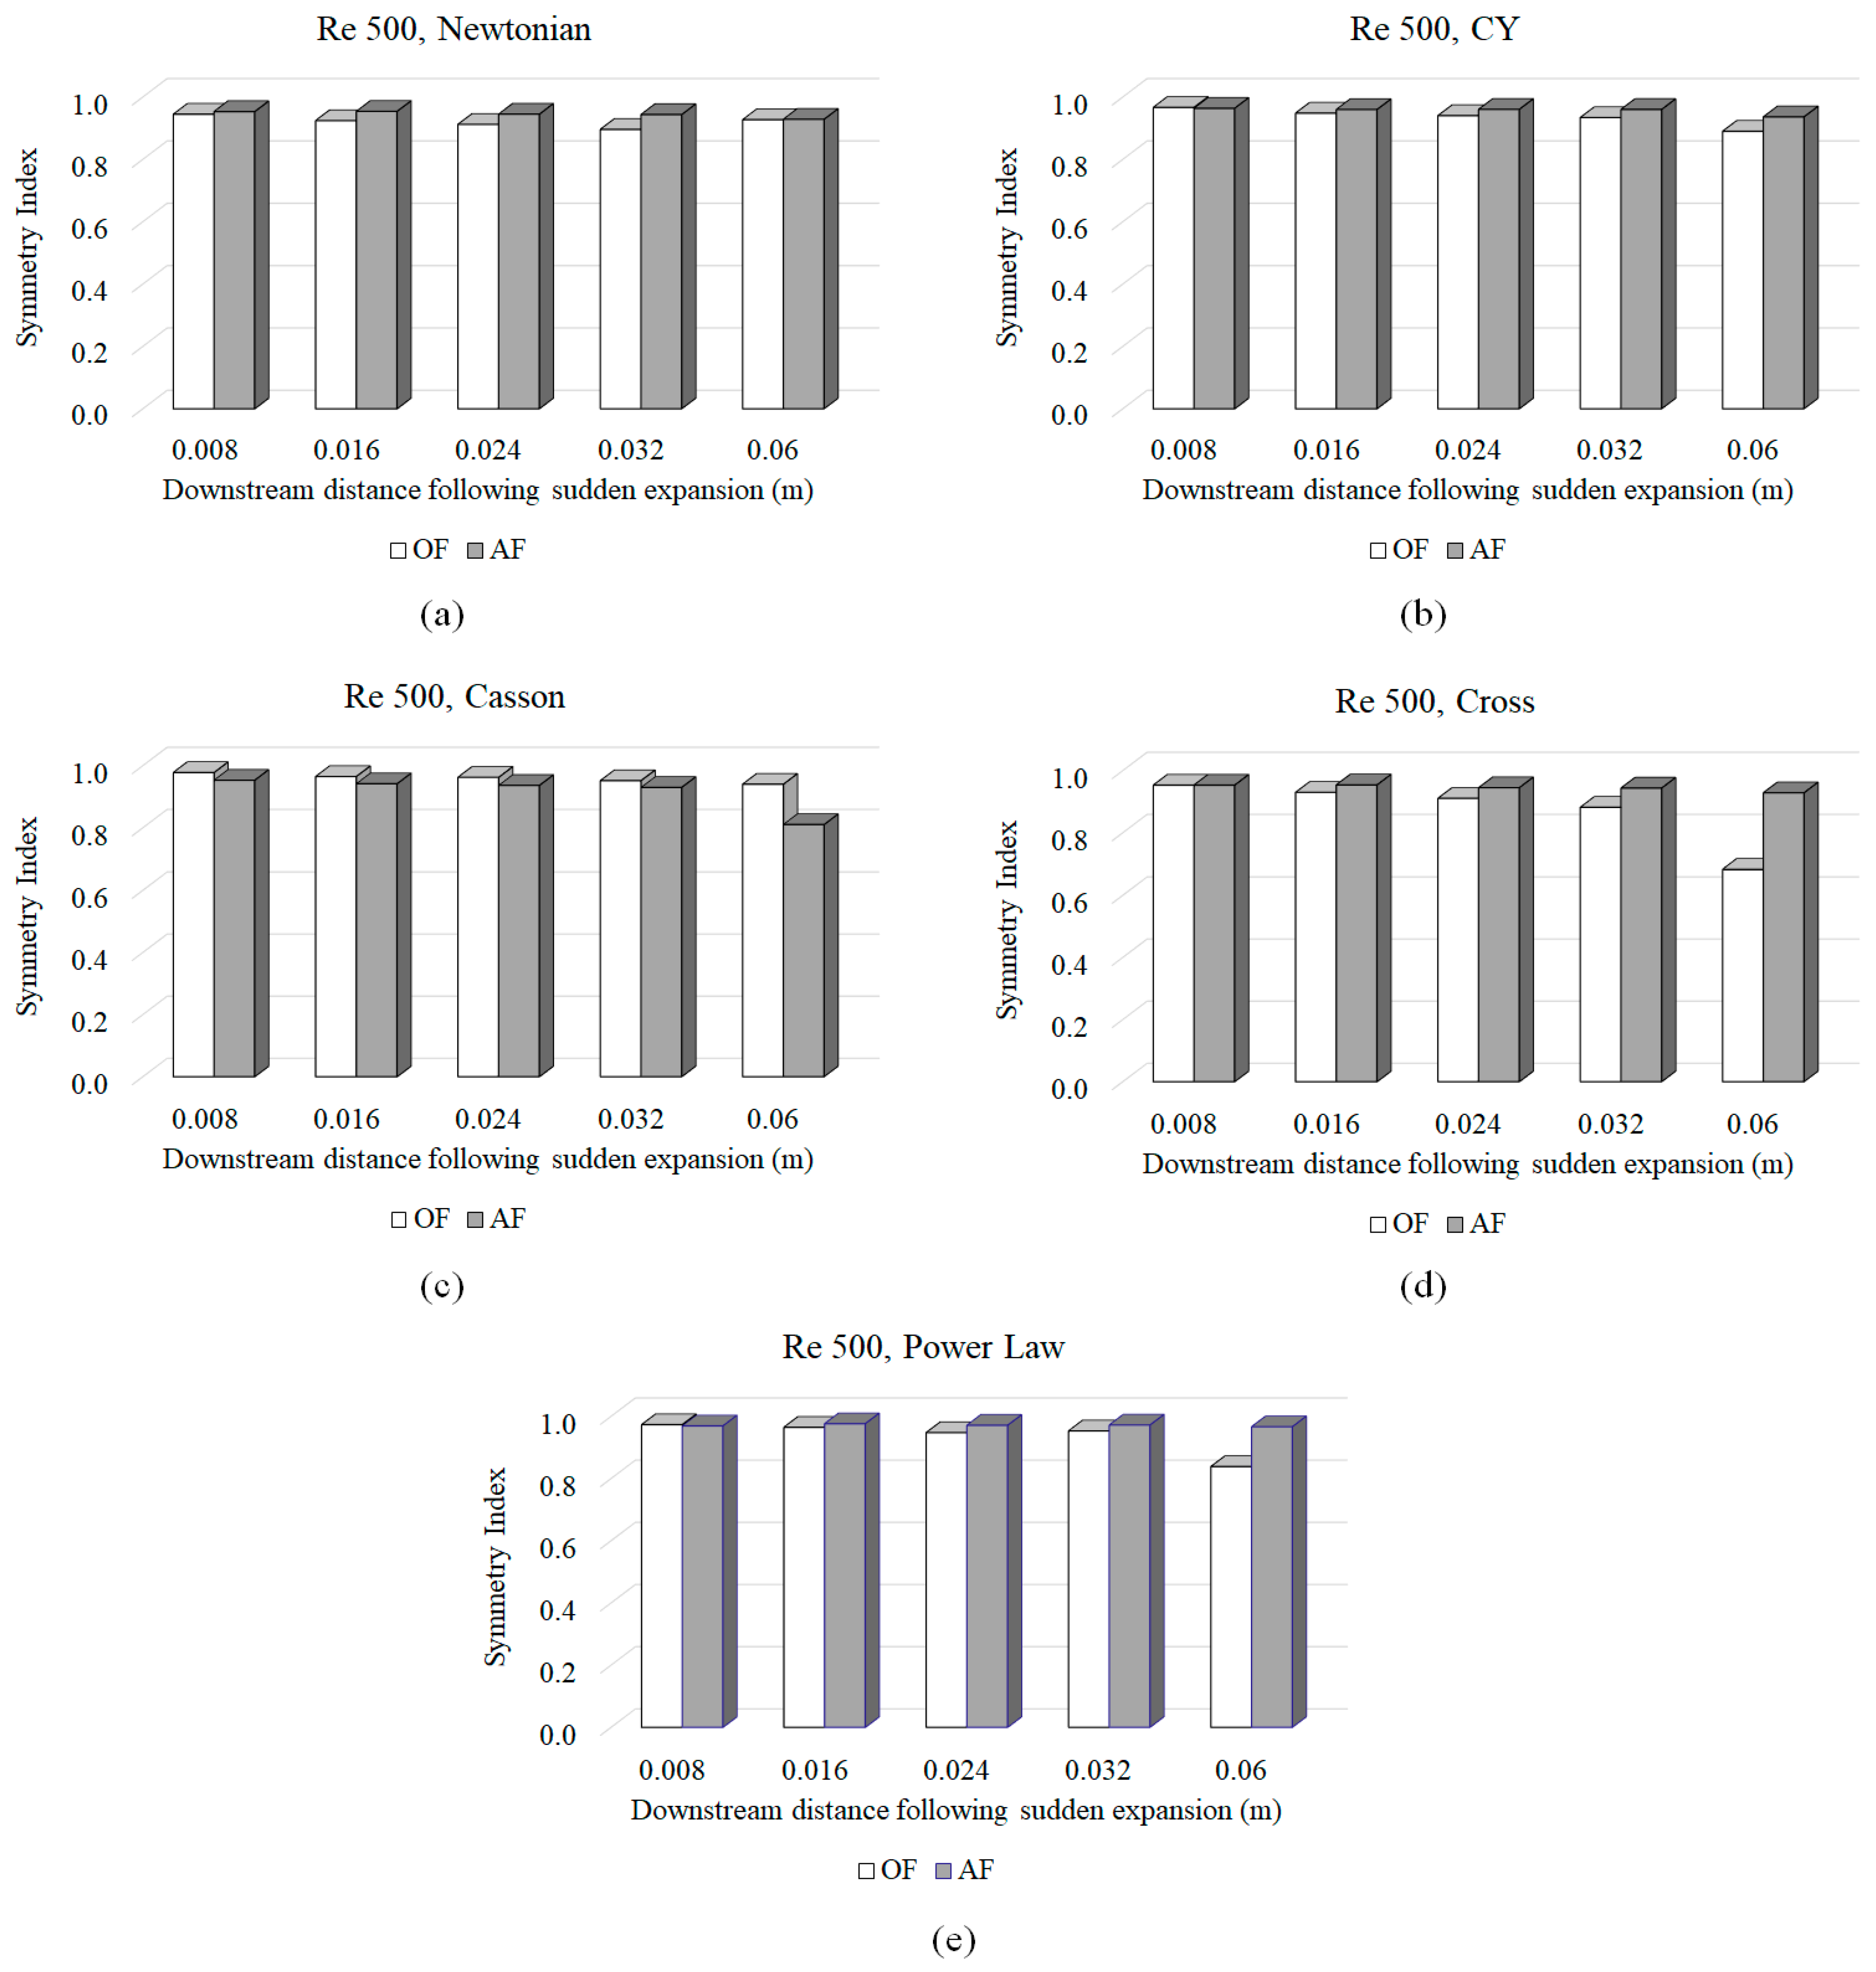
3.3. Symmetry Index (SI)

The symmetry index (SI) is a metric used to evaluate the degree of symmetry in various flow transport parameters. In this study, SI values are calculated using Equations (5) and (6) at different axial distances from the nozzle’s sudden expansion section based on the velocity values along the lines shown in Figure 1a. As illustrated in Figure 8, a significant breakdown of symmetry is observed beyond a radial distance of 0.06 m (at Re 500). This breakdown indicates a point where the flow begins to deviate significantly from a symmetrical pattern, suggesting regions of potential instability or turbulence transition. At 0.06 m, SI predictions from Ansys Fluent are greater than those from OpenFOAM. Unexpectedly, while Newtonian fluid simulations maintained high symmetry across both frameworks, consistent with previous studies listed in Table 1, three non-Newtonian models in OpenFOAM (CY, Cross, Power Law) and one in Ansys Fluent (Casson) show a symmetry breakdown at 0.06 m. This is contrary to the expectation that non-Newtonian models would delay the onset of turbulence. This phenomenon is also observed at Re 2000 (Figure 9), where a symmetry breakdown occurred sooner (following the sudden expansion section) with all non-Newtonian models in both Ansys Fluent and OpenFOAM, while the Newtonian fluid in AF maintained its symmetry. However, a consistent pattern in SI variations with different non-Newtonian models is not discernible from Figure 8 and Figure 9.

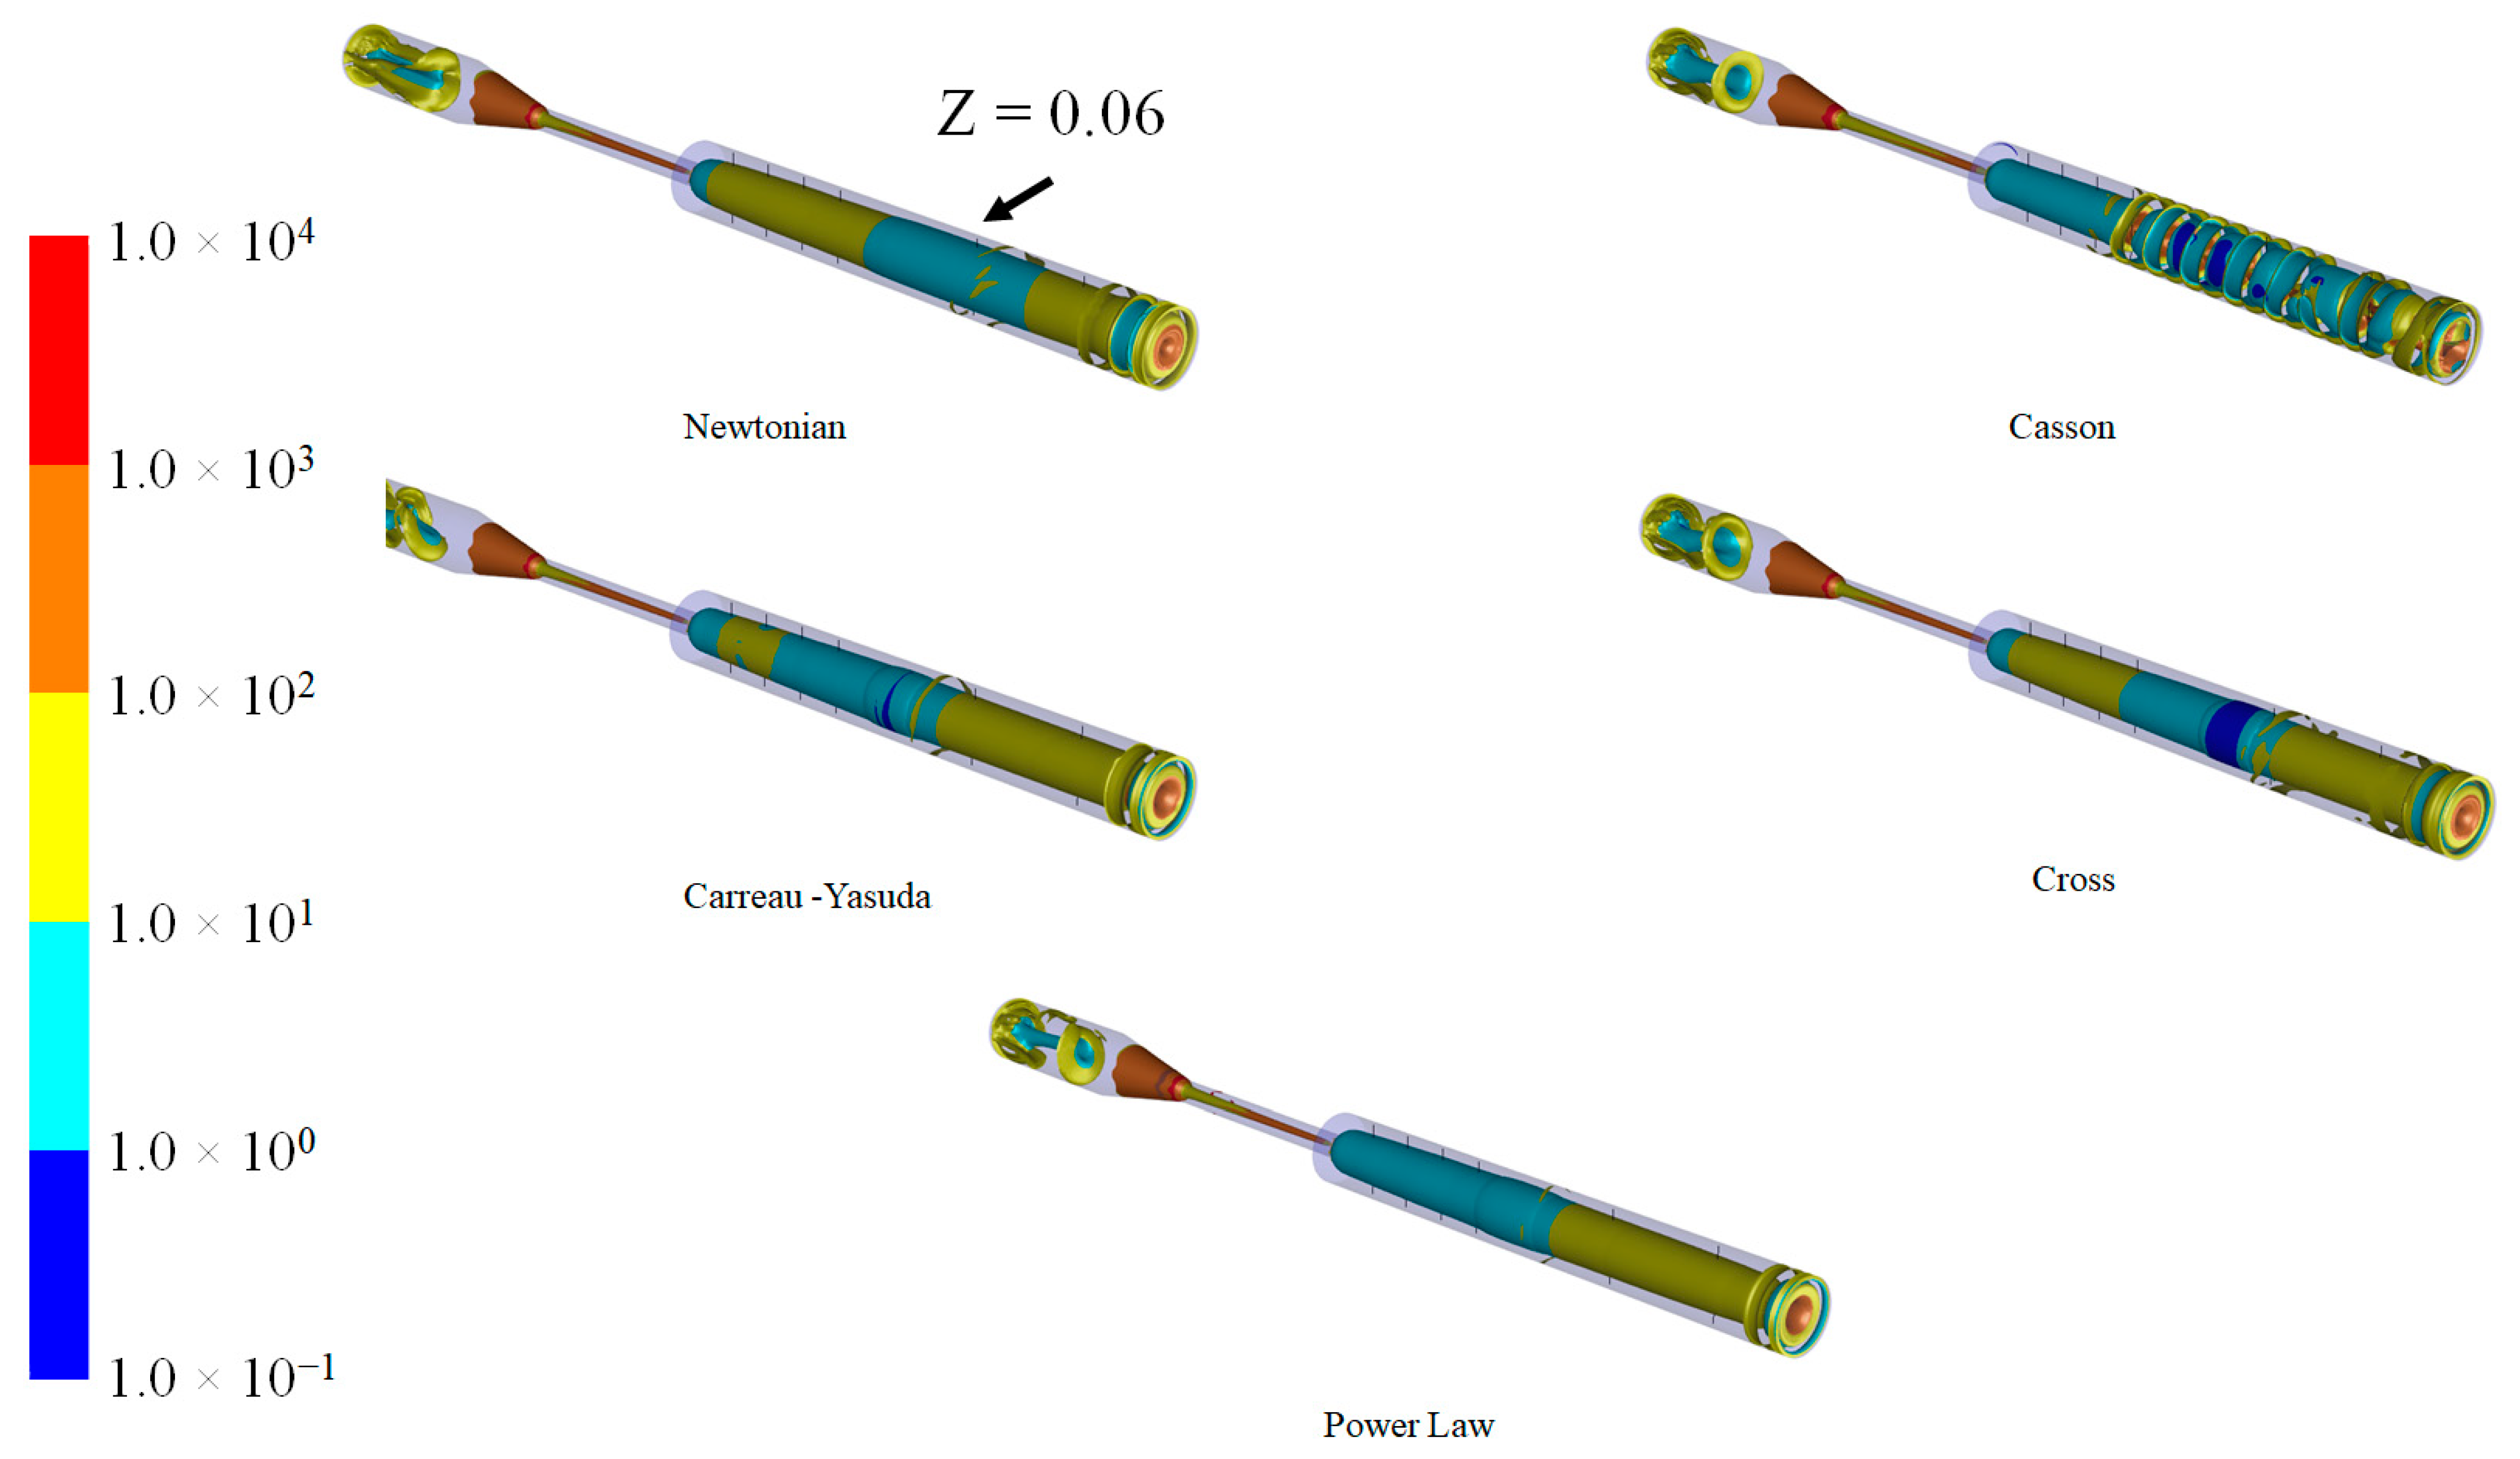
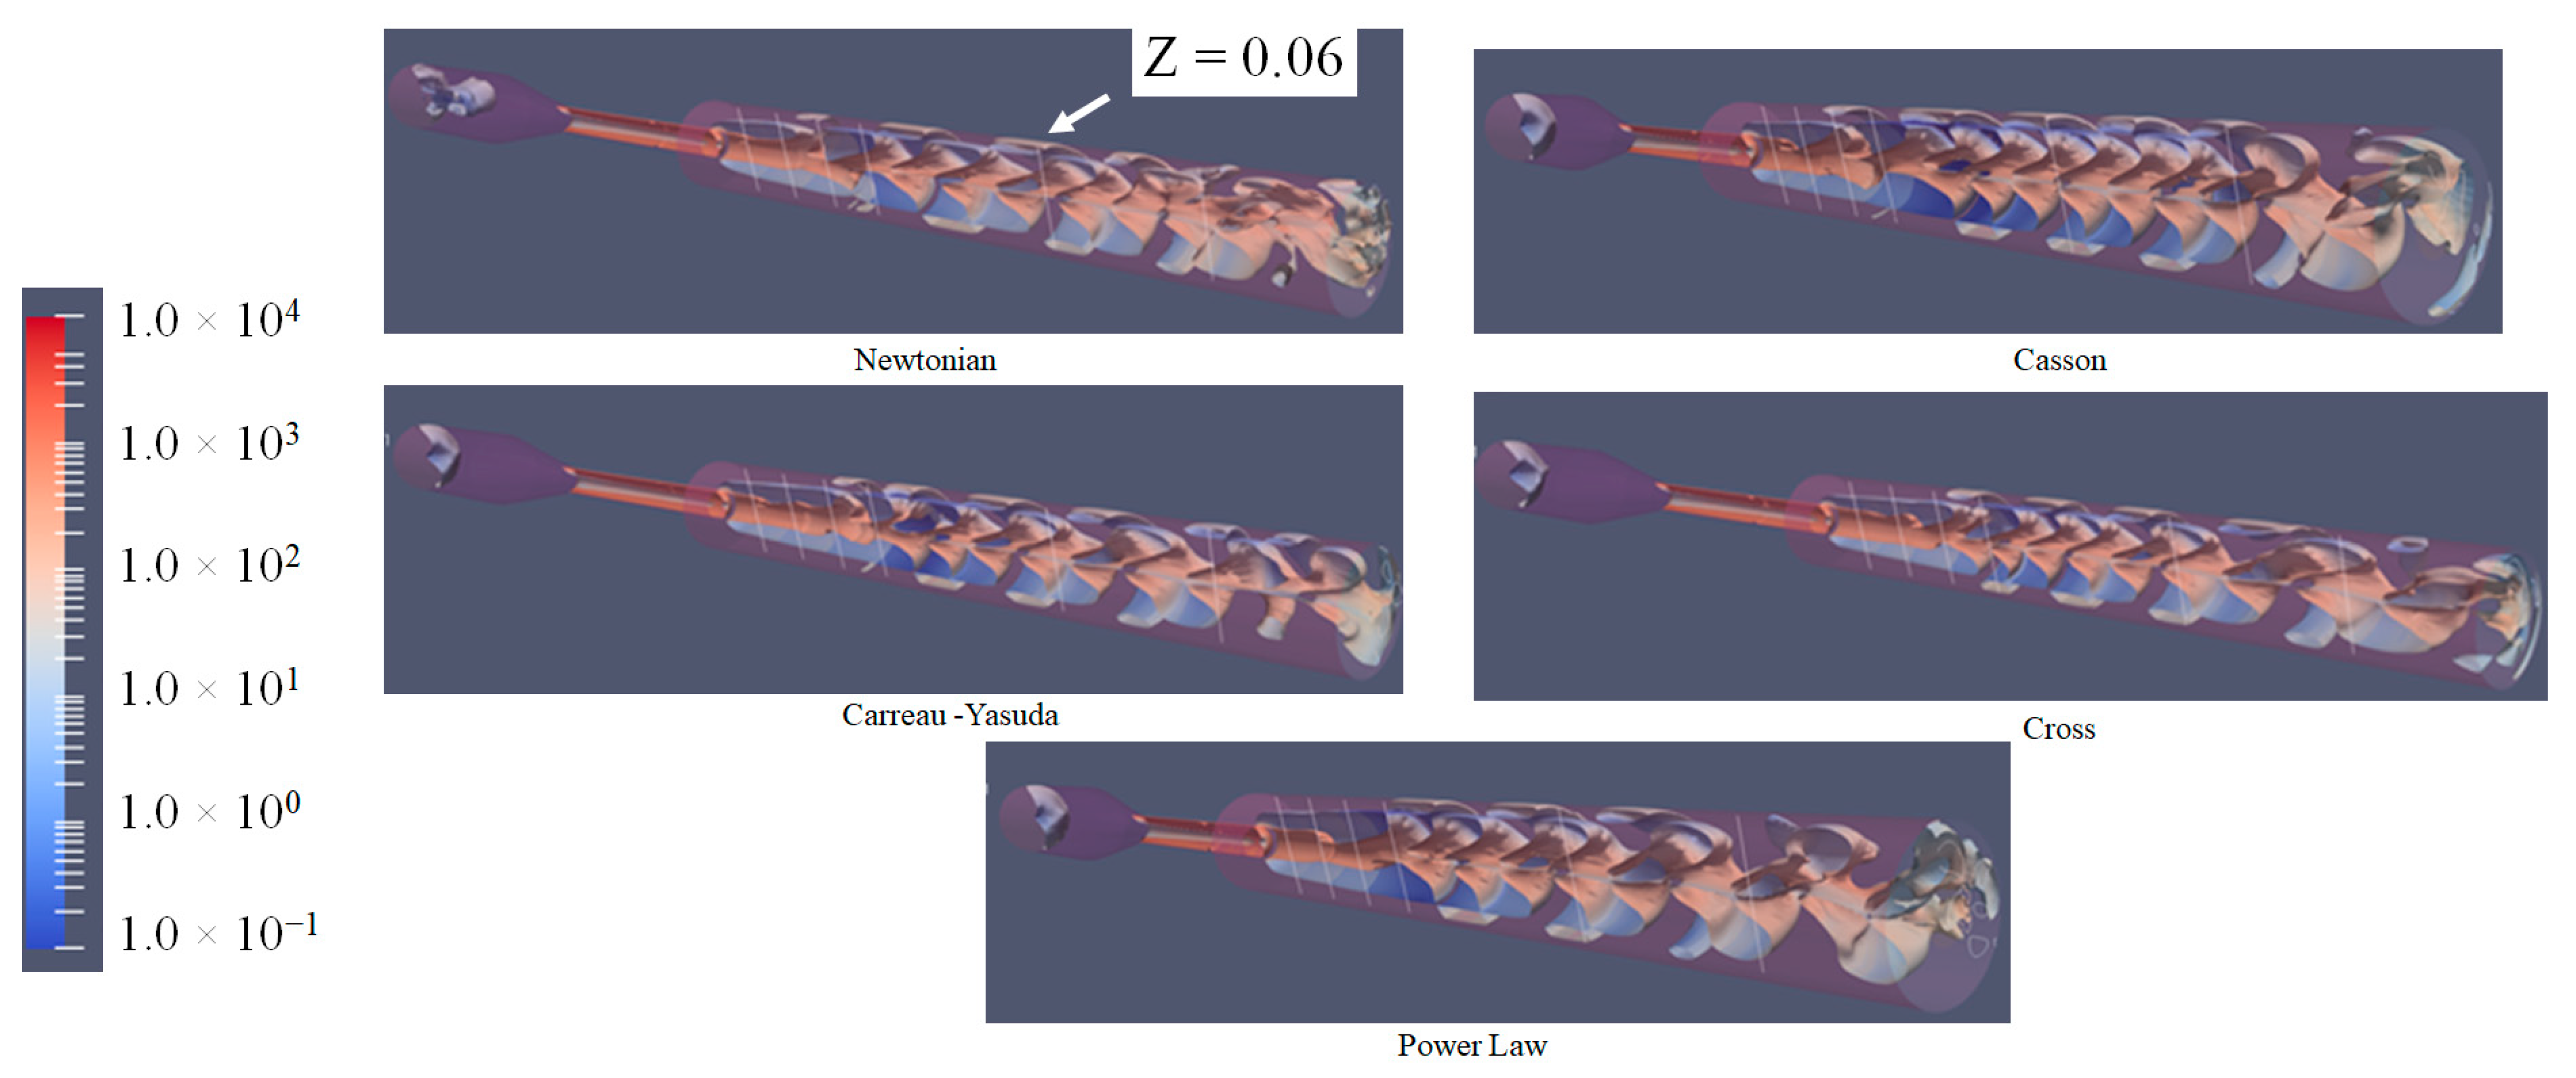
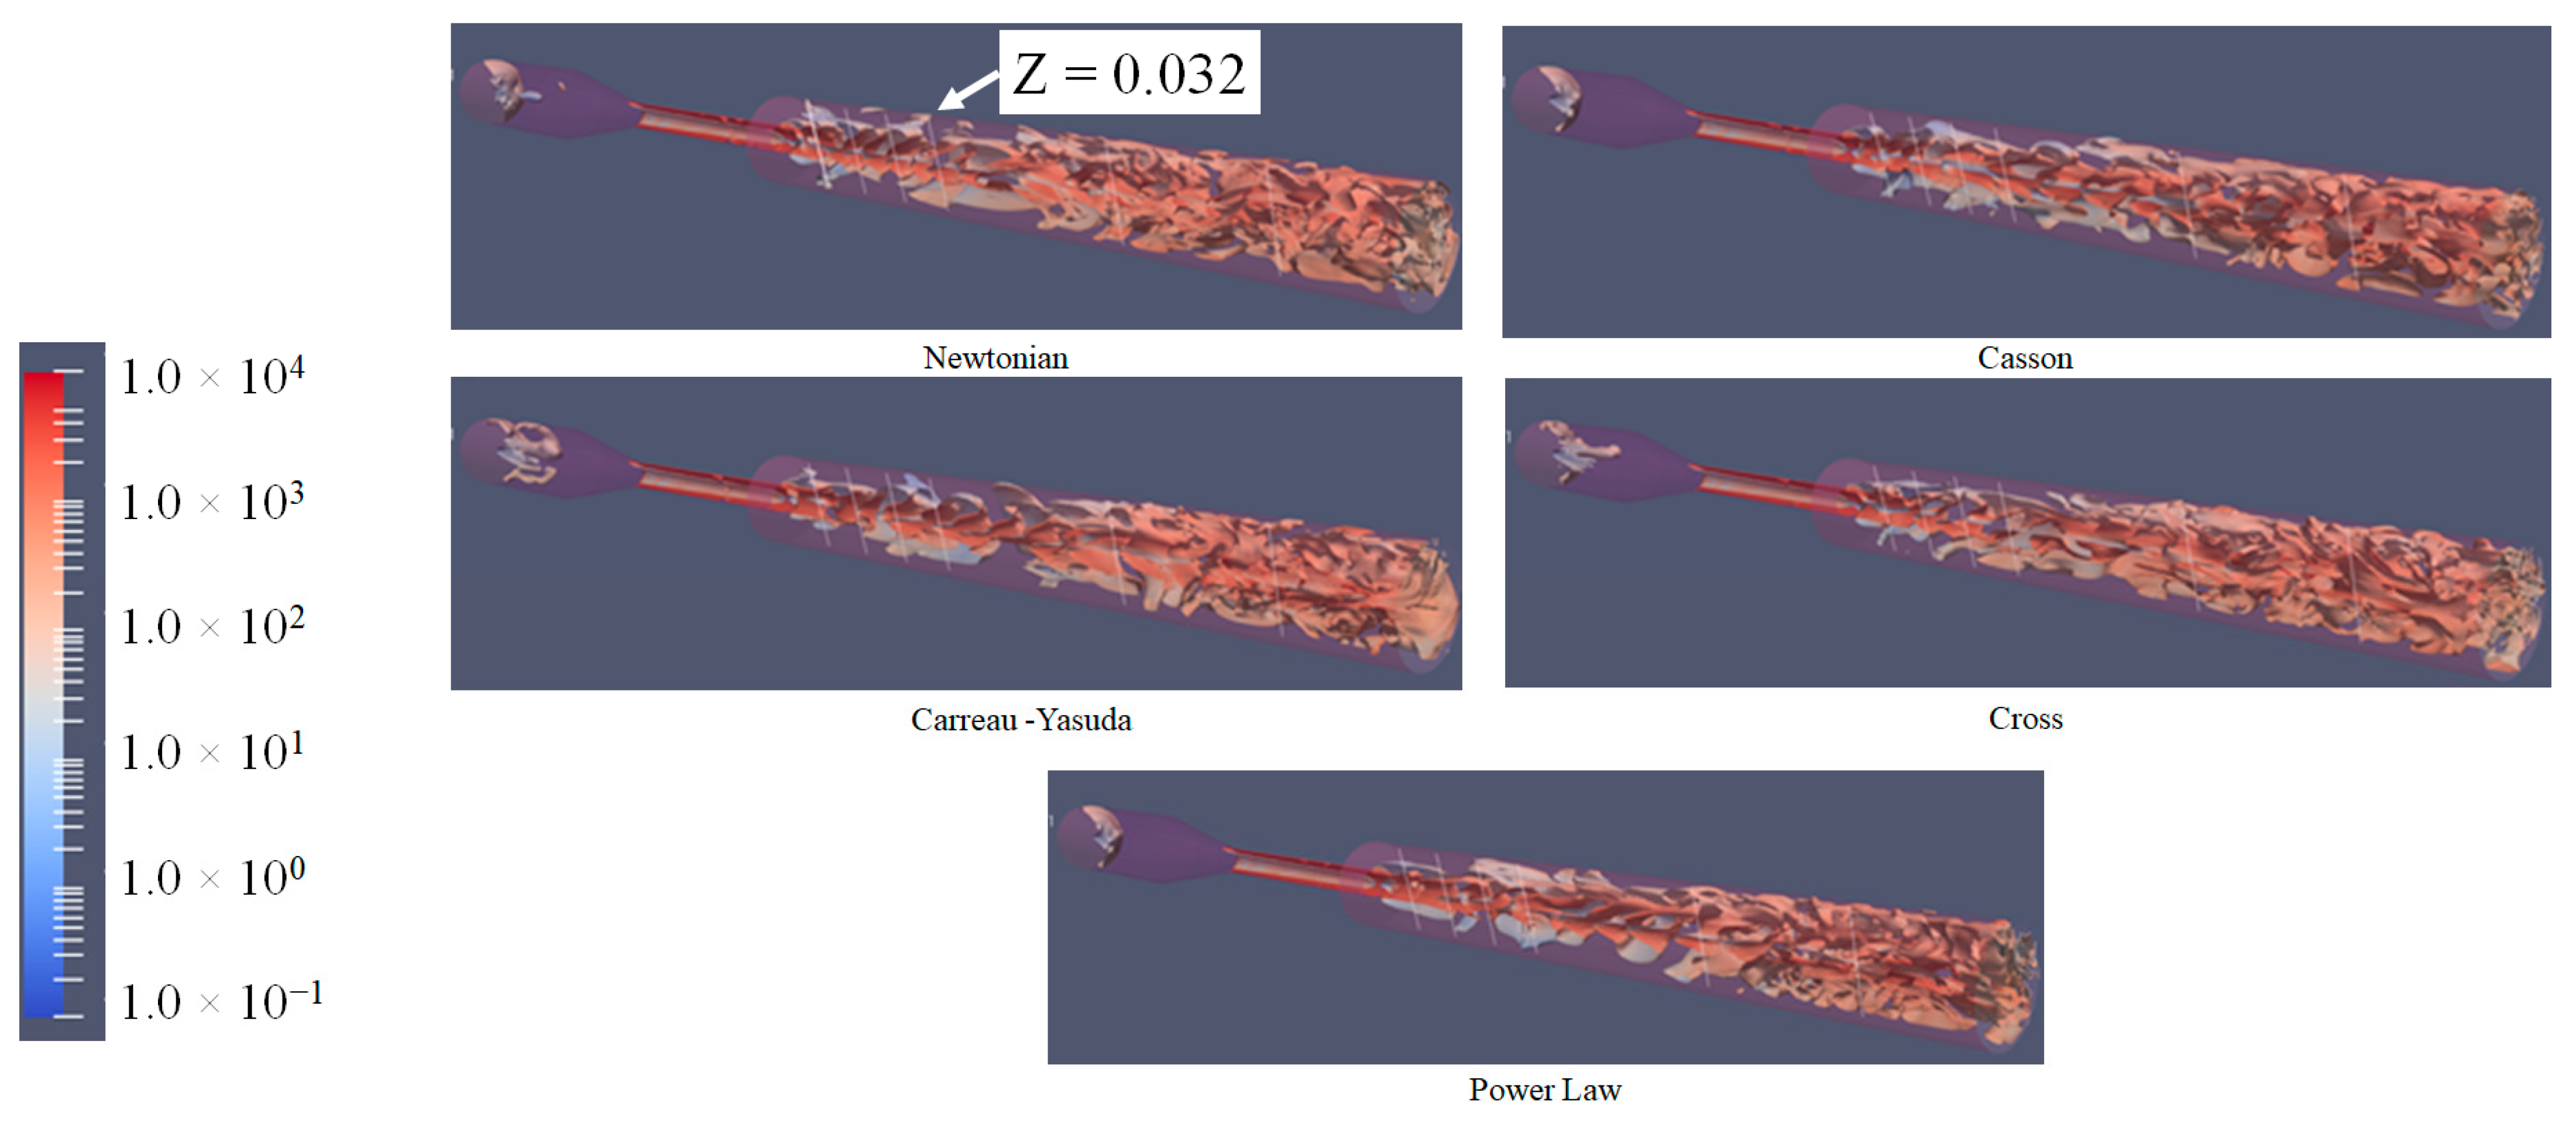
3.4. Q-Criterion and Vortex Shape Identification

The Q-Criterion is a metric used in fluid dynamics to evaluate turbulent flows and detect vortices. In this study, the Q-Criterion was employed to visualize and analyze vortices, providing insights into the complex dynamics of turbulent flows resulting from the interaction between medical devices and blood. The Q criterion is defined as follows:
Q = 0.5 ( | | | | 2 | | S | | 2 )
where S is the rate of strain tensor, and Ω is the velocity tensor.
Various vortex structures were identified by creating iso-surfaces of Q at zero, as illustrated in Figure 10, Figure 11, Figure 12 and Figure 13. At Re 500 (Figure 10), the Ansys Fluent-based analysis showed that all viscosity models, except for the Casson model, exhibited no vortex formation until the axial distance of Z = 0.06 m was reached. In contrast, the Casson model showed vortex formation starting at a radial distance of approximately 0.032 m. Consistent and symmetric vortex patterns were observed in OpenFOAM up to Z = 0.06 m. At Re 2000, vortex formation began at approximately 0.032 m, as shown consistently by both OpenFOAM and Ansys Fluent software outputs. At this Reynolds number, the flow is in a transitional regime and on the verge of becoming fully turbulent. This means the fluid experiences higher inertial forces compared to viscous forces, leading to the formation of vortices and other complex flow structures. The onset of vortex formation at 0.032 m marks a critical point where these instabilities become noticeable.

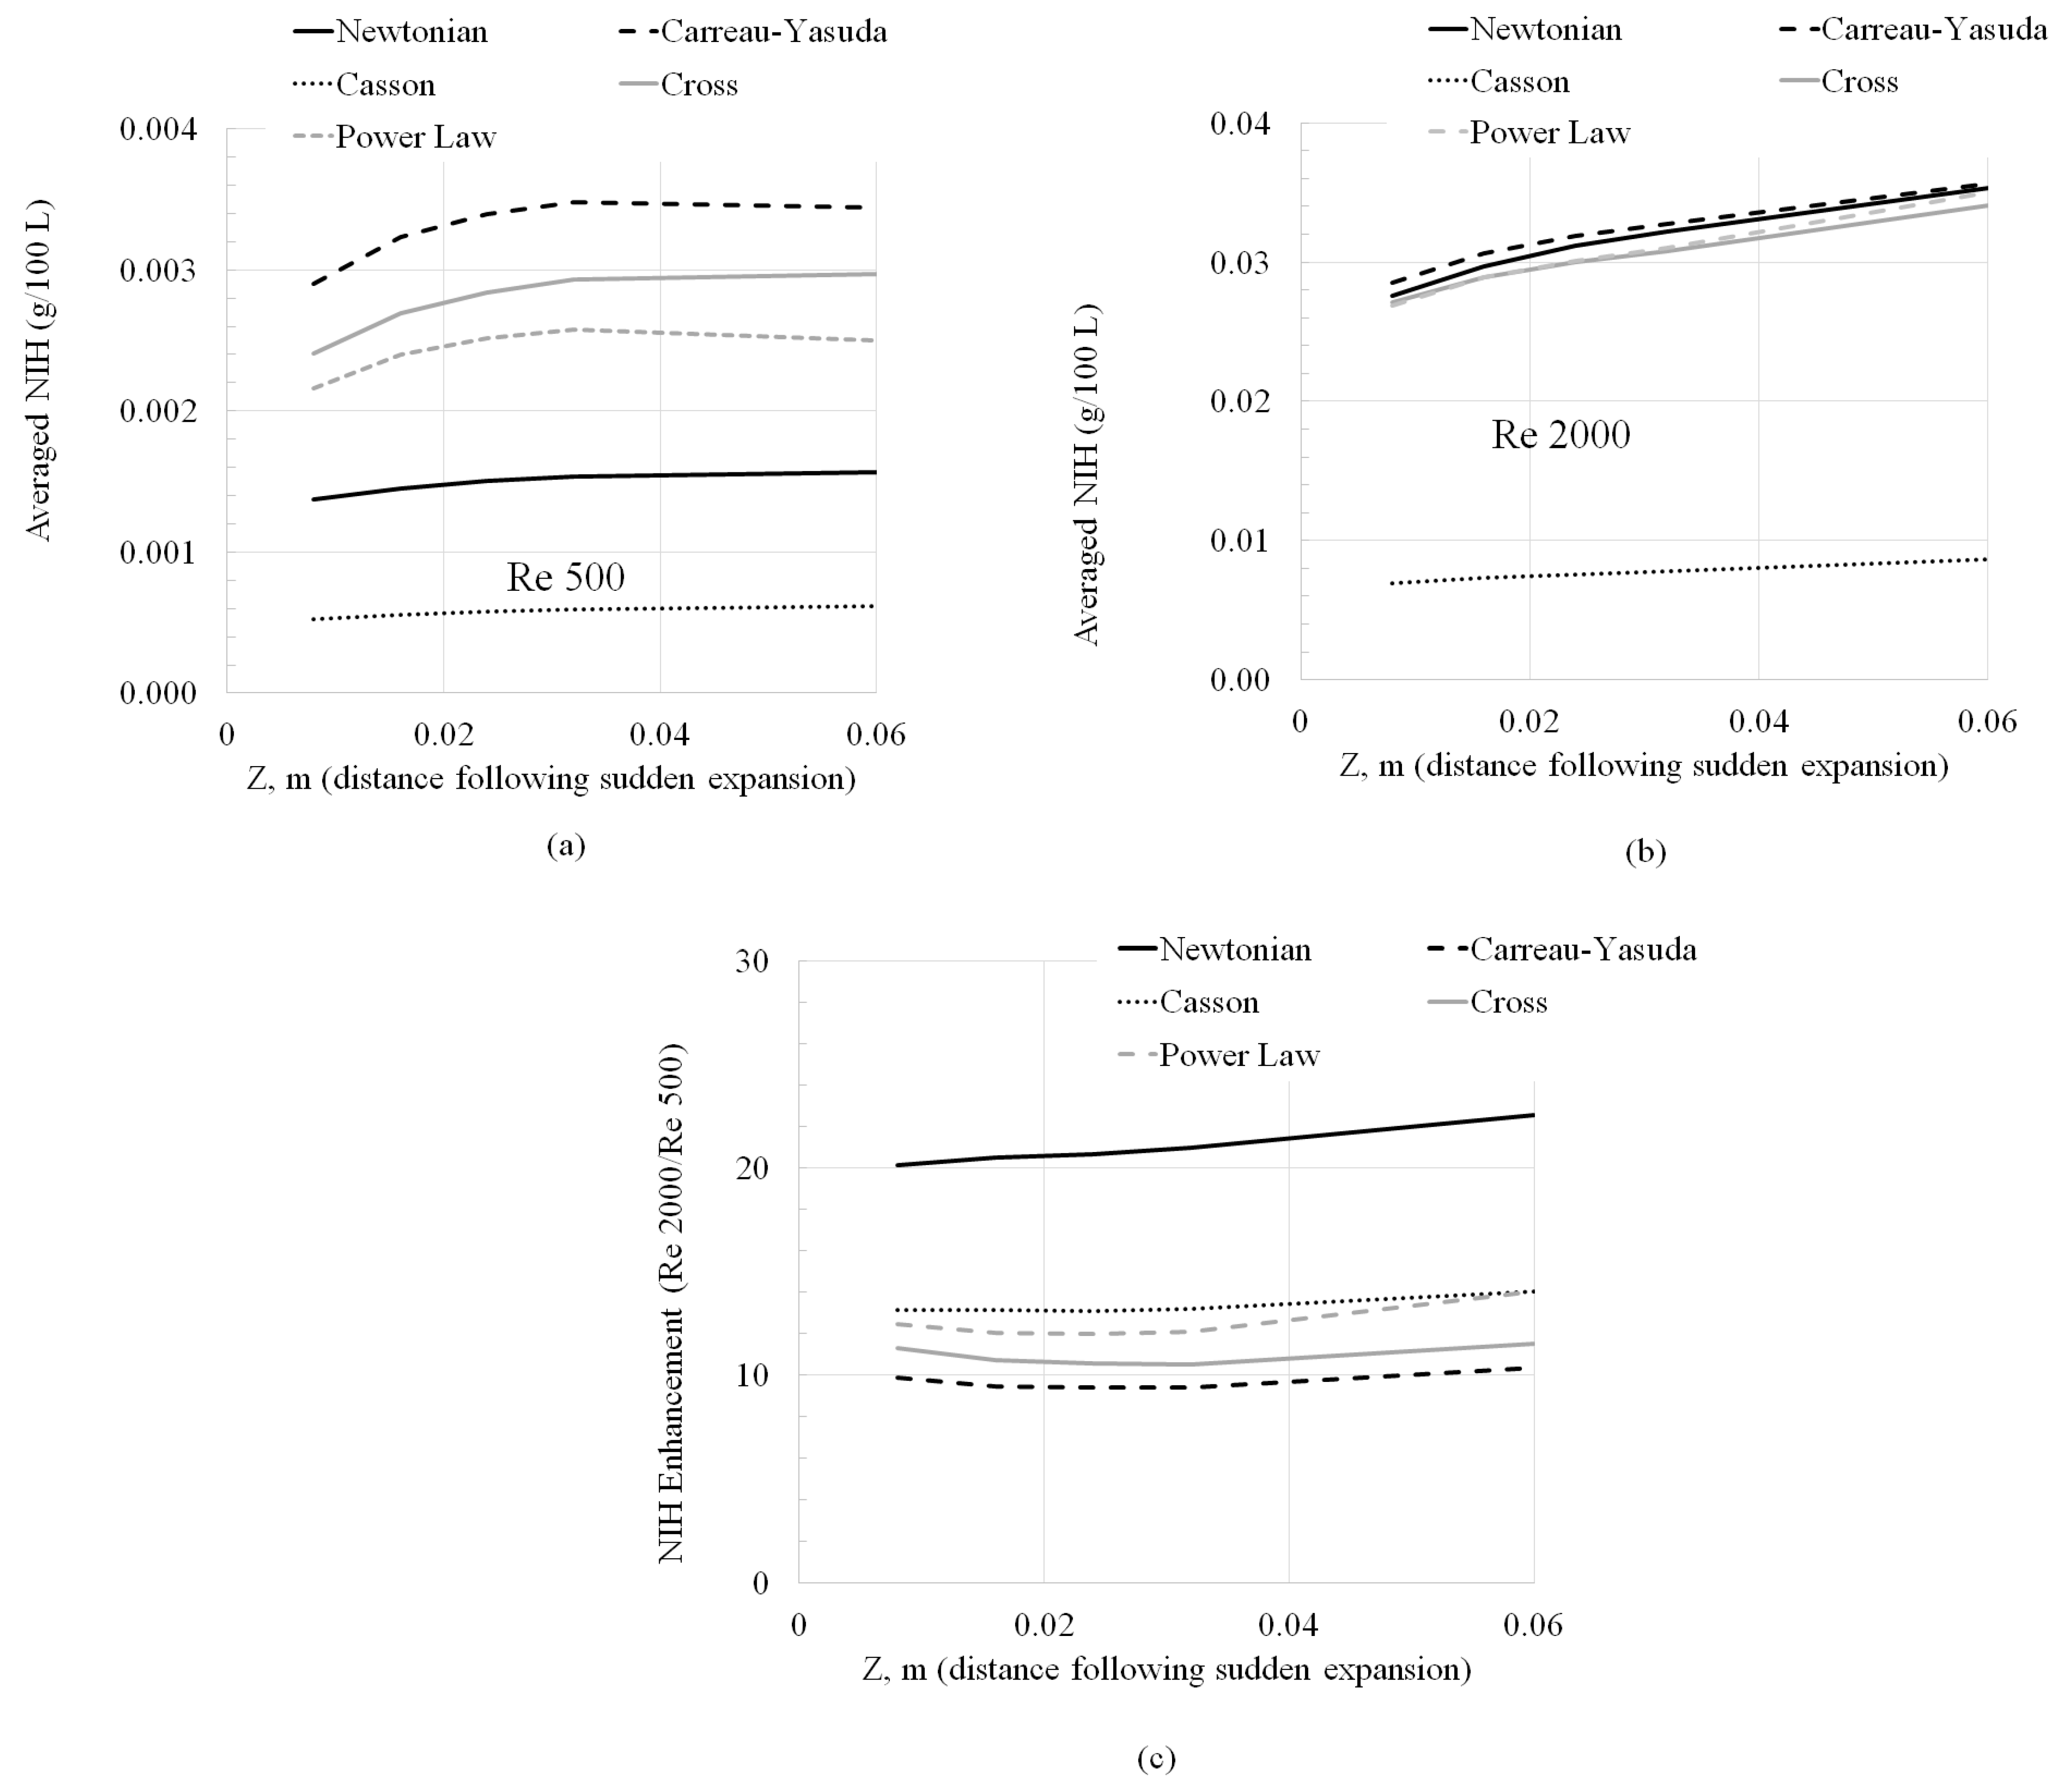
3.5. Normalized Index of Hemolysis (NIH) Evaluation

The Normalized Index of Hemolysis (NIH) is a standardized metric used to evaluate and compare the hemolytic effects (red blood cell destruction) of blood-handling devices. This metric is crucial for developing safer and more efficient medical devices, ultimately improving patient outcomes. However, predicting NIH is particularly challenging due to the highly device-specific nature of the coefficients in viscosity models. These coefficients vary significantly based on the characteristics and configurations of the devices, making it difficult to generalize predictions across different setups.
In this study, as shown in Figure 14, the overall findings demonstrated a significant correlation between NIH values and the flow regime, whether laminar or turbulent. At Re 500, NIH values indicated that all models except Casson predict a higher NIH than the Newtonian (N) model. This observation contrasts the results of Trias et al. [33], who showed that both the Casson and Carreau–Yasuda models predicted higher NIH than the Newtonian model. Nevertheless, the NIH values predicted by the Newtonian model in our study were in reasonable agreement with those reported by Trias et al. [33], even though the values were computed using different software packages.
At Re 2000, NIH values across different Reynolds numbers appear to be nearly independent of the non-Newtonian model used. This suggests that in spite of the viscosity prediction variations among the non-Newtonian models at low strain rates, the enhancement ratio of NIH across different Reynolds numbers can be predicted fairly consistently and is independent of the non-Newtonian model. The Newtonian models, on the other hand, tend to provide conservative estimates of NIH values. This conservatism arises because Newtonian models can underestimate viscosity, leading to lower predicted NIH values. The higher viscosity predicted by other models could potentially result in more accurate and possibly higher NIH predictions, but the Newtonian model’s tendency to underpredict provides a cautious upper bound for the enhancement ratio. This is a crucial consideration when assessing the potential hemolytic effects of blood-handling devices.

3.6. Mathematical Component

The incompressible flow Navier–Stokes equation was used to calculate velocity (v) and Shear Stress ( τ ) . Although velocity has been the generated parameter, shear stress evaluation is more relevant and critical to medical device applications. Therefore, the shear stress values were indirectly estimated by velocity profiles. The steady state mass conservation equation is given as [21]:
· ρ v = 0
where ρ and v   represent the density and velocity vector, respectively. The momentum conservation for the fluid can be written as [21]:
· ρ v v = p + · τ + ρ g
where τ is the stress tensor, p the static pressure, and g the direction of the gravitational component. The stress tensor is evaluated as follows:
τ = μ v + v T 2 3 · v I
where μ is the molecular viscosity, I is the unit tensor and the second term on the right-hand side is the effect of volume dilation. The pressure velocity coupling associated with Equations (2) and (3) was handled using the SIMPLE scheme in both Ansys Fluent and OpenFOAM [22,23]. The gradients in Ansys Fluent were evaluated using the Lease-Square Cell Based option, whereas a Gauss Linear scheme was employed in OpenFOAM [22,23].
The symmetry index (SI) at different axial locations (lines shown in Figure 1a) was evaluated by computing the volumetric flow rates above and below the axial center employing the axial velocities shown in Figure 2, Figure 3, Figure 4 and Figure 5. Equations (5) and (6) were employed to limit the SI values to a maximum value of one.
I f   Q U p p e r   h a l f < Q L o w e r   h a l f   S I = F l o w   R a t e   U p p e r   h a l f F l o w   R a t e   L o w e r   h a l f
I f   Q L o w e r   H a l f < Q U p p e r   h a l f   S I = F l o w   R a t e   L o w e r   h a l f F l o w   R a t e   U p p e r   h a l f
NIH was computed by solving a scalar transport equation for linear damage De:
ρ D e t + ρ D e u = C 1 a ρ τ b a
Equation (7) shows that De is a dynamic field that can be evolved together with the density and linear momentum, governed by Equations (2)–(4). The constant a, b and C on the right-hand side of Equation (7) were assigned values of: 0.785, 2.416 and 3.62 × 10⁻⁷, respectively, following Trias et al. [33].
The normalized index of hemolysis (NIH) quantified the extent of blood damage resulting from shear stresses within a specific flow domain and was evaluated using Equation (8).
N I H = 100 ( 1 H c t ) × D e × k
In Equation (8), De was computed at each spatial location using Equation (7). Hct is the hematocrit count (obtained from literature at 40%), and k is the hemoglobin content of blood and was set at 160 g/L per literature [33].

4. Discussion

The research highlights significant variability in predicting flow symmetry indices and vortex characteristics when using laminar flow models across two leading CFD codes: Ansys Fluent and OpenFOAM. Although both codes employed identical mesh configurations to control mesh-related discrepancies, differences in their numerical methods and gradient evaluation approaches resulted in notable variations in predictions. These variations can be attributed to differences in mesh topologies, solver algorithms, and gradient evaluation methods, which affect how each code calculates and interprets flow dynamics, leading to discrepancies in vortex formation and flow symmetry.
Beyond the standard Newtonian fluid modeling, which aligns with FDA guidelines, the study also incorporated simulations using four different non-Newtonian viscosity models in both CFD frameworks. The goal of these initial simulations was to achieve high fidelity by ensuring that the predicted velocity profiles closely matched experimental measurements.
At Reynolds number 500 (Re 500), both Ansys Fluent and OpenFOAM predicted symmetric vortices, indicating that turbulence had not yet onset for the Newtonian fluid. This finding is consistent with existing literature. However, discrepancies arise with non-Newtonian models. OpenFOAM showed a breakdown in symmetry for three of the four non-Newtonian models, whereas Ansys Fluent exhibited this breakdown for only one non-Newtonian model. This result contradicts the expected behavior of non-Newtonian fluids, which are anticipated to delay the onset of turbulence compared to Newtonian fluids.
Similarly, at Reynolds number 2000, a higher flow regime where turbulence is more prominent, all non-Newtonian models in both frameworks displayed a symmetry breakdown at approximately 0.032 m downstream from the sudden expansion. In contrast, the Newtonian fluid in Ansys Fluent maintained symmetry beyond 0.06 m. This suggests that the non-Newtonian models react differently to flow conditions, leading to an earlier onset of turbulence.
Visualization using Q-criterion-based iso-surfaces further highlighted these differences. Distinctly different vortex shapes were observed between Ansys Fluent and OpenFOAM, underscoring the sensitivity of vortex structure identification to numerical solver variations. This sensitivity reflects how different numerical methods can impact turbulence onset predictions using vortex characterization.
Regarding blood damage assessments, non-Newtonian models demonstrated a greater sensitivity at lower Reynolds numbers (Re 500). However, this sensitivity decreased at higher Reynolds numbers (Re 2000). However, the enhancement ratio of blood damage between Re 2000 and Re 500 was relatively consistent across non-Newtonian models, indicating that a fairly consistent assessment of how blood damage scales with Reynolds number may be obtained irrespective of the non-Newtonian model employed. In contrast, the Newtonian model estimated a higher blood damage ratio, which could be employed to establish safety boundaries when designing medical devices.
In summary, this study highlights how variations in CFD software and viscosity models can result in different predictions of fluid dynamics, which in turn can impact assessments of blood damage. This underscores the importance of understanding these differences when evaluating risks using medical device simulations.

5. Conclusions

This study delves into the complexities associated with predicting the transition from laminar to turbulent flow (Reynolds numbers (Re) 500–2000) within the FDA benchmark nozzle geometry using CFD codes. Despite a rigorous examination of numerical noise and geometric imperfections at the inflow, there is a consensus that most CFD codes can accurately predict the global variables under laminar flow conditions in this geometry. However, variations in predictions for derived variables, such as strain rate and vorticity, may arise due to differences in numerical solvers and gradient evaluation methods. These variations can subsequently impact blood flow-related phenomena such as blood damage, thrombosis, and non-Newtonian flow predictions.
In conclusion, the study highlights how prediction differences in numerical solvers can be exacerbated by the use of non-Newtonian viscosity models, leading to distinctly different vortex shapes and patterns. The results underscore the importance of understanding prediction variabilities across software frameworks when using simulations to assess risks associated with hemolysis and thrombosis, even under assumed steady-state, laminar flow conditions.

Author Contributions

N.G. contributed to this article by writing/creating the original draft. G.K. contributed to this article by writing and editing, supervising the project. Both authors contributed equally to the formulation of the problem, execution of work and data analysis. All authors have read and agreed to the published version of the manuscript.

Funding

This research received no external funding.

Data Availability Statement

All data that is relevant to this study is contained within the article. Any additional supplemental information that is needed is available upon request from the corresponding author.

Conflicts of Interest

The authors declare no conflicts of interest.

References

  1. Bergersen, A.W.; Mortensen, M.; Valen-Sendstad, K. The FDA nozzle benchmark: “In theory there is no difference between theory and practice but in practice there is”. Int. J. Numer. Methods Biomed. Eng. 2019, 35, 3150. [Google Scholar] [CrossRef] [PubMed]
  2. Bhushan, S.; Walters, D.K.; Burgreen, G.W. Laminar, turbulent, and transitional simulations in benchmark cases with cardiovascular device features. Cardiovasc. Eng. Technol. 2013, 4, 408–426. [Google Scholar] [CrossRef]
  3. Chabannes, V.; Prud’Homme, C.; Szopos, M.; Tarabay, R. High-order finite element simulations for fluid dynamics validated by experimental data from the FDA benchmark nozzle model. arXiv 2017, arXiv:1701.02179. [Google Scholar]
  4. Delorme, Y.T.; Anupindi, K.; Frankel, S.H. Large eddy simulation of FDA’s idealized medical device. Cardiovasc. Eng. Technol. 2013, 4, 392–407. [Google Scholar] [CrossRef]
  5. Fehn, N.; Wall, W.A.; Kronbichler, M. Modern discontinuous Galerkin methods for the simulation of transitional and turbulent flows in biomedical engineering: A comprehensive LES study of the FDA benchmark nozzle model. Int. J. Numer. Methods Biomed. Eng. 2019, 35, 3228. [Google Scholar] [CrossRef]
  6. Huang, F.; Noël, R.; Berg, P.; Hosseini, S.A. Simulation of the FDA nozzle benchmark: A lattice Boltzmann study. Comput. Methods Programs Biomed. 2022, 221, 106863. [Google Scholar] [CrossRef]
  7. Jain, K. Efficacy of the FDA nozzle benchmark and the lattice Boltzmann method for the analysis of biomedical flows in the transitional regime. Med. Biol. Eng. Comput. 2020, 58, 1817–1830. [Google Scholar] [CrossRef]
  8. Manchester, E.L.; Xu, X.Y. The effect of turbulence on transitional flow in the FDA’s benchmark nozzle model using large-eddy simulation. Int. J. Numer. Methods Biomed. Eng. 2020, 36, 3389. [Google Scholar] [CrossRef]
  9. Nicoud, F.; Chnafa, C.; Siguenza, J.; Zmijanovic, V.; Mendez, S. Large-eddy simulation of turbulence in cardiovascular flows. In Biomedical Technology: Modeling, Experiments, and Simulation; Springer: Berlin/Heidelberg, Germany, 2018; pp. 147–167. [Google Scholar]
  10. Passerini, T.; Quaini, A.; Veneziani, A.; Wood, N.B. Validation of an open-source framework for the simulation of blood flow in rigid and deformable vessels. Int. J. Numer. Methods Biomed. Eng. 2013, 29, 1192–1213. [Google Scholar] [CrossRef]
  11. Pewowaruk, R.; Li, Y.; Rowinski, D.; Roldán-Alzate, A. Solution adaptive refinement of cut-cell Cartesian meshes can improve FDA nozzle computational fluid dynamics efficiency. Int. J. Numer. Methods Biomed. Eng. 2021, 37, 3432. [Google Scholar] [CrossRef]
  12. Sánchez Abad, N.; Vinuesa, R.; Schlatter, P.; Andersson, M.; Karlsson, M. Simulation strategies for the Food and Drug Administration nozzle using Nek5000. AIP Adv. 2020, 10, 2. [Google Scholar] [CrossRef]
  13. Stewart, S.F.; Paterson, E.G.; Burgreen, G.W.; Hariharan, P.; Reddy, V.; Day, S.W. Assessment of CFD performance in simulations of an idealized medical device: Results of FDA’s first computational interlaboratory study. Cardiovasc. Eng. Technol. 2013, 4, 374–391. [Google Scholar] [CrossRef]
  14. Stewart, S.F.; Paterson, E.G.; Burgreen, G.W.; Hariharan, P.; Reddy, V.; Day, S.W. Results of FDA’s first interlaboratory computational study of a nozzle with a sudden contraction and conical diffuser. Cardiovasc. Eng. Technol. 2012, 3, 139–160. [Google Scholar] [CrossRef]
  15. Stiehm, M.; Wüstenhagen, C.; Siewert, S.; Grabow, N.; Schmitz, K.P. Numerical simulation of pulsatile flow through a coronary nozzle model based on FDA’s benchmark geometry. Curr. Dir. Biomed. Eng. 2017, 3, 775–778. [Google Scholar] [CrossRef]
  16. Taylor, C.A.; Steinman, D.A.; Simon, H.A.; Valen-Sendstad, K.; Bergersen, A.W.; Loth, F. Predicting the quality of the FDA’s nozzle benchmark. J. Biomech. 2016, 49, 2245–2251. [Google Scholar]
  17. Zmijanovic, V.; Löhner, R.; Indrakanti, S.S. Large eddy simulation of transitional and turbulent flow in the FDA nozzle model. J. Biomech. Eng. 2017, 139, 041003. [Google Scholar]
  18. Qiao, Y.; Luo, K. Computational prediction of thrombosis in FDA’s benchmark nozzle. Front. Physiol. 2022, 13, 867613. [Google Scholar] [CrossRef]
  19. Tobin, N.; Manning, K.B. Large-eddy simulations of flow in the FDA benchmark nozzle geometry to predict hemolysis. Cardiovasc. Eng. Technol. 2020, 11, 254–267. [Google Scholar] [CrossRef]
  20. Sobey, I.J.; Drazin, P.G. Bifurcations of two-dimensional channel flows. J. Fluid Mech. 1986, 171, 263–287. [Google Scholar] [CrossRef]
  21. ANSYS Inc. ANSYS Fluent, Version 2023 R2; ANSYS Inc.: Canonsburg, PA, USA, 2023; Available online: https://www.ansys.com/products/fluids/ansys-fluent (accessed on 1 January 2024).
  22. The OpenFOAM Foundation. OpenFOAM, Version 9; The OpenFOAM Foundation: London, UK, 2021; Available online: www.openfoam.org (accessed on 1 January 2024).
  23. Biswas, D.; Casey, D.M.; Crowder, D.C.; Steinman, D.A.; Yun, Y.H.; Loth, F. Characterization of transition to turbulence for blood in a straight pipe under steady flow conditions. I. Biomech Eng. 2016, 138, 071001. [Google Scholar] [CrossRef]
  24. Cebral, J.R.; Castro, M.A.; Appanaboyina, S.; Putman, C.M.; Millan, D.; Frangi, A.F. Efficient pipeline for image-based patient-specific analysis of cerebral aneurysm hemodynamics: Technique and sensitivity. IEEE Trans. Med. Imaging 2005, 24, 457–467. [Google Scholar] [CrossRef]
  25. Costa, R.P.; Simplice Talla Nwotchouang, B.; Yao, J.; Biswas, D.; Casey, D.; McKenzie, R.; Steinman, D.A.; Loth, F. Transition to turbulence downstream of a stenosis for whole blood and a Newtonian analog under steady flow conditions. J. Biomech. Eng. 2022, 144, 031008. [Google Scholar] [CrossRef] [PubMed]
  26. Haley, A.L.; Valen-Sendstad, K.; Steinman, D.A. On delayed transition to turbulence in an eccentric stenosis model for clean vs. noisy high-fidelity CFD. J. Biomech. 2021, 125, 110588. [Google Scholar] [CrossRef] [PubMed]
  27. Johnston, B.M.; Johnston, P.R.; Corney, S.; Kilpatrick, D. Non-Newtonian blood flow in human right coronary arteries: Steady-state simulations. J. Biomech. 2004, 37, 709–720. [Google Scholar] [CrossRef] [PubMed]
  28. Khan, M.O.; Valen-Sendstad, K.; Steinman, D.A. Direct numerical simulation of laminar-turbulent transition in a non-axisymmetric stenosis model for Newtonian vs. shear-thinning non-Newtonian rheologies. Flow Turbul. Combust. 2019, 102, 43–72. [Google Scholar] [CrossRef]
  29. Lee, S.W.; Steinman, D.A. On the relative importance of rheology for image-based CFD models of the carotid bifurcation. J. Biomech. Eng. 2007, 129, 273–278. [Google Scholar] [CrossRef]
  30. Razavi, A.; Shirani, E.; Sadeghi, M.R. Numerical simulation of blood pulsatile flow in a stenosed carotid artery using different rheological models. J. Biomech. 2011, 44, 2021–2030. [Google Scholar] [CrossRef]
  31. Good, B.C. The effects of non-Newtonian blood modeling and pulsatility on hemodynamics in the Food and Drug Administration’s benchmark nozzle model. Biorheology 2023, 59, 1–18. [Google Scholar] [CrossRef]
  32. Hussein, B.K.; Al-Azawy, M.G.; Al-Waaly, A.A.; Hamza, Z.A. Evaluation of turbulence and non-Newtonian blood rheology models through FDA nozzle. In Proceedings of the 2021 International Conference on Advance of Sustainable Engineering and its Application (ICASEA), Wasit, Iraq, 27–28 October 2021; IEEE: Toulouse, France, 2021; pp. 1–5. [Google Scholar]
  33. Trias, M.; Arbona, A.; Massó, J.; Miñano, B.; Bona, C. FDA’s nozzle numerical simulation challenge: Non-Newtonian fluid effects and blood damage. PLoS ONE 2014, 9, e92638. [Google Scholar] [CrossRef]
  34. Zakaria, M.S.; Zainudin, S.H.; Abdullah, H.; Yuan, C.S.; Abd Latif, M.J.; Osman, K. CFD simulation of non-Newtonian effect on hemodynamics characteristics of blood flow through benchmark nozzle. J. Adv. Res. Fluid Mech. Therm. Sci. 2019, 64, 117–125. [Google Scholar]
  35. Berg, P.; Janiga, G.; Thévenin, D. CFD Challenge: Solutions using the commercial solver Fluent and the open-source solver OpenFOAM. In Proceedings of the Summer Bioengineering Conference, Fajardo, PR, USA, 20–23 June 2012; American Society of Mechanical Engineers: New York, NY, USA, 2012; Volume 44809, pp. 115–116. [Google Scholar]
  36. Lysenko, D.A.; Ertesvåg, I.S.; Rian, K.E. Modeling of turbulent separated flows using OpenFOAM. Comput. Fluids 2013, 80, 408–422. [Google Scholar] [CrossRef]
  37. Robertson, E.; Choudhury, V.; Bhushan, S.; Walters, D.K. Validation of OpenFOAM numerical methods and turbulence models for incompressible bluff body flows. Comput. Fluids 2015, 123, 122–145. [Google Scholar] [CrossRef]
  38. Jones, D.A. CFD RANS Simulations on a Generic Conventional Scale Model Submarine: Comparison between Fluent and OpenFOAM; Technical Note; Defence Science and Technology Organisation, Maritime Division: Fishermans Bend, VIC, Australia, 2015; Available online: https://apps.dtic.mil/sti/pdfs/ADA622263.pdf (accessed on 26 March 2024).
  39. Greifzu, F.; Kratzsch, C.; Forgber, T.; Lindner, F.; Schwarze, R. Assessment of particle-tracking models for dispersed particle-laden flows implemented in OpenFOAM and ANSYS Fluent. Eng. Appl. Comput. Fluid Mech. 2015, 10, 30–43. [Google Scholar] [CrossRef]
  40. Dresar, P.; Duhovnik, J. A hybrid RANS-LES computational fluid dynamics simulation of an FDA medical device benchmark. Mechanics 2019, 25, 291–298. [Google Scholar] [CrossRef]
  41. Jarrell, J.A.; Sytsma, B.J.; Wilson, L.H.; Pan, F.L.; Lau, K.H.; Kirby, G.T.; Lievano, A.A.; Pawell, R.S. Numerical optimization of microfluidic vortex shedding for genome editing T cells with Cas9. Sci. Rep. 2021, 11, 11818. [Google Scholar] [CrossRef] [PubMed]
  42. Menon, P.G.; Teslovich, N.; Chen, C.Y.; Undar, A.; Pekkan, K. Characterization of neonatal aortic cannula jet flow regimes for improved cardiopulmonary bypass. J. Biomech. 2013, 46, 362–372. [Google Scholar] [CrossRef]
  43. Mancini, V.; Bergersen, A.W.; Valen-Sendstad, K.; Segers, P. Computed poststenotic flow instabilities correlate phenotypically with vibrations measured using laser Doppler vibrometry: Perspectives for a promising in vivo device for early detection of moderate and severe carotid stenosis. J. Biomech. Eng. 2020, 142, 091007. [Google Scholar] [CrossRef]
  44. Ozturk Papavassiliou, D.V.; O’Rear, E.A. An approach for assessing turbulent flow damage to blood in medical devices. J. Biomech. Eng. 2017, 139, 011008. [Google Scholar]
  45. Sonntag, S.J.; Lipinski, E.; Neidlin, M.; Hugenroth, K.; Benkowski, R.; Motomura, T.; Kaufmann, T.A.S. Virtual fitting and hemodynamic simulation of the EVAHEART 2 left ventricular assist device and double-cuff tipless inflow cannula. ASAIO J. 2019, 65, 698–706. [Google Scholar] [CrossRef]
  46. Kopernik, M. Modeling of blood thrombosis at microscopic and mesoscopic scales. Comput. Assist. Methods Eng. Sci. 2019, 25, 21–45. [Google Scholar]
Figure 1. (a) Schematic Representation of FDA Benchmark Nozzle with different axial distances following the sudden expansion (Z in meters) at which the results in this study are reported; (b) Viscosity variations employing the different non-Newtonian models employed in this study.
Symmetry 16 01165 g001
Figure 2. OpenFOAM (OF) predictions of axial velocity at different axial distances following the sudden expansion region at Re 500 employing the Newtonian (N) viscosity model at different grid resolutions (231 K, 439 K and 966 K): (a) Z = 0.008 m; (b) Z = 0.016 m; (c) Z = 0.024 m; (d) Z = 0.032 m; (e) Z = 0.06 m; (f) Z = 0.08 m.
Symmetry 16 01165 g002
Figure 3. Ansys Fluent (AF) predictions of axial velocity at different axial distances following the sudden expansion region at Re 500 employing the Newtonian (N) viscosity model at different grid resolutions (231 K, 439 K and 966 K): (a) Z = 0.008 m; (b) Z = 0.016 m; (c) Z = 0.024 m; (d) Z = 0.032 m; (e) Z = 0.06 m; (f) Z = 0.08 m.
Symmetry 16 01165 g003
Figure 4. OpenFOAM (OF) predictions of axial velocity at different axial distances following the sudden expansion region at Re 2000 employing the Newtonian (N) viscosity model at different grid resolutions (231 K, 439 K and 966 K): (a) Z = 0.008 m; (b) Z = 0.016 m; (c) Z = 0.024 m; (d) Z = 0.032 m; (e) Z = 0.06 m.
Symmetry 16 01165 g004
Figure 5. Ansys Fluent (AF) predictions of axial velocity at different axial distances following the sudden expansion region at Re 2000 employing the Newtonian (N) viscosity model at different grid resolutions (231 K, 439 K and 966 K): (a) Z = 0.008 m; (b) Z = 0.016 m; (c) Z = 0.024 m; (d) Z = 0.032 m; (e) Z = 0.06 m.
Symmetry 16 01165 g005
Figure 6. Axial velocity profiles (Re 500) at Z = 0.06 m following the sudden expansion using different non-Newtonian models in (a) Ansys Fluent (AF) (radial distances − 0.002 m to 0.002 m only to highlight differences); (b) Ansys Fluent (across the entire radius); (c) OpenFOAM (OF) (radial distances −0.002 m to 0.002 m only to highlight differences); (d) OpenFOAM (across the entire radius).
Symmetry 16 01165 g006
Figure 7. Axial velocity profiles (Re 2000) at different distances following the sudden expansion using different non-Newtonian models in (a) Ansys Fluent (Z = 0.032 m); (b) OpenFOAM (Z = 0.032 m); (c) Ansys Fluent (Z = 0.06 m); (d) OpenFOAM (Z = 0.06 m).
Symmetry 16 01165 g007
Figure 8. Symmetric index predicted from employing different viscosity models at Re 500 using OpenFOAM (OF) and Ansys Fluent (AF) (a) Newtonian Fluid, (b) Carreau–Yasuda (CY), (c) Casson, (d) Cross (e) Power Law.
Symmetry 16 01165 g008
Figure 9. Symmetric index predicted from employing different viscosity models at Re 2000 using OpenFOAM (OF) and Ansys Fluent (AF) (a) Newtonian Fluid, (b) Carreau–Yasuda (CY), (c) Casson, (d) Cross (e) Power Law using OpenFOAM (OF) and Ansys Fluent (AF).
Symmetry 16 01165 g009
Figure 10. Three-dimensional depiction of Q-criterion-based vortex formation at Re 500 using Ansys Fluent (colored by strain rate magnitudes, 1/s).
Symmetry 16 01165 g010
Figure 11. 3D depiction of Q-criterion-based vortex formation at Re 500 using OpenFoam (colored by strain rate magnitudes, 1/s).
Symmetry 16 01165 g011
Figure 12. Three-dimensional depiction of Q-criterion-based vortex formation at Re 2000 using Ansys Fluent (colored by strain rate magnitudes, 1/s).
Symmetry 16 01165 g012
Figure 13. Three-dimensional depiction of Q-criterion-based vortex formation at Re 2000 using OpenFOAM (colored by strain rate magnitudes, 1/s).
Symmetry 16 01165 g013
Figure 14. NIH values for evaluating hemolytic effects at (a) Re 500, (b) Re 2000 and (c) the ratio of NIH values at Re 2000/Re 500.
Symmetry 16 01165 g014
Table 1. A summary of CFD studies corresponding to Re 500, 2000 within the FDA Nozzle with an emphasis on symmetry and jet breakdown after the sudden expansion region.
AuthorsPublication YearSummary
Bergersen et al. [1]2013In this study, at a Reynolds number (Re) of 500, simulation predictions remained stable despite numerical noise introduced at the inlet to simulate experimental uncertainties. However, at a Reynolds number of 3500, such inlet perturbations influenced the location of vortex breakdown
Bhushan et al. [2]2013In this study, the use of turbulence models at Reynolds number (Re) 500 led to excessive diffusion, which resulted in lower centerline velocities compared to experimental data. However, transition-sensitive unsteady RANS turbulence models can deliver accurate predictions across the entire Reynolds number range if the turbulence intensity levels at the inlet are correctly specified.
Chabannes et al. [3]2017In this study, at Re 500, solution accuracies were assessed using mesh refinement studies. At Re 2000, the jet breakdown occurred downstream of the experimentally measured location.
Delorme et al. [4]2013LES and Immersed Boundary Method were employed. Predictions agreed with the experimental results for the mean velocities at Re = 500, 2000 and 3500. While Re = 500 stayed symmetric throughout, coherent vortices, as identified by the λ2 criterion, were observed close to the 0.032 m mark.
Fehn et al. [5]2019Flow remains laminar throughout at Re 500. At Re 2000 transition can be induced if the simulation parameters can be tweaked. Simulations were carried out using a high-order discontinuous Galerkin discretization technique.
Huang et al. [6]2022No jet breakdown after sudden expansion at Re 500 for unsteady simulations carried out with the Lattice Boltzmann Method. Symmetric solutions and zero centerline shear stresses persist downstream of the sudden expansion.
Jain [7]2020High resolution (HR) and Extreme spatial resolution (XR) of 40 µm; 20 µm is necessary for accurate results in Lattice Boltzmann Method-based simulations. Jet breakdown for the Re 2000 case occurs between 0.06 m and 0.08 m downstream of the sudden expansion. At low resolutions, the jet breaks down between 0.024 m and 0.032 m.
Manchester et al. [8]2020Using LES at Re 2000 using the OpenFOAM solver, laminar quantities were predicted throughout the model. In the jet breakdown region (0.06 m downstream of sudden expansion), where maximum Reynolds stresses occur, Reynolds shear stresses showed excellent agreement with measurements.
Nicoud et al. [9]2018LES simulations were carried out with a fourth-order accurate solver. Inlet perturbations did not induce turbulence in the laminar case (Re 500), whereas improved axial velocity predictions were seen at Re 2000.
Passerini et al. [10]2013Transient finite element simulations were carried out. At Re 500, the flow is axially symmetric throughout. At Re 2000, simulations predicted a jet breakdown location further downstream of the experimental and the differences were attributed to the fidelity of the numerical integration in the solver.
Pewowaruk et al. [11]2021Adaptive Mesh Refinement (AMR) study was carried out in a cut-cell representation of the device. Velocity contours show that symmetric profiles persist downstream of the sudden expansion at Re 500.
Sanchez, A. et al. [12]2020Used a high-order Spectral Element Method to carry out the simulations. At Re 500, no flow transition was observed. At Re 2000, flow did not transition to turbulence. However, by increasing the length of the domain downstream of the expansion and by incorporating some fluctuations at the inlet, a transition was eventually observed.
Stewart et al. [13]2012Re 500–6500 simulated. Turbulence models (k-epsilon, k-omega, and shear stress transport models) were employed in all Re > 500 simulations. Turbulence models were unable to accurately predict velocities and shear stresses in the recirculation zones downstream of the sudden expansion.
Stewart et al. [14]2012Summarized the results from several CFD groups. Results showed modest agreement in global and local flow behaviors. All CFD data sets contained wide degrees of velocity variation in comparison to the experiment and with each other at Re 2000 and between 0.032 m and 0.06 m downstream of the sudden expansion section.
Stiehm et al. [15]2017Pulsatile (time-dependent) boundary condition simulations were performed on a scaled-down (1/3rd scale) of the original FDA geometry at Re 500. Replacing the time-dependent boundary condition with an appropriate time-average boundary condition to employ in steady-state simulations was deemed to be sufficient if the interest is on obtaining time-averaged values.
Taylor et al. [16]2016Large variations in the LDV and PIV measurements of axial velocity at 0.06 m downstream of the sudden expansion due to instabilities for the Re 2000 case. The highest turbulence intensity and shear stresses were seen during jet breakdown between 0.032 m and 0.06 m downstream of the sudden expansion.
Zmijanovic et al. [17]2017LES simulations showed that Re 500 remains laminar throughout with no breakdown in symmetry. Results indicate a considerable impact of numerical aspects on the prediction of the location of the transition to turbulence for Re 3500.
Qiao et al. [18]2022Thrombus formation investigated at different Re. An inverse relationship between thrombosis and hemolysis was observed with thrombosis formation accelerated at lower Re.
Tobin et al. [19]2020The objective of this study is to utilize existing models to account for turbulence’s chaotic nature and the interplay of fluctuating velocities and eddies within the flow. To validate these adaptations, the study compared model predictions with experimental data gathered from previous research.
Table 2. Thrombosis and transition to turbulence (TT) prediction variations in different geometries at low Reynolds Numbers (Re < 2000) resulting from the choice of non-Newtonian viscosity models.
AuthorsPublication YearSummary
Biswas et al. [23]2016Two mathematically defined methods, based on the velocity profile shape change and turbulent kinetic energy (TKE), were used to detect the transition to turbulence experimentally. Overall, the critical Re for turbulence onset was delayed by 20% (2316 vs. 2871) for blood compared to the Newtonian fluid.
Cebral et al. [24]2005Non-Newtonian viscosity models, like the Casson model, produce smaller velocity gradients due to higher local viscosity in low-flow regions. Despite this, the overall flow patterns and mean wall shear stress remain largely unchanged. The most significant factor influencing intra-aneurysmal flow patterns is the geometry of the aneurysm and its connections.
Costa et al. [25]2022Normalized turbulent kinetic energy (TKE) was employed to establish the critical Reynolds number for each fluid. The study found a 19% delay in TT for whole blood compared to the Newtonian fluid.
Haley et al. [26] 2021Delays in TT between “noisy” non-Newtonian and Newtonian results were studied in an eccentric geometry. Introducing noise did not eliminate this distinction. However, as Re increased, the flow profiles under both rheologies started to converge towards similar outcomes.
Johnston et al. [27]2004While the Newtonian model of blood viscosity provides a good approximation in regions of mid-range to high shear, it is advisable to use the Generalized Power Law (non-Newtonian) model. This model converges to the Newtonian model in high shear ranges but offers a better approximation of wall shear stress at low shear rates.
Khan et al. [28]2019Blood exhibits a delayed TT compared to Newtonian fluids. However, defining a critical Reynolds number for non-Newtonian fluids accurately remains challenging in complex geometries. This difficulty is compounded by factors beyond shear thinning, including the potential influence of viscoelastic properties.
Lee, S.W. et al. [29]2007Prediction sensitivities to non-Newtonian models were in different geometries and flow rates. Using the Carreau–Yasuda model, it was observed that shear-thinning has a minimal effect on carotid bifurcation hemodynamics. In contrast, high shear rates, inlet boundary conditions, and geometric factors exerted more significant influences.
Razavi, A. et al. [30]2011In this study, flow conditions in a stenosed artery for various viscosity models, including Newtonian and six non-Newtonian models (power law, generalized power law, Carreau, Carreau–Yasuda, modified Casson, and Walburn–Schneck) were compared. The findings indicate that the power law model exhibits greater variation in wall shear stress and velocity values compared to other models. In contrast, the modified Casson and generalized power law models show a closer approximation to Newtonian behavior.
Table 3. Non-Newtonian simulations of the FDA nozzle.
AuthorsPublication YearSummary
Good [31]2023Model differences were most evident at Re = 500. The non-Newtonian model predicted blunter upstream velocity profiles, and a greater pressure drop, with minimal differences observed at higher Reynolds numbers.
Hussein et al. [32]2021At Re 500, TKE and turbulent viscosity ratio were lower with Carreau in comparison to the Newtonian model. Pressure profiles were also different, attributed to larger recirculation zones at lower Re. Both differences diminished between the viscosity models at higher Re.
Trias, et al. [33]2014Axial velocity in the downstream region is inversely proportional to viscosity, with the highest velocity in the Newtonian model, followed by Carreau–Yasuda and then Casson. Velocity differences are within 10%. Viscosity models do not significantly affect the pressure drop. Non-Newtonian effects, while not greatly impacting velocity or pressure drop, are important for assessing blood damage, as they predict higher wall shear stresses and greater blood damage.
Zakaria et al. [34]2019The Newtonian model exhibits higher centerline velocities due to its constant viscosity assumption, which should be higher at lower shear rates. It also shows a higher pressure drop, likely due to more vortices. Using the lambda-2 criterion, chaotic and unstable vortices were observed with the Newtonian model. Overall, the Newtonian model produced more severe hemodynamic properties.
Table 4. Literature summary comparing the predictions of Ansys Fluent and OpenFOAM.
AuthorsPublication YearSummary
Berg et al. [35]2012Centerline pressure predictions between Ansys Fluent and OpenFOAM show a high level of agreement, with differences being less than 1.03%. This indicates that both software packages provide reliable and consistent results for predicting centerline pressures in CFD simulations.
Lysenko et al. [36]2013In simulations of turbulent flow (Reynolds number = 3900) over a circular cylinder, AF and OF showed differences in predicting small, secondary vortices at the rear of the cylinder. These discrepancies underscore the importance of turbulence modeling and numerical methods in accurately capturing flow features and phenomena in CFD simulations.
Robertson et al. [37]2015In flow simulations around a sphere at Reynolds number 104, OF exhibits secondary circulations near the sphere’s separation point. Variations in predictions between OF and other solvers primarily stem from differences in turbulence source term modeling rather than numerical methods. For simulations involving a backward-facing step, OF shows greater sensitivity to grid resolution. However, both OF and other solvers agree well on integral and mean flow variables, demonstrating reliable performance in predicting overall flow characteristics despite localized differences.
Jones et al. [38]2015Accurate CFD simulations are crucial for submarine support. The authors compared Fluent to commonly utilized OpenFOAM. Simulations on a submarine model showed up to 15% differences in drag coefficients between the two codes. Some discrepancies were resolved, but significant differences remain. This report details efforts to address these differences and suggests further work to ensure confidence in both codes.
Greifzu et al. [39]2015This study investigates two benchmark problems for turbulent dispersed particle-laden flow using CFD programs OpenFOAM and Ansys Fluent. The Lagrangian–Eulerian point-particle models for RANS simulations are compared in steady state and transient modes against experimental data. The results from both programs align well with experimental data. Dispersed phase results show Ansys Fluent slightly under-predicting and OpenFOAM slightly overestimating particle dispersion.
Table 5. Sensitivity of vortex identification characteristics (based on the Q-criterion adopted in this study) to CFD models in biomedical devices.
AuthorsDate of PublicationSummary
Dresar et al. [40]2019RANS, SAS, DES and LES turbulence models were compared. While RANS and SAS did not show vortices, their predictions were insensitive to boundary mesh size.
Jarrell et al. [41]2021Intracellular delivery of functional macromolecules, such as DNA and RNA, across the cell microfluidic chips CFD simulations highlighted key hydrodynamic features that enhance vortex shedding and promote intracellular delivery of functional macromolecules such as DNA and RNA across cell microfluidic chips.
Menon et al. [42]2013The study visualized vortical structures in simulated aortic cannulation configurations using the Q-criterion to identify coherent vortex patterns in the jet wake. It compared two configurations: one arbitrarily oriented, leading to complex vortex structures and high hemolysis near the transverse aortic arch, and another based on surgeon sketches, showing simpler vortex patterns and lower hemolysis near the descending aorta. The findings highlight the importance of optimizing cannulation parameters for better hemodynamic outcomes during surgery.
Mancini et al. [43]2020LDA, along with Q-criterion, was employed to assess stenosis in vivo. Receiver operating characteristic analyses of power spectra revealed that the most relevant frequency bands for the detection of moderate (56–76%) and severe (86–96%) stenoses were 80–200 Hz and 0–40 Hz, respectively.
Ozturk et al. [44]2017The study found that smaller eddies, specifically those with diameters up to about 10 μm (Kolmogorov scale eddies), are significantly associated with hemolysis. There is a clear correlation between hemolysis and the total surface area occupied by these smaller eddies. However, no such relationship was observed for larger eddies. This suggests that predicting the distribution of Kolmogorov scale eddies could help evaluate the susceptibility of medical device designs to hemolysis. Adjusting the design to increase the size of Kolmogorov scales may be beneficial in reducing the risk of hemolysis associated with these smaller turbulent structures.
Sonntag et al. [45]2019Intraventricular vortices were identified and visualized using the Q criterion in various studies. These vortices are linked to ventricular health.
Table 6. Viscosity Models and coefficients were utilized to evaluate the non-Newtonian behavior of the fluid (blood) based on Kopernik [46].
TypeViscosity ModelConstants
Carreau–Yasuda (CY) μ = μ + μ 0 μ [ 1 + ( λ γ ˙ ) α ] n 1 α μ = 0.0035   P a . s
μ 0 = 0.056   P a . s
λ = 1.902
α = 1.25
n = 0.22
Casson μ = μ 2 γ ˙ + 2 μ N   γ ˙ + N 2
N = μ p 1 H c t 8
μ = 0.625   H c t
μ p = 0.00145
H c t = 0.4
Cross μ = μ + μ o μ 1 + γ ˙ γ c n             μ = 0.0035   P a . s
μ o = 0.0364   P a . s
γ c = 2.63   s 1
n = 1.45
Power Law μ m i n < μ = λ γ ˙ n 1 < μ m a x n = 0.7755
λ = 0.01467
μ m a x = 0.025   P a . s
μ m i n = 0.00345   P a . s
Disclaimer/Publisher’s Note: The statements, opinions and data contained in all publications are solely those of the individual author(s) and contributor(s) and not of MDPI and/or the editor(s). MDPI and/or the editor(s) disclaim responsibility for any injury to people or property resulting from any ideas, methods, instructions or products referred to in the content.

