Article

Symmetrical Martensite Distribution in Wire Using Cryogenic Cooling

by
Irina Volokitina
1,*,
Andrey Volokitin
2,*,
Evgeniy Panin
2 and
Bolat Makhmutov
3
1
Department of Metallurgy and Material Science, Karaganda Industrial University, Temirtau 101400, Kazakhstan
2
Department of Metal Forming, Karaganda Industrial University, Temirtau 101400, Kazakhstan
3
Department for Research and International Cooperation, Karaganda Industrial University, Temirtau 101400, Kazakhstan
*
Authors to whom correspondence should be addressed.
Symmetry 2024, 16(9), 1174; https://doi.org/10.3390/sym16091174
Submission received: 7 August 2024 / Revised: 29 August 2024 / Accepted: 3 September 2024 / Published: 7 September 2024

Abstract

:
This article presents the results of research on a new combined process involving multi-cycle wire-drawing and subsequent cryogenic cooling after each deformation stage. For theoretical research, modeling in the Deform software was performed. The analysis of temperature fields and the martensitic component in all models showed that for both considered thicknesses, the most effective option is a low deformation velocity and the conduct of a process without heating. The least effective option is to use an increased thickness of the workpiece at an increased deformation velocity and the conduct of a process without of heating to ambient temperature, which acts as a local cooling of the axial zone of the workpiece with an increase in the workpiece thickness. An analysis of laboratory studies on this combined process revealed that in the absence of intermediate heating of a wire between deformation cycles, 100% martensite is formed in the structure. However, if intermediate heating to 20 °C between deformation cycles is carried out, a gradient distribution of martensite can be obtained. And, since the wire has a circular cross-section, in all cases, martensite is distributed symmetrically about the center of the workpiece.

1. Introduction

Austenitic stainless steels are a key material in the modern world, occupying an impressive 80% of the global market for all corrosion-resistant steels. An important feature of such steels is their ability for γ–α transformation during plastic deformation. The lower the deformation temperature, the higher the concentration of the resulting martensite. Therefore, the γ–α transformation is particularly important in the production of high-strength wire. To obtain such a wire made of AISI-316 austenite stainless steel, a deformation of 90–92% is recommended. This deformation makes it possible to obtain 75% of the martensitic structure [1], which provides the best combination of plastic and strength properties. But, when processing medium and small cross-sections of wire, the use of 90–92% deformation is impossible, since wire-drawing leads to a decrease in its diameter, which makes it difficult to achieve the desired deformation degree. It was shown in [2,3,4] that good toughness, accompanied by a high yield strength of ~1 GPa for stainless steels with a heterogeneous lamellar structure (HLS) at ambient temperature, is explained by sharp plastic destruction caused by a lamellar microstructure and the deformation-induced transformation of austenite into martensite (TRIP effect). Austenitic stainless steels can exhibit complex deformation behavior depending on their composition, strain rate and temperature [5,6,7,8,9,10]. A decrease in the processing temperature will contribute to the decomposition of austenite, and a martensitic phase transformation is likely to occur in metastable microstructures. The energy of packaging defects also decreases at low temperatures, which makes it possible to convert austenite into ε-martensite due to the accumulation of packaging defects.
The magnitude of the γ→α’ transformation depends on the deformation level, temperature and chemical composition of the alloy. Numerous studies of the γ→α’ transformation have been carried out on austenitic steels using a variety of deformations, for example, rolling reduction [11,12], compression [13] and tensile tests [14,15]. As a result of such studies, it was found that the γ→α’ transformation is easily achieved in 304 steel due to its chemical composition. In most cases, this is observed when the content comprises a high amount of Cr (>18 wt. %) and/or a low amount of Ni (<10 wt. %), since the doping of Ni leads to the stabilization of the austenite structure and the doping of Cr contributes to the development of the structure of α’-martensite. Studies aimed at the same transformation in 316 stainless steel are few [16,17,18]. Cold wire extraction was carried out for 316L steel, which led to the formation of a significant amount of martensite α’. When refining 316L stainless steel powder in a ball mill, a large amount of martensite α’ is also formed. In [19], the absence of martensite was found in 316LN steel deformed to rupture by stretching, in contrast to deformation at a cryogenic temperature of 77 K. Based on all these studies, at the same deformation degree and this temperature, the γ→α’ transformation of austenitic stainless steels can be ordered as follows: 304 > 304L > 316 > 316L > 316LN. As shown in [20,21], when applying high pressure torsion at the maximum possible pressure and deformation conditions, another sequence of transformations can be obtained, i.e., γ → α’ → ε. The effect of martensite formation on such properties of stainless steels as deformability [22,23], corrosion resistance [24], mechanical properties and crack propagation has long been studied.
So, in today’s world, the demand for high-quality and functional materials is constantly growing, and developers are looking for new ways to increase efficiency and productivity. One of the most promising areas in this field is that of combined technologies, which is the synthesis of various approaches that allow developers to obtain optimal results [25,26,27,28,29,30,31,32,33]. When applied to the production of long-length products such as wire, combined technologies open up a wide breadth of opportunities for process optimization [34,35,36]. They allow the combination of the advantages of various processing methods, creating new technological chains that can significantly increase production efficiency. In recent years, more and more attention has been paid to materials with highly refined structures, which are characterized by high strength [37,38,39]. Higher values of strength factors due to an increase in the proportion of surface grain boundaries are usually accompanied by a decrease in plasticity. This limitation significantly narrows the scope of application of materials with a refined structure, since they can become brittle and unable to withstand significant loads. One of the promising developments in the field of wire processing is thermomechanical processing [40,41].
Traditional methods of manufacturing long products from metastable austenitic steels, such as wire, often involve multiple heat treatment steps to achieve one’s desired mechanical properties. This approach, although time-tested, has a number of disadvantages. Firstly, numerous heat treatment stages significantly lengthen the production cycle, which negatively affects production speed and profitability. Secondly, each heat treatment step requires additional energy costs, which increase the cost of the final product. The described approach is radically different from existing solutions; it is proposed to carry out cryogenic cooling after each drawing stage. This technology makes it possible to completely convert the austenitic structure of steel into martensite, forming an ultrafine-grained structure with unique properties. The austenitic structure characteristic of metastable steels is characterized by high ductility, but does not have high strength. The transition to martensite, which is achieved through cryogenic cooling, significantly increases the material’s strength. Therefore, cryogenic processing opens up new possibilities for the production of high-strength stainless steel wire. This method makes it possible to obtain a material with improved properties at reduced costs and is a promising direction in the development of innovative metalworking technologies.
The novelty of this work is the synergy of mathematical modeling and a laboratory experiment to study the distribution of martensite in a wire subjected to a new thermomechanical process. For this purpose, the methods of theoretical finite element method (FEM) simulation and experimental verification with a deep metallographic analysis of stainless steel were used.

2. Materials and Methods
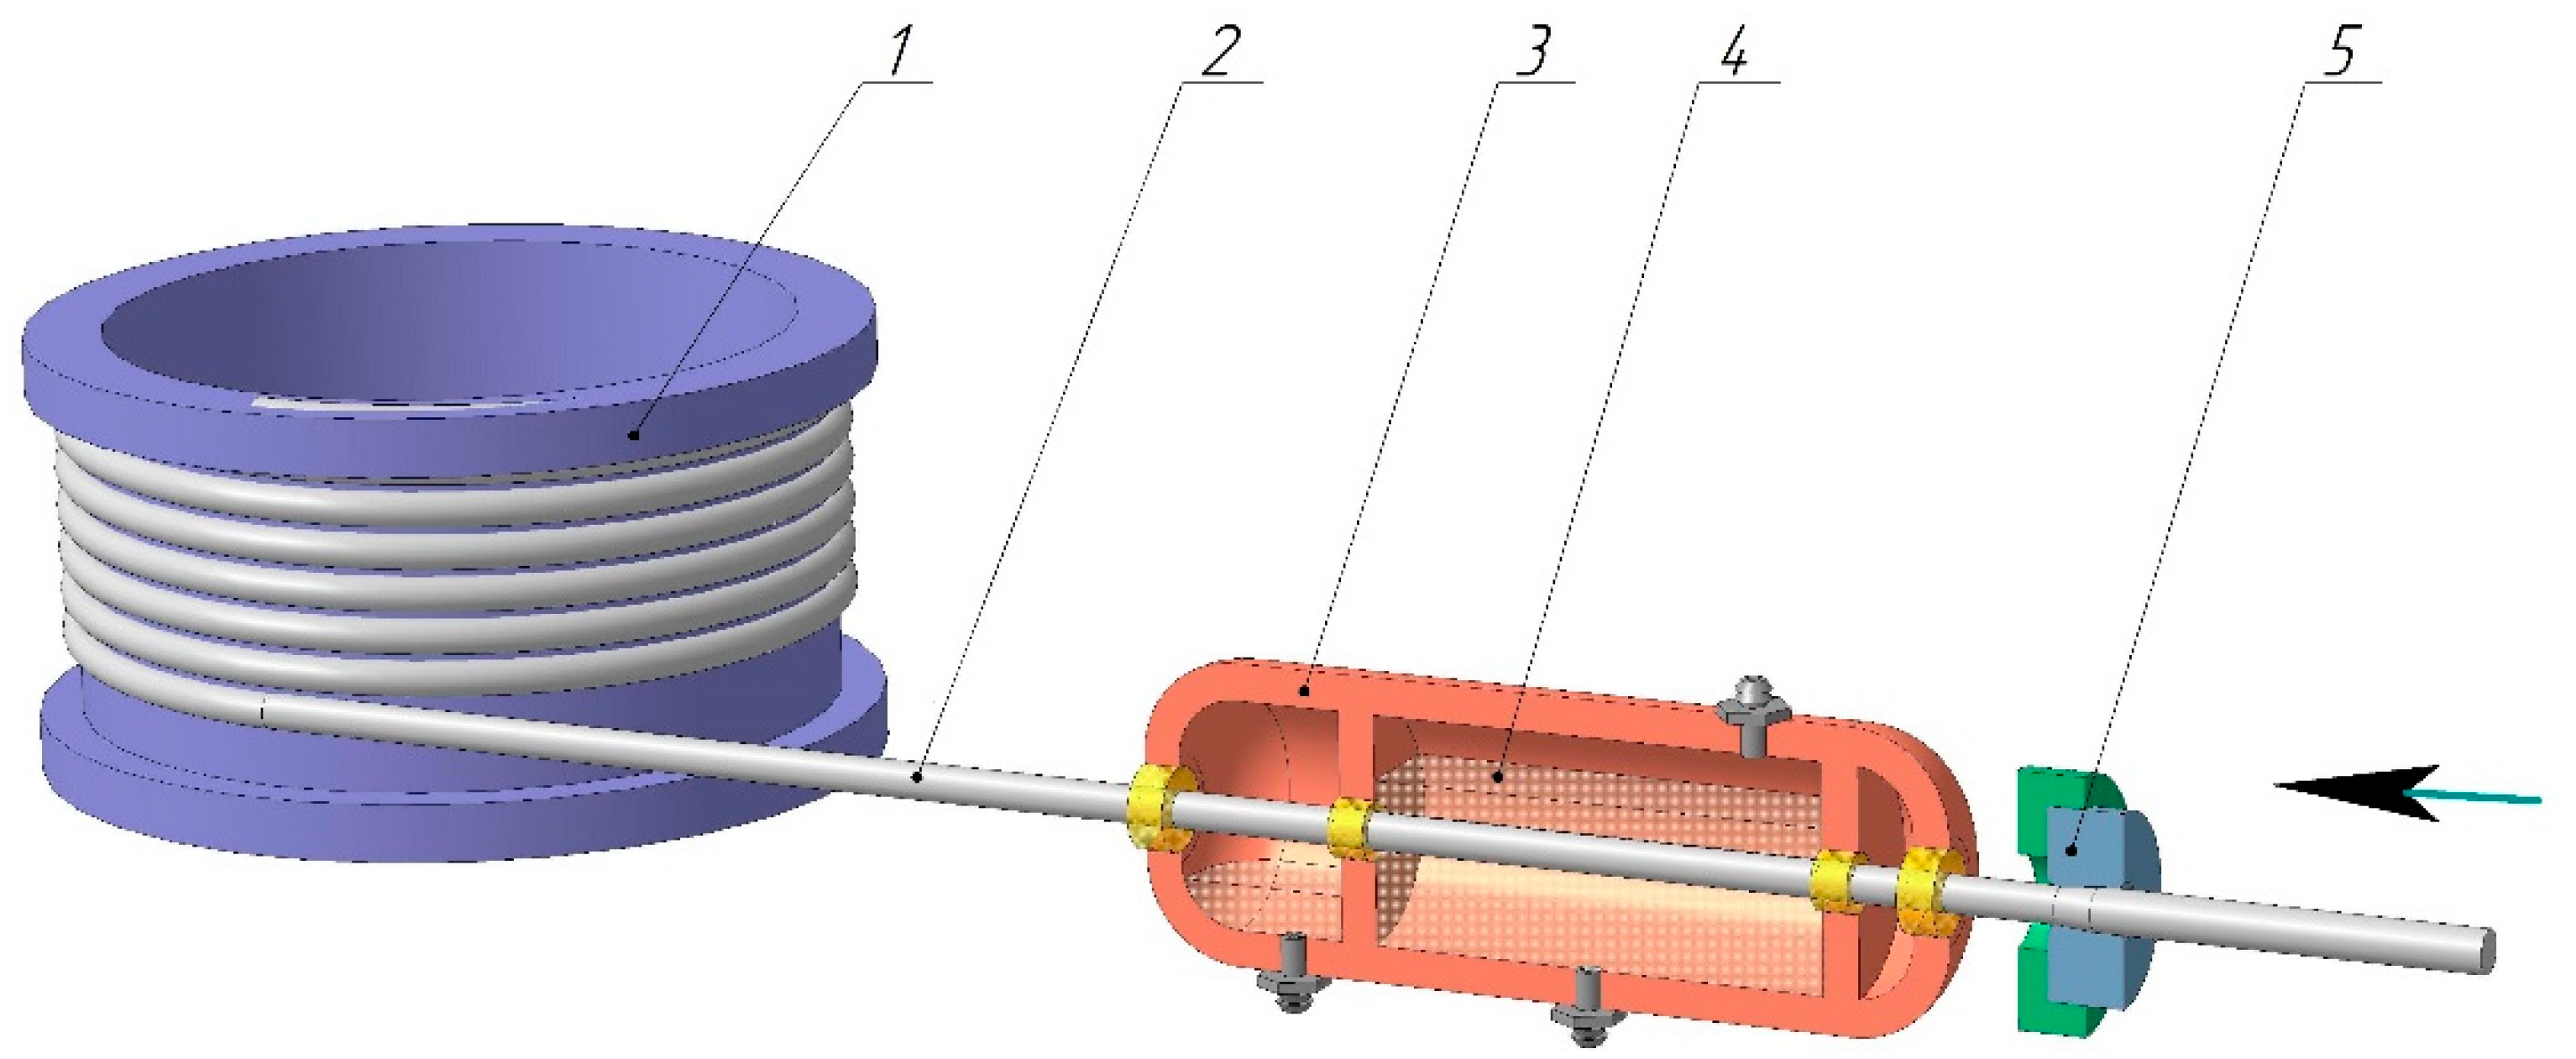
2.1. Modeling

The wire intended for thermomechanical processing goes through the standard stage of its installation in a die. To accomplish this, its end is sharpened to ensure smooth passage through the drawing hole. After that, the wire enters a special storage chamber located directly behind the drawing tool. This chamber is a key element of the thermomechanical processing system. The storage chamber is equipped with a liquid nitrogen recirculation system. The moment the wire enters the chamber, it is immersed in a cold nitrogen environment, the temperature of which reaches −196 °C. Such a sharp cooling leads to a change in the structure of the metal, making it more durable and ductile. After leaving the chamber, the wire is wound onto the drum of the drawing mill.
As part of the thermomechanical processing process, it was decided to reduce the compression level during drawing to 5–7% compared to the traditional method. This is due to the use of cryogenic cooling. Therefore, during the first deformation cycle, the wire diameter changed from 6 mm to 5.6 mm, then, on the second pass, from 5.6 mm to 5.3 mm and on the third, from 5.3 mm to 5 mm. During the tests, it was decided to consider the possibility of using thermomechanical processing for wire with a larger diameter, for example, 9 mm. Here, the workpiece was stretched to 8.2 mm, then, on the second pass, from 8.2 mm to 7.5 mm and on the third, from 7.5 mm to 7 mm (Figure 1).
During the thermomechanical processing of stainless austenitic wire, the phase transformation of austenite into martensite will occur. In this case, the intensity of this transformation will depend on both geometric parameters (the initial diameter of the wire and the values of compression in each passage) and technological parameters (temperature distribution over the cross section, which depends on the deformation rate in the fiber and the cooling time in liquid nitrogen). To evaluate these phase transformations, 8 models were used, built during the study for the following efforts:
(1)
from 6 mm to 5 mm at 500 mm/s, heating the workpiece to 20 °C after each cooling in nitrogen;
(2)
from 6 mm to 5 mm at 1000 mm/s, heating the workpiece to 20 °C after each cooling in nitrogen;
(3)
from 6 mm to 5 mm at 500 mm/s without preheating the workpiece;
(4)
from 6 mm to 5 mm at 1000 mm/s without preheating the workpiece;
(5)
from 9 mm to 7 mm at 500 mm/s with preheating of the workpiece to 20 °C after each cooling in nitrogen;
(6)
from 9 mm to 7 mm at 1000 mm/s with preheating of the workpiece to 20 °C after each cooling in nitrogen;
(7)
from 9 mm to 7 mm at 500 mm/s without preheating the workpiece;
(8)
from 9 mm to 7 mm at 1000 mm/s without heating the workpiece.
DEFORM software (SFTC, Columbus, OH, USA) V13.0 was used for a FEM simulation of the investigated thermomechanical processing process. AISI-316 austenitic stainless steel was chosen as the material workpiece for simulation. The rheological properties of AISI-316 steel at cryogenic conditions were taken from Ref. [42]; they are also available via https://doi.org/10.17632/6m5r6f2z5g.1 (accessed on 1 August 2024).
The following parameters were used in FEM simulation:
-
the initial state of the workpiece material was isotropic; the type of material was elastic–plastic; the type of material for drawing dies was rigid;
-
the type of finite elements was quadrangular; the number of FE nodes was 200, and the number of FEs was 957. An adaptive type of remeshing with a FE condensation coefficient of 4 in plastic deformation zones was adopted at the finite element mesh. One such FE mesh allowed the reduction in the face of the finite element in the zones necessary for the accurate rendering of the changing geometry.
-
the temperature of all drawing dies was equal to 20 °C; the temperature of zone with liquid nitrogen was equal to −196 °C;
-
the calculation type was non-isothermal; the heat exchange coefficient of the workpiece with the tool was 5000 W/(m2·°C), as the recommended value by the DEFORM system for metal forming processes, where each point of the workpiece had a short contact time with the deforming tools;
-
the contact interaction between the workpiece and the drawing dies was set in accordance with Siebel friction; the friction coefficient on contact was adopted at 0.1 (which corresponds to a polished surface with a low level of roughness in the lubrication condition).
The calculation was carried out by a direct iterative method using a sparse matrix solver for a higher level of convergence at each step. In the calculation, a time increment was used to maintain high accuracy—1 step was equal to 0.1 s. For the correct modeling of phase transformations, a thermo-kinetic diagram was used in the material base, characterizing phase transitions depending on temperature and time. At initial conditions, 100% austenite was specified in the workpiece section.

2.2. Laboratory Experiment

In this study, AISI-316 steel (C = 0.08%, Mn = 2%, Cr = 17%, Ni = 12%, Mo = 2.5%) wire was used, which has high corrosion resistance and mechanical strength. To obtain the initial equiaxed austenitic structure, the wire was subjected to heat treatment. Austenite is characterized by high plasticity and malleability to deformation. It is important to note that the austenitic structure is much more “riveted” than δ-ferrite, which has a higher hardness and, accordingly, is more resistant to deformation. To obtain the initial austenitic structure, the wire was tempered at a temperature of 1050 °C, kept at this temperature for 30 min and then sharply cooled in water. This treatment made it possible to transfer the steel to the austenitic phase, removing as much as possible the residual stresses that arose during the previous treatment.
The experimental study of the investigated combined process was carried out using the drawing mill B-I/550 M for 3 deformation cycles, as shown by computer modeling. From 8 simulated technologies, the 2 technologies that showed the best results were selected for the laboratory experiment:
(1)
deformation from 6 mm to 5 mm at 500 mm/s with heating of the workpiece to 20 °C after each cooling in nitrogen;
(2)
deformation from 6 mm to 5 mm at 500 mm/s without heating the workpiece.
The change in phase composition was analyzed via X-ray diffraction (XRD) on a Shimadzu XRD-6000 diffractometer with Cu-Ka radiation (λ = 1.54056Å). The scanning speed was ~3 °/min.
The electron backscattering diffraction (EBSD) method provides access to a huge amount of information that cannot be obtained with conventional observations using secondary or backscattered electrons, for example, of local texture, analysis of the state of deformation at the grain scale and the relationship between the orientations of phases involved in allotropic transformations. Therefore, for an in-depth study of the microstructural processes occurring in martensite, a series of high-resolution scans using the EBSD method were carried out. Martensite α’ is shown in the orientation color along the Y-axis, austenite is white and martensite ε is yellow.
It is known that the evolution of the microstructure in materials with low stacking fault energy largely depends on crystallographic orientation. This means that, depending on the orientation of the crystals in the material, various deformation mechanisms may prevail, such as planar sliding, the formation of mechanical twins or the formation of shear bands.

3. Results and Discussion

3.1. Simulation Results

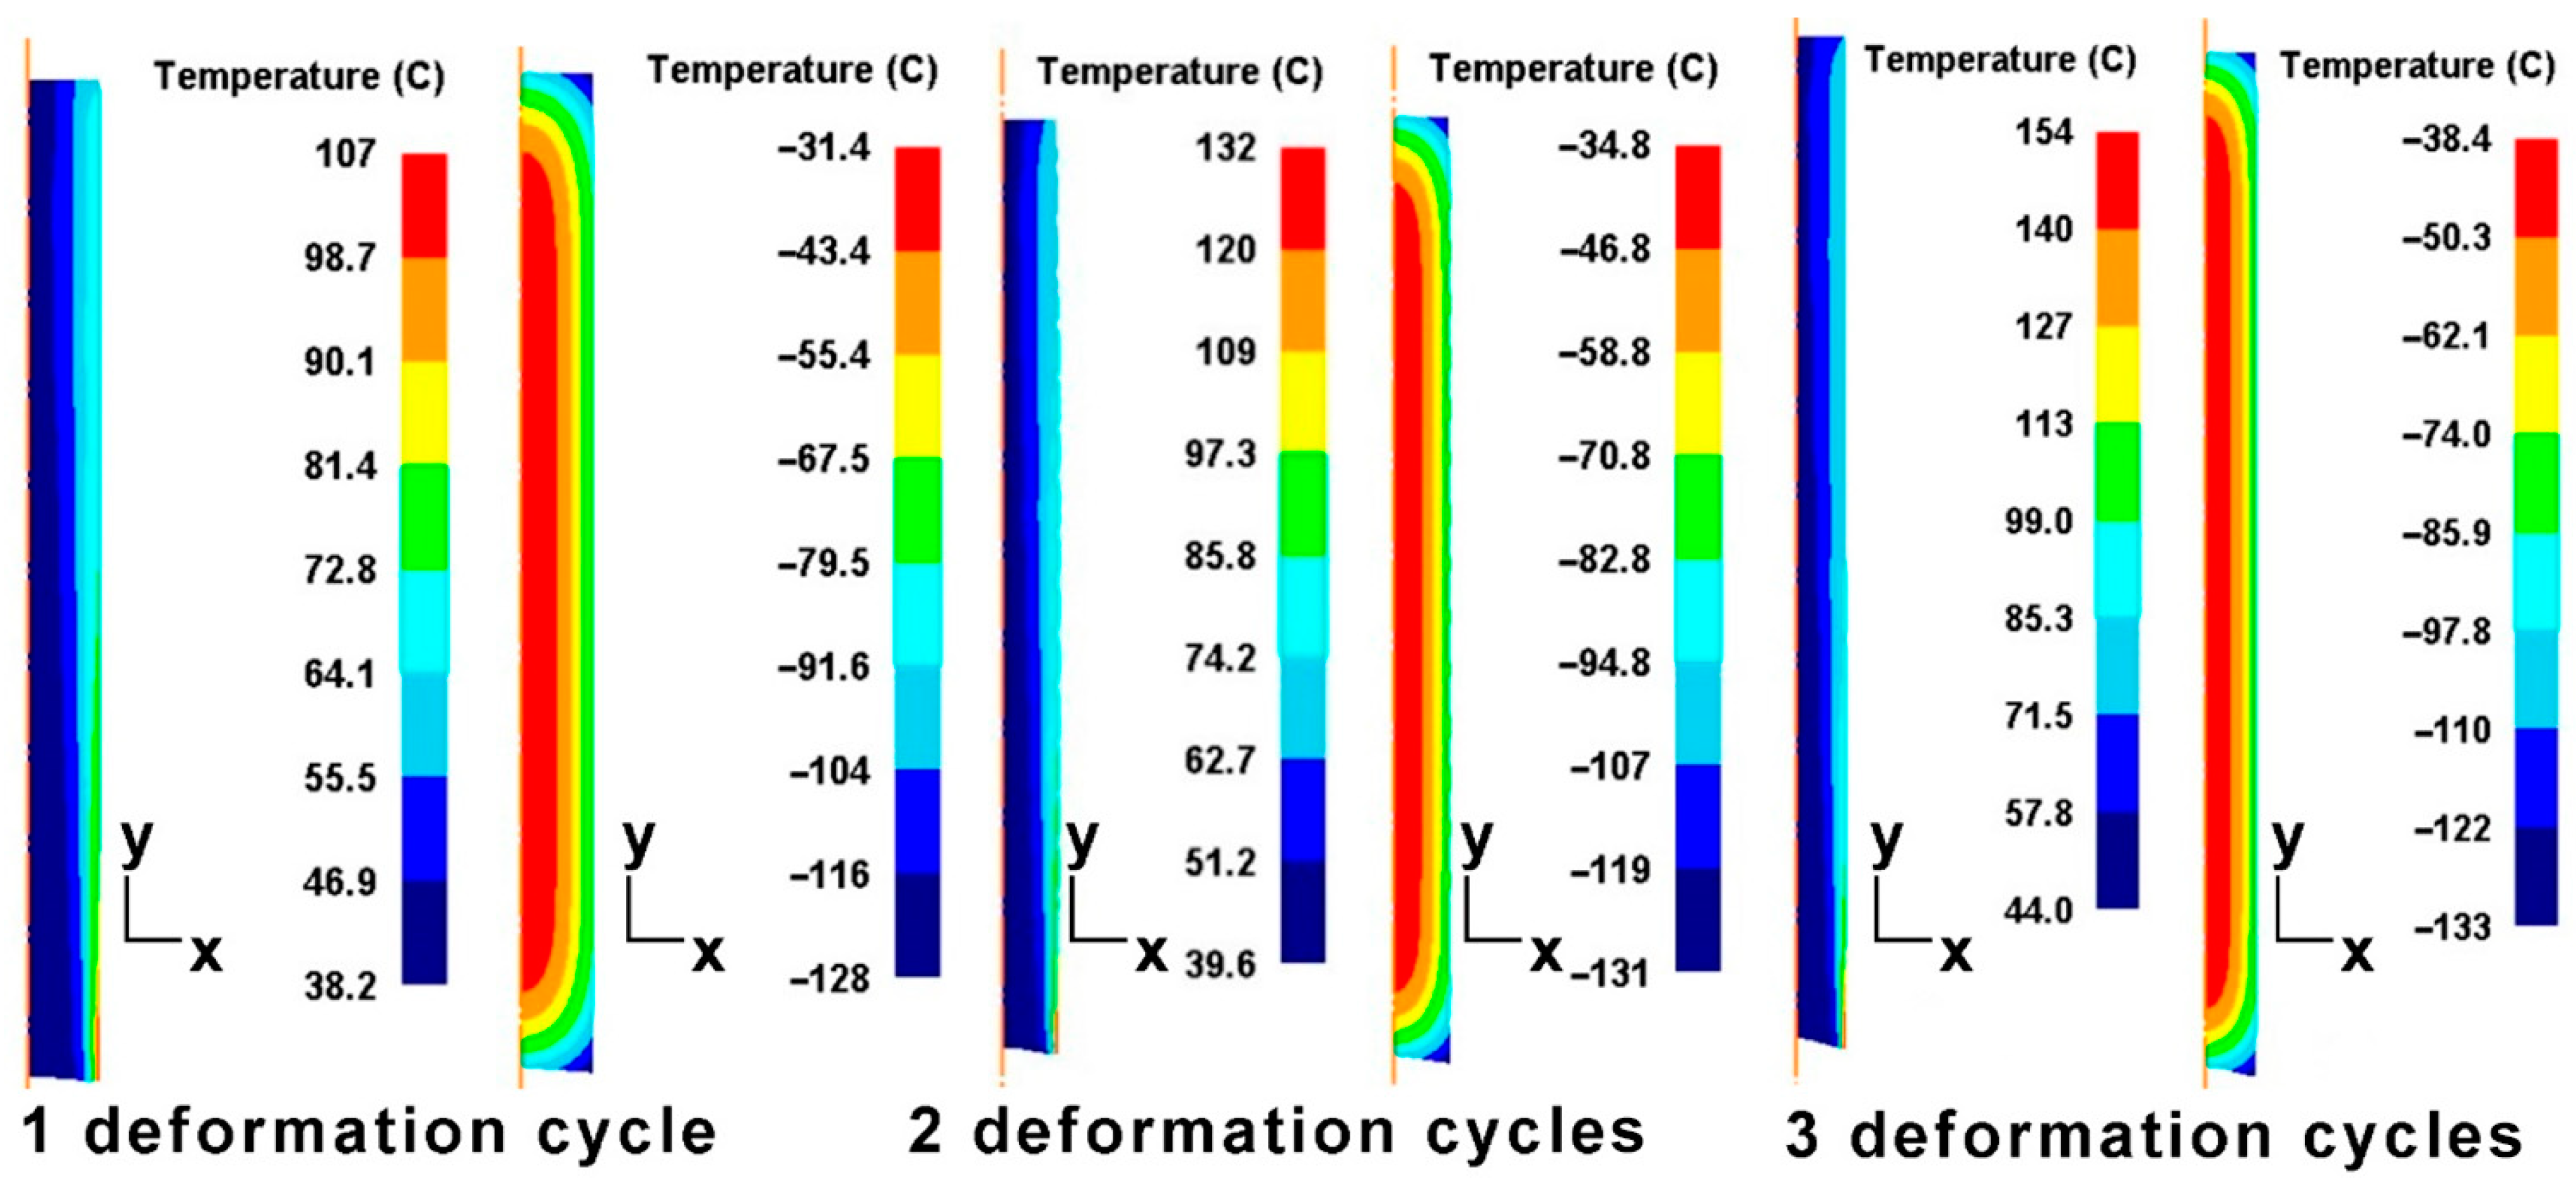
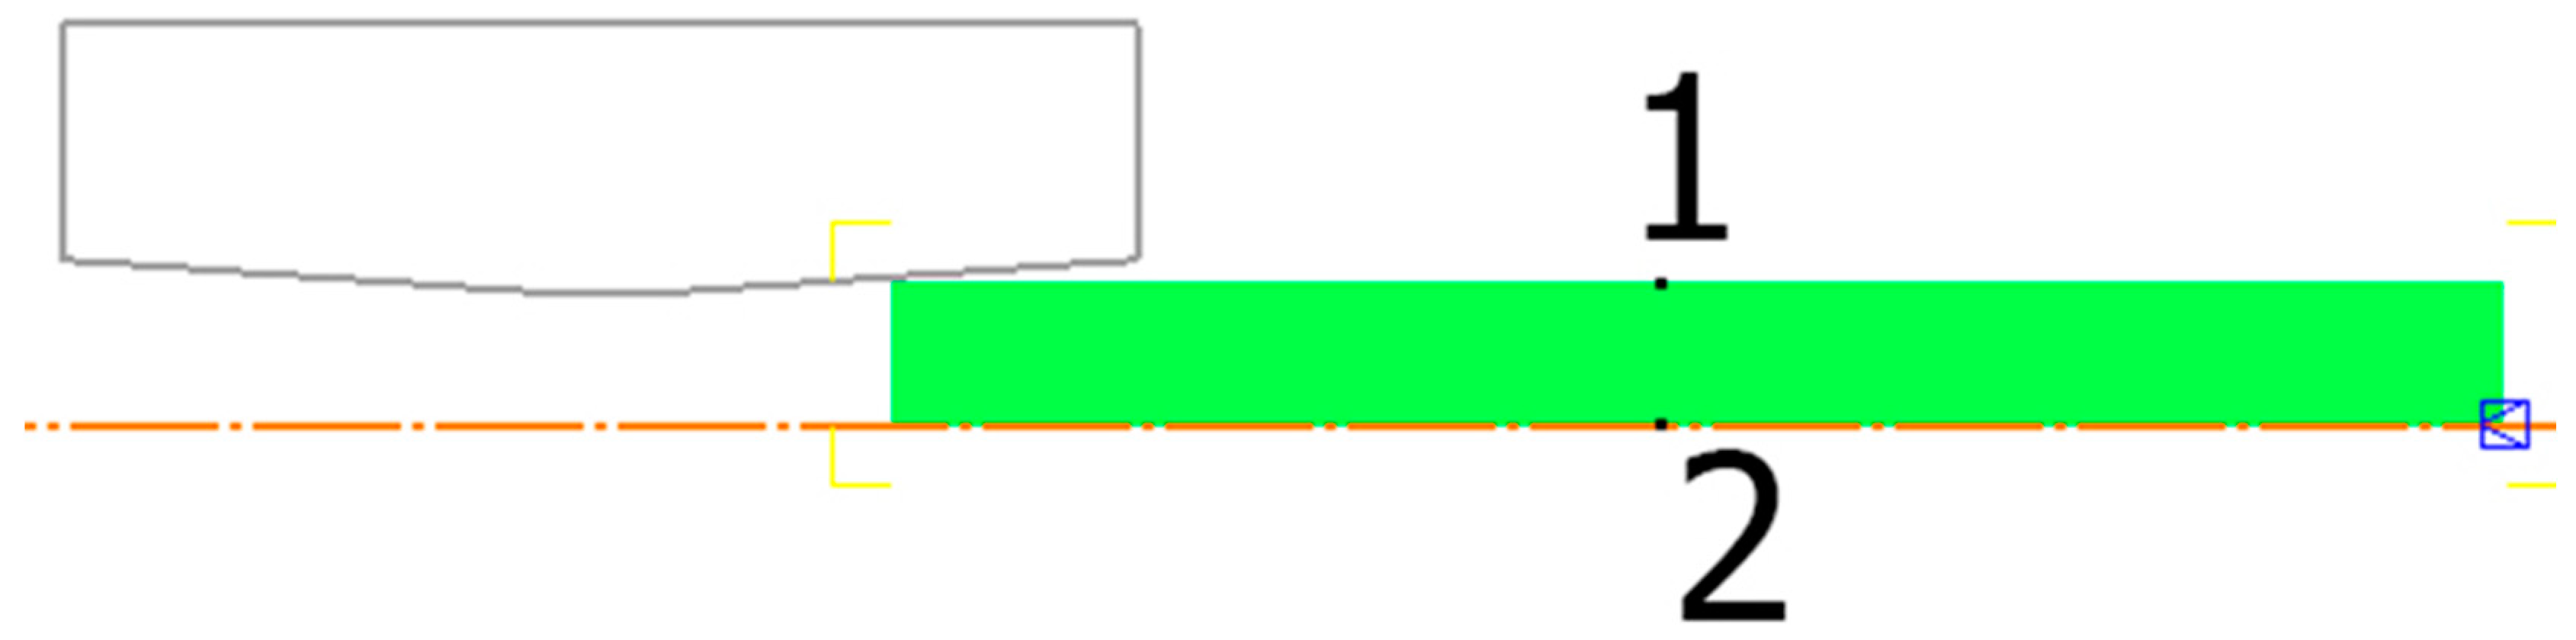
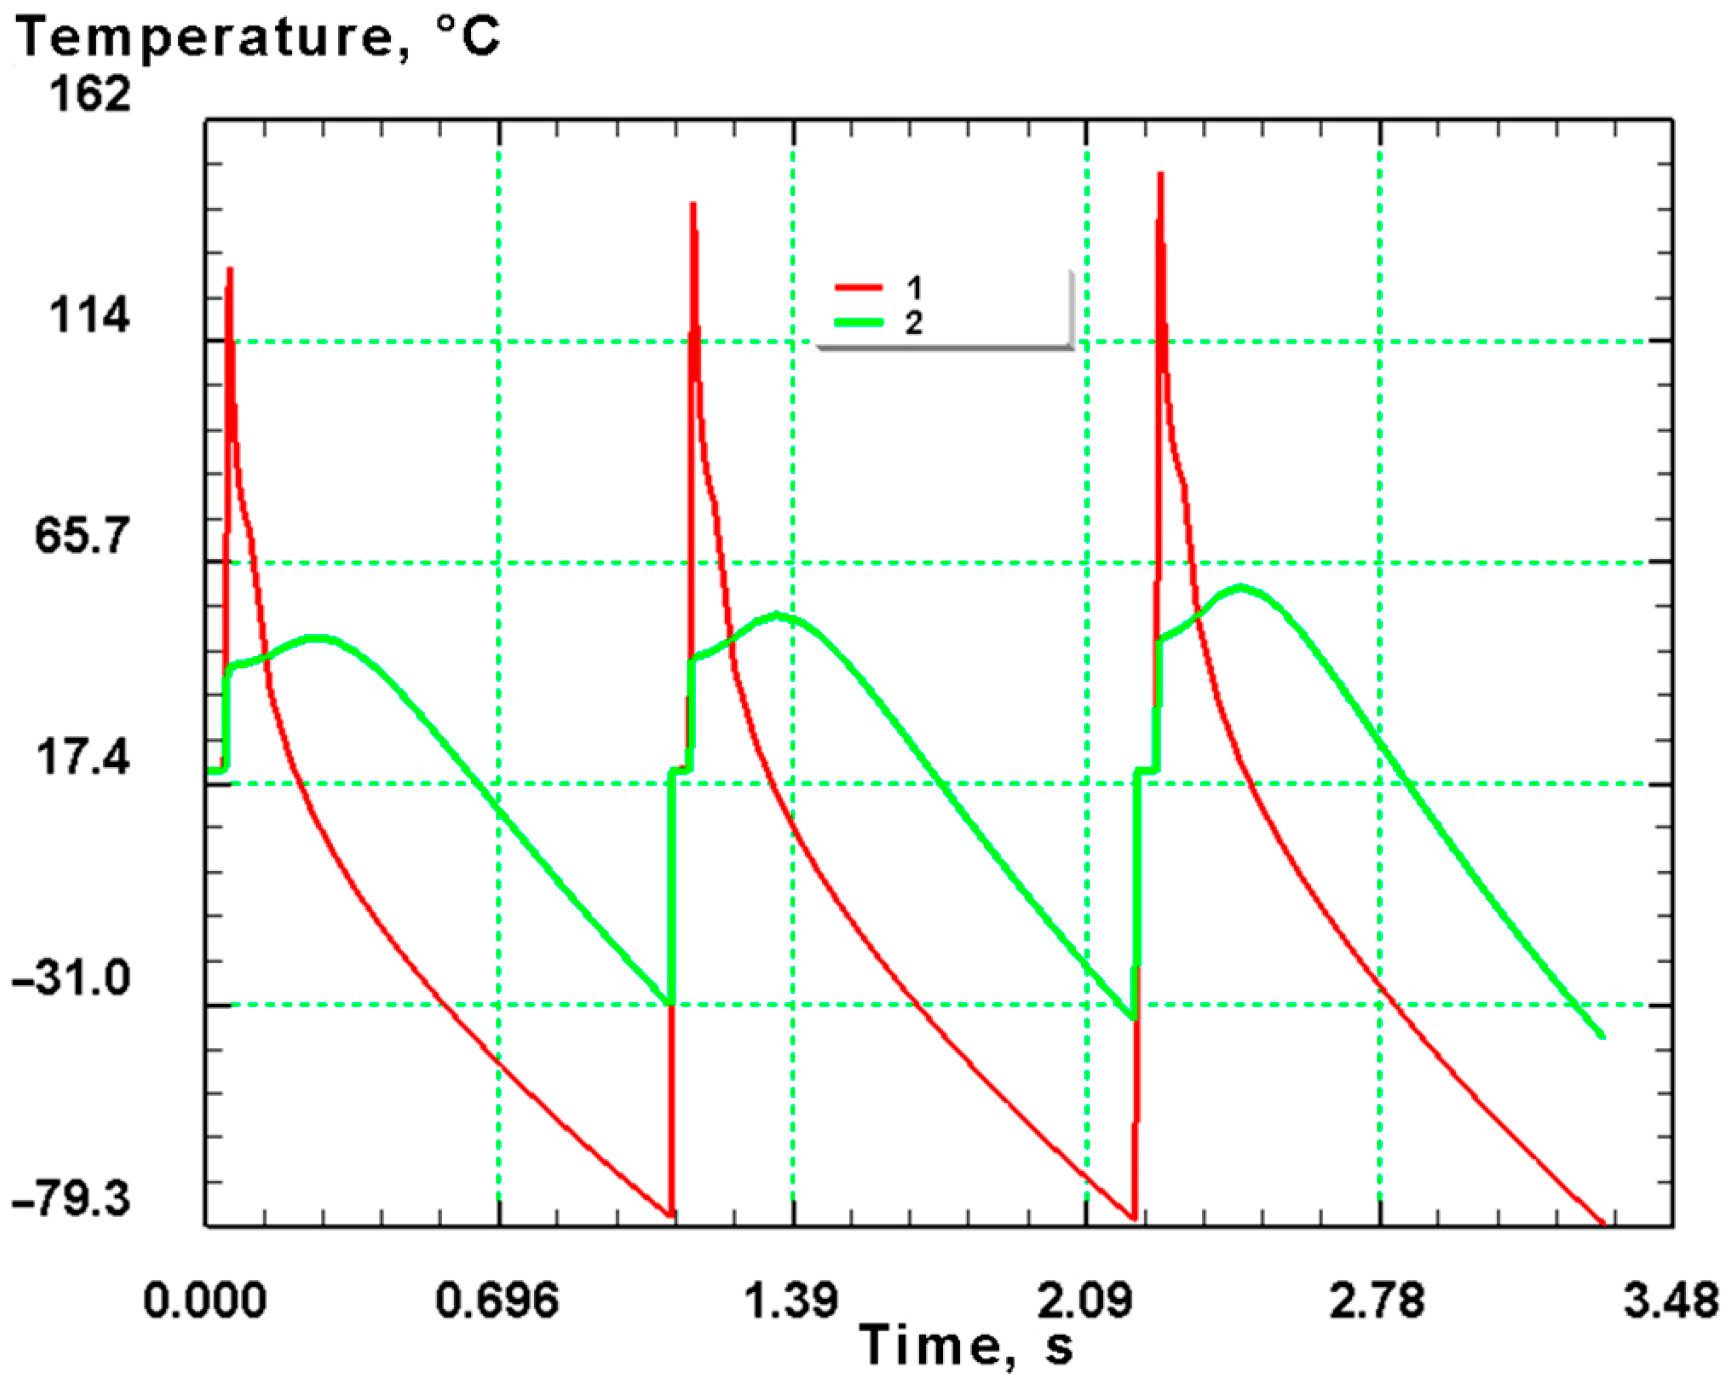
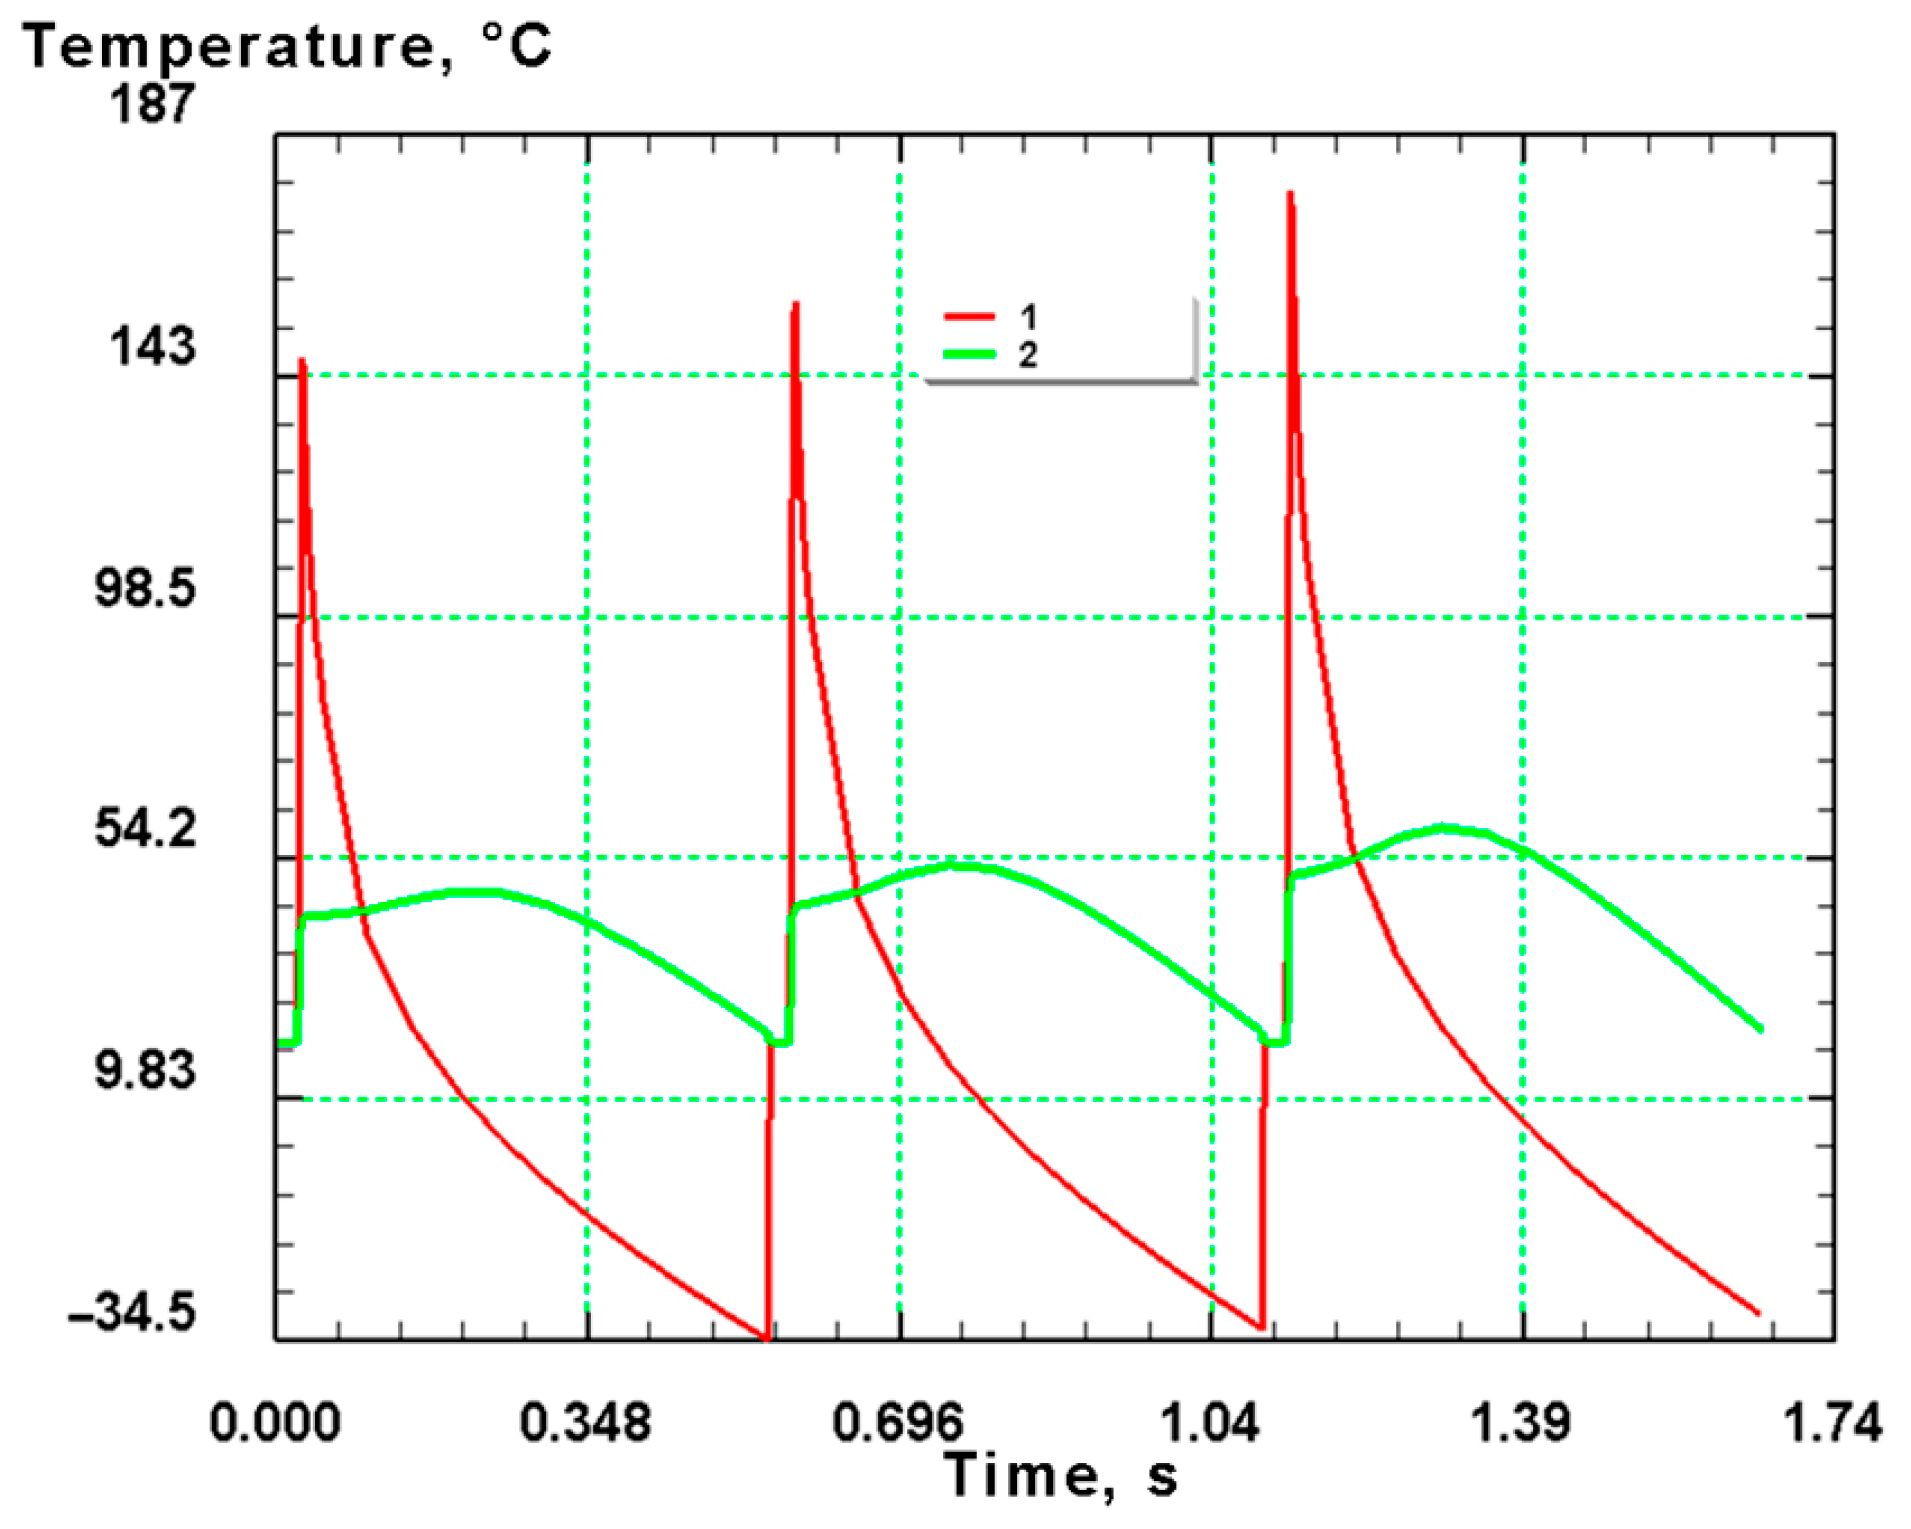
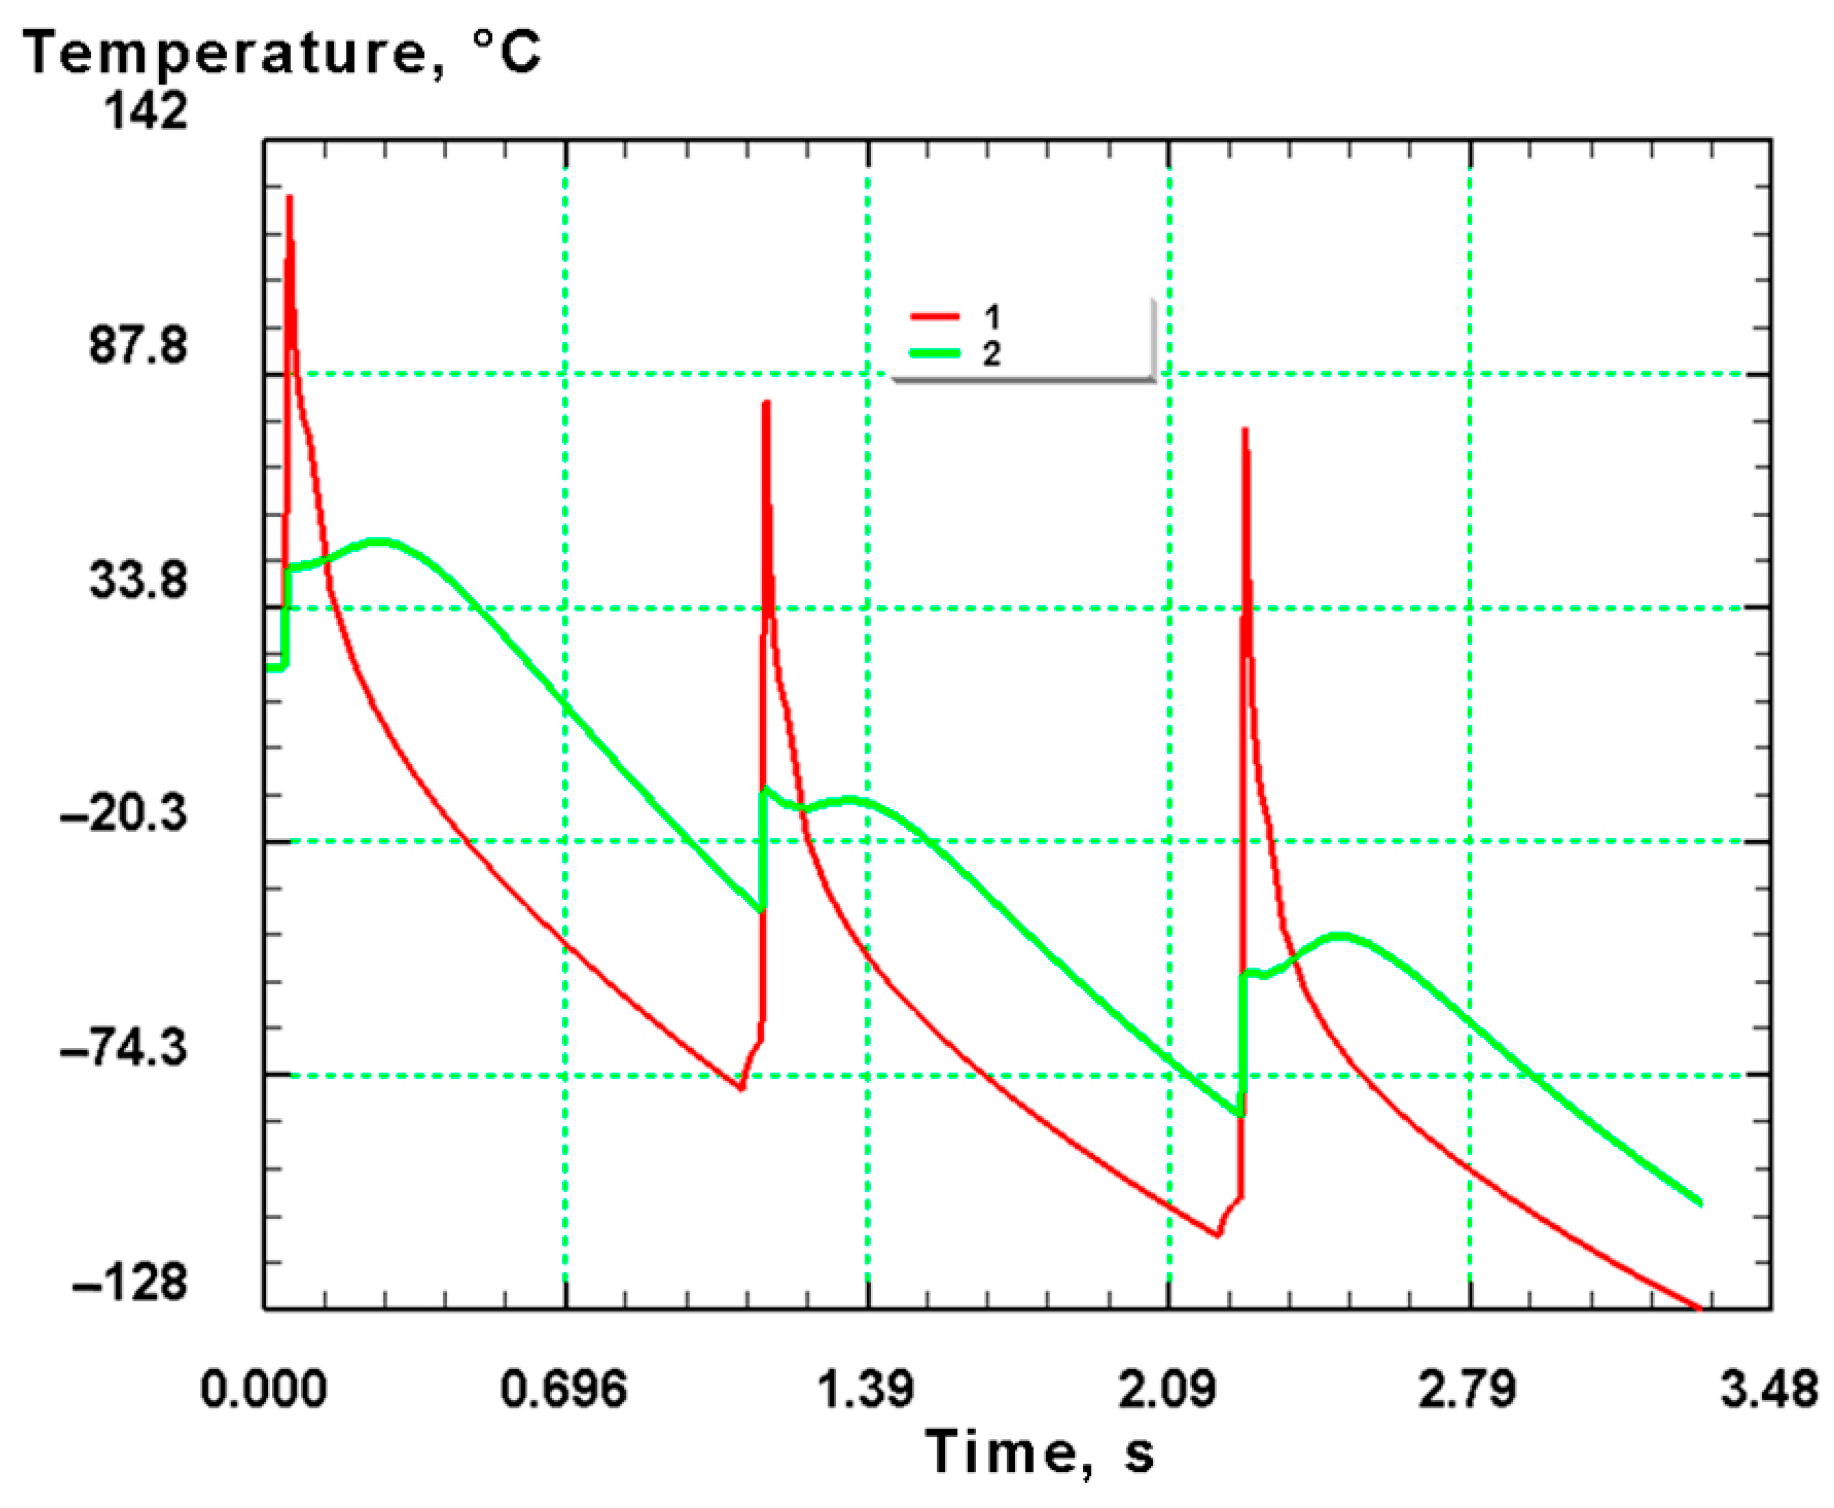
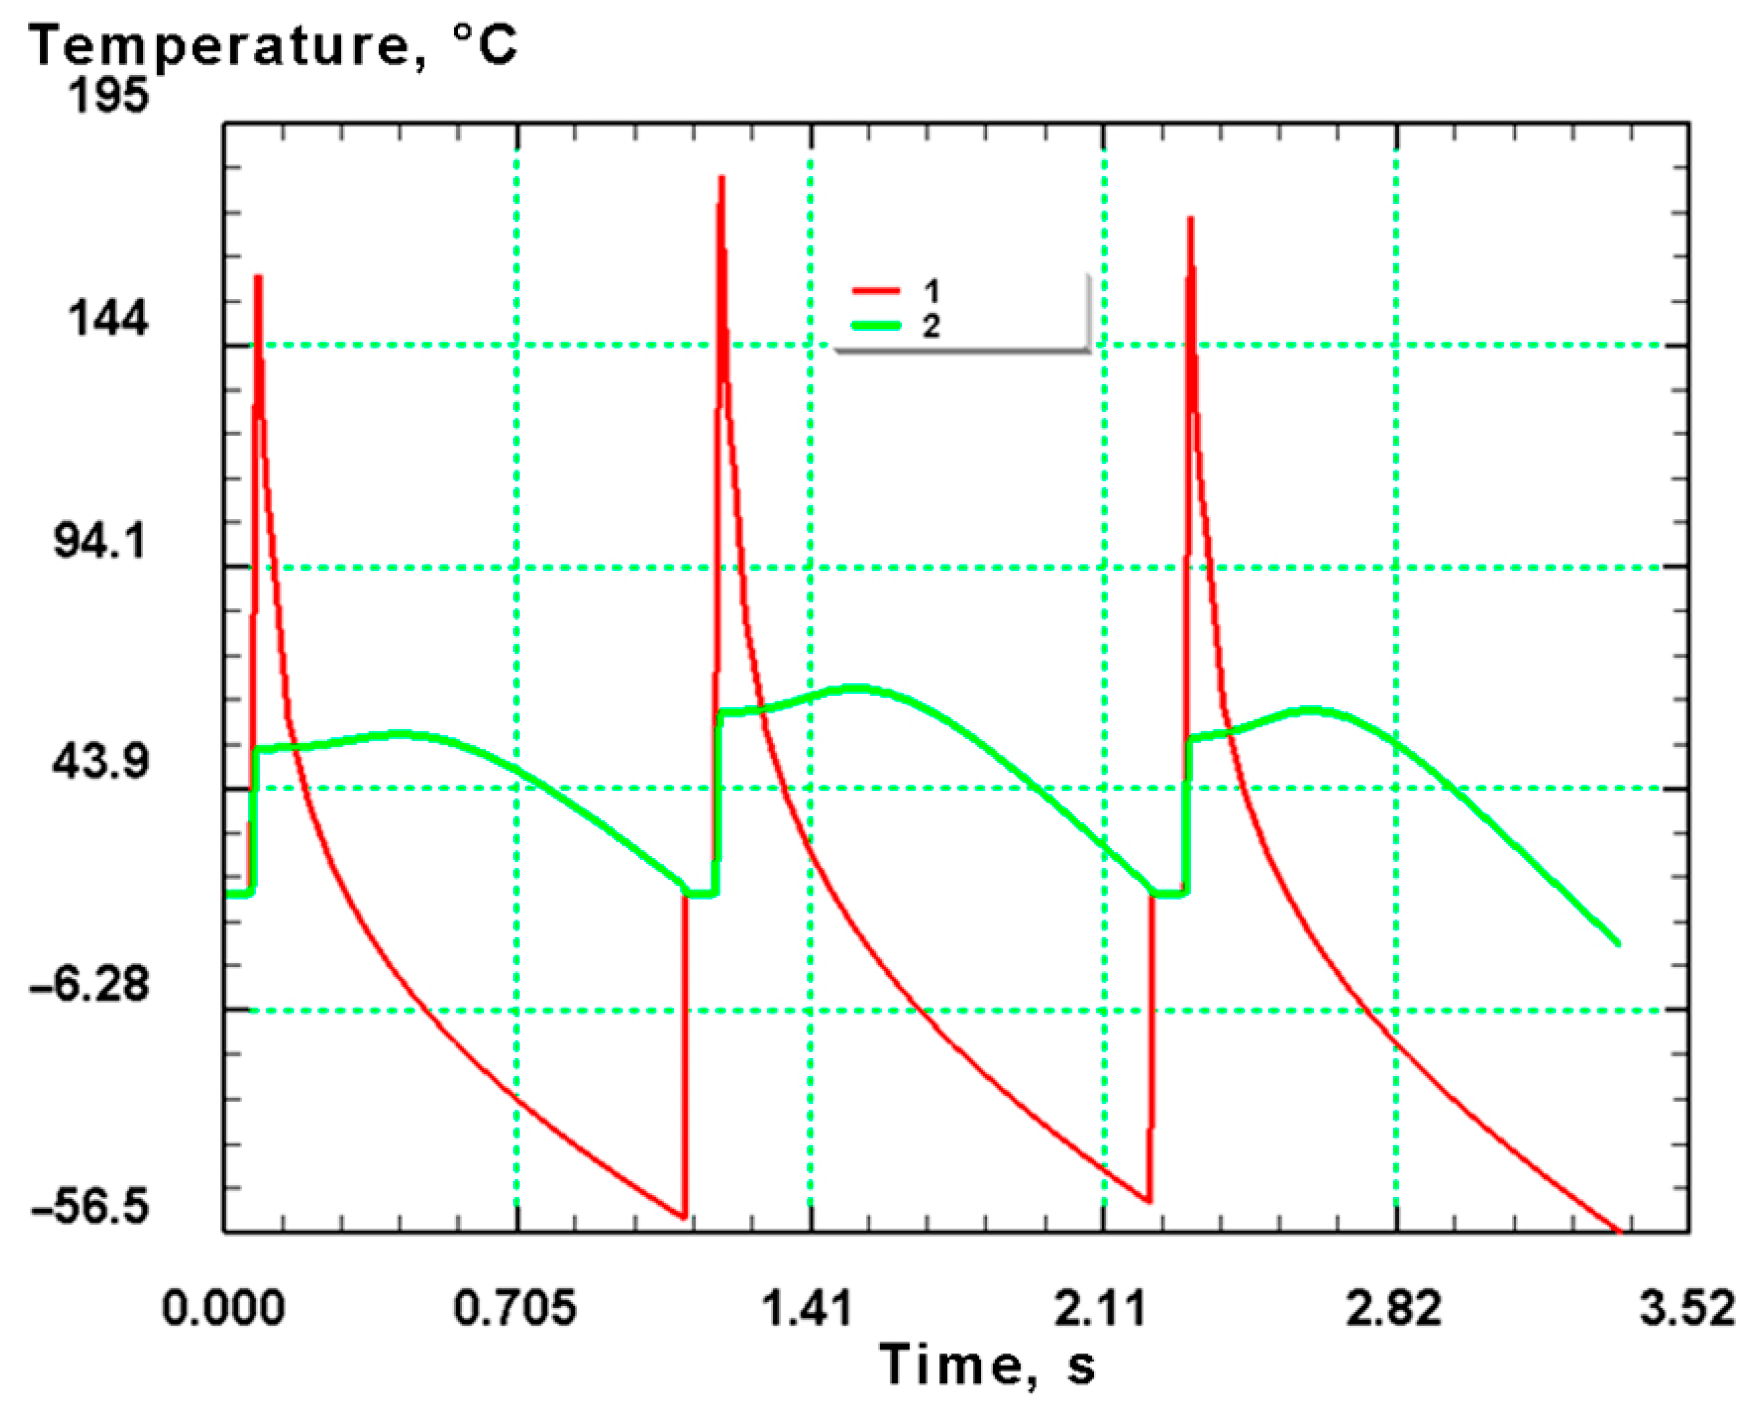
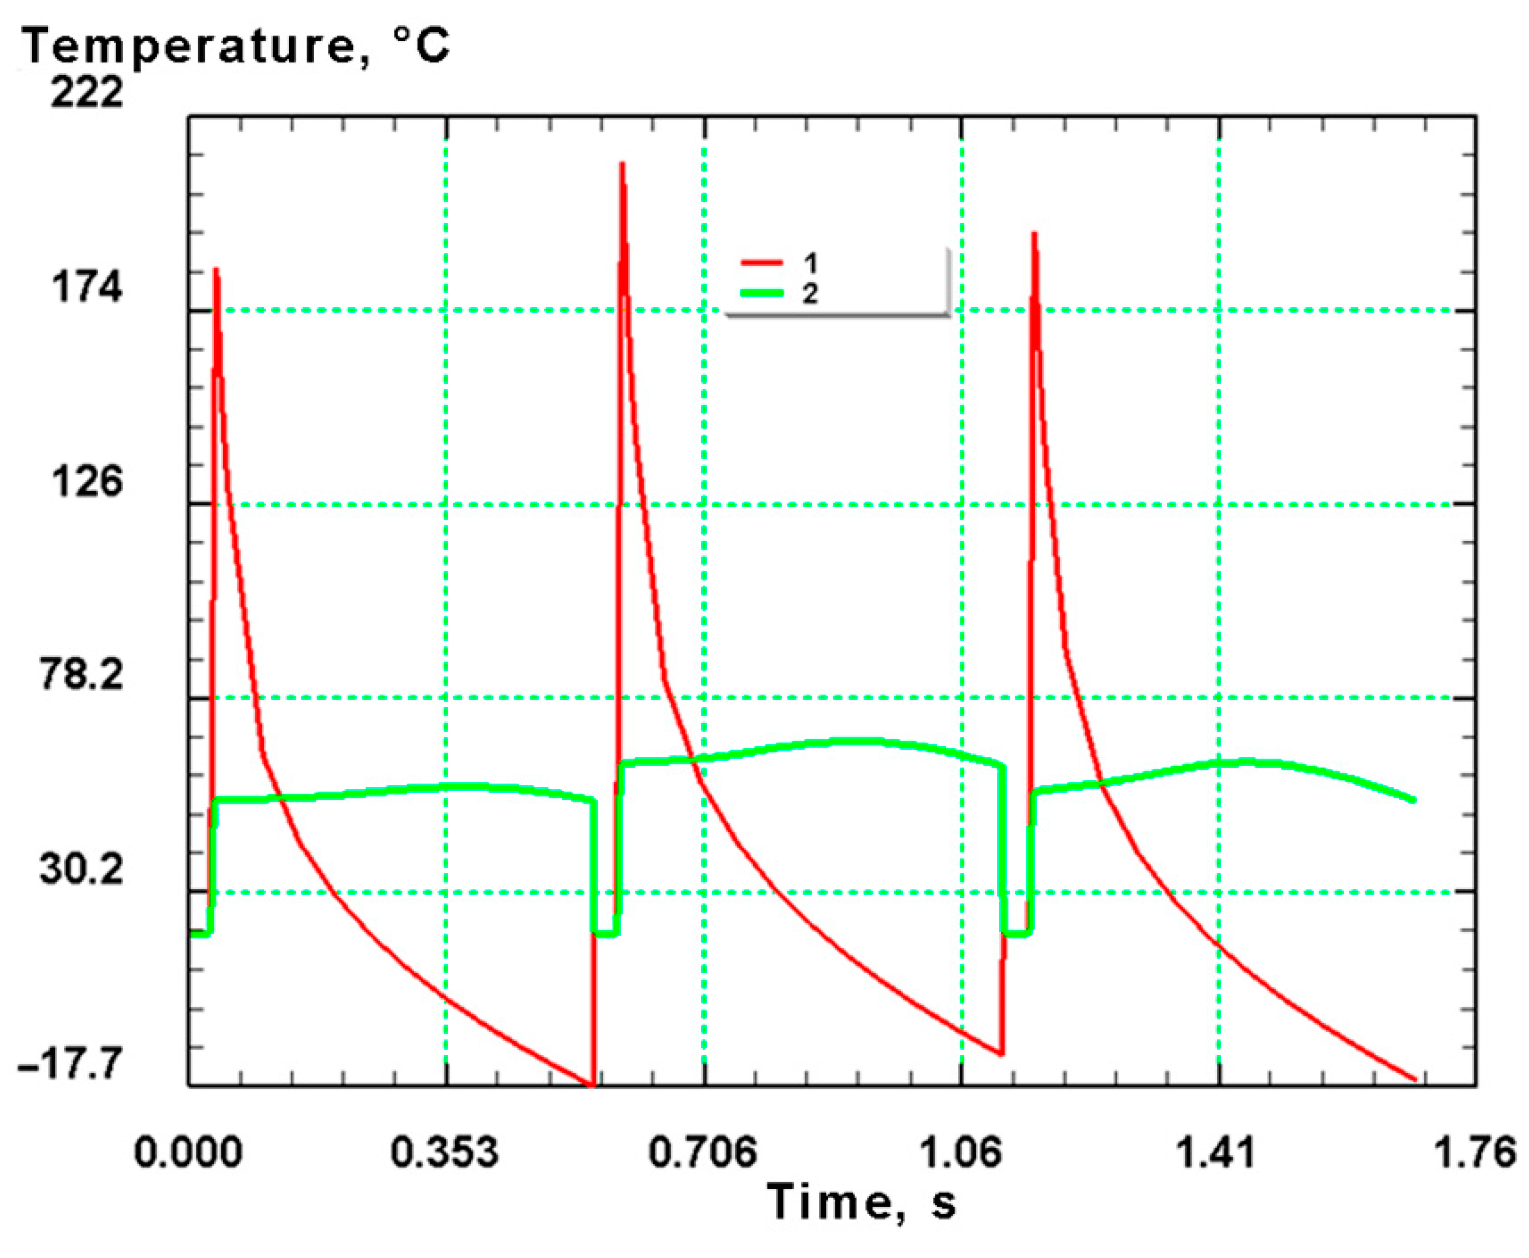
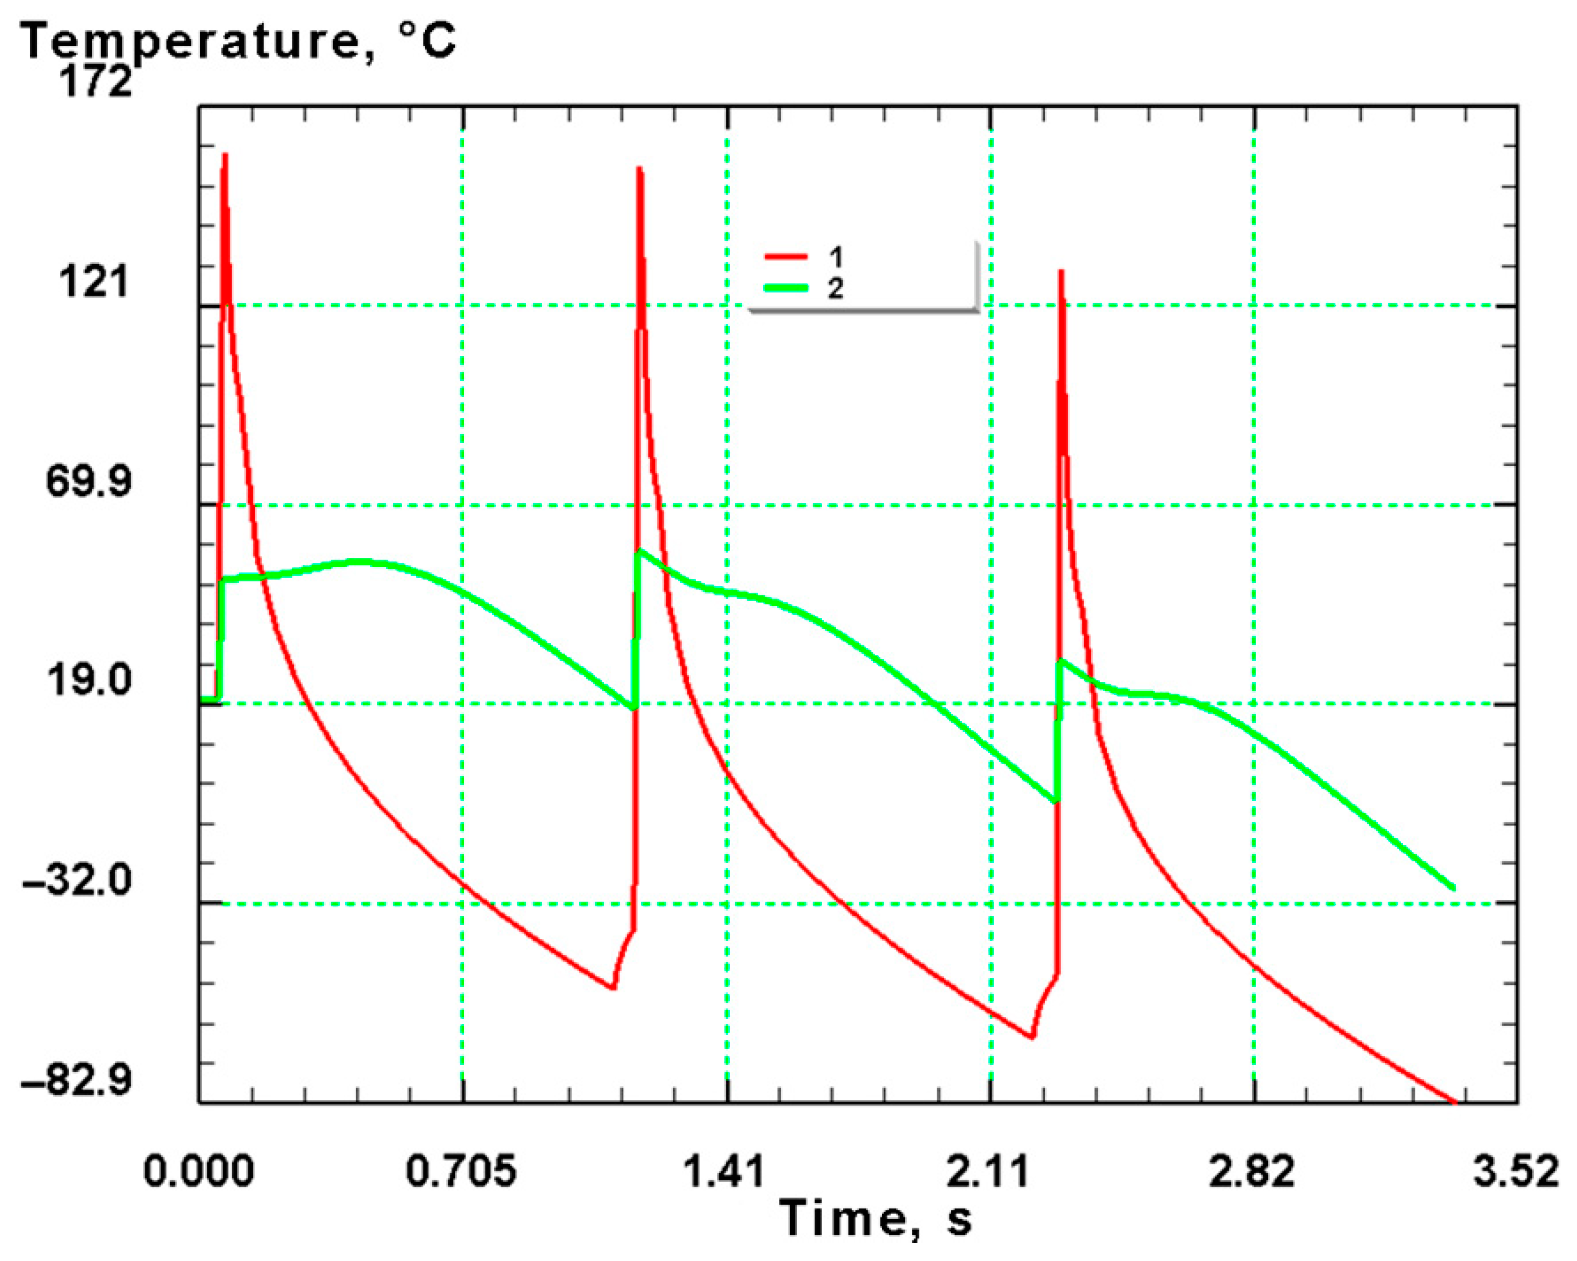
3.1.1. Effect of Temperature

At the first stage of the simulation, the temperature change along the workpiece section was studied, since this technological parameter is key for starting phase transformations. In each model, the temperature fields were studied six times, after each drawing stage and each cooling stage in liquid nitrogen. Figure 2 shows the temperature distribution patterns in the drawing model from 6 mm to 5 mm at 500 mm/s with the workpiece heated to 20 °C after each cooling in nitrogen (the first photo is shown after the drawing stage, and the second photo after cooling in nitrogen).
The analysis of the temperature distribution using the color scale values will have a significant error, because this scale is created based on the values of local extremes at this calculation step for all workpiece squares. Therefore, the minimum value will always be fixed in the outer section corner, and the maximum temperature value will be on the axis of symmetry closer to the middle of the workpiece length. The greatest interest in these models is the temperature change in the transverse direction from the center to the surface (radial direction). To track the required temperature values on the surface and in the center of the workpiece, the corresponding points 1 and 2 were pre-set (Figure 3).
Figure 4 shows graphs of the temperature distribution in the radial section for the specified points.
These graphs give a complete picture of the temperature distribution in the section of the workpiece, so it was decided to use this approach for all other models. It can be seen from Figure 4 that the graphs contain vertical sections characterizing intermediate heating. In the presence of intermediate heating, the surface layer cools down to about −80 °C each time, whereas, when heated after drawing, the temperature rises smoothly from 130 °C to 150 °C, which is associated with a decrease in the thickness of the workpiece after each stage of drawing. The axial zone, in comparison with the surface, has a lower temperature difference; here, heating is in the range from 45 °C to 55 °C, while the cooling range is in the range from −30 °C to −40 °C. For ease of comparison, the drawing model from 6 mm to 5 mm will be considered as the basic model, to which all other models will be compared.
An increase in the deformation rate to 1000 mm/s leads to an increase in the heating of the metal from deformation (Figure 5) and a simultaneous decrease in the cooling level due to a decrease in the residence time in liquid nitrogen. As a result, the surface layer has an increased heating level from 145 °C to 180 °C, while the cooling level decreases from −80 °C to −35 °C. The axial zone has a lower temperature drop compared to the base model. Here, an increase in the deformation rate leads to heating in the range from 50 °C to 55 °C, whereas the cooling range does not even overcome the zero mark and is in the range of 20–25 °C. In general, the nature of the graphs of both considered models is the same; each peak of heating and cooling is approximately within the same limits due to the fact that after each cooling stage, the workpiece has an initial temperature.
The exclusion of the intermediate heating stage gives a different picture of temperature fields (Figure 6). In the presence of heating, the lower temperature levels of the surface and center are approximately at the same level in all three passes; in the absence of heating, the lower temperature levels decrease with each pass. The surface of the workpiece receives the maximum cooling effect, since it is in direct contact with liquid nitrogen. Here, the temperature drops from −75 °C after the first pass to −128 °C after the third pass. This effect is the reason that during the drawing stages, the deformation heating is significantly reduced to 77 °C, versus 130 °C in the basic model. The axial zone of the workpiece also receives increased cooling; however, the temperature values here are higher than on the surface. After the first pass, the temperature value is −36 °C, which decreases to −105 °C after the third pass. The deformation heating during drawing in this area is small compared to the workpiece surface, where at each pass during drawing the temperature increases by 25–30 °C.
An increase in the deformation rate to 1000 mm/s in the absence of intermediate heating leads to a sharp decrease in the temperature difference, bringing the graphs in both zones to a more horizontal appearance, which indicates an increase in the level of heating from deformation (Figure 7). The surface zone is heated at all stages of drawing to approximately the same temperature level of 145 °C, while cooling the workpiece leads to a gradual decrease in temperature from the initial −35 °C to −54 °C. The same smooth temperature change is observed in the axial zone. From the initial temperature, the workpiece is heated to 50 °C, then the heating is reduced to 30 °C. When the workpiece is cooled, the temperature level drops in the axial zone to −10 °C.
An increase in the initial thickness of the workpiece to 9 mm leads to the fact that in the radial direction, at constant drawing speeds and cooling duration, the workpiece cools less intensively, which, in turn, affects an increase in the temperature of the workpiece during deformation. Thus, in the drawing model of this workpiece at 500 mm/s with the workpiece heated to 20 °C (Figure 8), the cooling intensity of the surface layer decreases from −80 °C to −55 °C compared to the base model, whereas when heated after drawing, the temperature rises from 150 °C to 190 °C, which is due to an increase in the cross-sectional area of the workpiece and a decrease in the level of heat transfer in the radial direction. The axial zone, like the basic model, has a lower temperature difference compared to the surface. Here, the heating is in the range from 52 °C to 60 °C, while the cooling range is from 15 °C to 5 °C.
An increase in the drawing speed with an increased thickness of the workpiece (Figure 9) leads to the fact that cooling proceeds even less intensively, which also affects the increase in temperature during deformation. The cooling intensity of the surface layer decreases from −80 °C to −18 °C compared to the base model, whereas when heated after drawing, the temperature rises from 150 °C to 210 °C. The axial zone is heated to 70 °C, while the cooling range has specific horizontal and vertical sections. This suggests that even after cooling in nitrogen, the axial zone has a temperature above ambient temperature (approximately 45–50 °C). During the subsequent stage of intermediate heating, a kind of local cooling to ambient temperature occurs in the axial zone.
The exclusion of the intermediate heating stage with an increased thickness of the workpiece gives a picture of temperature fields similar to the drawing model from 6 mm to 5 mm under similar conditions (Figure 10). As in the case of a small-diameter workpiece, in this model, the temperature threshold at which heating is absent decreases with each pass. At the same time, it should be noted that the overall cooling intensity compared to a similar model (see Figure 6) is significantly lower, which leads to a decrease in the cooling boundary and an increase in the heating boundary. The surface area is intensively cooled from −53 °C to −83 °C (in a similar model with a thinner wire, the range was from −75 °C to −128 °C). The heating of the surface zone reaches 130 °C (77 °C in a similar model with a thinner wire). By analogy with the small-diameter billet model, identical changes are observed in the axial zone; however, due to the greater thickness of the wire, the central zone is cooled only to −30 °C, while the billet of a smaller diameter was cooled in this zone to −105 °C. The deformation heating during drawing in this area is small compared to the workpiece surface; at each pass during drawing, the temperature increases by 25–30 °C.
An increase in the deformation rate to 1000 mm/s with an increased thickness of the workpiece and the absence of intermediate heating leads to a result opposite to all previously considered models. An increase in the drawing speed, leading to increased deformation heating and a decrease in the duration of contact with the cooler previously led to a sharp decrease in the temperature drop’s magnitude, bringing the graphs in both zones to a more horizontal appearance. However, the use of a billet of increased thickness leads to the fact that, in the axial zone, the billet, which after cooling has a temperature above ambient temperature, continues to heat up during the subsequent drawing stage (Figure 11). This is due to the fact that in the presence of intermediate heating, this operation performs the role of cooling the axial zone. The surface area heats up to about 205 °C, while cooling the workpiece leads to a gradual decrease in temperature from the initial −15 °C. In the axial zone, only positive temperature values are observed, which increase from 20 °C to 65 °C.

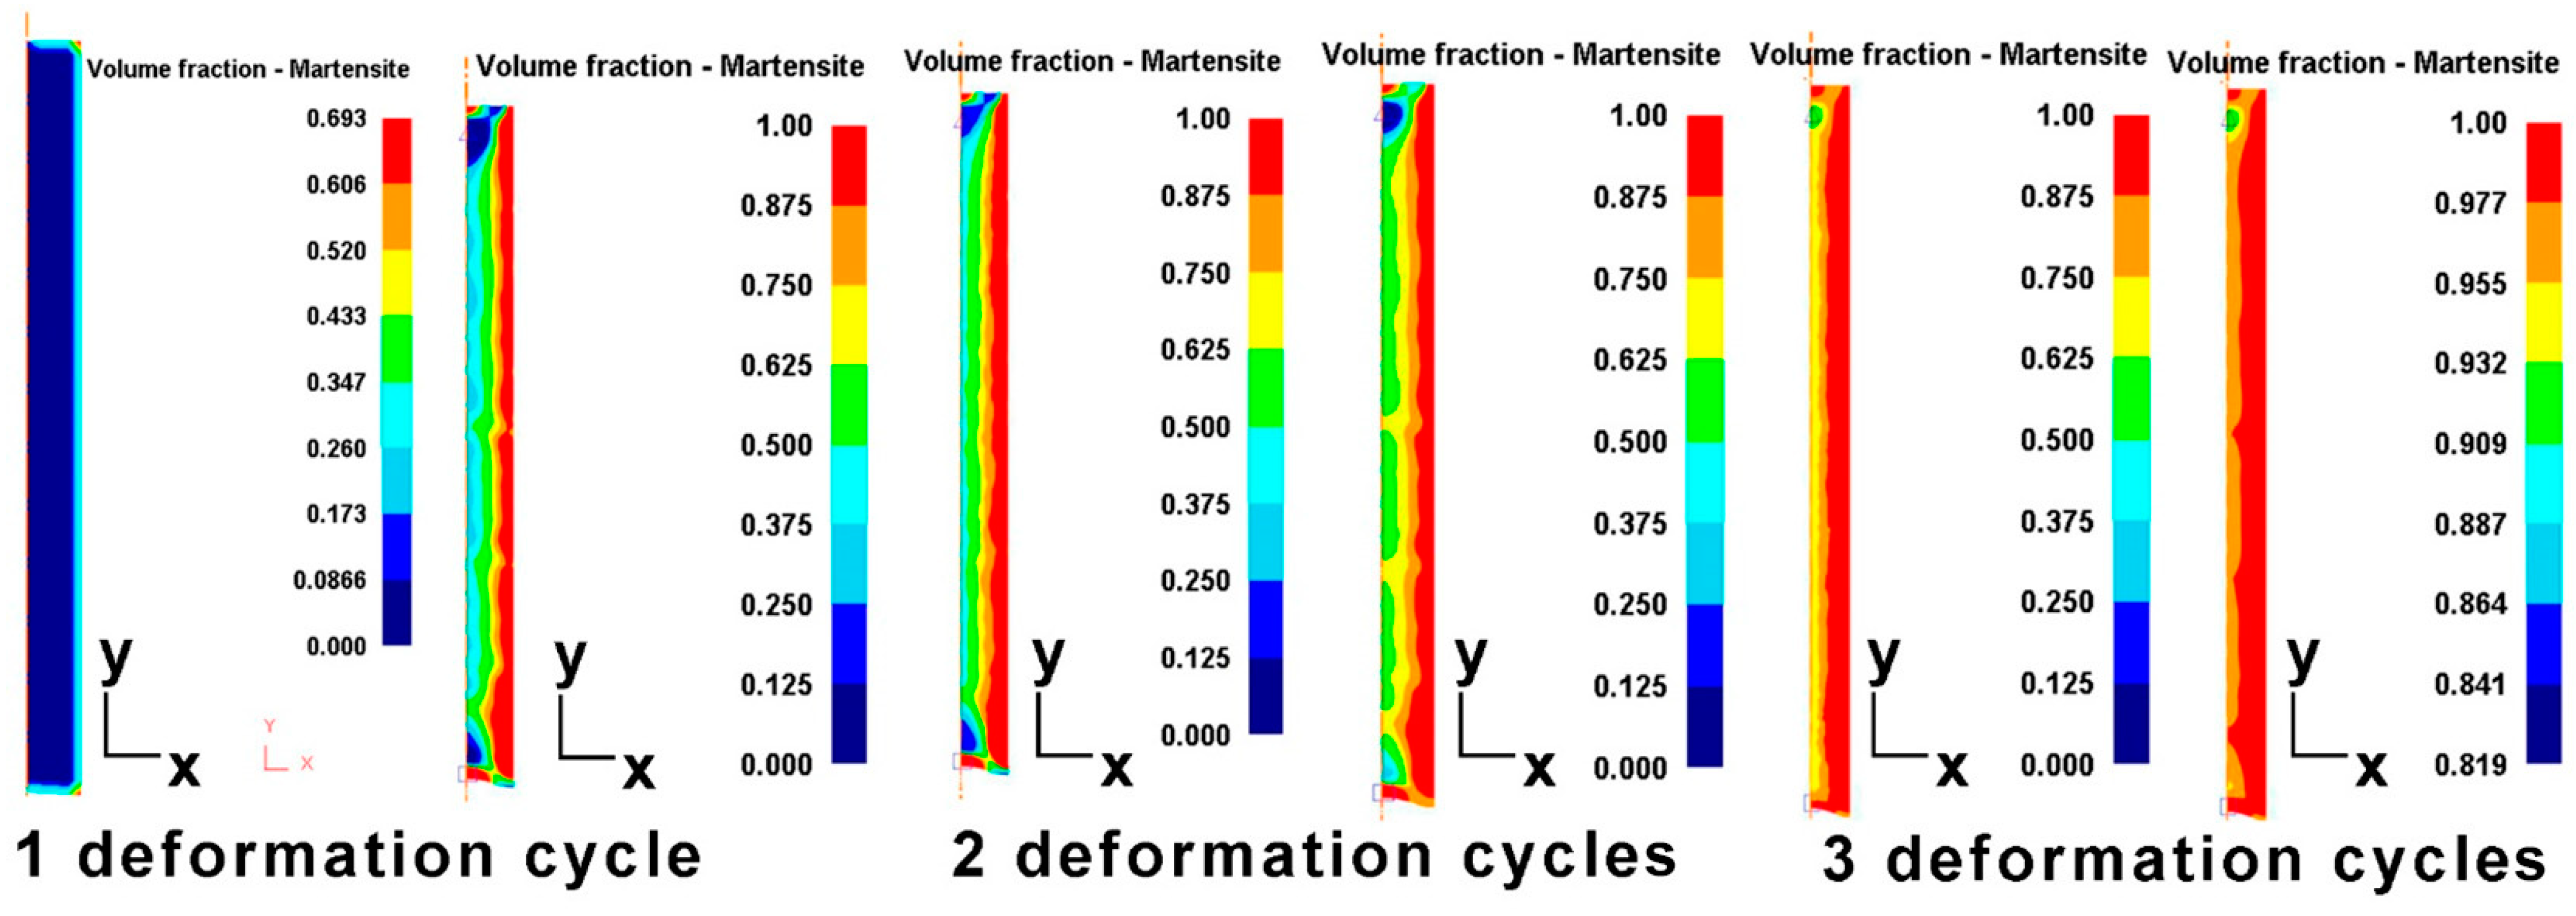
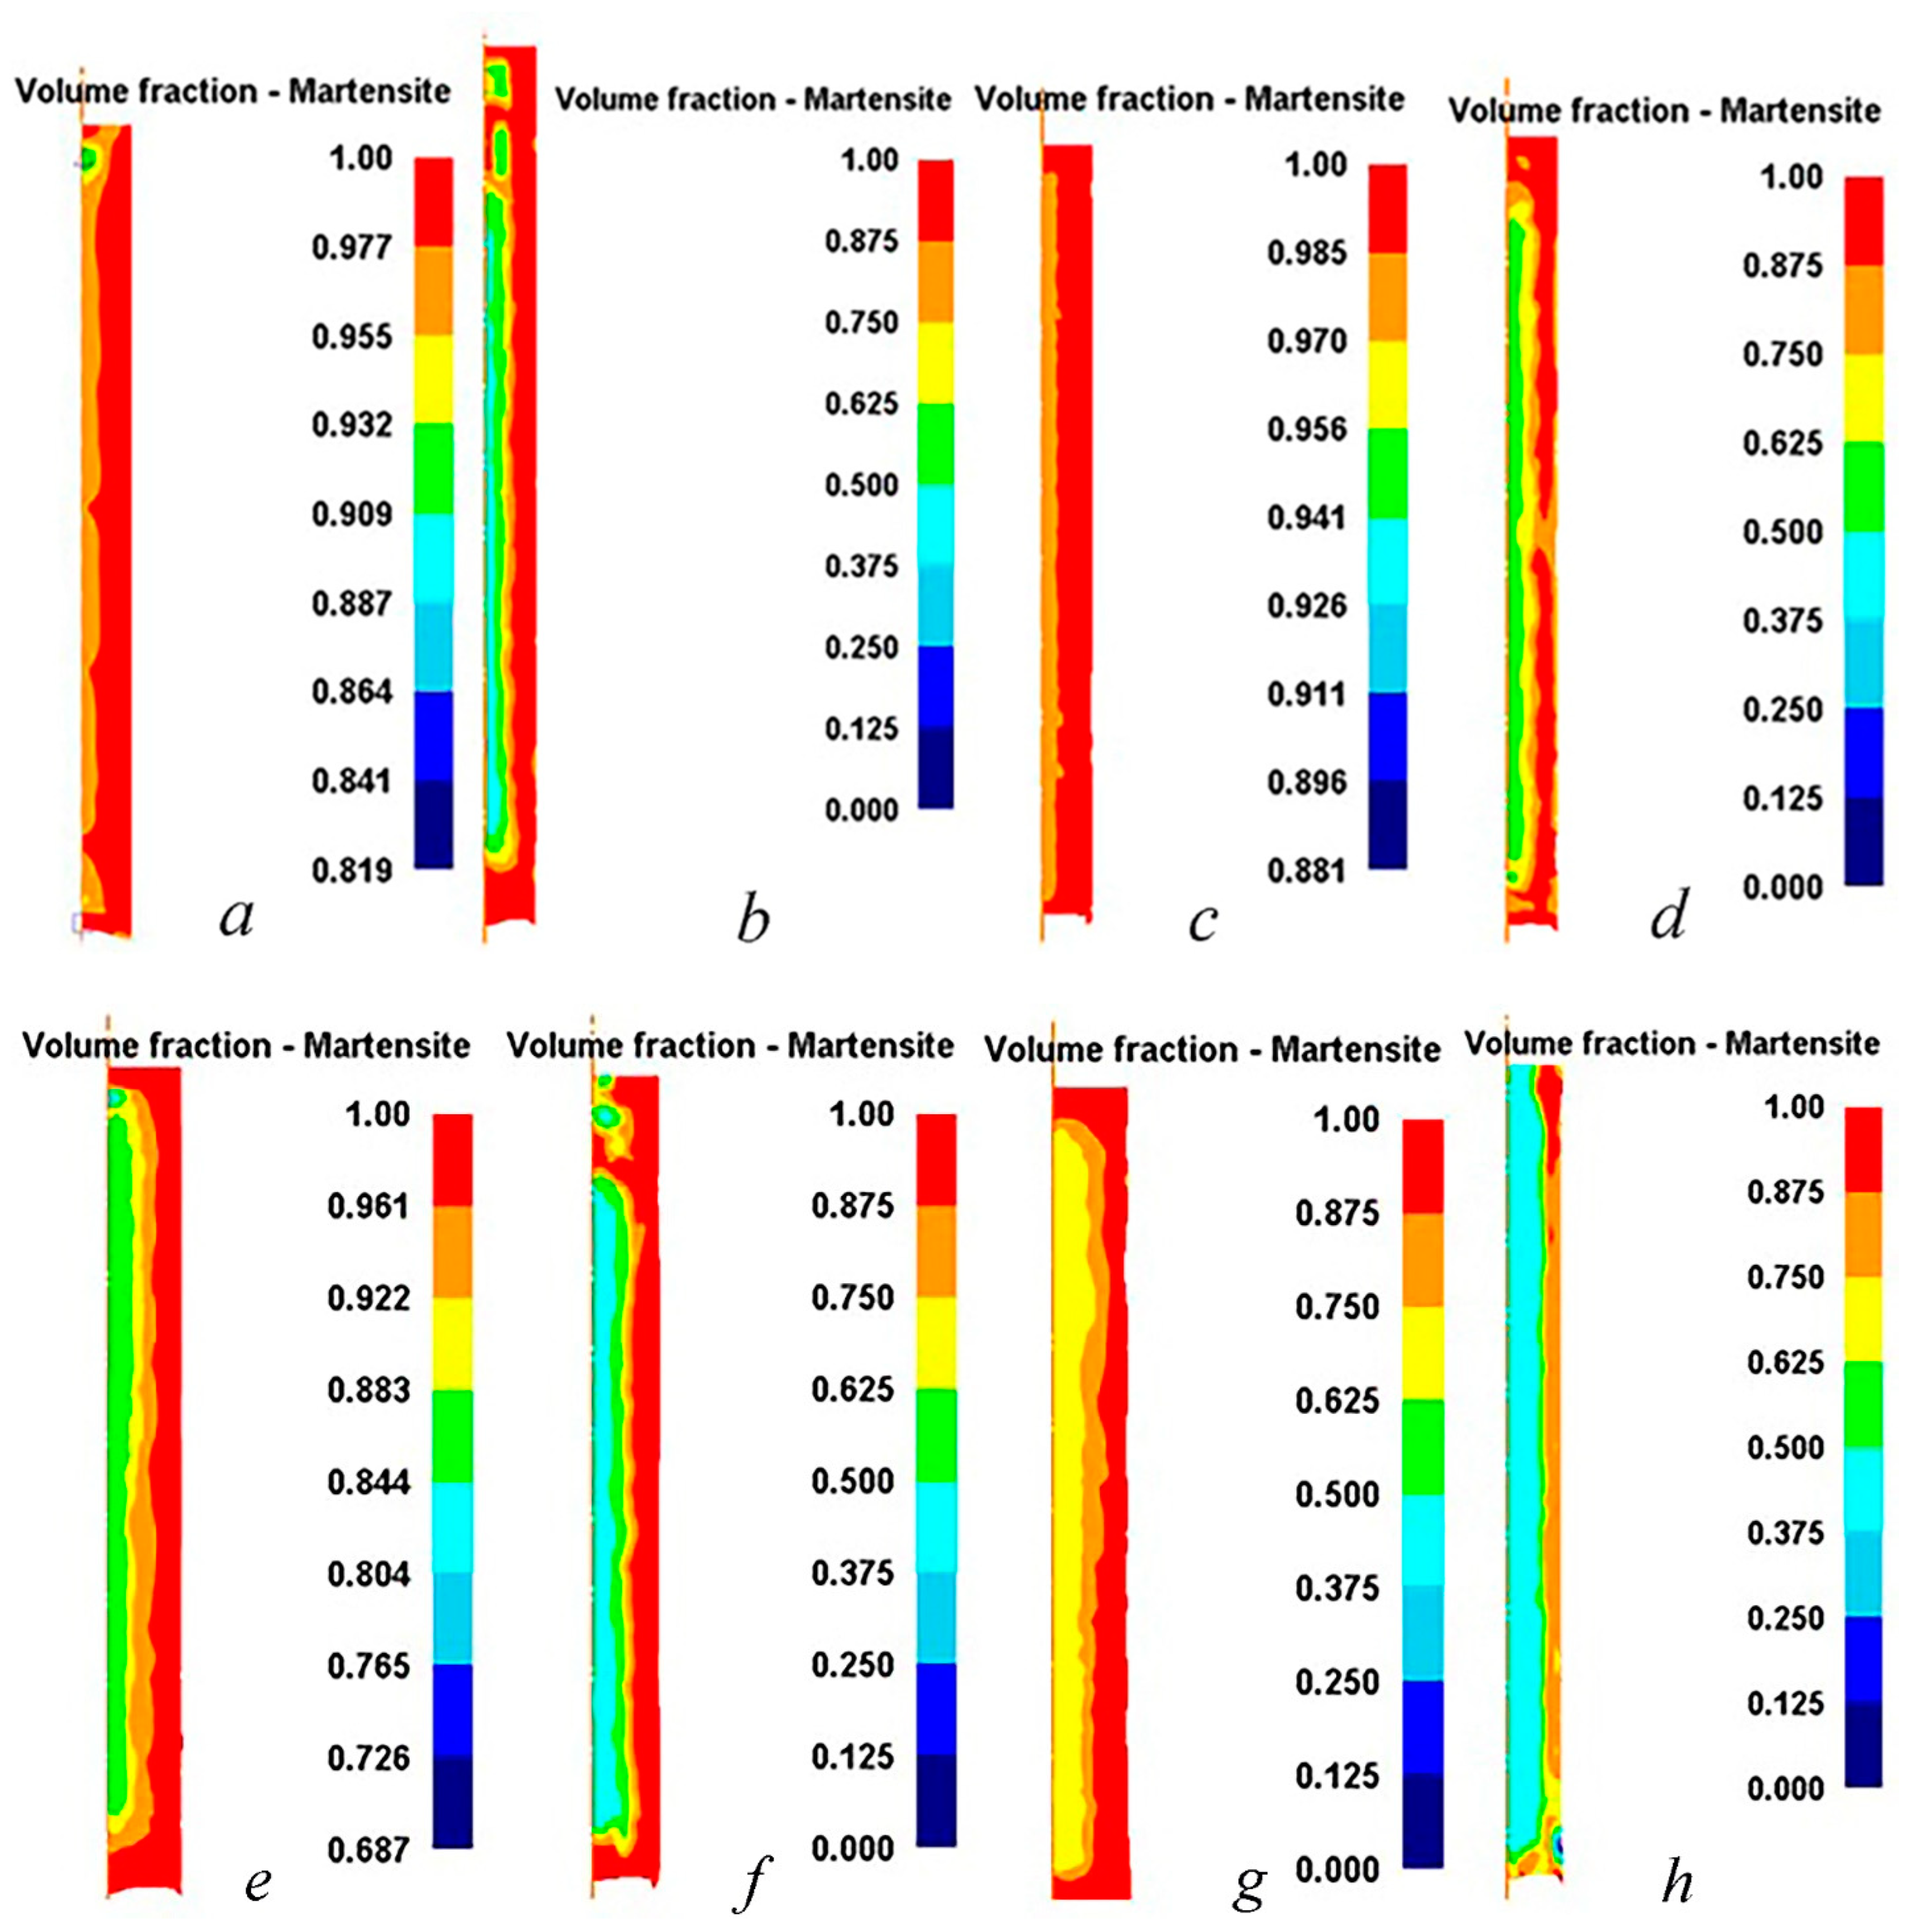
3.1.2. Martensite Distribution

The obtained patterns of distribution of the temperature fields allow the analysis of the proportion of martensite in the billet section formed after each pass. For the initial billet before deformation, the condition that the billet consists of 100% austenite was set. Figure 12 shows the distribution patterns of martensite in the section of the workpiece for the drawing model from 6 mm to 5 mm at 500 mm/s with the workpiece heated to 20 °C.
It is clearly seen that, unlike temperature fields, there is no characteristic uniformity along the workpiece length. Therefore, the previously used point estimation method is not suitable for this parameter. Since the main interest is the content and distribution of martensite after all stages of thermomechanical processing, it was decided to consider only the last stage of cooling in liquid nitrogen. In this case, it is convenient to evaluate the martensitic component on a scale that shows the minimum and maximum content of martensite in the section of the workpiece at this stage.
For comparative analysis, Figure 13 presents the results of modeling the phase transformations of all eight models in the order of their mention and the previously conducted considerations of the temperature fields.
An analysis of the martensite proportion in the obtained results showed that there is a direct dependence on the cooling level along the wire section. Therefore, for a workpiece with a small diameter of 6 mm, when deformed up to 5 mm, the optimal conditions are a low deformation velocity and the conduct of a process without heating (Figure 13, top row). In this case, the martensite percent is 90%. The inclusion of intermediate heating in these conditions reduces the formation of martensite by up to 82%. It should be noted here that these values of the martensite level are fixed in the axial zone, whereas on the surface, the level of martensite is 100%.
An increase in the drawing speed, as noted earlier, leads to a decrease in the cooling of the workpiece (especially in the axial zone). This leads to a sharp decrease in the formation of martensite in this area to 40–45% in the case of heated workpieces and up to 50–55% in the case of non-heated workpieces.
Using a billet of increased thickness gives similar results (Figure 13, bottom row), although with a lower level of martensite formation. The most effective option is a low deformation velocity and the conduct of a process without heating; in this case, the minimum level of martensite in the axial zone is 95%. The presence of intermediate heating reduces the formation of martensite by up to 68% in the central zone. It can be noted here that the level of martensite on the surface is still 100%, decreasing to 95% in the presence of intermediate heating. Increasing the drawing speed dramatically reduces the level of martensite formation in a billet of increased thickness. When the workpiece is heated to ambient temperature, the martensite level is approximately 48% in the axial zone and 90% in the surface zone. In the absence of intermediate heating to ambient temperature, the martensite level is approximately 38% in the axial zone and 80% in the surface zone. This result is a consequence of the resulting temperature field (see Figure 11), when the axial zone after cooling in liquid nitrogen has an above-ambient temperature. Since the wire has a circular cross-section, in all cases, the martensite is distributed symmetrically about the center of the workpiece.

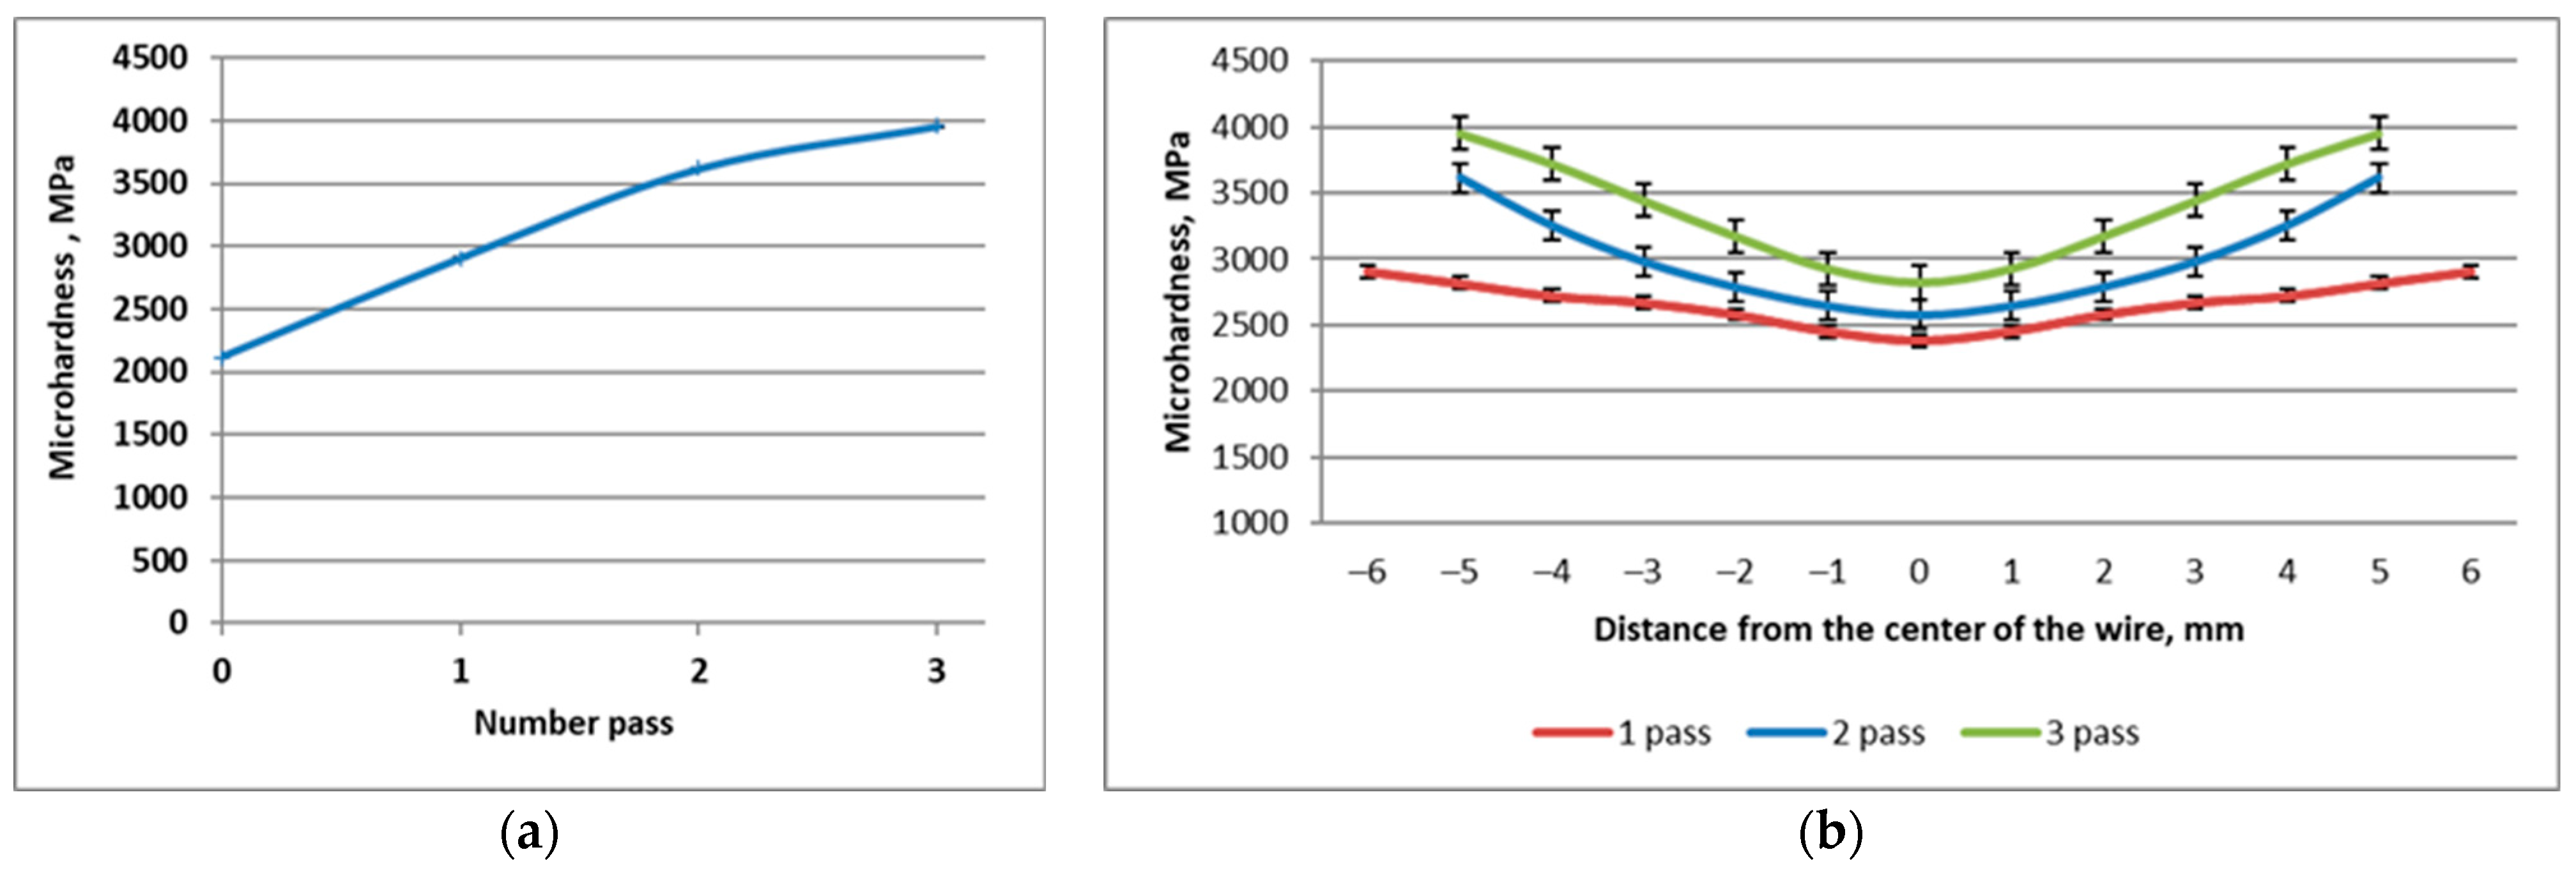
3.2. Results of the Laboratory Experiment

In a wire subjected to deformation at cryogenic temperature without heating, the observed microstructure consists mainly of α’-martensite (98% of indexed points). α’-martensite is present in banded structures. Using orientations obtained from residual austenitic domains, considered as the initial orientation of the parent phase, bands associated with martensite α’ are formed on dense deformation systems {111} (Figure 14a). The grain size achieved by martensite α’ is 0.5 μm.
In the wire subjected to deformation at cryogenic temperature with heating, different amounts of martensite are obtained in the central and surface zones. In the surface zone, the observed microstructure, as well as in the wire deformed without heating, consists mainly of α’-martensite (98% of indexed points) (Figure 14b). The microstructure in the center shows completely different results (Figure 14c). At this depth, austenitic grains contain strong color changes reflecting intragrain disorientation caused by plastic deformation. In the above orientation map, martensite α’ is shown by an orientation coloration along the Y-axis normal to the treated surface, and several austenitic domains that are still present are shown by contrasting stripes. The observed microstructure consists of α’-martensite (68% of indexed points) and residual austenite. The morphology of the original austenitic structure is indistinct, and there are many variants of α’-martensite, given the variety of colors present in the grains of the original austenite.
The distribution of α’-martensite was also estimated by the EBSD method (Figure 15). Given the very small size of ε-martensite, only γ-austenite and α’-martensite were selected for the survey. The numbers of phases were derived from these maps using a computer program. If a pixel had a blue color, it was considered martensite, red was austenite and if neither of these two colors was recognized, the point was considered unindexed. Before postprocessing the maps, only the unindexed pixels were deleted.
The martensite formation caused by deformation and the mechanisms of deformation hardening are facilitated by high deformation forces and low temperature of the wire [43]. When the wire is deformed without heating in the second and third passes, the wire temperature increases during drawing due to the greater amount of heat generated inside the sample as a result of deformation. Since the formation of martensite is suppressed with an increase in temperature caused by the self-heating process, cryogenic cooling of the wire immediately after leaving the portage resumes this process. When heating is used between deformation cycles, an even greater suppression of martensitic transformation occurs; therefore, the formation of martensite occurs most in the surface zone and reaches the central zone poorly.
Considering that severe deformation significantly degrades the quality of EBSD diffraction images, the composition of the phases was additionally characterized using X-ray diffraction. The vertical dotted lines represent the positions of the theoretical peaks for Kα chromium radiation. The values shown to the left of the diffractograms represent the background noise intensities measured in the center and on the surface of the wire for various processing conditions (Figure 16).
In the wire subjected to thermomechanical processing, martensitic peaks α’ are demonstrated in both deformation methods. As for the background intensity, when processed at cryogenic temperature, it was the same both in the center and on the surface of the wire, whereas, when processing with heating, the background intensity on the surface was several times higher than in the center, considering that the time of the X-ray radiation (a parameter that affects the background level) was the same for each survey. Since the martensitic transformation is facilitated at cryogenic temperature, the proportion of martensite in the wire treated without intermediate heating increases to 100%, both on the surface and in the center. And in the wire deformed with intermediate preheating, the proportion of martensite on the surface increases to 100% on the surface and 68% in the center. In this case, the distribution of martensite occurs symmetrically in the cross-section of the wire.
Thus, this important result indicates that martensitic phase transformation and the deformation hardening of austenite are two complementary hardening mechanisms. The martensitic transformation is responsible for the hardening efficiency observed in the surface layer of the wire subjected to cryogenic cooling. This phenomenon can be explained by the modification of the mechanisms of phase transformations under the influence of a decrease in the temperature of the process, as evidenced by the presence of martensite in the central part of the wire. The presence of ε-martensite in the central part can be explained by the fact that ε-martensite, considered as a transitional phase, is transformed into α’-martensite with an increase in the degree of deformation. Therefore, the latter is present in partially transformed areas where the deformation rate is not so high, while the intermediate heating between the deformation cycles limits the degree of depth to which the martensitic transformation takes place.
To confirm the symmetry of the microstructure distribution, tests were carried out to determine the microhardness of the wire cross-section. The initial microhardness of the wire was 2115 MPa over the entire wire section. After deformation by the method without intermediate heating from a diameter of 6 mm to a diameter of 5.0 mm in three passes, the microhardness was 3960 MPa. Graphs of the change in the microhardness of the wire after each deformation pass according to both methods are shown in Figure 17.
According to the above graph, it can be seen that the microhardness of the wire deformed with intermediate heating has a gradient spread. Over the surface area, the microhardness is the highest after each deformation cycle. Thus, the average value of microhardness in the surface zone after one pass is 2905 MPa, after two passes—3610 MPa, and after three passes—3950 MPa. The center of the wire has lower microhardness values. Such a microhardness spread confirms the symmetrical distribution of martensite over the wire section.
When drawing metastable austenitic steel under cryogenic cooling, the phase transformation of γ-austenite into α’- and ε-martensite occurs on the surface layer of the workpiece. Thus, the mechanisms of deformation hardening can be supplemented by the formation of martensite caused by deformation, which provides more effective surface hardening.
Also, this distribution of microhardness can be explained by a sharp decrease in the grain size on the surface. Obtaining such a grain size under cryogenic conditions became possible partly due to the suppression of dynamic recovery/recrystallization during the severe plastic deformation of the surface.
In contrast, the intermediate heating between the deformation cycles limits the degree of depth to which the transformation takes place, and therefore the microhardness achieved at depth.
In most works devoted to surface machining, the maximum proportion of martensite on the surface is mainly reported (on traditional hardening [44], on ultrasonic hardening [45] or on microhardening [46]).

4. Conclusions

During the investigation, a new combined process of wire-drawing and subsequent cryogenic cooling was proposed, and various theoretical and experimental studies were conducted.
  • The analysis of temperature fields and the martensitic component in all the models considered showed that for both thicknesses, the most effective option is a low deformation velocity and to conduct the process without heating. At the same time, an increase in the deformation rate sharply reduces the level of martensite formation in the axial zone. The least effective option is to use an increased thickness of the workpiece at an increased deformation velocity and to conduct the process without heating to room temperature, which, with an increase in the thickness of the workpiece, acts as a local cooling of the axial zone of the workpiece.
  • Thus, the decrease in hardening due to deformation hardening caused by cryogenic conditions is compensated by a decrease in the energy required to activate the martensitic transformation. As the temperature decreases, the force required to start the transformation decreases, and α’-martensite can form at a greater depth of the wire. Therefore, if there is no intermediate heating of the wire between deformation cycles, then 100% martensite is formed in the structure.
  • This study is of practical interest for the production and use of AISI-316 steel in various fields where high strength and hardness and preservation of ductility are required.

Author Contributions

Conceptualization, I.V. and A.V.; methodology, I.V. and E.P.; investigation, I.V. and A.V.; data curation, B.M.; writing—original draft preparation, I.V., E.P. and A.V.; writing—review and editing, I.V., A.V. and B.M.; supervision, I.V., E.P. and A.V.; project administration, B.M.; funding acquisition, B.M. All authors have read and agreed to the published version of the manuscript.

Funding

This research was funded by the Science Committee of the Ministry of Science and Higher Education of the Republic of Kazakhstan (Grant No. AP19576369).

Informed Consent Statement

Not applicable.

Data Availability Statement

Data are contained within the article.

Conflicts of Interest

The authors declare no conflicts of interest.

References

  1. Kumar, G.; Veerababu, R.; Pande, S.D.; Singh, V.; Vigneshwaran, S.; Sivaprasad, K.; Dhanasekaran, S.; Narayanasamy, R. Role of deformation induced martensite on mechanical properties of cryorolled 304 stainless steel. Mater. Res. Express 2019, 6, 086539. [Google Scholar] [CrossRef]
  2. Li, J.S.; Cao, Y.; Gao, B.; Li, Y.S.; Zhu, Y.T. Superior strength and ductility of 316L stainless steel with heterogeneous lamella structure. J. Mater. Sci. 2018, 53, 10442–10456. [Google Scholar] [CrossRef]
  3. Li, J.S.; Gao, B.; Huang, Z.W.; Zhou, H.; Mao, Q.Z.; Li, Y.S. Design for strength-ductility synergy of 316L stainless steel with heterogeneous lamella structure through medium cold rolling and annealing. Vacuum 2018, 157, 128–135. [Google Scholar] [CrossRef]
  4. Li, J.; Mao, Q.; Nie, J.; Huang, Z.; Wang, S.; Li, Y. Impact property of high-strength 316L stainless steel with heterostructures. Mater. Sci. Eng. A 2019, 754, 457–460. [Google Scholar] [CrossRef]
  5. Sitko, M.; Skoczeń, B. Effect of γ − α′ phase transformation on plastic adaptation to cyclic loads at cryogenic temperatures. Mater. Sci. 2012, 61, 7035–7059. [Google Scholar] [CrossRef]
  6. Amran, M.; Murali, G.; Fediuk, R.; Vatin, N.; Vasilev, Y.; Abdelgader, H. Palm Oil Fuel Ash-Based Eco-Efficient Concrete: A Critical Review of the Short-Term Properties. Materials 2021, 14, 332. [Google Scholar] [CrossRef]
  7. Klueh, R.L.; Hashimoto, N.; Maziasz, P.J. New nano-particle-strengthened ferritic/martensitic steels by conventional thermo-mechanical treatment. J. Nucl. Mater. 2007, 367, 48–53. [Google Scholar] [CrossRef]
  8. Odnobokova, M.; Belyakov, A.; Kaibyshev, R. Effect of severe cold or warm deformation on microstructure evolution and tensile behavior of a 316L stainless steel. Adv. Eng. Mater. 2015, 17, 1812–1820. [Google Scholar] [CrossRef]
  9. Sinitsin, D.A.; Elrefaei, A.E.M.M.; Glazachev, A.O.; Kayumova, E.I.; Nedoseko, I.V. Study of the characteristics of pavement elements made of reinforced soil with the use of secondary resources. Constr. Mater. Prod. 2023, 6, 1–12. [Google Scholar] [CrossRef]
  10. Volokitina, I. Evolution of the Microstructure and Mechanical Properties of Copper under ECAP with Intense Cooling. Met. Sci. Heat Treat. 2020, 62, 253–258. [Google Scholar] [CrossRef]
  11. Mumtaz, K.; Takahashi, S.; Echigoya, J.; Kamada, Y.; Zhang, L.F.; Kikuchi, H.; Sato, K.A. Magnetic Measurements of Martensitic Transformation in Austenitic Stainless Steel after Room Temperature Rolling. J. Mater. Sci. 2004, 39, 85–97. [Google Scholar] [CrossRef]
  12. Mitra, A.; Srivastava, P.K.; De, P.K.; Bhattacharya, D.K.; Jiles, D.C. Ferromagnetic prop-erties of deformation-induced martensite transformation in AISI 304 stainless steel. Met. Mater. Trans. A Phys. Met. Mater. Sci. 2004, 35, 599–605. [Google Scholar]
  13. Mumtaz, K.; Takahashi, S.; Echigoya, J. Temperature dependence of martensitic transformation in austenitic stainless steel. J. Mater. Sci. Lett. 2003, 22, 423–427. [Google Scholar] [CrossRef]
  14. Zhang, L.; Takahashi, S.; Kamada, Y.; Kikuchi, H.; Ara, K.; Sato, M.; Tsukada, T. Magnetic properties of SUS 304 austenitic stainless steel after tensile deformation at elevated temperatures. J. Mater. Sci. 2005, 40, 2709–2711. [Google Scholar] [CrossRef]
  15. O’Sullivan, D.; Cotterell, M.; Meszaros, I. The characterisation of work-hardened austenitic stainless steel by NDT micro-magnetic techniques. NDT E Int. 2004, 37, 265–269. [Google Scholar] [CrossRef]
  16. Wang, H.S.; Yang, J.R.; Bhadeshia, H. Characterisation of severely deformed austenitic stainless-steel wire. Mater. Sci. Technol. 2005, 21, 1323–1328. [Google Scholar] [CrossRef]
  17. Sort, J.; Concustell, A.; Menendez, E.; Surinach, S.; Baro, M.D.; Farran, J.; Nogues, J. Selective generation of local ferromagnetism in austenitic stainless steel using nanoindentation. Appl. Phys. Lett. 2006, 89, 032509. [Google Scholar] [CrossRef]
  18. Szymanska, A.; Oleszak, D.; Grabias, A.; Rosinski, M.; Sikorski, K.; Kazior, J.; Michalski, A.; Kurzydlowski, K.J. Phase transformations in ball milled AISI 316L stainless steel powders and the microstructure of the steel obtained by its sintering. Rev. Adv. Mater. Sic. 2004, 8, 143. [Google Scholar]
  19. Botshekan, M.; Degallaix, S.; Desplanques, Y.; Polak, J. Tensile and LCF properties ofAISI 316LN SS at 300 and 77 K. Fatigue Fract. Eng. Mater. Struct. 1998, 21, 651–660. [Google Scholar] [CrossRef]
  20. Tavares, S.S.M.; Gunderov, D.; Stolyarov, V.; Neto, J.M. Phase transformation induced by severe plastic deformation in the AISI 304L stainless steel. Mater. Sci. Eng. A 2003, 358, 32–36. [Google Scholar] [CrossRef]
  21. Abbasi, S.M.; Shokuhfar, A.; Ehsani, N.; Morakabati, M. Improvement of mechanical properties by optimization of cr and mo contents in xCr-yMo-9Ni-2Cu-1Ti-1V steel. J. Metall. 2008, 14, 55–65. [Google Scholar]
  22. Makkouk, R.; Bourgeois, N.; Serri, J.; Bolle, B.; Martiny, M.; Teaca, M.; Ferron, G. Experimental and theoretical analysis of the limits to ductility of type 304 stainless steel sheet. Eur. J. Mech. A 2008, 27, 181–194. [Google Scholar] [CrossRef]
  23. Andrade, M.S.; Gomes, O.A.; Vilela, J.M.C.; Serrano, A.T.L.; Moraes, J.M.D. Formability evaluation of two austenitic stainless steels. J. Braz. Soc. Mech. Sci. Eng. 2004, 26, 47–50. [Google Scholar] [CrossRef]
  24. Alvarez, S.M.; Bautista, A.; Velasco, F. Influence of strain-induced martensite in the anodic dissolution of austenitic stainless steels in acid medium. Corros. Sci. 2013, 69, 130–138. [Google Scholar] [CrossRef]
  25. Volokitina, I.; Volokitin, A.; Makhmutov, B. Formation of Symmetric Gradient Microstructure in Carbon Steel Bars. Symmetry 2024, 16, 997. [Google Scholar] [CrossRef]
  26. Skripalenko, M.M.; Romantsev, B.A.; Galkin, S.P.; Skripalenko, M.N.; Kaputkina, L.M.; Huy, T.B. Prediction of the Fracture of Metal in the Process of Screw Rolling in a Two-Roll Mill. Metallurgist 2018, 61, 925–933. [Google Scholar] [CrossRef]
  27. Snopiński, P. Electron Microscopy Study of Structural Defects Formed in Additively Manufactured AlSi10Mg Alloy Processed by Equal Channel Angular Pressing. Symmetry 2023, 15, 860. [Google Scholar] [CrossRef]
  28. Nurumgaliyev, A.; Zhuniskaliyev, T.; Shevko, V.; Yerekeyeva, G. Modeling and development of technology for smelting a complex alloy (ligature) Fe-Si-Mn-Al from manganese-containing briquettes and high-ash coals. Sci. Rep. 2024, 14, 7456. [Google Scholar] [CrossRef]
  29. Latypova, M.A.; Chigirinsky, V.V.; Kolesnikov, A.S. Effect of Controlled Rolling on the Structural and Phase Transformations. Prog. Phys. Met. 2023, 24, 132–156. [Google Scholar] [CrossRef]
  30. Mythili, R.; Kirana, R.; Herojit Singh, L.; Govindaraj, R.; Sinha, A.; Singh, M.; Saroja, S.; Vijayalakshmi, M.; Deb, S. Identification of Retained Austenite in 9Cr-1.4W-0.06Ta-0.12C Reduced Activation Ferritic Martensitic Steel. Symmetry 2022, 14, 196. [Google Scholar] [CrossRef]
  31. Sapargaliyeva, B.; Agabekova, A.; Syrlybekkyzy, S.; Ulyeva, G.; Yerzhanov, A.; Kozlov, P. Study of changes in microstructure and metal interface Cu/Al during bimetallic construction wire straining. Case Stud. Constr. Mater. 2023, 18, e02162. [Google Scholar] [CrossRef]
  32. Volokitina, I.E.; Volokitin, A.V.; Panin, E.; Fedorova, T.; Lawrinuk, D.; Kolesnikov, A.; Yerzhanov, A.; Gelmanova, Z.; Liseitsev, Y. Improvement of strength and performance properties of copper wire during severe plastic deformation and drawing process. Case Stud. Constr. Mater. 2023, 19, e02609. [Google Scholar] [CrossRef]
  33. Zhangabay, N.; Baidilla, I.; Tagybayev, A.; Anarbayev, Y.; Kozlov, P. Thermophysical indicators of elaborated sandwich cladding constructions with heat-reflective coverings and air gaps. Case Stud. Constr. Mater. 2023, 18, e02161. [Google Scholar] [CrossRef]
  34. Raab, G.I.; Gunderov, D.V.; Shafigullin, L.N.; Podrezov, Y.M.; Danylenko, M.I.; Tsenev, N.K.; Bakhtizin, R.N.; Aleshin, G.N.; Raab, A.G. Structural variations in low-carbon steel under severe plastic deformation by drawing, free torsion, and drawing with shear. Mater. Phys. Mech. 2015, 3, 242–252. [Google Scholar]
  35. Volokitina, I.E.; Volokitin, A.V. Changes in Microstructure and Mechanical Properties of Steel-Copper Wire During Deformation. Metallurgist 2023, 67, 232–239. [Google Scholar] [CrossRef]
  36. Sapargaliyeva, B.; Agabekova, A.; Liseitsev, Y.; Vavrenyuk, S. Increasing strength and performance properties of bimetallic rods during severe plastic deformation. Case Stud. Constr. Mater. 2023, 19, e02256. [Google Scholar] [CrossRef]
  37. Kolesnikov, A.S.; Kolesnikova, O.G. Effect of Deformation by High-Pressure Torsion in a Combined Matrix on the Properties of Brass. Metallurgist 2023, 66, 1601–1606. [Google Scholar] [CrossRef]
  38. Chigirinsky, V. Additional effect on the deformation zone during plastic metal flow. Eng. Solid Mech. 2024, 12, 113–126. [Google Scholar] [CrossRef]
  39. Bychkov, A.; Volokitin, A.; Kolesnikov, A. Natural Aging of Aluminum Alloy 2024 After Severe Plastic Deformation. Metallogr. Microstruct. Anal. 2023, 12, 564–566. [Google Scholar] [CrossRef]
  40. Volokitina, I.; Volokitin, A.; Denissova, A.; Kuatbay, Y.; Liseitsev, Y. Effect of thermomechanical processing of building stainless wire to increase its durability. Case Stud. Constr. Mater. 2023, 19, e02346. [Google Scholar] [CrossRef]
  41. Kazemi, S.S.; Homayounfard, M.; Ganjiani, M.; Soltani, N. Numerical and Experimental Analysis of Damage Evolution and Martensitic Transformation in AISI 304 Austenitic Stainless Steel at Cryogenic Temperature. Prog. Mater. Sci. 2019, 53, 893–979. [Google Scholar] [CrossRef]
  42. Kleber, X.; Barroso, S.P. Investigation of shot-peened austenitic stainless steel 304L by means of magnetic Barkhausen noise. Mater. Sci. Eng. A 2010, 527, 6046–6052. [Google Scholar] [CrossRef]
  43. Volokitin, A.; Volokitina, I.; Panin, E.; Naizabekov, A.; Aksenov, S.; Kuis, D. Finite element method (FEM) simulation of processing of AISI-316 austenitic stainless steel by high-pressure torsion (HPT) process at the cryogenic cooling. Metalurgija 2022, 61, 237–240. [Google Scholar]
  44. Cao, B.; Iwamoto, T.; Bhattacharjee, P.P. An experimental study on strain-induced martensitic transformation behavior in SUS304 austenitic stainless steel during higher strain rate deformation by continuous evaluation of relative magnetic permeability. Mater. Sci. Eng. A 2020, 774, 138927. [Google Scholar] [CrossRef]
  45. Chen, A.Y.; Ruan, H.H.; Wang, H.L.; Chan, Q.; Wang, Q.; Lu, J. The influence of strain rate on the microstructure transition of 304 stainless steel. Acta Mater. 2011, 59, 3697–3709. [Google Scholar] [CrossRef]
  46. Ye, C.; Telang, A.; Gill, S.; Suslov, S.; Idell, Y.; Zweiacker, K.; Wiezorek, J.; Zhou, Z.; Qian, D.; Vasudevan, K. Gradient nanostructure and residual stresses induced by Ultrasonic Nano-crystal Surface Modification in 304 austenitic stainless steel for high strength and high ductility. Mater. Sci. Eng. A 2014, 613, 274–288. [Google Scholar]
Figure 1. Installation scheme for the wire thermomechanical processing process: 1—wire, 2—drawing die, 3—holder, 4—nitrogen, 5—cryogenic cooling chamber.
Symmetry 16 01174 g001
Figure 2. Temperature distribution in the drawing model from 6 mm to 5 mm at 500 mm/s with the workpiece heating to 20 °C.
Symmetry 16 01174 g002
Figure 3. Points for temperature investigation.
Symmetry 16 01174 g003
Figure 4. Temperature distribution in the radial section of the drawing model from 6 mm to 5 mm at 500 mm/s with the workpiece heating to 20 °C.
Symmetry 16 01174 g004
Figure 5. Temperature distribution in the radial section of the drawing model from 6 mm to 5 mm at 1000 mm/s with the workpiece heating to 20 °C.
Symmetry 16 01174 g005
Figure 6. Temperature distribution in the radial section of the drawing model from 6 mm to 5 mm at 500 mm/s without workpiece heating.
Symmetry 16 01174 g006
Figure 7. Temperature distribution in the radial section of the drawing model from 6 mm to 5 mm at 1000 mm/s without workpiece heating.
Symmetry 16 01174 g007
Figure 8. Temperature distribution in the radial section of the drawing model from 9 mm to 7 mm at 500 mm/s with the workpiece heating to 20 °C.
Symmetry 16 01174 g008
Figure 9. Temperature distribution in the radial section of the drawing model from 9 mm to 7 mm at 1000 mm/s with the workpiece heating to 20 °C.
Symmetry 16 01174 g009
Figure 10. Temperature distribution in the radial section of the drawing model from 9 mm to 7 mm at 500 mm/s without workpiece heating.
Symmetry 16 01174 g010
Figure 11. Temperature distribution in the radial section of the drawing model from 9 mm to 7 mm at 1000 mm/s without workpiece heating.
Symmetry 16 01174 g011
Figure 12. Distribution of the martensitic component in the drawing model from 6 mm to 5 mm at 500 mm/s with the workpiece heating to 20 °C.
Symmetry 16 01174 g012
Figure 13. Summary distribution of the martensitic component after thermomechanical processing: (a) 6 mm to 5 mm at 500 mm/s with workpiece heating to 20 °C after each cooling in nitrogen; (b) 6 mm to 5 mm at 1000 mm/s with workpiece heating to 20 °C after each cooling in nitrogen; (c) 6 mm to 5 mm at 500 mm/s without workpiece heating; (d) 6 mm to 5 mm at 1000 mm/s without workpiece heating; (e) 9 mm to 7 mm at 500 mm/s with workpiece heating to 20 °C after each cooling in nitrogen; (f) 9 mm to 7 mm at 1000 mm/s with workpiece heating to 20 °C after each cooling in nitrogen; (g) 9 mm to 7 mm at 500 mm/s without workpiece heating; (h) 9 mm to 7 mm at 1000 mm/s without workpiece heating.
Symmetry 16 01174 g013
Figure 14. Microstructure orientation maps: (a) sample without heating, (b,c) sample heated to 20 °C after each cooling in nitrogen ((b) central zone, (c) surface zone).
Symmetry 16 01174 g014
Figure 15. Distribution of martensite and austenite in the cross section of the wire: (a) sample without heating, (b) sample heated to 20 °C after each cooling in nitrogen.
Symmetry 16 01174 g015
Figure 16. XRD curves and the calculated volume fractions of the martensitic component on the surface and in the center of the wire: (a) sample heated to 20 °C after each cooling in nitrogen, (b) sample without heating.
Symmetry 16 01174 g016
Figure 17. Graphs of microhardness distribution (a) after each pass for the method without heating; (b) along the wire cross-section for the method with heating.
Symmetry 16 01174 g017
Disclaimer/Publisher’s Note: The statements, opinions and data contained in all publications are solely those of the individual author(s) and contributor(s) and not of MDPI and/or the editor(s). MDPI and/or the editor(s) disclaim responsibility for any injury to people or property resulting from any ideas, methods, instructions or products referred to in the content.

