Abstract
In medical image analysis, precise retinal vessel segmentation is crucial for diagnosing and managing ocular diseases as the retinal vascular network reflects numerous health indicators. Despite decades of development, challenges such as intricate textures, vascular ruptures, and undetected areas persist, particularly in accurately segmenting small vessels and addressing low contrast in imaging. This study introduces a novel segmentation approach called MPCCN that combines position-aware cyclic convolution (PCC) with multi-scale resolution input to tackle these challenges. By integrating standard convolution with PCC, MPCCN effectively captures both global and local features. A multi-scale input module enhances feature extraction, while a weighted-shared residual and guided attention module minimizes background noise and emphasizes vascular structures. Our approach achieves sensitivity values of 98.87%, 99.17%, and 98.88%; specificity values of 98.93%, 97.25%, and 99.20%; accuracy scores of 97.38%, 97.85%, and 97.75%; and AUC values of 98.90%, 99.15%, and 99.05% on the DRIVE, STARE, and CHASE_DB1 datasets, respectively. In addition, it records F1 scores of 90.93%, 91.00%, and 90.55%. Experimental results demonstrate that our method outperforms existing techniques, especially in detecting small vessels.
1. Introduction
The retina, a crucial light-sensitive layer, plays a pivotal role in our ability to perceive both central and peripheral images. It is nourished and cleansed by an intricate network of retinal blood vessels that are essential for maintaining the health of our visual system. Alterations or damage to these vessels’ structure can herald a range of serious health issues, affecting not just the eyes, but also the cardiovascular system. Diseases such as diabetic retinopathy (DR), macular edema (ME), glaucoma, cataracts, tumors, and hypertension have been linked to such morphological changes [1,2,3]. By segmenting retinal images, medical professionals can identify and study these vascular changes, facilitating the early detection of lesions. This proactive approach is crucial for preventing blindness and mitigating a spectrum of vision-related conditions that stem from retinal abnormalities like DR. However, the endeavor to detect these changes is fraught with challenges. The images often suffer from noise, variations in contrast and lighting, and inconsistencies in the appearance, size, shape, and positioning of the blood vessels, complicating the detection process [4]. Initially, the examination of retinal fundus images for screening purposes is heavily dependent on the manual selection carried out by specialists. This approach, however, has proved to be exceedingly time consuming and laborious, requiring a high level of expertise and leaving much room for variability based on the individual’s experience. Such limitations have rendered it challenging to implement at a wide scale. Consequently, the development of automated methods for retinal vessel segmentation (RVS) have emerged as a compelling alternative. These automated techniques offer a significant advancement in enhancing the accuracy and efficiency of diagnoses, facilitating early identification and enabling prompt intervention for diseases related to the eye.
The global scientific community has developed a considerable number of RVS algorithms to date [5]. Hence, the above types of algorithms can generally be categorized into two main groups: unsupervised [6] and supervised [7]. These algorithms, which attempt to give an accurate segmentation of the retinal blood vessels, work without using annotations or additional guiding information, and they are solely based on the inherent characteristics of the vessels. The methods have mainly based on the inverse transformations of thresholding [8] and filtering [9] together with morphological operations. Accordingly, unsupervised algorithms can be further classified into three types: algorithms based on matched filtering [10], those dependent on the morphology of blood vessels, and those that completely rely on vessel tracking. However, in order to enhance the detection of the small vessels, an improved Frangi filter combined with a patch noise reduction method was proposed by Contejean et al. [11] to reduce the effect that occurs due to the bright and diseased areas of the retinal images on the segmentation of the blood vessels. The Frangi filter is prone to smoothing the whole image, which results in the ignoring of low contrast vessels. Graham et al. [12] tackled this issue from the point of view of tracking vessels by taking into account the small branches and junctions of vessels. They proposed the Bayesian theory and multi-scale inspection-based algorithm. This method, however, overly focuses on branch points and overlooks the positional information of the main vessels. Oliveira et al. [13] proposed fully convolutional networks (FCNs), using convolutional layers (CL) instead of fully connected layers, and they also used upsampling to restore the image size but the segmentation results were rough and less accurate. Zunair et al. [14] proposed Sharp U-Net, which improved upon FCNs with a symmetric encoder–decoder U-shaped network and used the skip connections between encoders and decoders at the same level to restore lost spatial information, thereby achieving precise segmentation outputs. Zhou et al. [15] used dense skip connections and introduced convolution in the skip pathways to reduce the feature discrepancy between the encoder and decoder. In instances where fundus images are subjected to uneven illumination, there is a noticeable decline in the precision of segmentation outcomes. Xinfeng et al. [16] used densely connected U-Net, allowing the network to utilize richer spatial context information. Oktay et al. [17] proposed attention U-Net, which introduced a gated attention mechanism to enhance the learning of segmentation target features and ignore unimportant features. However, due to the complex imaging of fundus images, noise interference, and the uneven distribution of small blood vessels, these segmentation methods struggle to accurately segment vascular boundaries, and they lack generalizability and their networks are prone to degradation.
On the other hand, the supervised algorithms were learnt from a huge array of manual annotation samples and, thus, enabled through the automatic extraction of retinal blood vessel information and segmentation. Jainish et al. [18] introduced a new adaptive histogram equalization and robust distance transformation-based preprocessing technique for retinal images to increase in their segmentation accuracy; however, this preprocessing technique showed a lesser processing ability in low-contrast vessels because of the differential preprocessing conducted in the various regions of an image. U-Net [19] is a fully symmetric algorithm in encoding and decoding, and it was designed to recover the lost vessel feature information during encoding through channel splicing and fusion; on the other hand, this method directly merges the results of the encoder with the decoder, where, of course, vascular information must suffer from loss. Ccs-unet, proposed by Zhu et al. [20], incorporates an attention gating mechanism in all skip connections to alleviate the influence of background pixels on segmentation results. However, it only changes the encoding–decoding fusion manner but does not touch the multi-scale nature of vessels, thereby making the model have a lower accuracy in the segmentation of small vessels. Prethija et al. [21] proposed EAMR-Net, in which the spatial attention and channel attention attend to one another in parallel right at the base of the U-Net for an accurate segmentation of the retinal blood vessels. However, this method does not consider the information loss in the encoding and decoding, and sometimes it may lead to an erroneously segmented small vessels. These strategies capitalize on the unique characteristics of fundus images and vascular patterns to identify segmentation targets, offering a speedier segmentation process and reducing the time required compared to the traditional manual screening approach. Nonetheless, these methods necessitate extensive domain-specific knowledge, intricate mathematical procedures, and the development of manual feature extraction techniques to establish the correlations between features and prognostic outcomes. This reliance significantly undermines their practicality and precision for clinical diagnostic purposes [22].
To address the challenges delineated, this study introduces the multi-scale position-aware cyclic convolutional network (MPCCN). This innovative framework marks the first integration of a multi-scale input module (MIM) within the encoder pathway, significantly expanding the receptive field while providing precise location metrics. Such enhancements bolster the network’s proficiency in vascular feature detection. Further, MPCCN employs a weighted-shared residual module (WRM), enriching the foundational feature dataset and mitigating the risk of detail loss and network degradation that are commonly associated with consecutive downsampling processes. Moreover, the incorporation of a guided attention module (GAM) within the skip connections adeptly curtails noise and extraneous feature representations, thereby refining the segmentation accuracy of retinal vessels. The principal contributions of this study are delineated as follows.
- We propose a novel multi-scale position-aware cyclic convolutional network (MPCCN) that incorporates a MIM within the encoder pathway. To the best of our knowledge, this is the first framework to integrate such a module, significantly expanding the receptive field while providing precise location metrics, which enhances the network’s ability to detect vascular features effectively.
- We introduce a weighted-shared residual module (WRM), which enriches the foundational feature dataset. This module mitigates the risk of detail loss and network degradation, a common challenge in consecutive downsampling processes. The WRM ensures the preservation of critical information, thereby maintaining high segmentation accuracy.
- We incorporate a guided attention module (GAM) within the skip connections; one that is specifically designed to curtail noise and extraneous feature representations. By refining the segmentation process, the GAM enhances the accuracy of retinal vessel detection, setting a new benchmark for performance in this domain.
2. Related Research
RVS has been widely applied in the auxiliary diagnosis of diseases. Doctors can diagnose diseases such as diabetic retinopathy, microaneurysms, and hypertension by examining the shape and branching of vessels in fundus images [23]. Therefore, RVS plays a significant role in the prevention and treatment of related diseases. However, manual annotation is inefficient and subject to the subjective judgment of doctors, thus failing to meet the demand of a large number of patients in a short time. Moreover, the growth of retinal vessels is often affected by pathological changes, resulting in disordered distribution and issues like optical imaging, which makes fine vessels difficult to segment completely. Hence, the automatic segmentation of retinal vessels has become a research hotspot in the field of medical imaging. Presently, scholars have introduced a wide array of algorithms for the segmentation of retinal vessels, the specifics of which are elucidated in the subsequent sections.
2.1. Convolution Operation
In CNN networks, convolution, also known as a filter, consists of a set of convolutional kernels with a fixed window size and learnable parameters; they are used for feature extraction and are the most core component of CNN networks. CNN’s CL extracts different features from the input, with the first layer capturing low-level features such as edges, lines, and corners, and higher layers extracting more advanced features [24]. Although traditional convolution operations can extract the local fine features of images well, they are limited by a small receptive field and cannot obtain richer contextual information, leading to poor performance in tasks like RVS. To overcome the disadvantage of a small receptive field in regular convolutions, Ople et al. [25] proposed dilated convolution, which introduces the concept of dilation on top of regular convolution, enabling the network to enlarge its receptive field under the same kernel size and dynamically control the spacing between kernels. Using dilated convolution can effectively increase the receptive field without changing the size of the feature map and without introducing additional parameters, which is particularly important in tasks such as image segmentation and classification. However, dilated convolution can cause the gridding effect, leading to discontinuous convolution computations, which is a serious problem for fine target segmentation tasks like RVS. Chen et al. [26] proposed deformable convolution, greatly improving the CNN’s ability to extract invariant features. Deformable convolution adds learned offsets to the grid sampling locations in standard convolution, making the sampling locations deformable and forming an adaptive changing capability [27]. However, the capability of deformable convolution to extract features of small targets is weak, and excessive use of deformable convolution might lead to overfitting [28], making it less suitable for RVS tasks. Xu et al. [29] proposed using an asymmetric CNN that can capture the coarse and fine maps of the vasculature as a 2D Gabor filter. They proposed a segmented network with dilated convolutions, skip connection modules, and stage-wise connections for segmenting the structures of varying thickness of the vessels. On the other hand, the repeated convolutions and pooling operations in CNN may result in the loss of fine details, affecting the performance of segmentation. To overcome such problems, a symmetrical multitask segmentation network, GDF-Net, was proposed, which uses two symmetric networks for separating the global features and details feature segmentation without losing the features of minor details. A fusion network was added to enhance the vascular segmentation precision [30]. Zhang et al. [31] combined the newly emerged Transformer model, attaining effective improvements over the existing models at the moment of segmentation while boosting the speed of the inference algorithm.
2.2. Retinal Vessel Segmentation
With the wide application and excellent performance of deep learning methods in the field of medical image segmentation, RVS models based on deep learning technology have gradually replaced traditional segmentation methods. U-Net networks and their variants have become mainstream in this field [32]. For a typical U-Net network, the features from shallow layers contain rich spatial details, while deep network layers contain rich abstract semantic details. The fusion of multi-scale information flow and feature blocks can significantly improve network performance. Desiani et al. [33] proposed LadderNet and CNN U-Net, which outperforms U-Net in RVS tasks by having multiple pairs of encoder–decoder branches and setting skip connections between each pair of adjacent decoder branches at every layer. Zhou et al. [34] proposed SEGAN, which combines adversarial generative networks, multi-scale feature refinement blocks, and attention mechanisms to capture minute retinal vessel morphology information, enhancing segmentation accuracy. Guo et al. [35] proposed CSGNet, utilizing multi-scale and multi-directional feature modules to learn semantically rich low-level features and retain high-level features with detail information, achieving better segmentation performance. Mo et al. [36] developed a multi-layer deep supervision full convolutional neural network (FCNN), which can work without preprocessing very specific vascular images and thus reduces the dependency on hand-labeled feature information. This approach not only reduces the impact of subjective factors on the experimental results, but also abates the vanishing gradient problem. However, up to now, the approach has not achieved the expected effect of segmenting small vessels. Moreover, deep learning algorithms based on encoder–decoder networks have been proven effective in medical segmentation tasks such as RVS [37]. However, directly applying a U-Net to vessel segmentation tasks has certain drawbacks: (1) The increasing depth of the network leads to feature accumulation limits in the encoder, making it difficult to extract more effective features. (2) The limited amount of available fundus image data can cause the U-Net to overfit during training. (3) The receptive field of single-scale convolution operations is fixed, making it difficult to capture vessel features with large scale variations, especially fine vessels. (4) Although the skip connections in U-Net’s decoding phase can integrate local information, they introduce excessive irrelevant background noise, making it challenging for the network to distinguish between actual vessels and the surrounding noise from lesions. To address these issues, researchers have proposed various U-Net-based improved algorithms. For instance, Schlemper et al. [38] proposed an attention gate structure based on U-Net, which can reduce the negative effects of noise in images. However, it performs poorly in segmenting fine vessels. Zhou et al. [39] introduced an improved network based on U-Net called UNet++, which embeds U-Nets at different depths and replaces long connections with dense short connections, using pruning strategies to speed up inference. While it has achieved better segmentation performance than U-Net, it still struggles with low-contrast images, and the nested U-Net structure leads to a large number of parameters. Inspired by DropBlock, Guo et al. [40] designed SD-UNet based on U-Net, which effectively alleviates the overfitting caused by the small dataset of fundus images, but the network’s segmentation accuracy and sensitivity are suboptimal.
In addition to U-Net-based improvements, encoder structures have also been constructed using backbone networks such as ResNet [41] and DenseNet [16], leading to many encoder–decoder-based segmentation networks. Gu et al. [42] proposed CE-Net, enhancing the encoder structure through dense atrous convolution blocks and residual multi-kernel pooling blocks. Yang et al. [43] proposed the CC-Net comprehensive context network for vessel segmentation based on an encoder–decoder network, addressing the spatial information loss caused by pooling operations and placing more focus on channel information, achieving decent segmentation performance but still falling short in segmenting fine vessels. Moreover, Soomro et al. [44] proposed an FCNN-based model that contained encoders and decoders to carry out precise RVS. On the other hand, strided CL outperforms standard pooling layers during the segmentation of tiny vessels by increasing the cost of model complexity. Addressing this, Jiang et al. [45] proposed an end-to-end FCNN framework for the segmentation of retinal vessel images that avoids the inherent defects of the multi-modular ones, reducing the complexity of the model and strengthening its generalization ability, albeit at a more expensive computation cost. On the other hand, He et al. [46] proposed a parallel FCNN architecture for retinal vessel image segmentation. The retinal vessel images are extracted through a parallel working of two FCNNs in real time, which reduces the computational execution cost. Based on this, Kar et al. [47] presented a supervised method for a variant FCNN that learns from a CL to preserve low-level edge information and then applies it in capturing tiny vessel information for storage size, thus minimizing hyperparameters at the same time and improving the robustness of the captured information. The other work by Ryu et al. [48] proposed a segmentation model with introduced residual modules in its architecture, and they presented it as a fully automatic model of retinal vessel image segmentation called Sine-Net, where the upsampling and downsampling operations extract the information with respect to thick and thin vessels but end up identifying non-vessel images incorrectly.
While the above RVS networks have improved the segmentation performance to some extent, they still have several limitations: (1) The excessive use of auxiliary outputs and dense or residual connections [16,38,39] to enhance network performance significantly increases the network’s complexity and computational burden, overlooking the lightweight nature and computational constraints in clinical applications. (2) Adding post-processing steps after network output [16,49] compromises the end-to-end nature of the network. (3) Using a fixed receptive field to extract vessel information [37,38,39,43] is not conducive to differentiating vessel segmentation.
3. Proposed Methodology
3.1. Network Structure
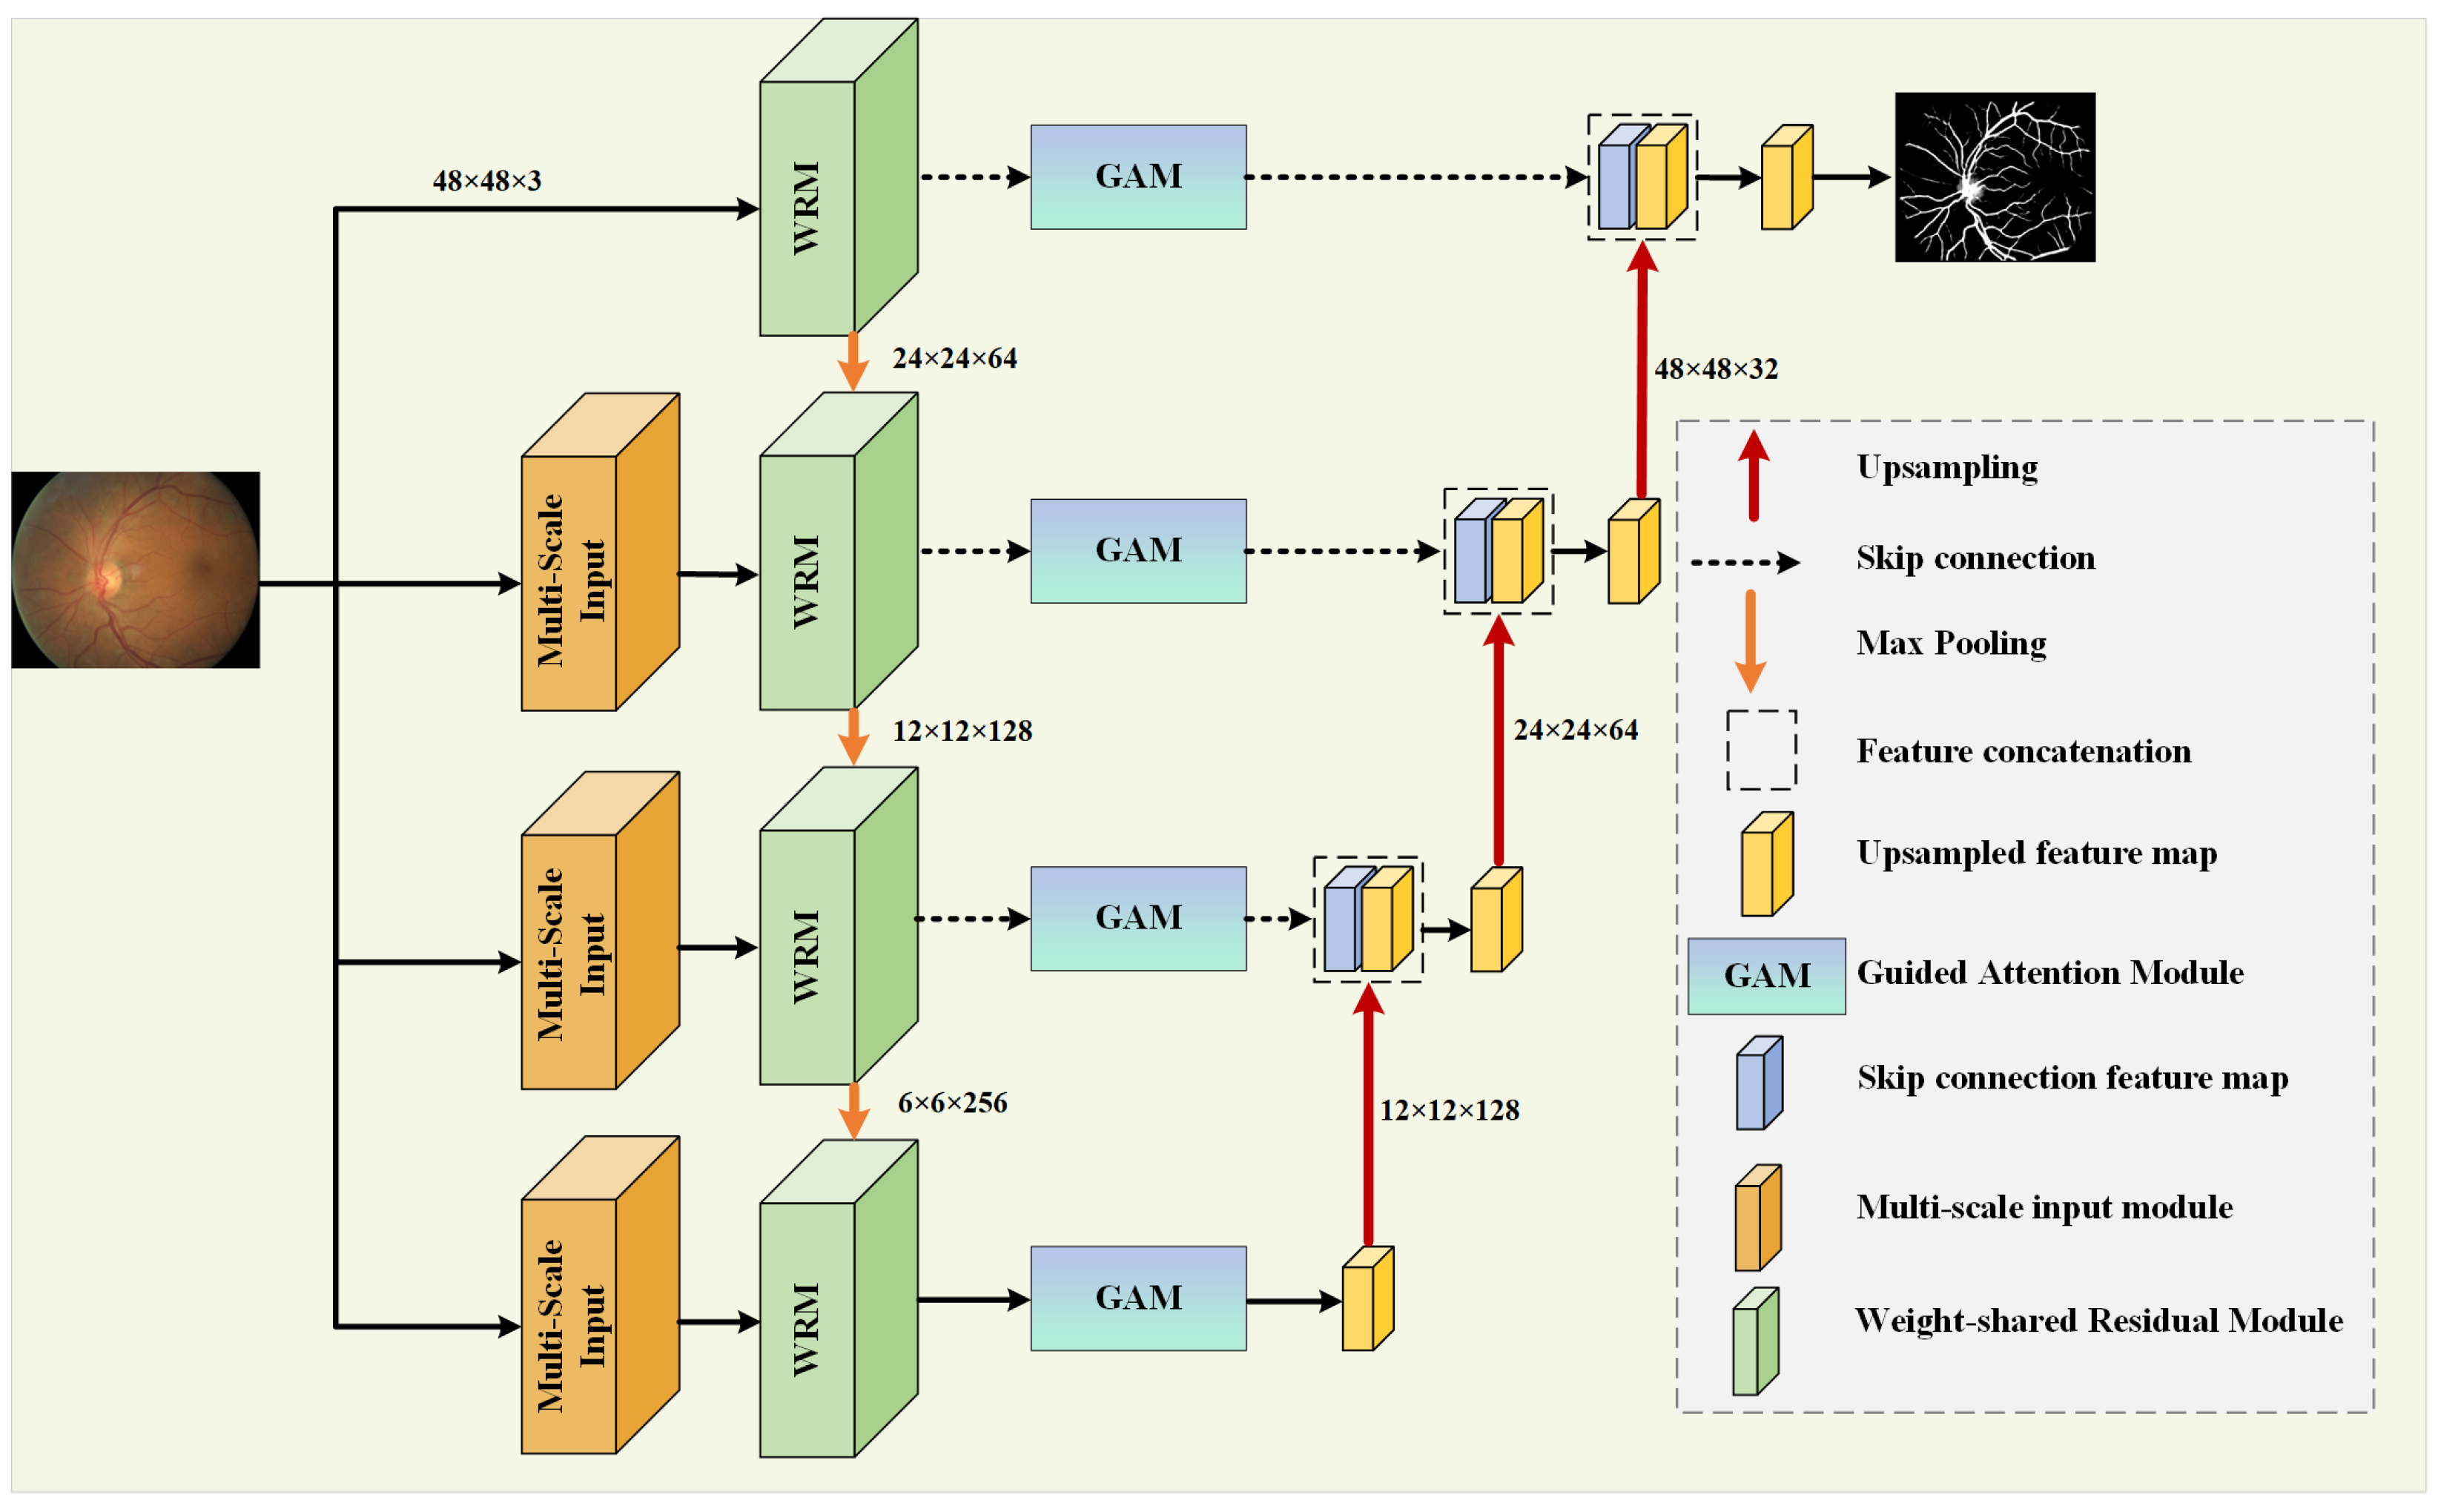
In retinal vessel images, the blood vessels at the fundus often present different shapes and sizes, with vessels around the fovea appearing thicker and becoming thinner as they branch, forming complex contours [50]. To improve the accuracy of segmentation and the utilization rate of features, this paper proposes MPCCN, with its network structure being shown in Figure 1.
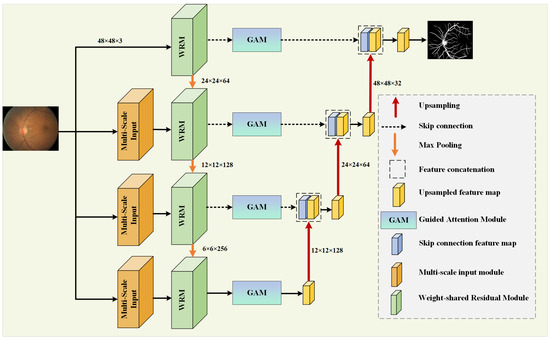
Figure 1.
Overall structure of the MPCCN.
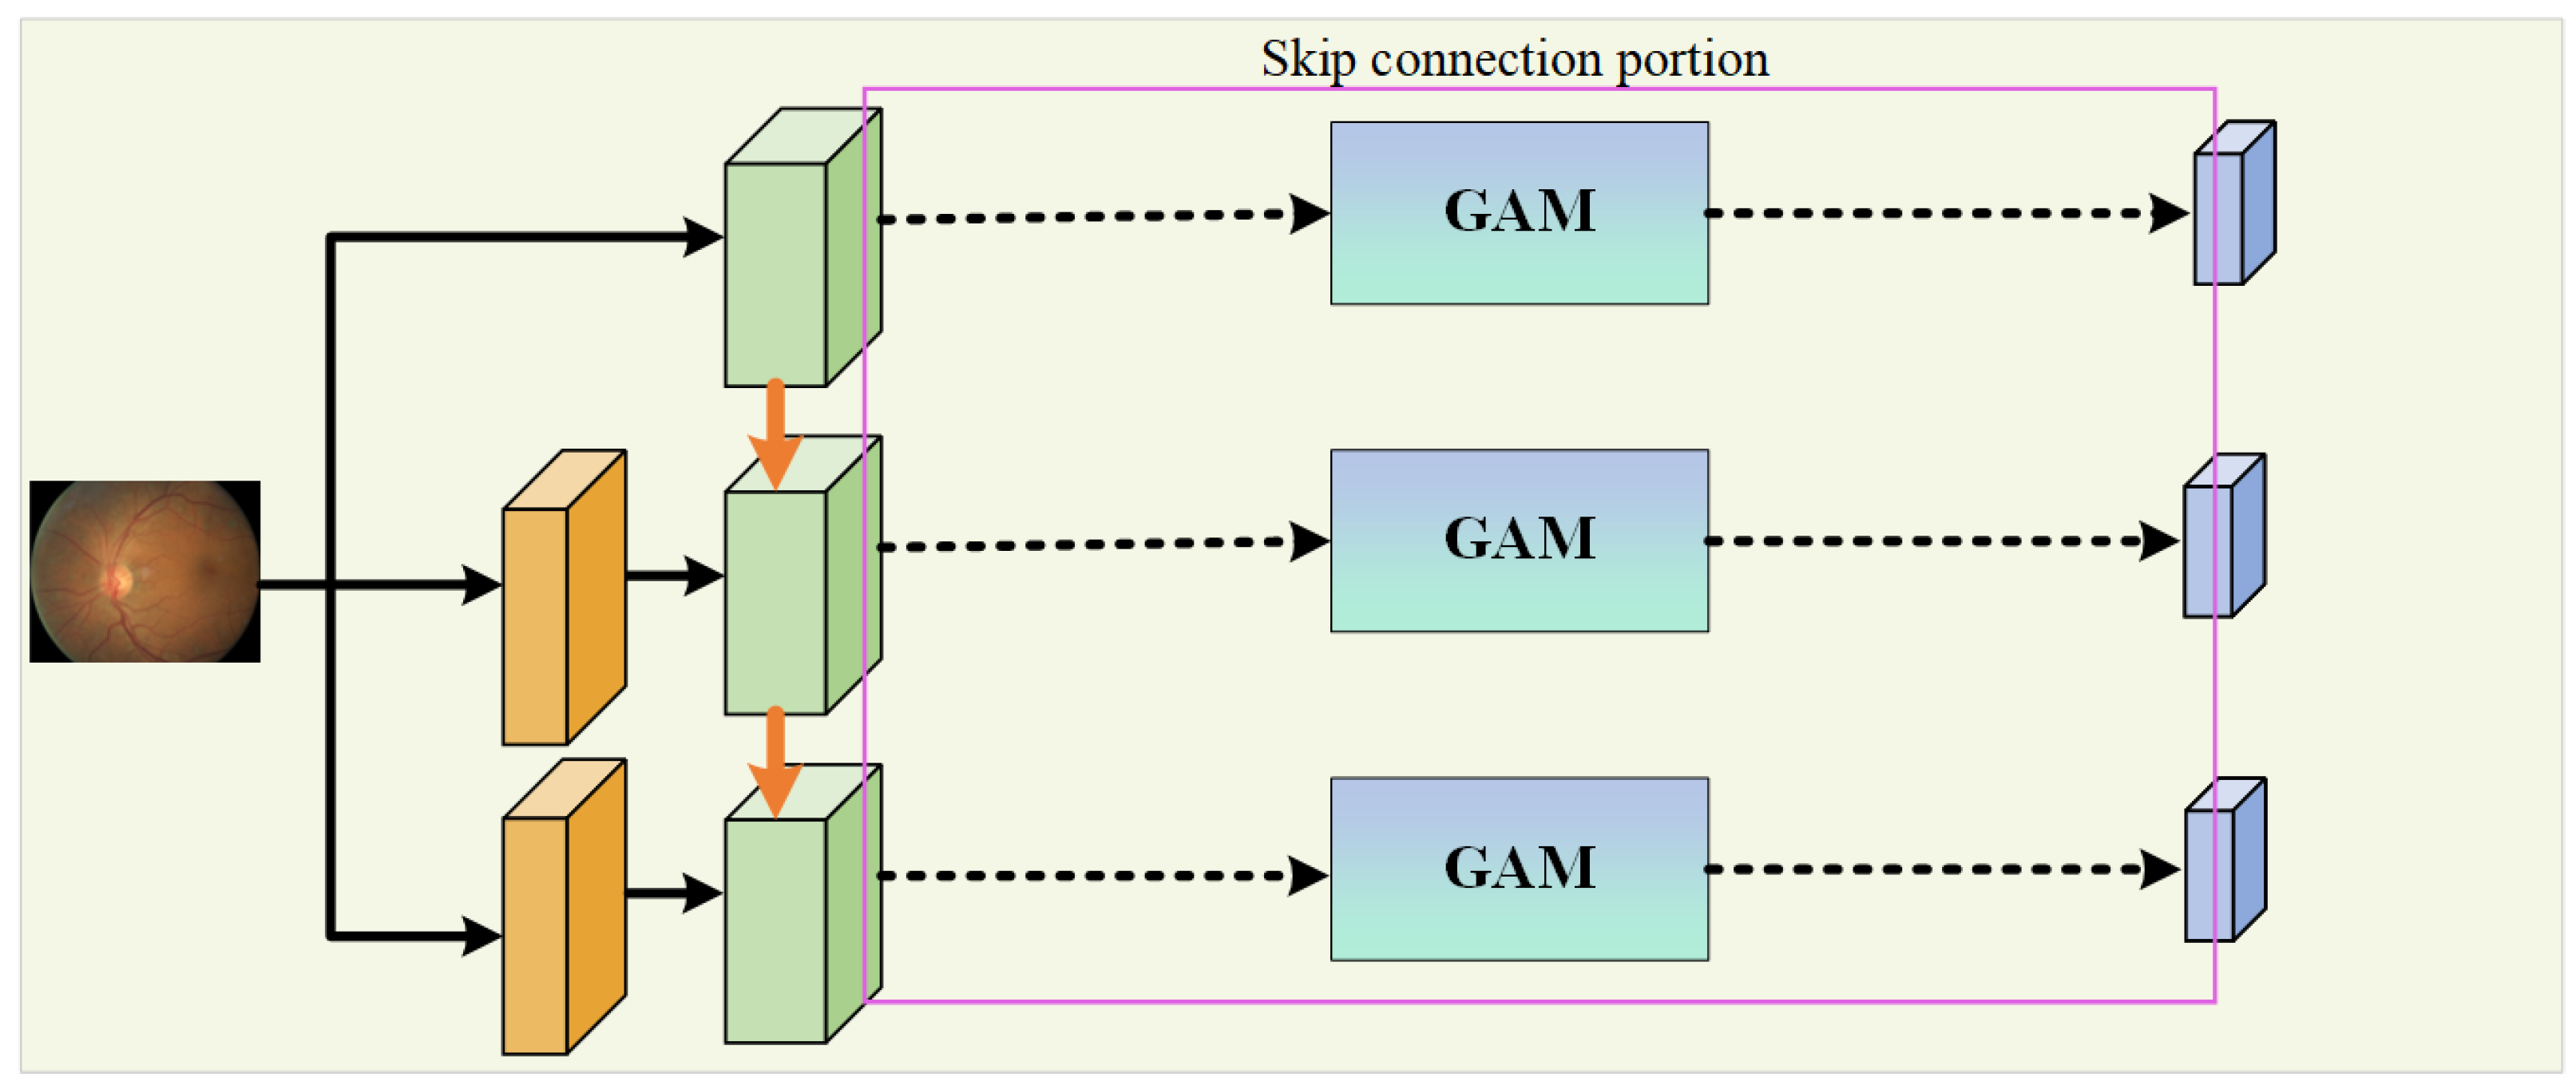
In the encoding path, the network introduces the WRM module on the basis of U-Net to further extract features. The module incorporates PCC to improve the utilization and extraction of global features. This is performed to encourage the fusion of shallow features and competition of deep features, as well as to reduce the impact of previous attention mechanisms’ compressive dimensionality reduction on learning inter-channel relationships. In addition, GAM is applied within the skip connections to suppress feature expressions that could interfere with the segmentation of vascular morphology and to enhance the learning of target features, as shown in Figure 2. At the same time, the network combines a MIM in the downsampling process to retrieve the detail information lost due to stacked downsampling operations. For a given original image size of , it passes through three MIMs, obtaining images of sizes , , and , respectively, and these images are added to the corresponding encoding level feature vectors to obtain the final feature map of the encoding path.
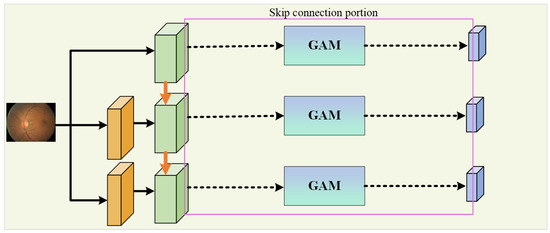
Figure 2.
The portion dedicated to a skip connection.
In the decoding path, the skip connections from U-Net are used to connect the encoders and decoders at the same level, allowing the network to learn the relationship between coarse- and fine-grained feature location information and global semantic information. The feature map after downsampling is subjected to three upsampling operations followed by a Conv Block to adjust the number of output channels to obtain the segmentation result map as there are two types of pixels to predict, and these correspond to the vascular foreground region and the black background area.
3.2. Encoding Path
The encoding path extracts features from the input image , where H and W are the height and width, and C is the number of channels. Each encoding layer applies a convolutional operation followed by a non-linear activation function:
where signifies the convolution operation, and ReLU is the activation function. After the convolution, max pooling is applied to reduce the spatial dimensions as follows:
Multi-Scale Input Module
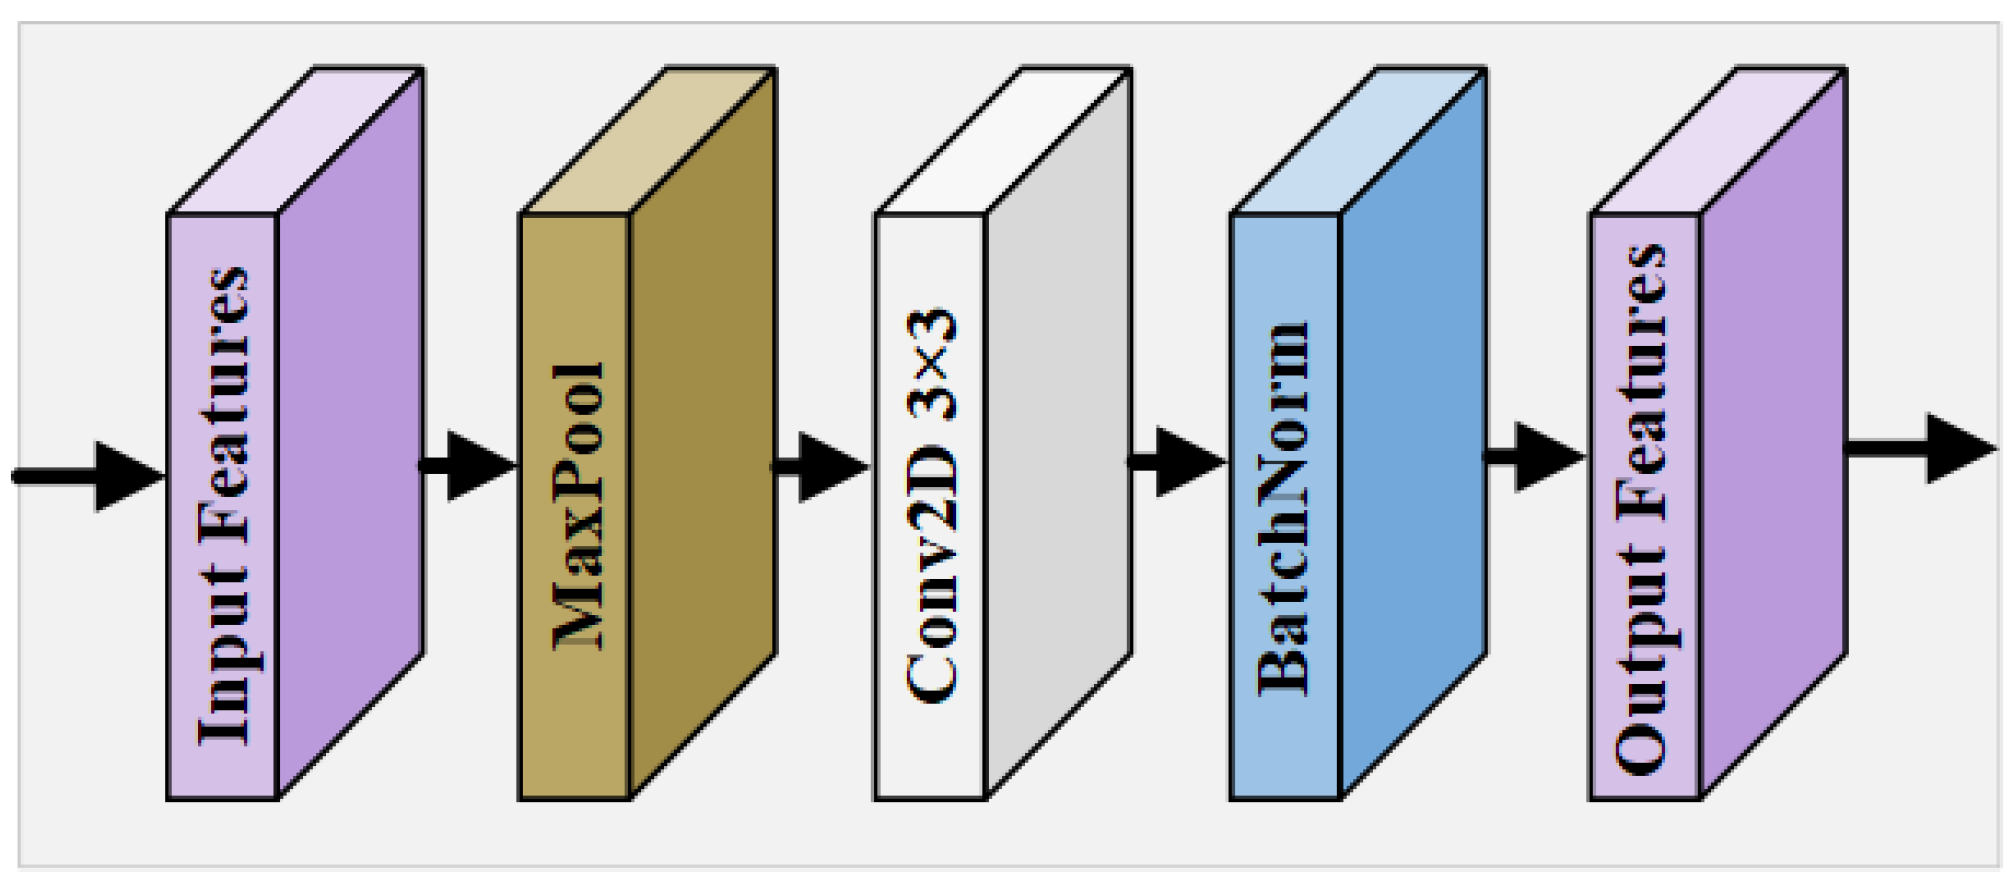
In the U-Net model and its various variants, multi-level downsampling operations are commonly employed to expand the receptive field, enabling the extraction of global and local features, as well as the positional information from the input image. These operations are critical for capturing the intricate details necessary for accurate segmentation tasks. However, the traditional downsampling approach often leads to a significant loss of crucial features, particularly regarding the morphological distribution and precise positional information of tiny retinal vessels. This loss of detail can severely diminish the effectiveness of the network’s feature extraction capability, resulting in suboptimal segmentation performance. To address this challenge, our proposed framework incorporates a novel MIM within the encoder pathway. This module is designed to preserve the integrity of fine vascular structures by processing multiple scales of the input feature map , allowing for a more comprehensive analysis of both large and small vessels. The MIM ensures that even the smallest vessels can retain their morphological and positional attributes, thereby enhancing the network’s overall performance in RVS. By maintaining a wider range of spatial context at each level of the encoding process, the MIM improves the network’s robustness to variations in the vessel size and orientation, offering a more detailed and accurate representation of the retinal vasculature. In the MIM, multiple scales of the input feature map are processed to retain the morphological details of the vessels:
where is a downsampling operation at scale k, followed by convolution , and batch bormalization (BN). This produces a refined feature map , which mitigates the loss of essential features due to downsampling and facilitates the extraction of richer, more informative feature maps that contribute to superior segmentation outcomes. The design of the MIM is shown in Figure 3. For the original feature map , according to the feature map size of different encoding levels, it goes through a pooling layer of a corresponding size; then, a convolution block refines the features after max pooling, and, finally, BN is performed using a BN layer to obtain the calibrated output.
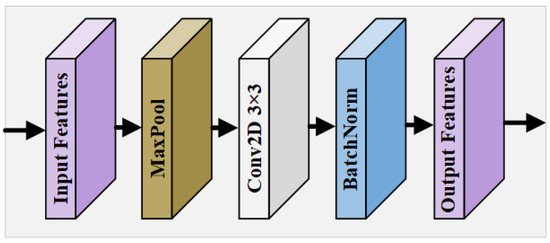
Figure 3.
Overall structure of MIM.
3.3. Weight-Shared Residual Module
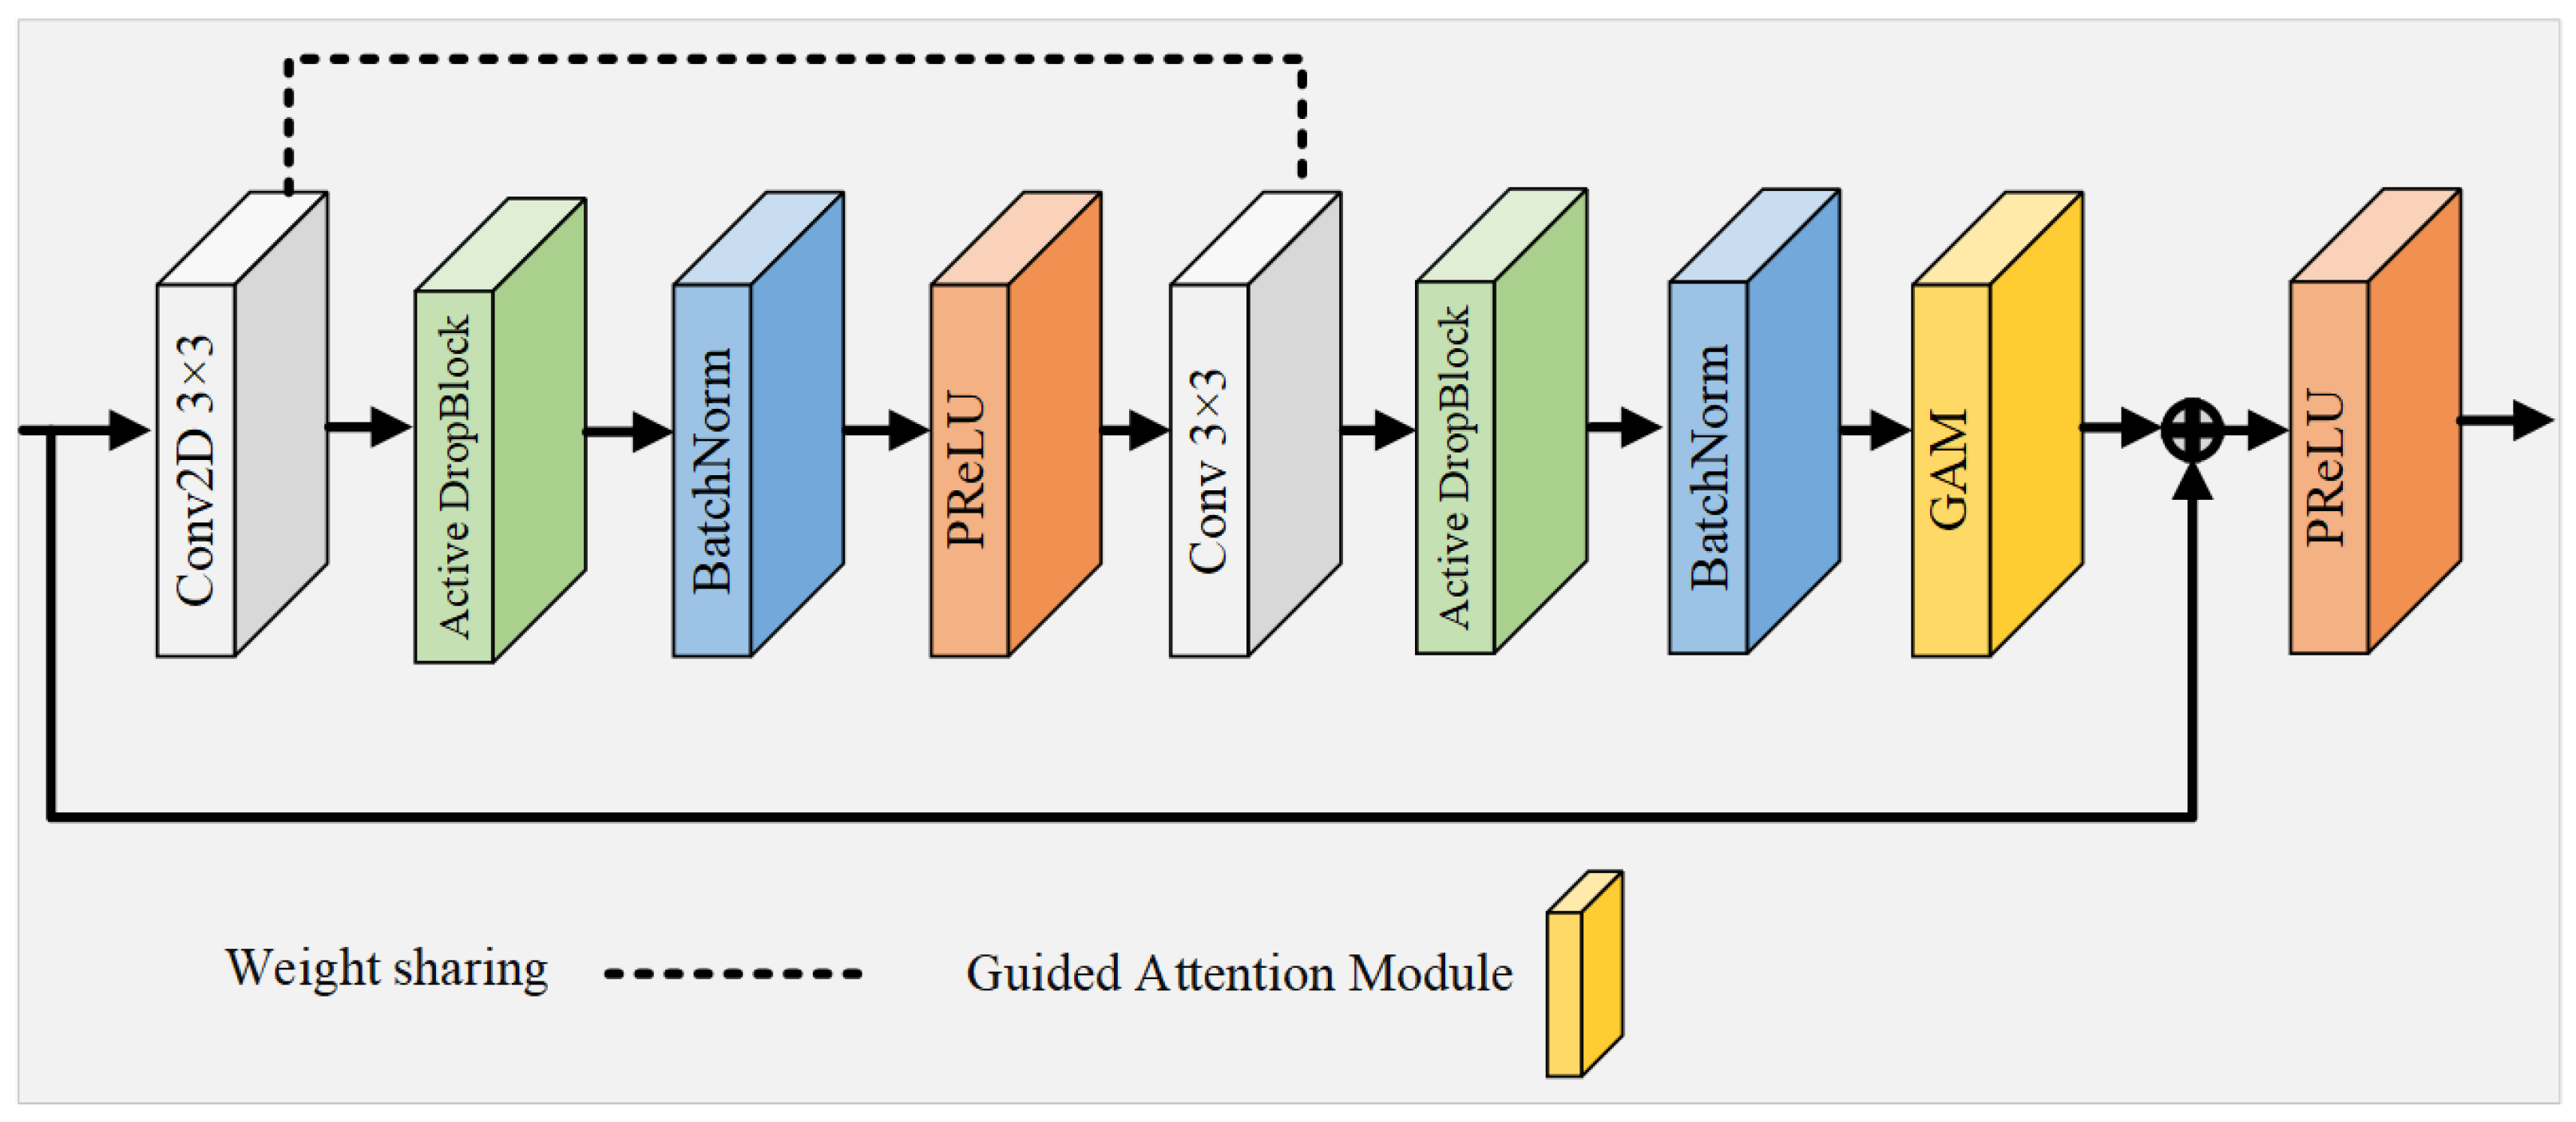
Since the activation units in the CL are spatially correlated, using Dropout regularization to randomly discard units does not effectively remove semantic information. To address this limitation, the WRM introduces a more structured variant of Dropout, termed Active DropBlock [51], which specifically targets the continuous areas within the layer’s feature mappings for removal. The WRM enhances feature extraction by introducing a weight-sharing mechanism and DropBlock regularization:
where DropBlock applies a structured dropout, and PReLU is the Parametric ReLU activation function. This strategic deletion of certain vascular feature semantic information compels the network’s remaining activation units to adapt and learn vascular features more effectively, thus serving as a countermeasure against network overfitting. The extent of the activation unit removal is governed by the parameter , and it is defined as follows:
where P is the probability of preservation; S is the size of the region to be dropped; and H and W are the feature map’s height and width, respectively. Building upon this foundation, this study introduces a novel residual module that integrates Active DropBlock and a weight-sharing strategy, serving as the foundational unit of the network, as depicted in Figure 4. This innovative module not only reduces the quantity of parameters and the duration of training, but also alleviates the challenges of network degradation and overfitting that typically arise with increased neural network depth.

Figure 4.
Overall structure of the multi-scale input module.
This innovative module not only reduces the quantity of parameters and the duration of training, but also alleviates the challenges of network degradation and overfitting that typically arise with increased neural network depth. In contrast to conventional residual convolutional modules [41], this module features two CL with identical weights, functioning akin to a recursive layer within a cyclic convolution framework (albeit with distinct batch normalization layers for each module). This recursive configuration accumulates features across layers, thereby fortifying the network’s capacity for low-level feature extraction through the reuse of feature maps, a particularly advantageous strategy for analyzing small vascular datasets. To prevent network overfitting, DropBlock regularization with settings of and is implemented between the CL. Moreover, the activation function PReLU, equipped with adjustable parameters, supplants the standard ReLU function in the residual block, thereby circumventing the issue of ReLU neuron inactivity. Culminating in the integration of an attention guidance module, this approach sharpens the focus on subtle vascular details. The residual module effectively synthesizes the benefits of residual connections, cyclic convolution, regularization, and attention mechanisms, resulting in a network characterized by fewer parameters and enhanced efficiency in feature extraction.
3.3.1. Guided Attention Module
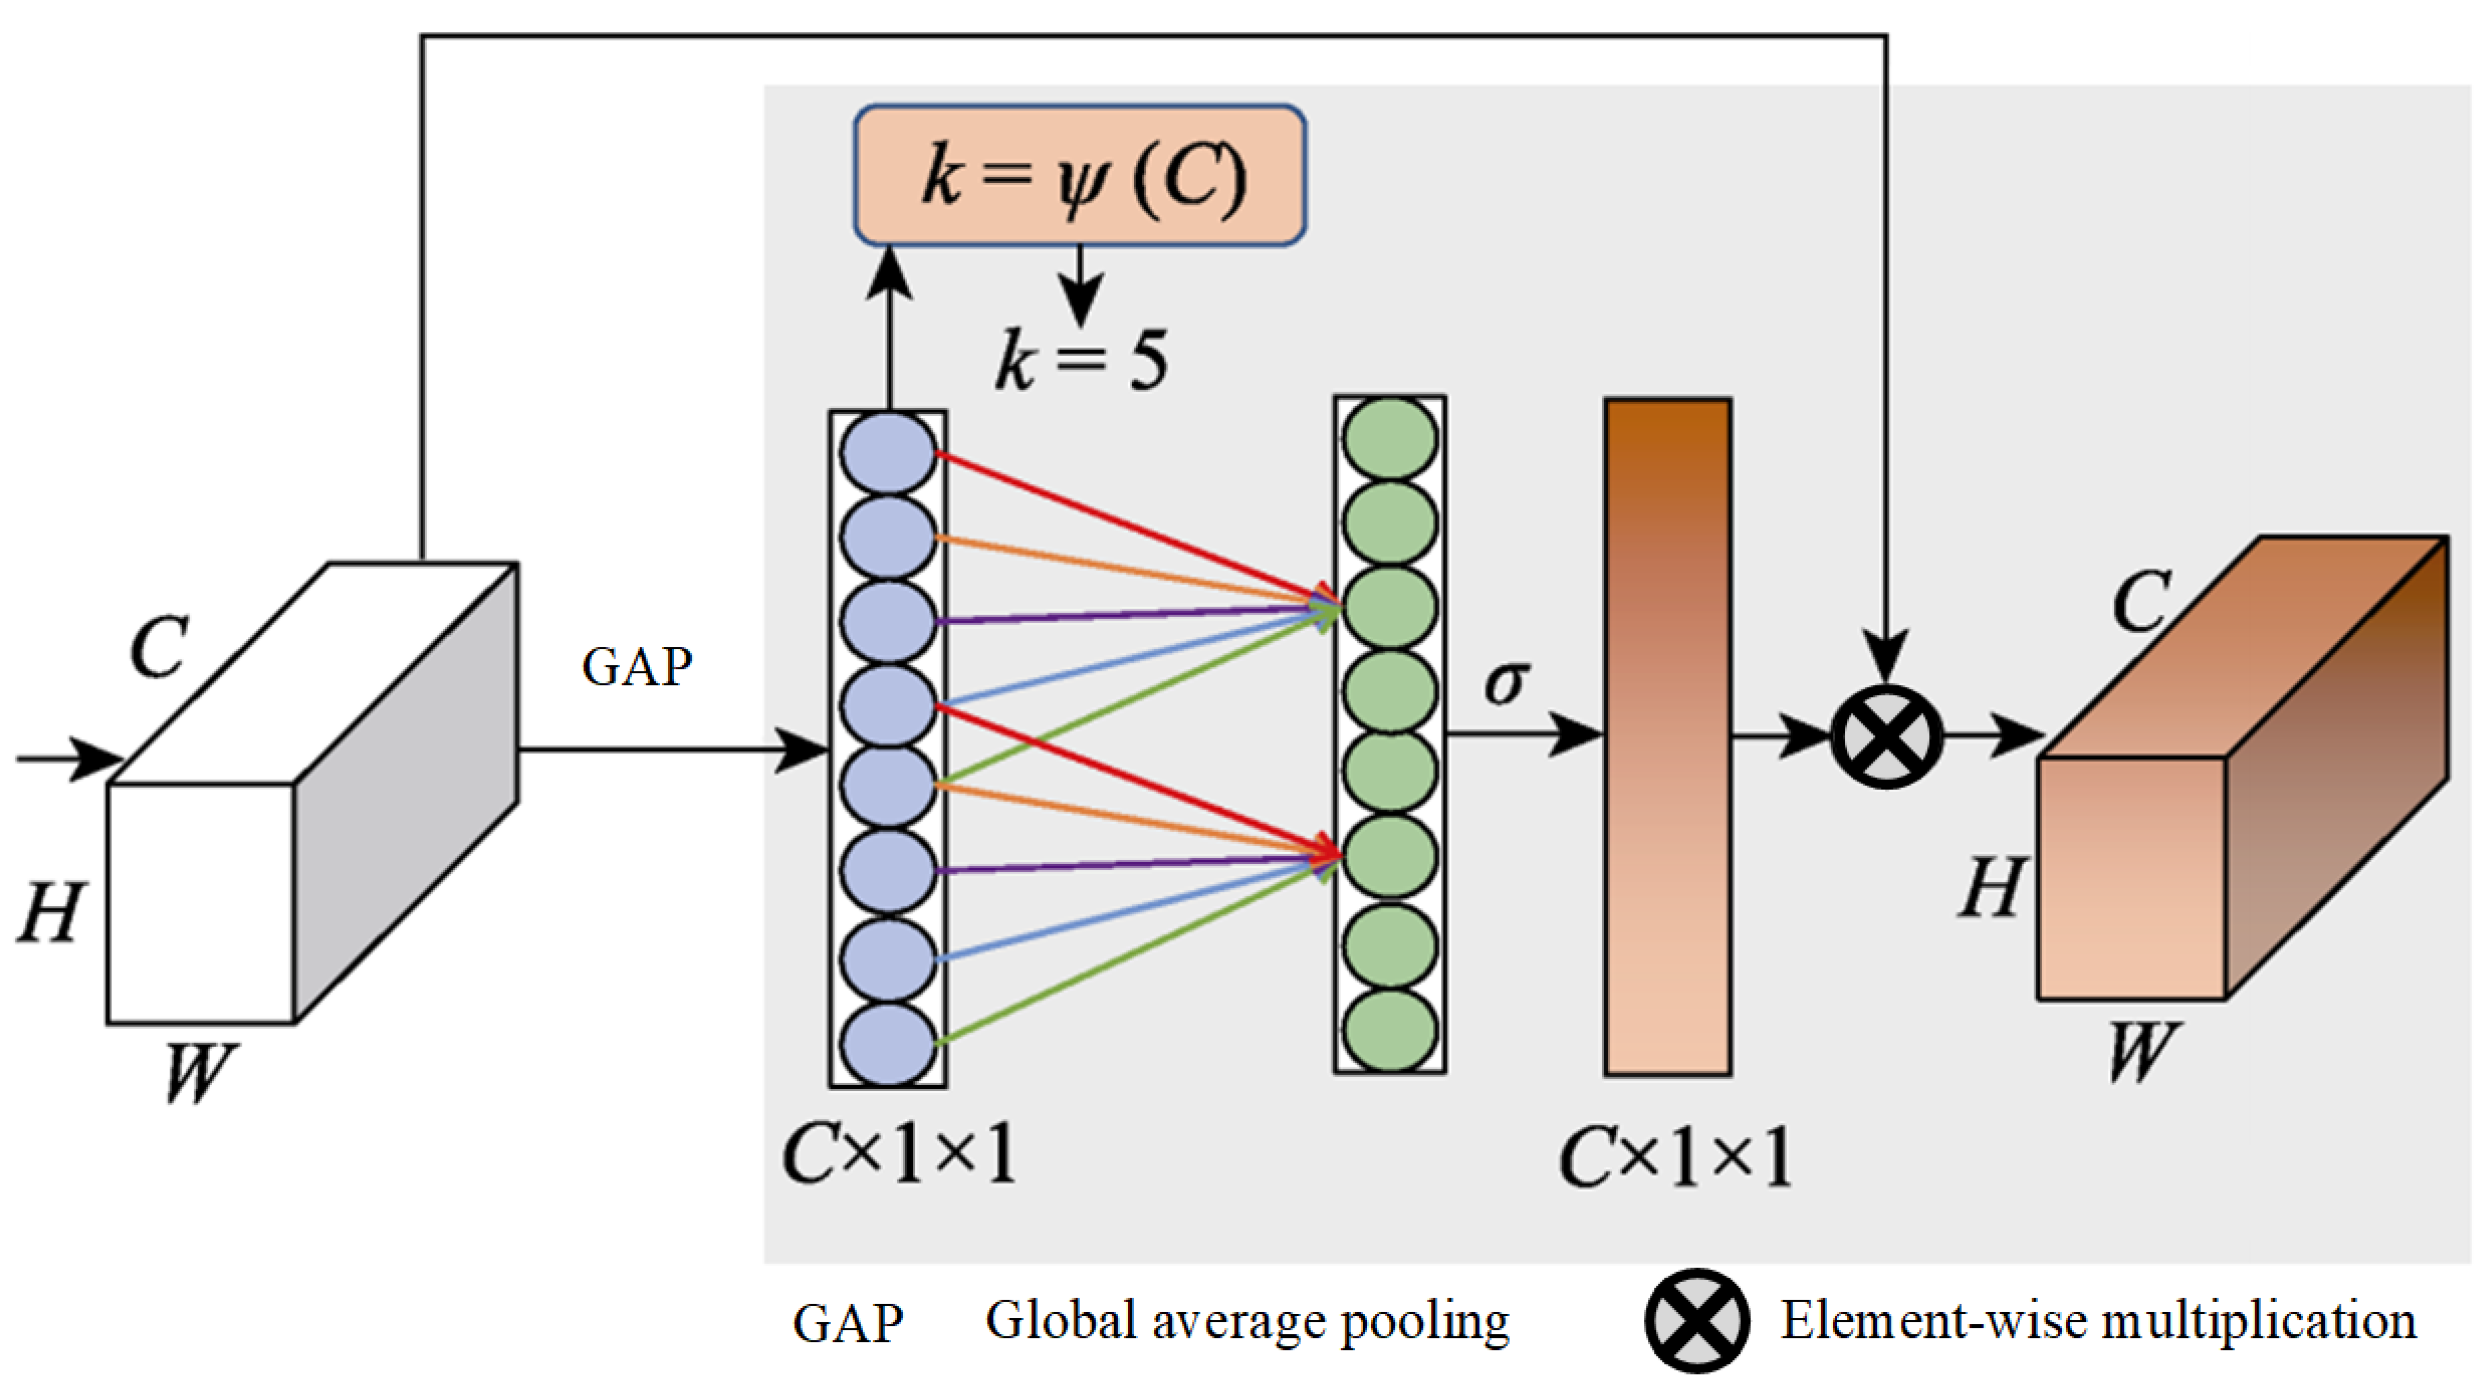
The global average pooling process in the squeeze-and-excitation (SE) module [52] is limited in capturing a comprehensive global context, a gap that was identified and addressed by Cao et al. [53]. They proposed a novel integration of self-attention with channel attention mechanisms, which was further refined by incorporating elements from the non-local (NL) module [54] alongside the SE module to develop a global context (GC) module. This innovative module employs GC to effectively map the dependencies between channels, thereby enhancing the model’s classification capabilities. Furthermore, Wang et al. [55] identified a challenge within the SE module, and its dimensionality reduction operation could dampen the model’s capacity to learn efficiently. They introduced an ECA module, and it is depicted in Figure 5.

Figure 5.
Structure of ECA.
It starts with utilizing global average pooling to generate a feature map of . Following this, 1D convolution is applied instead of a fully connected layer to quickly generate channel weights, which helps avoid reducing the channel dimensions and thus facilitates the learning of ECA. The size of the 1D convolutional kernel, k, is adaptively determined by the channel count, C, with a direct correlation between k and C, which is defined as .
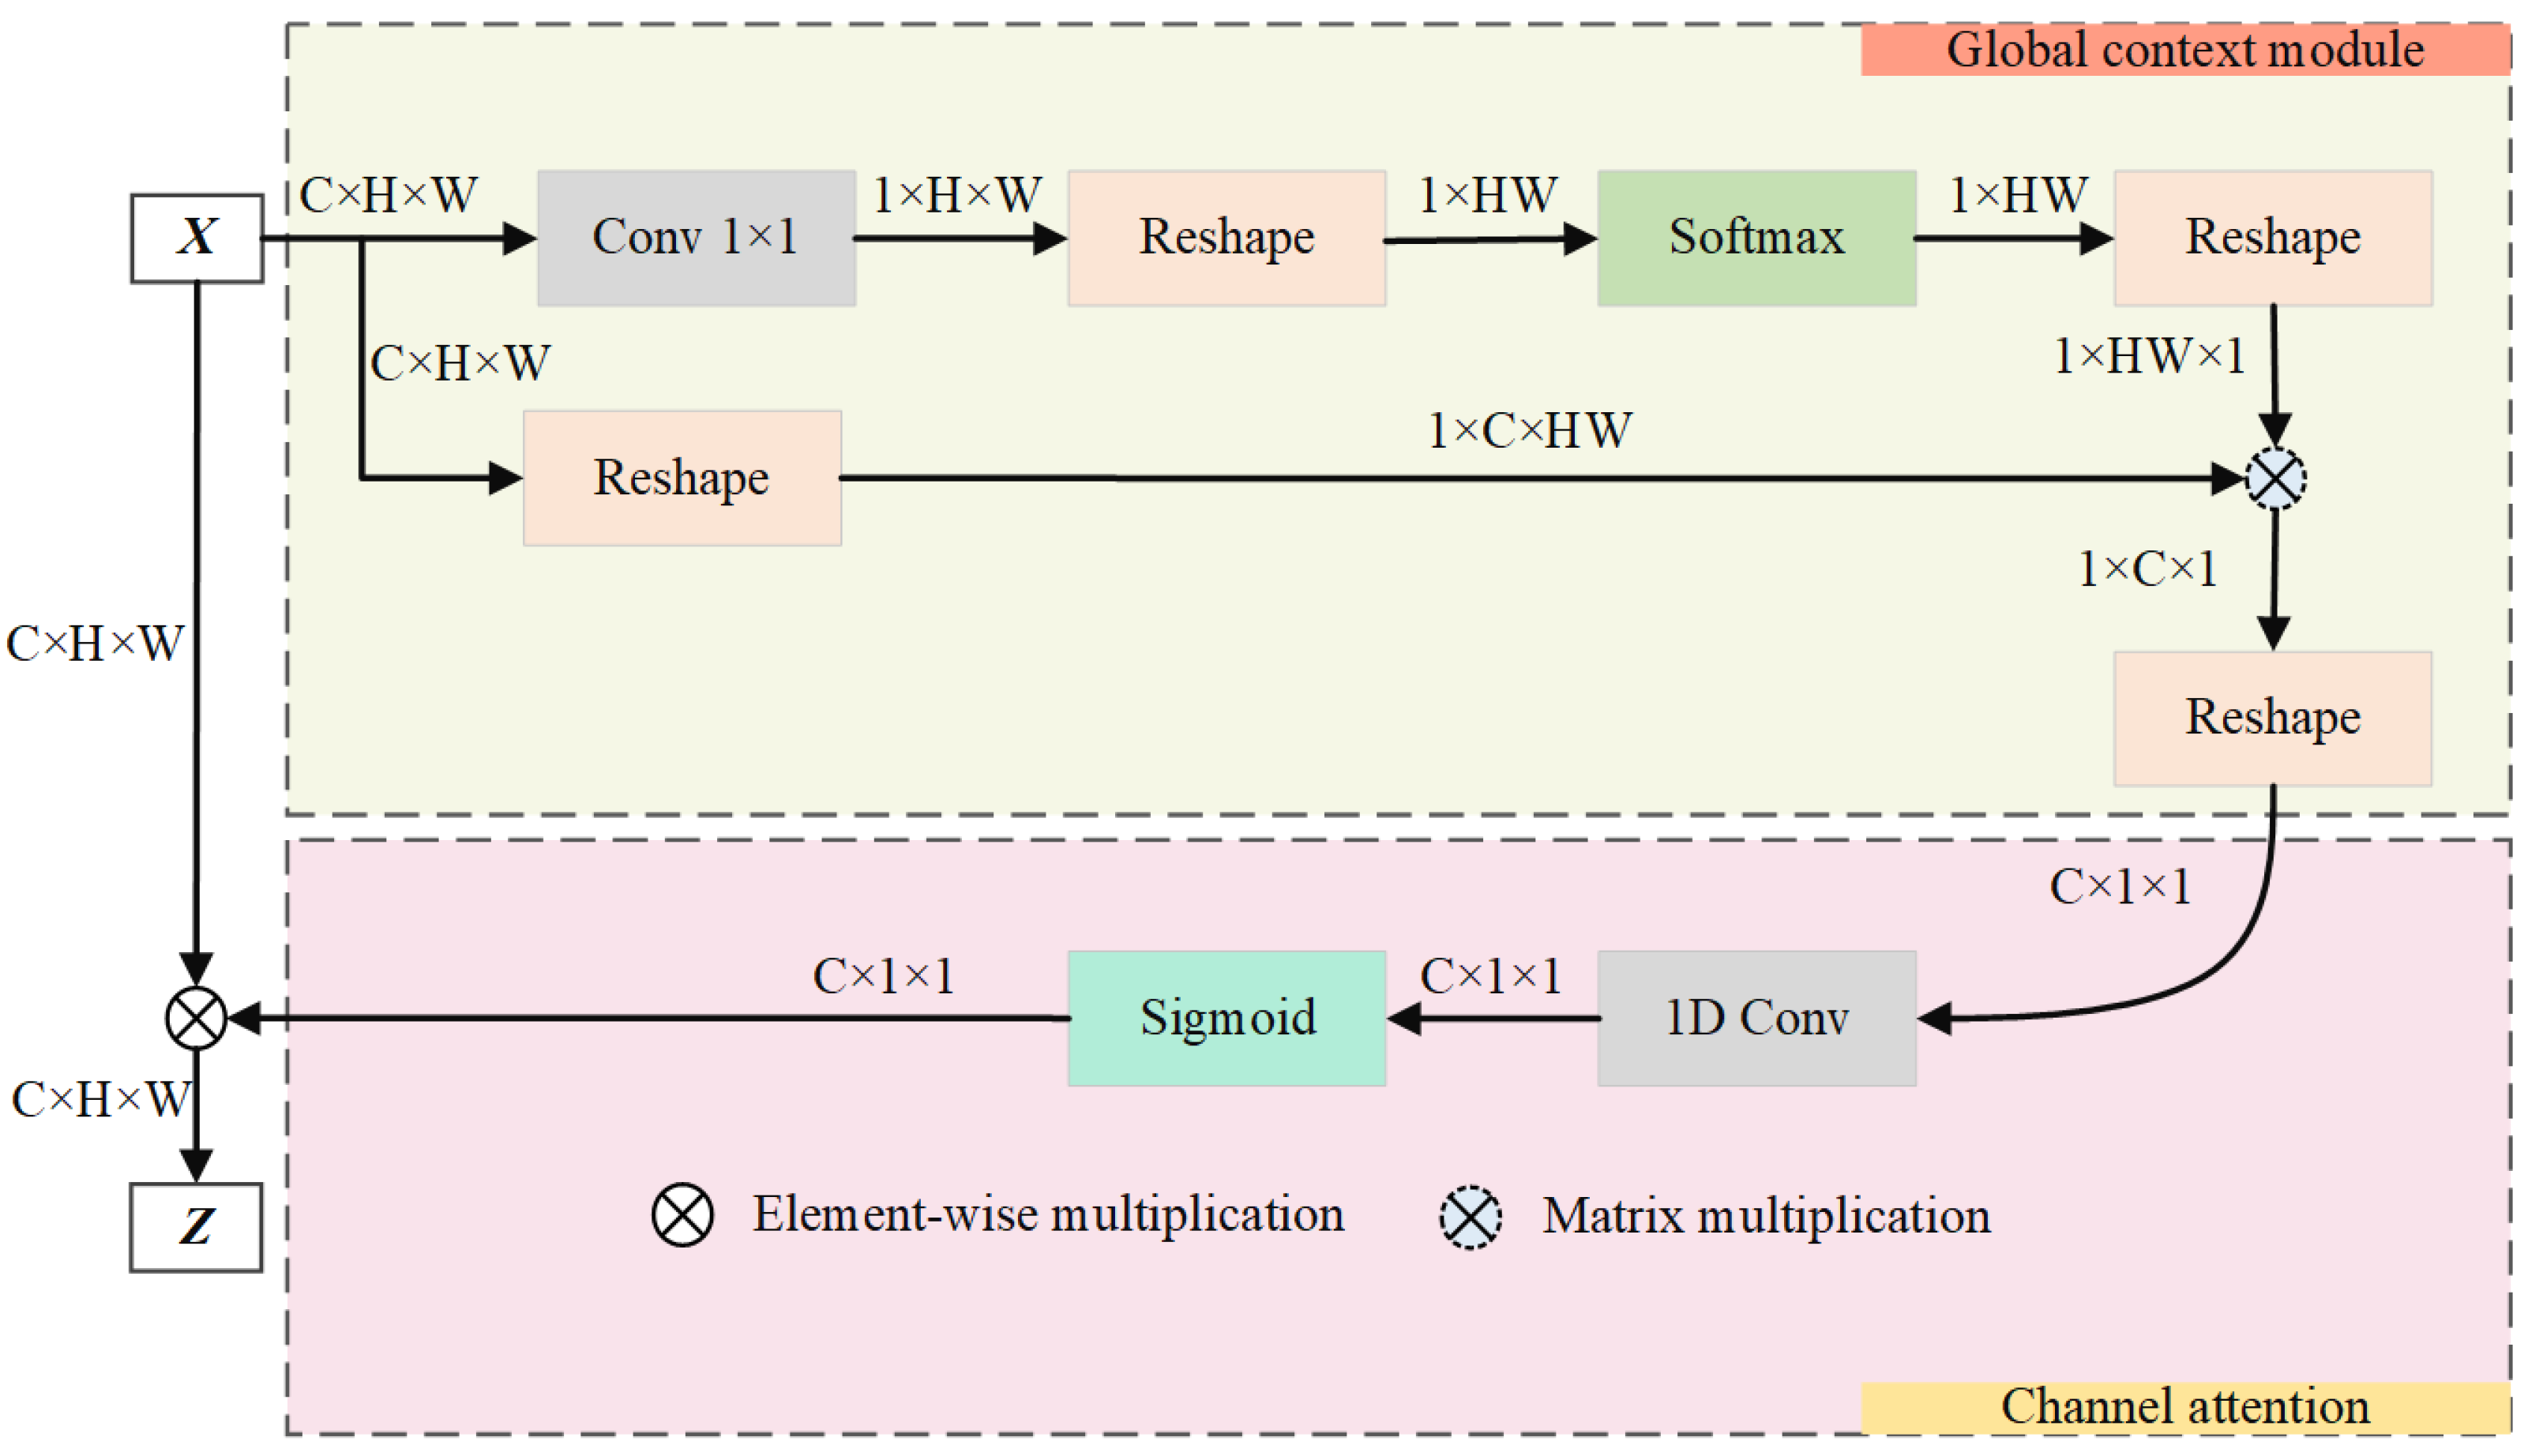
This paper advances the groundwork laid by the GC module by incorporating a streamlined NL module and ECA module, blending the strengths of both self-attention and ECA. This synthesis culminates in the creation of an attention guidance module that is proficient in GC modeling and is equipped with a channel attention mechanism, as illustrated in Figure 6.
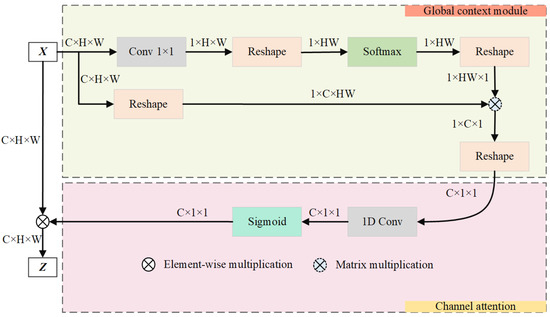
Figure 6.
Graphical representation of the guided attention module.
The purpose of this module is to improve the accuracy of vascular segmentation by merging global feature data and setting out dependencies across channels. The GAM enhances focus on relevant features by employing a global context and channel attention mechanism.
The module unfolds in two distinct stages. (1) Initially, it employs self-attention mechanisms to identify the long-range dependencies among vascular positions, thus effectively modeling global context. This stage enriches the semantic richness of fundus images by integrating global information into the channel architecture. The attention weight for each position j is computed as follows:
where is the learned weight matrix, is the feature vector at position j, and is the total number of positions. (2) Subsequently, it uses channel attention to model inter-channel dependencies, re-calibrating the importance of each channel. This dynamically generates the network’s focus areas, highlighting crucial retinal vascular information and suppressing the activation of features in unrelated background regions. The final output feature map Z after attention is as follows:
where is the Sigmoid function, captures channel dependencies, and represents the input feature map after passing through the weight-shared residual module. The operator ⊗ signifies the element-wise multiplication of the channel attention weights with the corresponding features. These integrated mechanisms ensure that the GAM effectively enhances the learning of critical features while suppressing irrelevant information, thereby improving the overall accuracy of RVS.
3.3.2. Decoding Path
The decoding path reconstructs the segmentation map by upsampling and concatenating features from the encoding path with skip connections:
where is the feature map from the encoding path, and Upsample is an upsampling operation. Finally, the output segmentation map is obtained via a convolution:
Furthermore, the algorithm step of MPCCN is shown in Algorithm 1
| Algorithm 1 Algorithmic steps of MPCCN |
|
3.4. Joint Loss Function
Due to the complexity of retinal vessel images and the presence of sample imbalance, using only cross-entropy loss for learning pixel-level dense predictions tends to favor the segmentation of the larger background portion. The global loss function based on the Jaccard coefficient (JC), which describes the similarity between limited sample sets, is suitable for global image-level predictions. It can detect and correct high-order inconsistencies between the network’s output of vascular segmentation maps and the gold standard images, compensating for the shortcomings of cross-entropy loss. Although the JC ensures the consistency of segmentation results, it is not conducive to the segmentation of small targets. If some pixels are incorrectly predicted, it can cause significant fluctuations in loss, making training unstable. Therefore, this paper combines cross-entropy loss with the JC in a weighted sum, thus proposing a joint loss function. The cross-entropy function, JC, and joint loss function are defined as follows:
where y represents the gold standard image; denotes the predicted image; represents the label value of a certain pixel in the image; represents the predicted value of a pixel; N signifies the total number of pixels in the image; and and represent the weight proportions of the two loss function terms. As shown in Table 1, this paper selected different weight proportions of the loss functions for comparative experiments on the DRIVE dataset. By comparing accuracy (Acc), specificity, sensitivity, and the area under the curve (AUC), the weight proportions of and were chosen for the best comprehensive segmentation performance. This approach ensures training stability while effectively improving the segmentation accuracy of vascular pixels.

Table 1.
Comparison of the segmentation performance using different weighted loss functions.
4. Experimental Results and Analysis
4.1. Experimental Setup
The experiments in this study were conducted on a high-performance Linux machine running Ubuntu 22.04. The deep neural network models were developed and evaluated on a powerful computer equipped with a 13th generation Intel Core i7 processor, an NVIDIA RTX 3090 GPU with 24 GB of GDDR6X memory, and 32 GB of DDR5 RAM. The most recent stable version of the PyTorch framework, with NVIDIA CUDA support, was utilized for implementing and running the experiments. To ensure consistency, both the training and testing of each model were carried out in the same computing environment using identical parameters throughout the process.
4.2. Datasets
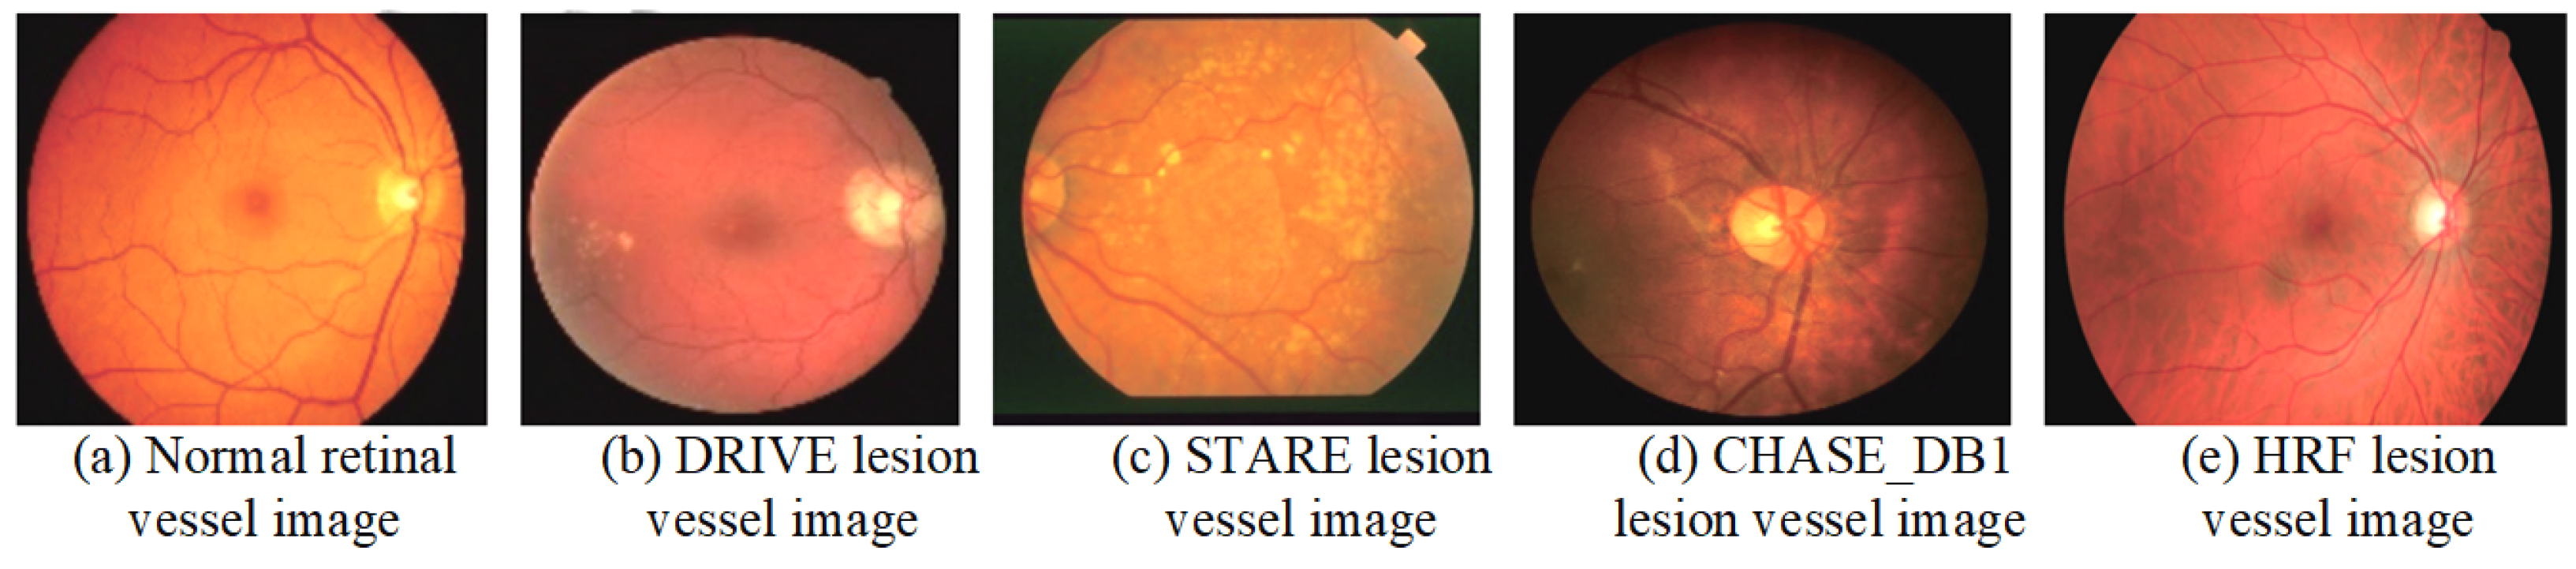
A dataset is a crucial component of medical image processing research and serves as a fundamental basis for evaluating the performance of various algorithms. The integrity and diversity of the dataset directly impact the reliability and generalizability of the research findings. This section provides a detailed description of the commonly used datasets in the study of retinal vessel image segmentation. By analyzing both normal retinal vessels and comparing them with lesion examples from different datasets, we can gain deeper insights into the strengths and limitations of each dataset. Figure 7 illustrates examples of normal retinal vessels alongside lesion examples from various datasets, highlighting the variations and challenges in RVS. The comprehensive understanding of these datasets is essential for advancing algorithm development and enhancing the accuracy of medical image analysis.
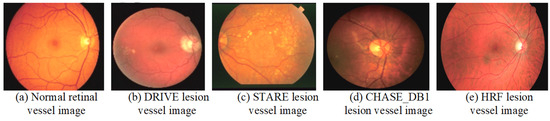
Figure 7.
Examples of the normal retinal vessels and lesion images from various datasets.
4.2.1. DRIVE
The DRIVE dataset [56] originates from the Netherlands’ diabetic retinopathy screening program, and it is designed to facilitate research in retinal image analysis. This dataset comprises 40 carefully selected images from a pool of 400 diabetic patients. Each image, with a resolution of 565 × 584 pixels and stored in JPEG format, is captured using a Canon CR3 non-mydriatic 45CCD camera. The images are taken with a 5° field of view (FOV) at a 45° angle, with the captured resolution being 768 × 584 pixels. Notably, the images exhibit a circular FOV with a diameter of 540 pixels. For inclusion in the dataset, the images are cropped and provided with FOV mask images to ensure consistency and ease of use. Among these images, seven display early signs of lesions, while the remaining images do not exhibit significant pathological features. Despite its establishment many years ago, the DRIVE dataset remains one of the most frequently utilized datasets for RVS research. Its continued relevance is a testament to its quality and comprehensiveness, although no new images have been added since its initial release.
4.2.2. STARE
The STARE dataset [57] was initially composed of 20 high-resolution fundus images, each measuring 700 × 605 pixels and stored in PPM format. Each image underwent meticulous manual segmentation by at least two experienced experts, ensuring a high level of accuracy and reliability. Among these images, 10 exhibit signs of retinal lesions, while the remaining images are free from any pathological indications. One notable limitation of the STARE dataset is the homogeneous nature of the lesion types, which may impact the robustness and generalizability of the models trained exclusively on this dataset. Consequently, it is advisable to use the STARE dataset in conjunction with other datasets to enhance the model performance in practical applications. The dataset has since been expanded to include 40 images for vessel segmentation and 80 images for optic nerve detection, broadening its utility and applicability in various research contexts.
4.2.3. CHASE_DB1
The CHASE_DB1 dataset [58] is part of the Child Heart and Health Study in England (CHASE), which collected images from multi-ethnic schools. This dataset comprises retinal images of both eyes of students, and they were captured using a handheld Nidek NM-200-D fundus camera with a 30° FOV. It consists of 28 fundus images, each sized 1280 × 960 pixels and stored in TIFF format. The recruitment of volunteers for image collection was designed to include a diverse range of ethnicities, resulting in a dataset characterized by varying background transparency and uneven vessel thickness. This diversity effectively addresses the issue of the homogeneous lesion types found in other datasets.
4.2.4. HRF
The HRF dataset [59] consists of 45 images, each with a resolution of 3504 × 2336 pixels and stored in JPEG format. The images in this dataset are categorized into three types: healthy patients, diabetic retinopathy patients, and glaucoma patients. Each image has been manually annotated, making it one of the highest-resolution datasets available at the time. Numerous studies have utilized the HRF dataset for validation. A comparison of these common public datasets is shown in Table 2.
Table 2.
Retinal vessel image segmentation datasets with augmentation details.
4.3. Data Preprocessing and Transfer Learning
The retinal images used for segmentation typically suffer from low contrast, subtle vascular structures, and significant noise interference, which can affect the accuracy of the segmentation model. To address these challenges, a rigorous data preprocessing pipeline described by Ziaur et al. [60] was applied to enhance the quality of the images before inputting them into the MPCCN model. Given the relatively small number of training images in the available datasets (e.g., DRIVE, STARE, and CHASE_DB1), data augmentation was applied to artificially expand the dataset size and improve the network’s generalizability. This included random rotations, flips, and scaling of the images. Furthermore, a sliding window approach was employed, where patches of a size were extracted from each image, and, for higher resolution datasets like HRF, a patch size of was used. This ensures that both global and local vessel structures are captured during training. Table 2 summarizes the data distribution and patch extraction details.
Furthermore, to accelerate the convergence and improve the overall performance of the MPCCN, transfer learning was employed. The encoder part of the MPCCN model was initialized with weights that were pre-trained on the ImageNet dataset [61]. These pre-trained weights provided the model with a strong starting point by leveraging knowledge from millions of natural images, enabling the network to extract robust low-level features such as edges, textures, and shapes. After initializing the encoder with pre-trained weights, the model was fine tuned on RVS datasets. During fine tuning, the weights in the encoder were allowed to update gradually, while the decoder part of the network was trained from scratch. Fine tuning allowed the model to adapt the pre-trained features to the specific task of RVS, resulting in faster convergence and improved segmentation performance.
4.4. Evaluation Metrics
In image segmentation tasks, seven metrics commonly serve as standards for evaluating the quality of model segmentation results: , SP, SE, F1-score, the AUC of the ROC curve, and the intersection over union (IoU). The AUC is a useful metric for evaluating the overall performance of a binary classifier, representing the likelihood that the classifier will rank a randomly chosen positive instance higher than a randomly chosen negative one. We also used these metrics as evaluation criteria in this study, and their formulas are presented in the following Equations:
Among them, the true positives (TP) represent the number of correctly classified vessel pixels, indicating instances where the algorithm successfully identifies the vessel pixels as such. The true negatives (TN) represent the number of correctly classified background pixels, showing the algorithm’s ability to recognize non-vessel areas correctly. On the other hand, the false positives (FP) are the number of background pixels incorrectly classified as vessel pixels, which highlight potential over-detection issues in the algorithm’s performance. Conversely, the false negatives (FN) are the number of vessel pixels incorrectly classified as background pixels, demonstrating cases where the algorithm fails to detect actual vessel pixels. Furthermore, the IoU, also known as the Jaccard Index, measures the overlap between the predicted segmentation and the ground truth as the ratio of the intersection to the union of the predicted and actual regions. It is particularly useful for evaluating segmentation quality by considering both false positives and false negatives.
4.5. Training Strategy
The training of the MPCCN model was conducted using a series of carefully selected techniques and hyperparameters to optimize performance on the RVS task. Given the complexity of the retinal vasculature, which features vessels of varying sizes and intricate patterns, it is crucial to employ strategies that would enhance the model’s ability to generalize across different datasets while preventing overfitting. Therefore, the hyperparameters were meticulously tuned to strike a balance between training efficiency and model performance. The learning rate, a critical parameter influencing the convergence of the model, was initialized at and gradually reduced using a cosine annealing schedule. A batch size of 16 was selected based on the available GPU memory and the need to maintain stable gradient updates. Moreover, the optimizer used was Adam, with the default parameters for momentum being and the beta values were . Weight decay was set to to regularize the model and prevent overfitting by penalizing large weights. Additionally, warm-up epochs were implemented, where the learning rate was gradually increased over the first five epochs to stabilize training and avoid divergence. To further prevent overfitting, dropout layers were incorporated within the network, with a dropout rate of 0.3 applied to key layers. This technique randomly deactivates neurons during training, forcing the network to develop redundant representations, which enhances its generalization capability. Additionally, weight regularization was applied to limit the magnitude of the network’s weights, reducing the risk of overfitting.
The dataset was divided into training, validation, and test sets, with the model’s performance evaluated on the validation set after each epoch. The training process was monitored over 50 epochs, with early stopping implemented if no significant improvement in validation loss was observed over 10 consecutive epochs. This strategy prevented unnecessary overtraining and conserved computational resources. Throughout training, the F1-score and IoU metrics were used to assess segmentation performance, with the model’s hyperparameters being fine tuned to maximize these metrics on the validation set.
4.6. Qualitative Analysis
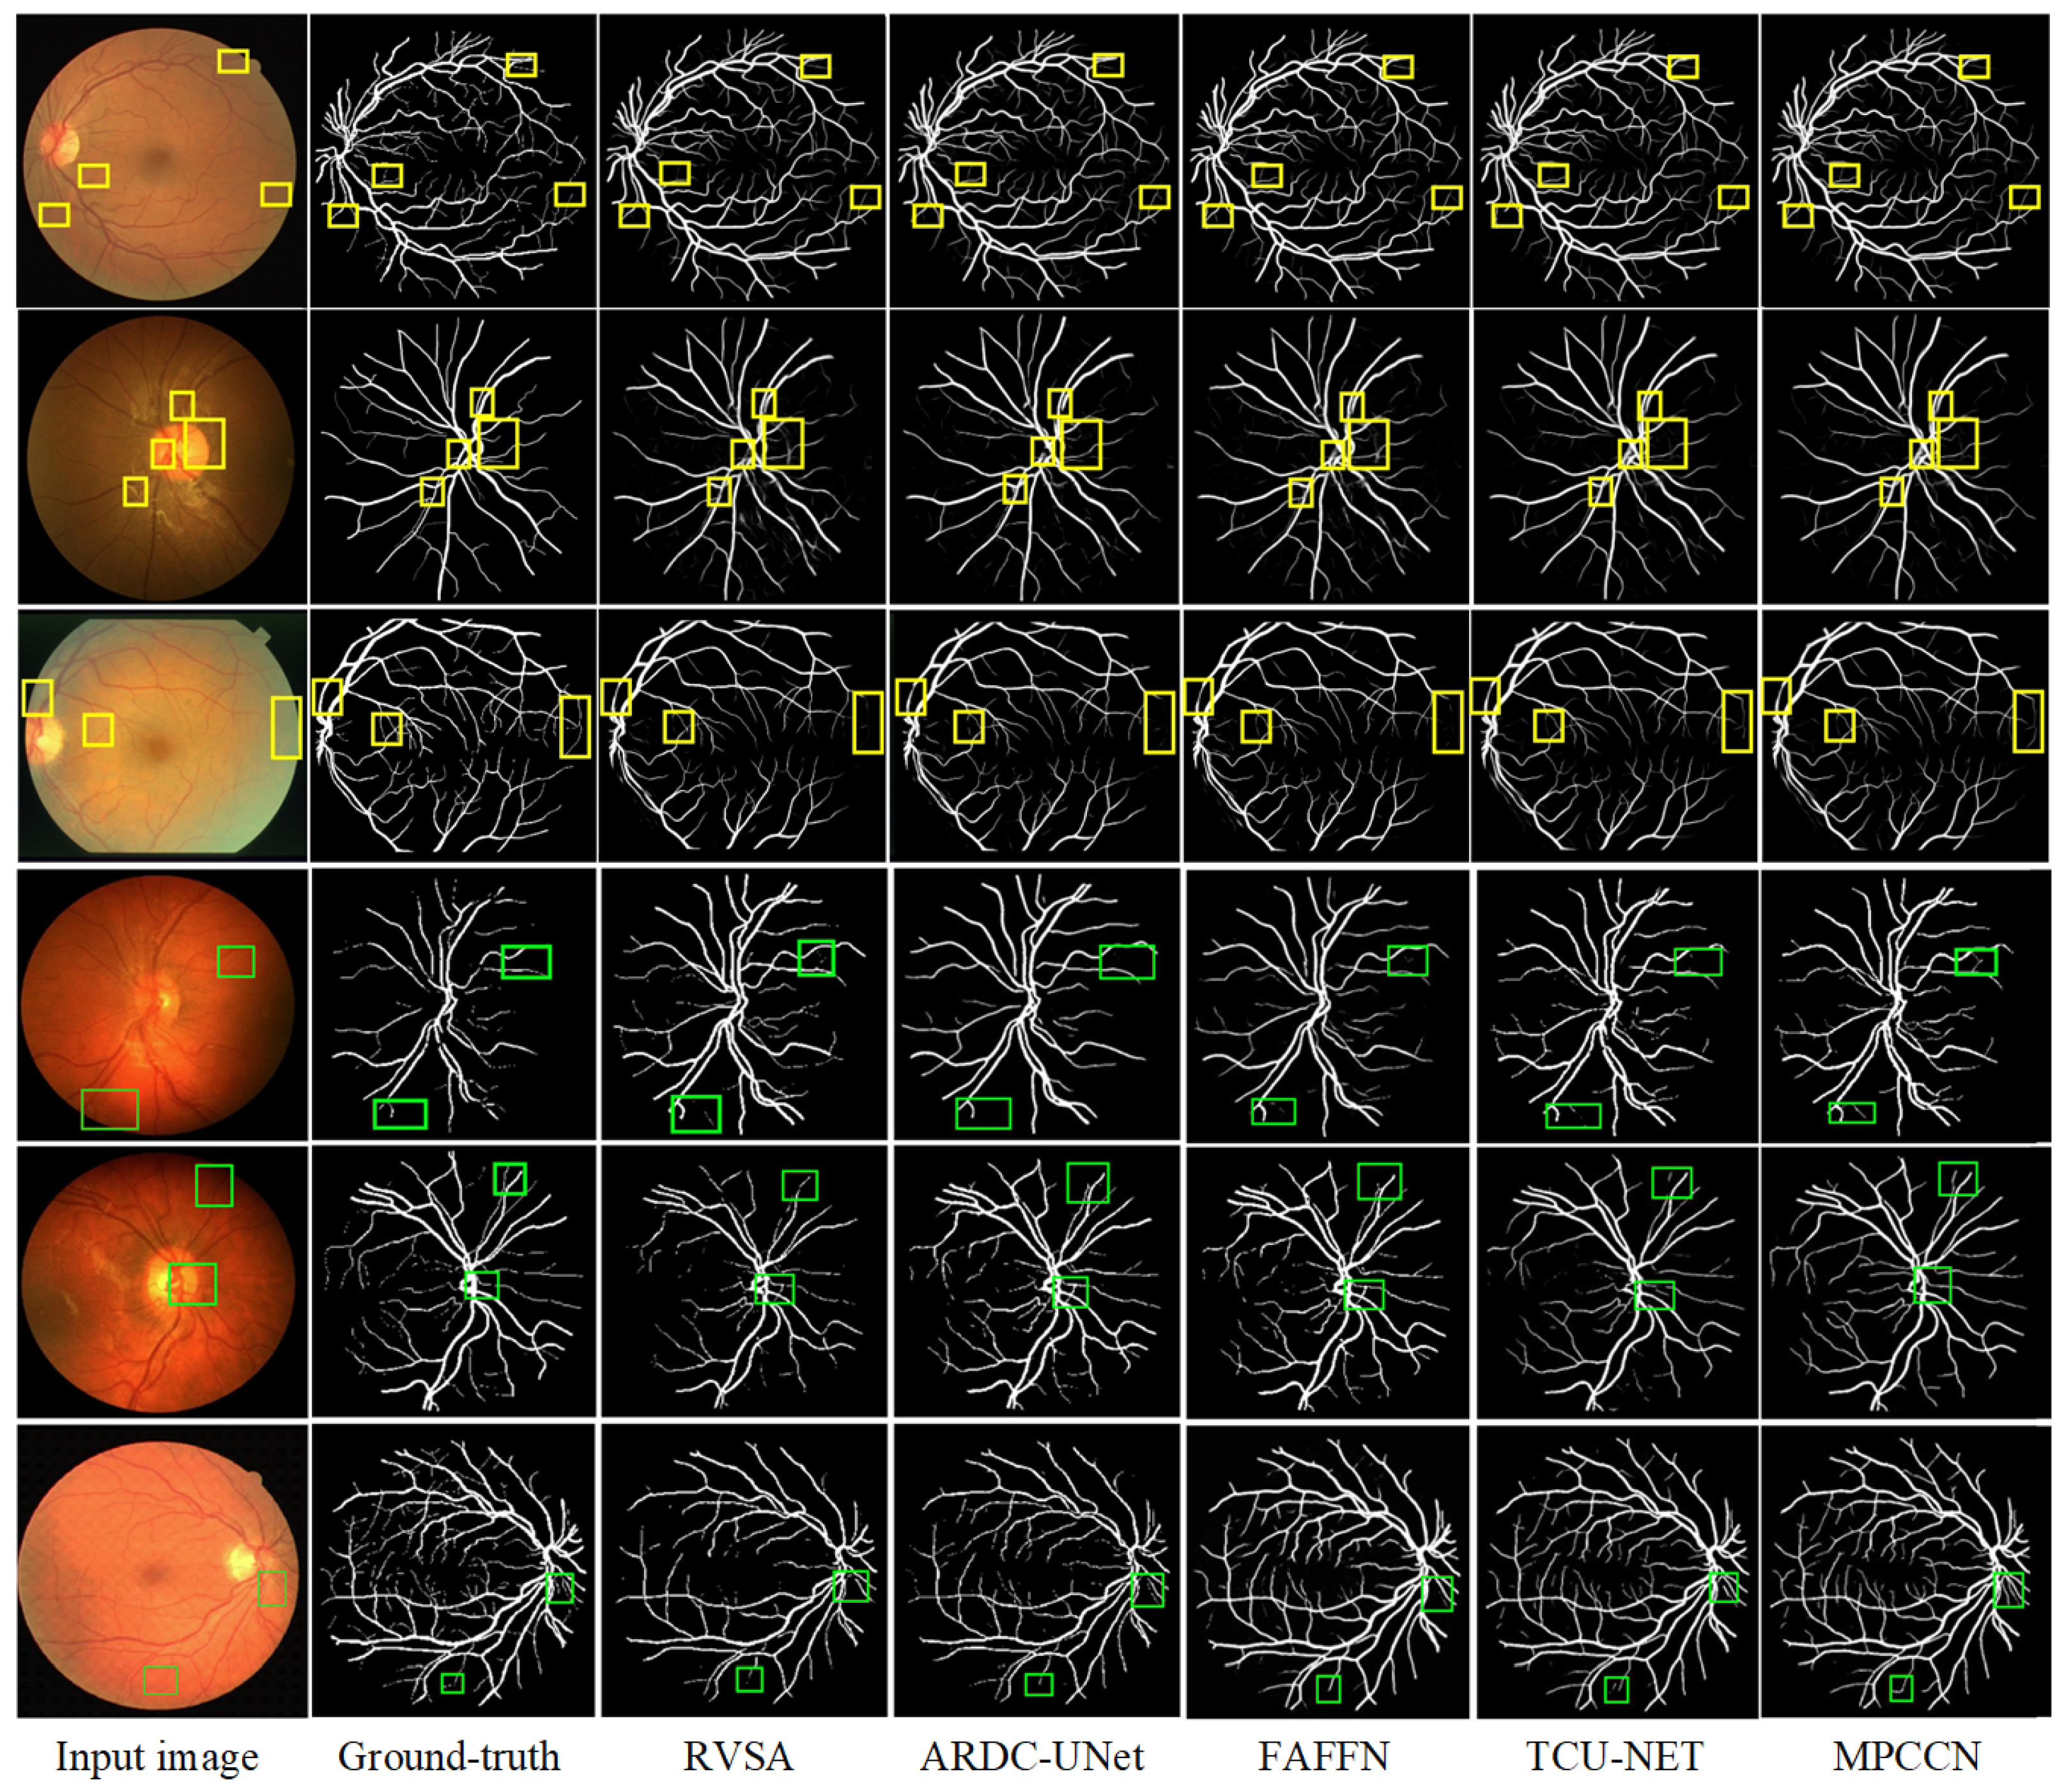
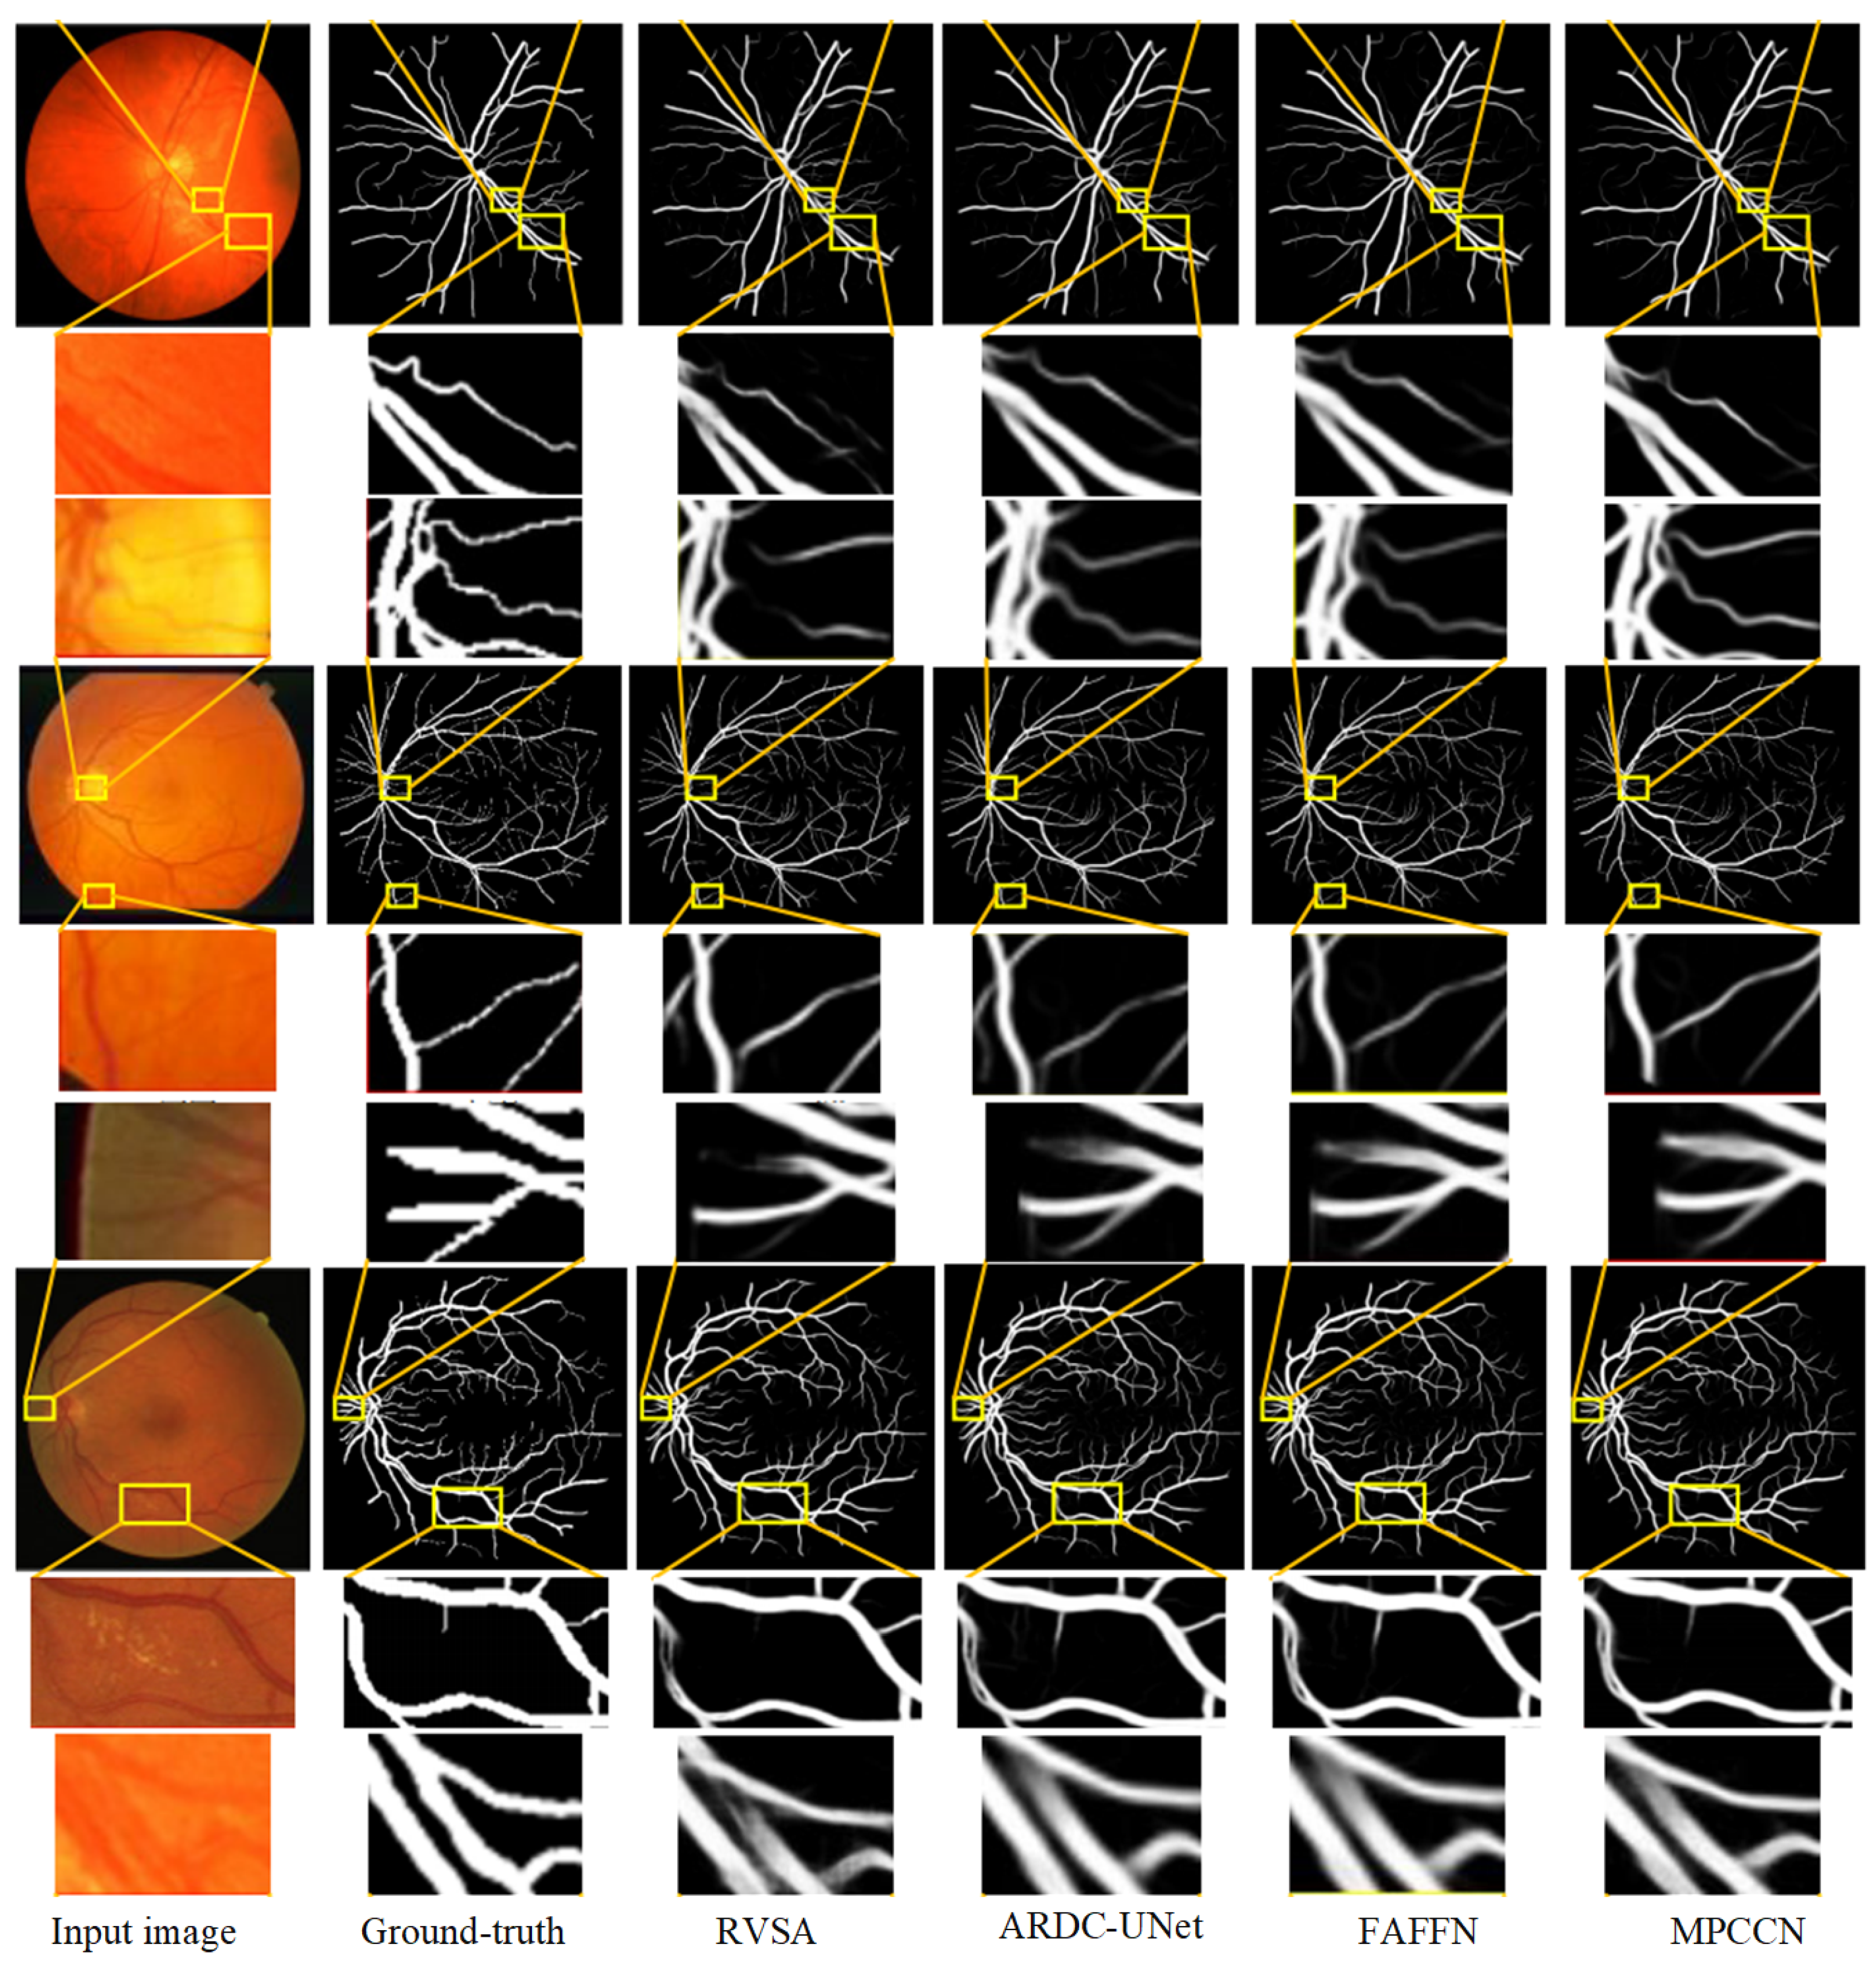
To verify the superiority of MPCCN, it was compared with different RVS algorithms, i.e., RVSA [46], ARDC-UNet [62], FAFFN [63], and TCU-NET [64]. The same experimental conditions and training strategies were used to perform RVS experiments on the DRIVE and CHASE_DB1 datasets. The experimental results are shown in Figure 8. From Figure 8 and Figure 9, it can be observed that RVSA [46], as a classic algorithm for RVS, can only segment the general direction and distribution of the vessels. However, it tends to show major vessel breaks and mis-segmentation at vessel intersections.

Figure 8.
Comparison of the segmentation results between the MPCCN and various prior methods on the DRIVE dataset. The yellow and green boxes show the difference between outcomes.

Figure 9.
Comparison of the segmentation results between the MPCCN and various prior methods on the CHASE_DB1 dataset. The yellow boxes show the difference between outcomes.
Building upon the foundation of RVSA [46], ARDC-UNet [62] replaces convolution blocks with residual convolutions. This allows for the fine extraction of the main vessel network without overfitting, thus outperforming the traditional U-Net. Nevertheless, TCU-NET [64] has a low accuracy rate for extracting tiny vessels and tends to produce false positive vessel areas. On the other hand, ARDC-UNet [62] introduces an attention gates mechanism at the skip connections, which helps to suppress noisy background regions while increasing the focus on vessel areas. This mechanism reduces the impact of background noise while extracting the main network, but mis-segmentation still occurs with tiny vessels.
Furthermore, FAFFN [63] introduced parallel channel and spatial attention modules at the bottom of U-Net, unifying local and global vessel information to achieve high-precision vessel segmentation. It can accurately segment both the main and tiny vessels, with high accuracy in tiny vessel segmentation. However, mis-segmentation still occurs at vessel edges. In contrast, the segmentation results of MPCCN are consistent with the manually segmented vessel images by experts. Compared to other algorithms, MPCCN maintains connectivity in tiny vessel segmentation, reduces the impact of background noise, and ensures vessel connectivity. Therefore, MPCCN finely preserves vessel structural information, has a certain degree of anti-interference capability, and achieves high-precision RVS.
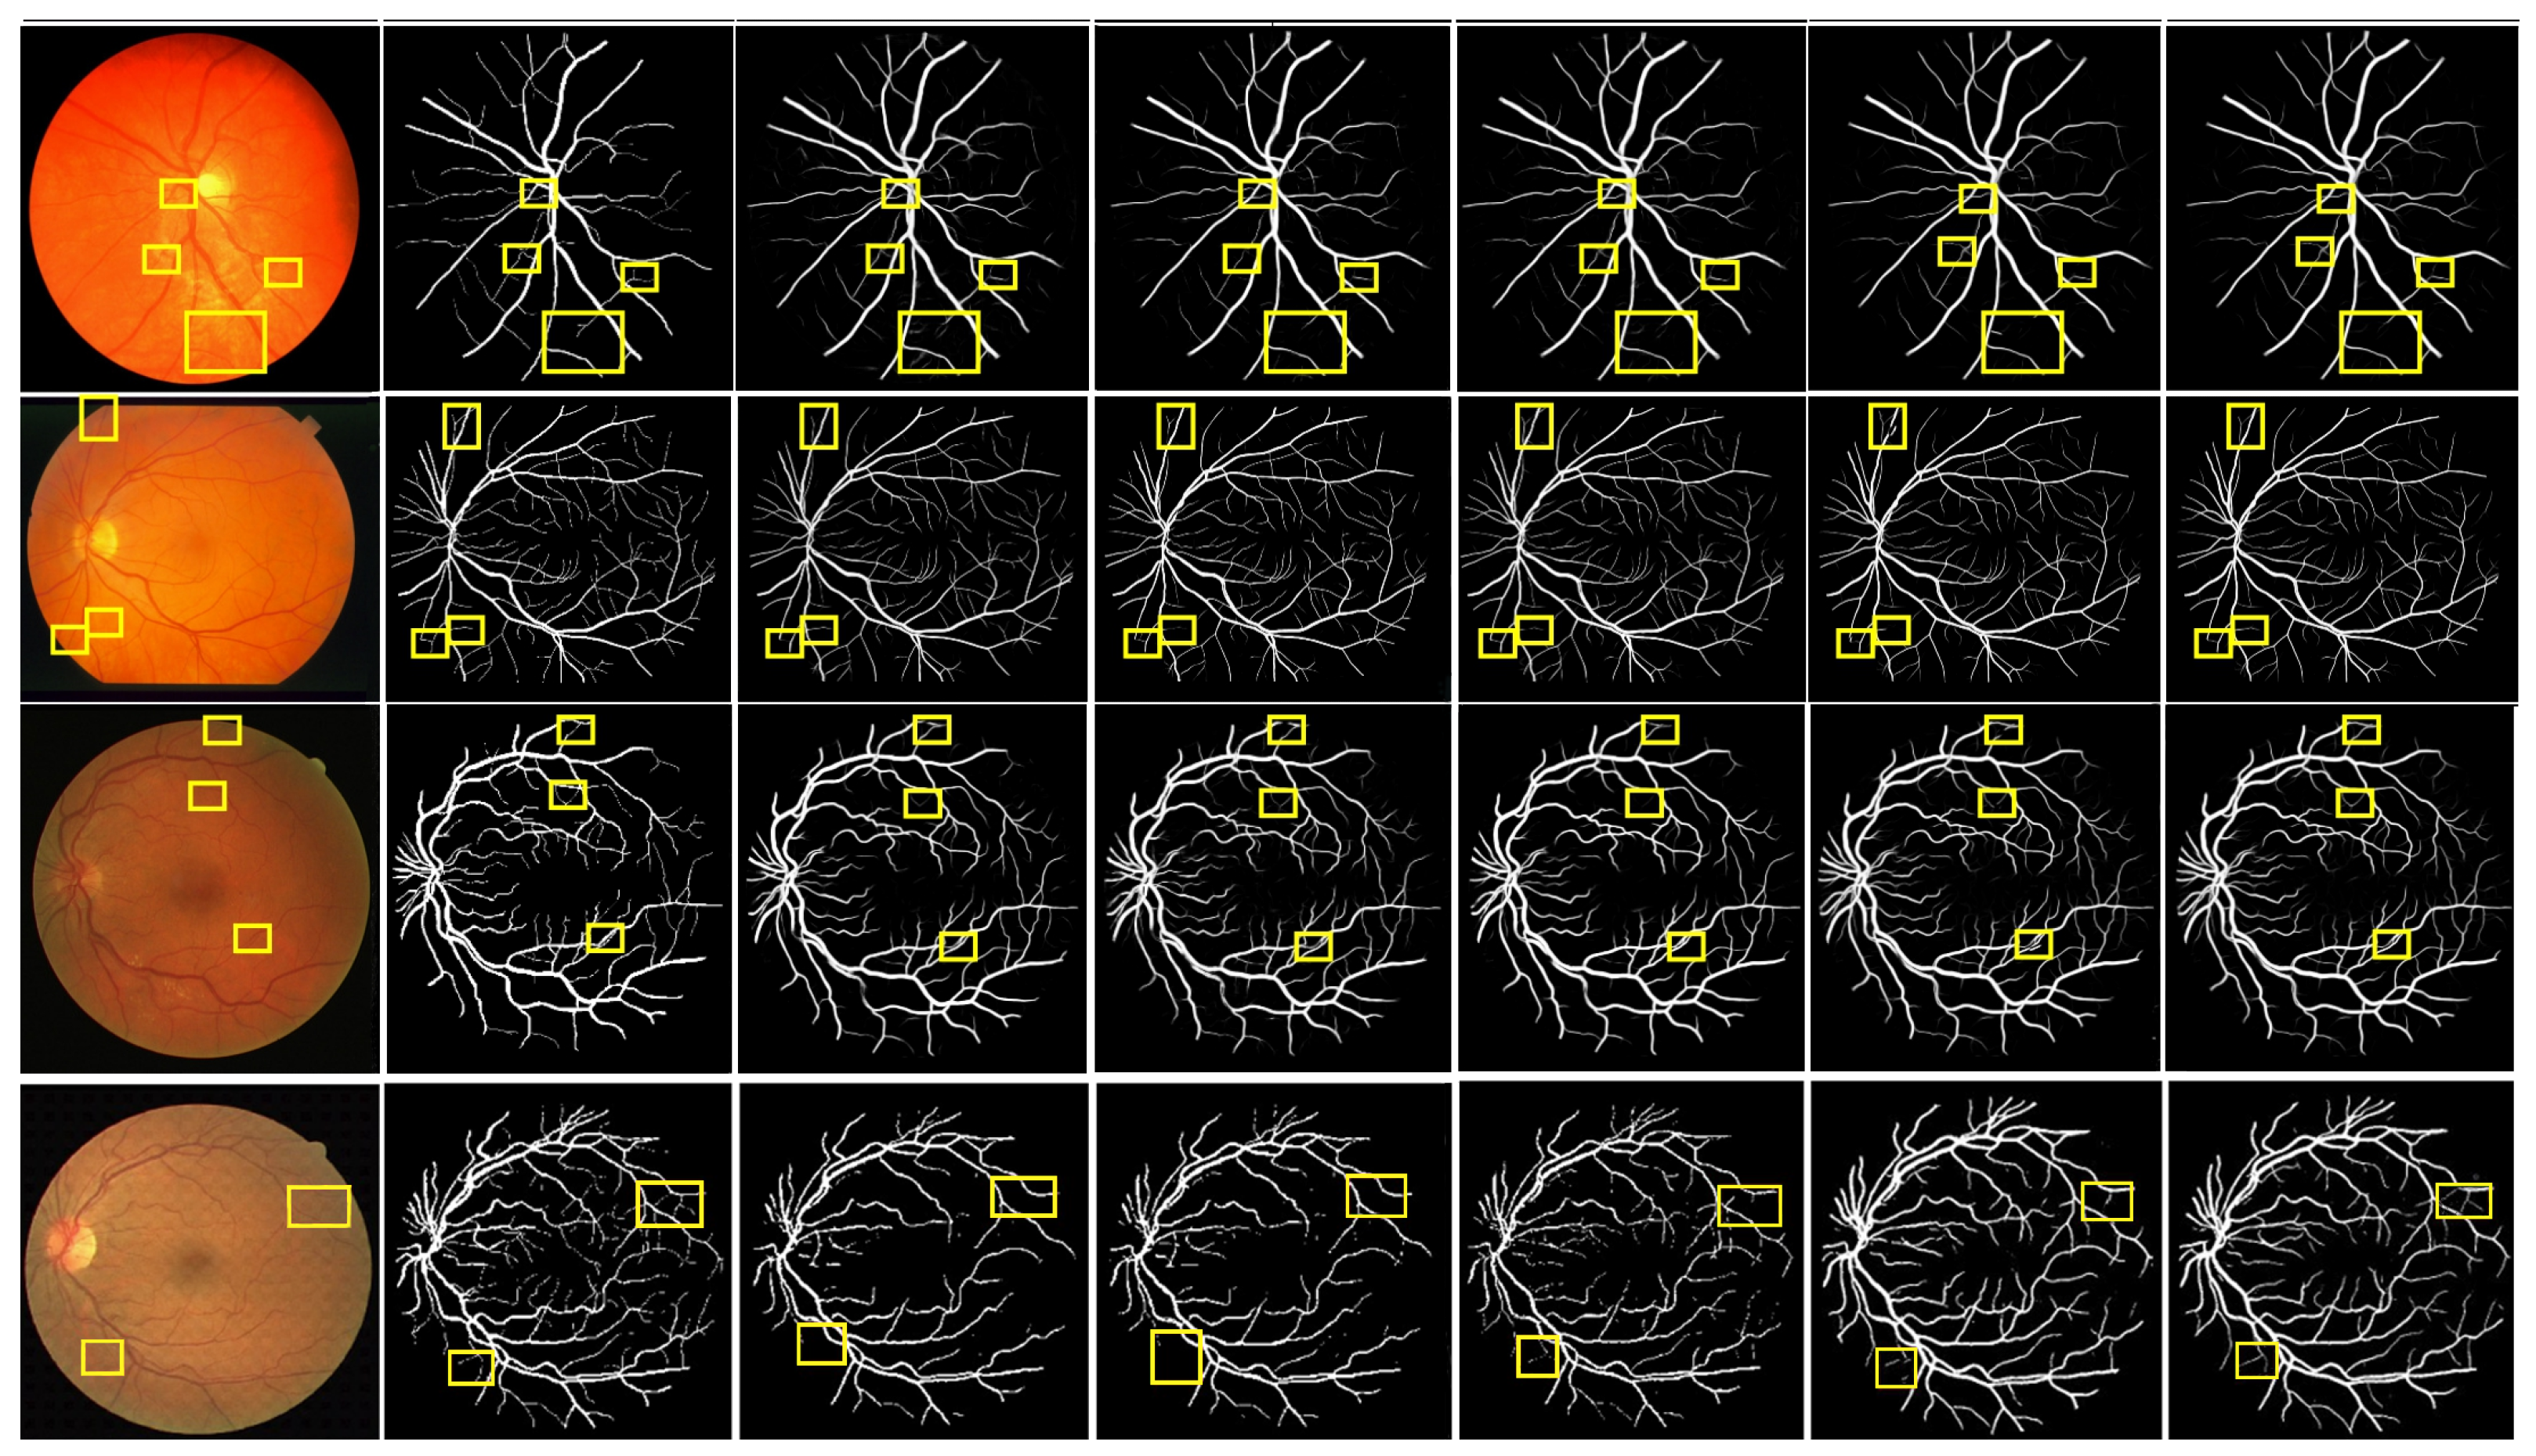
To further verify the performance advantage of MPCCN, a local region comparison of segmented images was conducted with RVSA, ARDC-UNet, and FAFFN algorithms. The comparison results are shown in Figure 10. RVSA can segment main vessels but has low segmentation accuracy at vessel intersections and in tiny vessel areas. ARDC-UNet improves the segmentation effect of tiny vessels compared to RVSA, but disconnection often occurs. The FAFFN model can gradually segment the general shape of boundary vessels, but disconnection still occurs. In contrast, MPCCN accurately segments both the main and tiny vessels without disconnection, greatly ensuring the integrity of the segmented retinal vessels. This comparison highlights the strengths of MPCCN as it effectively combines the advantages of the aforementioned methods while minimizing their drawbacks. Through a comparison of the segmentation details of different algorithms, it was demonstrated that replacing traditional convolutions with PCC can retain image contents as much as possible and can effectively highlight key vessel information. Additionally, standard convolution, PCC, and efficient channel attention can expand the receptive field to improve segmentation accuracy, promoting the integration of main and tiny vessels. MIM allows the algorithm to fully utilize encoding information at different levels, helping to eliminate background noise and redundant information in vessel feature maps. These results verify that MPCCN has high accuracy and anti-interference capability in RVS.
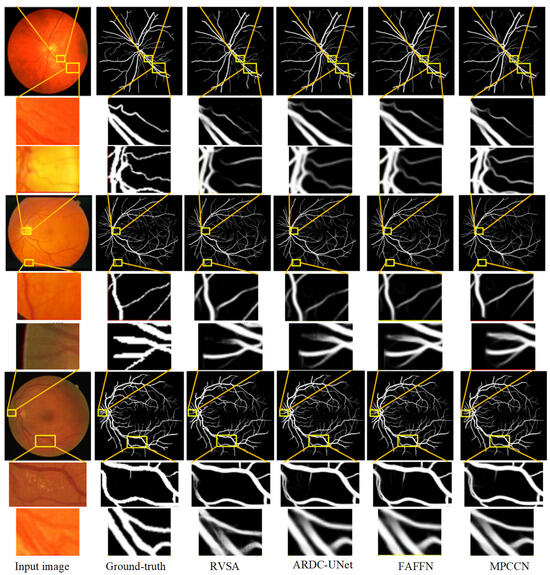
Figure 10.
Comparison of the segmentation results between the MPCCN and various prior methods on the CHASE_DB1 and STARE datasets. The lines from the yellow boxes show the local details.
4.7. Quantitative Analysis
Our thorough evaluation of the algorithm’s performance on the DRIVE, STARE, and CHASE_DB1 datasets involved a quantitative and qualitative comparison. Through this comparative analysis, we demonstrated our algorithm’s proficiency in segmenting fine-vessel bifurcations and areas within the optic disc, macula, and lesions. Our findings, illustrated in various tables and figures, highlight the algorithm’s superior ability in segmenting vessels in challenging conditions, such as lesions or uneven lighting, with greater accuracy and continuity compared to the reference algorithms. By examining the enlarged details of vessel segmentation, our analysis confirms the algorithm’s enhanced performance, particularly in detecting the end branches of vessels and minimizing the impact of lesion areas and artifacts on segmentation accuracy. To verify the effectiveness and feasibility, comparisons were made between the MPCCN and other high-performing deep learning-based segmentation methods. The comparison results are shown in Table 3, Table 4 and Table 5, with the best metrics highlighted in bold.
Table 3.
Evaluating the performance of MPCCN against prior algorithms on the DRIVE dataset.
Table 4.
Evaluating the performance of MPCCN against prior algorithms on the CHASE_DB1 dataset.
Table 5.
Evaluating the performance of MPCCN against prior algorithms on the STARE dataset.
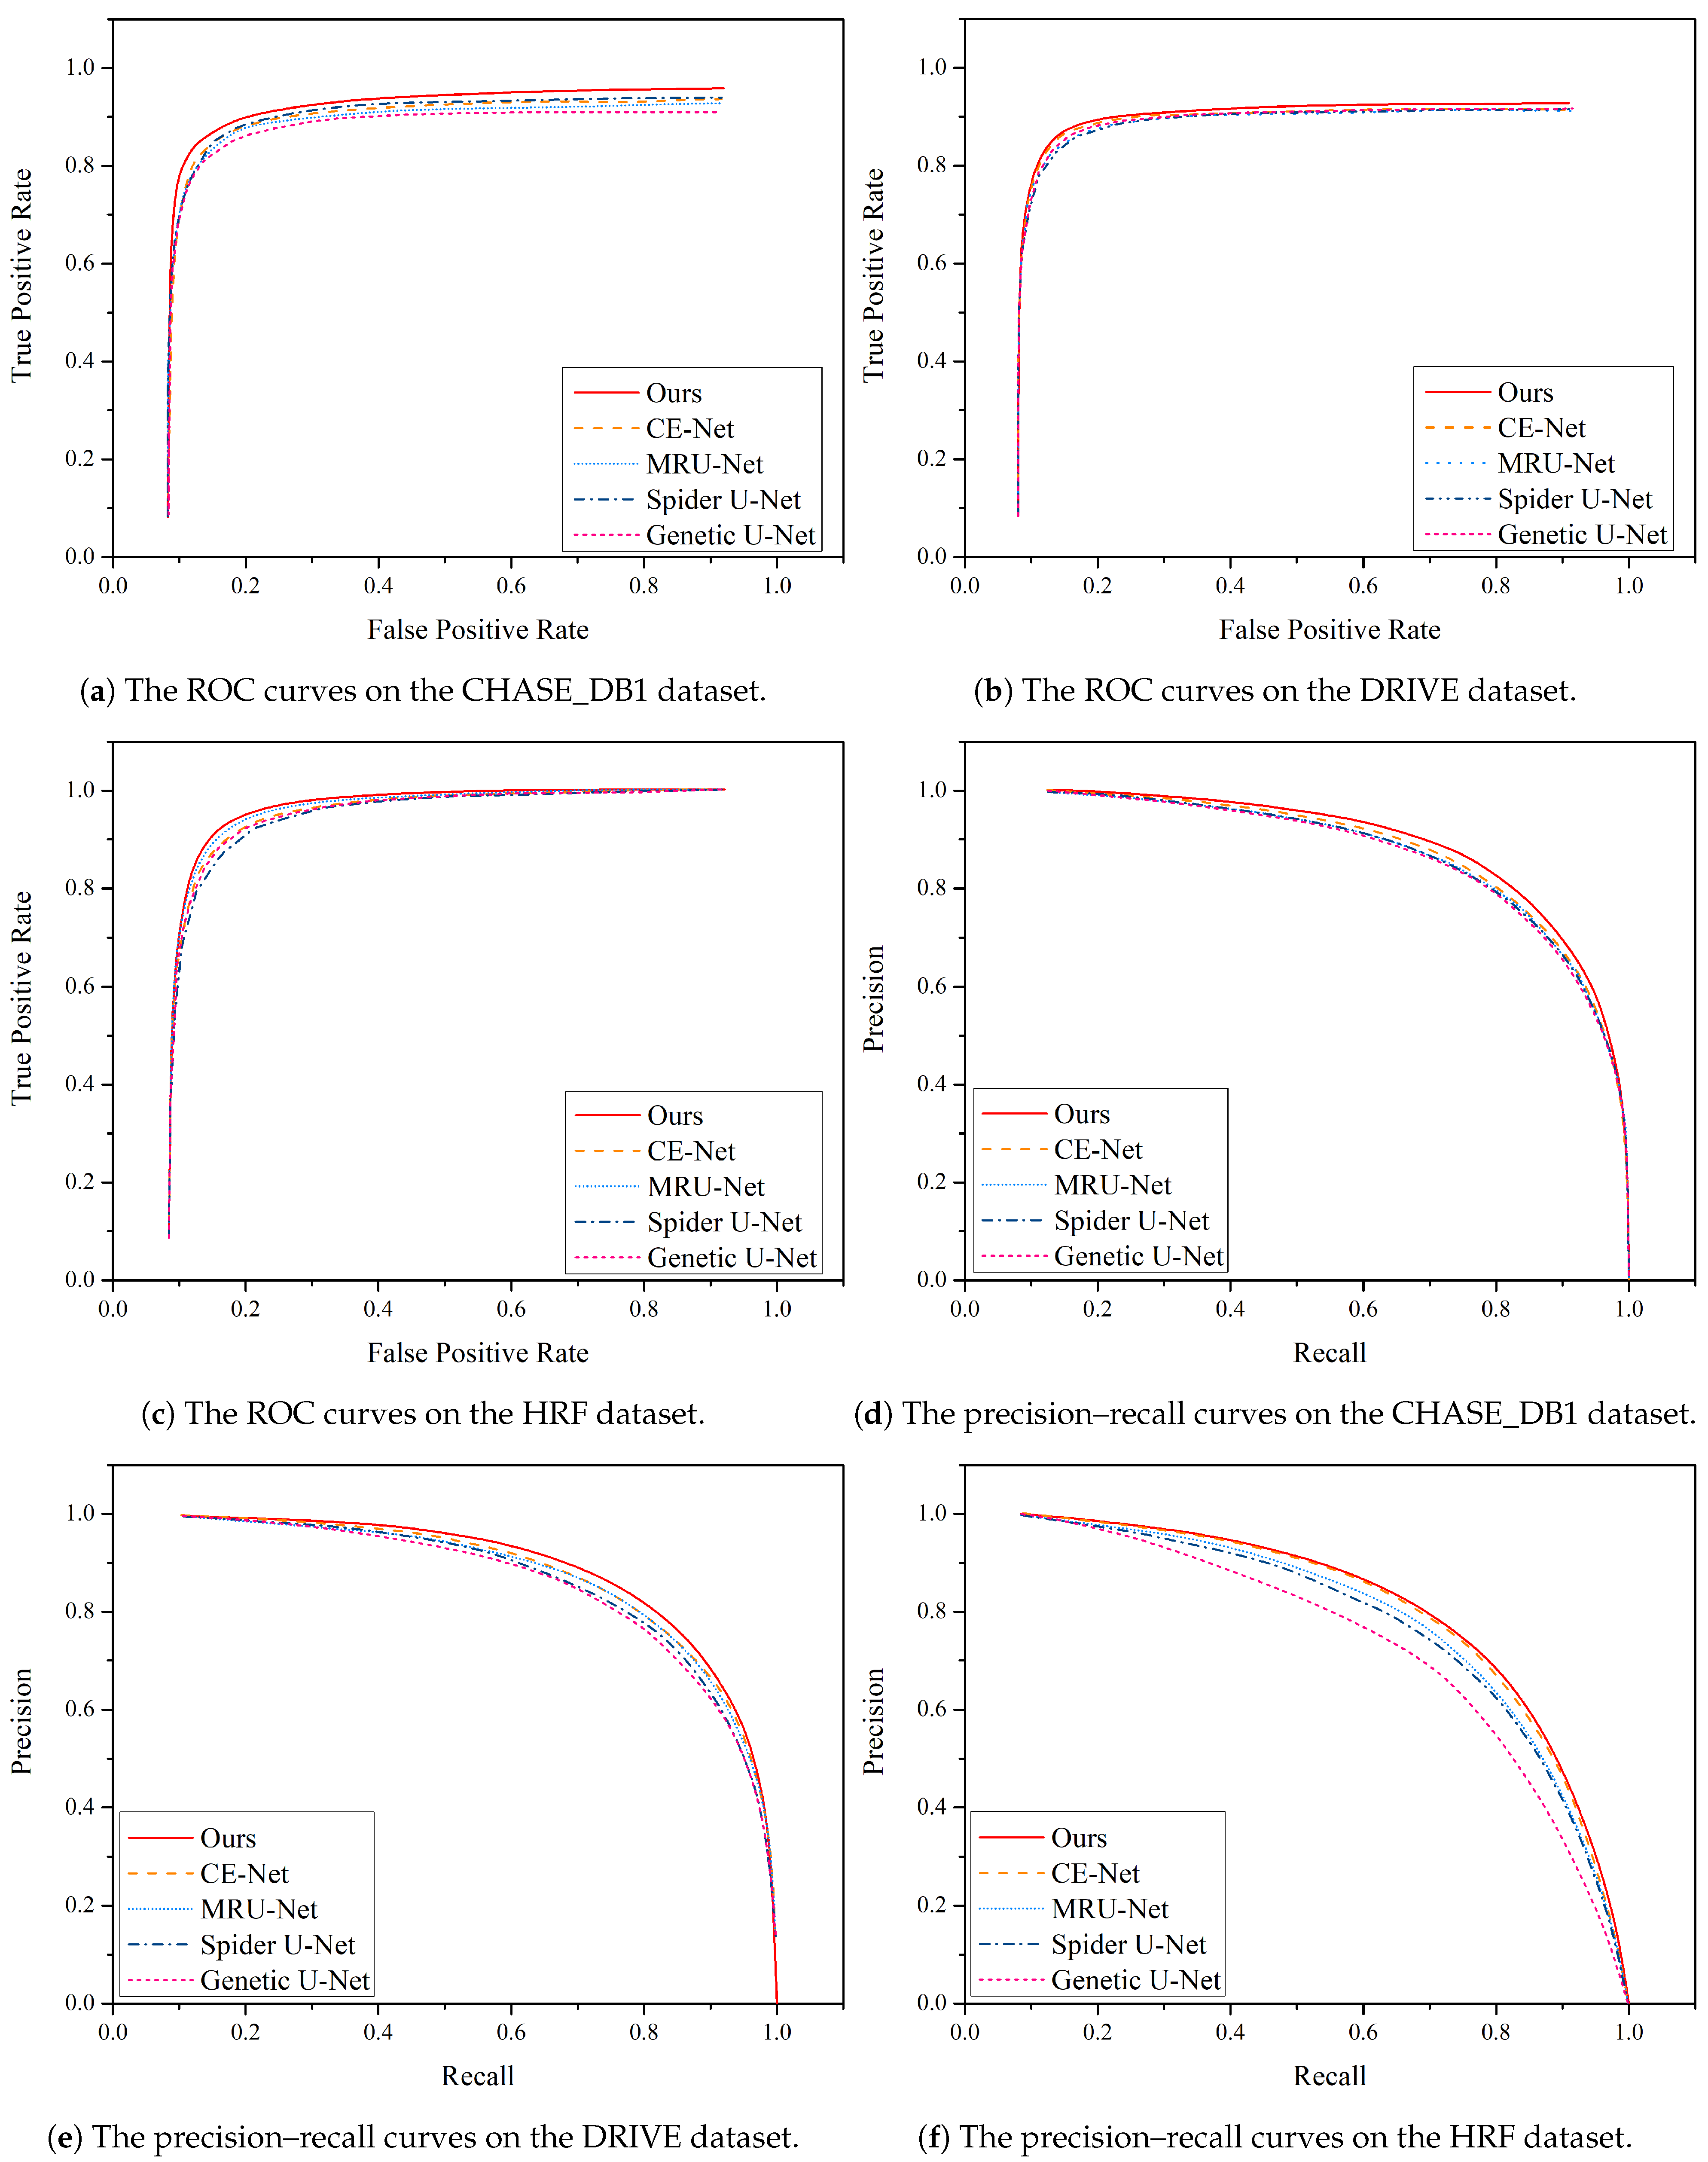
Furthermore, Figure 11 illustrates a comparison of the precision–recall curves and ROC curves for different algorithms on the DRIVE and CHASE_DB1 datasets. These curves provide valuable insights into the performance of the algorithms in question.
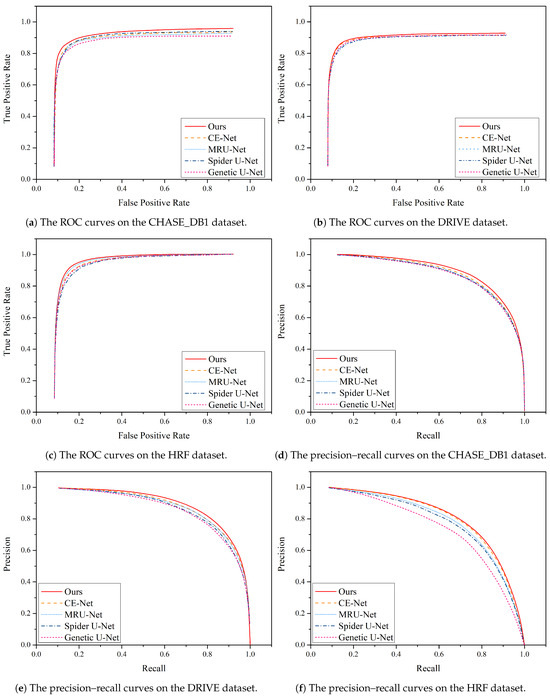
Figure 11.
Performance comparison of the precision–recall curve and ROC curve between MPCCN and various prior approaches on the CHASE_DB1, DRIVE, and HRF datasets.
4.8. Ablation Study
To further validate the effectiveness of each module in the proposed algorithm, ablation experiments were conducted on the DRIVE and CHASE_DB1 datasets. The experimental results are presented in Table 6, and they reveal that M1 has already achieved commendable accuracy in RVS, though there remains potential for enhancement.
Table 6.
Ablation study of the key components on the two datasets. M1 (multi-scale input module), M2 (weighted-shared residual module), and M3 (guided attention module).
M2 demonstrated improvements across various metrics compared to M1, indicating that the WRM contributes to increased segmentation precision. Subsequently, M3 exhibited further enhancement over M2, suggesting that the GAM effectively extracts multi-scale vessel information. Additionally, M4 showed a notable improvement in all metrics compared to M3, highlighting that the GAM module mitigates the impact of background noise by integrating encoded information from different levels, thereby achieving a high-precision segmentation of small vessels. The aforementioned results substantiate the effectiveness and rationality of the MPCCN framework. The progressive performance improvements from M1 to M4 indicate the efficacy of the proposed modules in enhancing the U-Net algorithm. Notably, M4 achieved the highest AUC value, signifying that MPCCN excels in RVS. It accurately delineated both primary and small vessels while maintaining the connectivity of segmented vessels.
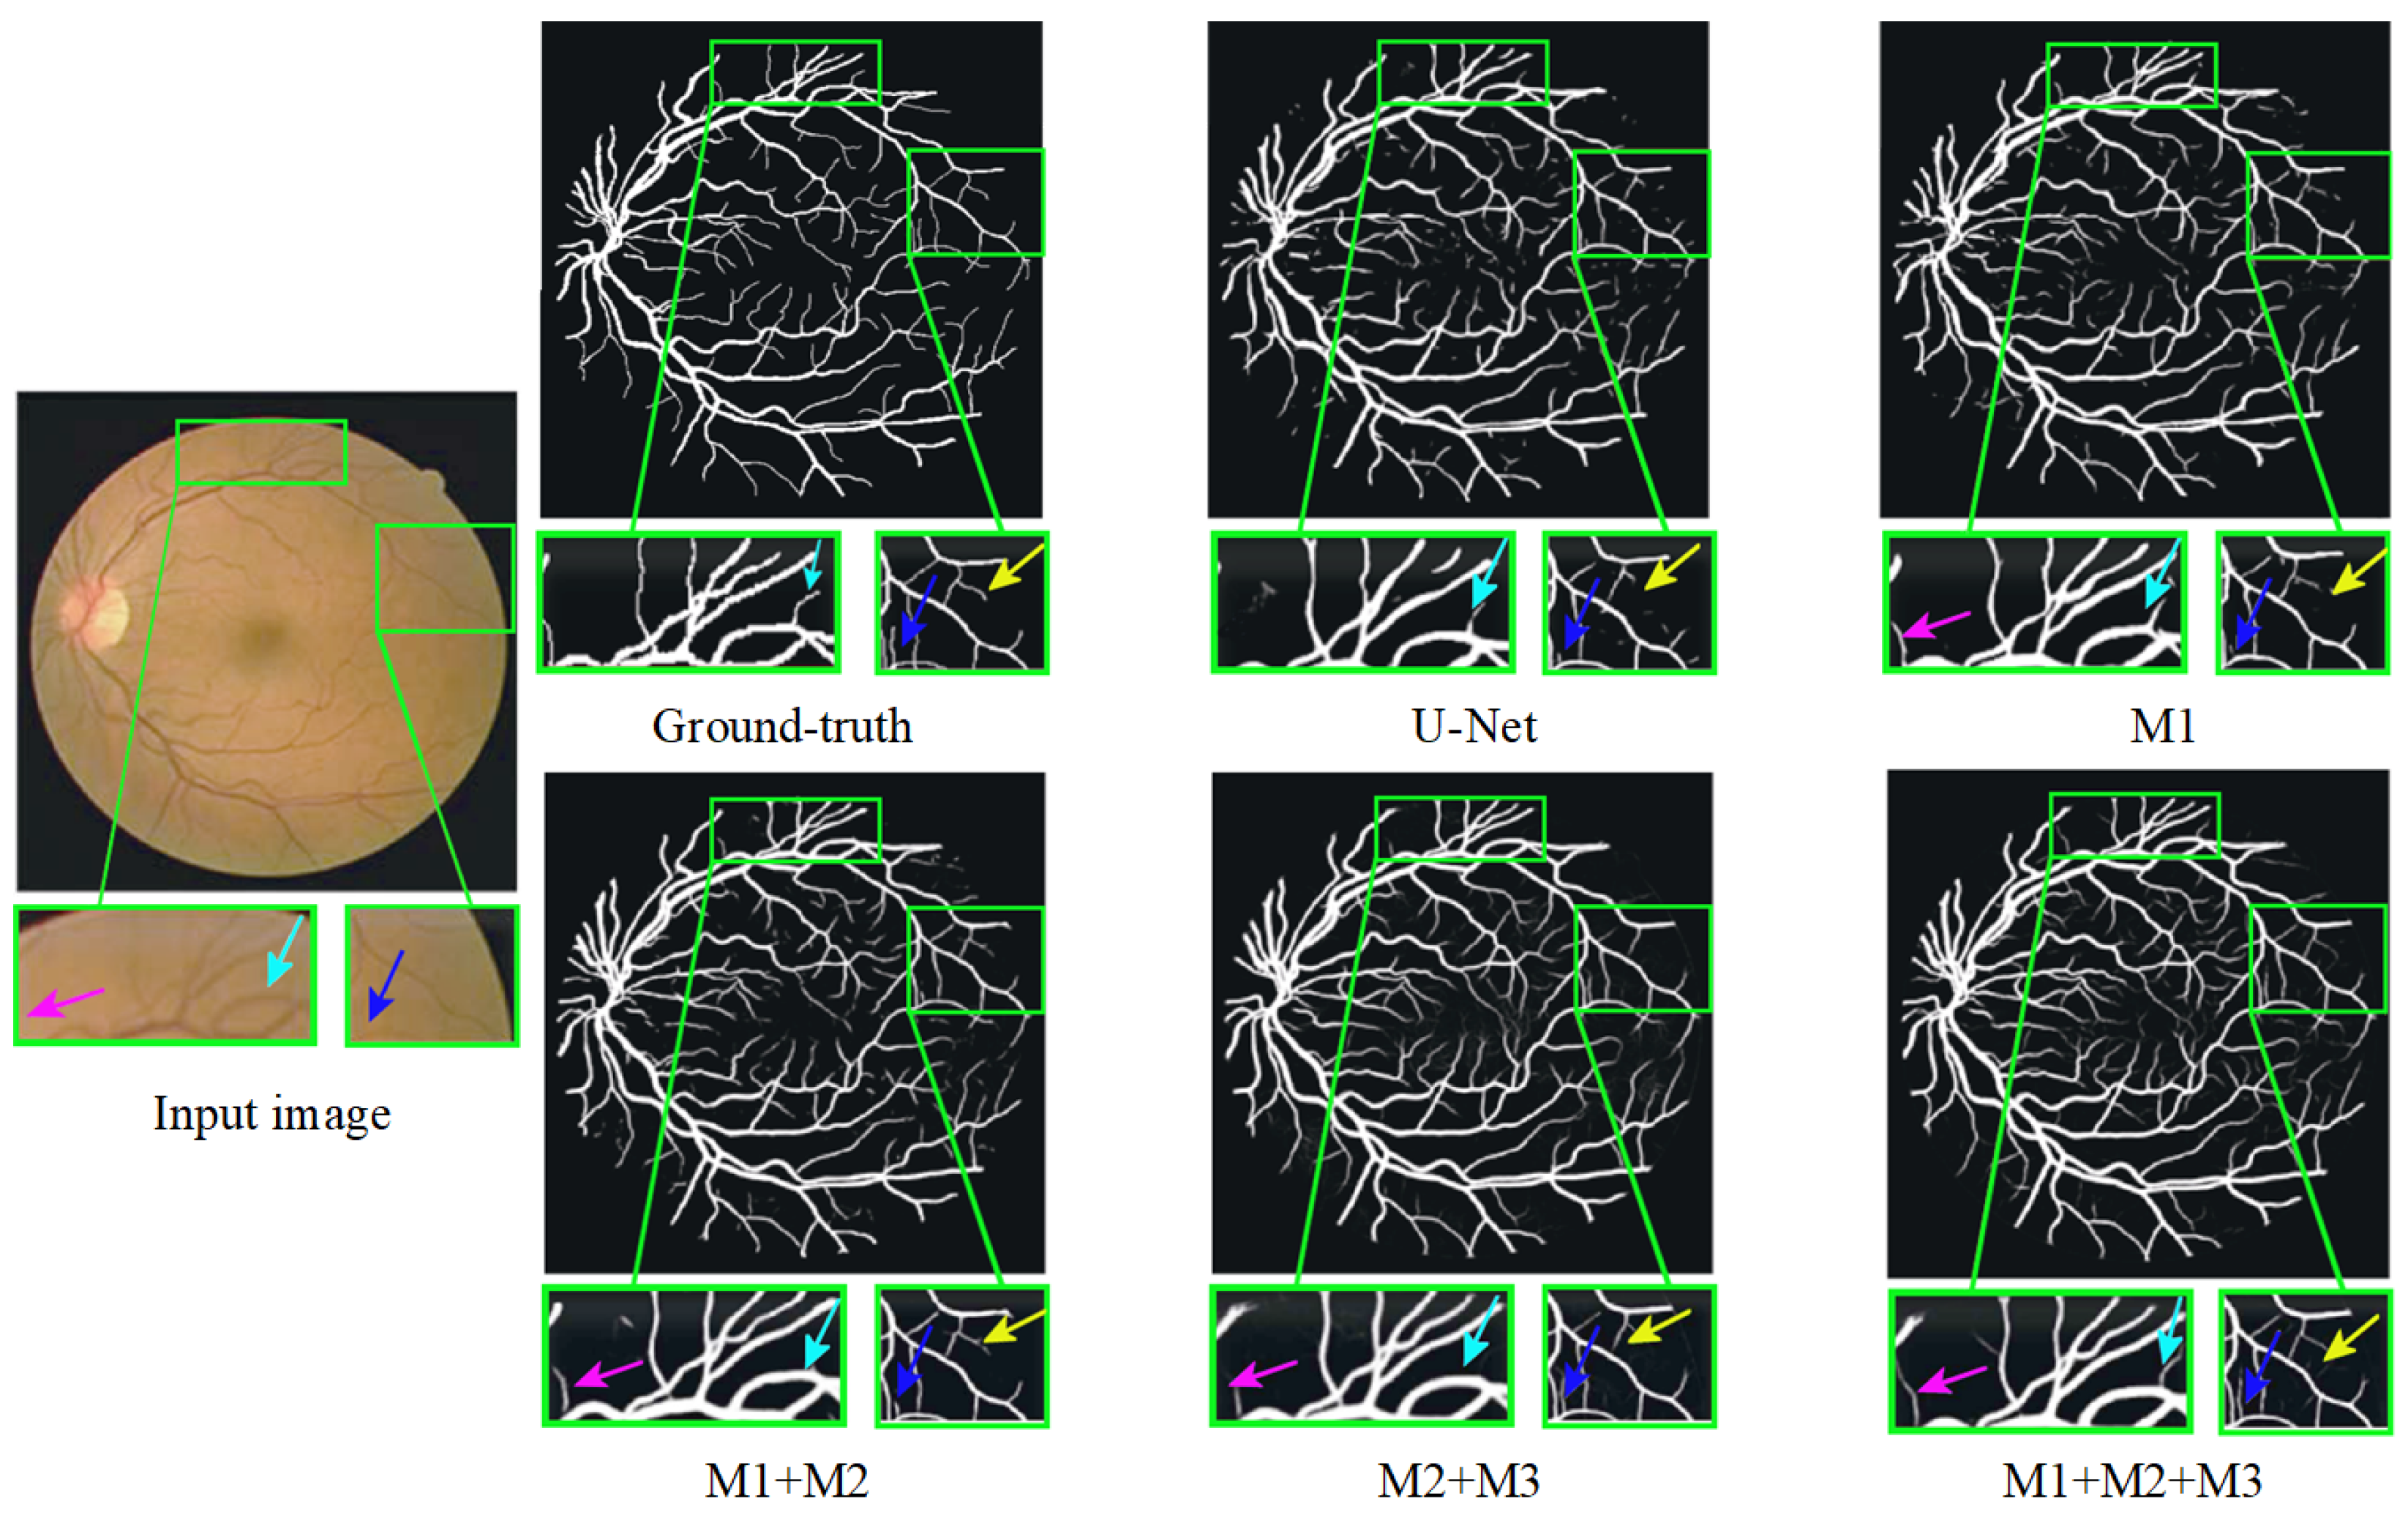
Furthermore, Figure 12 presents a qualitative comparison of the segmentation results produced by different modules within MPCCN. Each segmented image included two enlarged local detail views, allowing for a closer examination of specific areas. The segmentation performance of the individual modules in MPCCN varied, particularly when one or two modules were combined to evaluate their effect on the network’s overall performance. Notably, the combined use of all modules yielded significantly better results compared to any individual module, especially in the segmentation of microvessels. This demonstrates that the integration of multiple components enhances the network’s ability to capture fine details. In conclusion, MPCCN was proven to be a robust and highly accurate algorithm for RVS.
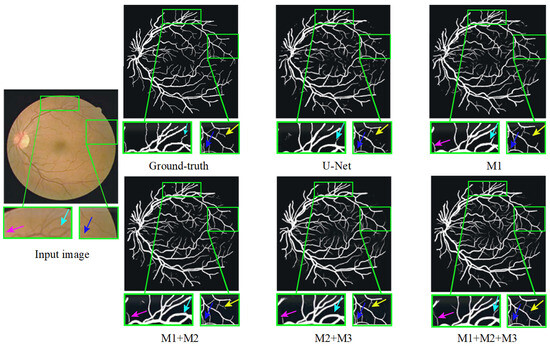
Figure 12.
Ablation study of different modules on the DRIVE dataset.
4.9. Computational Complexity
In medical clinical applications, there are often insufficient hardware computing resources available to deploy and run high-complexity networks. Therefore, the computational complexity of deep learning networks is an important factor in evaluating their potential for real-world applications. Two key metrics commonly used to assess this complexity are the number of network parameters Q and floating-point operations (FLOPs) [72]. These metrics provide insight into both the memory requirements and the computational demands of a network. The number of parameters Q is defined as follows:
And the number of FLOPs is given by
where and represent the number of input and output feature map channels, respectively; K represents the size of the convolution kernel; and H and W represent the height and width of the feature map, respectively. Table 7 includes a comparison, using both FLOPs and parameter count Q, of the computational complexity of the proposed MPCCN network with other RVS networks on the STARE dataset. As shown in the table, MPCCN achieved a relatively low FLOPs value of 13.1 M and a Q of 7.1 M, making it computationally efficient while maintaining high segmentation performance. Specifically, MPCCN achieved an accuracy of 0.9775, a specificity of 0.9725, a sensitivity of 0.9888, an F1-score of 0.9055, and an AUC of 0.9905, all while requiring only 0.31 s per image. Compared to other networks, MPCCN struck an excellent balance between low computational complexity and strong performance. For instance, Genetic U-Net produced a higher FLOPs value of 17.5 M and a parameter count of 9.8 M, requiring more computation time, i.e., 1.35 s, while delivering comparable segmentation results. Similarly, ARDC-UNet had a higher FLOPs and parameter count, but it required a much longer processing time of 2.25 s. In contrast, MPCCN outperformed these networks in terms of computational efficiency and segmentation accuracy, making it highly suitable for resource-constrained clinical applications. This demonstrates that the proposed network can achieve high accuracy without requiring a large number of parameters or excessive computational power, highlighting its practical applicability in real-world medical scenarios.
Table 7.
Performance comparison of MPCCN against prior algorithms on the STARE dataset, including FLOPs and Q.
5. Limitations and Future Work
While the MPCCN model demonstrated significant improvements in RVS, it still faced some limitations that need to be addressed. Firstly, the model’s performance is highly dependent on the diversity and size of the dataset even though data augmentation techniques were applied to overcome the limited availability of annotated retinal images. However, the lack of large-scale and diverse datasets covering different ethnicities, age groups, and retinal conditions may still limit the model’s generalizability. The performance could potentially drop when applied to unseen data from different populations or with more complex pathologies. Secondly, retinal images can vary significantly in their visual appearance due to non-uniform illumination conditions, which can impact the clarity of vascular structures. Images taken under inconsistent lighting or low-quality fundus camera images may require pre-adjustments to enhance visibility before being fed into the network. Addressing non-uniform illumination is critical as uncorrected images can reduce the model’s segmentation accuracy, making this an additional limitation that should be considered.
However, the types of data used in this study were somewhat limited. In addition to the commonly used color fundus images, there are also scanning laser ophthalmoscope (SLO) retinal images and optical coherence tomography (OCT) retinal images. Compared to standard color fundus images, SLO and OCT images contain more information and can more effectively reflect the fine structure, especially OCT images that clearly display the 10 layers of the retina. In short, the combination of MPCCN with multi-modal medical imaging techniques to further improve the accuracy of retinal disease diagnosis should be explored. Fusing information from multiple imaging modalities may provide a more comprehensive understanding of retinal conditions and lead to better diagnostic outcomes.
6. Conclusions
In this study, we introduced a multi-scale position-aware cyclic convolutional network (MPCCN) to address key challenges in RVS, particularly with respect to intricate textures, small vessels, and low-contrast imaging. Our approach integrates a multi-scale input module within the encoder pathway, enhancing the receptive field while maintaining precise location metrics. The weighted-shared residual module further enriches feature extraction, mitigating the risk of detail loss during downsampling. Additionally, the guided attention module refines segmentation by reducing background noise, particularly benefiting the detection of small vessels. Extensive experiments on the STARE, DRIVE, CHASE_DB1, and HRF datasets demonstrate that MPCCN consistently outperforms existing techniques in accurately segmenting small vessels. These results highlight the potential of MPCCN as a valuable tool for improved diagnostic accuracy in ophthalmology.
Author Contributions
Conceptualization, methodology, software, formal analysis, validation, and data processing, C.X.; writing—original draft preparation, C.X. and J.L.; investigation, resources, supervision, and project administration, C.X. and J.L.; writing—review and editing visualization, C.X. and J.L. All authors have read and agreed to the published version of the manuscript.
Funding
This research received no external funding.
Data Availability Statement
The datasets and code will be made available upon request through the first and corresponding authors.
Acknowledgments
The authors wish to thank He Zhonglin and Deng Moyun of Huanggang Normal University for providing the scientific research facility in the department of computer science.
Conflicts of Interest
The authors declare no conflicts of interest.
References
- Wu, Y.; He, M.; Huang, W.; Wang, W. Associations between retinal microvascular flow, geometry, and progression of diabetic retinopathy in type 2 diabetes: A 2-year longitudinal study. Acta Diabetol. 2024, 61, 195–204. [Google Scholar] [CrossRef] [PubMed]
- Kong, H.; Lou, W.; Li, J.; Zhang, X.; Jin, H.; Zhao, C. Retinal Vascular Geometry in Hypertension: CSLO-Based Method. Ophthalmol. Ther. 2023, 12, 939–952. [Google Scholar] [CrossRef]
- Pacal, I. A novel Swin transformer approach utilizing residual multi-layer perceptron for diagnosing brain tumors in MRI images. Int. J. Mach. Learn. Cybern. 2024, 15, 3579–3597. [Google Scholar] [CrossRef]
- Pacal, I. MaxCerVixT: A novel lightweight vision transformer-based Approach for precise cervical cancer detection. Knowl.-Based Syst. 2024, 289, 111482. [Google Scholar] [CrossRef]
- Yan, Z.; Yang, X.; Cheng, K.T. A three-stage deep learning model for accurate retinal vessel segmentation. IEEE J. Biomed. Health Inform. 2018, 23, 1427–1436. [Google Scholar] [CrossRef] [PubMed]
- Sinaga, K.P.; Yang, M.S. Unsupervised K-means clustering algorithm. IEEE Access 2020, 8, 80716–80727. [Google Scholar] [CrossRef]
- Li, C.; Ma, W.; Sun, L.; Ding, X.; Huang, Y.; Wang, G.; Yu, Y. Hierarchical deep network with uncertainty-aware semi-supervised learning for vessel segmentation. Neural Comput. Appl. 2022, 34, 3151–3164. [Google Scholar] [CrossRef]
- Dash, J.; Bhoi, N. A thresholding based technique to extract retinal blood vessels from fundus images. Future Comput. Inform. J. 2017, 2, 103–109. [Google Scholar] [CrossRef]
- Tamim, N.; Elshrkawey, M.; Abdel Azim, G.; Nassar, H. Retinal blood vessel segmentation using hybrid features and multi-layer perceptron neural networks. Symmetry 2020, 12, 894. [Google Scholar] [CrossRef]
- McGuire, B.A.; Loomis, R.A.; Burkhardt, A.M.; Lee, K.L.K.; Shingledecker, C.N.; Charnley, S.B.; Cooke, I.R.; Cordiner, M.A.; Herbst, E.; Kalenskii, S.; et al. Detection of two interstellar polycyclic aromatic hydrocarbons via spectral matched filtering. Science 2021, 371, 1265–1269. [Google Scholar] [CrossRef]
- Khawaja, A.; Khan, T.M.; Naveed, K.; Naqvi, S.S.; Rehman, N.U.; Nawaz, S.J. An improved retinal vessel segmentation framework using frangi filter coupled with the probabilistic patch based denoiser. IEEE Access 2019, 7, 164344–164361. [Google Scholar] [CrossRef]
- Graham, S.; Epstein, D.; Rajpoot, N. Dense steerable filter cnns for exploiting rotational symmetry in histology images. IEEE Trans. Med. Imaging 2020, 39, 4124–4136. [Google Scholar] [CrossRef]
- Oliveira, A.; Pereira, S.; Silva, C.A. Retinal vessel segmentation based on fully convolutional neural networks. Expert Syst. Appl. 2018, 112, 229–242. [Google Scholar] [CrossRef]
- Zunair, H.; Hamza, A.B. Sharp U-Net: Depthwise convolutional network for biomedical image segmentation. Comput. Biol. Med. 2021, 136, 104699. [Google Scholar] [CrossRef]
- Zhou, Z.; Rahman Siddiquee, M.M.; Tajbakhsh, N.; Liang, J. Unet++: A nested u-net architecture for medical image segmentation. In Deep Learning in Medical Image Analysis and Multimodal Learning for Clinical Decision Support, Proceedings of the 4th International Workshop, DLMIA 2018, and 8th International Workshop, ML-CDS 2018, Held in Conjunction with MICCAI 2018, Granada, Spain, 20 September 2018; Proceedings 4; Springer: Cham, Switzerlands, 2018; pp. 3–11. [Google Scholar]
- Du, X.; Wang, J.; Sun, W. Densely connected U-Net retinal vessel segmentation algorithm based on multi-scale feature convolution extraction. Med. Phys. 2021, 48, 3827–3841. [Google Scholar] [CrossRef]
- Oktay, O.; Schlemper, J.; Folgoc, L.L.; Lee, M.; Heinrich, M.; Misawa, K.; Mori, K.; McDonagh, S.; Hammerla, N.Y.; Kainz, B.; et al. Attention u-net: Learning where to look for the pancreas. arXiv 2018, arXiv:1804.03999. [Google Scholar]
- Jainish, G.; Jiji, G.W.; Infant, P.A. A novel automatic retinal vessel extraction using maximum entropy based EM algorithm. Multimed. Tools Appl. 2020, 79, 22337–22353. [Google Scholar] [CrossRef]
- Sun, K.; Chen, Y.; Chao, Y.; Geng, J.; Chen, Y. A retinal vessel segmentation method based improved U-Net model. Biomed. Signal Process. Control 2023, 82, 104574. [Google Scholar] [CrossRef]
- Zhu, Y.-F.; Xu, X.; Zhang, X.-D.; Jiang, M.-S. Ccs-unet: A cross-channel spatial attention model for accurate retinal vessel segmentation. Biomed. Opt. Express 2023, 14, 4739–4758. [Google Scholar] [CrossRef]
- Prethija, G.; Katiravan, J. EAMR-Net: A multiscale effective spatial and cross-channel attention network for retinal vessel segmentation. Math. Biosci. Eng. 2024, 21, 4742–4761. [Google Scholar] [CrossRef]
- Chen, Q.; Peng, J.; Zhao, S.; Liu, W. Automatic artery/vein classification methods for retinal blood vessel: A review. Comput. Med. Imaging Graph. 2024, 113, 102355. [Google Scholar] [CrossRef]
- Chen, C.; Chuah, J.H.; Ali, R.; Wang, Y. Retinal vessel segmentation using deep learning: A review. IEEE Access 2021, 9, 111985–112004. [Google Scholar] [CrossRef]
- Dhillon, A.; Verma, G.K. Convolutional neural network: A review of models, methodologies and applications to object detection. Prog. Artif. Intell. 2020, 9, 85–112. [Google Scholar] [CrossRef]
- Ople, J.J.M.; Yeh, P.Y.; Sun, S.W.; Tsai, I.T.; Hua, K.L. Multi-scale neural network with dilated convolutions for image deblurring. IEEE Access 2020, 8, 53942–53952. [Google Scholar] [CrossRef]
- Chen, F.; Wu, F.; Xu, J.; Gao, G.; Ge, Q.; Jing, X.Y. Adaptive deformable convolutional network. Neurocomputing 2021, 453, 853–864. [Google Scholar] [CrossRef]
- Jin, Q.; Meng, Z.; Pham, T.D.; Chen, Q.; Wei, L.; Su, R. DUNet: A deformable network for retinal vessel segmentation. Knowl.-Based Syst. 2019, 178, 149–162. [Google Scholar] [CrossRef]
- Deng, L.; Gong, Y.; Lu, X.; Yi, X.; Ma, Z.; Xie, M. Focus-enhanced scene text recognition with deformable convolutions. In Proceedings of the 2019 IEEE 5th International Conference on Computer and Communications (ICCC), Chengdu, China, 6–9 December 2019; pp. 1685–1689. [Google Scholar]
- Xu, Y.; Fan, Y. Dual-channel asymmetric convolutional neural network for an efficient retinal blood vessel segmentation in eye fundus images. Biocybern. Biomed. Eng. 2022, 42, 695–706. [Google Scholar] [CrossRef]
- Li, J.; Gao, G.; Yang, L.; Liu, Y. GDF-Net: A multi-task symmetrical network for retinal vessel segmentation. Biomed. Signal Process. Control 2023, 81, 104426. [Google Scholar] [CrossRef]
- Zhang, H.; Zhong, X.; Li, Z.; Chen, Y.; Zhu, Z.; Lv, J.; Li, C.; Zhou, Y.; Li, G. TiM-Net: Transformer in M-Net for retinal vessel segmentation. J. Healthc. Eng. 2022, 2022, 9016401. [Google Scholar] [CrossRef]
- Alom, M.Z.; Yakopcic, C.; Hasan, M.; Taha, T.M.; Asari, V.K. Recurrent residual U-Net for medical image segmentation. J. Med. Imaging 2019, 6, 014006. [Google Scholar] [CrossRef]
- Desiani, A.; Erwin; Suprihatin, B.; Agustina, S.B. A robust techniques of enhancement and segmentation blood vessels in retinal image using deep learning. Biomed. Eng. Appl. Basis Commun. 2022, 34, 2250019. [Google Scholar] [CrossRef]
- Zhou, Y.; Chen, Z.; Shen, H.; Zheng, X.; Zhao, R.; Duan, X. A refined equilibrium generative adversarial network for retinal vessel segmentation. Neurocomputing 2021, 437, 118–130. [Google Scholar] [CrossRef]
- Guo, S. CSGNet: Cascade semantic guided net for retinal vessel segmentation. Biomed. Signal Process. Control 2022, 78, 103930. [Google Scholar] [CrossRef]
- Huang, Y.; Deng, T. Multi-level spatial-temporal and attentional information deep fusion network for retinal vessel segmentation. Phys. Med. Biol. 2023, 68, 195026. [Google Scholar] [CrossRef] [PubMed]
- Ronneberger, O.; Fischer, P.; Brox, T. U-net: Convolutional networks for biomedical image segmentation. In Medical Image Computing and Computer-Assisted Intervention–MICCAI 2015, Proceedings of the 18th International Conference, Munich, Germany, 5–9 October 2015; Proceedings, Part III 18; Springer: Cham, Switzerlands, 2015; pp. 234–241. [Google Scholar]
- Schlemper, J.; Oktay, O.; Schaap, M.; Heinrich, M.; Kainz, B.; Glocker, B.; Rueckert, D. Attention gated networks: Learning to leverage salient regions in medical images. Med. Image Anal. 2019, 53, 197–207. [Google Scholar] [CrossRef]
- Zhou, Z.; Siddiquee, M.M.R.; Tajbakhsh, N.; Liang, J. Unet++: Redesigning skip connections to exploit multiscale features in image segmentation. IEEE Trans. Med Imaging 2019, 39, 1856–1867. [Google Scholar] [CrossRef]
- Guo, C.; Szemenyei, M.; Pei, Y.; Yi, Y.; Zhou, W. SD-UNet: A structured dropout U-Net for retinal vessel segmentation. In Proceedings of the 2019 IEEE 19th International Conference on Bioinformatics and Bioengineering (BIBE), Athens, Greece, 28–30 October 2019; pp. 439–444. [Google Scholar]
- He, K.; Zhang, X.; Ren, S.; Sun, J. Deep residual learning for image recognition. In Proceedings of the IEEE Conference on Computer Vision and Pattern Recognition, Las Vegas, NV, USA, 27–30 June 2016; pp. 770–778. [Google Scholar]
- Gu, Z.; Cheng, J.; Fu, H.; Zhou, K.; Hao, H.; Zhao, Y.; Zhang, T.; Gao, S.; Liu, J. Ce-net: Context encoder network for 2d medical image segmentation. IEEE Trans. Med Imaging 2019, 38, 2281–2292. [Google Scholar] [CrossRef]
- Yang, D.; Zhao, H.; Han, T. Learning feature-rich integrated comprehensive context networks for automated fundus retinal vessel analysis. Neurocomputing 2022, 491, 132–143. [Google Scholar] [CrossRef]
- Soomro, T.A.; Afifi, A.J.; Gao, J.; Hellwich, O.; Zheng, L.; Paul, M. Strided fully convolutional neural network for boosting the sensitivity of retinal blood vessels segmentation. Expert Syst. Appl. 2019, 134, 36–52. [Google Scholar] [CrossRef]
- Jiang, Y.; Zhang, H.; Tan, N.; Chen, L. Automatic retinal blood vessel segmentation based on fully convolutional neural networks. Symmetry 2019, 11, 1112. [Google Scholar] [CrossRef]
- He, X.; Wang, T.; Yang, W. Research on Retinal Vessel Segmentation Algorithm Based on a Modified U-Shaped Network. Appl. Sci. 2024, 14, 465. [Google Scholar] [CrossRef]
- Kar, M.K.; Neog, D.R.; Nath, M.K. Retinal vessel segmentation using multi-scale residual convolutional neural network (MSR-Net) combined with generative adversarial networks. Circuits, Syst. Signal Process. 2023, 42, 1206–1235. [Google Scholar] [CrossRef]
- Ryu, J.; Rehman, M.U.; Nizami, I.F.; Chong, K.T. SegR-Net: A deep learning framework with multi-scale feature fusion for robust retinal vessel segmentation. Comput. Biol. Med. 2023, 163, 107132. [Google Scholar] [CrossRef]
- Deng, X.; Ye, J. A retinal blood vessel segmentation based on improved D-MNet and pulse-coupled neural network. Biomed. Signal Process. Control 2022, 73, 103467. [Google Scholar] [CrossRef]
- Hussain, S.; Guo, F.; Li, W.; Shen, Z. DilUnet: A U-net based architecture for blood vessels segmentation. Comput. Methods Programs Biomed. 2022, 218, 106732. [Google Scholar] [CrossRef] [PubMed]
- Yao, J.; Xing, W.; Wang, D.; Xing, J.; Wang, L. Active dropblock: Method to enhance deep model accuracy and robustness. Neurocomputing 2021, 454, 189–200. [Google Scholar] [CrossRef]
- Hu, J.; Shen, L.; Sun, G. Squeeze-and-excitation networks. In Proceedings of the IEEE Conference on Computer Vision and Pattern Recognition, Salt Lake City, UT, USA, 18–23 June 2018; pp. 7132–7141. [Google Scholar]
- Cao, Y.; Xu, J.; Lin, S.; Wei, F.; Hu, H. Gcnet: Non-local networks meet squeeze-excitation networks and beyond. In Proceedings of the IEEE/CVF International Conference on Computer Vision Workshops, Seoul, Republic of Korea, 27–28 October 2019; pp. 1971–1980. [Google Scholar]
- Wang, Z.; Zou, N.; Shen, D.; Ji, S. Non-local u-nets for biomedical image segmentation. In Proceedings of the AAAI Conference on Artificial Intelligence, New York, NY, USA, 7–12 February 2020; Volume 34, pp. 6315–6322. [Google Scholar]
- Wang, Q.; Wu, B.; Zhu, P.; Li, P.; Zuo, W.; Hu, Q. ECA-Net: Efficient channel attention for deep convolutional neural networks. In Proceedings of the IEEE/CVF Conference on Computer Vision and Pattern Recognition, Seattle, WA, USA, 13–19 June 2020; pp. 11534–11542. [Google Scholar]
- Staal, J.; Abràmoff, M.D.; Niemeijer, M.; Viergever, M.A.; Van Ginneken, B. Ridge-based vessel segmentation in color images of the retina. IEEE Trans. Med Imaging 2004, 23, 501–509. [Google Scholar] [CrossRef]
- Liskowski, P.; Krawiec, K. Segmenting retinal blood vessels with deep neural networks. IEEE Trans. Med Imaging 2016, 35, 2369–2380. [Google Scholar] [CrossRef]
- Owen, C.G.; Rudnicka, A.R.; Mullen, R.; Barman, S.A.; Monekosso, D.; Whincup, P.H.; Ng, J.; Paterson, C. Measuring retinal vessel tortuosity in 10-year-old children: Validation of the computer-assisted image analysis of the retina (CAIAR) program. Investig. Ophthalmol. Vis. Sci. 2009, 50, 2004–2010. [Google Scholar] [CrossRef]
- Jebaseeli, T.J.; Durai, C.A.D.; Peter, J.D. Retinal blood vessel segmentation from diabetic retinopathy images using tandem PCNN model and deep learning based SVM. Optik 2019, 199, 163328. [Google Scholar] [CrossRef]
- Rahman, Z.; Bhutto, J.A.; Aamir, M.; Dayo, Z.A.; Guan, Y. Exploring a radically new exponential retinex model for multi-task environments. J. King Saud Univ.-Comput. Inf. Sci. 2023, 35, 101635. [Google Scholar] [CrossRef]
- Russakovsky, O.; Deng, J.; Su, H.; Krause, J.; Satheesh, S.; Ma, S.; Huang, Z.; Karpathy, A.; Khosla, A.; Bernstein, M.; et al. Imagenet large scale visual recognition challenge. Int. J. Comput. Vis. 2015, 115, 211–252. [Google Scholar] [CrossRef]
- Naik, N.; Reddy, P.P. ARDC-UNet retinal vessel segmentation with adaptive residual deformable convolutional based U-Net. Multimed. Tools Appl. 2024, 83, 1–22. [Google Scholar] [CrossRef]
- Ni, J.; Sun, H.; Xu, J.; Liu, J.; Chen, Z. A feature aggregation and feature fusion network for retinal vessel segmentation. Biomed. Signal Process. Control 2023, 85, 104829. [Google Scholar] [CrossRef]
- Shi, Z.; Li, Y.; Zou, H.; Zhang, X. Tcu-net: Transformer embedded in convolutional u-shaped network for retinal vessel segmentation. Sensors 2023, 23, 4897. [Google Scholar] [CrossRef]
- Ding, H.; Cui, X.; Chen, L.; Zhao, K. MRU-Net: A U-shaped network for retinal vessel segmentation. Appl. Sci. 2020, 10, 6823. [Google Scholar] [CrossRef]
- Lee, K.; Sunwoo, L.; Kim, T.; Lee, K.J. Spider U-Net: Incorporating inter-slice connectivity using LSTM for 3D blood vessel segmentation. Appl. Sci. 2021, 11, 2014. [Google Scholar] [CrossRef]
- Wei, J.; Zhu, G.; Fan, Z.; Liu, J.; Rong, Y.; Mo, J.; Li, W.; Chen, X. Genetic U-Net: Automatically designed deep networks for retinal vessel segmentation using a genetic algorithm. IEEE Trans. Med Imaging 2021, 41, 292–307. [Google Scholar] [CrossRef] [PubMed]
- Guo, C.; Szemenyei, M.; Yi, Y.; Wang, W.; Chen, B.; Fan, C. Sa-unet: Spatial attention u-net for retinal vessel segmentation. In Proceedings of the 2020 25th International Conference on Pattern Recognition (ICPR), Milan, Italy, 10–15 January 2021; pp. 1236–1242. [Google Scholar]
- Islam, M.T.; Khan, H.A.; Naveed, K.; Nauman, A.; Gulfam, S.M.; Kim, S.W. LUVS-Net: A Lightweight U-Net Vessel Segmentor for Retinal Vasculature Detection in Fundus Images. Electronics 2023, 12, 1786. [Google Scholar] [CrossRef]
- Panchal, S.; Kokare, M. ResMU-Net: Residual Multi-kernel U-Net for blood vessel segmentation in retinal fundus images. Biomed. Signal Process. Control 2024, 90, 105859. [Google Scholar] [CrossRef]
- Yue, C.; Ye, M.; Wang, P.; Huang, D.; Lu, X. SRV-GAN: A generative adversarial network for segmenting retinal vessels. Math. Biosci. Eng 2022, 19, 9948–9965. [Google Scholar] [CrossRef]
- Molchanov, P.; Tyree, S.; Karras, T.; Aila, T.; Kautz, J. Pruning convolutional neural networks for resource efficient inference. arXiv 2016, arXiv:1611.06440. [Google Scholar]
Disclaimer/Publisher’s Note: The statements, opinions and data contained in all publications are solely those of the individual author(s) and contributor(s) and not of MDPI and/or the editor(s). MDPI and/or the editor(s) disclaim responsibility for any injury to people or property resulting from any ideas, methods, instructions or products referred to in the content. |
© 2024 by the authors. Licensee MDPI, Basel, Switzerland. This article is an open access article distributed under the terms and conditions of the Creative Commons Attribution (CC BY) license (https://creativecommons.org/licenses/by/4.0/).