Article

Bridging 3D Confinement and 2D Correlations in Counterion Layers at Charged Interfaces: An Extended Percus Relation from First Principles

Laboratory of Statistical Physics, Kochi University of Technology, Tosa-Yamada, Kochi 782-8502, Japan
Symmetry 2025, 17(11), 1783; https://doi.org/10.3390/sym17111783
Submission received: 15 September 2025 / Revised: 13 October 2025 / Accepted: 14 October 2025 / Published: 22 October 2025
(This article belongs to the Section Physics)

Abstract

We develop a first-principles theory that bridges three-dimensional (3D) confinement and two-dimensional (2D) in-plane correlations in counterion layers at oppositely charged interfaces. The system is controlled by two independent coupling constants. While a 3D parameter ( γ ) for perpendicular localization varies with the strength and direction of the applied electric field, a 2D parameter ( Γ ) for lateral correlations depends solely on system-specific conditions. This independence allows for strongly coupled yet noncrystalline liquid states. Our theoretical framework is based on a hybrid of density functional and statistical field theory, thereby yielding an extended Percus relation that, unlike its conventional counterpart for uniform 2D liquids, is valid for the spatially inhomogeneous density profiles. This extension is critical, as it establishes a direct connection between the 3D confinement and the resulting 2D in-plane structure. Numerical investigations of this relation reveal key in-plane structural features in the strong 3D coupling limit ( γ ): a geometric length scale, the minimal inter-particle separation ( d min ), governs both the first peak of the radial distribution function and the wavelength ( λ ) of its oscillatory tail. These findings clarify that in-plane order in these strongly coupled counterion liquids is determined by a geometric constraint rather than any crystalline symmetry.

1. Introduction

Highly charged objects carrying a huge amount of surface charges, such as colloids and electrodes, create strongly inhomogeneous ionic environments by attracting a dense layer of oppositely charged counterions [1,2,3,4,5,6]. In the strong coupling regime, typically observed when multivalent counterions are surrounded by a solvent with low permittivity, most counterions localize near the interface, forming a system that resembles a two-dimensional (2D) one-component plasma (OCP) layer neutralized by the charged surface [1,2,3,4,5,6,7,8,9]. Despite the success of strong coupling theories [2,3,4,5,10,11,12,13,14,15,16,17,18,19,20,21] in predicting macroscopic phenomena such as counterion-mediated attraction between like-charged objects, a fundamental and quantitative understanding of the microscopic liquid structure of these localized counterions has yet to be fully achieved. The structure of this strongly correlated liquid is still to be characterized, particularly in systems where counterions are localized perpendicular to the interface while remaining fluid in-plane. This, in turn, calls for revisiting detailed and quantitative investigations of lateral density modulations in strongly coupled counterion liquids from the perspective of the 2D OCP [7,8,9,22,23,24,25,26,27,28,29,30,31,32,33].
Interfacial structure exhibits marked complexity and controllability under an applied electric field, a scenario widely investigated in melt systems including room temperature ionic liquids at electrode interfaces [34,35,36,37]. Molecular simulations in this context, for example, have revealed a detailed picture of electrically driven ordering, where a precursor “pre-ordering” phenomenon precedes an abrupt transition to a crystalline state [37]. While these insights from melt systems are valuable, similar principles of correlation-driven ordering are widely observed experimentally [38,39,40,41,42,43,44] in our primary subject: ionic solutions containing counterions. In such ionic solutions, applying an electric potential difference can increase the surface charge density and thus the electrostatic coupling strength, enabling systematic tuning from weak to strong coupling. X-ray reflectivity experiments have directly captured the resulting changes in interfacial ion density and their influence on in-plane structural organization [38]. It has been found that counterions in ionic solutions also form compact, laterally organized structures at oppositely charged interfaces. Crucially, however, these experimentally observed structures are often incommensurate with any underlying surface lattice and are not necessarily crystalline, leaving the nature of the more general, strongly correlated liquid states to be fully explored [38,39,40,41,42,43,44]. These observations highlight the diversity of Coulomb-driven ordering across different systems, and understanding this diversity within a unified theoretical framework calls for a clearer theoretical perspective.
Collectively, insights from theory, simulation, and experiment converge on a significant point that has received surprisingly little attention in theoretical treatments: the system’s behavior is governed by the interplay of two independent coupling parameters, Γ and γ . The two-dimensional (2D) coupling constant Γ governs in-plane correlations and depends solely on system-specific conditions, such as temperature T, dielectric permittivity ϵ , and counterion valence q [2,3,4,5,10,11,12,13,14,15,16,17,18,19,20,21,22,23,24,25,26,27,28,29,30,31,32,33]. In contrast, the three-dimensional (3D) coupling constant γ controls the degree of localization perpendicular to charged interfaces and varies with the surface charge density of highly charged objects or with the strength and direction of the applied electric field, along with the above system conditions. Strong confinement (large γ ) does not necessarily imply strong in-plane coupling (large Γ ). This decoupling enables noncrystalline liquid states in which counterions are tightly bound to the surface yet remain fluid laterally. The 2D Wigner crystal that emerges in the 2D OCP beyond Γ m 140 [32,33] is a singular limiting case, not the generic outcome of strongly coupled counterions. Experimental and simulation studies can easily cover a regime where γ becomes large by applying an external electric field while maintaining Γ < Γ m , a situation beyond the scope of lattice-based descriptions [2,15,16,17].
To address the regime, we employ a unified framework that combines density functional theory (DFT) with statistical field theory [21,45,46]. While the conventional 2D Percus relation [47,48] offers a powerful description of in-plane correlations, its validity is strictly limited to uniform liquids. This poses a fundamental challenge for charged interfaces, where counterions are inherently organized into a spatially inhomogeneous density profile perpendicular to the surface. Our hybrid approach resolves this challenge by yielding a first-principles extended Percus relation, the central result of this work. This extension is specifically derived for such inhomogeneous systems, establishing a direct, quantitative link between the 3D counterion confinement and the resulting 2D in-plane liquid structure. It is this 3D-to-2D bridge that provides new structural insights into strongly coupled counterion systems, as our relation reduces to the conventional one only in the limiting case of infinite 3D coupling ( γ ). We then quantify how density–density correlation functions evolve with Γ and show that their salient features reflect the local geometry rather than crystalline symmetry. For this quantitative assessment, we employ the hypernetted-chain (HNC) approximation [48] in the 2D OCP setting, thereby clarifying the structural nature of strongly correlated counterion liquids.
The remainder of this paper is organized as follows. Section 2 introduces the system and relevant parameters. Section 3 develops the analytical formulation based on the hybrid theory and establishes, from first principles, the extended Percus relation. Section 4 reports numerical results for the correlation function and structure factor, also offering a quantitative assessment of structural features in the 2D OCP. Section 5 concludes with implications and future directions.

2. System Setup: Charged Plate with Counterions Only

The system considered here consists of a negatively charged plate with area A and dissociated q-valent cations (counterions). Let N and σ denote the total number of counterions and the smeared surface number density of fixed charges on the plate, respectively. From the condition of global charge neutrality, N q = A σ , it follows that
A N = q σ .
Here, A / N represents the area assigned to each particle, assuming all counterions are confined to the plate. The Wigner–Seitz (WS) radius a in the counterion systems is related to this area as follows [2,15,16,17]:
A N = π a 2 .
In what follows, unless otherwise noted, all lengths are expressed in units of the WS radius a. Correspondingly, we introduce the rescaled area density σ ˜ of counterions,
σ ˜ = N a 2 A ,
which, due to Equations (1) and (2), reads
σ ˜ = σ a 2 q = 1 π .
We also define the rescaled position vector r = x y z T as r   = R / a using the unscaled coordinate vector R = X Y Z T :
r = x y z = 1 a X Y Z .
As illustrated in Figure 1, the z-component of r represents the vertical distance from the plate, measured in units of a.
In addition to the WS radius a, another important length scale is the minimal inter-particle separation d min [49,50]. As in the derivation of the WS radius, we consider the case where all counterions are confined to the charged plate. Under this condition, a purely geometric argument in two dimensions allows us to identify the minimal separation d min between counterions. This length represents the shortest inter-particle distance in a uniform system and is given by
d min = 1 σ ˜ = π ,
where Equation (4) has been used (see also Figure 1). The relation (6) arises from the reverse isominwidth inequality, a refinement of Pál’s classical inequality for centrally symmetric convex bodies, which states that the isominwidth d satisfies the inequality d 2 1 / σ ˜ when the occupancy region is placed in its isominwidth (Behrend-type) position [49,50]. In the context of isotropic homogeneous liquids, such a normalization is physically justified because no direction is privileged and the average shape of the single-particle occupancy region can be considered geometrically balanced.
Throughout this study, all energy quantities are made dimensionless by expressing them in units of thermal energy k B T . As we will show in Section 3, the ideal gas density ρ J ( r ) under an external potential J ( z ) serves as a reference for inhomogeneous systems. Since ρ J ( r ) is given by
ρ J ( r ) = e μ J ( z )
using the chemical potential μ , the reference density at a reference position z ref reads
ρ ref = e μ J ( z ref ) .
It follows from Equations (7) and (8) that
ρ J ( r ) = ρ ref e J ( z ) + J ( z ref ) = ρ ref + Δ ρ J ( r ) ,
which defines the density difference Δ ρ J ( r ) , a core variable in our theory (see Section 3).
Let us now consider the external potential J ( z ) = ψ ( z ) actually experienced by a counterion under a stationary and uniform electric field E. The total potential ψ ( z ) is given by
ψ ( z ) = γ 0 + q e E a k B T z ,
where the first term on the right-hand side (RHS) accounts for the attractive interaction from the charged plate, e denotes the elementary charge, and we consider only the case in which the electric field is applied with the sole effect of attracting the cationic counterions toward the surface (see also Figure 1). The coefficient γ 0 equals the inverse of the Gouy–Chapman length λ 0 in units of the WS radius a [1,2,3,4,5,6]:
γ 0 = 1 λ 0 ,
λ 0 = 1 a 1 2 π q l B σ .
Here, l B denotes the Bjerrum length, defined by
l B = e 2 ϵ k B T ,
which represents the distance at which two elementary charges immersed in a dielectric medium interact with energy k B T in Gaussian units [1,2,3,4,5,6]. Note that, unlike other lengths in this paper, l B is not expressed in units of the WS radius a; this is because it becomes dimensionless in the 2D Gaussian unit system, which directly enables its use in defining the 2D coupling constant Γ (see Equation (63)).
The ideal gas density ρ ψ ( r ) relates to the total number N of counterions as follows:
N = d r ρ ψ ( r ) = A a 2 0 d z ρ ψ ( r ) = A γ a 2 e μ ,
where we have introduced the effective coefficient γ , or the inverse of the effective Gouy–Chapman length λ in units of a:
γ = γ 0 + q e E a k B T = 1 λ .
Using the effective parameter γ , Equation (10) becomes
ψ ( z ) = γ z .
Substituting this into Equation (7) with J ( z ) = ψ ( z ) yields
ρ ψ ( r ) = e μ γ z ,
indicating that γ quantifies the extent to which counterions are bound to the plate under the external field E: the larger the 3D coupling constant γ , the more localized the ideal gas density ρ ψ ( r ) becomes. Thus, the strong 3D coupling can be represented by the following condition:
γ 1 ,
or, equivalently, λ 1 (see also Figure 1). To clarify under what conditions the strong 3D coupling condition γ 1 is realized, it is instructive to rewrite Equation (15) as follows:
γ = q 2 l B a 2 π σ a 2 q + q e E ( q 2 e 2 / ϵ a 2 ) = q 2 l B π σ q 2 + η a = q / π σ ,
where Equation (4) has been used and η ( a ) = q e E / ( q 2 e 2 / ϵ a 2 ) . The physical meaning of this expression is as follows:
  • The coupling constant γ is proportional to the term q 2 l B π σ / q .
  • It also depends on the ratio η ( a ) for a = q / π σ , which represents the ratio of the attractive force on a counterion from the external electric field to the repulsive Coulomb force between counterions separated by the WS radius a.
Based on this, the strong 3D coupling condition γ 1 is achieved in the following situations:
  • When the Bjerrum length l B becomes large due to low temperature T and low dielectric permittivity ϵ .
  • For multivalent counterions with a large valence q.
  • For high surface charge density e σ on the charged plate.
  • When the attractive force from the external electric field pulling the counterions toward the plate is sufficiently larger than the repulsive force from an adjacent counterion.
These agree with the conditions discussed in Section 1.
From Equation (14), the chemical potential μ is determined as
μ = ln σ ˜ γ ,
where Equation (3) has been used. Combining Equations (8), (9), (15), and (20), Equation (17) reads
ρ ψ ( r ) = ρ ref e γ z ,
with
ρ ref = σ ˜ γ = σ ˜ λ
and z ref = 0 . The ideal gas density ρ ψ ( r ) provides a good approximation to the z-axis density profile in the strong coupling regime γ 1 , a well-established result in strong coupling theories and the standard reference state for constructing the strong coupling approximation [2,3,4,5,10,11,12,13,14,15,16,17,18,19,20,21]. Accordingly, ρ ψ ( r ) will be taken as the baseline density in the next section, where fluctuations around it are treated within a field-theoretical framework.

3. Analytical Results: Density Distribution at Strong 3D Coupling

3.1. Hybrid Method of the DFT and Statistical Field Theory [21,45,46]

The DFT based on a variational principle determines the grand potential Ω [ J ] of a many-body system in an external potential J ( r ) [48,51,52,53]. The DFT considers two variational functionals, Ω V [ ρ ] and A [ ρ ] , which are related through the Legendre transform:
Ω V [ ρ ] = A [ ρ ] d r μ ˜ ( r ) ρ ( r ) ,
ρ ( r ) = δ Ω V [ ρ ] δ μ ˜ ,
where the intrinsic chemical potential μ ˜ ( r ) represents the difference between μ and an arbitrary potential V ( r ) that creates a density distribution ρ ( r ) : μ ˜ ( r ) μ V ( r ) . The variational principle of the DFT reads
δ Ω V [ ρ ] δ ρ ρ = ρ eq = 0 ,
Ω V [ ρ eq ] = Ω [ J ] ,
at V ( r ) = J ( r ) . Equations (23)–(26) reveal that the equilibrium functional A [ ρ eq ] , the Legendre transform of the grand potential Ω [ J ] , is identified with the intrinsic Helmholtz free energy. Therefore, we divide A [ ρ ] into the ideal gas functional A id [ ρ ] and the excess one A ex [ ρ ] :
A [ ρ ] = A id [ ρ ] + A ex [ ρ ] ,
A id [ ρ ] = d r ρ ( r ) ln ρ ( r ) ρ ( r ) ,
following the standard procedure of the DFT [48,52,53].
Recently, we have developed the hybrid theory of the DFT and the statistical field theory based on a functional integral formulation [21,45,46]. The hybrid method incorporates the key functional Ω V [ ρ ] of the DFT into the density functional integral representation of the grand potential Ω [ J ] :
e Ω [ J ] = D ρ D ϕ e F [ ρ , ϕ ] ,
F [ ρ , ϕ ] = Ω V [ ρ ] + T [ ρ ] + Φ [ ρ , ϕ ] .
We can see that the functional F [ ρ , ϕ ] in the exponent of the integrand on the RHS of Equation (29) contains the DFT functional Ω V [ ρ ] , which is why the present formulation can be referred to as the hybrid theory. The remaining terms on the RHS of Equation (30) are given as follows:
T [ ρ ] = d r ρ ( r ) c ( r r ) ρ ^ test ( r ) ,
ρ ^ test ( r ) = δ ( x x 0 ) δ ( y y 0 ) δ ( z ) ,
and
Φ [ ρ , ϕ ] = 1 2 d r d r ϕ ( r ) G ( r r ; ρ ) ϕ ( r ) ,
G ( r r ; ρ ) = ρ ( r ) δ ( r r ) + h ( r r ; ρ ) ρ ( r ) ,
with c ( r r ; ρ ) and h ( r r ; ρ ) denoting the direct correlation function (DCF) and the total correlation function (TCF), respectively [21,45,46,48,52,53]. Equations (31) and (32) indicate that a counterion is fixed on the plate surface as a test counterion for detecting correlations between counterions (see Figure 1).

3.2. Gaussian Approximation as an Extension of the Percus Test-Particle Method

We consider the fluctuating density field n ( r ) = ρ ( r ) ρ J ( r ) around the ideal gas density ρ J ( r ) in Equation (7). In the Gaussian approximation, which incorporates contributions up to quadratic order in F [ ρ , ϕ ] as a functional of both n ( r ) and ϕ ( r ) , the functional integral in Equation (29) yields the following (see Appendix A for details):
Ω [ J ] = Ω V [ ρ J ] + T [ ρ J ] + Δ Ω [ ρ J ] = A id [ ρ J ] + A ex [ ρ J ] d r μ ˜ ( r ) ρ J ( r ) + T [ ρ J ] + Δ Ω [ J ] ,
where μ ˜ = μ J ( r ) ,
Δ Ω [ ρ J ] = 1 2 d r d r Δ ρ J + T ( r ) h ( r r ; ρ J ) c ( r r ; ρ J ) Δ ρ J + T ( r ) ,
and
ρ J ( r ) + ρ ^ test ( r ) = ρ ref + Δ ρ J + T ( r ) , Δ ρ J + T ( r ) = Δ ρ J ( r ) + ρ ^ test ( r ) .
This formulation is valid within the regime where the Ramakrishnan–Yussouff (RY) approximation for the excess free energy functional A ex [ ρ J ] applies [48,51,52,53]:
A ex [ ρ J ] = A ex [ ρ ref ] 1 2 d r d r Δ ρ J ( r ) c ( r r ; ρ J ) Δ ρ J ( r ) .
Here, the reference-state dependence c ( r r ; ρ ref ) has been replaced by c ( r r ; ρ J ) , following a second-order truncation in Δ ρ J , as detailed in Appendix A.
We now turn to the equilibrium density distribution ρ eq ( r ) , which is obtained by differentiating the grand potential Ω [ J ] with respect to the external potential J ( r ) :
ρ eq ( r ) = δ Ω [ J ] δ J = ρ J ( r ) + d r δ ρ J ( r ) δ J ( r ) δ Ω [ J ] δ ρ J ( r ) = ρ J ( r ) 1 δ Ω [ J ] δ ρ J ( r ) ,
where we have used the identity
δ ρ J ( r ) δ J ( r ) = ρ J ( r ) δ ( r r ) .
To proceed further, we need to evaluate the functional derivative δ Ω [ J ] / δ ρ J ( r ) appearing in Equation (39). Since the grand potential Ω [ J ] is given by Equation (35), this derivative can be decomposed into the sum of three contributions as follows:
δ Ω [ J ] δ ρ J ( r ) = δ Ω V [ ρ J ] δ ρ J ( r ) + δ T [ ρ J ] δ ρ J ( r ) + δ Δ Ω [ J ] δ ρ J ( r ) .
It follows from Equations (28), (35), and (38) that
δ Ω V [ ρ J ] δ ρ J ( r ) = δ A id [ ρ J ] δ ρ J ( r ) + δ A ex [ ρ J ] δ ρ J ( r ) μ ˜ = ln ρ J ( r ) μ ˜ d r c ( r r ; ρ J ) Δ ρ J ( r ) = d r c ( r r ; ρ J ) Δ ρ J ( r ) ,
where use has been made of Equation (7) and μ ˜ = μ J ( r ) in the last line.
By combining Equations (31), (36), (41), and (42), we obtain the following expressions for the functional derivatives:
δ Ω V [ ρ J ] δ ρ J ( r ) + δ T [ ρ J ] δ ρ J ( r ) = d r c ( r r ; ρ J ) Δ ρ J ( r ) + ρ ^ test ( r ) = d r c ( r r ; ρ J ) Δ ρ J + T ( r )
and
δ Δ Ω [ J ] δ ρ J ( r ) = d r h ( r r ; ρ J ) Δ ρ J + T ( r ) + d r c ( r r ; ρ J ) Δ ρ J + T ( r ) .
Adding Equations (43) and (44) amounts to
δ Ω [ J ] δ ρ J ( r ) = d r h ( r r ; ρ J ) Δ ρ J + T ( r ) .
Substituting this into Equations (39) at J ( r ) = ψ ( r ) , we have
ρ eq ( r ) = ρ ψ ( r ) 1 + d r h ( r r ; ρ ψ ) Δ ρ ψ + T ( r ) = ρ ψ ( r ) 1 + h ( r s 0 ; ρ ref ) + d r h ( r r ; ρ ψ ) Δ ρ ψ ( r ) ,
where the last term on the RHS remains due to Δ ρ ψ ( r ) 0 in nonuniform systems; otherwise, Equation (46) reduces to the conventional relation of the Percus test-particle method for uniform systems [47,48].
Equation (46) can thus be regarded as a Gaussian approximation to the deviation of the equilibrium density ρ eq ( r ) from the baseline density ρ ψ ( r ) , an approximation that should become relevant in the strong coupling regime γ 1 [2,3,4,5,10,11,12,13,14,15,16,17,18,19,20,21]. In this sense, our formulation developed in Section 3.2 constitutes a new strong coupling approximation for counterion systems in the regime of finite γ .

3.3. Dimensional Reduction in the Limit of Strong 3D Coupling

Let s be the 2D coordinates restricted to the plane at z = 0 (see Figure 1):
s = r δ ( z ) ,
s 0 = x 0 y 0 0 ,
with the subscript 0 denoting the test counterion position in Equation (32). In the limit of strong 3D coupling ( γ ), Equation (21) for z 0 is approximated as
ρ ψ ( r ) = σ ˜ γ e γ z σ ˜ δ ( z ) ,
which reads
ρ ref = σ ˜ δ ( z ) ,
Δ ρ ψ ( s ) = 0 ,
ρ ψ ( r s ) = 0 .
In this limiting state, where dimensional reduction effectively occurs, the integral term in Equation (46) vanishes:
d r h ( r r ; ρ ψ ) Δ ρ ψ ( r ) = d s h ( r s ; ρ ψ ) Δ ρ ψ ( s ) + d r h ( r r ; ρ ψ ) Δ ρ ψ ( r s ) = 0 ,
because of Equation (51), and also because Equation (52) implies h ( r r ; ρ ψ ) = 0 for r s . Furthermore, we define
g ( s ) = 1 + h ( s ) = 1 + h ( s s 0 ; ρ ref ) ,
with the uniform reference density ρ ref given by Equation (50). In Equation (54), g ( s ) and h ( s ) denote the radial distribution function and the TCF, respectively, for a uniform and isotropic 2D system where the correlation functions depend only on the distance s = | s s 0 | = | s | from a test counterion placed at the origin ( x 0 = y 0 = 0 in Equation (48)) as illustrated in Figure 1; this choice can be assumed without loss of generality.
To rewrite the extended Percus relation (46) in terms of the areal density, or the 2D density, we introduce the equilibrium 2D density σ eq ( s ) associated with the 3D equilibrium density as
σ eq ( s ) = d z ρ eq ( r ) .
Following this definition, we integrate both sides of Equation (46) with respect to z, which, when the density expression (49) is valid in the limit γ , leads to the conventional Percus relation for 2D systems [47,48]:
σ eq ( s ) = σ ˜ g ( s ) ,
due to Equations (53) and (54). Thus, the hybrid theory presented in Section 3.1 establishes that the 2D Percus relation (56) applies to the 3D strongly coupled counterion system in the limit γ , as the limiting form of Equation (46) relevant in the strong coupling regime γ 1 .
When determining the behavior of g ( s ) , it is important to note that, in principle, the TCF and DCF on the charged plate obey the 3D Ornstein–Zernike (OZ) equation as follows [48]:
h ( s s 0 ; ρ ψ ) = c ( s s 0 ; ρ ψ ) + d z d s c ( s r ; ρ ψ ) ρ ψ ( r ) h ( r s 0 ; ρ ψ ) ,
where the 3D coordinate r is defined as r = ( s , z ) T , reflecting its decomposition into lateral and perpendicular components with respect to the charged plate (see Figure 1). In the limit γ , where Equation (49) holds, the 3D Equation (57) reduces to the 2D OZ equation for uniform systems [48]:
h ( s ) = c ( s ) + σ ˜ d s c ( s s ) h ( s s 0 ) ,
with s = | s s 0 | as before. To proceed with the formulation in Fourier space, we define the 2D Fourier transform of a function f ( s ) as
f ( k ) = 2 π 0 d s s J 0 ( k s ) f ( s ) ,
using the zeroth Bessel function J 0 ( k s ) of the first kind. The corresponding inverse transform is given by
f ( s ) = 1 2 π 0 d k k J 0 ( k s ) f ( k ) .
Applying the 2D Fourier transform to Equation (58), we obtain
h ( k ) = c ( k ) 1 σ ˜ c ( k ) .
The validity of the 2D expressions (58) and (61) for the 3D counterion system at γ is nontrivial and represents another noteworthy outcome of our analysis.

4. Numerical Results: Oscillatory Wavelength in Liquid Systems of Localized Counterions

4.1. Computational Setup

Let κ 1 denote the 2D Debye–Hückel length in units of the WS radius a. We have
κ 2 = 2 π Γ σ ˜ = 2 Γ ,
Γ = q 2 l B ,
noting that the Bjerrum length l B becomes dimensionless in Gaussian units for 2D systems, as mentioned after Equation (13). The last equality on the RHS of Equation (62) follows from Equation (4). Equations (19) and (63) allow us to clarify the distinction between the two coupling constants: the 2D coupling constant Γ and the 3D coupling constant γ . According to Equation (63), the 2D coupling constant Γ is determined solely by the counterion valence q and the Bjerrum length l B . Therefore, the strong 2D coupling condition Γ 1 is realized under the following two system-specific conditions:
  • When the Bjerrum length l B becomes large due to low temperature T and low dielectric permittivity ϵ .
  • For multivalent counterions with a large valence q.
As discussed in Section 1, this theoretical definition of strong 2D coupling is governed exclusively by these system-specific parameters and is independent of the surface charge density e σ of the charged plate or the strength E of the external electric field.
Although the theoretical definition of 2D coupling constant Γ does not directly apply to realistic systems, as discussed at the end of Section 5, it is nevertheless worth recalling a key conceptual point: strong confinement at γ 1 does not necessarily imply strong in-plane coupling at Γ 1 . In Equation (19), the dimensionless ratio η ( a ) quantifies the relative strength of the attractive force from the external electric field compared to the repulsive Coulomb force between neighboring counterions separated by the WS radius a. By increasing the external electric field, one can enhance η ( a ) and thereby achieve strong 3D coupling ( γ 1 ), even when the in-plane coupling remains below the crystallization threshold ( Γ < Γ m ). This highlights the fundamental decoupling between γ and Γ , and the possibility of realizing noncrystalline yet strongly confined counterion states.
In such a regime of strongly coupled liquids ( 1 Γ < Γ m ), the smeared Gaussian charge model has proven relevant [54,55,56]. This model assumes a Gaussian distribution of total charge q e spread over a finite spatial extent, given by the following:
Q ( s ) = q e 2 π exp s 2 2 .
The smeared Gaussian charge model specified by Equation (64) provides the long-range form c L ( s ) of the 2D DCF [54,55,56]:
c L ( s ) = Γ ln s + 1 2 E 1 s 2 ,
where E 1 denotes the exponential integral function. The 2D Fourier transform of Equation (65) yields the following expression:
σ ˜ c L ( k ) = κ 2 e k 2 / 4 k 2 .
This form reveals a structural identity between the long-range behaviors of 2D and 3D DCFs at strong coupling in terms of their Fourier transforms [54,55,56,57].
Figure 2 compares the s-dependences of the bare interaction potential between q-valent counterions and the long-range part of DCF c L ( s ) given by Equation (65) in units of Γ . It is seen from Figure 2 that c L ( s ) converges to the bare interaction potential u ( s ) = Γ ln s at long range and deviates from the divergent behavior of u ( s ) at short range, amounting to a finite value even at s = 0 . We also observe from Figure 2 that c L ( s ) begins to deviate from the bare interaction potential around s 2 , indicating the onset of overlap between smeared Gaussian charges.
The OZ Equation (58) determines the relationship between the TCF h ( s ) and the DCF c ( s ) . However, to fully specify h ( s ) , an additional closure relation is required. In this study, we adopt the HNC closure [48]:
c ( s ) = e u ( s ) + t ( s ) 1 t ( s ) ,
t ( s ) = h ( s ) c ( s ) ,
where t ( s ) can be referred to as the indirect correlation function, reflecting the physics of the OZ Equation (58). The smeared Gaussian charge model proves relevant when solving the coupled OZ and closure equations at strong 2D coupling ( Γ 1 ) [54,55,56]. Subtracting the long-range component c L ( s ) , given by Equation (65), we have the short-range interaction potential u S ( s ) as follows:
u S ( s ) = u ( s ) + c L ( s ) = Γ 2 E 1 s 2 ,
which corresponds to the difference between the dashed and solid lines in Figure 2. Similarly, the short-range parts of the DCF c S ( s ) and the indirect correlation function t S ( s ) are defined as
c S ( s ) = c ( s ) c L ( s ) ,
t S ( s ) = t ( s ) + c L ( s ) .
Using the short-range functions, u S ( s ) , c S ( s ) , and t S ( s ) , the HNC closure (67) becomes
c S ( s ) = e u S ( s ) + t S ( s ) 1 t S ( s ) .
It follows from Equations (68) and (71), as well as the OZ Equation (61), that the Fourier transform of t S ( s ) is expressed by h ( k ) and c L ( k ) :
t S ( k ) = σ ˜ h 2 ( k ) 1 + σ ˜ h ( k ) + c L ( k ) .
Performing the inverse Fourier transform, we obtain t S ( s ) for the 2D system. Once t S ( s ) is determined, c S ( s ) can be calculated from Equation (72). Adding the Fourier transforms of c S ( s ) and c L ( s ) , c ( k ) is obtained, which yields h ( k ) via Equation (61). We find the solution to the coupled OZ and closure equations by iteratively repeating this procedure until a self-consistent solution for h ( s ) is achieved. The HNC equation is solved using 1024 grid points and a choice of grid spacing in s such that the 32nd grid point corresponds to s = 1 . In other words, the maximum range in the correlation functions is set to be 32. The iteration process is accelerated by the Anderson mixing scheme [58].

4.2. Data Trends and Physical Interpretation

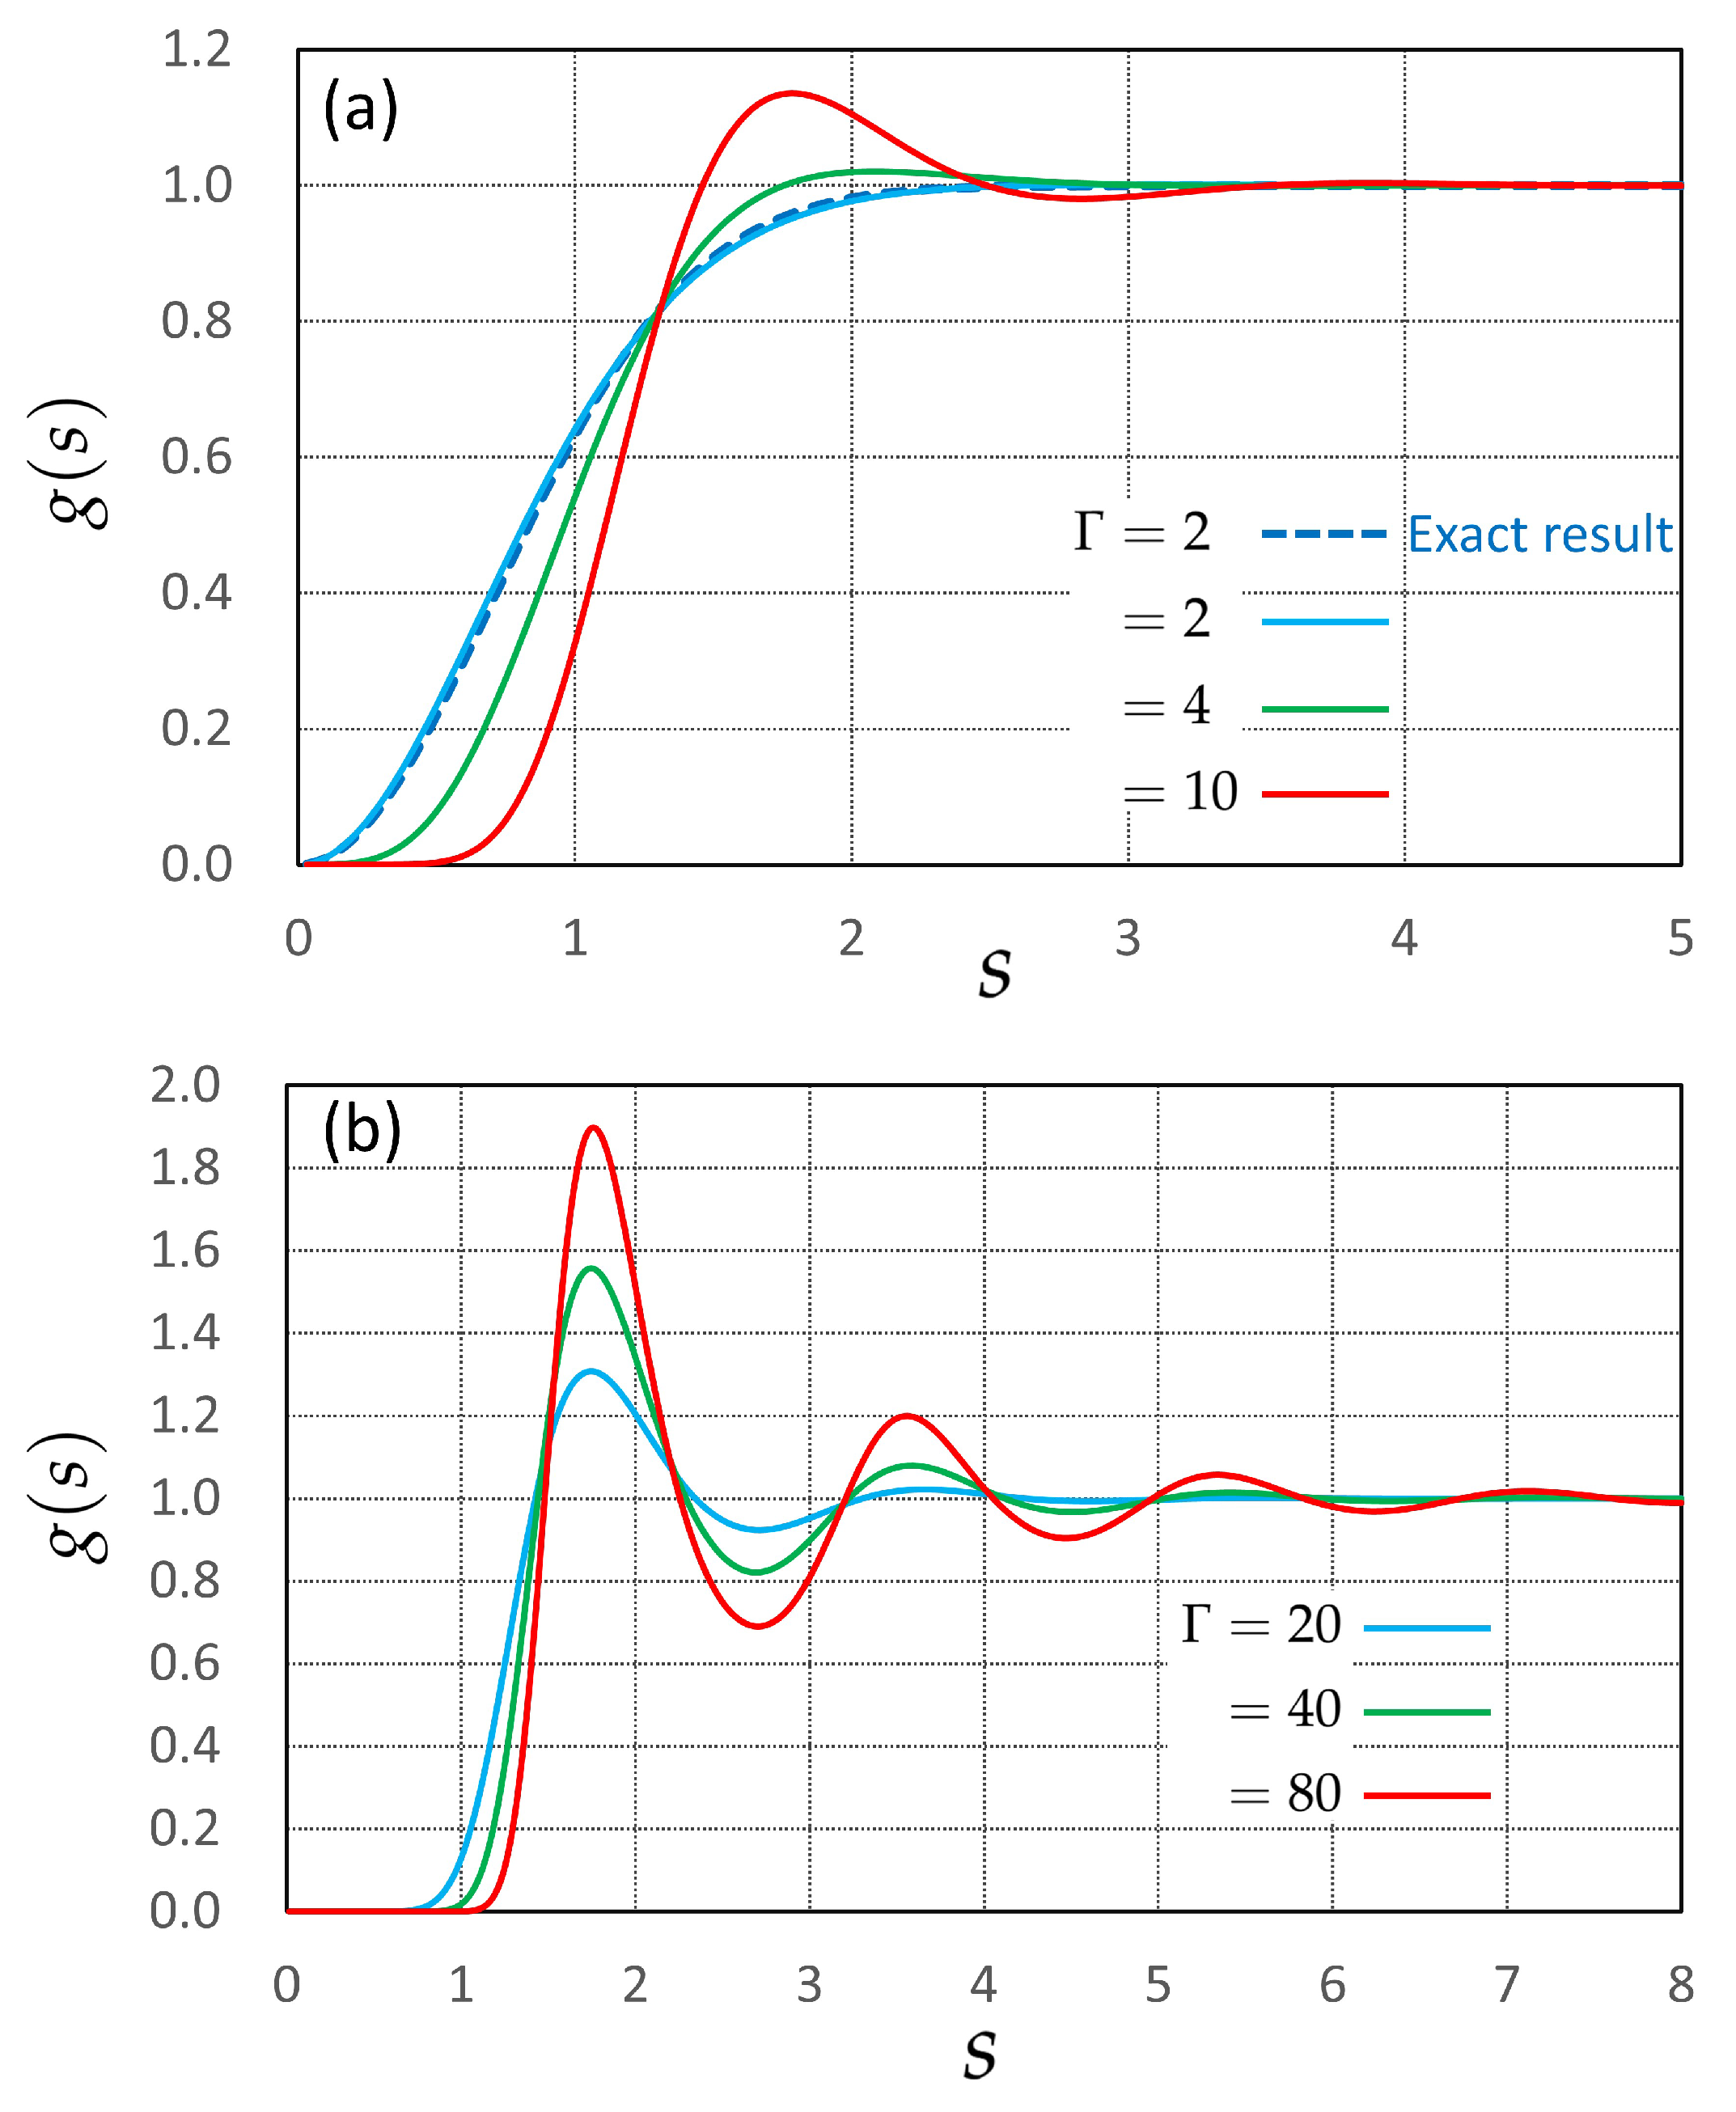
Equation (56) states that the equilibrium 2D density σ eq ( s ) around a test counterion is determined by the radial distribution function g ( s ) . Hence, Section 4.2 presents numerical results for g ( s ) obtained using the HNC closure (72). By varying the 2D coupling constant Γ from 2 to 80, we examine the evolution of g ( s ) as a function of inter-particle separation s. The main objective here is to investigate the asymptotic oscillatory decay that emerges in the strong 2D coupling regime ( Γ 1 ). We pay particular attention to the long-range behavior beyond the first peak, where an oscillatory decay leading to density modulations persists. To quantify this behavior, we evaluate the wavelength and decay length of the oscillatory decay observed in g ( s ) (see Table 1).
Before proceeding to the quantitative analysis, we briefly review the qualitative features of g ( s ) . Previous studies on the 2D OCP have highlighted two notable values of the coupling constant: Γ = 2 and Γ m 140 . At Γ = 2 , the system is exactly solvable [22], providing a Gaussian decay of the following form:
g ( s ) = 1 e s 2 .
The coupling regime around Γ = 2 has been extensively studied both theoretically and numerically, suggesting that g ( s ) undergoes a crossover from monotonic to oscillatory decay as Γ exceeds 2 [26,27]. At Γ m 140 , on the other hand, a freezing transition has been found to occur [24,28,31,32,33]. Therefore, in the strong coupling regime of 1 Γ < Γ m , g ( s ) is expected to display characteristic features of strongly correlated liquids.
Figure 3 illustrates the evolution of g ( s ) with increasing Γ , from the exactly solvable case at Γ = 2 to the strongly coupled regime. As shown in Figure 3a, our HNC approximation agrees well with the exact result (74) at Γ = 2 [22]. For Γ > 2 , the radial distribution function g ( s ) exhibits oscillatory decay, consistent with previous findings [26,27]. Figure 3b further shows that as Γ increases, the system develops pronounced features of strongly coupled liquids: the first peak grows higher, and the oscillations decay more slowly. These characteristics of g ( s ) align with simulation results for the 2D OCP [24,25,33]. However, due to inherent limitations of the HNC approximation, the first peak at Γ = 40 and 80 is slightly underestimated compared to simulation data [23,25]. This issue can be traced back to the work of Caillol et al. in 1982 [25], who identified and analyzed it in detail, showing that although the HNC typically underestimates the peak height relative to Monte Carlo simulation results, it accurately reproduces the peak positions and the periodicity of the subsequent oscillations. Furthermore, they demonstrated that the underestimation can be effectively resolved by employing a modified HNC method, which incorporates a semi-empirical bridge function calibrated using MC data [25].
It is noteworthy that the position s * of the first peak in Figure 3 remains nearly unchanged as Γ varies, consistently appearing between 1.75 and 1.77. This observation suggests that the stationary first peak corresponds to the minimal inter-particle separation, which from geometric considerations is given by d min = π 1.77 (see Equation (6) and Figure 1) [49,50]:
s * d min .
Despite extensive studies on the 2D OCP, the relation (75) has not, to our knowledge, been explicitly pointed out in the literature [7,8,9,22,23,24,25,26,27,28,29,30,31,32,33], and we therefore note it here.
Our primary interest lies in the wavelength of oscillatory decay that persists beyond the first peak. In particular, we aim to clarify the relationship between the wavelength and the minimal inter-particle separation d min whose value matches the position of the first peak. To this end, it is helpful to note that the Bessel function appearing in Equation (60) takes the following asymptotic form [59]:
J 0 ( k s ) = 2 π k s sin k s + π 4 + O s 3 / 2 .
The pole-based analysis using Equation (76) reveals that the inverse Fourier transform of h ( k ) amounts to [60]
s h ( s ) e s / ξ cos 2 π s λ + φ ,
where φ denotes an initial phase, and λ and ξ represent the wavelength and decay length, respectively, both determined by the primary pole of h ( k ) . Equation (77) indicates that analyzing the s-dependence of ln | s h ( s ) | is useful for identifying the characteristic lengths λ and ξ .
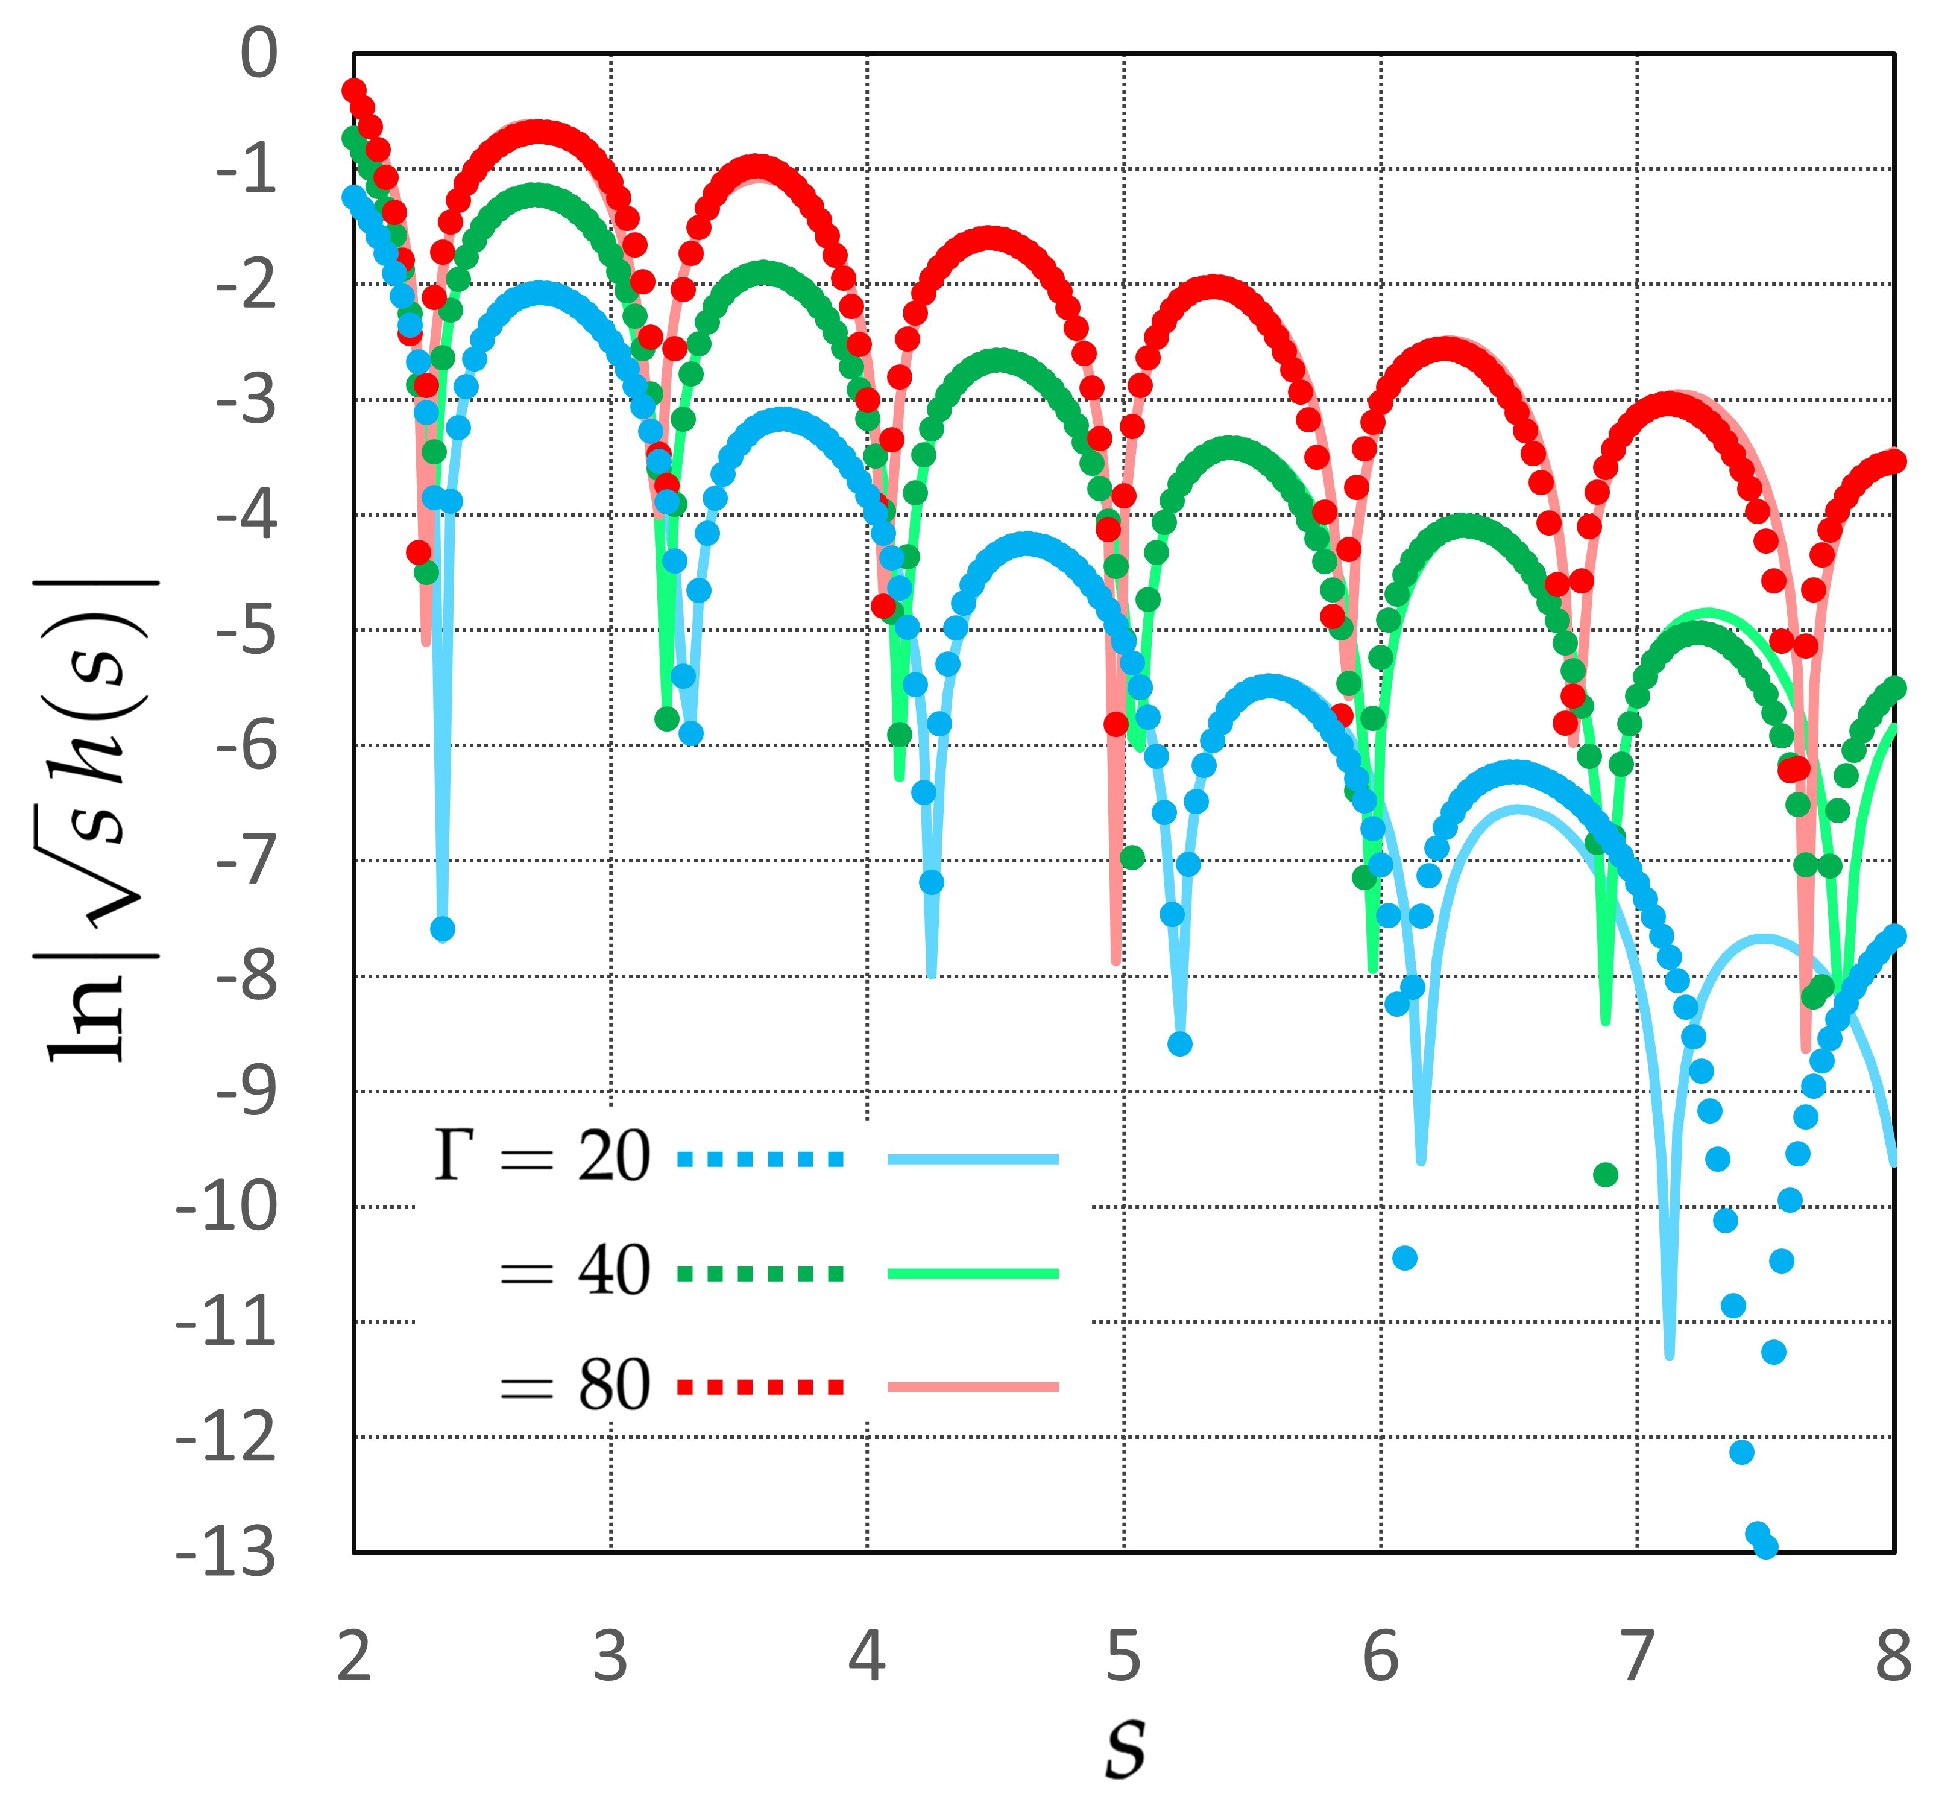
Figure 4 presents logarithmic plots of s h ( s ) for Γ = 20 , 40 , and 80, using the data shown in Figure 3b. Colored dots denote the HNC results, and the corresponding solid lines are obtained by fitting the asymptotic form (77) to the numerical results for g ( s ) over the long-range window 2 s 16 .
From the colored dots alone, two robust qualitative trends are evident: as Γ increases, the oscillation wavelength decreases, whereas the overall decay becomes slower (the decay length ξ grows). Both features are consistent with strengthening correlations at higher coupling. The fitted curves quantify these trends. For all Γ , the fits agree well with the data near s = 2 , and deviations increase with s and are more pronounced at smaller Γ values. Especially for Γ = 20 , the asymptotic form fails to capture the behavior beyond s 6 , suggesting that the assumption of oscillatory decay is no longer valid. These observations indicate that as Γ increases, the system transitions toward a regime where the oscillatory decay persists over longer distances, a hallmark of strongly coupled liquids. The crossover is clearly visible in the behavior of ln | s h ( s ) | .
Table 1 lists the fitted parameters λ and ξ . As Γ increases from 20 to 80, the decay length ξ more than doubles, indicating a significant enhancement of structural correlations beyond the short-range scale. The data also show that, at small Γ , the wavelength λ clearly exceeds d min 1.77 , indicating that the density modulation in the tail region is not shaped by the short-range order associated with the first peak, and that this order is relaxed to some extent. With increasing Γ , λ gradually decreases and approaches d min , reaching λ d min at Γ = 80 . It follows from Equation (75) that s * λ d min at Γ = 80 , thereby implying that the density modulation observed in the tail region arises from the same locally preferred arrangement that governs the short-range structure, and remains influential over the medium-range scale characterized by the decay length ξ .
Recent large-scale Monte Carlo simulations of the 2D OCP on cylindrical surfaces near freezing [33] have revealed similar behaviors: the wavelengths of not only bulk correlations detected by the TCF but also boundary density oscillations decrease with increasing Γ . While both boundary and bulk observables exhibit the same downward Γ -dependence, the bulk correlation wavelength remains slightly longer than that of the boundary oscillations. For the case Γ = 80 examined therein, the bulk wavelength satisfies λ d min , consistent with our findings. This consistency in both trend and scale reinforces the above interpretation: the observed oscillatory decay reflects a local order inherent to strongly coupled liquids. Furthermore, this agreement lends support to our newly obtained HNC results, which reproduce the peak positions and the periodicity of the oscillations in line with the earlier analysis [25], as mentioned above.
It is crucial to emphasize that the result s * λ d min at Γ = 80 does not indicate crystalline ordering. The triangular lattice constant is 1.90 , about 7 % larger than d min 1.77 , and the numerical equality of d min to the square-lattice constant should not be interpreted as a preference for square symmetry. As discussed in Section 2, d min is the minimal inter-particle separation dictated by geometry in isotropic systems. In the present context, the fact that λ approaches d min should be interpreted as a signature of strong liquid-state correlations due to a geometric constraint [49,50], not as evidence of any specific lattice order.

4.3. Assessment of Sum Rules

Sum rules [7,8,9,61] in the 2D OCP impose integral constraints on the TCF, arising from fundamental physical principles such as global charge neutrality and perfect screening. These constraints, notably the Stillinger–Lovett conditions [9] involving the zeroth and second moments, manifest in the small-wavevector behavior of the structure factor S ( k ) = 1 + σ ˜ h ( k ) and provide rigorous checks for analytical approximations and numerical simulations. In the present study, we focus on two specific sum rules that constrain the zeroth and second moments of h ( s ) , given, respectively, by
σ ˜ d s h ( s ) = 1 ,
σ ˜ d s s 2 h ( s ) = 4 κ 2 .
Equation (78) ensures global neutrality, whereas Equation (79), which establishes a connection to the the 2D Debye–Hückel length defined in Equation (62), is responsible for perfect screening. Both conditions play a key role in assessing the physical consistency of the system. These relations can be directly substituted into the small-wavenumber expansion of the structure factor,
S ( k ) = 1 + σ ˜ d s h ( s ) σ ˜ 4 k 2 d s s 2 h ( s ) + O [ k 4 ] ,
yielding the limiting behavior
lim k 0 S ( k ) = 0 ,
S ( k ) = k 2 κ 2 + O [ k 4 ] .
For later convenience, we rewrite Equation (82) as
ln S ( k ) α ln k β ,
with α = 2 and β = ln κ 2 . These expressions serve as a consistency test [7,8,9,61] for our numerical results with the fundamental constraints imposed by the long-wavelength behavior of the system.
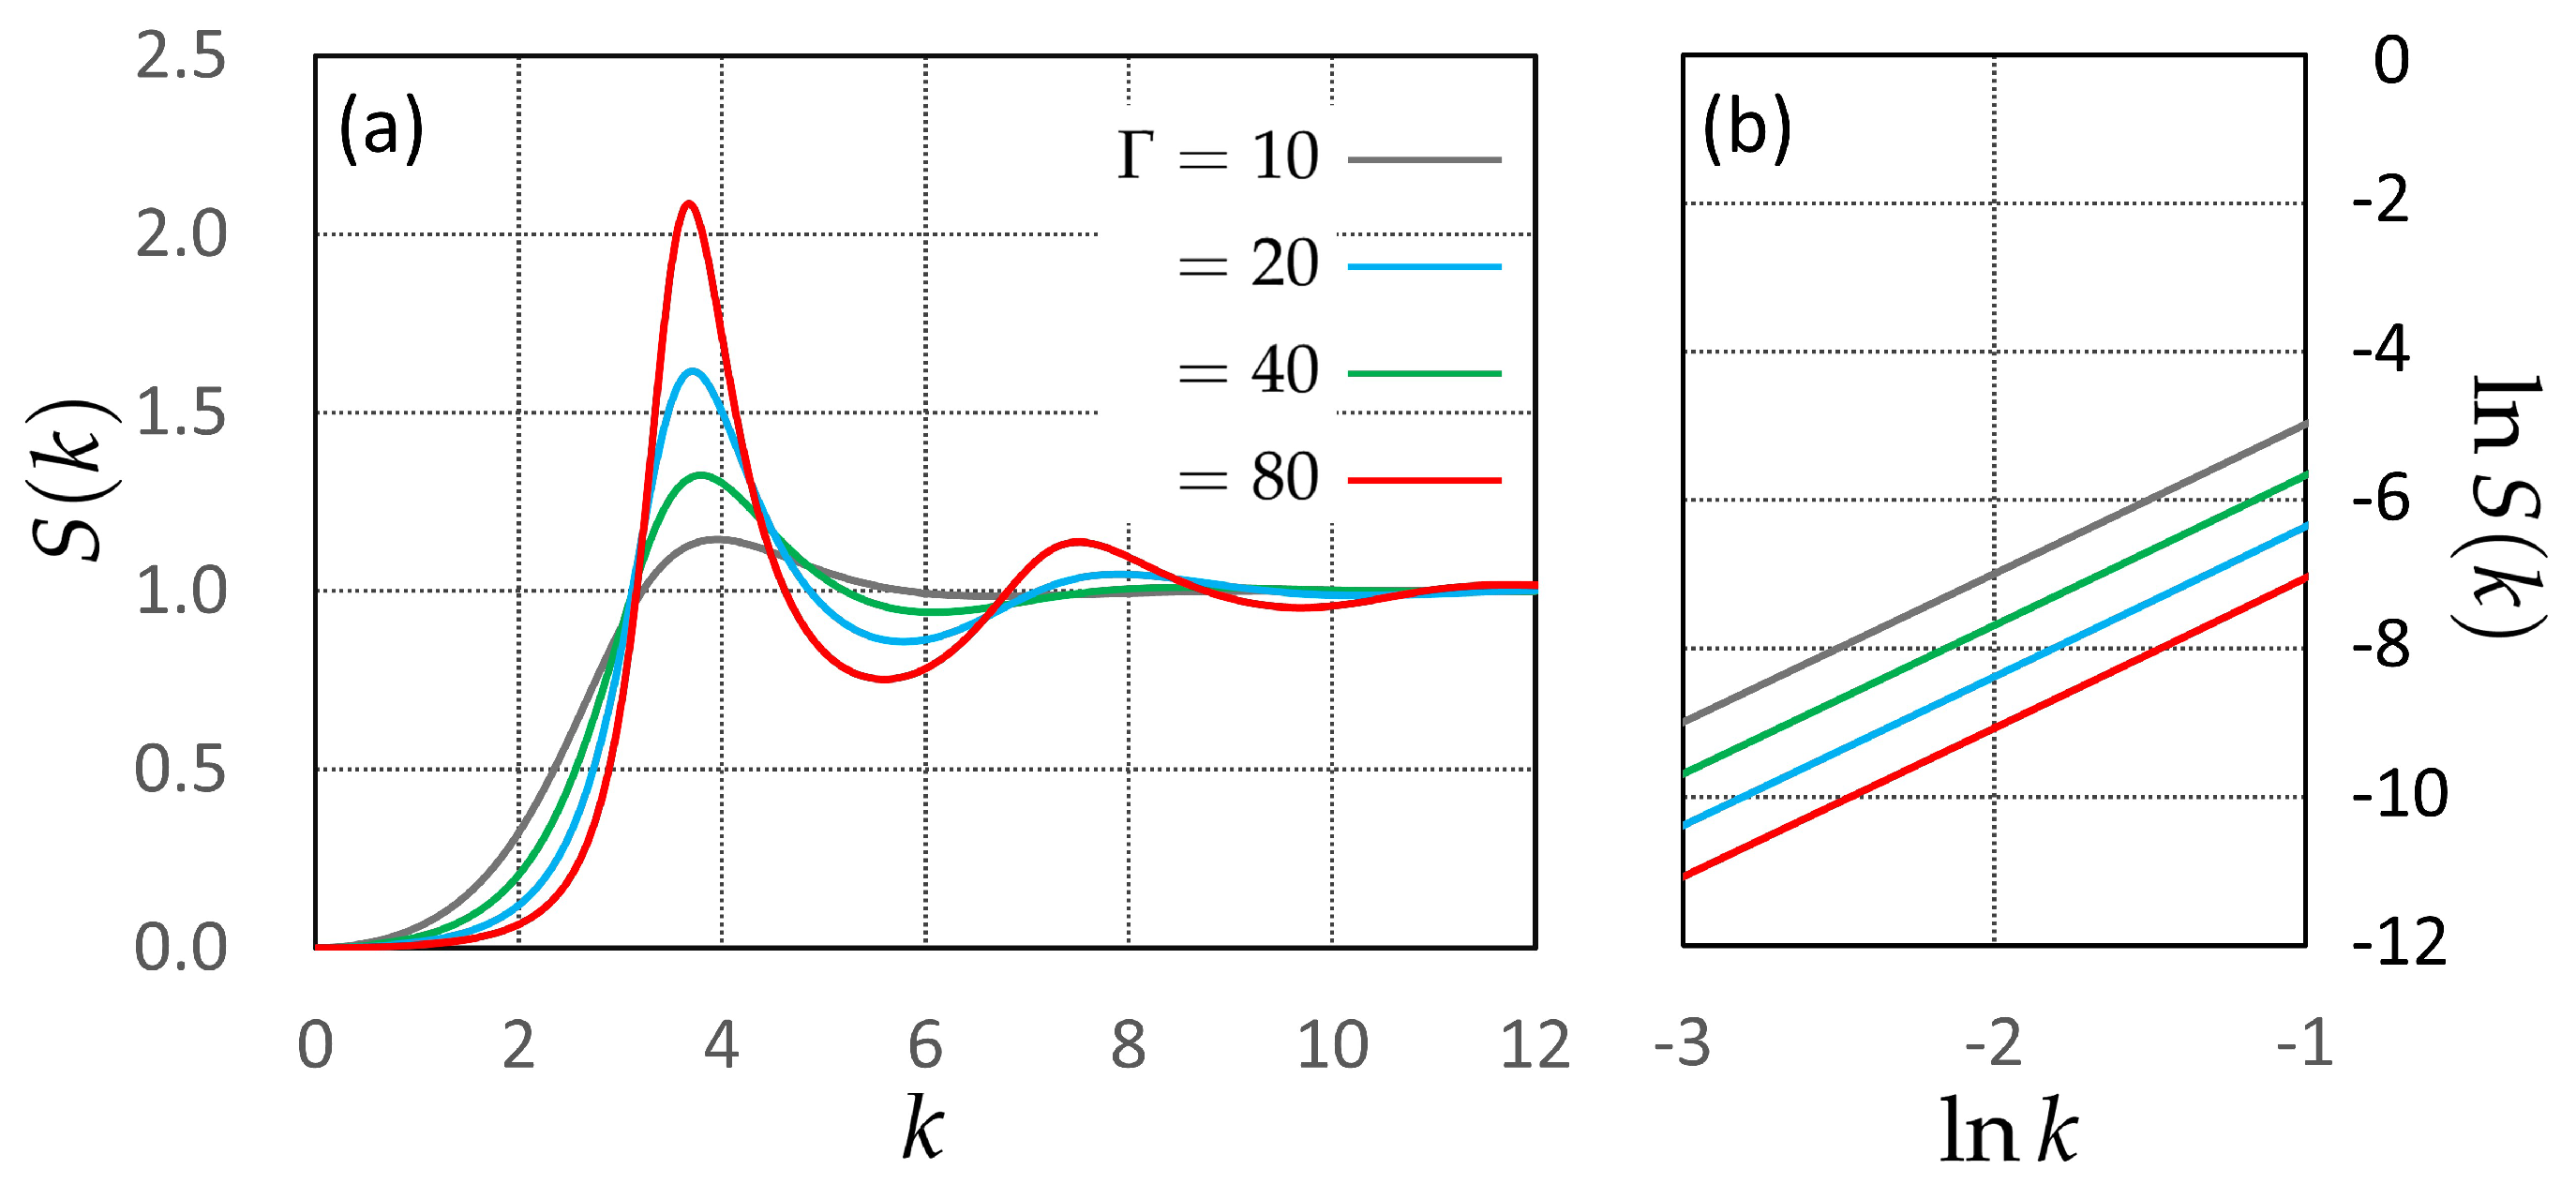
Figure 5 presents the structure factor S ( k ) for Γ = 10 , 20, 40, and 80, computed using the HNC closure (72). This figure is intended to verify the validity of the sum rules discussed above. Specifically, we utilize Figure 5a to examine the zeroth-moment condition given in Equation (81), whereas Figure 5b is designed to test the second-moment condition in Equation (82).
For the assessment of sum rules, we focus on the low-wavenumber region below the main peak at k * in Figure 5a. In this regime, S ( k ) decreases rapidly for all values of Γ , leading to S ( 0 ) = 0 , in agreement with the first sum rule (81), as required by the global charge neutrality condition. To further assess the second-moment condition in Equation (82), or Equation (83), we extract the data in the small-wavenumber range 3 ln k 1 and replot it in the log–log scale in Figure 5b. This representation allows us to apply Equation (83) and perform a linear fit, from which the slope α and intercept β are obtained. The fitting results are summarized in Table 2, where the fitted values of κ fit 1 are compared with the theoretical predictions. The relative errors remain within 2%, demonstrating that the perfect screening condition (82) is also well captured; this agreement can be attributed to the use of Equation (66) as the long-range form of the DCF.
Before closing this section, we briefly examine the overall shape of S ( k ) shown in Figure 5a, with particular attention to the main peak at the smallest wavenumber k * . For all values of Γ , the peak position k * remains nearly unchanged with increasing Γ , in agreement with simulation data [25]. For Γ = 20 , 40 , and 80, k * satisfies 6.4 < k * s * < 6.6 , indicating that k * 2 π / s * is a reasonable estimate. Furthermore, the wavelength λ of long-range oscillations, listed in Table 1, satisfies λ s * and varies with Γ . Therefore, the correspondence between k * and λ is less direct than that with s * , both qualitatively and quantitatively. Thus, the emergence of the main peak at k * can be ascribed to the local structural relation,
k * 2 π s * 2 π d min .
Similar to Equation (75), this relation appears to have received little attention in the existing literature [7,8,9,22,23,24,25,26,27,28,29,30,31,32,33] and is thus worth noting.

5. Concluding Remarks

Rather than providing a comprehensive summary, the final section presents several caveats that may help clarify how the present findings should be interpreted. We begin by recalling the characteristics of the inhomogeneous counterion system considered here, followed by comments on the analytical contributions that distinguish this work from previous formulations [1,2,3,4,5,10,11,12,13,14,15,16,17,18,19,20,21]. Finally, we address the role of the numerical results, emphasizing their value beyond the mere reproduction of existing simulation data [24,25,33].
The system considered in this study shares certain similarities with the well-known OCP [7,8,9,22,23,24,25,26,27,28,29,30,31,32,33], in that it consists of a single species of charged particles interacting via Coulomb forces. However, a key distinction lies in the spatial distribution of the neutralizing background: while the OCP assumes a uniform background charge distributed throughout the entire volume, the present system features a background that is confined to a 2D plane. This structural asymmetry introduces a fundamental difference in the nature of the Coulomb interactions and the resulting equilibrium properties. In accordance with such mixed characteristics, the counterion system is described by two distinct coupling constants: the 3D coupling constant γ and the 2D coupling constant Γ , defined, respectively, in Equations (15) and (63). The parameter γ , as indicated by Equations (17) and (19), acts as a tuning variable that controls the crossover from a 3D liquid to a 2D one. In contrast, Γ is defined in the same manner as in the conventional 2D OCP and plays an analogous role in characterizing the strength of correlations on the charged plate. In particular, in the limit γ , the system approaches a regime that closely resembles the 2D OCP, and Γ becomes the relevant parameter for quantifying the degree of 2D coupling.
To present the theoretical structure underlying the analytical contributions of this study in Section 3, we summarize the theoretical scheme in Table 3. This table outlines four key steps, each accompanied by representative equations and their physical interpretations. Among these, Steps 2 and 3 constitute the most fundamental contributions. Step 1 introduces a novel type of statistical field theory that incorporates the DFT, thereby establishing a hybrid framework. In Step 2, fluctuations around the ideal gas density ρ ψ ( r ) governed by the external potential ψ ( r ) = γ z , including an applied electric field E, are evaluated within the Gaussian approximation. This leads to a density functional form for the grand potential Ω [ J ] , compact and novel, that cannot be derived from the conventional DFT. Step 3 demonstrates that the extended relation of the Percus test-particle method holds for inhomogeneous counterion system, providing a new formulation relevant in the strong 3D coupling regime γ 1 . Finally, Step 4 presents the conventional Percus relation [47,48] for the equilibrium 2D density σ eq ( s ) , which, although well known, is here derived in a completely different setting: dimensional reduction of the 3D counterion system in the strong 3D coupling limit ( γ ). That is the sense in which Equation (56) represents the central achievement of our study.
Our numerical results in Section 4 offer two complementary perspectives. In the context of the 2D OCP, to which our system reduces in the γ limit, this study represents a modern revisit of integral equation theories using the HNC approximation. Despite the extensive historical research on the 2D OCP [7,8,9,22,23,24,25,26,27,28,29,30,31,32,33], quantitative characterizations of its correlation functions, particularly those related to the first peak and long-range density modulations, have been surprisingly scarce. What our study has clarified is (i) the validity of sum rules, (ii) the local arrangement scale indicated by the first peak at s * , and (iii) the Γ -dependent behavior of density modulations, where the oscillation wavelength λ decreases with increasing Γ and approaches the minimal inter-particle separation d min (see Section 2 for the geometric discussions [49,50]). Although a similar trend in λ has been observed in a recent simulation study [33], the above features of s * and λ have not, to our knowledge, been discussed systematically within the 2D OCP literature [7,8,9,22,23,24,25,26,27,28,29,30,31,32,33]. From the counterion standpoint, the absence of such structural benchmarks has obscured the nature of strongly correlated yet noncrystalline liquids. Our study provides insight into this noncrystalline liquid state at γ , one governed by local geometry rather than crystalline order; a clear recognition of such structural characteristics appears to have also been lacking in the prior literature on strongly coupled counterion systems [1,2,3,4,5,6,10,11,12,13,14,15,16,17,18,19,20,21].
Taken together, our findings highlight the broad applicability of the proposed analytical framework. First, Equation (46) establishes a general theoretical foundation. When treated as a perturbation around the 2D Percus relation (56), it provides a systematic, first-principles approach to determining the density distribution at finite γ in the strong 3D coupling regime ( γ 1 ). This formulation not only offers a unified perspective on previously proposed strong coupling methods [2,3,4,5,10,11,12,13,14,15,16,17,18,19,20,21] but also paves the way for a more integrated theory of counterion systems. Second is the diversity of physical systems to which our theory applies. The 3D coupling parameter γ can be significantly enhanced by various means, including externally applied electric fields, as found not only in ionic liquids and solutions [34,35,36,37,38] but also in the electrophoretic-directed assembly systems [62,63,64] that motivated this work. While such fields localize the counterions to some extent, the 2D coupling parameter Γ can be tuned independently. In particular, increasing the counterion valence q or reducing the dielectric permittivity ϵ can drive the system into the strong 2D coupling regime ( Γ 1 ), making our analytical predictions particularly amenable to experimental verification.
However, a caveat is in order when comparing our findings with existing experimental and simulation studies of the strong coupling regime: it concerns the definition of the coupling constant. When an experimental system is evaluated from the perspective of the 2D OCP, its coupling parameter is typically defined in three-dimensional Gaussian units with an appropriate reference length, reflecting its quasi-two-dimensional nature [38,39,40,41,42,43,44]. In most cases, the WS radius a serves as this reference length:
Γ exp = q 2 l B a ,
where the Bjerrum length l B carries the dimension of length. As a reminder, Equation (63) treats l B as a dimensionless quantity in 2D Gaussian units. By contrast, the coupling parameter commonly used in conventional strong coupling theories for counterions differs slightly from ours [2,3,4,5,10,11,12,13,14,15,16,17,18,19,20,21]. It is a dimensionless length based on the bare Gouy–Chapman length normalized by q 2 l B , rather than by the WS radius a:
Ξ = 2 π q 3 l B σ = Γ exp γ 0 = 2 Γ exp 2 ,
where γ 0 in Equation (11) has been rewritten as γ 0 = ( 2 π a 2 σ / q ) Γ exp = 2 Γ exp . In simulations, the strong coupling limit is typically taken as Ξ 1 × 10 4 , which, according to Equation (86), implies Γ exp < Γ m 140 [3,4,5,10,11,12,13,14,15,16,17]. This indicates that the behavior observed in the conventional strong coupling limit without an applied electric field corresponds to that of strongly coupled liquids near the crystallization point in the context of 2D OCPs. Meanwhile, Wigner crystals in experimental systems have been reported when the inter-particle distance becomes smaller than the hydration radius, suggesting that increasing the surface charge of the charged plate is effective [42,44].
We have proposed that the 3D strong coupling can be controlled by γ rather than by Ξ in Equation (86). Combining Equations (19) and (85), we obtain
γ = Γ exp { 2 + η ( a ) } ,
which can be tuned by η ( a ) (i.e., the electric field strength E) independently of Γ exp . Moreover, as noted in Section 1, the surface charge can be adjusted by the electrode potential [38]. Consequently, there is a possibility that Γ exp can also be controlled not only by system-specific conditions but also by the applied electric field. In this sense, our theory is intended to serve not merely as a framework for understanding strong coupling phenomena, but also as a milestone that guides and inspires the expanding frontier of experimental investigations into strongly correlated ionic systems.
While this study clarifies key aspects of strongly correlated counterion liquids, it also opens several promising directions for future research. Notable extensions to the framework include incorporating finite-size effects, surface heterogeneity, and dynamic responses to time-dependent fields. Investigating the interplay between γ and Γ beyond the static limit, particularly in relation to crystallization thresholds and non-equilibrium phenomena, represents a compelling challenge. Exploring these frontiers will not only expand the applicability of our framework but also solidify its value as a first-principles basis for elucidating the complex physics of these systems.

Funding

This research received no external funding.

Data Availability Statement

The original contributions presented in this study are included in the article. Further inquiries can be directed to the corresponding author.

Conflicts of Interest

The author declares no conflicts of interest.

Nomenclature

AbbreviationFull NameFirst Appearance
2Dtwo-dimensionalSection 1
3Dthree-dimensionalSection 1
OCPone-component plasmaSection 1
DFTdensity functional theorySection 1
HNChypernetted-chainSection 1
WSWigner–SeitzSection 2
RHSright-hand sideSection 2
DCFdirect correlation functionSection 3.1
TCFtotal correlation functionSection 3.1
RYRamakrishnan–YussouffSection 3.2
OZOrnstein–ZernikeSection 3.3

Appendix A. Derivation of Equations (35) and (36) in the Gaussian Approximation

We provide a detailed derivation of Equations (35) and (36), which describe the grand potential Ω [ J ] evaluated within the Gaussian approximation. We begin by outlining the structure of the functional integral and the strategy for its expansion. The starting point is the functional integral given by Equation (29). To evaluate this integral within the Gaussian approximation, we focus on the fluctuating density field n ( r ) around the ideal gas density ρ J ( r ) defined by Equation (7). This leads us to consider the following expression:
e Ω [ J ] = e F [ ρ J , ϕ 0 ] D n D ϕ e Δ F [ ρ J + n , ϕ ] .
The functional F [ ρ J , ϕ 0 ] , which equals Ω V [ ρ J ] + T [ ρ J ] according to Equation (30), is taken outside the integral. The remaining contribution, Δ F [ ρ J + n , ϕ ] , is the part to be integrated. We expand Δ F [ ρ J + n , ϕ ] around ρ J ( r ) , retaining terms up to quadratic order in both n ( r ) and the auxiliary potential field ϕ ( r ) , while neglecting higher-order contributions denoted by O ( n , ϕ ) 3 . The general form of this expansion is
Δ F [ ρ J + n , ϕ ] F [ ρ J + n , ϕ ] F [ ρ J , ϕ 0 ] = d r δ F [ ρ J , ϕ 0 ] δ ρ J ( r ) n ( r ) + 1 2 d r d r n ( r ) δ 2 F [ ρ J , ϕ 0 ] δ ρ J ( r ) δ ρ J ( r ) n ( r ) + Φ [ ρ J , ϕ ] + O ( n , ϕ ) 3 .
To perform the functional integration, we first evaluate the functional derivatives appearing in the above expression.
The first-order functional derivative is obtained from Equations (42) and (43) as follows:
δ F [ ρ J , ϕ 0 ] δ ρ J ( r ) = δ Ω V [ ρ J ] δ ρ J ( r ) + δ T [ ρ J ] δ ρ J ( r ) = d r c ( r r ; ρ J ) Δ ρ J + T ( r ) .
Equation (A3) is derived using the RY approximation [48,51,52,53] for the excess free energy functional A ex [ ρ J ] , a well-established method in the DFT. The RY approximation, truncated at second order in Δ ρ J , reads
A ex [ ρ J ] = A ex [ ρ ref ] 1 2 d r d r Δ ρ J ( r ) c ( r r ; ρ ref ) Δ ρ J ( r ) + O [ Δ ρ J 3 ] A ex [ ρ ref ] 1 2 d r d r Δ ρ J ( r ) c ( r r ; ρ J ) Δ ρ J ( r ) .
The replacement of the reference-state DCF c ( r r ; ρ ref ) with the state-dependent form c ( r r ; ρ J ) in the second line of Equation (A4) is justified by the following expansion [48,52,53]:
c ( r r ; ρ J ) = c ( r r ; ρ ref ) + d r δ c ( r r ; ρ ) δ ρ ( r ) ρ ( r ) = ρ ref Δ ρ J ( r ) + O Δ ρ J 2 ,
where the second term on the RHS contributes to cubic order in Δ ρ J and is therefore neglected under the Gaussian approximation. Meanwhile, the second-order functional derivative in Equation (A2) is given by
δ 2 F [ ρ J , ϕ 0 ] δ ρ J ( r ) δ ρ J ( r ) = δ 2 Ω V [ ρ J ] δ ρ J ( r ) δ ρ J ( r ) = δ ( r r ) ρ J ( r ) c ( r r ; ρ J ) = G 1 ( r r ; ρ J ) .
The first equality holds because the second functional derivative of T [ ρ J ] vanishes. The second equality is a known result in the DFT and corresponds to the inverse of G ( r r ; ρ ) in Equation (34), in accordance with the OZ equation [48].
Building on the above results, we are now ready to prepare the quadratic functional to be used in the Gaussian integration. Substituting the first- and second-order functional derivatives, Equations (A3) and (A6), into Equation (A2), and recalling that Φ [ ρ J , ϕ ] is defined by Equation (33), we obtain the following expression for Δ F [ ρ J + n , ϕ ] :
Δ F [ ρ J + n , ϕ ] = d r n ( r ) χ J ( r ) + 1 2 d r d r n ( r ) G 1 ( r r ; ρ J ) n ( r ) = d r χ J ( r ) n ( r ) + 1 2 d r d r ϕ ( r ) G ( r r ; ρ J ) ϕ ( r ) + O ( n , ϕ ) 3 ,
where the linear coupling term depends on the effective potential χ J ( r ) , defined by
χ J ( r ) = d x c ( r x ; ρ J ) Δ ρ J + T ( x ) .
Equation (A7) allows us to perform the Gaussian integral with respect to the ϕ -field first, yielding a ρ J -functional defined as
N [ ρ J ] = D ϕ exp 1 2 d r d r ϕ ( r ) G ( r r ; ρ J ) ϕ ( r ) .
It follows from Equations (A7) and (A9) that Equation (A1) becomes
e Ω [ J ] = e F [ ρ J , ϕ 0 ] + ln N [ ρ J ] D n e Δ F [ ρ J + n , ϕ 0 ] ,
thereby reducing the original functional integral to an integration over the density fluctuations n ( r ) alone.
To evaluate the functional integral in Equation (A10), we perform the square completion of the quadratic functional Δ F [ ρ J + n , ϕ 0 ] with respect to the fluctuating density field n ( r ) . This is achieved by introducing a new fluctuating density field n ˜ ( r ) that absorbs the linear coupling between n ( r ) and the effective potential χ J ( r ) in Equation (A7):
n ˜ ( r ) = n ( r ) + d r G ( r r ; ρ J ) χ J ( r ) .
By replacing the quadratic term of n ( r ) in Equation (A7) with the newly defined field n ˜ ( r ) , we obtain the following expression for Δ F [ ρ J , n ˜ , ϕ 0 ] :
Δ F [ ρ J , n ˜ , ϕ 0 ] = 1 2 d r d r n ˜ ( r ) G 1 ( r r ; ρ J ) n ˜ ( r ) 1 2 d r d r χ J ( r ) G ( r r ; ρ J ) χ J ( r ) ,
where the second term on the RHS is subtracted to cancel out the surplus contribution due to the variable change. Accordingly, Equation (A10) reduces to a Gaussian integral over the new field n ˜ ( r ) , yielding a ρ J -functional:
N 1 [ ρ J ] = D n ˜ exp 1 2 d r d r n ˜ ( r ) G 1 ( r r ; ρ J ) n ˜ ( r ) .
Combining Equations (A7), (A10), (A12), and (A13), we arrive at the following expression for the grand potential:
Ω [ J ] = F [ ρ J , ϕ 0 ] ln N [ ρ J ] ln N 1 [ ρ J ] 1 2 d r d r χ J ( r ) G ( r r ; ρ J ) χ J ( r ) = Ω V [ ρ J ] + T [ ρ J ] + Δ Ω [ J ] ,
Δ Ω [ J ] = 1 2 d r d r χ J ( r ) G ( r r ; ρ J ) χ J ( r ) ,
where the two logarithmic terms originating from the Gaussian integrations over the ϕ -and n-fields cancel each other.
Finally, we recast the surplus term arising from the completion of the square using the OZ equation. By inserting Equation (A8) into the expression (A15), one arrives at the following integral form:
d x d y d r d r c ( r x ; ρ J ) Δ ρ J + T ( x ) G ( r r ; ρ J ) c ( r y ; ρ J ) Δ ρ J + T ( y ) τ ( x y ) = d x d y Δ ρ J + T ( x ) Δ ρ J + T ( y ) τ ( x y ) ,
τ ( x y ) d r d r c ( r x ; ρ J ) G ( r r ; ρ J ) c ( r y ; ρ J ) .
The kernel τ ( x y ) defined in Equation (A17) can be transformed via the 3D OZ equation, recalled here [48]:
h ( r r ; ρ J ) = c ( r r ; ρ J ) + d r c ( r r ; ρ J ) ρ J ( r ) h ( r r ; ρ J ) .
Using the OZ equation twice, the kernel τ ( x y ) is rewritten as
τ ( x y ) = d r c ( r x ; ρ J ) ρ J ( r ) d r δ ( r r ) + h ( r r ) ρ J ( r ) c ( r y ; ρ J ) = d r c ( r x ; ρ J ) ρ J ( r ) h ( r y ; ρ J ) = h ( x y ; ρ J ) c ( x y ; ρ J ) ,
thereby confirming that τ ( x y ) is equivalent to the indirect correlation function, which is the difference between the TCF and the DCF: h ( x y ; ρ J ) c ( x y ; ρ J ) . It follows from Equations (A16), (A17), and (A19) that the surplus term can be expressed as the following density functional:
Δ Ω [ J ] = 1 2 d r d r Δ ρ J + T ( r ) h ( r r ; ρ J ) c ( r r ; ρ J ) Δ ρ J + T ( r ) .
Taken together, Equations (A14) and (A20) complete the derivation of Equations (35) and (36).

References

  1. Levin, Y. Electrostatic correlations: From plasma to biology. Rep. Prog. Phys. 2002, 65, 1577–1632. [Google Scholar] [CrossRef]
  2. Grosberg, A.Y.; Nguyen, T.T.; Shklovskii, B.I. Colloquium: The physics of charge inversion in chemical and biological systems. Rev. Mod. Phys. 2002, 74, 329–345. [Google Scholar] [CrossRef]
  3. Boroudjerdi, H.; Kim, Y.; Naji, A.; Netz, R.; Schlagberger, X.; Serr, A. Statics and dynamics of strongly charged soft matter. Phys. Rep. 2005, 416, 129–199. [Google Scholar] [CrossRef]
  4. Naji, A.; Jungblut, S.; Moreira, A.G.; Netz, R.R. Electrostatic interactions in strongly coupled soft matter. Phys. A Stat. Mech. Its Appl. 2005, 352, 131–170. [Google Scholar] [CrossRef]
  5. Naji, A.; Kanduč, M.; Forsman, J.; Podgornik, R. Perspective: Coulomb fluids—Weak coupling, strong coupling, in between and beyond. J. Chem. Phys. 2013, 139, 150901. [Google Scholar] [CrossRef] [PubMed]
  6. Wu, J. Understanding the Electric Double-Layer Structure, Capacitance, and Charging Dynamics. Chem. Rev. 2022, 122, 10821–10859. [Google Scholar] [CrossRef]
  7. Baus, M. Statistical mechanics of simple coulomb systems. Phys. Rep. 1980, 59, 1–94. [Google Scholar] [CrossRef]
  8. Ichimaru, S. Strongly coupled plasmas: High-density classical plasmas and degenerate electron liquids. Rev. Mod. Phys. 1982, 54, 1017–1059. [Google Scholar] [CrossRef]
  9. Martin, P.A. Sum rules in charged fluids. Rev. Mod. Phys. 1988, 60, 1075–1127. [Google Scholar] [CrossRef]
  10. Netz, R. Electrostatistics of counter-ions at and between planar charged walls: From Poisson-Boltzmann to the strong-coupling theory. Eur. Phys. J. E 2001, 5, 557–574. [Google Scholar] [CrossRef]
  11. Frusawa, H. Coarse-Grained Counterions in the Strong Coupling Limit. J. Phys. Soc. Jpn. 2004, 73, 507–510. [Google Scholar] [CrossRef]
  12. Chen, Y.G.; Weeks, J.D. Local molecular field theory for effective attractions between like charged objects in systems with strong Coulomb interactions. Proc. Natl. Acad. Sci. USA 2006, 103, 7560–7565. [Google Scholar] [CrossRef] [PubMed]
  13. Santangelo, C.D. Computing counterion densities at intermediate coupling. Phys. Rev. E 2006, 73, 041512. [Google Scholar] [CrossRef] [PubMed]
  14. Hatlo, M.M.; Lue, L. Electrostatic interactions of charged bodies from the weak- to the strong-coupling regime. Europhys. Lett. 2010, 89, 25002. [Google Scholar] [CrossRef]
  15. Šamaj, L.; Trizac, E. Wigner-crystal formulation of strong-coupling theory for counterions near planar charged interfaces. Phys. Rev. E 2011, 84, 041401. [Google Scholar] [CrossRef]
  16. Šamaj, L.; Trulsson, M.; Trizac, E. Strong-coupling theory of counterions between symmetrically charged walls: From crystal to fluid phases. Soft Matter 2018, 14, 4040–4052. [Google Scholar] [CrossRef]
  17. Palaia, I.; Trulsson, M.; Šamaj, L.; Trizac, E. A correlation-hole approach to the electric double layer with counter-ions only. Mol. Phys. 2018, 116, 3134–3146. [Google Scholar] [CrossRef]
  18. Frusawa, H. Transverse Density Fluctuations around the Ground State Distribution of Counterions near One Charged Plate: Stochastic Density Functional View. Entropy 2019, 22, 34. [Google Scholar] [CrossRef]
  19. Frusawa, H. Ground-state correlation energy of counterions at a charged planar wall: Gibbs-Bogoliubov lower-bound approach. Phys. Lett. A 2020, 384, 126512. [Google Scholar] [CrossRef]
  20. de Souza, J.P.; Bazant, M.Z. Continuum Theory of Electrostatic Correlations at Charged Surfaces. J. Phys. Chem. C 2020, 124, 11414–11421. [Google Scholar] [CrossRef]
  21. Frusawa, H. On the equivalence of self-consistent equations for nonuniform liquids: A unified description of the various modifications. J. Stat. Mech. Theory Exp. 2021, 2021, 013213. [Google Scholar] [CrossRef]
  22. Jancovici, B. Exact Results for the Two-Dimensional One-Component Plasma. Phys. Rev. Lett. 1981, 46, 386–388. [Google Scholar] [CrossRef]
  23. Hansen, J.P.; Levesque, D. The two-dimensional one-component plasma in the hypernetted chain approximation. J. Phys. C Solid State Phys. 1981, 14, L603–L608. [Google Scholar] [CrossRef]
  24. de Leeuw, S.; Perram, J. Statistical mechanics of two-dimensional Coulomb systems. Phys. A Stat. Mech. Its Appl. 1982, 113, 546–558. [Google Scholar] [CrossRef]
  25. Caillol, J.M.; Levesque, D.; Weis, J.J.; Hansen, J.P. A Monte Carlo study of the classical two-dimensional one-component plasma. J. Stat. Phys. 1982, 28, 325–349. [Google Scholar] [CrossRef]
  26. Piasecki, J.; Levesque, D. From monotonic to oscillatory decay of correlations: Analytical approximation for the two-dimensional, one-component plasma. J. Stat. Phys. 1987, 47, 489–503. [Google Scholar] [CrossRef]
  27. Šamaj, L.; Percus, J.K.; Kolesík, M. Two-dimensional one-component plasma at coupling Γ = 4: Numerical study of pair correlations. Phys. Rev. E 1994, 49, 5623–5627. [Google Scholar] [CrossRef] [PubMed]
  28. Muto, S.; Aoki, H. Crystallization of a classical two-dimensional electron system: Positional and orientational orders. Phys. Rev. B 1999, 59, 14911–14914. [Google Scholar] [CrossRef]
  29. Levesque, D.; Weis, J.J.; Lebowitz, J.L. Charge Fluctuations in the Two-Dimensional One-Component Plasma. J. Stat. Phys. 2000, 100, 209–222. [Google Scholar] [CrossRef]
  30. Šamaj, L. Is the Two-Dimensional One-Component Plasma Exactly Solvable? J. Stat. Phys. 2004, 117, 131–158. [Google Scholar] [CrossRef]
  31. Antlanger, M.; Mazars, M.; Šamaj, L.; Kahl, G.; Trizac, E. Taking one charge off a two-dimensional Wigner crystal. Mol. Phys. 2014, 112, 1336–1349. [Google Scholar] [CrossRef]
  32. Cardoso, G.; Stéphan, J.M.; Abanov, A.G. The boundary density profile of a Coulomb droplet. Freezing at the edge. J. Phys. A Math. Theor. 2020, 54, 015002. [Google Scholar] [CrossRef]
  33. Cardoso, G.; Stéphan, J.M.; Abanov, A.G. The density profile of a Coulomb plasma on a cylinder: Boundary oscillations. J. Phys. A Math. Theor. 2025, 58, 245002. [Google Scholar] [CrossRef]
  34. Kirchner, K.; Kirchner, T.; Ivaništšev, V.; Fedorov, M. Electrical double layer in ionic liquids: Structural transitions from multilayer to monolayer structure at the interface. Electrochim. Acta 2013, 110, 762–771. [Google Scholar] [CrossRef]
  35. de Souza, J.P.; Goodwin, Z.A.; McEldrew, M.; Kornyshev, A.A.; Bazant, M.Z. Interfacial Layering in the Electric Double Layer of Ionic Liquids. Phys. Rev. Lett. 2020, 125, 116001. [Google Scholar] [CrossRef]
  36. Jeanmairet, G.; Rotenberg, B.; Salanne, M. Microscopic Simulations of Electrochemical Double-Layer Capacitors. Chem. Rev. 2022, 122, 10860–10898. [Google Scholar] [CrossRef]
  37. Angiolari, F.; Coretti, A.; Salanne, M.; Bonella, S. Electrically driven first-order phase transition of a 2D ionic crystal at the electrode/electrolyte interface. arXiv 2025, arXiv:2507.19087. [Google Scholar] [CrossRef]
  38. Laanait, N.; Mihaylov, M.; Hou, B.; Yu, H.; Vanýsek, P.; Meron, M.; Lin, B.; Benjamin, I.; Schlossman, M.L. Tuning ion correlations at an electrified soft interface. Proc. Natl. Acad. Sci. USA 2012, 109, 20326–20331. [Google Scholar] [CrossRef]
  39. Miller, M.; Chu, M.; Lin, B.; Meron, M.; Dutta, P. Observation of Ordered Structures in Counterion Layers near Wet Charged Surfaces: A Potential Mechanism for Charge Inversion. Langmuir 2015, 32, 73–77. [Google Scholar] [CrossRef]
  40. Miller, M.; Chu, M.; Lin, B.; Bu, W.; Dutta, P. Atomic Number Dependent “Structural Transitions” in Ordered Lanthanide Monolayers: Role of the Hydration Shell. Langmuir 2017, 33, 1412–1418. [Google Scholar] [CrossRef] [PubMed]
  41. Sloutskin, E.; Tamam, L.; Sapir, Z.; Ocko, B.M.; Bain, C.D.; Kuzmenko, I.; Gog, T.; Deutsch, M. Counterions under a Surface-Adsorbed Cationic Surfactant Monolayer: Structure and Thermodynamics. Langmuir 2022, 38, 12356–12366. [Google Scholar] [CrossRef]
  42. Wang, J.; Li, H.; Tavakol, M.; Serva, A.; Nener, B.; Parish, G.; Salanne, M.; Warr, G.G.; Voïtchovsky, K.; Atkin, R. Ions Adsorbed at Amorphous Solid/Solution Interfaces Form Wigner Crystal-like Structures. ACS Nano 2023, 18, 1181–1194. [Google Scholar] [CrossRef] [PubMed]
  43. Han, T.; Xu, W.; Han, J.; Adibnia, V.; He, H.; Zhang, C.; Luo, J. Counterion Distribution in the Stern Layer on Charged Surfaces. Nano Lett. 2024, 24, 10443–10450. [Google Scholar] [CrossRef]
  44. Chau, H.H.; Li, H.; Atkin, R. Anion Size Controls Cation Wigner Crystal-Like Structures at Silica Interfaces. J. Phys. Chem. Lett. 2025, 16, 5695–5699. [Google Scholar] [CrossRef]
  45. Frusawa, H. Stochastic dynamics and thermodynamics around a metastable state based on the linear Dean–Kawasaki equation. J. Phys. A Math. Theor. 2019, 52, 065003. [Google Scholar] [CrossRef]
  46. Frusawa, H. Non-hyperuniform metastable states around a disordered hyperuniform state of densely packed spheres: Stochastic density functional theory at strong coupling. Soft Matter 2021, 17, 8810–8831. [Google Scholar] [CrossRef]
  47. Percus, J.K. Approximation Methods in Classical Statistical Mechanics. Phys. Rev. Lett. 1962, 8, 462–463. [Google Scholar] [CrossRef]
  48. Hansen, J.P.; McDonald, I.R. Theory of Simple Liquids: With Applications to Soft Matter; Academic Press: Cambridge, MA, USA, 2013. [Google Scholar] [CrossRef]
  49. Schneider, R. Convex Bodies: The Brunn–Minkowski Theory; Cambridge University Press: Cambridge, UK, 1993. [Google Scholar] [CrossRef]
  50. Cañete, A.; González Merino, B. On the isodiametric and isominwidth inequalities for planar bisections. Rev. Matemática Iberoam. 2020, 37, 1247–1275. [Google Scholar] [CrossRef]
  51. Ramakrishnan, T.V.; Yussouff, M. First-principles order-parameter theory of freezing. Phys. Rev. B 1979, 19, 2775–2794. [Google Scholar] [CrossRef]
  52. Evans, R. The nature of the liquid-vapour interface and other topics in the statistical mechanics of nonuniform, classical fluids. Adv. Phys. 1979, 28, 143–200. [Google Scholar] [CrossRef]
  53. Wu, J.; Li, Z. Density-Functional Theory for Complex Fluids. Annu. Rev. Phys. Chem. 2007, 58, 85–112. [Google Scholar] [CrossRef]
  54. Lado, F. Effective potentials in the integral quantum Hall effect. Phys. Rev. B 2003, 67, 245322. [Google Scholar] [CrossRef]
  55. Aupic, J.; Urbic, T. Thermodynamics and structure of a two-dimensional electrolyte by integral equation theory. J. Chem. Phys. 2014, 140, 184509. [Google Scholar] [CrossRef]
  56. Lomba, E.; Weis, J.J.; Lado, F. Structure and thermodynamics of a two-dimensional Coulomb fluid in the strong association regime. J. Chem. Phys. 2007, 127, 074501. [Google Scholar] [CrossRef]
  57. Ng, K.C. Hypernetted chain solutions for the classical one-component plasma up to Γ = 7000. J. Chem. Phys. 1974, 61, 2680–2689. [Google Scholar] [CrossRef]
  58. Anderson, D.G. Iterative Procedures for Nonlinear Integral Equations. J. ACM 1965, 12, 547–560. [Google Scholar] [CrossRef]
  59. Maass, F.; Martin, P.; Olivares, J. Analytic approximation to Bessel function J0(x). Comput. Appl. Math. 2020, 39, 222. [Google Scholar] [CrossRef]
  60. Walters, M.C.; Subramanian, P.; Archer, A.J.; Evans, R. Structural crossover in a model fluid exhibiting two length scales: Repercussions for quasicrystal formation. Phys. Rev. E 2018, 98, 012606. [Google Scholar] [CrossRef] [PubMed]
  61. Torquato, S. Hyperuniform states of matter. Phys. Rep. 2018, 745, 1–95. [Google Scholar] [CrossRef]
  62. Velev, O.D.; Bhatt, K.H. On-chip micromanipulation and assembly of colloidal particles by electric fields. Soft Matter 2006, 2, 738. [Google Scholar] [CrossRef]
  63. Besra, L.; Liu, M. A review on fundamentals and applications of electrophoretic deposition (EPD). Prog. Mater. Sci. 2007, 52, 1–61. [Google Scholar] [CrossRef]
  64. Chai, Z.; Childress, A.; Busnaina, A.A. Directed Assembly of Nanomaterials for Making Nanoscale Devices and Structures: Mechanisms and Applications. ACS Nano 2022, 16, 17641–17686. [Google Scholar] [CrossRef] [PubMed]
Figure 1. Schematic illustration of the system considered in this study. The figure consists of two panels: (a) a 3D view and (b) its cross-sectional counterpart. In both panels, a negatively charged plate and counterions are depicted, along with coordinate axes and several vectors and lengths introduced in the main text. (a) The Cartesian coordinate system is shown on the surface of the charged plate. The three vectors illustrate the electric field vector with magnitude E (fixed in the direction that attracts q-valent cationic counterions), the position vector r of a counterion, and its projection onto the x y -plane, s , so that r = ( x , y , z ) T and s = ( x , y , 0 ) T (see Equations (5) and (47)). (b) A cross-sectional view parallel to the z-axis. All lengths are expressed in units of the WS radius a, where the label z = 1 corresponds to a distance equal to the WS radius. The strong 3D coupling regime ( γ = 1 / λ 1 ) is represented by the condition λ 1 , with λ being the effective Gouy–Chapman length defined in Equation (15). The minimal inter-particle separation in the isotropic liquid state, d min , is given by Equation (6) as d min = π 1.77 . This distance is illustrated by the separation between a test counterion and its nearest neighbor on the charged plate. Here, the test counterion, located at s 0 = ( x 0 , y 0 , 0 ) T (see Equation (48)), is placed at the origin ( x 0 = y 0 = 0 ) in Equation (54) without loss of generality.
Symmetry 17 01783 g001
Figure 2. Comparison between the 2D Coulomb interaction potential ( u ( s ) = Γ ln s ) that contains no exponential integral in Equation (65) and the long-range part of the DCF with a negative sign ( c L ( s ) ) given by Equation (65). The y-axis represents u ( s ) or c L ( s ) in units of Γ with the x-axis showing the inter-particle separation s.
Symmetry 17 01783 g002
Figure 3. Radial distribution function g ( s ) for counterions localized on a charged plate, plotted for various values of the coupling constant Γ ranging from 2 to 80. (a) Results for Γ = 2 , 4 , 10 in the range 0 s 5 . Solid lines represent our results based on the HNC approximation, while the dashed line corresponds to the exact result at Γ = 2 [22]. (b) Results for Γ = 20 , 40 , 80 in the range 0 s 8 , all obtained using the HNC approximation.
Symmetry 17 01783 g003
Figure 4. Logarithmic plots of s h ( s ) as a function of s, using the results shown in Figure 3b. The data correspond to three values of the coupling constant, Γ = 20 , 40, and 80. Colored dots represent the results obtained from the HNC approximation, while the corresponding solid lines (in matching color tones) indicate the fitting curves derived from the asymptotic expression (77).
Symmetry 17 01783 g004
Figure 5. Structure factor S ( k ) for Γ = 10 , 20, 40, and 80, calculated using the HNC closure (72) as in Figure 3. (a) Linear plot of S ( k ) as a function of k. (b) Log–log plot of the same data, focusing on the small-wavenumber regime in the range 3 ln k 1 .
Symmetry 17 01783 g005
Table 1. Wavelength λ and decay length ξ as a function of the 2D coupling constant Γ obtained from the fit to the asymptotic form (77). The values are rounded to three decimal places.
Γ Wavelength λ Decay Length ξ
201.9100.852
401.8341.256
801.7931.912
Table 2. List of fitting parameters and comparison with theoretical values for different 2D coupling constants Γ . The slope α and intercept β are obtained from linear regression, yielding κ fit 2 = e β as the fitted result for the 2D Debye–Hückel length κ fit 1 . The relative error quantifies the deviation from theoretical predictions: | κ 1 κ fit 1 | / κ 1 , where κ 2 = 2 Γ , as given by Equation (62). The values are rounded to two decimal places.
Γ Slope α Intercept β κ fit 2 Relative Error [%]
102.012.9719.591.05
202.013.6638.941.35
402.014.3577.581.55
802.015.04154.051.91
Table 3. The scheme for obtaining analytical results is summarized in four steps, with representative equations selected for each. Each step illustrates the theoretical progression from hybrid DFT–statistical field theory for the 3D grand potential Ω [ J ] to the conventional Percus relation [47,48] for the equilibrium 2D density σ eq ( s ) , in the limit of strong 3D coupling ( γ ).
StepPhysical QuantityEquationsInterpretation
1 Ω [ J ]
(grand potential)
(29) and (30)Hybrid theory combining DFT and statistical field theory
2 Ω [ J ]
(grand potential)
(35) and (36)Resulting form in the Gaussian approximation
3 ρ eq ( r )
(equilibrium 3D density)
(46)Extended relation of the Percus test-particle method in 3D systems
4 σ eq ( s )
(equilibrium 2D density)
(56)Conventional Percus relation in 2D systems
Disclaimer/Publisher’s Note: The statements, opinions and data contained in all publications are solely those of the individual author(s) and contributor(s) and not of MDPI and/or the editor(s). MDPI and/or the editor(s) disclaim responsibility for any injury to people or property resulting from any ideas, methods, instructions or products referred to in the content.