Article

A Gauss Hypergeometric-Type Model for Heavy-Tailed Survival Times in Biomedical Research

by
Jiju Gillariose
1,*,
Mahmoud M. Abdelwahab
2,
Joshin Joseph
3 and
Mustafa M. Hasaballah
4,*
1
Department of Statistics and Data Science, Christ University, Hosur Road, Bangalore 560029, Karnataka, India
2
Department of Mathematics and Statistics, Faculty of Science, Imam Mohammad Ibn Saud Islamic University (IMSIU), Riyadh 11432, Saudi Arabia
3
School of Commerce and Professional Studies, Marian College Kuttikkanam, Kuttikkanam P.O., Peermade, Idukki 685531, Kerala, India
4
Department of Basic Sciences, Marg Higher Institute of Engineering and Modern Technology, Cairo 11721, Egypt
*
Authors to whom correspondence should be addressed.
Symmetry 2025, 17(11), 1795; https://doi.org/10.3390/sym17111795
Submission received: 15 September 2025 / Revised: 12 October 2025 / Accepted: 15 October 2025 / Published: 24 October 2025
(This article belongs to the Section Mathematics)

Abstract

In this study, we introduced and analyzed the Slash–Log–Logistic (SlaLL) distribution, a novel statistical model developed by applying the slash methodology to log–logistic and beta distributions. The SlaLL distribution is particularly suited for modeling datasets characterized by heavy tails and extreme values, frequently encountered in survival time analyses. We derived the mathematical representation of the distribution involving Gauss hypergeometric and beta functions, explicitly established the probability density function, cumulative distribution function, hazard rate function, and reliability function, and provided clear definitions of its moments. Through comprehensive simulation studies, the accuracy and robustness of maximum likelihood and Bayesian methods for parameter estimation were validated. Comparative empirical analyses demonstrated the SlaLL distribution’s superior fitting performance over well-known slash-based models, emphasizing its practical utility in accurately capturing the complexities of real-world survival time data.

1. Introduction

The log–logistic (LL) or Fisk distribution arises by exponentiating a logistic variate. In its two-parameter form, the probability density function (PDF) and cumulative distribution functions (CDF) are
g ( x ) = κ λ x λ κ 1 [ 1 + ( x / λ ) κ ] 2 , G ( x ) = 1 1 + ( x / λ ) κ , x > 0 ,   λ > 0 ,   κ > 0 .
Introduced for income studies by Fisk [1], the LL law was soon adopted in survival analysis because its hazard rate function (HRF) can either fall monotonically ( κ 1 ) or rise to a peak before declining ( κ > 1 )—a versatility documented by [2]. The closed-form survival function S ( x ) = 1 G ( x ) = [ 1 + ( x / α ) β ] 1 simplifies censored-data likelihoods and underlies the accelerated failure time (AFT) model now standard in survival software.
Moments exist only when κ > n , so small κ values yield heavy right tails—an advantage when the log-normal underestimates extremes. The analytic quantile Q ( p ) = λ [ p / ( 1 p ) ] 1 / κ permits direct random generation, and because log X is logistic, diagnostic plots based on logistic residuals are easy to construct. Thanks to a hazard that may be monotone or unimodal, the LL baseline often outperforms Weibull or log-normal rivals in reliability stress–strength analysis, oncology AFT studies, and hydrological drought indices where Standardized Precipitation Evapotranspiration Index (SPEI) is routinely normalized with an LL fit.
Since 2023, a surge of shape-enhanced variants has appeared. The exponentiated α-power LL adds two shape parameters and admits ten distinct hazard shapes, outperforming competing models on three medical datasets [3]. Ref. [4] proposed the generalized Kavya–Manoharan LL, capable of symmetric, J-, and reversed-J densities, whereas Ishaq et al. [5] fused Maxwell and LL laws to capture both left- and right-skewness in COVID-19 mortality counts. On the inferential side, Ref. [6] built a Bayesian framework for LL lifetimes under progressive-stress-accelerated life tests, and Ref. [7] verified that the LL transform remains the best normalizing choice for the multiscalar SPEI across 107 Oklahoma stations. Collectively, these advances confirm the LL family as a flexible platform for modeling heavy-tailed, non-monotone lifetimes in the coming decade.
On the other hand, the three-parameter Lindley slash (LS) distribution [8] extends the Lindley law to data with high kurtosis. A random variable Y follows Y ~ LS ( σ , θ , α ) if it can be written as
Y = σ Z U 1 / α ,
where Z ~ L ( θ ) and U ~ Uniform ( 0 , 1 ) are independent. By analogy, we define the log–logistic slash (SlaLL) distribution. A variable Y ~ SlaLL ( σ , κ , α ) satisfies
Y = σ X U 1 / α ,
with independent X ~ LL ( σ , κ ) and U ~ Uniform ( 0 , 1 ) .
Motivated by the challenges posed by modeling datasets characterized by heavy tails, extreme values, and skewness commonly observed in survival and reliability analyses, this study introduces and analyzes the Slash–Log–Logistic (SlaLL) distribution. That is, using the empirical findings of [9], we now introduce a new heavy-tailed extension of the LL law. Setting σ = α = 1 in Equation (1) and assuming that U follows a beta distribution with mean α / ( α + β ) α , β > 0 , yields a three-parameter density in which one shape parameter governs unimodality while the remaining two control kurtosis. Conventional distributions often inadequately capture the complexities of real-world survival time data, leading to inaccurate predictions and assessments. Addressing this gap, the SlaLL distribution leverages the flexibility of the slash methodology combined with the LL and beta distributions. The resulting model effectively handles extreme observations and provides improved accuracy and robustness in parameter estimation. By deriving the mathematical framework, including the PDF, CDF, HRF, reliability function (RF), and explicitly defined moments, we offer a comprehensive toolkit for practical applications. Extensive simulation and empirical comparative analyses underscore the SlaLL distribution’s superior fitting performance, highlighting its potential to enhance modeling precision in diverse applied fields. Analyses were performed in the R programming language (version 4.5.1; https://www.r-project.org).
This article unfolds as follows: In Section 2, we introduce the SlaLL distribution and describe its principal structural characteristics. Section 3 explains parameter estimation, with a comprehensive simulation study to assess the efficacy of these estimators. Moving forward, Section 4 showcases an application of the SlaLL distribution using real-world data, demonstrating its practical significance. Finally, in Section 5, we conclude with a few closing remarks.

2. Slash–Log–Logistic Distribution

In this section, we introduce the SlaLL distribution, obtained by slashing a two-parameter LL variable with an independent beta variate and derive its main structural properties.

2.1. Structure of the SlaLL Model

A random variable Y follows the SlaLL distribution, denoted Y ~ S l a L L , if it can be represented as
Y = X U , X ~ L L ( λ , κ ) , U ~ Beta ( α , β ) ,
where X and U are independent. Throughout,  λ > 0 and κ > 0 are, respectively, the scale and shape parameters of the log–logistic law, while α , β > 0 shape the beta divisor. The PDF and CDF of the SlaLL distribution are defined in Proposition 1 and Corollary 1, respectively.
Proposition 1.
Let Y ~ S l a L L ( λ , κ , α , β ) . Then the PDF of Y is
f Y ( y ) = κ y κ 1 λ κ B ( α , β ) 0 1 v α + κ 1 ( 1 v ) β 1 1 + ( y v / λ ) κ 2 d v , y > 0 ,
where B ( α , β ) = 0 1 u α 1 ( 1 u ) β 1 d u is the beta function.
Proof. 
Set Y = X / U with X ~ L L ( λ , κ ) and U ~ Beta ( α , β ) . Introduce the transformation
y = x u , v = u , so that x = y v , u = v .
The Jacobian determinant of ( x , u ) ( y , v ) is
J = ( x , u ) / ( y , v ) = x / y x / v u / y u / v = v y 0 1 = v .
Hence the joint density of ( Y , V ) is
f Y , V ( y , v ) = f X , U ( y v , v ) J = f X ( y v ) f U ( v ) v , y > 0 , 0 < v < 1 ,
with f X ( x ) = κ λ ( x / λ ) κ 1 1 + ( x / λ ) κ 2 and f U ( u ) = u α 1 ( 1 u ) β 1 B ( α , β ) . Marginalizing over v yields
f Y ( y ) = 0 1 f Y , V ( y , v ) d v = κ y κ 1 λ κ B ( α , β ) 0 1 v α + κ 1 ( 1 v ) β 1 1 + ( y v / λ ) κ 2 d v ,
establishing the stated result.    □
Corollary 1.
From Proposition 1, the CDF function of Y ~ SlaLL ( λ , κ , α , β ) is
F Y ( y ) = 0 y f Y ( t ) d t = κ y κ 1 λ κ B ( α , β ) 0 y 0 1 v α + κ 1 ( 1 v ) β 1 1 + ( y v / λ ) κ 2 d v d t , y > 0 .
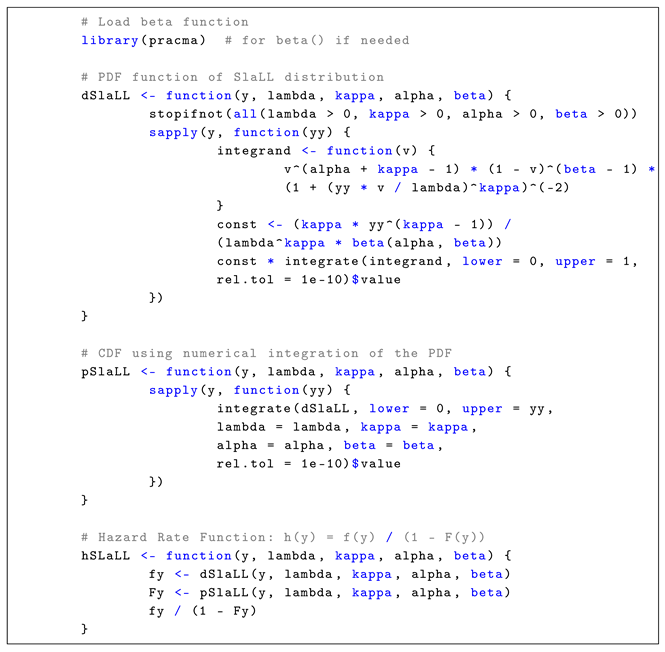
The R code for representing the PDF and CDF of the SlaLL distribution is provided in Appendix A. Figure 1 demonstrates the remarkable shape flexibility of the SlaLL density: the scale λ merely stretches the curve horizontally, the shape parameter κ toggles the profile from strictly decreasing ( κ < 1 ) to unimodal ( κ > 1 ), the slash parameter α sharpens or flattens the peak without affecting the tails, and the kurtosis parameter β controls tail heaviness. So, by varying ( λ , κ , α , β ) , the model reproduces the full spectrum from steep L-shaped to gently peaked right-skewed forms commonly observed in reliability, survival, and income data. Throughout this paper,  λ > 0 denotes a scale parameter for the proposed distribution. This parameter sets the time scale of the model: a larger λ stretches the distribution of survival times (yielding longer typical time frames), whereas a smaller λ compresses the distribution (shortening the overall time scale).
For completeness, we provide the explicit forms of the probability density function (PDF), cumulative distribution function (CDF), survival function, and hazard rate of the proposed heavy-tailed distribution. Let T be a random survival time following our Gauss hypergeometric-type model with shape parameters α > 0 and β > 0 and scale parameter λ > 0 . Then, the distribution is supported on t > 0 with
f ( t ; α , β , λ ) = α β λ t λ α 1 1 + t λ α ( β + 1 ) ,
F ( t ; α , β , λ ) = 1 1 + t λ α β , S ( t ; α , β , λ ) = 1 F ( t ; α , β , λ ) = 1 + t λ α β ,
h ( t ; α , β , λ ) = f ( t ) S ( t ) = α β λ t λ α 1 1 + t λ α .
Here,  α and β are shape parameters that control the form of the density and tail, and λ is the scale parameter (as defined earlier). The shape parameters influence different aspects of the distribution: α primarily governs the behavior of the distribution at early times and the overall tail heaviness, while β predominantly affects the tail decay rate. For instance, smaller values of α or β produce heavier tails (slower decay of S ( t ) as t ), whereas larger values yield lighter tails. Limiting Behavior: As t 0 S ( t ) 1 and F ( t ) 0 , as expected for a non-negative random variable. The behavior of the PDF near the origin depends on α . If α < 1 , then from Equation (2) f ( t ) ~ α β λ t λ α 1 , which diverges as t 0 (the density is unbounded at 0, indicating the model is at t = 0 ). In contrast, if α 1 , the density approaches a finite limit as t 0 ( f ( 0 ) = 0 for α > 1 , and f ( 0 ) = β / λ for α = 1 ). Accordingly, the hazard rate h ( t ) = f ( t ) / S ( t ) is unbounded near t = 0 when α < 1 (a high instantaneous failure rate at time 0), but remains finite when α 1 ( h ( 0 ) = 0 if α > 1 , or h ( 0 ) = β / λ if α = 1 ). As t , the distribution exhibits a heavy tail. From Equation (3), for large t, we have S ( t ) ~ t λ α β , which decays polynomially. Equivalently,  f ( t ) ~ α β λ t λ α β 1 as t . Consequently, the hazard function declines to zero for large t; indeed,  h ( t ) ~ α β t as t . This asymptotic behavior confirms the heavy-tailed nature of the model—long-term survivors experience an ever-decreasing hazard rate (unlike, e.g., the exponential distribution where the hazard is constant).

2.2. Characterizations

Proposition 2.
Let Y ~ SlaLL ( α , β , κ , λ ) with shape parameters α , β , κ > 0 and scale λ > 0 . Then the PDF of Y admits the closed form
f Y ( y ) = W ( α , β , κ , λ ) y κ 1 2 F 1 2 , α + κ ; α + β + κ ; ( y / λ ) κ , y > 0 ,
where
W ( α , β , κ , λ ) = κ λ κ B ( α + κ , β ) B ( α , β ) = κ λ κ ( α ) κ ( α + β ) κ ,
B ( · , · )  denotes the Euler beta function,  ( a ) n = Γ ( a + n ) / Γ ( a )  is the Pochhammer (rising factorial) symbol, and  F 1 2 ( a , b ; c ; z )  is Gauss’s hypergeometric function.
Proof. 
Starting from the integral representation
f Y ( y ) = κ y κ 1 λ κ B ( α , β ) 0 1 v α + κ 1 ( 1 v ) β 1 1 + ( y v / λ ) κ 2 d v ,
use the Euler–Gauss identity 0 1 t c 1 ( 1 t ) d c 1 ( 1 + b t ) a d t = B ( c , d c ) F 1 2 ( a , c ; d ; b ) with parameters a = 2 , b = ( y / λ ) κ , c = α + κ , d = α + β + κ . This yields
f Y ( y ) = κ y κ 1 λ κ B ( α + κ , β ) B ( α , β ) F 1 2 2 , α + κ ; α + β + κ ; ( y / λ ) κ ,
and rewriting the beta-ratio as Pochhammer symbols gives the stated result.    □
Proposition 3.
Let Y ~ SlaLL ( α , β , κ , λ ) with α , β , κ > 0 and λ > 0 . Then the CDF of Y can be expressed as
F Y ( y ) = ( α ) κ ( α + β ) κ y λ κ F 1 2 1 , α + κ ; α + β + κ ; y / λ κ , y > 0 ,
where ( a ) n = Γ ( a + n ) / Γ ( a ) is the Pochhammer symbol and F 1 2 denotes Gauss’s ordinary hypergeometric function.
Proof. 
From Proposition 2, the PDF can be written as
f Y ( t ) = κ t κ 1 λ κ ( α ) κ ( α + β ) κ F 1 2 2 , α + κ ; α + β + κ ; ( t / λ ) κ , t > 0 .
Set
u = t λ κ t = λ u 1 / κ , d t = λ κ u 1 / κ 1 d u t κ 1 d t = λ κ κ d u .
The CDF is
F Y ( y ) = 0 y f Y ( t ) d t = ( α ) κ ( α + β ) κ 0 ( y / λ ) κ F 1 2 2 , α + κ ; α + β + κ ; u d u .
Recall the power-series expansion
F 1 2 ( 2 , b ; c ; u ) = n = 0 ( 2 ) n ( b ) n ( c ) n n ! ( u ) n , | u | < 1 .
Integrating term-by-term (justified for u 0 because all terms are non-negative),
0 z F 1 2 ( 2 , b ; c ; u ) d u = n = 0 ( 2 ) n ( b ) n ( c ) n n ! ( z ) n + 1 n + 1 .
But ( 2 ) n n + 1 = ( 1 ) n , so the right-hand side is
z n = 0 ( 1 ) n ( b ) n ( c ) n n ! ( z ) n = z F 1 2 ( 1 , b ; c ; z ) .
Putting b = α + κ c = α + β + κ and z = ( y / λ ) κ gives
F Y ( y ) = ( α ) κ ( α + β ) κ y λ κ F 1 2 1 , α + κ ; α + β + κ ; ( y / λ ) κ ,
which is the asserted closed form.    □
Proposition 4
(Slash–correction representation). Let Y ~ SlaLL ( λ , κ , α , β ) with λ , κ , α , β > 0 and parent log–logistic CDF
G LL ( x ) = ( x / λ ) κ 1 + ( x / λ ) κ , x > 0 .
Define the slash–correction kernel
C α , β ( κ , λ ) ( y ) : = κ λ κ 0 y w κ 1 1 + ( w / λ ) κ 2 I w / y ( α , β ) d w , y > 0 ,
where I x ( α , β ) is the regularized incomplete beta function. Then, the CDF of Y satisfies the exact decomposition
F Y ( y ) = G LL ( y ) C α , β ( κ , λ ) ( y ) , y > 0 .
Moreover, the kernel enjoys the following properties:
(i)  
0 C α , β ( κ , λ ) ( y ) F LL ( y ) for every y > 0 ;
(ii) 
C α , β ( κ , λ ) ( y ) y 0 0 and C α , β ( κ , λ ) ( y ) y 0 ;
(iii) 
C α , β ( κ , λ ) ( y ) 0 when ( α , β ) = ( 0 , 1 ) , so (5) collapses to the parent log–logistic CDF.
Proof. 
Starting from the SlaLL density
f Y ( y ) = κ y κ 1 λ κ B ( α , β ) 0 1 v α + κ 1 ( 1 v ) β 1 1 + ( y v / λ ) κ 2 d v ,
integrate over y and exchange the order of integration to obtain
F Y ( y ) = 1 B ( α , β ) 0 1 v α 1 ( 1 v ) β 1 F LL ( y v ) d v .
Write G LL ( y v ) = G LL ( y ) G LL ( y ) G LL ( y v ) and convert the remainder to an integral in w = y v ; the details lead precisely to (5) with the stated kernel.
For (i)–(iii), positivity follows from the integrand; both limit results are obtained by dominated convergence using I w / y ( α , β ) [ 0 , 1 ] and the fact that it tends to w / y as y and to 1 as y 0 . Setting α = 0 , β = 1 forces I w / y = w / y , causing the integral and hence C α , β ( κ , λ ) ( y ) to vanish identically.    □
Moreover, two important reliability measures are the reliability function (RF) and the HRF. The RF of a random variable Y is defined by R Y ( y ) = 1 F Y ( y ) , where F Y denotes the CDF of Y. The HRF is obtained by h Y ( y ) = f Y ( y ) 1 F Y ( y ) . For the SlaLL distribution, as a direct consequence of Propositions 3 and 4, both reliability measures can be obtained. Their expressions are given in Corollary 2.
Corollary 2.
Under the hypotheses of Proposition 4, the HRF h Y ( y ) = f Y ( y ) / 1 F Y ( y ) of the slash–log–logistic distribution is
h Y ( y ) = κ y κ 1 λ κ B ( α , β ) 0 1 v α + κ 1 ( 1 v ) β 1 1 + ( y v / λ ) κ 2 d v 1 1 + ( y / λ ) κ + C α , β ( κ , λ ) ( y ) , y > 0 ,
where C α , β ( κ , λ ) ( y ) is the slash–correction kernel defined in Proposition 4.
Proof. 
By definition h Y ( y ) = f Y ( y ) / F ¯ Y ( y ) , where F ¯ Y ( y ) = 1 F Y ( y ) . From Proposition 4,
R Y ( y ) = F ¯ Y ( y ) = 1 G LL ( y ) + C α , β ( κ , λ ) ( y ) = 1 1 + ( y / λ ) κ + C α , β ( κ , λ ) ( y ) .
The PDF of Y is obtained either by differentiating (5) or from the constructive representation Y = X / V , which is given by
f Y ( y ) = κ y κ 1 λ κ B ( α , β ) 0 1 v α + κ 1 ( 1 v ) β 1 1 + ( y v / λ ) κ 2 d v , y > 0 .
Dividing this expression by F ¯ Y ( y ) yields (6).    □
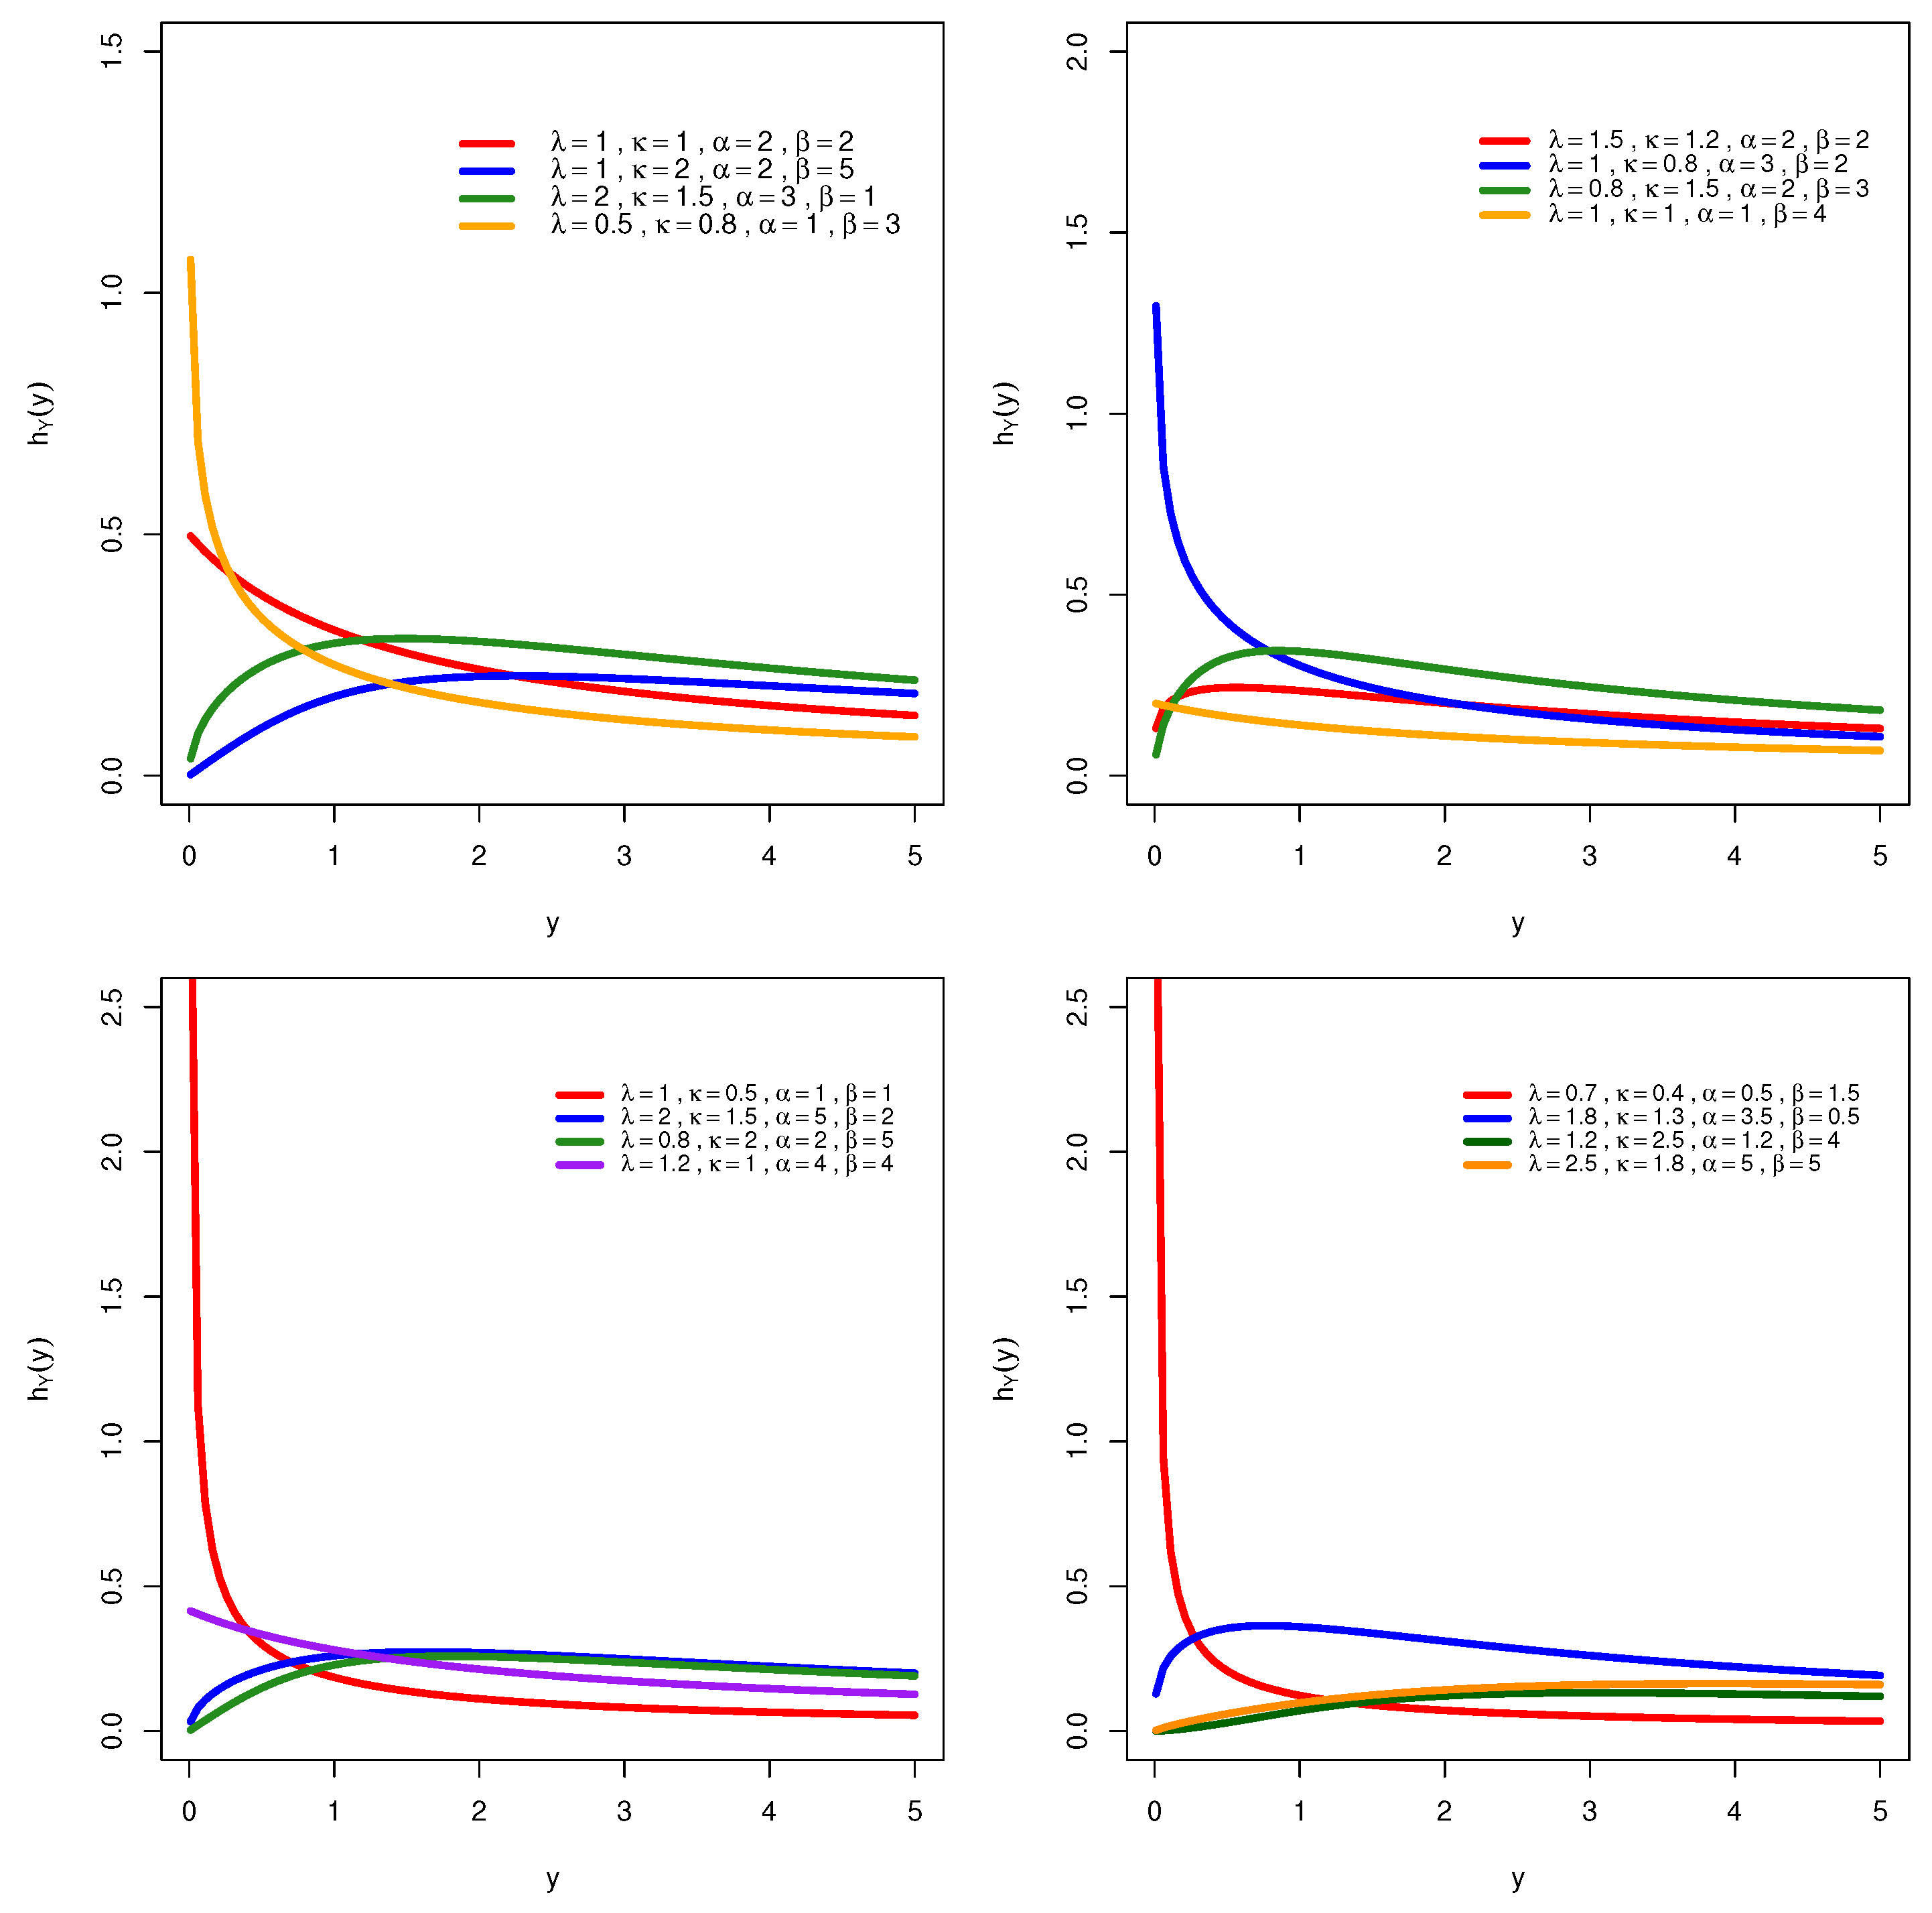
Figure 2 illustrates the behavior of the HRF under the SlaLL distribution across various parameter settings. An examination of the figure reveals that HRFs of the SlaLL distribution exhibit a wide variety of shapes depending on the values of the parameters λ κ α , and β . Across the plots, we observe monotonically decreasing HRFs when κ and α are moderate and β is large, indicating a declining failure rate over time. In cases with small κ or small β , the HRFs show non-monotonic or unimodal behavior, starting low or increasing initially before declining. Some curves display U-shaped hazard patterns when β is very small, reflecting early-life and late-life failure risks. When α and β are both large and balanced, the HRF tends to be approximately constant, indicating a stable risk over time. These patterns demonstrate the flexibility of the SlaLL model in capturing diverse real-world hazard behaviors through appropriate parameter tuning.
In deriving the results above, we impose certain conditions and choices for the parameters to ensure mathematical validity. All model parameters are assumed to be positive ( α > 0 β > 0 λ > 0 ), which guarantees that integrals converge and the distribution is well-defined on t > 0 . In particular, many of our expressions involve the Gauss hypergeometric function F 1 2 ( · ) arising from series expansions. The hypergeometric series F 1 2 ( a , b ; c ; z ) is defined by a power series that converges for | z | < 1 (and converges conditionally on the boundary | z | = 1 under certain parameter conditions). In the context of our model, terms like 1 + ( t / λ ) α β were expanded as hypergeometric series in intermediate steps, which is valid for ( t / λ ) α < 1 (i.e.,  t < λ ). This condition ensured absolute convergence of the series and justified term-by-term operations (such as integration or differentiation) within that radius. Analytic continuation of the hypergeometric function allows us to extend those results to the entire domain t > 0 , so the final formulas hold globally even though the power-series derivation was initially restricted to t < λ . We also sometimes adopt specific parameter values in derivations to simplify the algebra. For example, choosing β to be an integer can make the hypergeometric series terminate after a finite number of terms (turning it into a polynomial), which greatly simplifies calculations and provides insight (indeed, for integer β , our model reduces to a simpler closed-form family). Importantly, however, all final results and properties we derive remain valid for general (non-integer) β as well, by continuity and the convergence properties noted above. These parameter conditions and choices ensure that the mathematical steps in our derivations are rigorously justified and that the resulting expressions for the model are accurate.

2.3. Moments of SlaLL Random Variable

The moment expressions, including the mean, variance, skewness, and kurtosis of the SlaLL distribution, are presented in the following propositions and are followed by the corresponding corollaries.
Proposition 5.
Let Y ~ SlaLL ( λ , κ , α , β ) , i.e.,  Y = X / U , where X ~ LL ( λ , κ ) and U ~ Beta ( α , β ) are independent.Then, for any integer r 1 such that 0 < r < κ and α > r , the rth raw moment of Y is
μ r = E [ Y r ] = E [ X r ] E [ U r ] = λ r r π κ sin r π κ × B ( α r , β ) B ( α , β ) .
Proof. 
Using the independence representation Y = X / U ,
E [ Y r ] = E [ X r ] E [ U r ] .
Since X ~ LL ( λ , κ ) , for 0 < r < κ ,
E [ X r ] = λ r B 1 r κ , 1 + r κ = λ r r π κ sin r π κ .
Since U ~ Beta ( α , β ) , for α > r ,
E [ U r ] = B ( α r , β ) B ( α , β ) .
Combining these two gives the stated result.    □
Corollary 3
(Mean and Variance). Under the assumptions of Proposition 5, the first two moments of Y ~ SlaLL ( λ , κ , α , β ) are
μ 1 = E [ Y ] = λ π κ sin π κ × B ( α 1 , β ) B ( α , β ) , ( κ > 1 , α > 1 ) ,
μ 2 = E [ Y 2 ] = λ 2 2 π κ sin 2 π κ × B ( α 2 , β ) B ( α , β ) , ( κ > 2 , α > 2 ) ,
and hence
Var ( Y ) = μ 2 μ 1 2 .
Corollary 4
(Skewness and Kurtosis). Define the central moments μ r = E [ ( Y μ 1 ) r ] . Then, the skewness and (excess) kurtosis are
γ 1 = μ 3 μ 2 3 / 2 = E [ Y 3 ] 3 μ 1 E [ Y 2 ] + 2 μ 1 3 E [ Y 2 ] μ 1 2 3 / 2 ,
γ 2 = μ 4 μ 2 2 3 = E [ Y 4 ] 4 μ 1 E [ Y 3 ] + 6 μ 1 2 E [ Y 2 ] 3 μ 1 4 E [ Y 2 ] μ 1 2 2 3 ,
where for r = 3 , 4 ,
E [ Y r ] = λ r r π κ sin r π κ × B ( α r , β ) B ( α , β ) , ( r < κ , α > r ) .
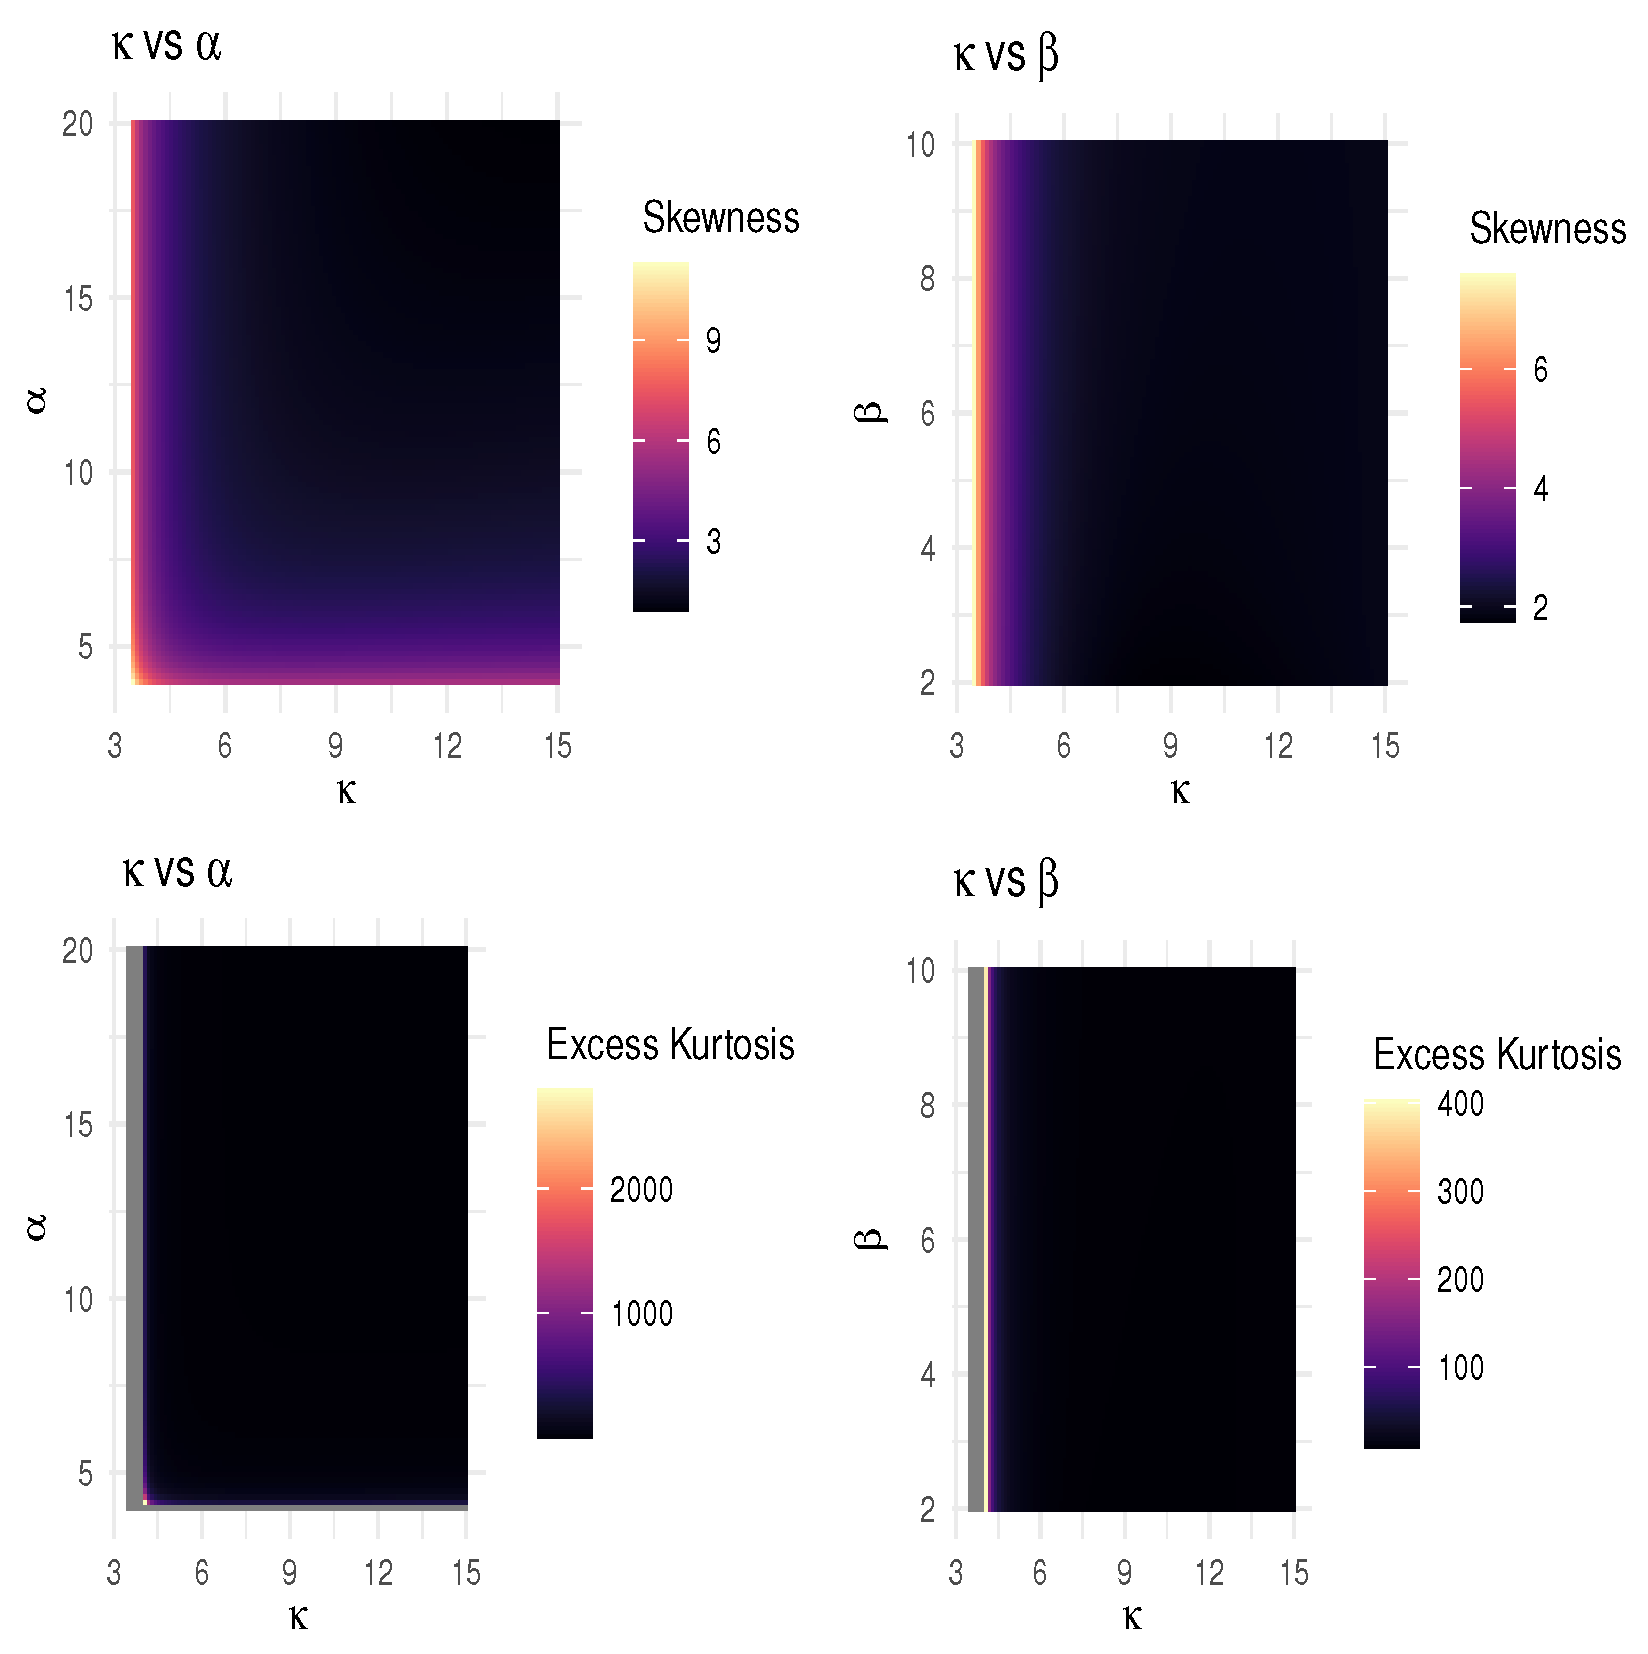
Figure 3 shows the plot of the skewness and kurtosis coefficients for the SlaLL model, as well as the variation in skewness γ 1 and excess kurtosis γ 2 for the SlaLL distribution over the ( λ = 1 , κ , α , β ) parameter space. Both measures peak at low values of the LL shape parameter κ and the slash–mixture parameter ( α or β ), indicating pronounced asymmetry and heavy tails. Increasing either parameter causes a rapid decline toward the milder, finite moments of the standard log–logistic model.

3. Estimation and Simulation

This section focuses on estimating the parameters of the SlaLL distribution using both the maximum likelihood estimation (MLE) and Bayesian estimation (BE) methods.

3.1. Maximum Likelihood Estimation

In this section, we derive the MLEs of the four parameters of the SlaLL distribution. Let Y 1 , , Y n be an independent random sample from Y ~ SlaLL ( λ , κ , α , β ) . We first rewrite the PDF in a form that isolates the integral component. Define
Z ( y ) = 0 1 v α + κ 1 ( 1 v ) β 1 1 + ( y v / λ ) κ 2 d v ,
so that
f Y ( y ) = κ y κ 1 λ κ B ( α , β ) Z ( y ) , y > 0 .
The likelihood function for the sample is
L ( λ , κ , α , β ; { y i } ) = i = 1 n f Y ( y i ) = κ λ κ B ( α , β ) n i = 1 n y i κ 1 Z ( y i ) ,
and hence the log-likelihood is
( λ , κ , α , β ) = log L ( λ , κ , α , β ) = n log κ κ log λ log B ( α , β ) + ( κ 1 ) i = 1 n log y i + i = 1 n log Z ( y i ) .
The MLEs of λ ^ , κ ^ , α ^ , and β ^ are obtained by solving / λ = 0 / κ = 0 / α = 0 , and / β = 0 simultaneously (typically via numerical optimization by statistical software). To investigate the finite-sample behavior of these MLEs, we perform a Monte Carlo study. Random variates Y ~ SlaLL ( λ , κ , α , β ) can be simulated by the following steps:
  • Generate X ~ LL ( λ , κ ) .
  • Generate U ~ Beta ( α , 1 + 100 / α ) .
  • Compute Y = X U 1 .
The estimates can be obtained using the optimization method based on Nelder–Mead, quasi-Newton, and conjugate-gradient algorithms and implemented in the statistical package R. Under standard regularity conditions, the vector of MLEs θ ^ = ( λ ^ , κ ^ , α ^ , β ^ ) T is asymptotically multivariate normal:
θ ^   ~ ˙ N 4 θ , I 1 ( θ ) ,
where
I ( θ ) = E 2 ( θ )
is the Fisher information matrix and is the log-likelihood. Denote by I 1 ( θ ^ ) j j the estimated variance of θ ^ j . Then, an approximate ( 1 ε ) 100 % confidence interval (CI) for each component θ j is
θ ^ j ± z 1 ε / 2 I 1 ( θ ^ ) j j ,
where z 1 ε / 2 is the ( 1 ε / 2 ) -quantile of the standard normal distribution.

3.2. Bayesian Estimation

In this section, we obtain the BEs of the parameters of the SlaLL distribution under the assumption of a squared error loss function (SELF). The SELF is symmetric and penalizes estimation errors quadratically. If θ ~ is the estimator of the true parameter θ , then the loss function is given by
L ( θ ~ , θ ) = E [ ( θ ~ θ ) 2 ] .
Under the SELF, the BE that minimizes the posterior risk is the posterior mean. That is,
θ ˜ Bayes = E [ θ data ] .
We assign independent Gamma priors to all positive parameters:
λ ~ Γ ( a λ , b λ ) , κ ~ Γ ( a κ , b κ ) , α ~ Γ ( a α , b α ) , β ~ Γ ( a β , b β ) ,
where ( a , b ) are chosen to reflect prior knowledge or to be weakly informative. This choice ensures support on ( 0 , ) and can encode vague priors by small shape and rate. For instance, one might set a λ = a κ = 1 (exponential) or a α = a β = 2 with moderate rate. The joint prior density is
π ( λ , κ , α , β ) λ a λ 1 e b λ λ κ a κ 1 e b κ κ α a α 1 e b α α β a β 1 e b β β .
By Bayes’ rule, the posterior is proportional to the product of the likelihood and priors:
p ( λ , κ , α , β y 1 : n ) i = 1 n f Y ( y i ) π ( λ ) π ( κ ) π ( α ) π ( β ) .
Substituting f Y ( y i ) gives an expression involving the integral over v for each i. Equivalently, introducing latent variables v i ~ Beta ( α , β ) lets us write the augmented posterior:
p ( λ , κ , α , β , { v i } y 1 : n ) i = 1 n f ( y i v i , λ , κ ) f ( v i α , β ) × π ( λ ) π ( κ ) π ( α ) π ( β ) ,
where f ( y i v i ) is the log–logistic PDF and f ( v i ) v i α 1 ( 1 v i ) β 1 . Because of the integral form, the posterior must be explored through sampling methods. We implement a Metropolis-within-Gibbs sampler to draw from the posterior.
Each iteration cycles through all parameters. Proposal variances σ are tuned to achieve reasonable acceptance rates (20–50%). Multiple chains with dispersed initial values are run to assess convergence. In the Bayesian approach, inference about each parameter θ j { λ , κ , α , β } is based on its posterior distribution in (10). A ( 1 ε ) 100 %  equal-tailed credible interval (CrI) for θ j is given by the posterior quantiles
θ j , ( ε / 2 ) , θ j , ( 1 ε / 2 ) ,
where
θ j ( ε / 2 ) π ( θ j y ) d θ j = ε 2 , θ j ( 1 ε / 2 ) π ( θ j y ) d θ j = 1 ε 2 .
Alternatively, one can report the highest-posterior-density (HPD) interval  [ a , b ] , which satisfies
a b π ( θ j y ) d θ j = 1 ε and π ( a y ) = π ( b y )
so that every point inside the interval has posterior density at least as large as any point outside. In practice, these intervals are obtained by sampling from the posterior (e.g., via Markov Chain Monte Carlo (MCMC)) and then computing the appropriate quantiles (for equal-tailed) or the shortest interval covering a 1 ε fraction of the draws (for HPD).
We conducted a Monte Carlo simulation study to assess the finite-sample performance of the maximum likelihood estimators (MLEs) for the model parameters. In particular, we were interested in evaluating the bias and variability of the MLEs under different sample sizes, given the heavy-tailed nature of the proposed distribution. Simulation Setup: For the simulation, we selected a set of true parameter values that represents a heavy-tailed scenario in order to challenge the estimation procedure. Specifically, we chose, for example,  α = 0.5 and β = 2 for the shape parameters, with λ = 1 as the scale. The choice of a small α (significantly less than 1) produces an extremely heavy-tailed distribution—a non-negligible probability of very large survival times—which is a difficult but important case for estimator performance. This scenario corresponds to a situation with a high proportion of long-term survivors or outliers. We fix λ = 1 (time units) for simplicity and without loss of generality, since the scale mainly rescales time and does not affect the bias trends (using a different λ would scale all survival times but the relative estimator performance would be similar). The parameter β = 2 was chosen to yield a moderately heavy-tailed exponent ( α β = 1 in this case) and to ensure that the theoretical first moment is infinite (an indication of a heavy tail). Overall, these true values create a challenging setting that tests the robustness of the MLE under heavy-tailed conditions.
Using the above parameter values, we generated random samples of varying sizes n from the proposed distribution. We considered sample sizes ranging from small to moderate ( n = 50 , 100 , 200 , 500 , for instance) to examine how quickly the estimator performance improves as n increases. For each sample size, we drew N rep = 1000 independent datasets of that size. For each dataset, we computed the MLEs of α β , and λ by maximizing the log-likelihood (using a numerical optimization routine to solve the likelihood equations). We then summarized the estimation error across the 1000 replications in terms of bias and mean squared error (MSE) for each parameter. The bias for a given parameter is calculated as the average difference between the MLE and the true value across simulations:
Bias ( θ ^ ) = 1 N rep r = 1 N rep θ ^ r θ true .
The MSE is calculated as
MSE ( θ ^ ) = 1 N rep r = 1 N rep θ ^ r θ true 2 ,
which incorporates both variance and any squared bias of the estimator. These metrics are plotted in Figure 2 (bias) and Figure 3 (MSE) as functions of the sample size n.
Results: Figure 2 shows the empirical bias of the MLE for each parameter at different sample sizes. We observe that the bias is small in magnitude for all parameters, even at the smaller sample sizes, and it tends to decrease toward zero as n increases. This trend indicates that the MLEs are approximately unbiased and become essentially unbiased in large samples (as expected from consistency properties). Among the parameters, the tail-index parameter α exhibits a slightly larger bias when n is very small (e.g., at n = 50 , the average α ^ is somewhat below the true α = 0.5 ). This is intuitive because accurately estimating the heavy-tail behavior (governed by α ) can be difficult with limited data—a few extreme observations can heavily influence the estimate, and with small n, there is a higher chance those extremes are under-represented. However, by n = 100 or 200, the bias in α ^ has nearly vanished, and the biases for β and λ are also negligible. The scale parameter λ in particular shows almost no bias across all sample sizes (since λ primarily shifts the time scale, the MLE of λ benefits from the information in even moderate sample sizes). Overall, no systematic bias is evident for n 100 , confirming that the MLEs are performing as expected in terms of accuracy.
Figure 3 presents the mean squared error (MSE) of the MLEs for α β , and λ as a function of sample size. The MSE curves decline sharply with increasing n, demonstrating a clear improvement in estimator precision with larger samples. On a log–log plot, the MSE approximately follows a straight line consistent with the theoretical O ( 1 / n ) rate of convergence for efficient estimators. For instance, when the sample size increases from n = 50 to n = 200 (a four-fold increase), the MSE for each parameter drops roughly by an order of magnitude (a decrease by approximately a factor of 4, which aligns with the 1 / n scaling). Among the three parameters, the estimator of α shows the highest MSE at small sample sizes, reflecting greater uncertainty in pinning down the tail exponent from limited data. This again is expected—the heavy-tail index can be difficult to estimate precisely without a substantial number of observations in the distribution’s tail. By n = 200 or 500, however, the MSE for α ^ has decreased dramatically, and it is of the same order of magnitude as the MSEs for β ^ and λ ^ . In fact, at n = 500 , all three parameters have quite small MSEs (see Figure 3), indicating that the estimates are tightly concentrated around the true values. These results suggest that even in a significantly heavy-tailed situation, a few hundred observations are sufficient for the MLE to achieve high accuracy.
In summary, the simulation study confirms that the proposed model’s parameters can be reliably estimated using MLE. The estimators are essentially unbiased for moderate-to-large sample sizes and exhibit decreasing variance as n grows. Even under an extreme heavy-tail scenario (where the true distribution has infinite mean and a significant probability of outliers), the MLE performs well: with n 100 , it yields reasonably accurate estimates, and with larger n, the precision improves to a high level. This provides reassurance for practical applications—it indicates that standard inference techniques (like MLE and associated confidence intervals) are applicable and effective for our heavy-tailed model. Users analyzing heavy-tailed survival data can expect that, given a sufficient sample size, the model’s parameter estimates will be both accurate and stable.

3.3. Simulation Study

To evaluate the finite-sample performance of the maximum-likelihood and Bayesian estimators for the SlaLL distribution, we carried out a Monte Carlo simulation with 10,000 replications per method. Independent samples of size
n { 25 , 50 , 100 , 150 , 200 , 300 }
were drawn under two distinct parameter settings (we assume β = 1 + 100 / α ):
  • Set 1: λ = 3 , κ = 1.5 , α = 2 .
  • Set 2: λ = 2 , κ = 2.5 , α = 3 .
For each estimator and each ( n , set ) combination, we computed
  • The empirical bias and mean squared error (MSE) of λ ^ , κ ^ , α ^ ;
  • The lower and upper bounds (LB, UB) of the nominal 95% CI and CrI.
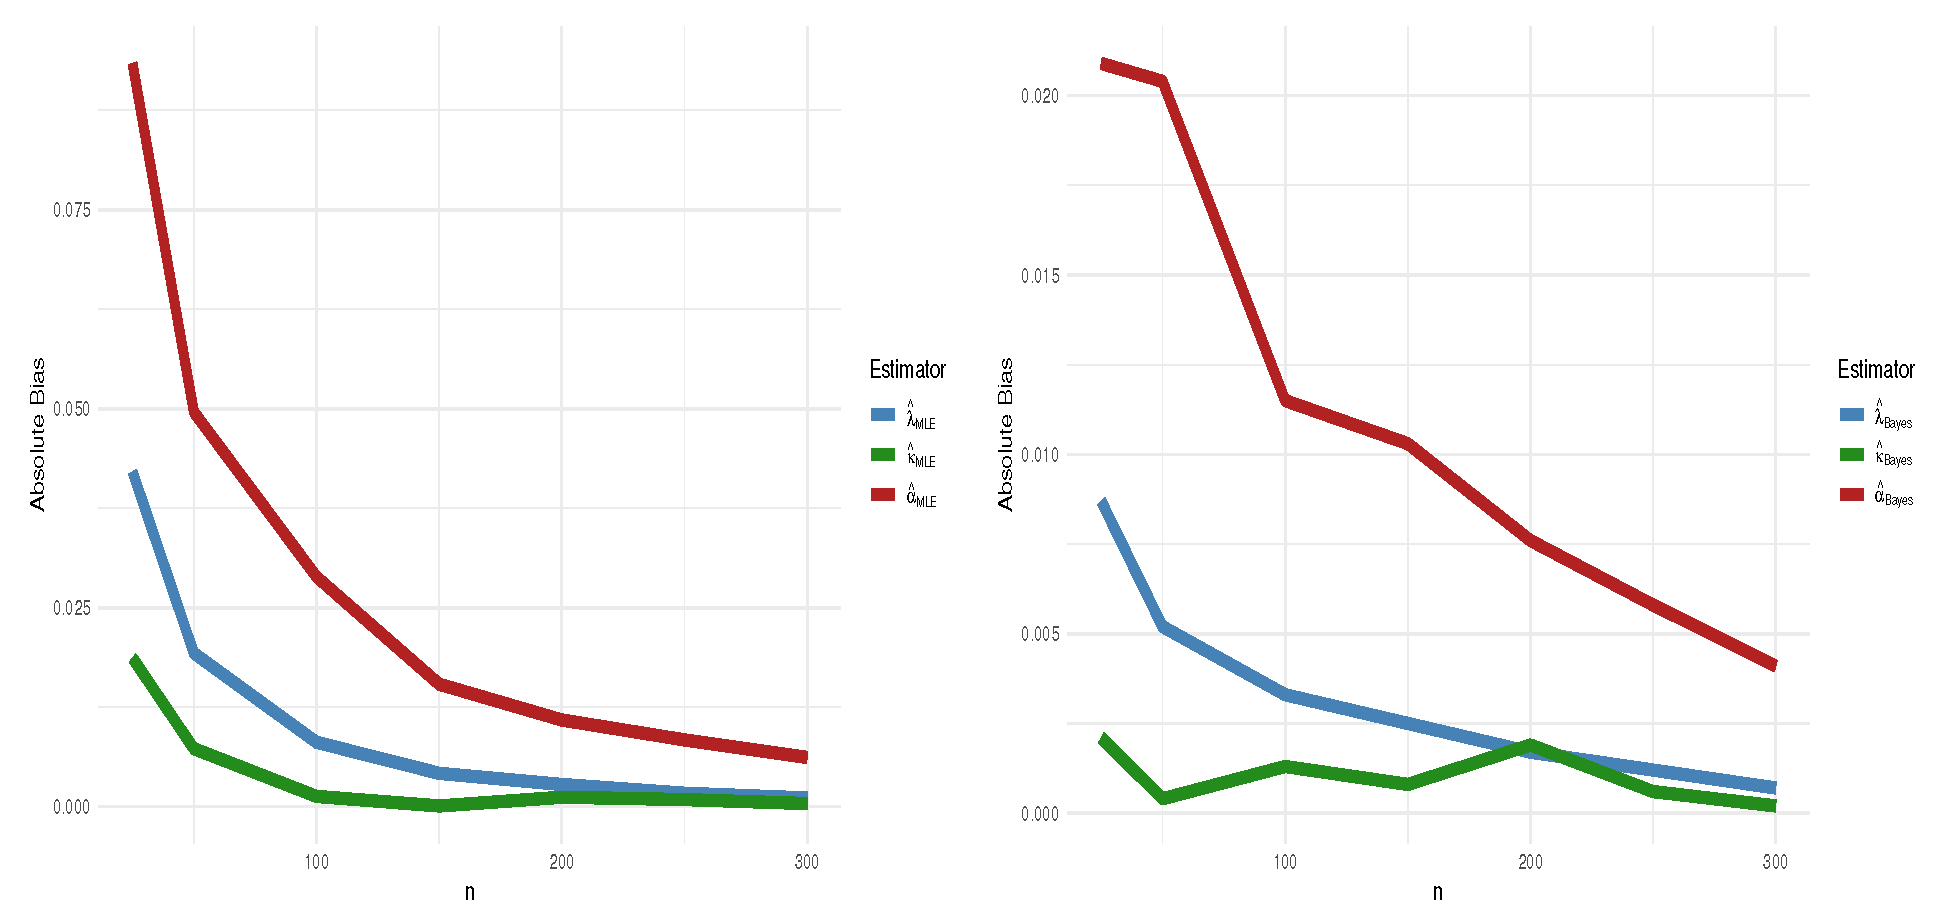
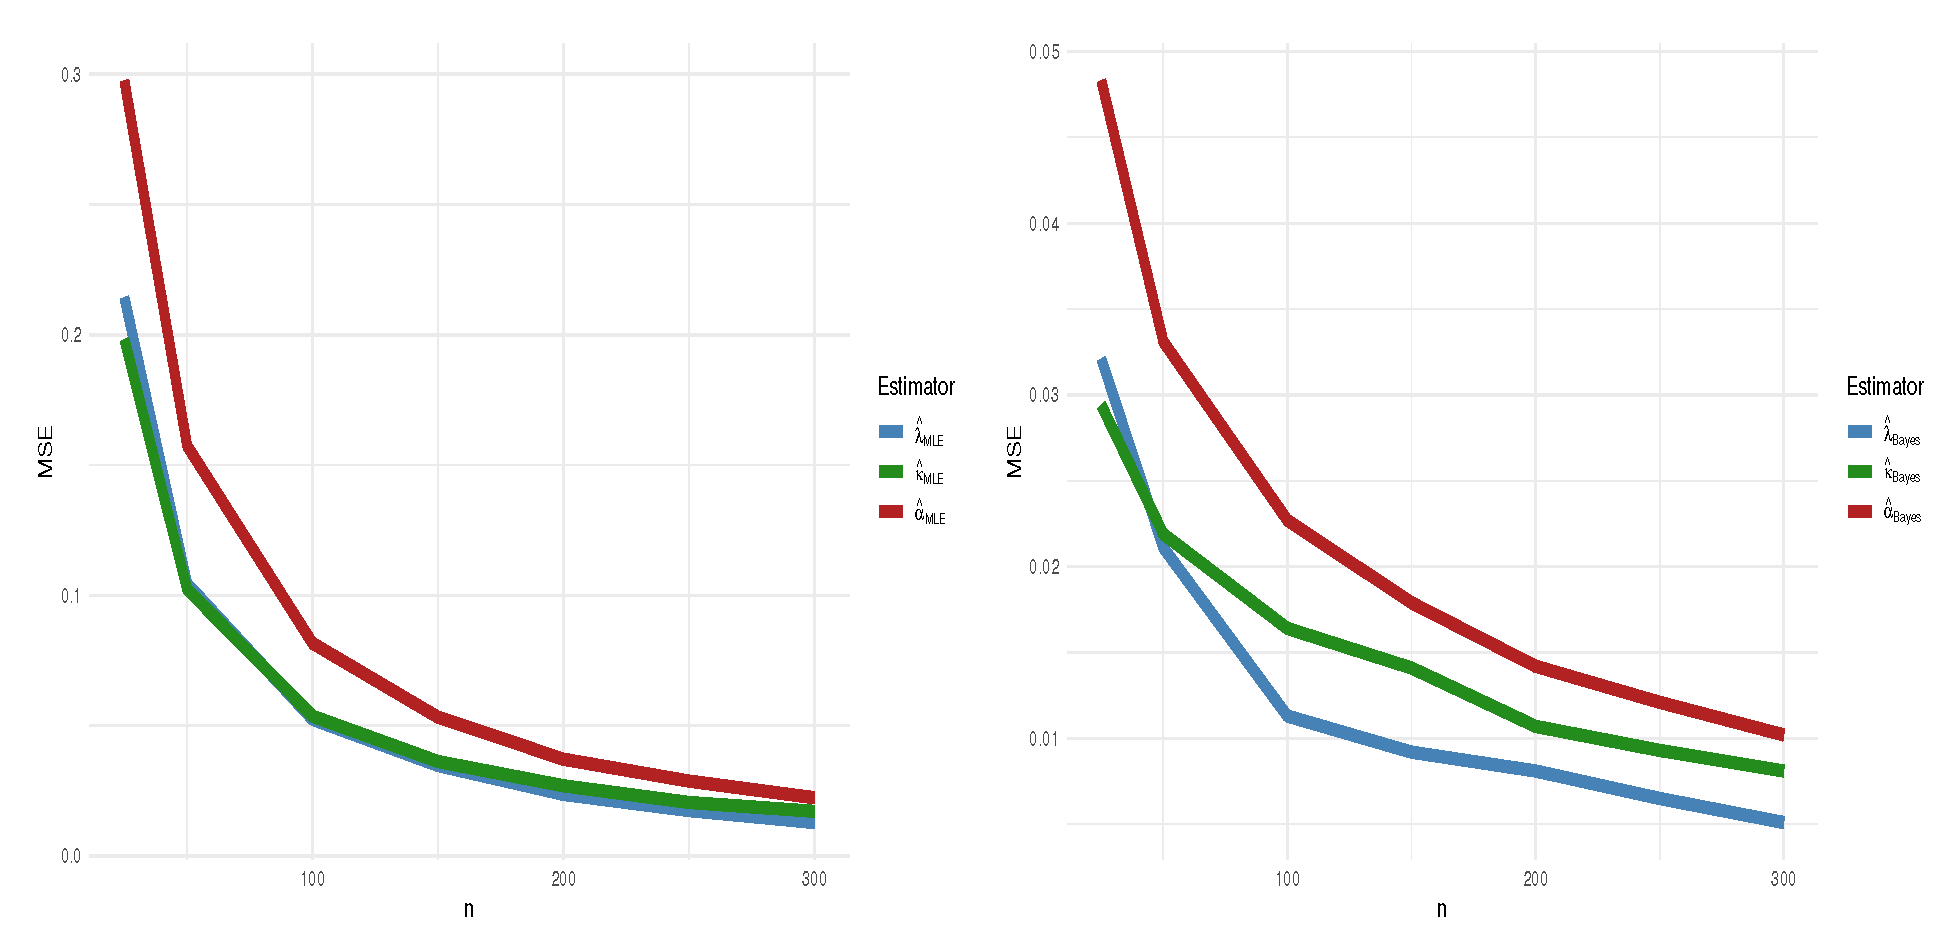
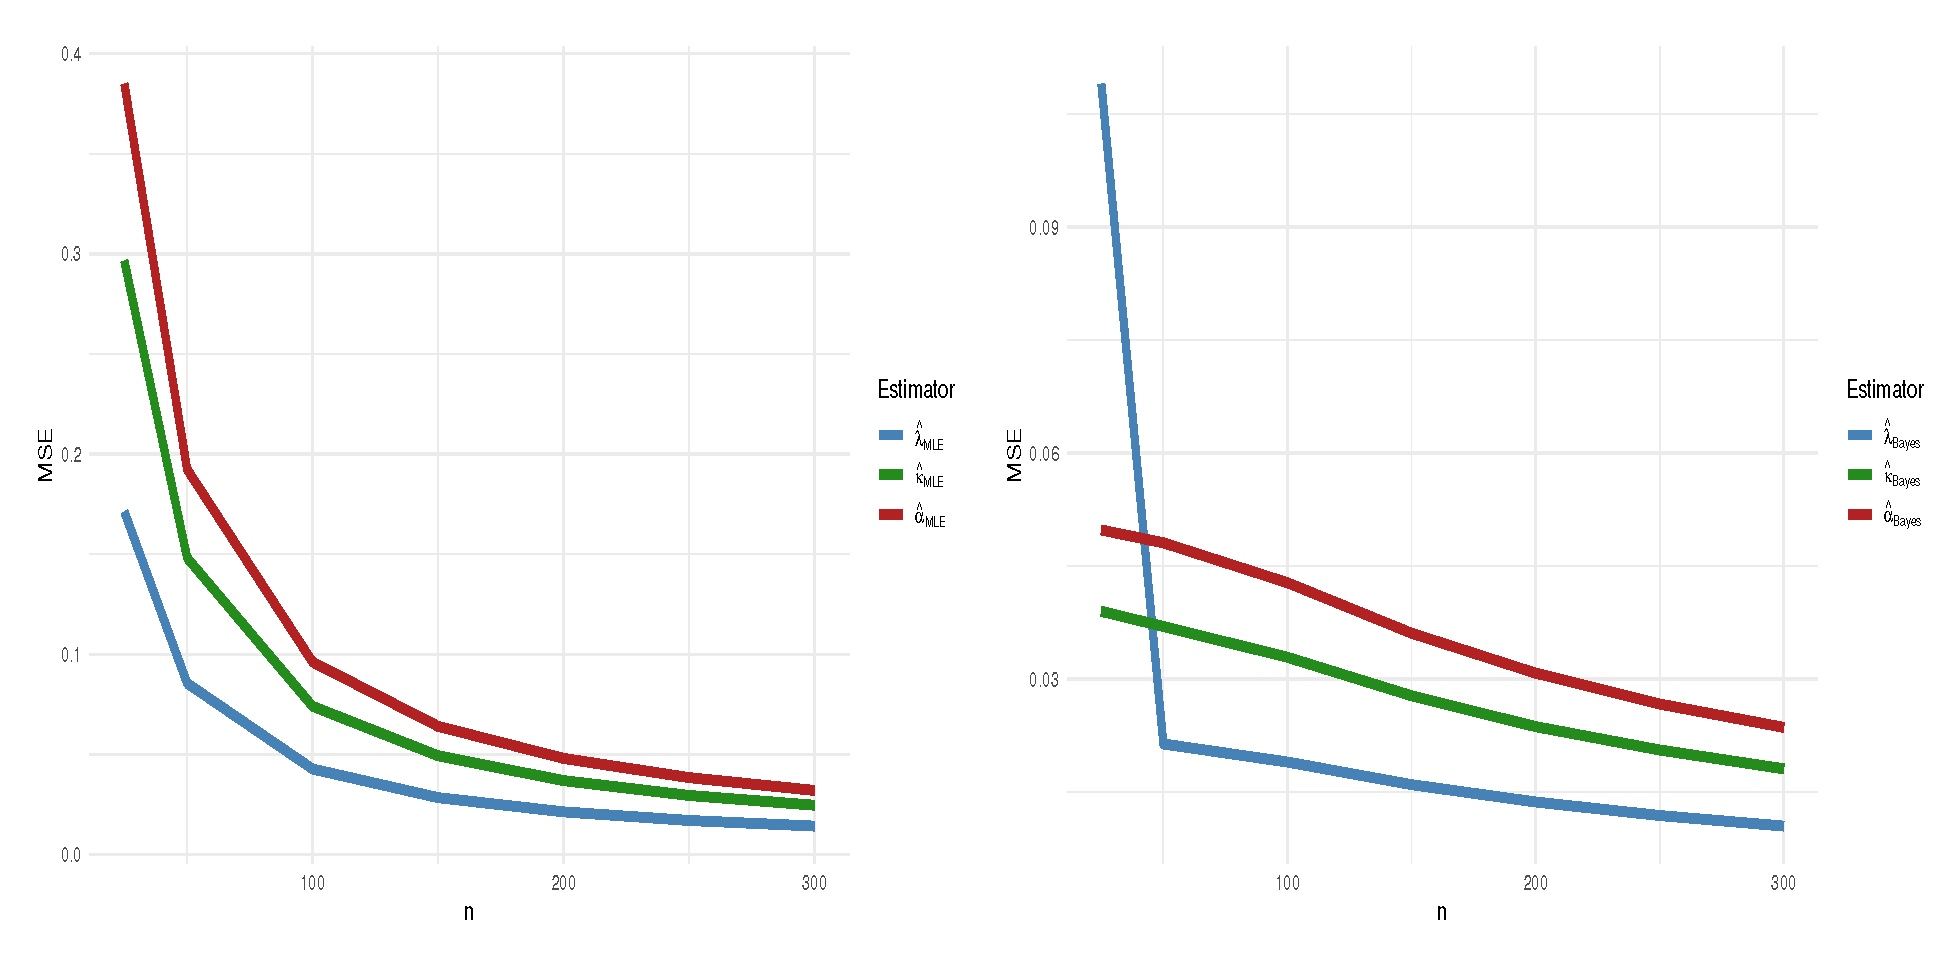
The performance of MLE and BE methods for the SlaLL distribution is compared in Table 1 and Table 2, corresponding to parameter sets 1 and 2, respectively. For various sample sizes n, the tables present the estimated values of the parameters λ κ , and α , along with their MSEs and the corresponding 95 % confidence and credible intervals. The results indicate that Bayesian estimators generally yield lower MSEs compared to MLE, particularly for smaller sample sizes, highlighting the efficiency and stability of the Bayesian approach in parameter estimation for the SlaLL distribution. Figure 4 and Figure 5 illustrate the bias of the estimated parameters λ κ , and α for parameter sets 1 and 2, respectively, under both MLE and BE methods across various sample sizes. It is evident that the bias decreases as the sample size increases, with the Bayesian estimates generally showing lower bias, particularly for the parameter α . Figure 6 and Figure 7 present the MSE of the estimators for the same parameter sets. As expected, the MSEs decrease with larger sample sizes, and the Bayesian estimation method consistently outperforms MLE in terms of lower MSEs for all parameters. These visual comparisons further reinforce the robustness and efficiency of Bayesian methods in estimating the parameters of the SlaLL distribution.

4. Modeling Heavy-Tailed Survival Times

This section examines three datasets representing heavy-tailed, right-skewed time-to-event data in the biomedical domain: acute myelogenous leukemia (AML) survival times, COVID-19 patient survival times, and veteran survival times. The AML dataset from the survival package in R includes times (in weeks) until relapse or censoring for patients undergoing maintenance chemotherapy, exhibiting pronounced right-skewness and censoring, with one patient’s duration extending to 261 weeks [10]. The COVID-19 dataset captures survival times (in days) for 53 fatal cases from China, demonstrating early fatalities with a prolonged tail extending to approximately 20 days [11]. Finally, the veteran dataset, also from R’s survival package, comprises survival durations (in days) from a clinical trial of chemotherapy for advanced lung cancer, ranging extensively from 1 to 999 days [10,12]. To assess model fit, we evaluated the adaptability of the SlaLL with Slash Lindley (SL) [13], Slash Modified Lindley (SML) [14], and Slash Inverse Exponential (SIE) [15] distributions. Parameter estimates were derived using the maximum likelihood estimation (MLE) method. Model performance was assessed using standard error (SE), negative log-likelihood ( log l ), Akaike Information Criterion (AIC), Bayesian Information Criterion (BIC), Kolmogorov–Smirnov (K-S) statistic and its corresponding p-value, as well as Anderson–Darling ( A ) and Cramér von Mises ( W ). Detailed descriptions, evaluations, and analyses are provided in the subsequent subsections.

4.1. Dataset 1: AML Survival Times

The AML dataset contains survival times until relapse or censoring; for more details, see [10]. Model fitting results are summarized in Table 3.

4.2. Dataset 2: COVID-19 Patient Survival Times

This dataset can be retrieved from https://www.worldometers.info/coronavirus/ (accessed on 20 October 2024); the dataset consists of recorded survival times (in days) for COVID-19 patients [16]:
0.054 , 0.064 , 0.704 , 0.816 , 0.235 , 0.976 , 0.865 , 0.364 , 0.479 , 0.568 , 0.352 , 0.978 , 0.787 , 0.976 , 0.087 , 0.548 , 0.796 , 0.458 , 0.087 , 0.437 , 0.421 , 1.978 , 1.756 , 2.089 , 2.643 , 2.869 , 3.867 , 3.890 , 3.543 , 3.079 , 3.646 , 3.348 , 4.093 , 4.092 , 4.190 , 4.237 , 5.028 , 5.083 , 6.174 , 6.743 , 7.274 , 7.058 , 8.273 , 9.324 , 10.827 , 11.282 , 13.324 , 14.278 , 15.287 , 16.978 , 17.209 , 19.092 , 20.083
Model fitting metrics are presented in Table 4, with graphical representation.

4.3. Model Fit Metrics for Dataset 3

The third dataset represents survival durations (in days) for veterans in a clinical trial for lung cancer chemotherapy [17,18]:
72 , 411 , 228 , 126 , 118 , 10 , 82 , 110 , 314 , 100 , 42 , 8 , 144 , 25 , 11 , 30 , 384 , 4 , 54 , 13 , 123 , 97 , 153 , 59 , 117 , 16 , 151 , 22 , 56 , 21 , 18 , 139 , 20 , 31 , 52 , 287 , 18 , 51 , 122 , 27 , 54 , 7 , 63 , 392 , 10 , 8 , 92 , 35 , 117 , 132 , 12 , 162 , 3 , 95 , 177 , 162 , 216 , 553 , 278 , 12 , 260 , 200 , 156 , 182 , 143 , 105 , 103 , 250 , 100 , 999 , 112 , 87 , 231 , 242 , 991 , 111 , 1 , 587 , 389 , 33 , 25 , 357 , 467 , 201 , 1 , 30 , 44 , 283 , 15 , 25 , 103 , 21 , 13 , 87 , 2 , 20 , 7 , 24 , 99 , 8 , 99 , 61 , 25 , 95 , 80 , 51 , 29 , 24 , 18 , 83 , 31 , 51 , 90 , 52 , 73 , 8 , 36 , 48 , 7 , 140 , 186 , 84 , 19 , 45 , 80 , 52 , 164 , 19 , 53 , 15 , 43 , 340 , 133 , 111 , 231 , 378 , 49
Table 5 summarizes the model-fitting results.

4.4. Result Analysis

Table 3, Table 4 and Table 5 summarize descriptive analyses and model fit metrics for datasets 1, 2, and 3, respectively. Among the evaluated models, the SlaLL distribution consistently demonstrated superior performance, indicated by the lowest values of log L , AIC, BIC, K-S,  A , and W , as well as the highest p-values.
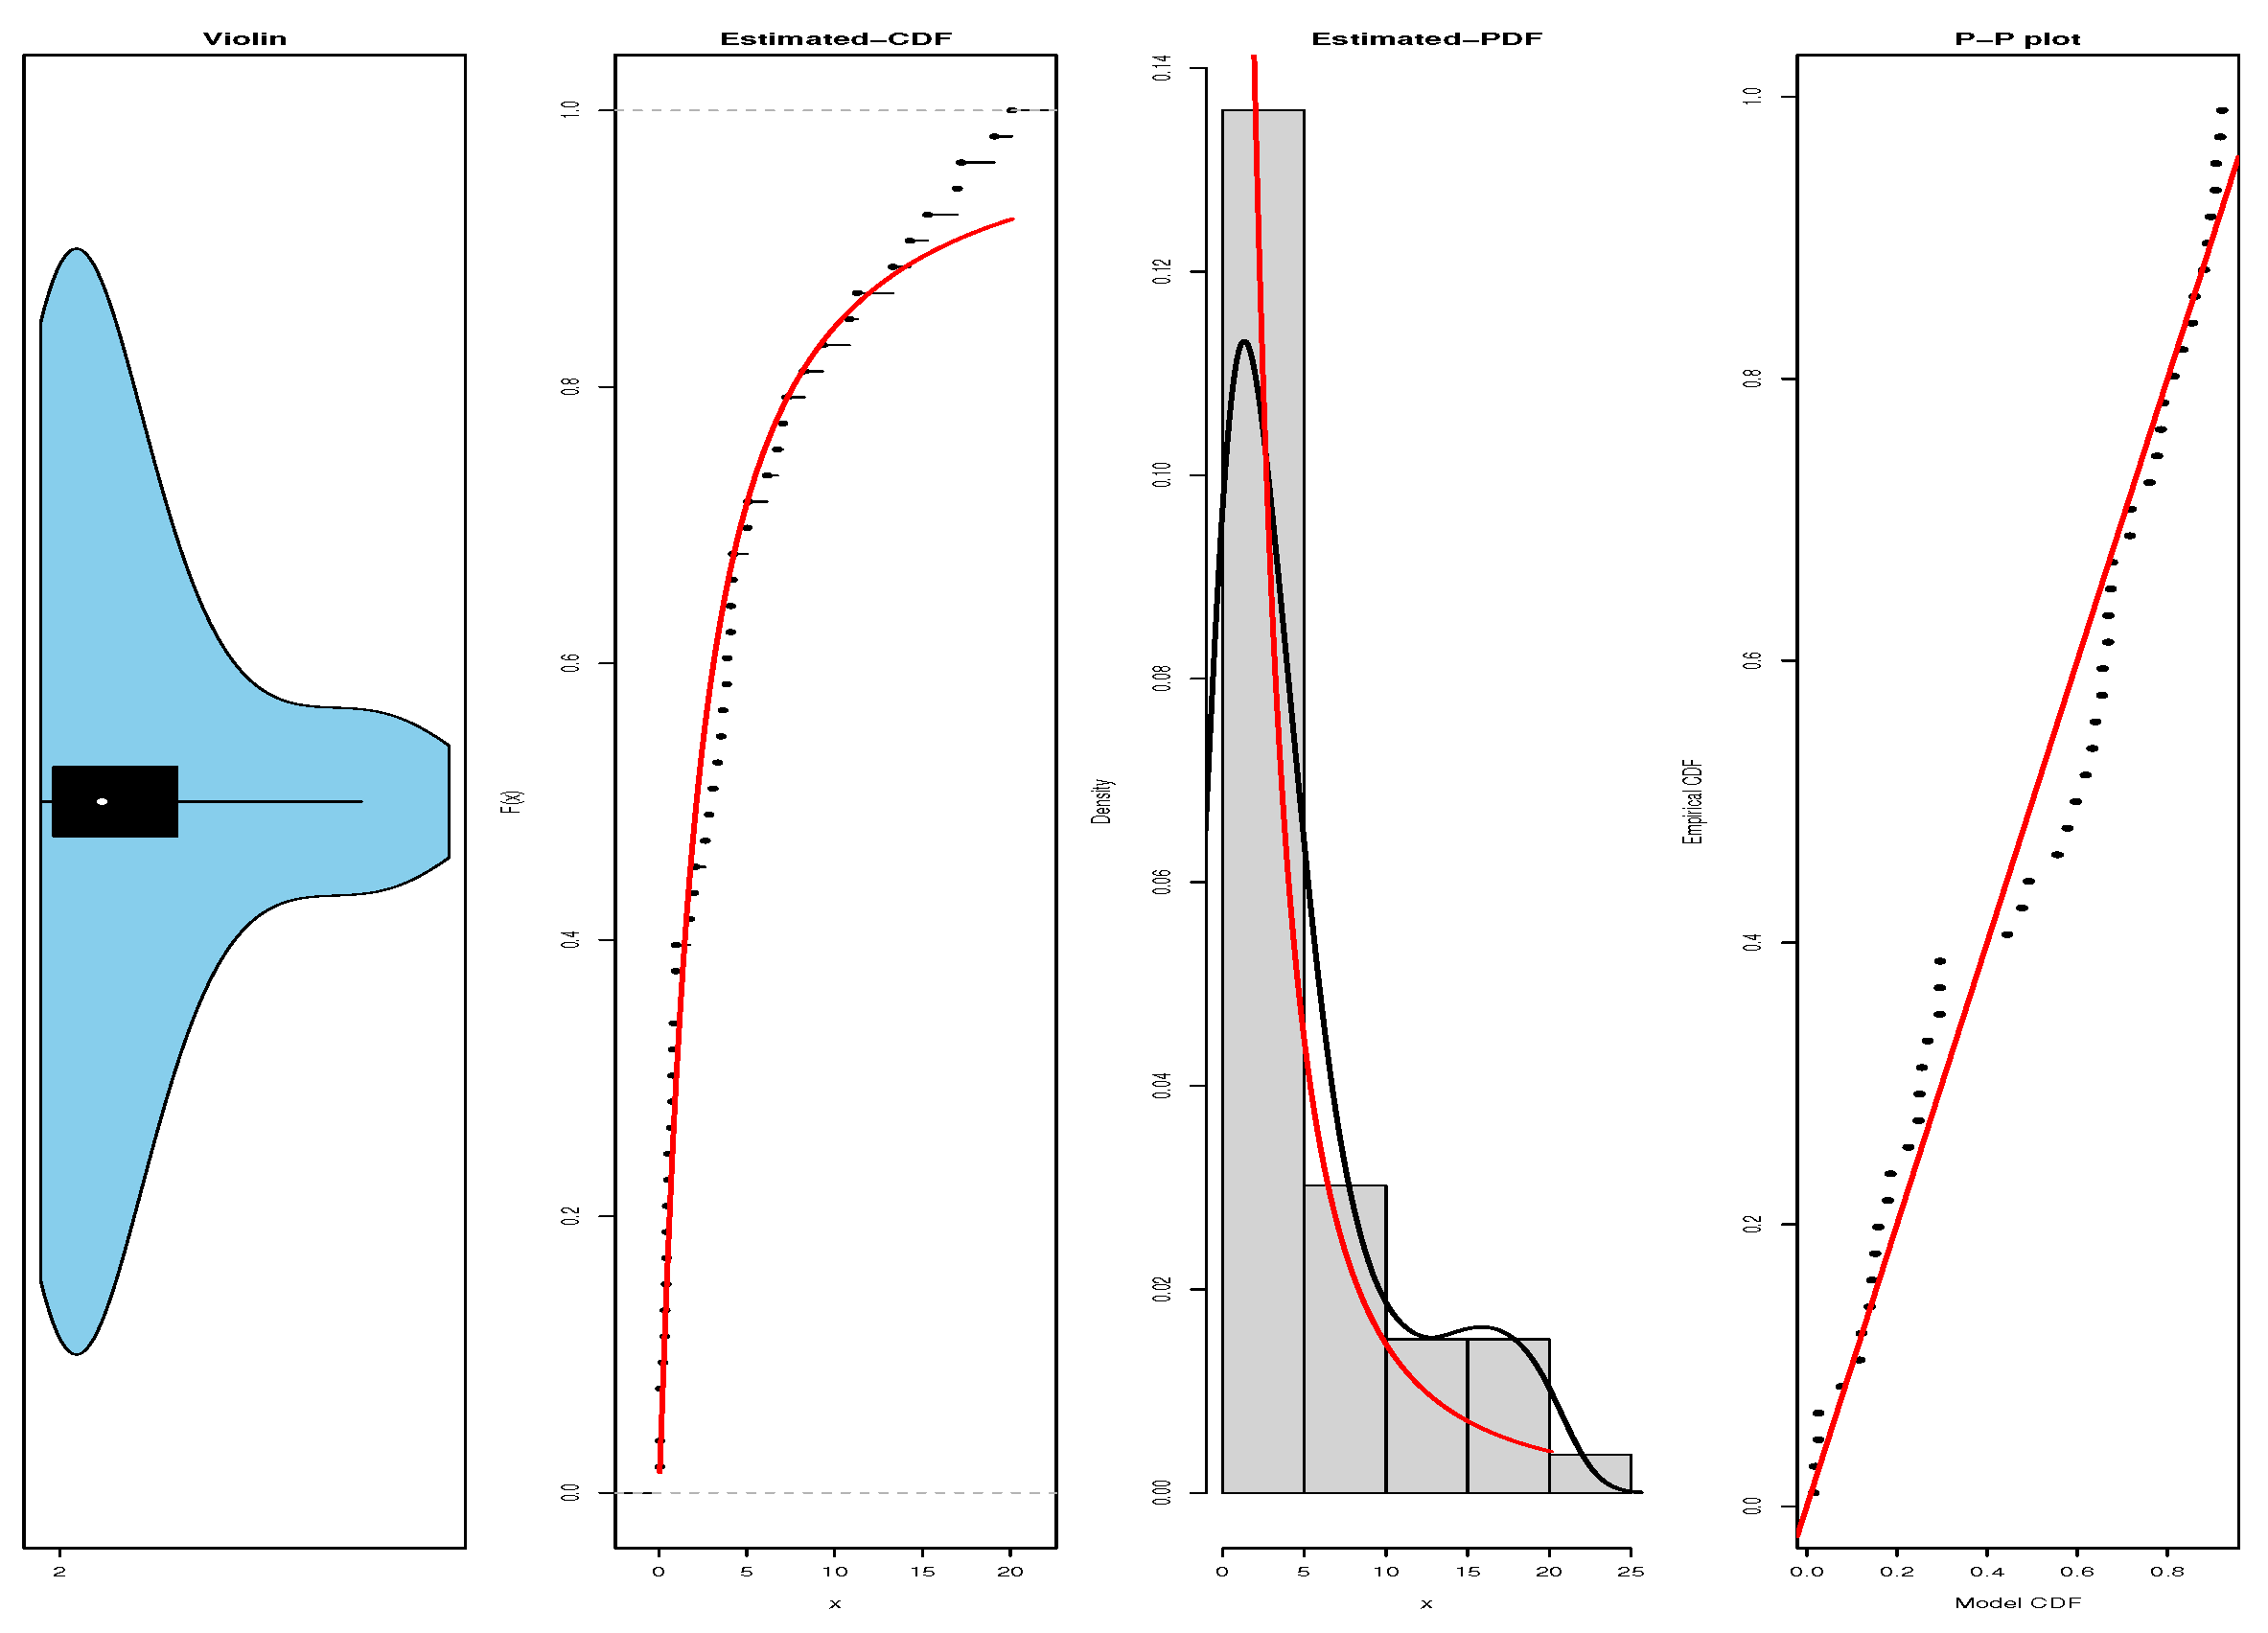
Graphical assessments presented in Figure 8, Figure 9 and Figure 10 confirm the adequacy of the SlaLL model for the analyzed datasets. Each figure shows, from left to right, the following: (1) a violin plot illustrating the overall distributional shape and spread of the data; (2) the empirical cumulative distribution function (CDF) overlaid with the fitted SlaLL CDF to assess closeness of fit; (3) a histogram with the empirical density and fitted SlaLL PDF curve for comparing model and data frequencies; and (4) a P–P plot comparing model-predicted and empirical cumulative probabilities. Across all three datasets, the fitted SlaLL curves (red) closely follow the empirical curves (black) in both the CDF and PDF plots, indicating that the model captures the central tendency and tail behavior well. The P–P plots show points lying approximately along the 45-degree line, suggesting good agreement between theoretical and empirical distributions and supporting the suitability of the SlaLL model for these data. The violin and kernel density plots further highlight the model’s ability to reflect the observed variability and skewed nature of the data.
Comparative Discussion: The proposed heavy-tailed survival model offers distinct advantages over classical distributions such as the Weibull and log-normal. The Weibull distribution (commonly used in survival analysis) has an exponentially decaying tail and a hazard function that is monotonic (either always increasing for shape k > 1 or always decreasing for k < 1 ). This limits Weibull’s ability to represent extremely heavy tails or non-monotonic failure rates. In contrast, our Gauss hypergeometric-type model allows for polynomial-decaying tails (far heavier than the exponential tail of Weibull), and it can capture a wider range of hazard shapes. For example, with α < 1 , our model produces a hazard that starts high and decreases over time (eventually tending to zero as t ), a behavior that Weibull cannot emulate. If α > 1 , our model’s hazard is non-monotonic: it rises from 0 at t = 0 to a peak and then declines toward 0 at infinity, which is a pattern that can resemble, but also eventually extends beyond, the log-normal hazard shape. The log-normal distribution is another two-parameter model often used for long-tailed data; it does have a heavy (sub-exponential) tail and a non-monotonic hazard (peaking at an intermediate time then declining). However, the log-normal’s tail is lighter than a power-law (its survival decays faster than any polynomial) and it lacks the flexibility of additional shape parameters. Our model’s extra shape parameter(s) provide greater flexibility: one can adjust tail heaviness and the hazard curvature independently to better fit complex datasets (especially those with outliers or a subset of long-term survivors). Furthermore, the new model retains closed-form expressions (in terms of standard special functions) for the PDF and CDF, which facilitates estimation and prediction. For instance, computing tail probabilities P ( T > t ) or other reliability metrics is straightforward via the closed-form survival function in Equation (3), whereas the log-normal CDF does not have an elementary closed form (it involves the error function). It is also noteworthy that our distribution encompasses certain existing heavy-tailed models as special cases. For example, when β = 1 , our CDF in Equation (3) simplifies to F ( t ) = 1 [ 1 + ( t / λ ) α ] 1 , which is the CDF of the Burr type XII (log–logistic) distribution—a known heavy-tailed survival distribution. In this sense, the Gauss hypergeometric-type model generalizes the Burr/log–logistic family and extends it with an additional shape parameter for even greater flexibility. Overall, compared to Weibull and log-normal, the proposed model can better accommodate heavy-tailed data (with a polynomial tail decay) and diverse hazard rate trajectories, making it a valuable addition to the toolbox for survival analysis.

5. Conclusions

In this paper, we introduced a new survival time distribution—a Gauss hypergeometric-type model—specifically designed to handle heavy-tailed lifetime data. The proposed model is characterized by flexible shape parameters that allow it to capture extremely heavy right tails (higher probabilities of very large survival times) as well as a variety of hazard function shapes. We derived explicit formulas for the model’s PDF, CDF, survival function, and hazard rate, and we established key properties such as the power-law tail behavior of the survival function. These mathematical characterizations confirm that the model can represent scenarios with, for example, decreasing hazards and polynomial tail decay—phenomena that classical survival distributions (like exponential or Weibull) cannot adequately model. We also developed a maximum likelihood estimation procedure for the model’s parameters and showed that it performs well; our simulation study demonstrated that the MLEs are essentially unbiased and achieve increasing precision as the sample size grows. Even under an extreme heavy-tail scenario (where conventional methods might struggle), the estimators exhibited the expected 1 / n convergence in MSE and negligible bias for moderate n. This evidence highlights the practical reliability of the model for inference. The heavy-tailed Gauss hypergeometric-type model offers several practical advantages for biomedical survival analysis. Many biomedical studies encounter data with outliers or subgroups of long-term survivors (for instance, a fraction of patients who respond exceptionally well to a treatment and live far longer than others). In such cases, standard survival models with exponentially bounded tails can severely under-predict the probability of long-term survival. Our model, by contrast, can assign significantly higher probabilities to extreme survival times, aligning more closely with empirical heavy-tailed patterns. The added flexibility of two shape parameters means that it can fit a wide range of dataset shapes—adjusting independently the early-time behavior (e.g., whether the hazard is high initially or not) and the tail decay rate. This can lead to better goodness-of-fit and more accurate estimation of tail-related quantities such as the probability of surviving beyond a very large time horizon. From a computational standpoint, the availability of closed-form expressions for the CDF and PDF (in terms of well-known special functions) means that standard likelihood-based methods (estimation, model checking, etc.) can be applied without numerical complications. We anticipate that this model can be immediately useful in analyzing survival data in fields like oncology, epidemiology, or reliability engineering, where heavy tails (e.g., cure fractions or extremely long survival times) are present.
Future directions: The development of this heavy-tailed model opens up multiple avenues for further research. One important extension will be to incorporate covariates into the model—for example, formulating a survival regression model (such as an accelerated failure time or proportional hazards extension) where the Gauss hypergeometric-type distribution serves as the baseline for the time-to-event outcome. This would allow one to assess the effects of patient characteristics or treatment factors on heavy-tailed survival outcomes. Another promising direction is to explore frailty or mixture models in conjunction with the proposed distribution. By introducing random effects or mixture components, we could capture unobserved heterogeneity in populations and see how the heavy-tailed component interacts with individual-level variability. On the theoretical side, further study of the new distribution’s properties could be fruitful—for instance, investigating the conditions under which it converges to or bounds other distributions, or examining the behavior of its entropy and information measures in comparison to lighter-tailed models. Finally, applying the Gauss hypergeometric-type model to real datasets (such as survival times of patients in clinical trials or failure times of mechanical components) would be an excellent way to demonstrate its practical value. Such case studies would allow us to compare the model’s performance against existing survival distributions in terms of goodness-of-fit and predictive accuracy. In conclusion, the proposed model provides a robust and flexible tool for modeling heavy-tailed survival data, and we believe it can greatly enhance the analyst’s ability to draw insights from data with extreme outcomes. The encouraging results from this study motivate both the application of this model to complex real-world data and the extension of the model within broader survival analysis frameworks.

Author Contributions

Conceptualization, J.G. and J.J.; Methodology, J.G., J.J. and M.M.H.; Software, J.G. and J.J.; Validation, J.G. and J.J.; Formal analysis, M.M.H.; Investigation, M.M.A.; Resources, M.M.A. and M.M.H.; Data curation, M.M.A. and M.M.H.; Writing—original draft, J.G. and J.J.; Writing—review and editing, M.M.H.; Visualization, M.M.A.; Funding acquisition, M.M.A. All authors have read and agreed to the published version of the manuscript.

Funding

This work was supported and funded by the Deanship of Scientific Research at Imam Mohammad Ibn Saud Islamic University (IMSIU) (grant number IMSIU-DDRSP2502).

Data Availability Statement

The original contributions presented in this study are included in the article. Further inquiries can be directed to the corresponding authors.

Acknowledgments

The authors extend their appreciation to Deanship of Scientific Research at Imam Mohammad Ibn Saud Islamic University (IMSIU) for funding this work through Research Group: IMSIU-DDRSP2502.

Conflicts of Interest

The authors declare no conflicts of interest.

Appendix A

Listing A1. R routines for the SlaLL distribution.
Symmetry 17 01795 i001

References

  1. Fisk, P.R. The Graduation of Income Distributions. Econometrica 1961, 29, 171–185. [Google Scholar] [CrossRef]
  2. Bennett, S. Log–logistic regression models for survival data. J. R. Stat. Soc. Ser. C 1983, 32, 165–171. [Google Scholar] [CrossRef]
  3. Kariuki, V.; Wanjoya, A.; Ngesa, O.; Aljohani, H.M. Properties, estimation and applications of the extended log–logistic distribution. Sci. Rep. 2024, 14, 20967. [Google Scholar] [CrossRef] [PubMed]
  4. Afify, A.Z.; Abdelall, Y.Y.; AlQadi, H.; Mahran, H.A. The modified log–logistic distribution: Properties and inference with real-life data applications. Contemp. Math. 2025, 6, 862–890. [Google Scholar] [CrossRef]
  5. Ishaq, A.I.; Panitanarak, U.; Abiodun, A.A.; Daud, H.; Suleiman, A.A. A new Maxwell–log–logistic distribution and its applications for mortality rate data. J. Niger. Soc. Phys. Sci. 2025, 7, 1976–1989. [Google Scholar]
  6. Mahto, A.K.; Tripathi, Y.M.; Dey, S.; Alsaedi, B.S.; Alhelali, M.H.; Alghamdi, F.M.; Alrumayh, A.; Alshawarbeh, E. Bayesian estimation and prediction under progressive-stress accelerated life tests for a log–logistic model. Alex. Eng. J. 2024, 101, 330–342. [Google Scholar] [CrossRef]
  7. Lee, S.; Moriasi, D.N.; Mehr, A.D.; Mirchi, A. Sensitivity of the Standardised Precipitation–Evapotranspiration Index to distribution choice and PET method. J. Hydrol. Reg. Stud. 2024, 53, 101761. [Google Scholar] [CrossRef]
  8. Gui, W. Statistical properties and applications of the Lindley slash distribution. J. Appl. Stat. Sci. 2012, 20, 283–298. [Google Scholar]
  9. Rojas, M.A.; Bolfarine, H.; Gómez, H.W. An extension of the slash-elliptical distribution. SORT 2014, 38, 215–230. [Google Scholar]
  10. Therneau, T.M. Survival analysis. In The aml Dataset in R’s survival Package Records Weeks to Relapse or Censoring for AML Patients; John Wiley & Sons: Hoboken, NJ, USA, 1997. [Google Scholar]
  11. Liu, X.; Ahmad, Z.; Gemeay, A.M.; Abdulrahman, T.A.; Hafez, E.H.; Khalil, N. Modeling the survival times of COVID-19 patients with a new statistical model: A case study from China. PLoS ONE 2021, 16, e0254999. [Google Scholar] [CrossRef] [PubMed]
  12. Miller, R.G. Survival Analysis, 2nd ed.; Wiley Classics Library; John Wiley & Sons: Hoboken, NJ, USA, 1997; ISBN 0-471-25218-2. [Google Scholar]
  13. Rojas, M.A.; Iriarte, Y.A. A Lindley-Type Distribution for Modeling High-Kurtosis Data. Mathematics 2022, 10, 2240. [Google Scholar] [CrossRef]
  14. Gillariose, J.; Joseph, J.; Chesneau, C. Extended Slash Modified Lindley Distribution to Model Economic Variables Showing Asymmetry. Comput. Econ. 2024, 66, 3497–3516. [Google Scholar] [CrossRef]
  15. Elbatal, I.; Joseph, J.; Gillariose, J.; Jamal, F.; Ben Ghorbal, A. Confluent hypergeometric inverse exponential distribution with application to climate and economic data. J. Radiat. Res. Appl. Sci. 2025, 18, 101516. [Google Scholar] [CrossRef]
  16. Kamal, M.; Alsolmi, M.M.; Nayabuddin; Al Mutairi, A.; Hussam, E.; SidAhmed Mustafa, M.; Nassr, S.G. A new distributional approach: Estimation, Monte Carlo simulation and applications to the biomedical data sets. Netw. Heterog. Media 2023, 18, 1575–1599. [Google Scholar] [CrossRef]
  17. Ewuru, D.A.; Etikan, I. The Survival Analysis of Veterans’ Administration Lung Cancer Dataset. medRxiv 2022. [Google Scholar] [CrossRef]
  18. Kalbfleisch, J.D.; Prentice, R.L. The Statistical Analysis of Failure Time Data; Wiley: New York, NY, USA, 1980. [Google Scholar]
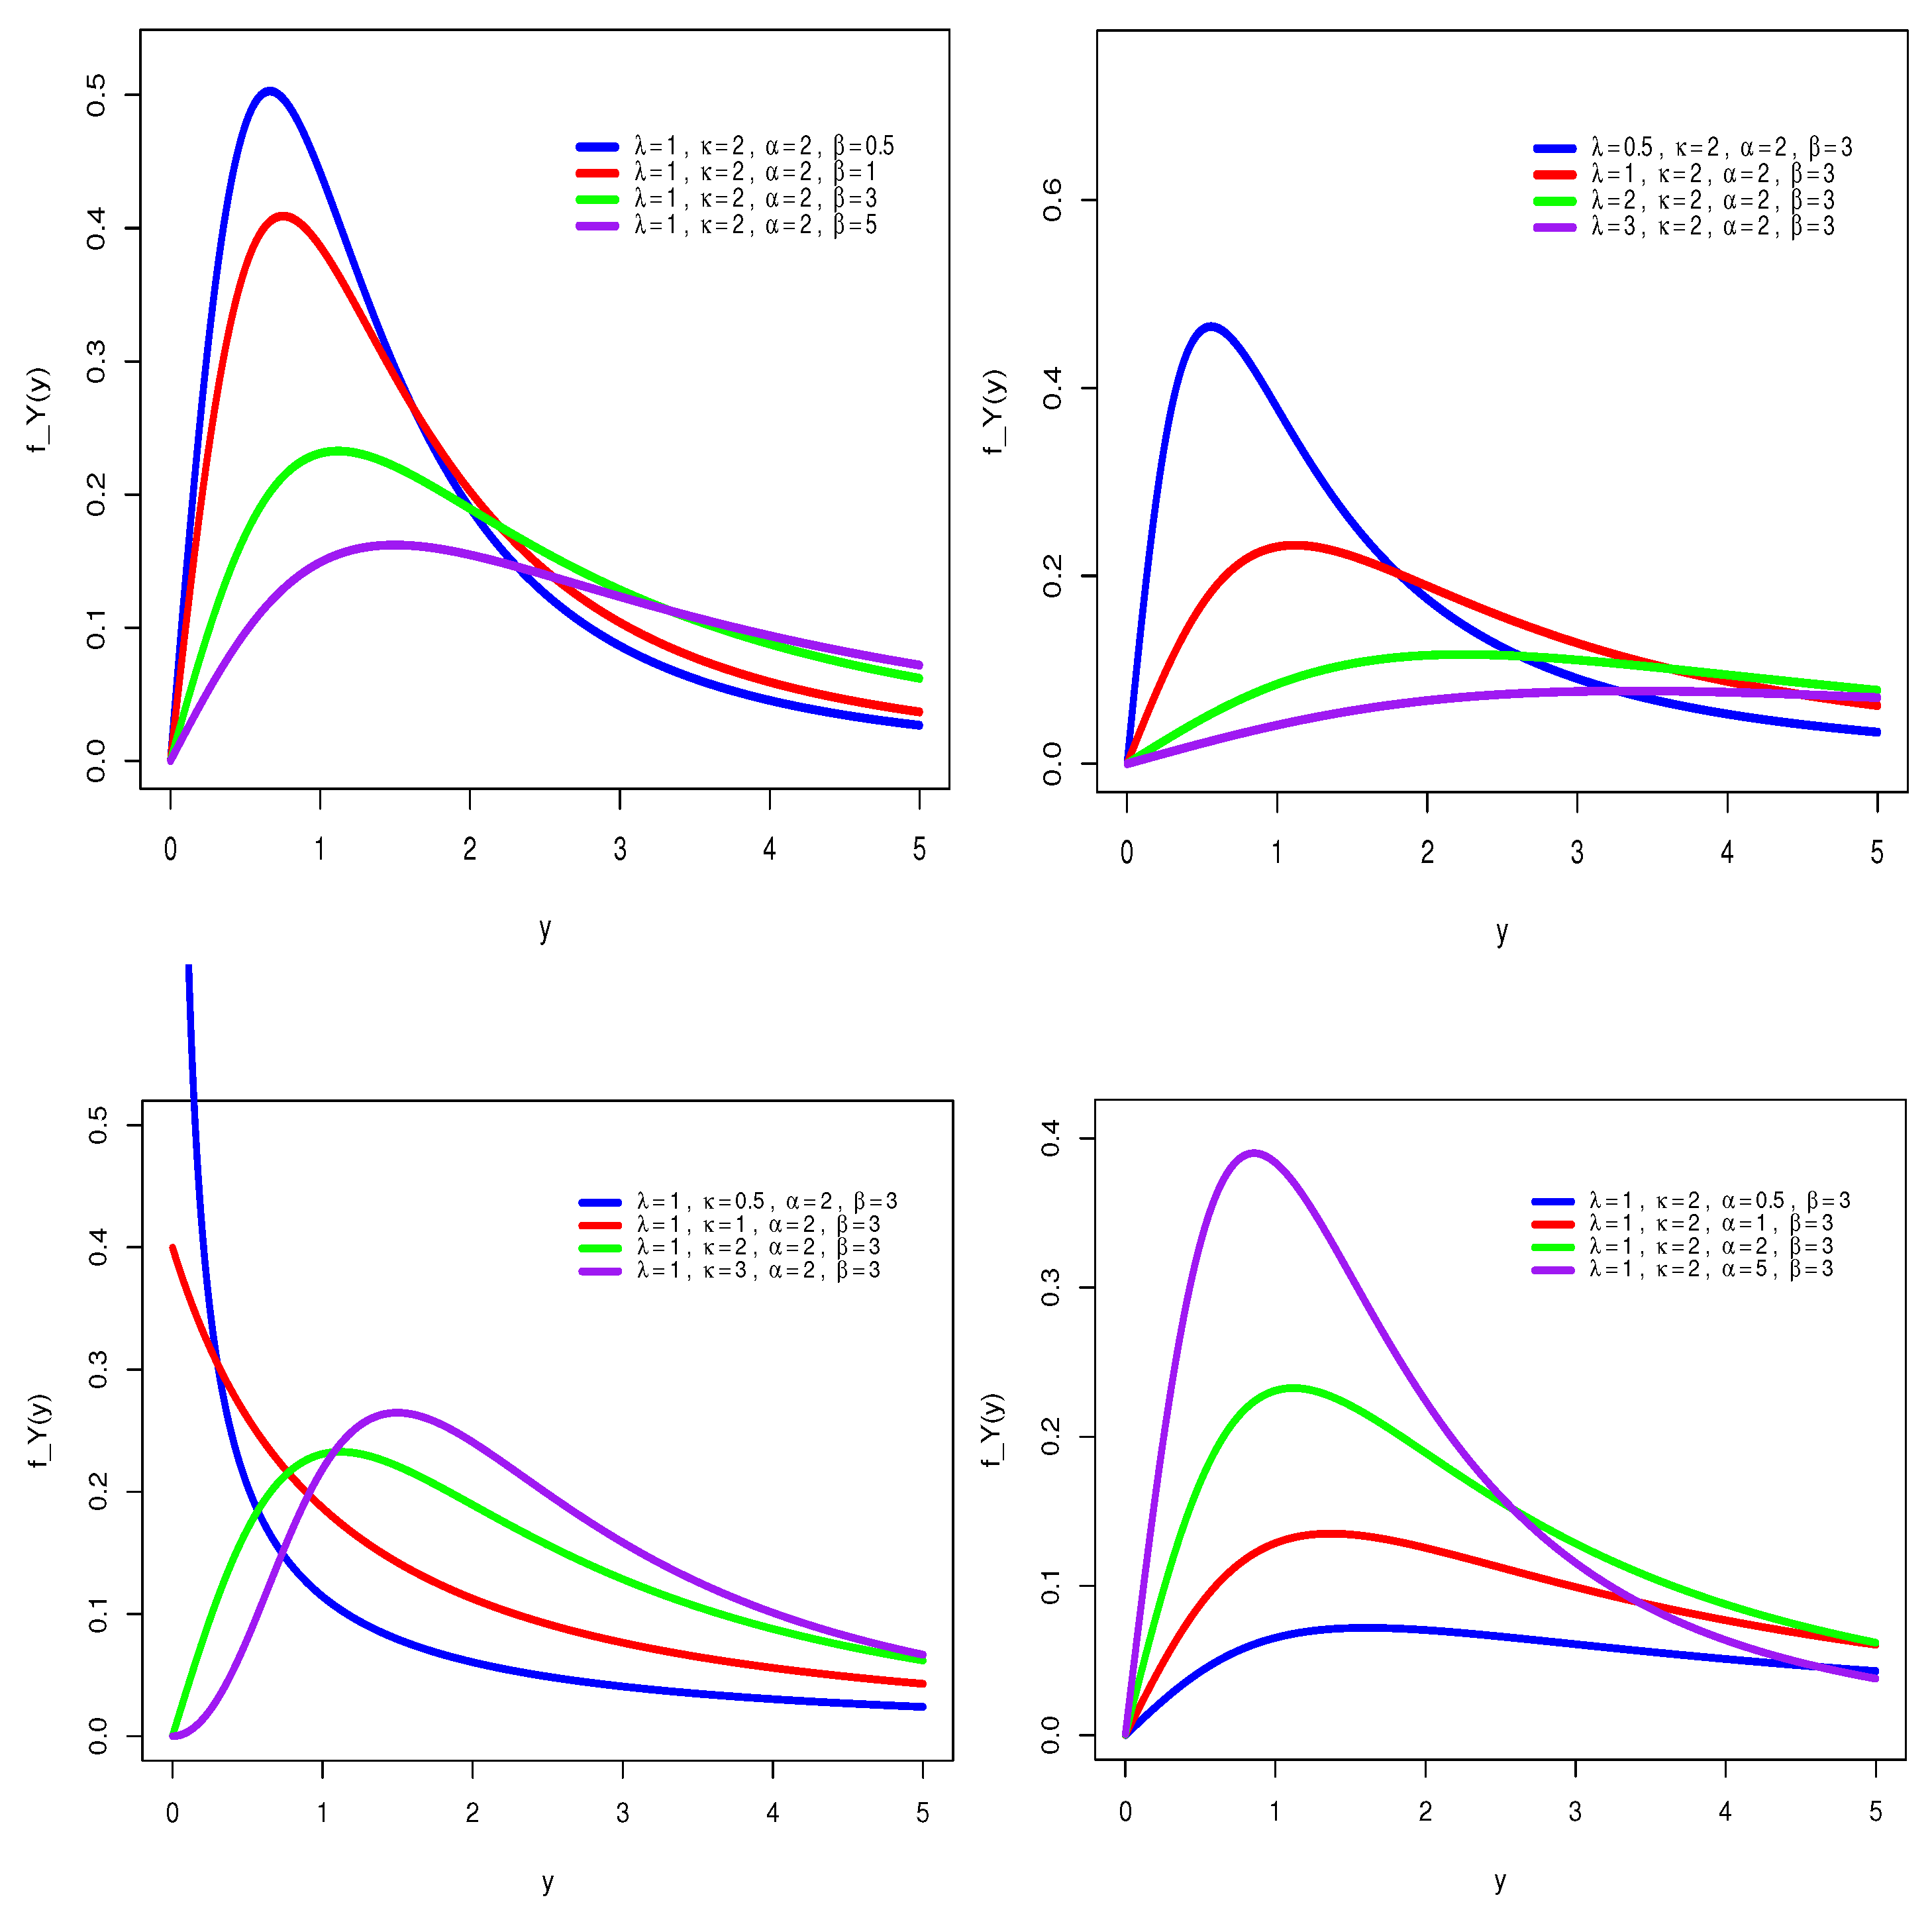
Figure 1. Graphs of PDF of the SlaLL distribution.
Symmetry 17 01795 g001
Figure 2. Graphs of HRF of the SlaLL distribution.
Symmetry 17 01795 g002
Figure 3. Heatmaps of skewness (top row) and excess kurtosis (bottom row) of the SlaLL distribution over ( κ λ ).
Symmetry 17 01795 g003
Figure 4. Bias of the estimated parameters for parameter set 1.
Symmetry 17 01795 g004
Figure 5. Bias of the estimated parameters for parameter set 2.
Symmetry 17 01795 g005
Figure 6. MSE of the estimated parameters for parameter set 1.
Symmetry 17 01795 g006
Figure 7. MSE of the estimated parameters for parameter set 2.
Symmetry 17 01795 g007
Figure 8. Diagnostic plots for the SlaLL model for dataset 1. Panels (from left): (i) violin plot with embedded boxplot (central dot = median; short bar = IQR; whiskers = 1.5 × IQR); (ii) empirical CDF (black) and fitted SlaLL CDF (red); (iii) histogram with empirical density (black) and fitted SlaLL PDF (red); (iv) P–P plot with empirical probabilities (dots), fitted curve (red), and 45° reference line (grey dotted).
Symmetry 17 01795 g008
Figure 9. Diagnostic plots for the SlaLL model for dataset 2. Panels (from left): (i) violin plot with embedded boxplot (central dot = median; short bar = IQR; whiskers = 1.5 × IQR); (ii) empirical CDF (black) and fitted SlaLL CDF (red); (iii) histogram with empirical density (black) and fitted SlaLL PDF (red); (iv) P–P plot with empirical probabilities (dots), fitted curve (red), and 45° reference line (grey dotted).
Symmetry 17 01795 g009
Figure 10. Diagnostic plots for the SlaLL model for dataset 3. Panels (from left): (i) violin plot with embedded boxplot (central dot = median; short bar = IQR; whiskers = 1.5 × IQR); (ii) empirical CDF (black) and fitted SlaLL CDF (red); (iii) histogram with empirical density (black) and fitted SlaLL PDF (red); (iv) P–P plot with empirical probabilities (dots), fitted curve (red), and 45° reference line (grey dotted).
Symmetry 17 01795 g010
Table 1. Comparison of MLE and BE for the SlaLL model under parameter set 1.
n MLEMSECILBCIUBBEMSECrILBCrIUB
25 λ 3.04210.21433.01143.07283.00870.03213.00023.0172
25 κ 1.48130.19821.45671.50591.50210.02941.49031.5139
25 α 2.09340.29752.06212.12472.02090.04832.00022.0232
50 λ 3.01930.10453.00273.03603.00520.02112.99673.0137
50 κ 1.49270.10231.47361.51181.49960.02191.48831.5109
50 α 2.04960.15742.02692.07232.02040.03312.00932.0315
100 λ 3.00810.05242.99723.01903.00330.01132.99683.0098
100 κ 1.49870.05361.48891.50851.50130.01641.49281.5098
100 α 2.02890.08162.01352.04432.01150.02272.00132.0217
150 λ 3.00420.03472.99613.01233.00250.00922.99563.0094
150 κ 1.50010.03621.49251.50771.50080.01411.49351.5081
150 α 2.01540.05322.00382.02702.01030.01792.00162.0190
200 λ 3.00280.02362.99553.01013.00170.00812.99523.0082
200 κ 1.50120.02691.49461.50781.50190.01071.49551.5083
200 α 2.01090.03712.00122.02062.00760.01421.99982.0154
250 λ 3.00170.01742.99543.00803.00120.00652.99543.0070
250 κ 1.50090.02051.49471.50711.50060.00931.49431.5069
250 α 2.00840.02872.00032.01652.00580.01211.99872.0129
300 λ 3.00110.01282.99553.00673.00070.00512.99533.0061
300 κ 1.50040.01711.49501.50581.50020.00811.49491.5055
300 α 2.00620.02231.99932.01312.00410.01021.99782.0104
Table 2. Comparison of MLE and BE for the SlaLL model under parameter set 2.
n MLEMSECILBCIUBBEMSECrILBCrIUB
25 λ 2.02240.17121.99682.0482.00750.10901.99892.016
25 κ 2.48940.29642.45572.52312.49650.03902.48522.5077
25 α 3.05700.38483.01863.09543.01900.04983.00623.0318
50 λ 2.01120.08561.99312.02932.00560.02141.99652.0147
50 κ 2.49470.14822.47082.51862.49730.03702.48542.5093
50 α 3.02850.19243.00133.05573.01430.04813.00073.0278
100 λ 2.00560.04281.99282.01842.00370.01901.99522.0123
100 κ 2.49730.07412.48052.51422.49820.03292.48702.5095
100 α 3.01430.09622.99503.03353.00950.04282.99673.0223
150 λ 2.00370.02851.99332.01422.00280.01601.99492.0107
150 κ 2.49820.04942.48452.51202.49870.02782.48832.5090
150 α 3.00950.06412.99383.02523.00710.03612.99543.0189
200 λ 2.00280.02141.99372.01192.00220.01371.99502.0095
200 κ 2.49870.03702.48672.51062.49890.02372.48942.5085
200 α 3.00710.04812.99353.02073.00570.03082.99483.0166
250 λ 2.00220.01711.99412.01032.00190.01191.99512.0086
250 κ 2.49890.02962.48832.50962.49910.02062.49022.5080
250 α 3.00570.03852.99353.01793.00480.02672.99463.0149
300 λ 2.00190.01431.99452.00932.00160.01051.99532.0079
300 κ 2.49910.02472.48942.50892.49920.01812.49092.5076
300 α 3.00480.03212.99373.01583.00410.02362.99463.0136
Table 3. Model fit metrics for dataset 1.
DistributionEstimates−LoglAICBICK-Sp-Value A W
SlaLL λ ^ = 5.6814 151.9841311.9683317.57310.114690.82490.443190.08109
κ ^ = 1.4973
α ^ = 2.6052
β ^ = 8.8743
SL θ ^ = 1.2453 176.0303358.0606365.87610.84724<2.2 × 10−1691.0388.2901
α ^ = 1.4946
β ^ = 0.6136
SML θ ^ = 6.4862 212.7549431.5097439.32520.395140.0001257.42941.4276
α ^ = 7.7069
β ^ = 123.9153
SI θ ^ = 1.3455 153.8979313.7957317.99930.144530.55790.612350.08441
α ^ = 1.5009
β ^ = 12.1172
Table 4. Model fit metrics for dataset 2.
DistributionEstimates−LoglAICBICK-Sp-Value A W
SlaLL λ ^ = 0.8452 136.7253281.4506289.33180.10760.57180.79290.1263
κ ^ = 1.1661
α ^ = 3.2863
β ^ = 4.4443
SL θ ^ = 31.7889 137.9096295.8192291.73010.15610.15081.00680.1553
α ^ = 3.0101
β ^ = 323.0142
SML θ ^ = 6.4862 212.7549431.5097439.32520.17080.09073.90340.4814
α ^ = 7.7069
β ^ = 123.9153
SI θ ^ = 1.3455 153.8979313.7957317.99930.17080.09073.66430.5643
α ^ = 0.5089
β ^ = 2.172
Table 5. Model fit metrics for dataset 3.
DistributionEstimates−LoglAICBICK-Sp-Value A W
SlaLL λ ^ = 4.6677793.86781595.7361607.4160.07910.35860.73190.1156
κ ^ = 1.4038
α ^ = 6.4576
β ^ = 75.4064
SL θ ^ = 37.8879934.90961775.09921881.73010.7974<2.2 × 10−163.57886.9228
α ^ = 31.1101
β ^ = 23.7142
SML θ ^ = 1.87432912.75492318.00902436.32520.7974<2.2 × 10−166.86427.9642
α ^ = 8.7069
β ^ = 43.9153
SI θ ^ = 0.1369807.44391620.8881629.6480.11280.06122.74393.8753
α ^ = 1.5058
β ^ = 266.9019
Disclaimer/Publisher’s Note: The statements, opinions and data contained in all publications are solely those of the individual author(s) and contributor(s) and not of MDPI and/or the editor(s). MDPI and/or the editor(s) disclaim responsibility for any injury to people or property resulting from any ideas, methods, instructions or products referred to in the content.