Article

Stability Control Method Utilizing Grid-Forming Converters for Active Symmetry in the Elastic Balance Region of the Distribution Grid

1
State Grid Shanghai Energy Interconnection Research Institute Co., Ltd., Shanghai 201210, China
2
Xinjiang Information Industry Co., Ltd., Urumqi 830011, China
*
Author to whom correspondence should be addressed.
Symmetry 2025, 17(2), 263; https://doi.org/10.3390/sym17020263
Submission received: 13 December 2024 / Revised: 27 January 2025 / Accepted: 3 February 2025 / Published: 9 February 2025
(This article belongs to the Special Issue Symmetry/Asymmetry Studies in Modern Power Systems)

Abstract

:
The development of the elastic balance area within the distribution network places greater demands on the interaction between sources and loads, which impacts the stability of the power system. While achieving symmetry in active power is essential for stable operation, it is challenging to attain perfection due to various disruptions that can exacerbate frequency and voltage instability. Additionally, due to the inherent resonance characteristics of LCL filters and the time-varying nature of weak grid line impedance, grid-connected inverters may interact with the grid, potentially leading to oscillation issues. A grid-forming inverter control method that incorporates resonance suppression is proposed to address these challenges. First, a control model for the grid-forming inverter based on the Virtual Synchronous Generator (VSG) is established, enabling the system to exhibit inertia and damping characteristics. Considering the interaction between the VSG grid-connected system and the weak grid, sequence impedance models of the VSG system, which feature voltage and current double loops within the αβ coordinate system, are developed using harmonic linearization techniques. By combining the impedance analysis method, the stability of the system under weak grid conditions is evaluated using the Nyquist criterion. The validity of the analysis is confirmed through simulations. Finally, in order to ensure the effectiveness and correctness of the simulation, an experimental prototype of an NPC three-level LCL grid-forming inverter is built, and the experimental results have verified that the system has good elastic support capability and resonance suppression capability in the elastic region.

1. Introduction

With the advancement of new power systems, distributed energy sources such as photovoltaic and wind power generation, along with flexible loads, have been extensively integrated into the distribution system [1,2]. The randomness and volatility of outputs from distributed power sources, coupled with the extensive involvement of flexible loads in demand response, will significantly alter the operating characteristics of the power grid. Active power symmetry plays a vital role in this context. It refers to the balanced distribution and exchange of active power among different components within the power grid, including power sources, grids, loads, and energy storage. This change will shift the operating mode from a deterministic power balance—where power sources follow load demands—to a dynamic balance characterized by interactions between power sources and loads. As a result, balancing power and energy between these entities will become more challenging. Additionally, the safety and stability concerns related to large-scale interactions between power sources and loads are becoming increasingly prominent. The low inertia and weak damping characteristics of these systems exacerbate stability concerns [3,4]. Grid-forming inverters have gained significant attention because they behave like synchronous voltage sources and can provide some inertia support to the electrical grid. The most common control strategies for these inverters include droop control and Virtual Synchronous Generator control, both of which adjust power output in response to grid demand. Additionally, matching control and virtual oscillator control can enhance grid performance. Matching control optimizes the compatibility between the inverter and the grid, while virtual oscillator control introduces nonlinear oscillation mechanisms to support grid stability [5,6,7].
To improve the quality of grid-connected electrical power, an LCL-type filter needs to be connected in series with the inverter output side. However, there are significant resonance issues associated with this configuration [8]. Currently, LCL resonance suppression methods can be categorized into two primary approaches: (1) Passive damping methods involve inserting or paralleling resistors in the LCL filter to suppress resonance [9,10]. While passive damping does not introduce additional control loops to the system, it incurs considerable power losses. (2) Active damping methods mainly include the pre-filtering method and the state variable feedback method [11,12]. Reference [13] employs a notch filter in the system control loop to suppress LCL resonance using pole-zero cancelation, However, this method is sensitive to system parameters. Adaptive algorithms have been used in References [14,15] to reduce the parameter sensitivity issue, though this significantly increases the complexity of system control. Due to various drawbacks associated with the pre-filtering method, researchers have increasingly focused on the state variable feedback method. Commonly used state variables include inverter-side current, capacitor voltage, or current and grid current. When employing the grid current feedback method, the active damping controller utilizes a second-order differential component, which can effectively suppress LCL resonance [16,17]. However, these methods primarily target grid-connected inverters under conventional single-current loop control and are not readily applicable to VSG-based grid-connected systems.
Regarding system stability, the premise for VSG to actively underpin weak grids is that the VSG can function reliably when connected to the grid due to the VSG control strategy simulating the motion equation of synchronous generators; when the load changes, VSG can detect the changes and make corresponding adjustments, so that the inverter can provide good elastic support for the active frequency and reactive voltage stability of the system when facing interference in the elastic balance region [18]. References [19,20] established the state-space equation of a multi-machine parallel system using the state-space modeling method and analyzed the static stability of the grid-connected system. However, these studies primarily focus on traditional VSG control strategies, with limited research on the influence of LCL filters on the stability of VSG grid-connected systems.
Addressing the aforementioned issues, a grid-forming inverter control method with resonance suppression is discussed. In this method, VSG technology is used to make the grid-forming inverter have similar inertia and damping characteristics as the synchronous machine, ensuring that the grid provides elastic support for frequency and voltage while reducing the harmonic distortion rate of grid current. Additionally, the harmonic linearization method is used to build the sequential impedance model of the inverter system on the grid side. The stability of the system is then analyzed from an impedance perspective.

2. Topology and Control Strategies of VSG

Figure 1 illustrates the topology and control structure of the VSG-based grid-forming inverter under weak grid conditions. Vdc is the input DC voltage; C1 and C2 are the DC voltage divider capacitors; Point O is the midpoint of the DC side; via, vib, and vic are the inverter output bridge arm voltages; C is the filtering capacitor; L1 and L2 are, respectively, the filter inductors on the inverter side and the grid side; i1a, i1b, and i1c are the inverter-side three-phase currents; i2a, i2b, and i2c are the grid-side currents; eg is the grid voltage; and Lg is the grid inductor. By applying an appropriate control strategy, the voltage waveform output by the inverter can be controlled and, after filtering through the LCL filter, the output voltage is integrated into the grid.

2.1. P-f Control

The P-f loop of the VSG primarily exhibits inertia and damping characteristics by emulating the rotor dynamics of conventional synchronous generators. Combining with the synchronous generator’s second-order model [21,22], the P-f equation for the VSG is represented as follows (1):
J d ω d t = P r e f ω n P e ω n D p ω ω n d θ d t = ω
where, J-the VSG’s virtual inertia, Pref is the given active power, ω and ωn refer to the output and rated angular frequencies of the VSG, θ represents the phase angle, and Pe is the instantaneous active power.

2.2. Q-U Control

In the VSG, the Q-U loop primarily simulates the excitation controller of synchronous generators [21,22]. The Q-U equation can be expressed as (2):
2 E r = 1 K q s [ 2 ( U n U ) D q + Q r e f Q e ]
where Kq is the excitation constant, U is the effective value of the output voltage, Dq is the Q-U Loop droop constant, Un is the rated effective voltage, Qref is the reference value for reactive power, Qe is the instantaneous reactive power, and Er represents the virtual internal voltage’s effective value.
The internal voltage of the VSG is jointly defined by the outer loop control, which is expressed as Equation (3):
e a = 2 E r sin θ e b = 2 E r sin ( θ 2 3 π ) e c = 2 E r sin ( θ + 2 3 π )

2.3. Virtual Impedance Control

According to the electrical characteristics of the stator, the internal voltage Eq, stator current I, and terminal voltage U of a synchronous generator exhibit the following relationship:
U = E q I ( r a + j ω L d )
where ra is the armature resistance of the synchronous generator and Ld is the synchronous inductance.
To achieve the stator electrical characteristics shown in Equation (4) for the grid-tied system, virtual impedance is employed in the VSG control strategy and transformed into the αβ coordinate system as shown in Equation (5):
u α r e f = e α R v i α + ω L v i β u β ref = e β R v i β ω L v i α
where Rv denotes the virtual resistor, Lv denotes the virtual inductor; eα and eβ are the αβ axis components of the voltages ea, eb, and ec within VSG; iα and iβ are the αβ axis components of the system grid-side currents; and the reference components of the voltage output from the virtual impedance loop in the αβ axis are uαref and uβref.
The voltage reference value obtained through the power outer-loop control and virtual impedance control in Section 2.1, Section 2.2 and Section 2.3 can be directly used as the modulation signal for SPWM, allowing the grid-connected system to exhibit inertia and damping characteristics as those of a synchronous generator. Nevertheless, since the relatively decelerated dynamic response of the outer loop control, the grid-tied power quality cannot be fully ensured. Therefore, it is necessary to add an inner-loop controller to accelerate the system’s dynamic response and improve power quality.

2.4. VSG Voltage Loop Control

The quasi-PR controller not only retains the advantages of the PR (Proportional-Resonant) controller but also reduces the impact of frequency deviation on the AC side. Therefore, this paper selects a voltage loop design based on the quasi-PR controller. The expression for the quasi-PR controller is shown in Equation (6).
G P R ( s ) = K p + 2 K r ω i s s 2 + 2 ω i s + ω o 2
where Kp denotes the proportional factor, Kr denotes the resonant factor, and ωi is the fundamental resonant bandwidth. In this paper, ωi = πrad/s and ωo is the angular frequency reference value.
The voltage loop expression of the VSG based on the quasi-PR controller G1(s) is as follows:
i α r e f = G 1 ( s ) ( u α r e f u α ) i β r e f = G 1 ( s ) ( u β r e f u β )
where Kp1 is the proportional coefficient of G1(s), Kr1 is the resonant coefficient of G1(s), uαref and uβref are the voltage loop αβ axis reference components output by the virtual impedance, uα and uβ represent the output voltages of the αβ axis components at the PCC of the system, and iαref and iβref are the current loop αβ axis reference components output by the voltage loop.

2.5. VSG Current Loop Control

After obtaining the reference value of the current loop controlled by the VSG voltage loop, it is necessary to adjust the grid side current of the grid-connected system through the current loop. Based on the proportional controller G2(s), the expression of the VSG current loop can be expressed as (8)
u i α = G 2 ( s ) ( i α r e f i α ) u i β = G 2 ( s ) ( i β r e f i β )
where Kp2 is the proportional coefficient of G2(s). The outputs of the current loop, u and u, serve as the αβ axis components of the inverter’s modulation wave; iαref and iβref serve as the reference components of the current loop’s αβ axis, outputted by the voltage loop; and iα and iβ represent the current of the αβ axis components at the grid-side in the system.
To address the resonance issues introduced by the LCL filter, an active damping component based on grid-side feedback is incorporated into the current control loop.
G a d ( s ) = k a d s 2
where kad represents the active damping coefficient.

3. Impedance Modeling of Grid-Forming Inverters Based on VSG Under Weak Grid Conditions

Considering that the three-phase grid-connected system in this paper does not control the dq coordinate system, and the advantages of harmonic linearization modeling method are clear physical meaning, convenient measurement and verification of sequential impedance model, and relatively simple stability criteria, in order to create the impedance model for the three-phase grid-connected system, this paper uses the harmonic linearization modeling technique.

3.1. Sequence Impedance Modeling

In the time domain, after injecting a small signal perturbation on the grid side, the expression for the output voltage ua(t) of the system and the grid-side current i2a(t) are as follows:
u a ( t ) = V 1 cos ( 2 π f 1 t ) + V p cos ( 2 π f p t + φ v p ) + V n cos ( 2 π f n t + φ v n )
i 2 a ( t ) = I 1 cos ( 2 π f 1 t + φ i 1 ) + I p cos ( 2 π f p t + φ i p ) + I n cos ( 2 π f n t + φ i n )
where V1, Vp, and Vn represent the amplitudes of the disturbance voltages of each sequence, respectively; I1, Ip, and In represent the corresponding response current amplitudes; f1, fp, and fn represent the corresponding perturbation frequencies; φvp and φvn are the initial phase angles of the positive-sequence and negative-sequence disturbance voltages, respectively; φi1, φip and φin are the initial phase angles of the corresponding response currents.
Equations (10) and (11) can be transformed into the frequency domain as follows:
u a [ f ] = V 1 , f = ± f 1 V p , f = ± f p V n , f = ± f n i 2 a [ f ] = I 1 , f = ± f 1 I p , f = ± f p I n , f = ± f n
where V1 = V1/2; Vp = (Vp/2)e ± jφvp; Vn = (Vn/2)e ± jφvn; I1 = (I1/2)e ± jφi1; Ip = (Ip/2)e ± jφip; In = (In/2)e ± jφin.
Since the grid-connected system studied in this paper is three-phase symmetric, Equation (12) can be transformed into the αβ coordinate system.
u α [ f ] = V 1 , f = ± f 1 V p , f = ± f p V n , f = ± f n u β [ f ] = j V 1 , f = ± f 1 j V p , f = ± f p ± j V n , f = ± f n
i 2 α [ f ] = I 1 , f = ± f 1 I p , f = ± f p I n , f = ± f n i 2 β [ f ] = j I 1 , f = ± f 1 j I p , f = ± f p ± j I n , f = ± f n
According to the fundamental principles of the modeling method of harmonic linearization, the expression of the function between the disturbance voltage and the response current can be obtained.
Z v p = V p I p Z v p = V n I n
where Zvp(s) and Zvn(s) represent the positive and negative sequence impedance of the VSG system. By combining the above three layers of functional relationships, the functional relationship between Vp(Vn) and Ip(In) can be solved, and the sequence impedance model of the VSG system can be obtained. Based on the operating principle of the system shown in Figure 1, the small signal flow chart of the system as shown in Figure 2.
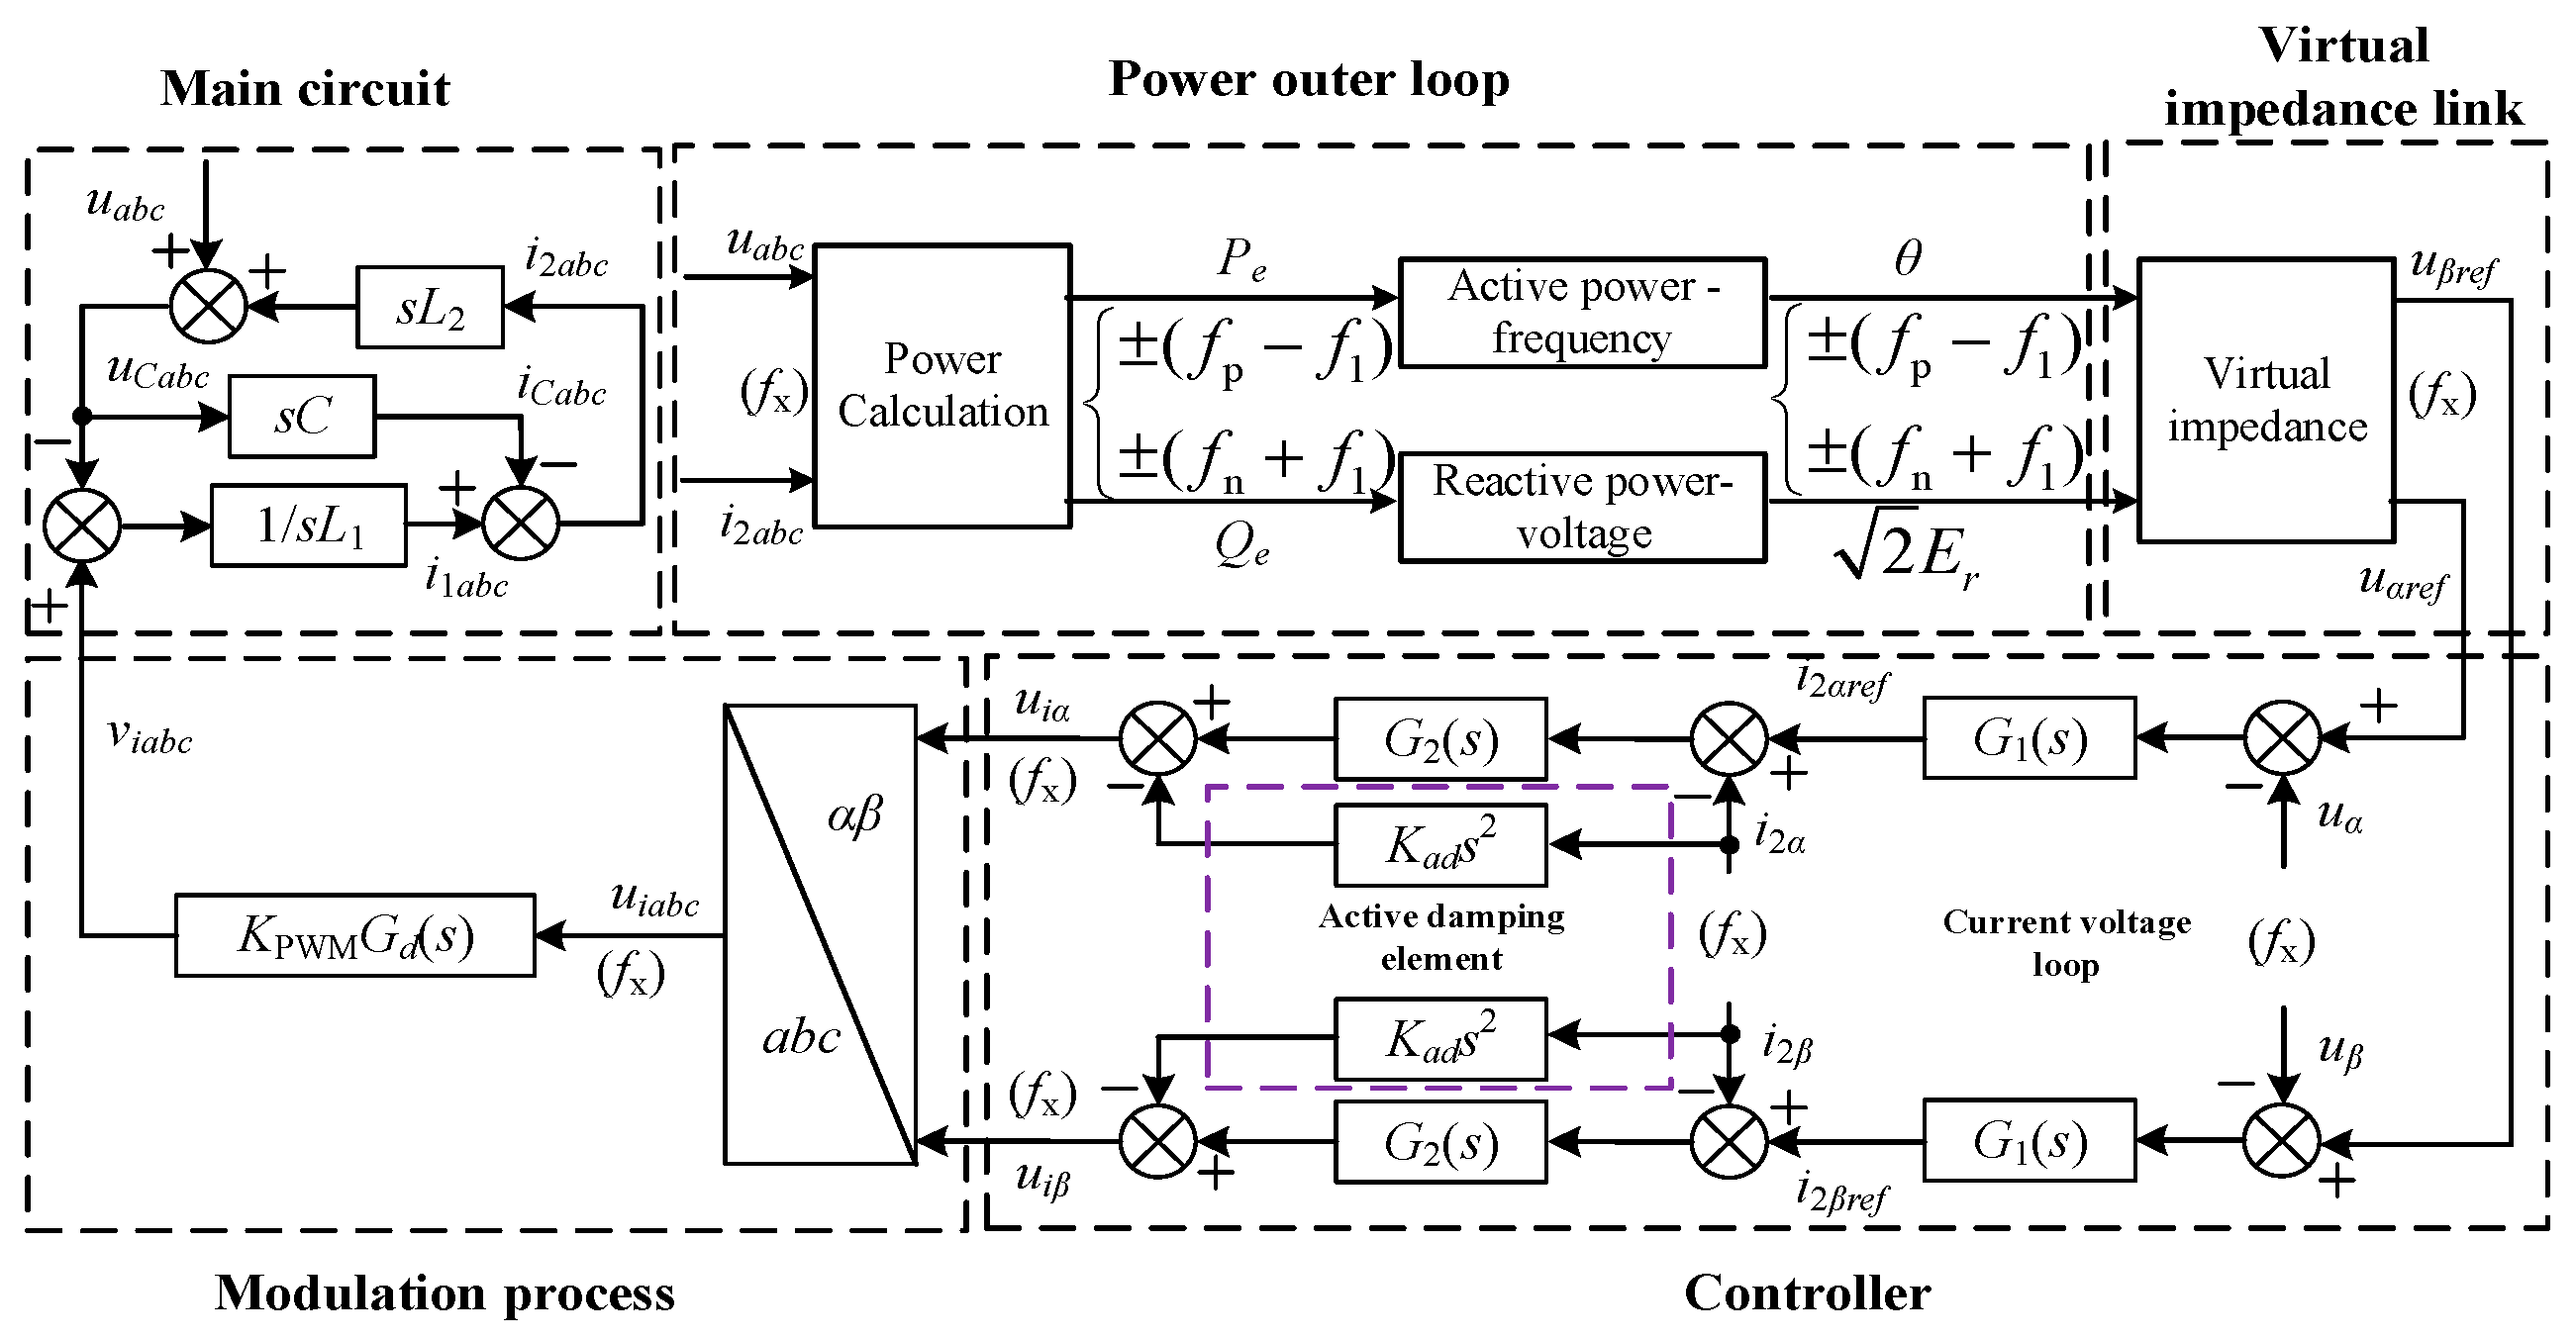
Figure 2 illustrates the small signal flow diagram of the VSG system, where the main circuit is composed of filters, and the control loop consists of the VSG power loop, virtual impedance segment, voltage–current loop, and modulation segment. In the figure, the subscript x = p, n represents the positive and negative sequence disturbance component at frequency f. Based on Figure 2, the impedance modeling of the VSG system can be divided into five parts. Below, the impedance models for these five components are established.

3.2. Modeling of the Main Circuit for the VSG Grid-Connected Systems

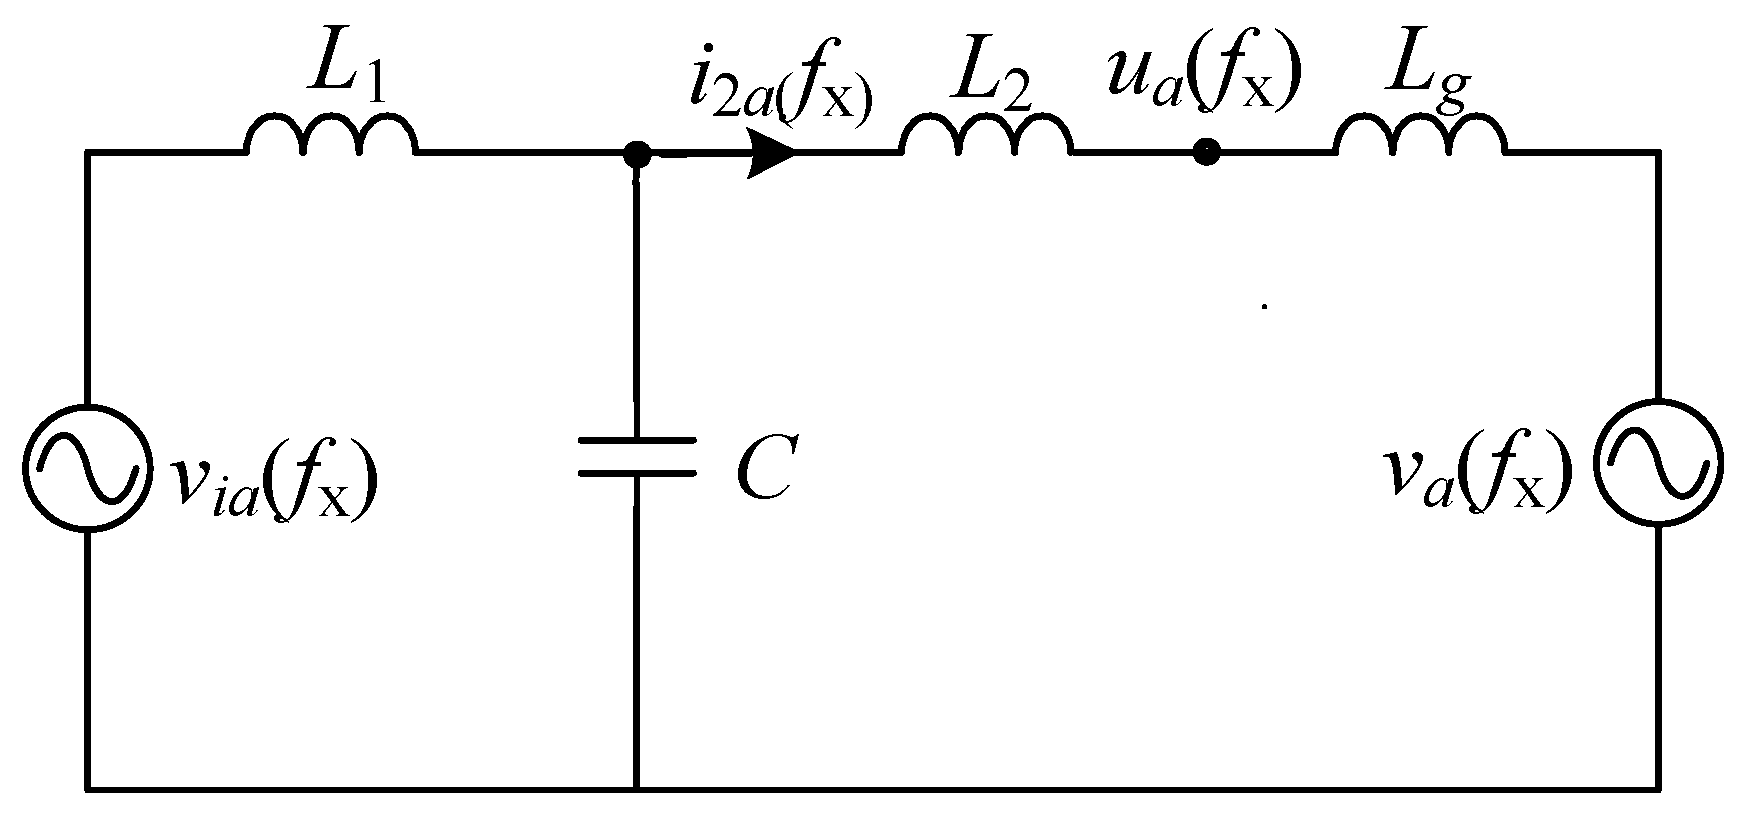
Injecting small signal voltage disturbances in positive and negative sequences with frequencies fp and fn on the grid side will generate current response signals with frequencies fp and fn, respectively. Taking phase a as an example, Figure 3 represents the harmonic small signal equivalent model of the main circuit. In the figure, the subscript x = p indicates the positive sequence disturbance component at frequency fp, while x = n indicates the negative sequence disturbance component at frequency fn.
Based on Figure 3, the corresponding main circuit small signal expression is (16)
v i a [ f ] = [ L 1 L 2 C s 3 + ( L 1 + L 2 ) s ] i 2 a [ f ] + ( L 1 C s 2 + 1 ) u a [ f ]

3.3. VSG Power Outer Loop Modeling

It is known that the expression for the output power of the system in the αβ coordinate system can be expressed as (17)
P e = 1.5 G f ( s ) ( u α i 2 α + u β i 2 β ) Q e = 1.5 G f ( s ) ( u β i 2 α u α i 2 β )
where Gf(s) = ωl/(s + ωl) represents the transfer function of a low-pass filter and ωl represents the cutoff frequency of the low-pass filter.
By substituting Equations (14) and (15) into Equation (18), and combining the frequency domain convolution theorem while neglecting the effects of second-order small-signal disturbance terms, the expressions for Pe and Qe of the system in the frequency domain can be expressed as (18)
P e = 3 G f ( s ) ( V 1 I 1 * + I 1 V 1 * ) ,   f = dc 3 G f ( s ) ( I p V 1 * + V p I 1 * ) , f = ± ( f p f 1 ) 3 G f ( s ) ( V 1 I n + V n I 1 ) ,   f = ± ( f n + f 1 )
Q e = 3 j G f ( s ) ( V 1 I 1 * + I 1 V 1 * ) , f = dc ± 3 j G f ( s ) ( I p V 1 * V p I 1 * ) , f = ± ( f p f 1 ) ± 3 j G f ( s ) ( V 1 I n + V n I 1 ) , f = ± ( f n + f 1 )
The expression for θ can be obtained from the VSG active power controller as (20)
θ ( s ) = M ( s ) ( P r e f P e + D p ω n 2 )
In the above formula, M(s) = 1/(Jωns2 + Dωns).
By substituting Equation (18) into Equation (20), the expressions about θ can be expressed as (21)
θ [ f ] = 3 G f ( s ) M ( s ) ( I p V 1 * + V p I 1 * ) , f = ± ( f p f 1 ) 3 G f ( s ) M ( s ) ( V 1 I n + V n I 1 ) , f = ± ( f n + f 1 )
Regarding the output θ of the VSG active power-frequency loop, the corresponding phase angle perturbation ∆θ can be introduced by voltage perturbations, which can be expressed as (22)
Δ θ [ f ] = 3 G f ( s ) M ( s ) ( I p V 1 * + V p I 1 * ) , f = ± ( f p f 1 ) 3 G f ( s ) M ( s ) ( V 1 I n + V n I 1 ) , f = ± ( f n + f 1 )
The phase angle disturbance ∆θ yields θ = θ1 + ∆θ, where θ1 is the fundamental wave angle of the grid-connected system, obtaining Equation (23).
cos θ [ f ] = cos θ 1 [ f ] + Δ θ [ f ] cos θ 1 [ f ] Δ θ [ f ] * sin θ 1 [ f ]
where θ = θ1 + ∆θ, with φ1 denoting the power angle of the VSG, φ1 ≈ arsin[PNωnLv/(VNV1)].
In the frequency domain, the value of θ1 can be calculated as (24)
cos θ 1 [ f ] = e ± j φ 1 / 2 , f = ± f 1 sin θ 1 [ f ] = e ± j ( φ 1 + π / 2 ) / 2 ,     f = ± f 1
By substituting Equations (22) and (24) into Equation (23), we can obtain Equation (25).
cos θ [ f ] = 1 2 e ± j φ 1 , f = ± f 1 3 2 e ± j φ vir G f ( s j 2 π f 1 ) M ( s j 2 π f 1 ) ( I p V 1 * + V p I 1 * ) , f = ± f p 3 2 e j φ vir G f ( s ± j 2 π f 1 ) M ( s ± j 2 π f 1 ) ( V 1 I n + V n I 1 ) , f = ± f n
where φvir = φ1 + π/2.
From the reactive power–voltage controller Equation (2) of the VSG, the internal voltage magnitude 2 Em in the frequency domain is given by
2 E r [ f ] = V 1 ,     f = dc 2 D q V p 3 j G f ( s ) ( I p V 1 * V p I 1 * ) K q s , f = ± ( f p f 1 ) 2 D q V n ± 3 j G f ( s ) ( V 1 I n V n I 1 ) K q s , f = ± ( f n + f 1 )
By combining Equations (25) and (26) with the VSG power outer loop inner voltage Equation (3), we can neglect the effects of second-order small-signal disturbance terms and transform them into the αβ coordinate system. Considering that the system is three-phase balanced and symmetrical, eα[f] = ea[f], the expression for eα is obtained as (27)
e α [ f ] = H 1 ( s ) V p + H 2 ( s ) ( I p V 1 * V p I 1 * ) + H 3 ( s ) ( I p V 1 * + V p I 1 * ) , f = ± f p H 1 * ( s ) V n H 2 * ( s ) ( V 1 I n V n I 1 ) + H 3 * ( s ) ( V 1 I n + V n I 1 ) , f = ± f n
where
H 1 ( s ) = D q e ± j φ 1 / K q ( s j 2 π f 1 ) H 2 ( s ) = 1.5 j G f ( s j 2 π f 1 ) e ± j φ 1 / K q ( s j 2 π f 1 ) H 3 ( s ) = 1.5 V 1 e ± j φ v i r G f ( s j 2 π f 1 ) M ( s j 2 π f 1 )

3.4. Virtual Impedance Modeling of the VSG

As shown in Figure 2, the output of the VSG power outer loop, after passing through the virtual impedance stage, becomes the reference quantity for the output voltage loop. Combining Equation (5), the α-axis reference component uαref of the voltage loop is given by (29)
u α r e f [ f ] = H 1 ( s ) V p + H 2 ( s ) ( I p V 1 * V p I 1 * ) + H 3 ( s ) ( I p V 1 * + V p I 1 * ) R v I p j ω n L v I p , f = ± f p H 1 * ( s ) V n H 2 * ( s ) ( V 1 I n V n I 1 ) ] + H 3 * ( s ) ( V 1 I n + V n I 1 ) R v I n ± j ω n L v I n , f = ± f n

3.5. VSG Inner Loop Modeling

Using the voltage loop reference obtained from Equation (29) and the voltage outer loop control principle in Figure 2, the α-axis current loop reference component iαref is given by
i α r e f [ f ] = G 1 ( s ) ( u α r e f [ f ] V p ) ,   f = ± f p G 1 ( s ) ( u α r e f [ f ] V n ) , f = ± f n
From the small-signal flowchart of the VSG system depicted in Figure 2, it can be known that the α-axis modulation wave of the current loop output is denoted as u[f]:
u i α [ f ] = G 2 ( s ) ( i α r e f [ f ] I p ) K a d s 2 I p ,   f = ± f p G 2 ( s ) ( i β r e f [ f ] I n ) K a d s 2 I n , f = ± f n

3.6. Modulation Link Modeling

Given that the grid-connected system is balanced in three phases, uia[f] = u[f]. The PWM modulation signal in the αβ coordinate system is derived from the output of the inner loop. By transforming it into the abc coordinate system, the response signal of the voltage of the bridge arm can be obtained as (32)
v i a [ f ] = K PWM u i a [ f ] G d ( s )
By combining Equations (16), (31), and (32), the sequence impedances Zvp and Zvn of the grid-forming inverter can be determined as follows:
Z v p ( s ) = 0.5 V 1 K 1 ( s ) [ H 2 ( s ) + H 3 ( s ) ] + ( R v ± j ω n L v ) K 1 ( s ) + K 2 ( s ) + L 1 L 2 C s 3 + ( L 1 + L 2 ) s 0.5 I 1 K 1 ( s ) [ H 2 ( s ) H 3 ( s ) ] + K 1 ( s ) [ 1 H 1 ( s ) ] + L 1 C s 2 + 1
Z v n ( s ) = 0.5 V 1 K 1 ( s ) [ H 2 * ( s ) H 3 * ( s ) ] + [ R v j ω n L v ] K 1 ( s ) + K 2 ( s ) + L 1 L 2 C s 3 + ( L 1 + L 2 ) s 0.5 I 1 K 1 ( s ) [ H 2 * ( s ) + H 3 * ( s ) ] + K 1 ( s ) [ 1 H 1 * ( s ) ] + L 1 C s 2 + 1
where
K 1 ( s ) = K PWM G 1 ( s ) G 2 ( s ) G d ( s ) K 2 ( s ) = K PWM K a d s 2 G d ( s ) + K PWM G 2 ( s ) G d ( s )

4. Stability Analysis

To further analyze the stability of the VSG system, this paper analyzes the impedance proportion of grid-forming inverters and weak grids based on the Nyquist criterion. Given that the VSG system exhibits symmetrical characteristics in three-phase balance during grid-connected operation, the positive and negative sequence impedances are decoupled in the system. Therefore, the impedance proportion applied to determine the stability of the grid-connected system is calculated using Equation (36).
H v p ( s ) = Z v p ( s ) Z g p ( s ) H v n ( s ) = Z v n ( s ) Z g n ( s )
Here, Hvp(s) and Hvn(s) represent the positive and negative sequence impedance proportions, respectively, between the grid-forming inverter and the weak grid. Zgp(s) and Zgn(s) represent the positive and negative sequence impedances of the grid, respectively, and Zg(s) = Zgp(s) = Zgn(s) = sLg.
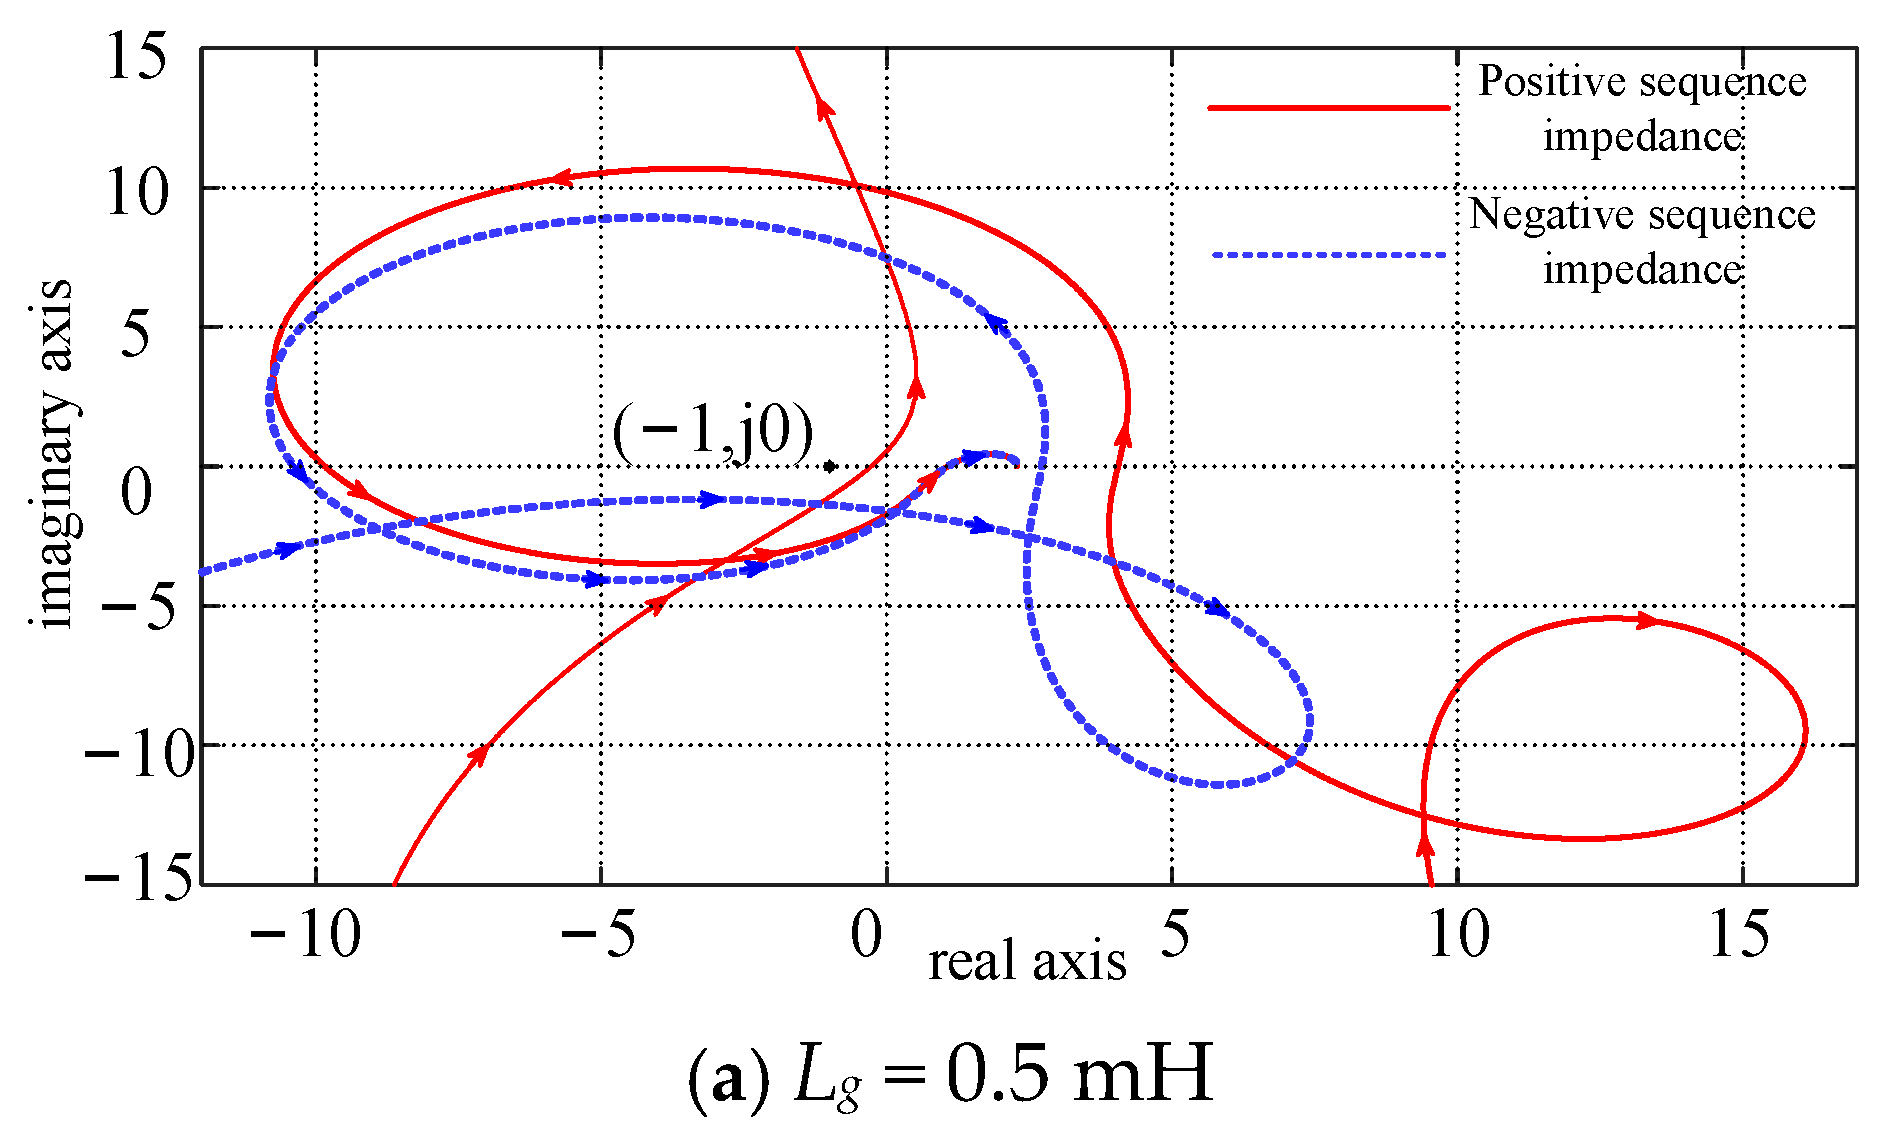
Figure 4 shows the Nyquist diagrams of the grid-connected system’s Hvp(s) and Hvn(s) under different weak grid conditions, and Table 1 shows the analysis of the Nyquist diagram in Figure 4. Among them, the red solid line represents the system’s positive sequence impedance ratio Hvp(s), and the blue dashed line represents the system’s negative sequence impedance ratio Hvn(s). When the difference between the number of positive crossings N+ and the number of negative crossings N- of the open-loop frequency characteristic curve of the system in the section of the negative real axis (−1, −∞) multiplied by 2 is equal to the number of right poles of the open-loop system, the closed-loop system is stable. Both Hvp(s) and Hvn(s) have two poles in the right half-plane. Therefore, when the grid-connected system is stable, the Nyquist curves of both Hvp(s) and Hvn(s) should cross the negative real axis to the left of the point (−1, j0) positively once. It can be seen from Figure 4 that as the grid becomes weaker, the Nyquist curves of Hvp(s) and Hvn(s) each cross the negative real axis to the left of the point (−1, j0) positively once. From this, it can be concluded that the grid-connected system with the active damping link added can operate stably under weak grid conditions.

5. Simulation Analysis

To assess the efficacy of the proposed VSG control strategy for the grid-forming inverter, a simulation model based on VSG is constructed using MATLAB/Simulink 2023a under weak grid conditions. The results of this simulation are then analyzed, with the parameters outlined in Table 2.

5.1. Verification of the Dynamic Performance of the VSG

5.1.1. Participate in the Grid Frequency Modulation Capability Verification

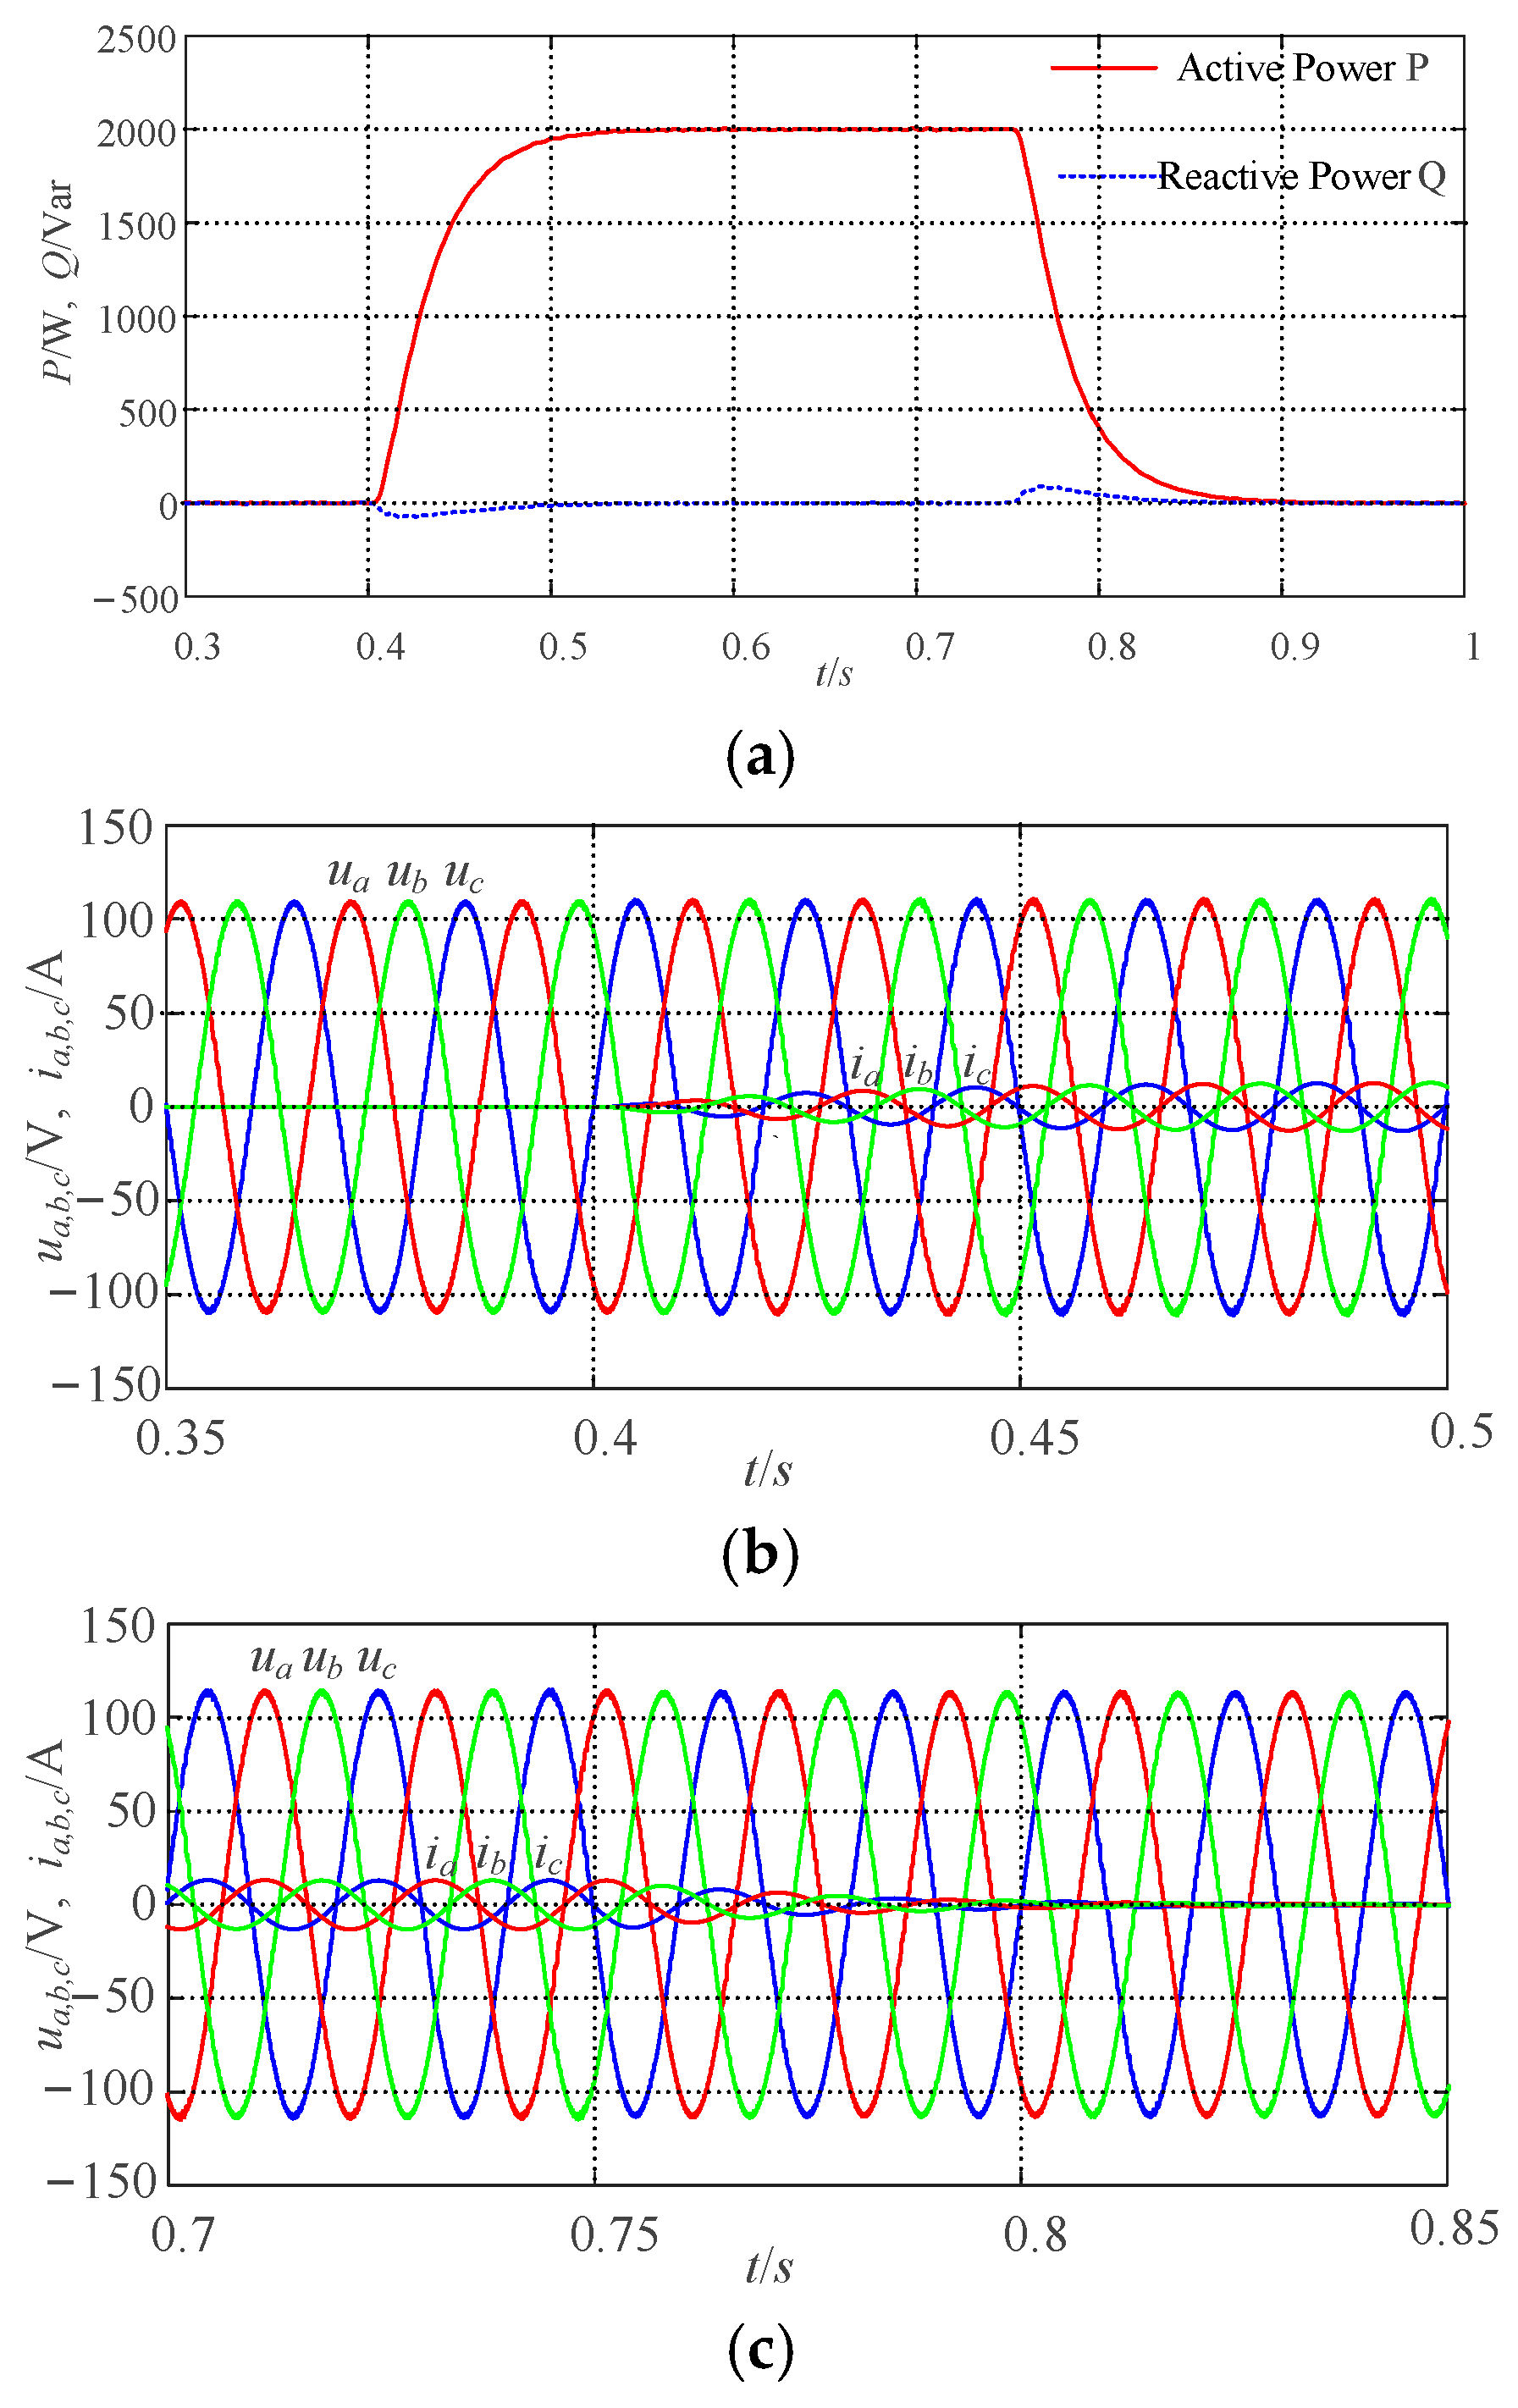
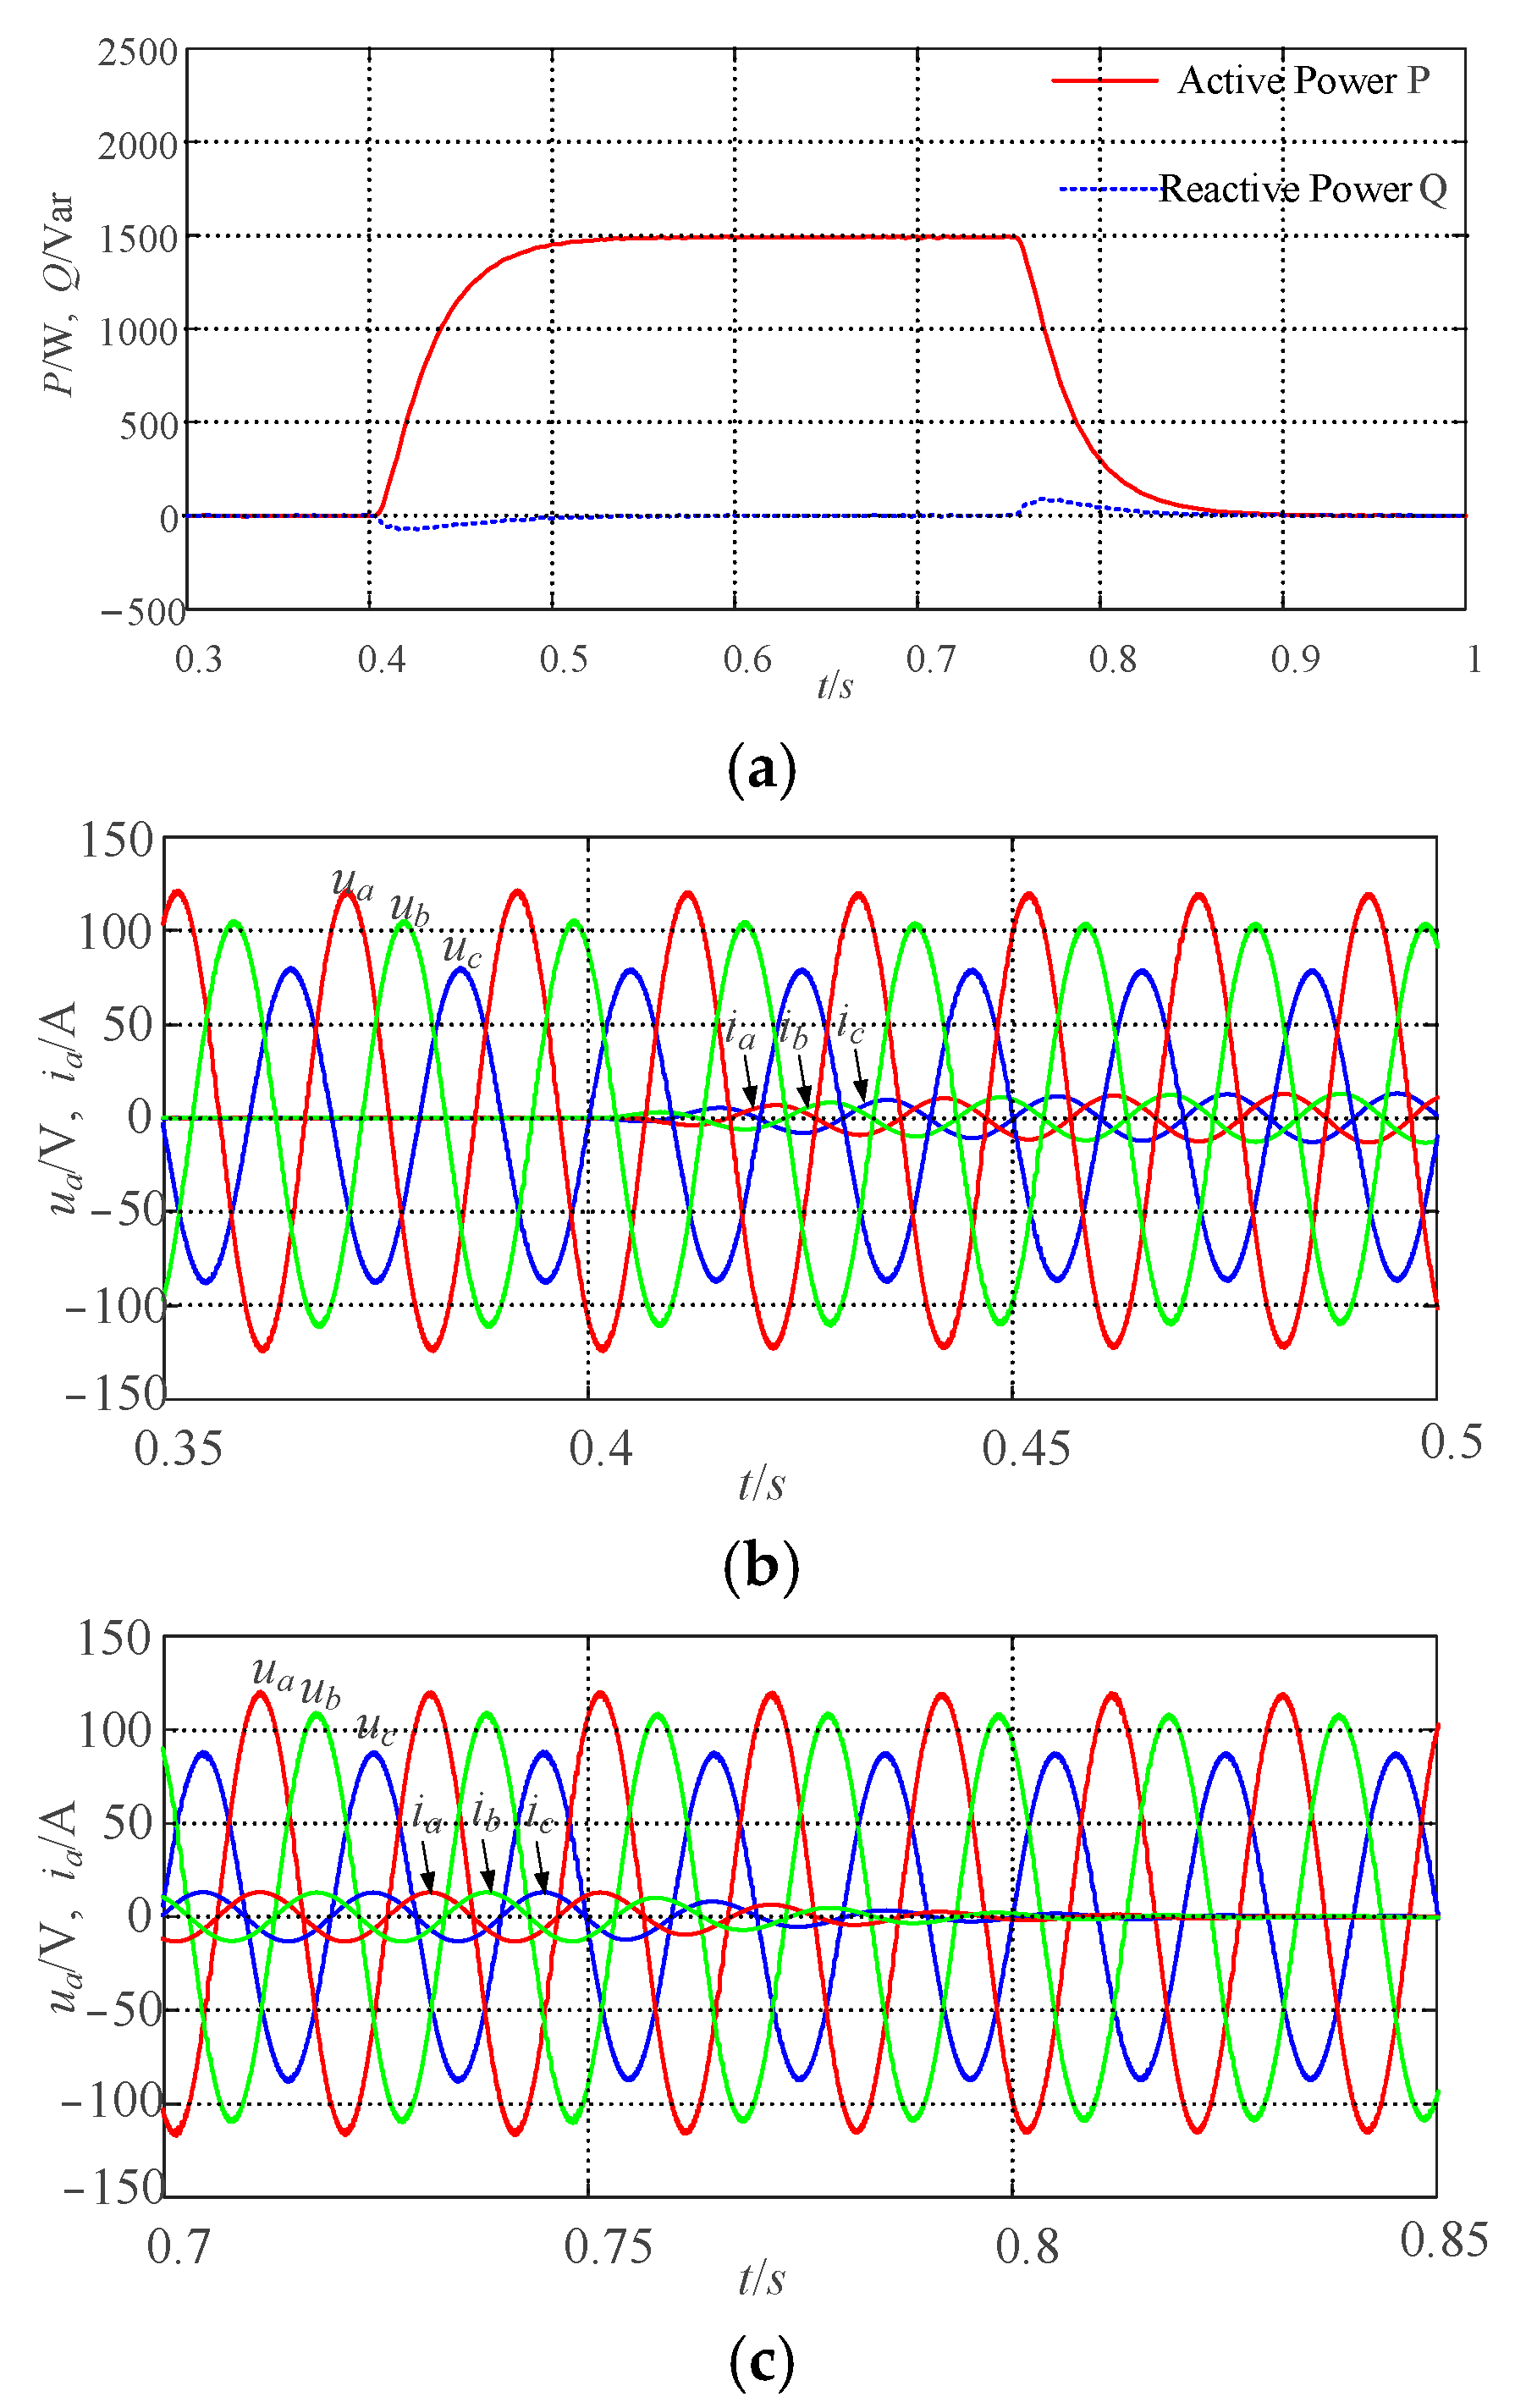
(1) Simulation of participation in the grid frequency modulation capability verification 1: At the initial moment of 0 s, the grid-connected system operates at rated conditions with Pref = 0 W and Qref = 0 Var. At 0.4 s, a sudden drop in the grid angular frequency of 0.2 π rad/s is introduced, and, at 0.75 s, the grid angular frequency is restored to its rated state. The output power, output voltage, and grid-side current of the grid-connected system are illustrated in Figure 5.
In Figure 5, at 0 s, the system operates at rated conditions, with the output P and Q tracking the given power values of Pref and Qref. Following a sudden drop in the grid angular frequency of 0.2 π rad/s at 0.4 s, the output P of the system increases to 2000 W, accompanied by changes in the grid-side current. At 0.75 s, when the grid angular frequency is restored to its rated state, the output P returns to the set value, and the grid-side current also reverts to its initial condition. During the fluctuations in grid frequency, the VSG can adjust its active output through primary frequency control, ensuring the stability of the system. The variations in output voltage and grid-side current are consistent with changes in the system’s active power, indicating that the VSG control strategy proposed in this paper is effective in participating in grid frequency regulation.
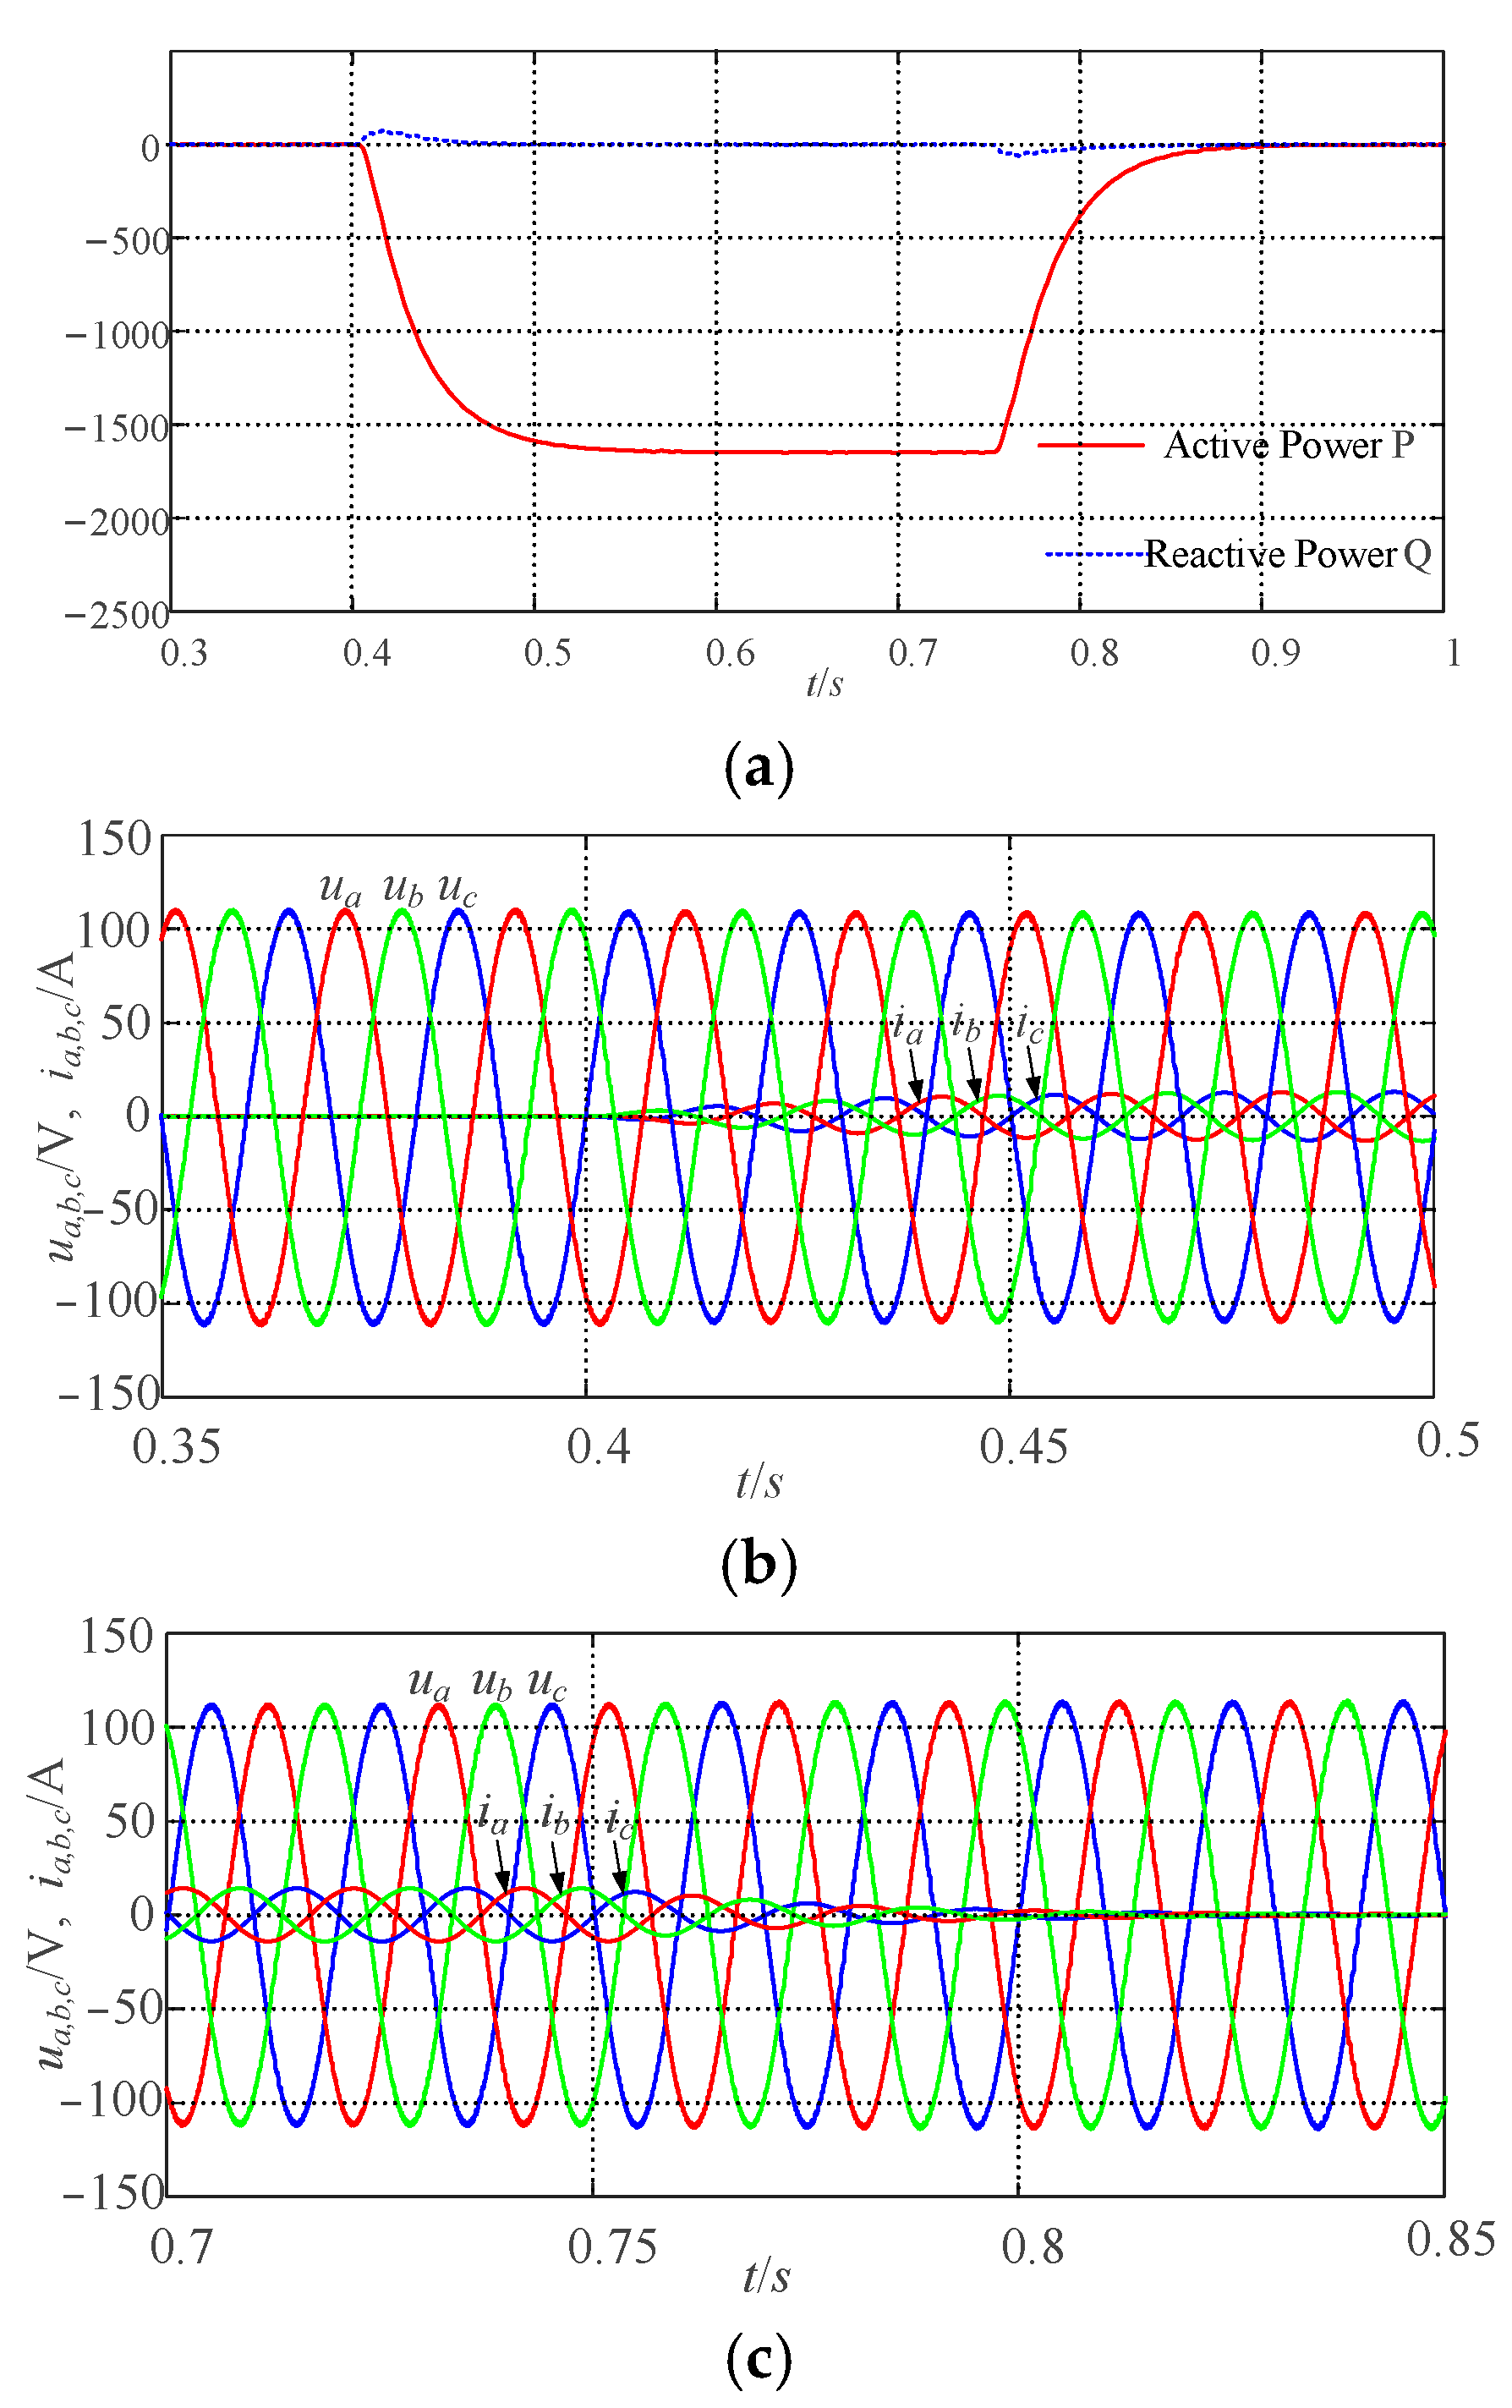
(2) Simulation of participation in the grid frequency modulation capability verification 2: At the initial moment of 0 s, the grid-connected system operates at rated conditions with Pref = 0 W and Qref = 0 Var. At 0.54 s, a sudden increase in the grid angular frequency of 0.2 π rad/s is introduced, and, at 0.75 s, the grid angular frequency is restored to its rated state. The output power, output voltage, and grid-side current of the grid-connected system are illustrated in Figure 6.
As shown in Figure 6, at 0 s, the grid-connected system operates at rated conditions, with the output P and Q tracking the specified power values of Pref and Qref. Following a sudden increase in the grid angular frequency of 0.2 π rad/s at 0.4 s, the output P of the grid-connected system decreases to −2000 W, accompanied by corresponding changes in the grid-side current. At 0.75 s, when the grid angular frequency is restored to its rated state, the output P returns to the set value, and the grid-side current also reverts to its initial condition. During fluctuations in grid frequency, the VSG can adjust its active output through primary frequency control, ensuring the stability of the system. The variations in output voltage and grid-side current are consistent with changes in the system’s active power, further demonstrating that the VSG control strategy proposed in this paper effectively participates in grid frequency regulation.
(3) Validation of the ability to participate in frequency regulation under unbalanced grid conditions: In Figure 7, in order to verify the system’s frequency support capability under an unbalanced power grid, at 0 s, the grid-connected system operates at rated conditions, with the output P and Q tracking the specified power values of Pref and Qref. Following a sudden increase in the grid angular frequency of 0.15 π rad/s at 0.4 s, the output P of the grid-connected system decreases to 15,000 W, accompanied by corresponding changes in the grid-side current. At 0.75 s, when the grid angular frequency is restored to its rated state, the output P returns to the set value, and the grid-side current also reverts to its initial condition. It can be seen that under the conditions of an unbalanced power grid, during fluctuations in grid frequency, the VSG can adjust its active output through primary frequency control, ensuring the stability of the system. The variations in output voltage and grid-side current are consistent with changes in the system’s active power, indicating that the VSG control strategy proposed in this paper can also effectively participate in grid frequency regulation under the conditions of a three-phase unbalance in the power grid.

5.1.2. Participate in the Grid Voltage Modulation Capability Verification

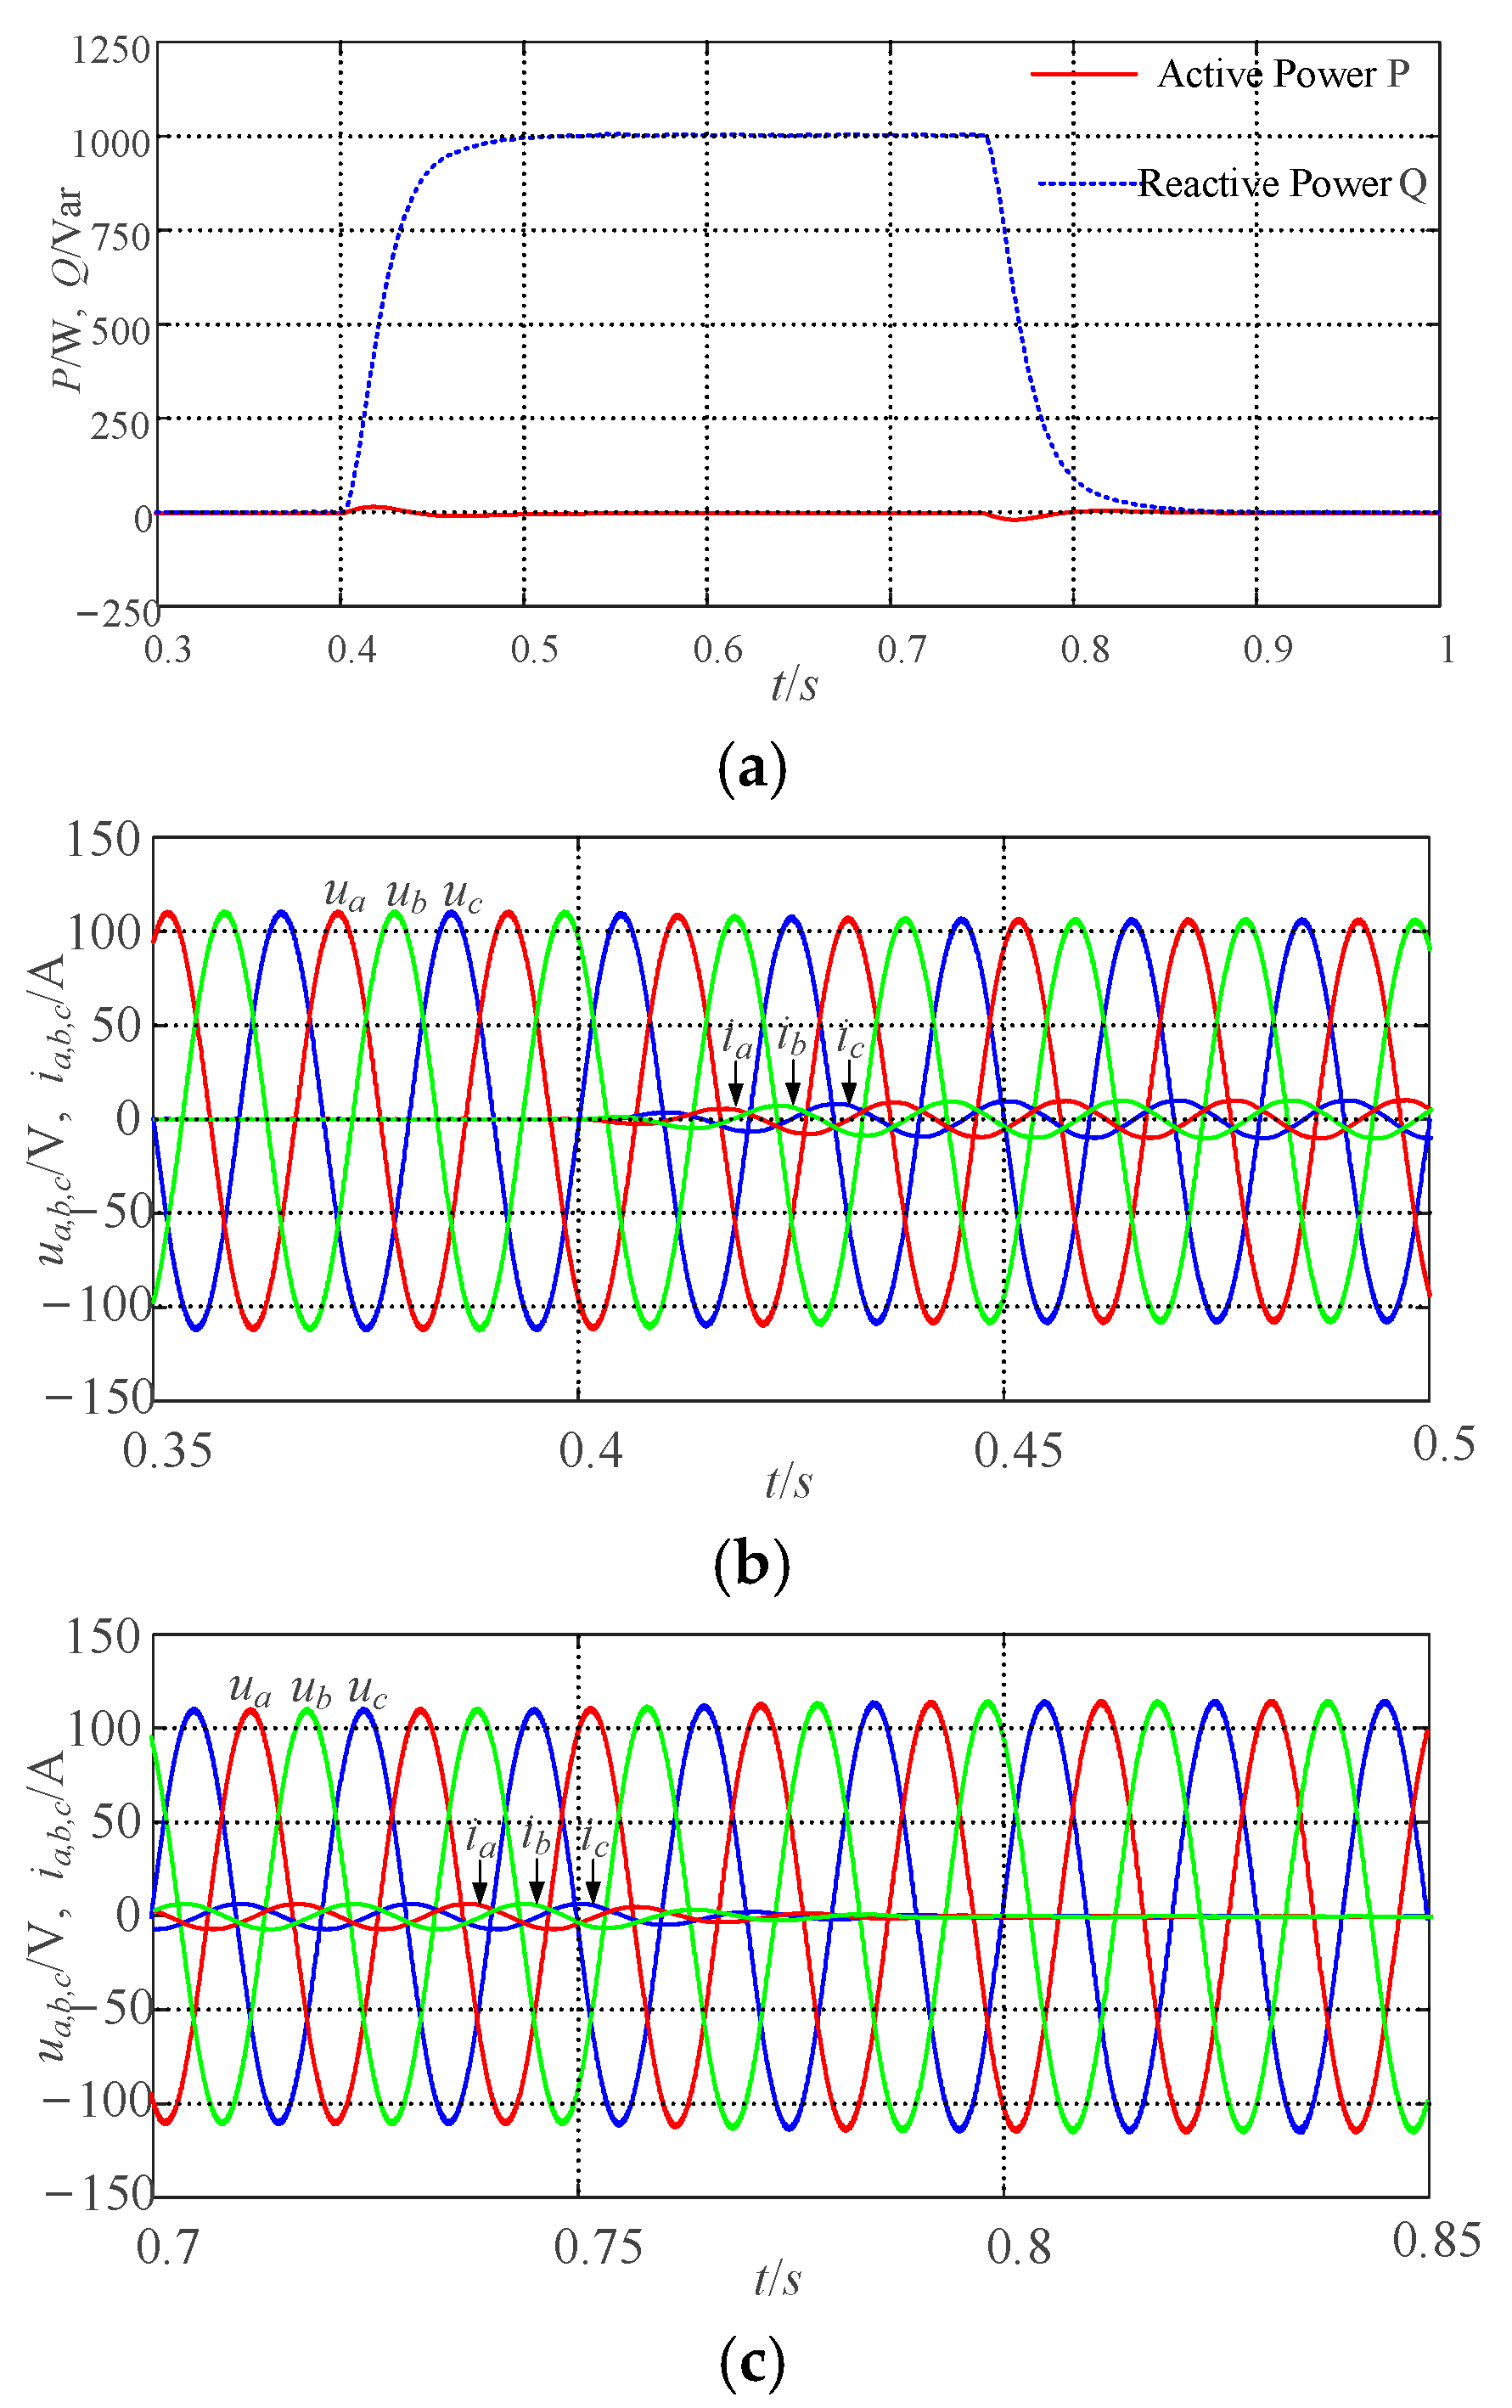
(1) Simulation of participation in the grid voltage modulation capability verification 1: At the initial moment of 0 s, the grid-connected system operates at rated conditions with Pref = 0 W and Qref = 0 Var. At 0.4 s, a sudden drop of 2.5% in the grid voltage amplitude is introduced, and, at 0.75 s, the grid voltage amplitude returns to the set value. The output power, output voltage, and grid-side current of the grid-connected system are illustrated in Figure 7 Simulation 1 of Participation in the Voltage Regulation of the Power Grid.
From Figure 7, at 0 s, the grid-connected system operates at rated conditions, with the output P and Q tracking the specified values of Pref and Qref. Following a sudden drop of 2.5% in the grid voltage amplitude at 0.4 s, the output Q of the system increases to 1000 Var, accompanied by corresponding changes in the grid-side current. At 0.75 s, when the grid voltage is restored to its rated state, the output Q returns to the set value, and the grid-side current also reverts to its initial condition. During fluctuations in grid voltage amplitude, the VSG can adjust its reactive output through voltage regulation to ensure the stability of the system. The variations in output voltage and grid-side current are consistent with changes in the system’s Q, indicating that the VSG control strategy proposed in this paper effectively participates in grid voltage regulation.
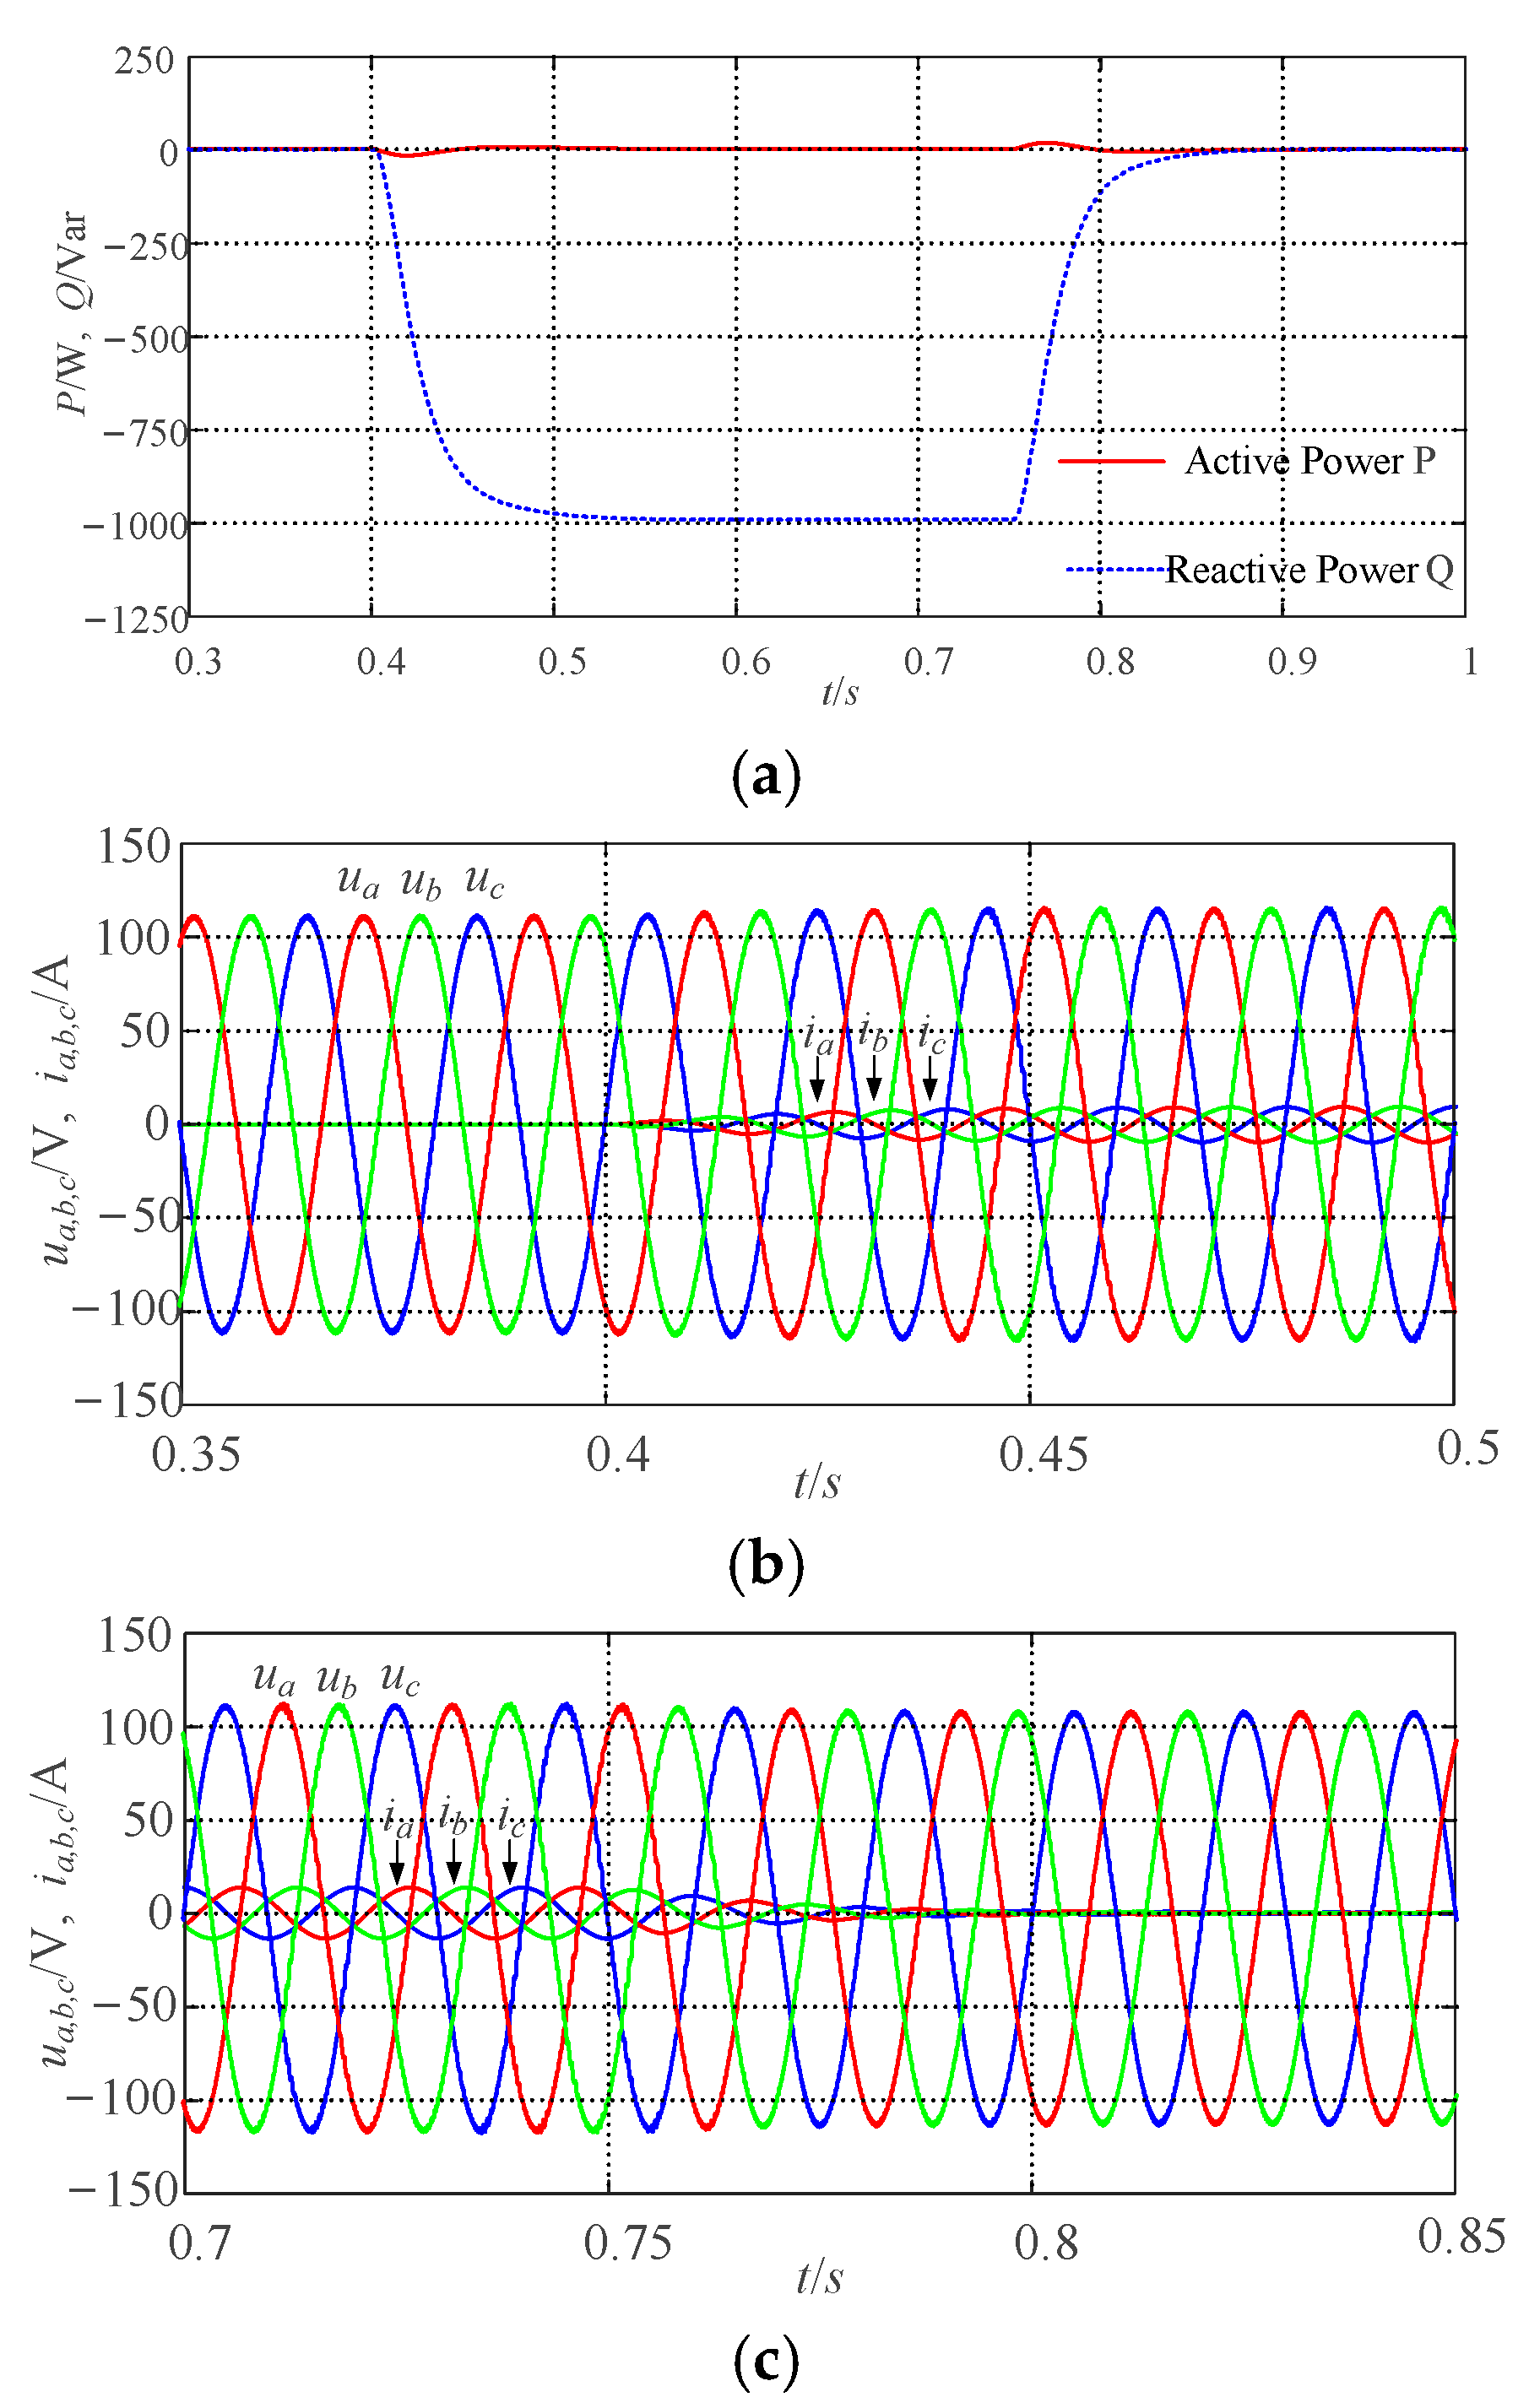
(2) Simulation of participation in the grid voltage modulation capability verification 2: At the initial moment of 0 s, the grid-connected system operates at rated conditions with Pref = 0 W and Qref = 0 Var. At 0.4 s, a sudden increase of 2.5% in the grid voltage amplitude is introduced, and, at 0.75 s, the grid voltage amplitude returns to the set value. The output power, output voltage, and grid-side current of the grid-connected system are illustrated in Figure 8 Simulation 2 of Participation in the Voltage Regulation of the Power Grid.
As shown in Figure 9, at 0 s, the grid-connected system operates at rated conditions, with the output P and Q tracking the specified values of Pref and Qref. Following a sudden increase of 2.5% in the grid voltage amplitude at 0.4 s, the output Q of the system decreases to −1000 Var, accompanied by corresponding changes in the grid-side current. At 0.75 s, when the grid voltage amplitude is restored to its rated state, the output Q returns to the set value, and the grid-side current also reverts to its initial condition. During fluctuations in grid voltage amplitude, the VSG can adjust its reactive output through voltage control to ensure the stability of the system. The variations in output voltage and grid-side current are consistent with changes in the system’s Q, further demonstrating that the VSG control strategy proposed in this paper effectively participates in grid voltage regulation.
(3) Validation of participation in voltage regulation capability under unbalanced grid conditions: In Figure 10, to verify the system’s voltage support capability under unbalanced grid conditions, at 0 s, the grid-connected system operates at rated conditions, with the output P and Q tracking the specified values of Pref and Qref. Following a sudden drop of 1.875% in the grid voltage amplitude at 0.4 s, the output Q of the system increases to 750 Var, accompanied by corresponding changes in the grid-side current. At 0.75 s, when the grid voltage is restored to its rated state, the output Q returns to the set value, and the grid-side current also reverts to its initial condition. It can be seen that under the conditions of an unbalanced grid, during fluctuations in grid voltage amplitude, the VSG can adjust its reactive output through voltage regulation to ensure the stability of the system. The variations in output voltage and grid-side current are consistent with changes in the system’s Q, indicating that the VSG control strategy proposed in this paper can effectively participate in grid voltage regulation under conditions of three-phase unbalance in the grid.
From the above analysis, it can be seen that adopting the VSG control strategy can enable the system to have good frequency and voltage active support capabilities in the elastic region. In the case of a weak grid, the system will have good elastic support capabilities.

5.2. Verification of Steady-State Performance of the VSG

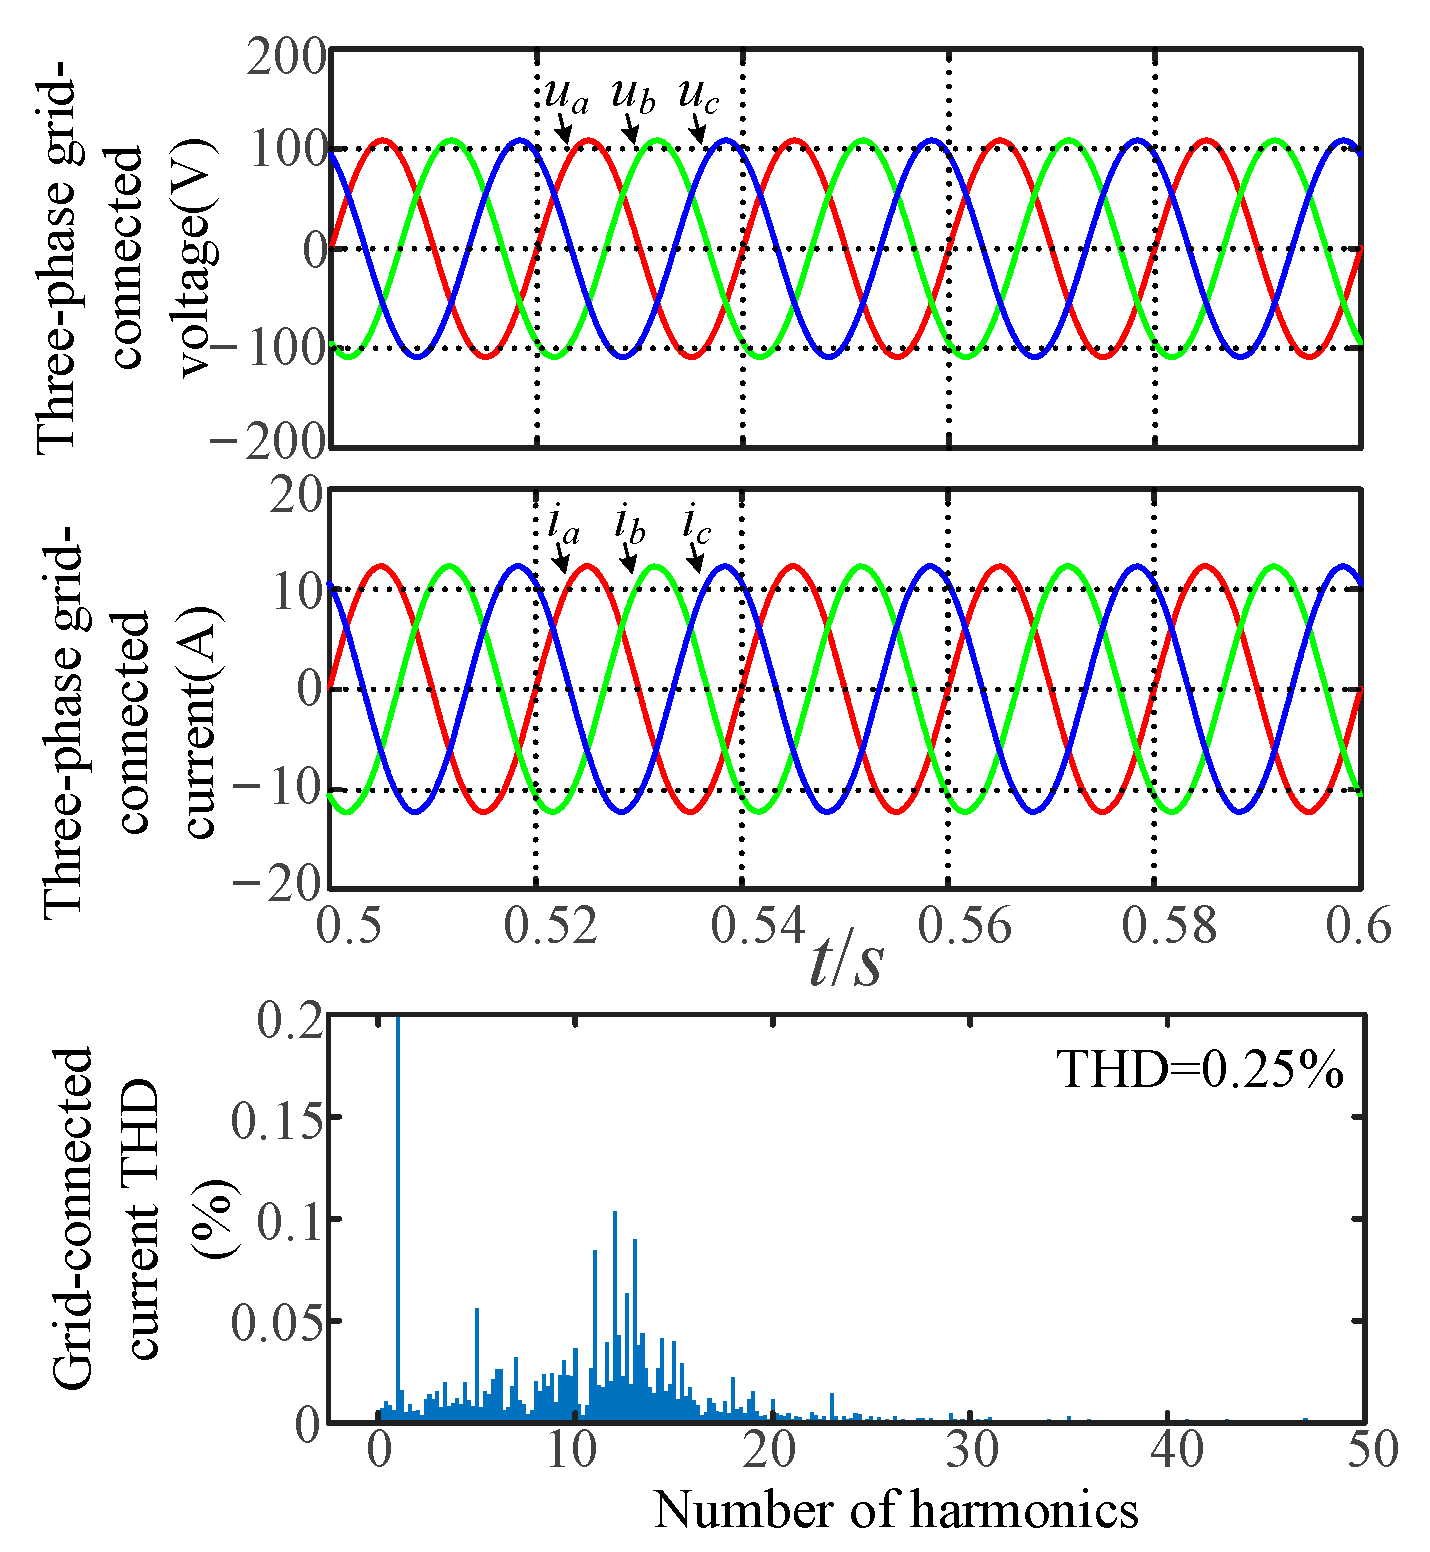
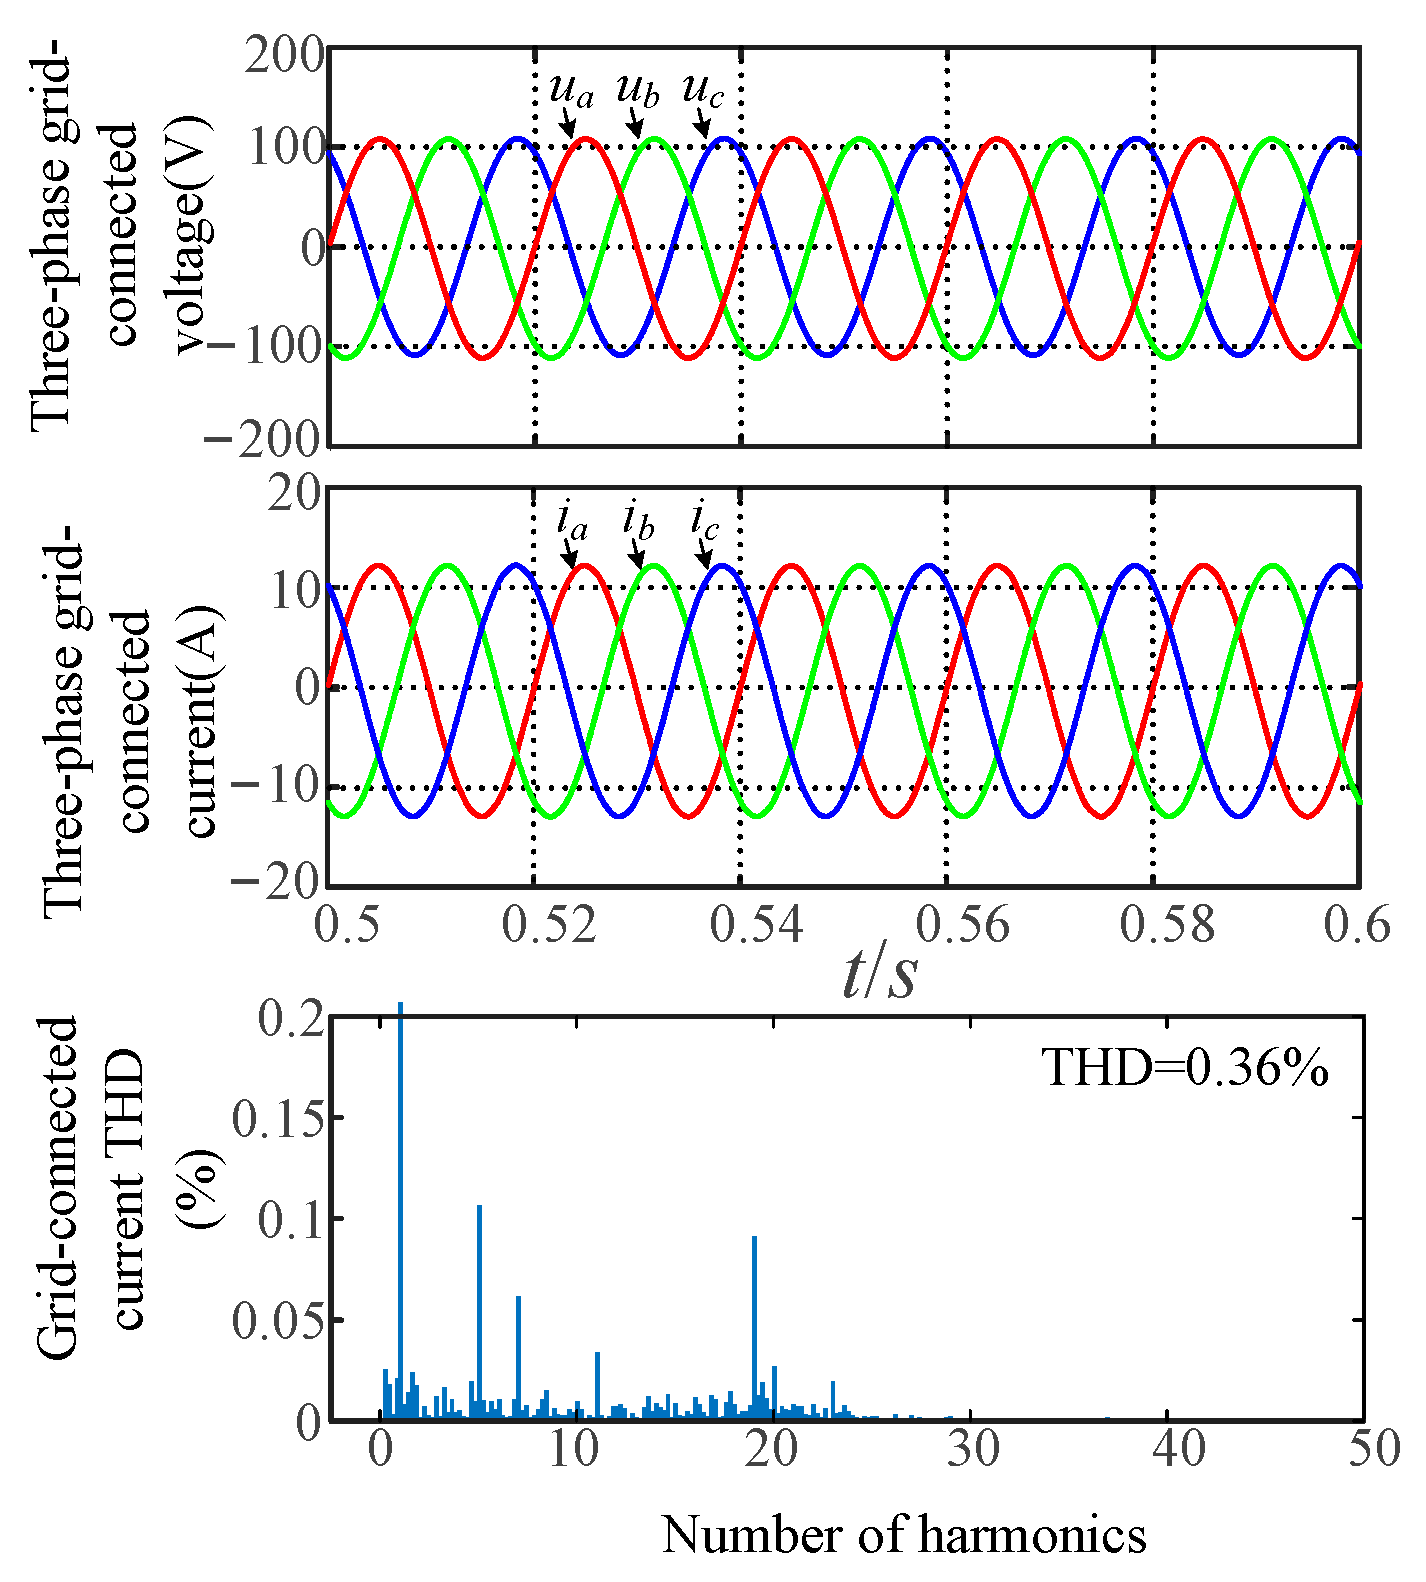
Figure 11, Figure 12 and Figure 13 present the simulation waveforms of the grid-forming inverter equipped with an additional active damping control strategy when the grid-connected system operates at rated conditions, with Pref = 2000 W and Qref = 0 Var. The simulations consider grid line impedances of 0 mH, 1.5 MH, and 3 mH, respectively. Here, ui (i = a, b, c) are the three-phase grid voltage waveforms, while in(n = a, b, c) denotes the three-phase grid current waveforms.
From Figure 11, Figure 12 and Figure 13 and Table 3, the grid-forming inverter with VSG control operates stably under all three grid conditions. The three-phase grid currents are sine-balanced and exhibit relatively low Total Harmonic Distortion (THD). Specifically, when Lg = 0 mH, the THD is 0.25%; when Lg = 1.5 mH, the THD is 0.36%; and when Lg = 3 mH, the THD is 0.37%. These values meet the grid connection requirements.

5.3. IEEE Equivalent Power System Model Validation

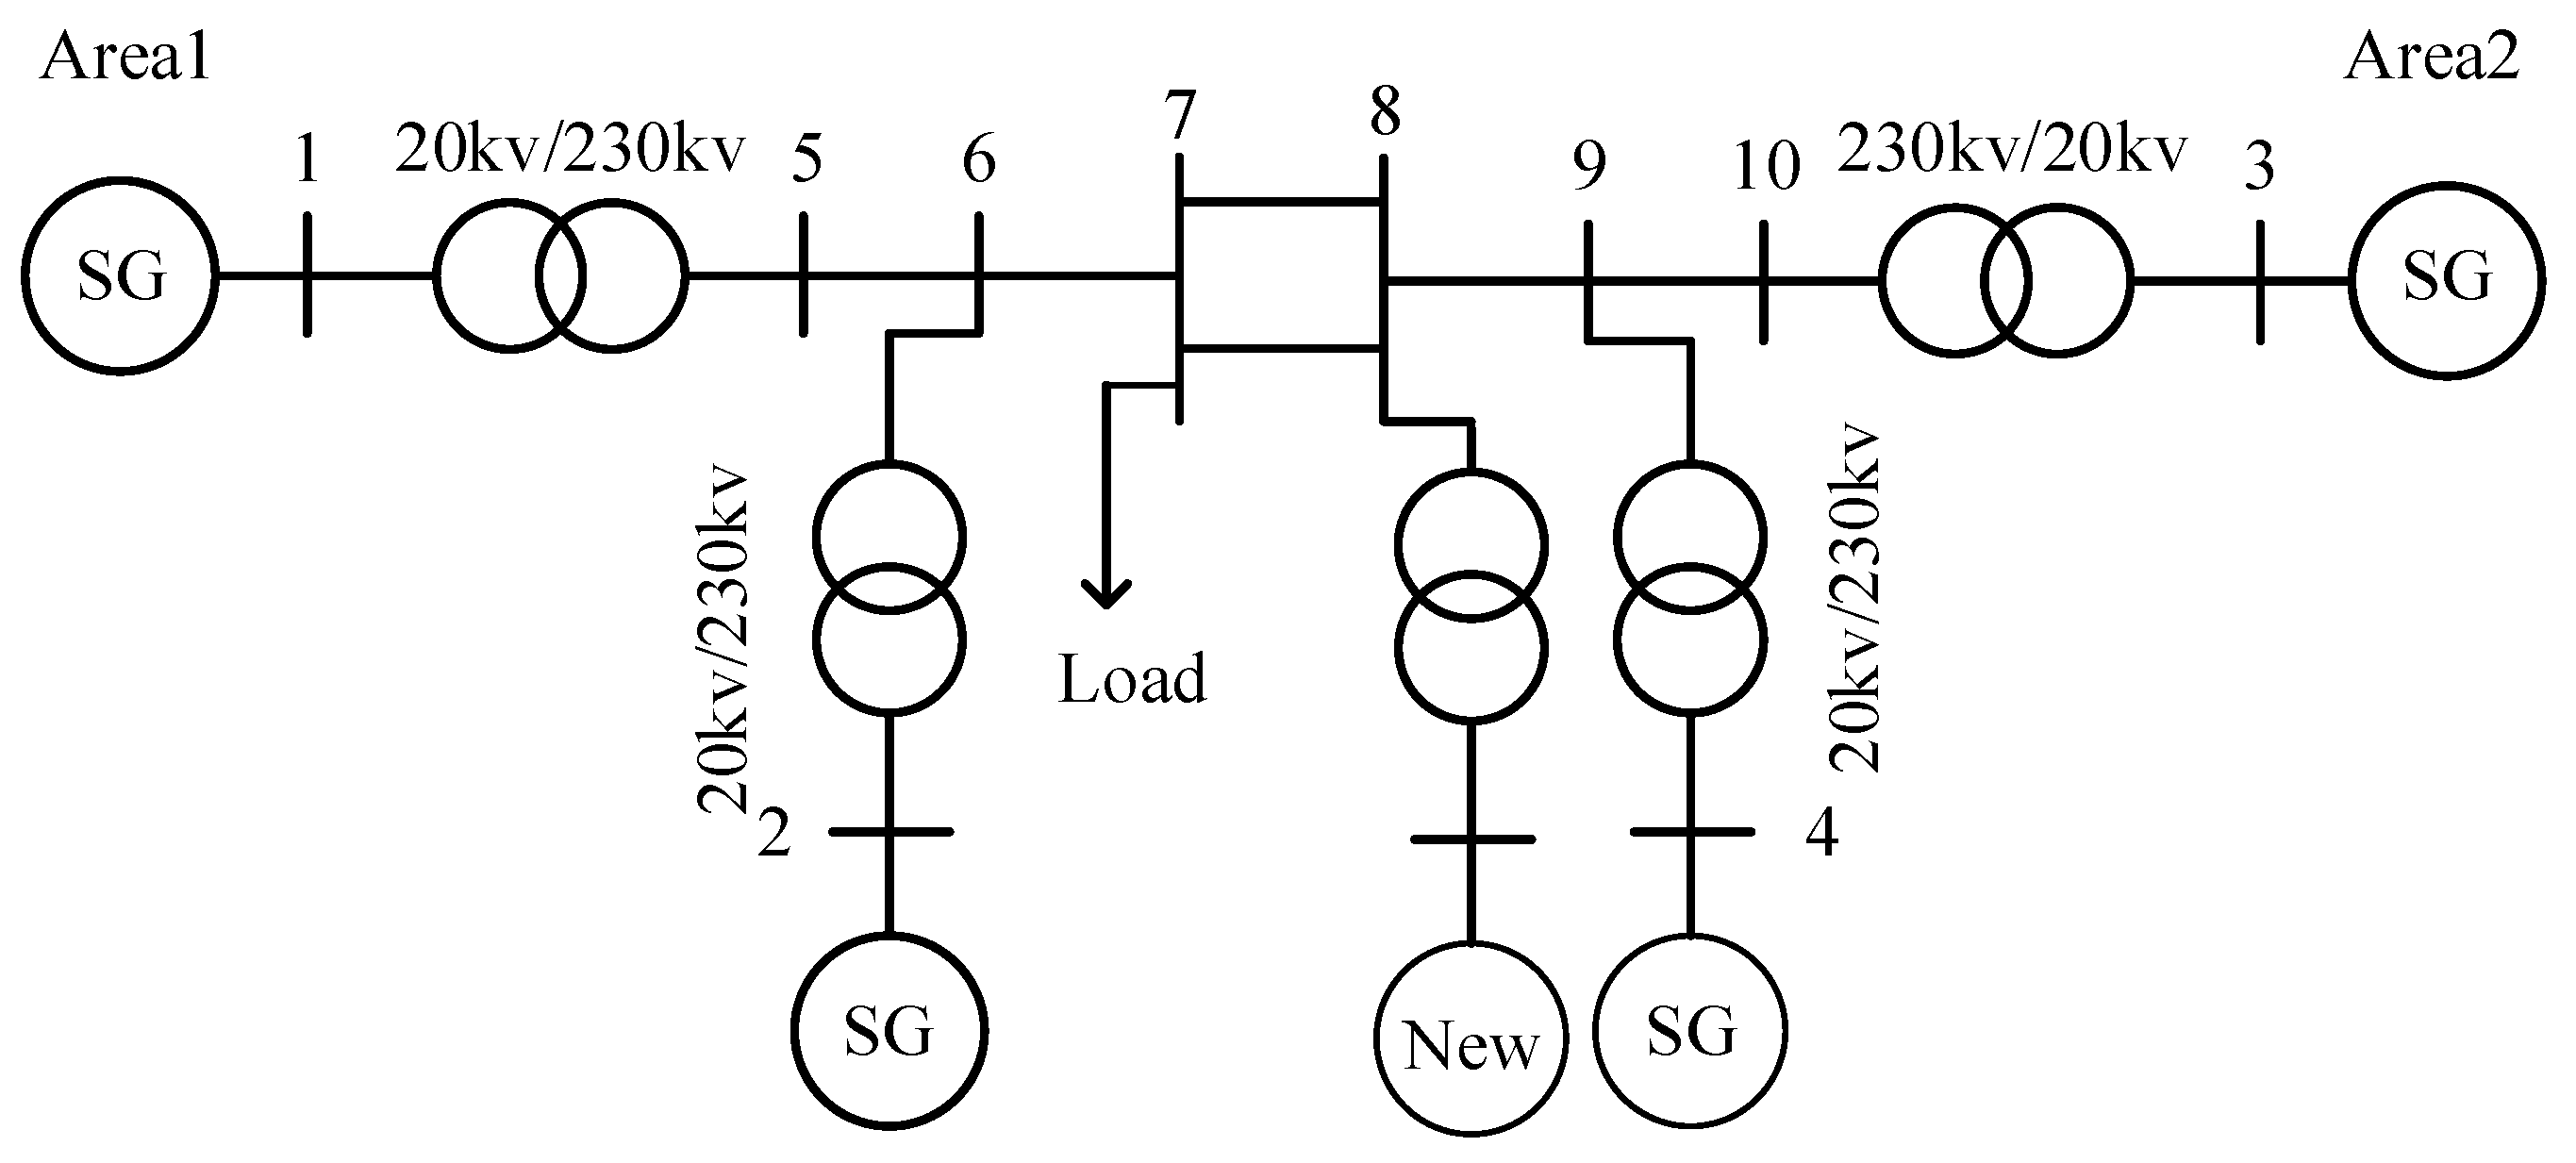
In order to verify the effectiveness and reliability of the designed system and method operating in a large power grid, this section establishes an IEEE power system equivalent model of the inverter based on the scheme designed in this paper. The specific topology diagram is shown in Figure 14, and the specific parameters are shown in Table 4.

5.3.1. Verification of System Frequency Regulation Capability

When the system reaches a steady state, at t = 5 s, there is a sudden increase in active load in the power grid, and the corresponding frequency fluctuation curve and inverter output active power change are shown in Figure 15. After the sudden change occurs, the inverter starts to increase power to suppress the frequency drop. Finally, at t = 12 s, the inverter increases active power by 10 MW, and the frequency stabilizes at 49.925 Hz, achieving active support for the power grid frequency.

5.3.2. Verification of System Voltage Regulation Capability

When the system reaches a steady state, at t = 5 s, there is a sudden increase in reactive load in the power grid, and the corresponding voltage fluctuation curve and inverter output reactive power change are shown in Figure 16. After the sudden change occurs, the inverter starts to increase reactive power to suppress the voltage drop. Finally, at t = 18 s, the inverter increases reactive power by 25 MVar, and the voltage stabilizes at 0.97 p.u, achieving reactive support for the power grid voltage.
In summary, after equating the system proposed in this article to the IEEE power system equivalent model, in the large-scale power grid system, when facing active and reactive load disturbances, the system will actively adjust the output of active and reactive power according to the sudden changes in power grid load to cope with changes in system frequency and voltage, thereby achieving active support for regional elastic power grids.

5.4. Experimental Validation

In order to ensure the effectiveness and correctness of the simulation, an experimental prototype of an NPC three-level LCL grid-forming inverter is built, and the corresponding experimental parameters are consistent with those of the simulation in the experimental platform.
Figure 17 shows the comparative experimental waveforms of the grid-connected system when the grid impedances are Lg = 0 mH, 1.5 mH, and 3 mH with and without the active damping loop. From Figure 17a,c,e, it can be observed that when the system does not include the active damping loop, the THD of the grid current changes little with increasing grid impedance and does not meet the grid connection requirements, exhibiting significant resonance phenomena. In contrast, Figure 17b,d,f show that after incorporating the active damping loop, the resonance phenomena of the grid-connected inverter are effectively suppressed compared to the case without it. At this point, for the three different grid impedance scenarios, the THD of the grid current is 1.518%, 1.7664%, and 1.790%, respectively, which shows significant improvement compared to the THD values under the same conditions without the active damping loop. All these values meet the grid connection requirements, indicating that the system has good current quality.
According to the comprehensive analysis, the resonance phenomenon of the grid-forming inverter is effectively suppressed under weak grid conditions by adopting the VSG control with the active damping loop proposed in this paper, and the system remains stable, has good current quality, and meets the grid-connected standard.

6. Conclusions

This paper examines the grid-side components of power systems that incorporate new energy generation sources and considers the frequency and voltage support capabilities required by elastic regional power grids. A control system based on Virtual Synchronous Generator (VSG) technology is designed. A small-signal sequential impedance model of the VSG system in the αβ coordinate frame is established using harmonic linearization methods. The stability of the system is analyzed from an impedance perspective, leading to the following conclusions, which were verified by comparative experiments.
(1) The control system based on VSG technology effectively implements grid-side management for power systems utilizing wind and photovoltaic energy. It provides essential elastic support for voltage and frequency stabilization, effectively suppresses resonance, and avoids causing oscillation, thereby enhancing power quality.
(2) The grid-connected system employing VSG technology demonstrated stable operation under varying grid impedance conditions, indicating its robustness and adaptability across different operational environments, thereby providing a resilient area for the stable operation of the power grid.

Author Contributions

Conceptualization, Z.L. (Zhipeng Lv) and H.L.; methodology, B.J.; software, H.L.; validation, Z.S., H.L. and S.Z.; formal analysis, Z.L. (Zhipeng Lv); data curation, Z.S.; writing—original draft preparation, Z.S.; writing—review and editing, Z.L. (Zhizhou Li); visualization, Z.L. (Zhizhou Li); supervision, S.Z.; project administration, Z.L. (Zhizhou Li); All authors have read and agreed to the published version of the manuscript.

Funding

This research received no external funding.

Data Availability Statement

The original contributions presented in the study are included in the article, further inquiries can be directed to the corresponding author.

Conflicts of Interest

Author Zhipeng Lv, Zhenhao Song, Hao Li, Shan Zhou and Zhizhou Li was employed by the company State Grid Shanghai Energy Interconnection Research Institute Co., Ltd. Author Bingjian Jia was employed by the company Xinjiang Information Industry Co., Ltd. Authors declare that the research was conducted in the absence of any commercial or financial relationships that could be construed as a potential conflict of interest.

References

  1. Yang, X.; Song, Y.; Wang, G.; Wang, W. A Comprehensive Review on the Development of Sustainable Energy Strategy and Implementation in China. IEEE Trans. Sustain. Energy 2010, 1, 57–65. [Google Scholar] [CrossRef]
  2. Blaabjerg, F.; Teodorescu, R.; Liserre, M.; Timbus, A.V. Overview of Control and Grid Synchronization for Distributed Power Generation Systems. IEEE Trans. Ind. Electron. 2006, 53, 1398–1409. [Google Scholar] [CrossRef]
  3. Lasseter, R.H.; Chen, Z.; Pattabiraman, D. Grid-Forming Inverters: A Critical Asset for the Power Grid. IEEE J. Emerg. Sel. Top. Power Electron. 2020, 8, 925–935. [Google Scholar] [CrossRef]
  4. Elmelegi, A.; Mohamed, E.A.; Aly, M.; Ahmed, E.M.; Al-Attar, M.; Elbaksawi, O. Optimized Tilt Fractional Order Cooperative Controllers for Preserving Frequency Stability in Renewable Energy-Based Power Systems. IEEE Access 2020, 9, 8261–8277. [Google Scholar] [CrossRef]
  5. Wang, J.; Ma, K. Inertia and Grid Impedance Emulation of Power Grid for Stability Test of Grid-Forming Converter. IEEE Trans. Power Electron. 2023, 38, 2469–2480. [Google Scholar] [CrossRef]
  6. Du, W.; Chen, Z.; Kevin, P.; Schneider, K.; Lasseter, R.H.; Nandanoori, S.P.; Tuffner, F.K.; Kundu, S. A Comparative Study of Two Widely Used Grid-Forming Droop Controls on Microgrid Small-Signal Stability. IEEE J. Emerg. Sel. Top. Power Electron. 2022, 8, 963–975. [Google Scholar] [CrossRef]
  7. Rathnayake, D.B.; Akrami, M.; Phurailatpam, C.; Me, S.P.; Hadavi, S.; Jayasinghe, G.; Zabihi, S.; Bahrani, B. Grid Forming Inverter Modeling, Control, and Applications. IEEE Access 2021, 9, 114781–114807. [Google Scholar] [CrossRef]
  8. Liu, T.; Liu, J.; Liu, Z.; Liu, Z. A Study of Virtual Resistor-Based Active Damping Alternatives for LCL Resonance in Grid-Connected Voltage Source Inverters. IEEE Trans. Power Electron. 2020, 35, 247–262. [Google Scholar] [CrossRef]
  9. Zhao, H.; Wu, W.; Orabi, M.; Koutroulis, E.; Chung, H.S.-H.; Blaabjerg, F. A Passive Damping Design Method of Three-phase Asymmetric-LCL Power filter for Grid-Tied Voltage Source Inverter. In Proceedings of the 2023 IEEE Energy Conversion Congress and Exposition (ECCE), Nashville, TN, USA, 29 October–2 November 2023; pp. 94–98. [Google Scholar]
  10. Sharma, H.R.; Suryawanshi, H.M.; Chaturvedi, P.; Govind, D. Implementation of Passive Damping Technique in LCL Filter for Three-Phase Grid Connected Inverter. In Proceedings of the 2022 IEEE 2nd International Conference on Sustainable Energy and Future Electric Transportation (SeFeT), Hyderabad, India, 4–6 August 2022; pp. 1–6. [Google Scholar]
  11. Fonsêca, T.Q.; Ribeiro, R.L.A.; Rocha, T.d.O.A.; Costa, F.B.; Guerrero, J.M. Voltage Grid Supporting by Using Variable Structure Adaptive Virtual Impedance for LCL-Voltage Source Converter DG Converters. IEEE Trans. Ind. Electron. 2020, 67, 9326–9336. [Google Scholar] [CrossRef]
  12. Beres, R.N.; Wang, X.; Liserre, M.; Blaabjerg, F.; Bak, C.L. A Review of Passive Power Filters for Three-Phase Grid-Connected Voltage-Source Converters. IEEE J. Emerg. Sel. Top. Power Electron. 2016, 4, 54–69. [Google Scholar] [CrossRef]
  13. Yao, W.; Yang, Y.; Zhang, X.; Blaabjerg, F.; Loh, P.C. Design and analysis of robust active damping for LCL filters using digital notch filters. IEEE Trans. Power Electron. 2016, 32, 2360–2375. [Google Scholar] [CrossRef]
  14. Peña-Alzola, R.; Liserre, M.; Blaabjerg, F.; Ordonez, M.; Kerekes, T. A Self-commissioning notch filter for active damping in three phase LCL-filter based grid-tied converter. IEEE Trans. Power Electron. 2014, 29, 6754–6761. [Google Scholar] [CrossRef]
  15. Han, Y.; Li, Z.; Yang, P.; Wang, C.; Xu, L.; Guerrero, J.M. Analysis and Design of Improved Weighted Average Current Control Strategy for LCL-Type Grid-Connected Inverters. IEEE Trans. Energy Convers. 2017, 32, 941–952. [Google Scholar] [CrossRef]
  16. Wang, X.; Wang, Y.; Yang, H.; Dai, H. Grid-Connected Current Double Loop Feedback Suppression Strategy of Parallel Inverter in the Weak Grid. In Proceedings of the 2023 IEEE 2nd International Power Electronics and Application Symposium (PEAS), Xi’an, China, 10–13 November 2023; pp. 2023–2028. [Google Scholar]
  17. Xu, J.; Xie, S.; Tang, T. Active Damping-Based Control for Grid-Connected LCL-Filtered Inverter with Injected Grid Current Feedback Only. IEEE Trans. Ind. Electron. 2014, 61, 4746–4758. [Google Scholar] [CrossRef]
  18. Wu, W.; Chen, Y.; Zhou, L.; Luo, A.; Zhou, X.; He, Z.; Yang, L.; Xie, Z.; Liu, J.; Zhang, M. Sequence Impedance Modeling and Stability Comparative Analysis of Voltage-Controlled VSGs and Current-Controlled VSGs. IEEE Trans. Ind. Electron. 2018, 66, 6460–6472. [Google Scholar] [CrossRef]
  19. Wei, Y.; Zhang, H.; Song, Q.; Sun, K. Control strategy for parallel-operated virtual synchronous generators. In Proceedings of the 2016 IEEE 8th International Power Electronics and Motion Control Conference (IPEMC 2016–ECCE Asia), Hefei, China, 22–26 May 2016. [Google Scholar]
  20. Liu, J.; Miura, Y.; Bevran, H.; Ise, T. Enhanced virtual synchronous generator control for parallel inverters in microgrids. IEEE Trans. Smart Grid 2017, 8, 2268–2277. [Google Scholar] [CrossRef]
  21. Wang, Q.; Zhou, D.; Yin, S.; Lei, Y.; He, T. Improved Adaptive Inertia and Damping Coefficient Control Strategy of VSG Based on Optimal Damping Ratio. In Proceedings of the 2022 International Power Electronics Conference (IPEC-Himeji 2022- ECCE Asia), Himeji, Japan, 15–19 May 2022; pp. 102–107. [Google Scholar]
  22. Ibrahim, N.F.; Mahmoud, K.; Lehtonen, M.; Darwish, M.M.F. Comparative Analysis of Three-Phase PV Grid Connected Inverter Current Control Schemes in Unbalanced Grid Conditions. IEEE Access 2023, 11, 42204–42221. [Google Scholar] [CrossRef]
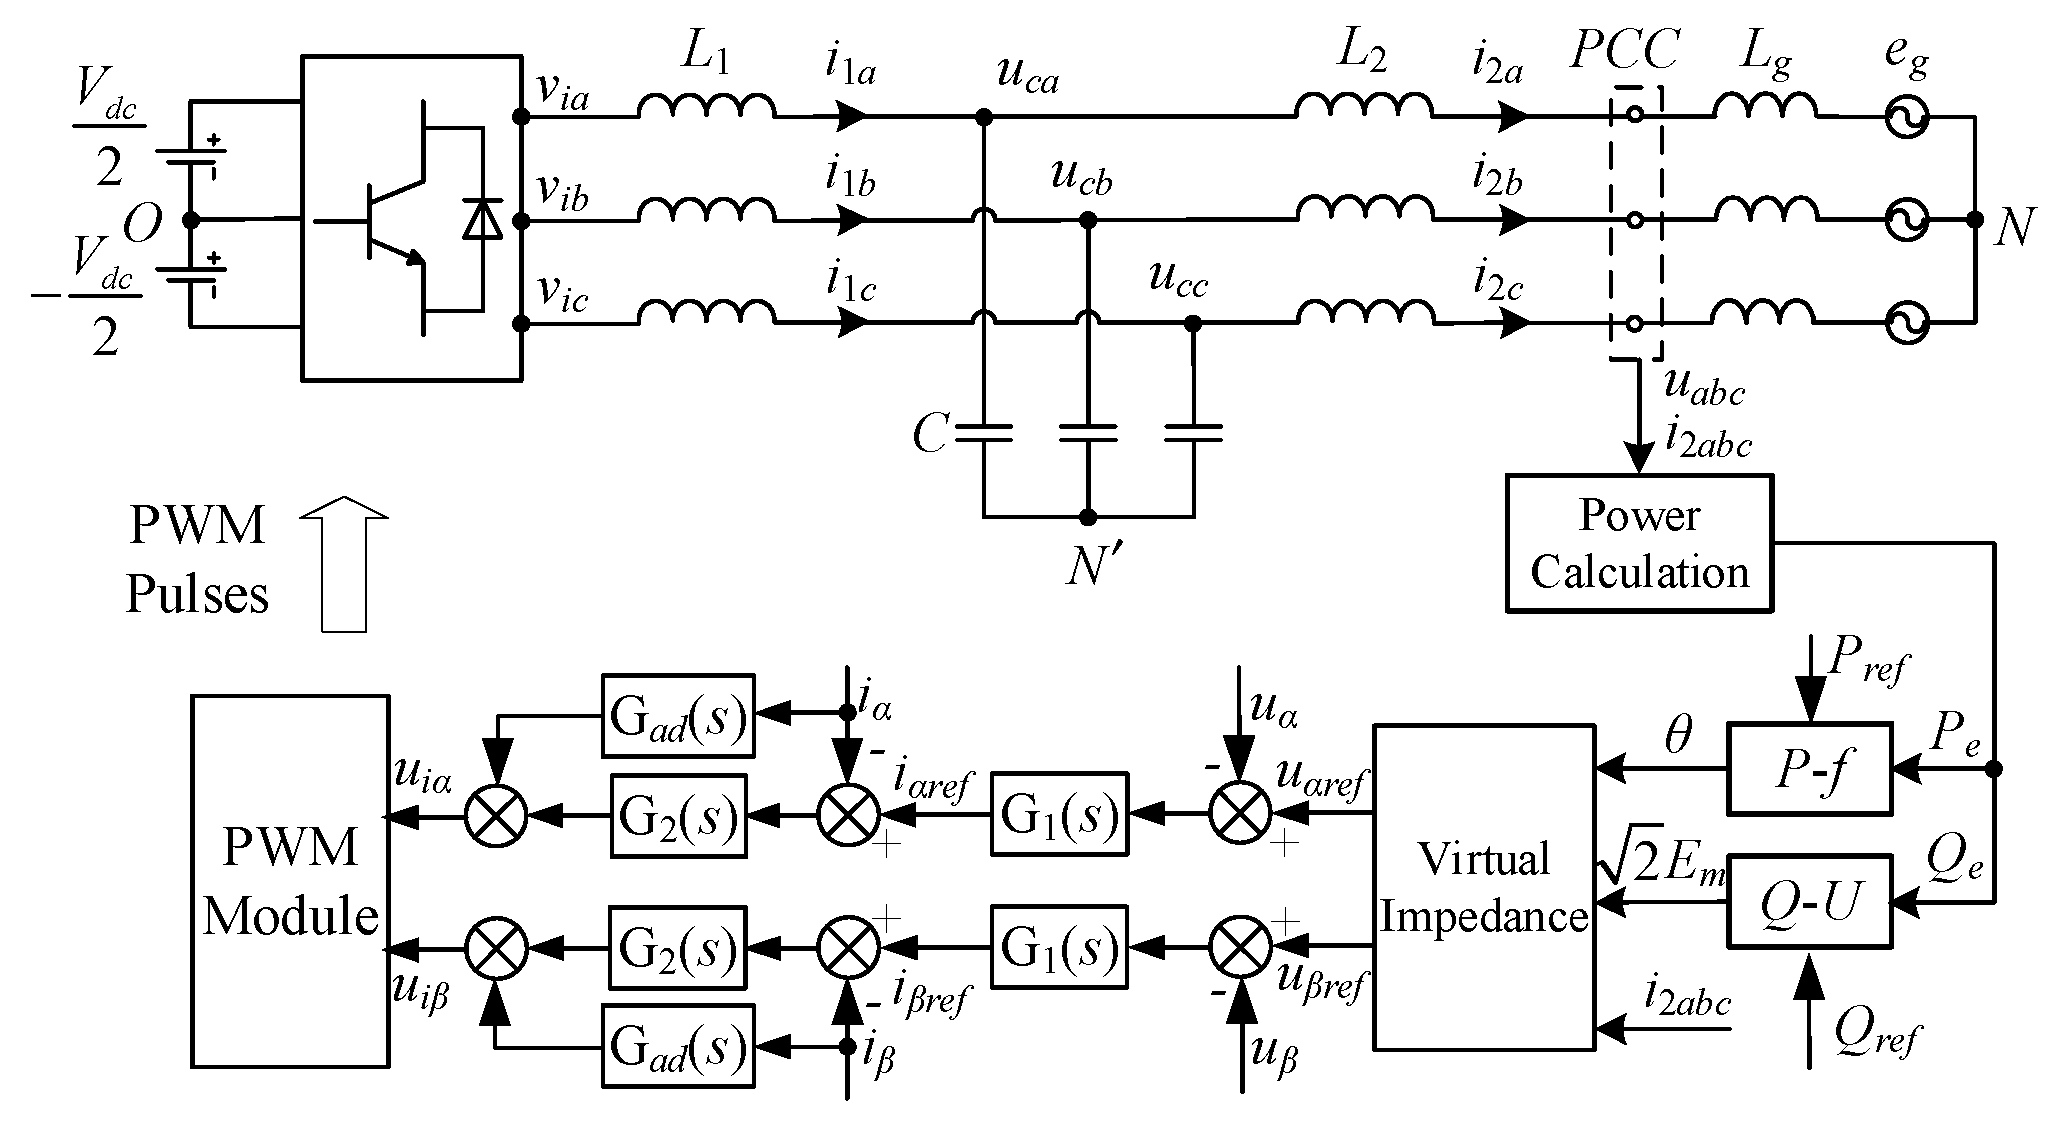
Figure 1. Overall control block diagram of the grid-connected system based on VSG.
Symmetry 17 00263 g001
Figure 2. Small signal flowchart of the VSG system.
Symmetry 17 00263 g002
Figure 3. Equivalent model of harmonic small signal in phase A main circuit.
Symmetry 17 00263 g003
Figure 4. Nyquist plots of Hvp(s) and Hvn(s) under different weak grid conditions.
Symmetry 17 00263 g004aSymmetry 17 00263 g004b
Figure 5. Simulation 1 of participation in the frequency regulation of the power grid. (a) Waveform graph of P and Q of the system during variations in grid frequency. (b) Waveform graph of output voltage and current of the system during sudden drops in grid frequency. (c) Waveform graph of output voltage and current of the system during recovery of grid frequency.
Symmetry 17 00263 g005
Figure 6. Simulation 2 of participation in the frequency regulation of the power grid. (a) Waveform graph of P and Q of the system during variations in grid frequency. (b) Waveform graph of output voltage and current of the system during sudden drops in grid frequency. (c) Waveform graph of output voltage and current of the system during recovery of grid frequency.
Symmetry 17 00263 g006
Figure 7. Validation of the ability to participate in frequency regulation under unbalanced grid conditions. (a) Waveform graph of P and Q of the system during variations in grid frequency. (b) Waveform graph of output voltage and current of the system during sudden drops in grid frequency. (c) Waveform graph of output voltage and current of the system during recovery of grid frequency.
Symmetry 17 00263 g007
Figure 8. Simulation 1 of participation in the voltage regulation of the power grid. (a) Waveform graph of P and Q of the system during variations in grid voltage. (b) Waveform graph of output voltage and current of the system during sudden drops in grid voltage. (c) Waveform graph of output voltage and current of the system during recovery of grid voltage.
Symmetry 17 00263 g008
Figure 9. Simulation 2 of participation in the voltage regulation of the power grid. (a) Waveform graph of P and Q of the system during variations in grid voltage. (b) Waveform graph of output voltage and current of the system during sudden increases in grid voltage. (c) Waveform graph of output voltage and current of the system during recovery of grid voltage.
Symmetry 17 00263 g009
Figure 10. Validation of participation in voltage regulation capability under unbalanced grid conditions. (a) Waveform graph of P and Q of the system during variations in grid voltage. (b) Waveform graph of output voltage and current of the system during sudden increases in grid voltage. (c) Waveform graph of output voltage and current of the system during recovery of grid voltage.
Symmetry 17 00263 g010
Figure 11. Simulation waveform when Lg = 0 mH.
Symmetry 17 00263 g011
Figure 12. Simulation waveform when Lg = 1.5 mH.
Symmetry 17 00263 g012
Figure 13. Simulation waveform when Lg = 3 mH.
Symmetry 17 00263 g013
Figure 14. The topology of IEEE power system model with grid-connected inverters.
Symmetry 17 00263 g014
Figure 15. Waveform diagram of grid frequency and active power during load burst.
Symmetry 17 00263 g015
Figure 16. Waveform diagram of grid voltage and reactive power during load burst.
Symmetry 17 00263 g016
Figure 17. Experimental waveforms of the grid-connected system under different impedance conditions.
Symmetry 17 00263 g017
Table 1. Analysis of the Nyqist diagram in Figure 4.
Lg/mHN + (Hvp(s))N − (Hvn(s))2[(N+) − (N−)]Stability
0.5112stable
1.5112stable
3112stable
Table 2. Simulation model parameters for the system.
ParameterValueParameterValue
L12 mHL21 mH
C50 μFLg0~3 mH
Vdc300 VUg76.7 V
Pref2000 WQref0 Var
J0.5Dp5
Kq5.8Dq368
Rv0.1ΩLv3 mH
Kp10.01Kr12.1
Kp20.06Kad6*10−9
fs10 kHzfsw10 kHz
Table 3. Analysis of steady-state performance simulation results of VSG.
Lg/mHTHD
00.25%
1.50.36%
30.37%
Table 4. Simulation parameter settings.
ParametersNumeric Value
Zone 1 generator capacity (MW)198
Zone 2 generator capacity (MW)198
Rated power output of the PV array (KW)500
The number of photovoltaic power station units150
Voltage side capacitor DC voltage (V)1500
Disclaimer/Publisher’s Note: The statements, opinions and data contained in all publications are solely those of the individual author(s) and contributor(s) and not of MDPI and/or the editor(s). MDPI and/or the editor(s) disclaim responsibility for any injury to people or property resulting from any ideas, methods, instructions or products referred to in the content.