Article

Using Voronoi Tessellation Diagrams to Visualize the Mechanical Response of Interacting Axisymmetric Simultaneous Propagating Waves

by
Zherui Martinez-Guo
School of Aeronautics & Astronautics, Purdue University, West Lafayette, IN 47907, USA
Symmetry 2025, 17(4), 555; https://doi.org/10.3390/sym17040555
Submission received: 23 November 2024 / Revised: 2 April 2025 / Accepted: 3 April 2025 / Published: 5 April 2025
(This article belongs to the Section Mathematics)

Abstract

:
When two axisymmetric stress waves of the same strength propagate radially at the same velocity, the stress wave wavefronts collide and interact along a specific locus, which is the perpendicular bisector between the two sources. The maximum principal stress occurs along this perpendicular bisector, and the tensile stresses result in crack bridging between the two source points. This symmetric wave propagation behavior allows us to use the Voronoi tessellation diagram and its symmetric dual graph, the Delaunay triangulation, to gain first-order insight into complex wave propagation phenomena for an arbitrary distribution of wave propagation sources. The inherent symmetry of these simultaneous wave propagation mechanics allows us to rapidly visualize and predict the stress wave propagation and interactions, and the resultant crack bridging patterns that arise from random blast sources. The current work is focused on rock blast fracture mechanics, but the visualization scheme can be implemented for any application where waves propagate axisymmetrically and interact.

1. Introduction

When two source-wise axisymmetric blast waves (i.e., axisymmetric with respect to their source) initiate at the same time and their stress wave fronts propagate radially at the same velocity, their wavefronts will interact along the perpendicular bisector of the line connecting the two sources [1,2,3,4,5]. For some homogeneous, isotropic medium, the peak principal stresses occur along the axis of this perpendicular bisector. If we generalize this behavior for waves propagating radially from multiple point sources, their wavefronts similarly interact along the perpendicular bisector between two adjacent sources. The resultant loci of all the axes of wavefront interactions give rise to the Voronoi tessellation diagram, with each point source as the seed. This concept of visualizing the interacting loci of multiple point sources is not particularly new—Chew and Drysdale [6] briefly discussed a similar “expanding waves” idea. However, their work focused on using this wave propagation concept to demonstrate how different Voronoi diagrams can be generated using different metrics.
For brittle materials, the peak principal stresses resulting from transient stress wave interaction can result in fracture and cracks bridging along the connecting line between two adjacent sources. With this stress wave propagation and interaction in mind, we use this behavior to our advantage and present a method of predicting the fracture patterns within brittle materials subjected to an internal transient axisymmetric stress boundary condition. We expand upon the point-source wave propagation concept to visualize the critical stress field parameters that cause brittle fracture to occur within an arbitrary system of axisymmetric point sources. The combination of the Voronoi diagram and its dual graph, the Delaunay triangulation, can be used to rapidly predict the mechanical response of complex interacting stress fields. The proposed visualization model is applicable to any scenario where multiple point sources of axisymmetric radially propagating waves are likely to occur, but in this work, we focus on the simultaneous multi-point blast initiation of a rock substrate for the first few sections. We then briefly discuss similar visualization results for the multi-point ballistic impact perforation of a ceramic armor plate.

Transient Stress Fields in Rock Blasting Applications

Rock blasting is a process whereby brittle rock substrates are fragmented for shaping of the terrain or removal of raw rock material for subsequent processing into other products [7]. Rock blasting is typically achieved by detonating an explosive charge within a cylindrical borehole to initiate a cylindrically propagating shockwave within the surrounding rock substrate. To achieve a certain blasting result, the explosive charges are typically arranged in a pre-planned array. In these arrays, the ‘spacing’ direction refers to the line between two blast wave initiation sources, and the direction perpendicular to the spacing direction is called the ‘burden’ direction. For simultaneously initiated rock blasts, the stress wave interaction response and cracking behavior is relatively straightforward: the waves will first meet at the midpoint along the spacing direction, and peak tensile forces within the generated stress fields occur such that the cracks will begin to form along the spacing direction and bridge two adjacent blast holes.
The key to determining the crack bridging patterns therefore lies in representing the principal tensile stress directions during the transient wave interaction process. Prior studies used computational simulations to determine the most probable lines along which the generated cracks will bridge two initiating blast holes [3,4,5,8,9,10,11]. Computational simulations can predict the stress fields generated by each individual blast source and their subsequent interactions, but for relatively simple gridded arrays of blast holes, they can be computationally expensive for minimal results. There is a general qualitative sense that brittle fracture and crack bridging will occur along certain spacing lines for a pre-determined blast hole array, but there are no simple methods to quantitatively determine this phenomenon. Additional complexity arises when the pressure wave source locations become arbitrary, and there are currently no simple methods to determine, mathematically, which cracks are more likely to appear first within a generalized system of point sources. The complexity is further compounded when the number of point sources becomes large. Recent studies [4,5,12] have looked further into the delayed initiation of blasts to achieve optimal results; however, we focus on the simpler case of simultaneous blast initiation and wave propagation to show the feasibility of the methods presented herein.

2. Solution of Axisymmetric Stress Wave Propagation from Single Source

The detonation of an explosive charge in rock results in dynamic loading of the walls of the borehole and generation of a pressure wave that originates from the borehole wall [3,7,13,14]. For a blast hole with radius a propagating within an isotropic, homogeneous medium, we assume an axisymmetric plane strain wave propagation problem, and the corresponding differential equations for this problem is given in cylindrical coordinates as [15,16].
2 Φ r , t r 2 + 1 r Φ r , t r = 1 c p 2 2 Φ r , t t 2
where Φ r , t is the displacement potential function, r is the radial coordinate, and t is time. The radial, hoop, and axial stresses ( σ r r , σ θ θ , and σ z z respectively) are related to the displacement potential function via the set of equations.
σ r r r , t = λ 2 Φ + 2 μ 2 Φ r 2
σ θ θ r , t = λ 2 Φ + 2 μ r Φ r
σ z z r , t = ν σ r r + σ θ θ
where λ and μ are the Lamé parameters of the rock medium given by
λ = E 1 + ν 1 2 ν
μ = 1 2 1 + ν
and E and ν are the material’s Young’s modulus and Poisson’s ratio, respectively. In Equation (1), c p is the P-wave (or dilatational wave) velocity in the material. After the initiation of the blast, this P-wave is the fastest traveling wave that transmits energy through the surrounding medium. For some arbitrary blast pressure wave profile, the P-wave and S-wave wavefronts propagate through the solid medium with velocity c p and c s , given, respectively, as
c p = λ + 2 μ ρ
c s = μ ρ
While other types of mechanical waves such as Rayleigh waves will also propagate during blast initiation, we focus on P-wave propagation in this current work as it is the fastest propagating wave, and the simplicity of the analytical solutions provided easily exemplifies the method presented. However, the same visualization schemes presented in this work will apply for any type of axisymmetric wave propagation, as we show in a later section. For some blast pressure profile P ( t ) , the axisymmetric plane strain problem is subject to the following initial and boundary conditions:
Φ r , 0 = Φ ˙ r , 0 = 0 for   r a
lim r Φ r , t = 0
σ r r a , t = P ( t )
Equation (1) cannot be solved directly and requires a numerical solution. For this problem, we use a = 10 mm, ν = 0.23 , E = 50 GPa, and ρ = 2700 kg/m3. A typical blasthole pressure profile after initiation of the explosive charge can be modeled based on an equation by Blair [17]:
P ( t ) = P V N e γ t / n n e γ t ,
where P V N is the von Neumann pressure at the borehole cavity wall, γ is a pressure decay parameter with a value of 0.7, and n is an integer to be fitted to prior experimental data. In Blair’s work, the value of n = 3 was obtained by fitting to experimental work by Grady et al. [18] and Larson [19], with P V N = 14.2 GPa (Figure 1). Further note that t in Equation (12) is given in units of μs.
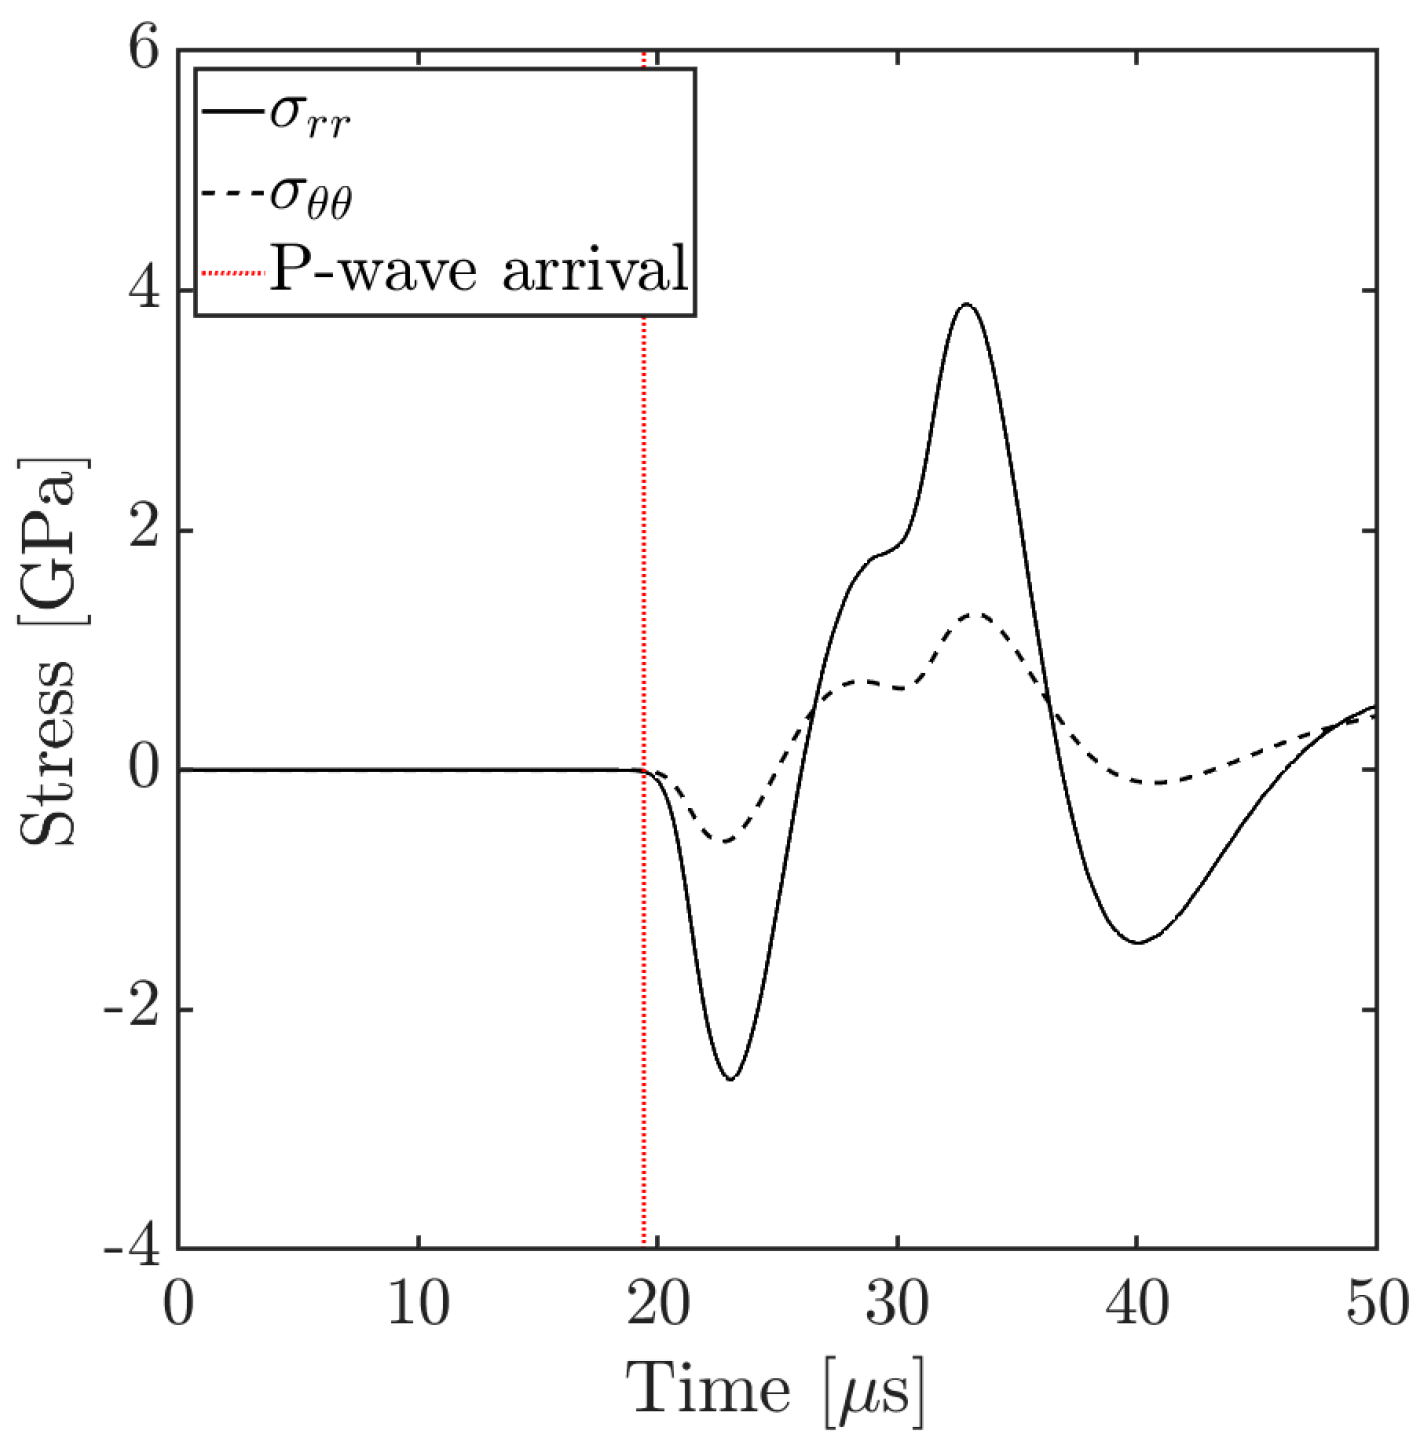
The set of differential equations was solved in Julia [20] using the finite difference discretization scheme MethodOfLines [21] and an adaptive Adams-Bashforth method VCAB5 for a time duration of 50 µs. Figure 2 shows an example stress profile against time for a radial location of r / a = 10 away from the blast wave source, with compressive stresses being negative and tensile stresses being positive. From mass and momentum conservation principles, the axisymmetric stress wave attenuates through the medium as it propagates radially, but the wavefront propagates at the same velocity c p . Upon arrival of the P-wave wavefront, both radial stress σ r r and hoop stress σ θ θ are initially in compression (negative) before becoming tensile (positive). According to the Griffith theory of fracture, brittle cracks evolve and propagate in a direction perpendicular to the direction of maximum tensile principal stress. As such, when the magnitude of the tensile strain is sufficiently large, tensile cracks begin to initiate within the tensile region and propagate radially from the blast source (Figure 3) [22,23].

3. Stress Wave Propagation and Interaction Between Multiple Regularly Spaced Blast Sources

When two dynamic pressure waves propagate radially from their respective point sources, the axisymmetric stresses act in the σ r r radial and σ θ θ hoop directions. However, to determine the effects of axisymmetric wave interaction, we require a coordinate transformation of the stresses from a cylindrical coordinate system around each blast hole to a Cartesian spacing–burden coordinate system (ss-bb) between two adjacent blast holes is required. Such a transformation is given by
σ s s = σ r r , 1 cos 2 ϕ + σ θ θ , 1 sin 2 ϕ + σ r r , 2 cos 2 ϕ + σ θ θ , 2 sin 2 ϕ
σ b b = σ r r , 1 sin 2 ϕ + σ θ θ , 1 cos 2 ϕ + σ r r , 2 sin 2 ϕ + σ θ θ , 2 cos 2 ϕ
with subscripts 1 and 2 being the stress contribution from each adjacent blast wave source.
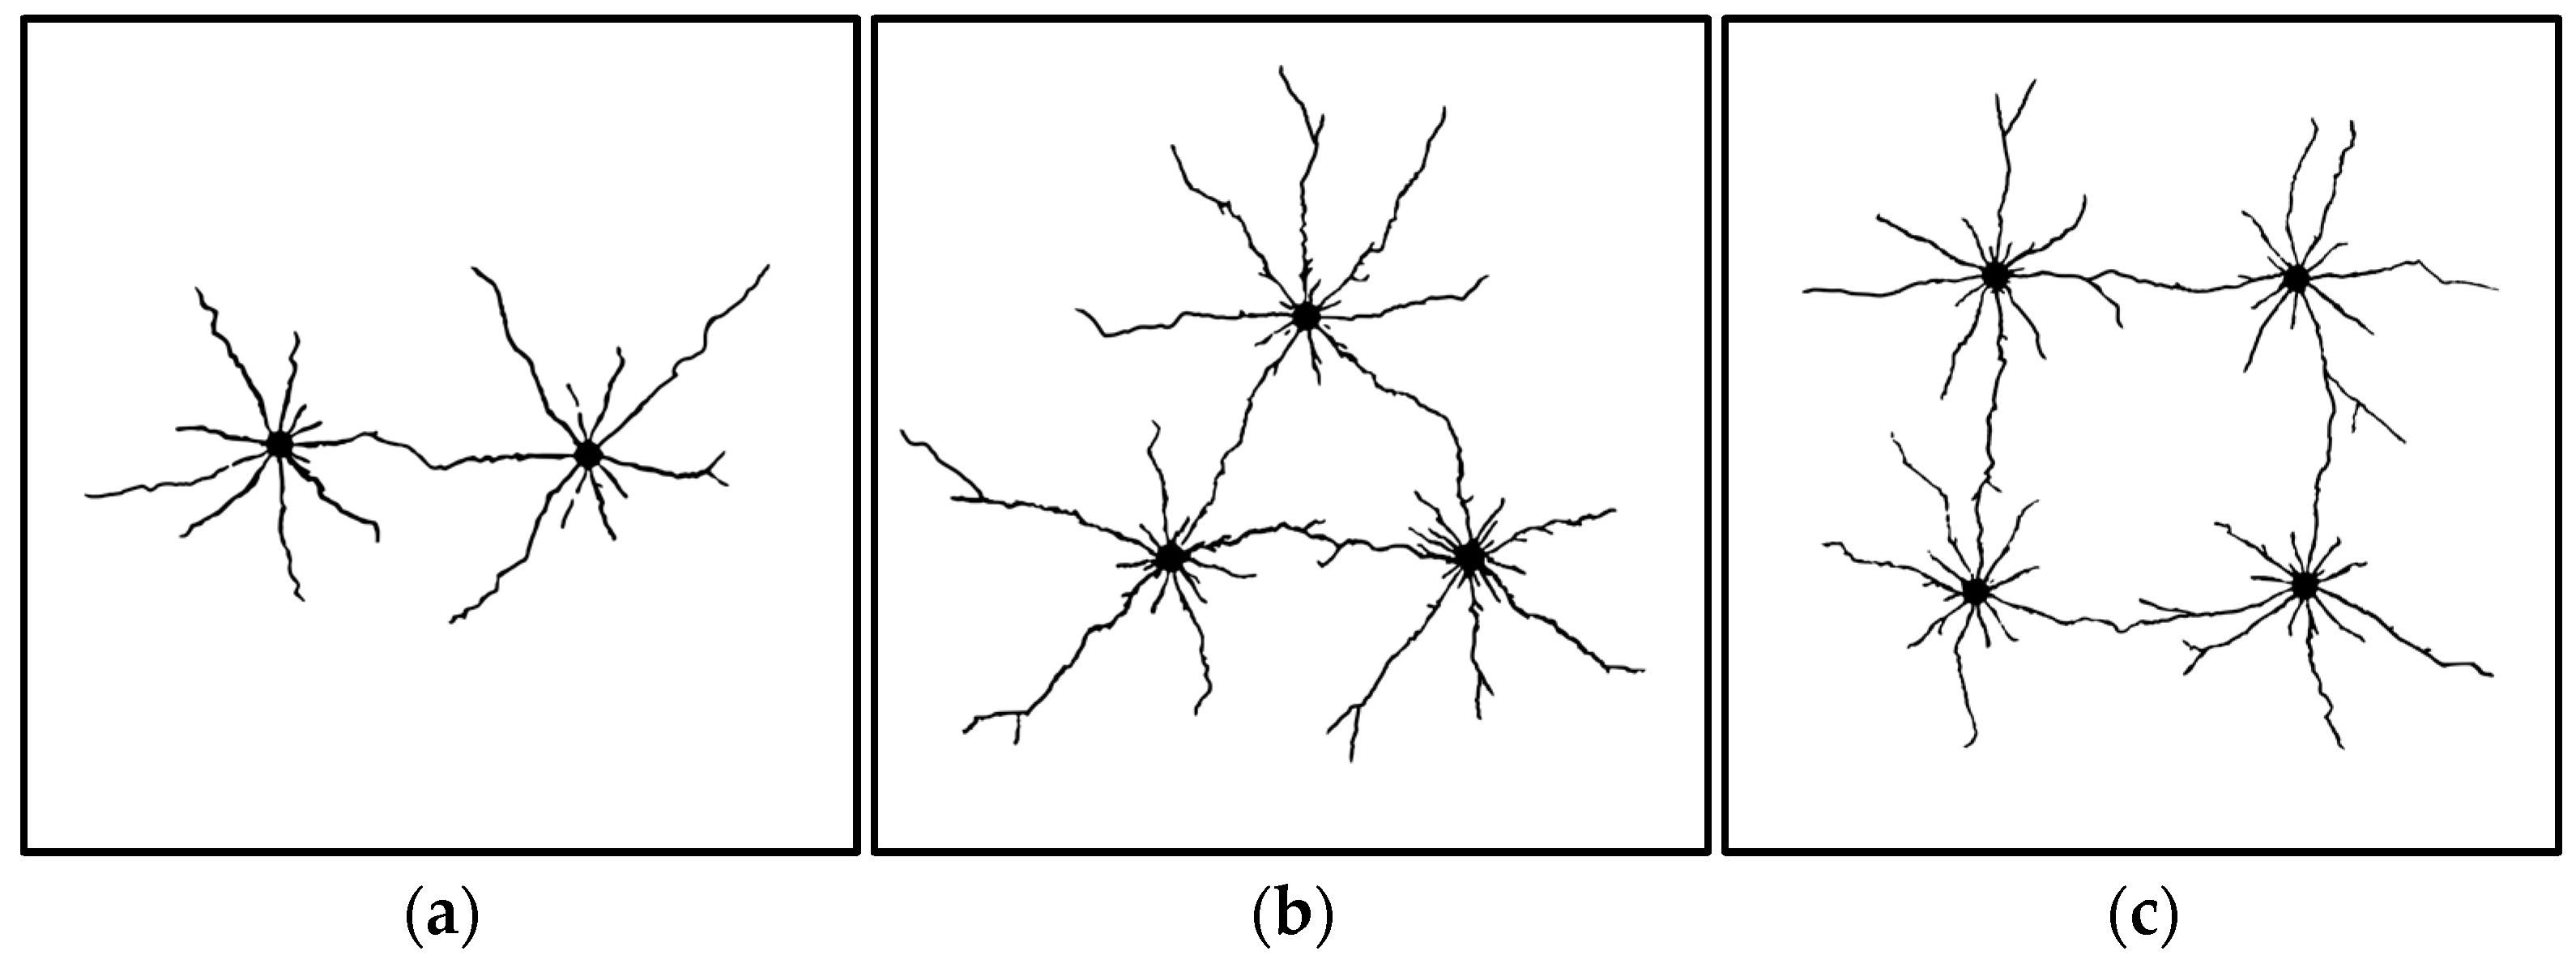
As the axisymmetric P-waves propagate toward each other (at velocity c p ), the interaction results in a superposition of stress states along the bisecting midpoint between the two sources. Along the spacing direction, the compressive stresses at the wavefronts act diametrically opposed to each other. Along the burden axis, however, superposition of the hoop stresses results in tensile stresses acting away from each other (Figure 4). Therefore, the brittle cracks tend to propagate preferentially along the spacing axis due to the maximum principal tensile stresses acting perpendicularly along the burden directions. These cracks typically bridge across two adjacent blast holes (Figure 5a) [4,9]. Along the burden axis, ϕ = 0 , and for two sources with the same strength σ θ θ , 1 = σ θ θ , 2 = σ θ θ , and so the stress wave superposition reduces Equation (14) to σ b b = 2 σ θ θ .
As discussed, when multiple blasts are initiated simultaneously, their wavefronts will interact along the midpoint between two adjacent sources. Like the stress field generated between two blast sources, the maximum tensile principal stresses will similarly act along the perpendicular bisecting axis between two adjacent blast sources. For two adjacent blastholes with a blast amplitude sufficient to cause crack bridging along the spacing distance, the crack bridging patterns will occur along certain lines between two adjacent holes. For the regular crack bridging patterns shown in Figure 5b,c, the crack patterns form along the edges of the equilateral hole pattern along the connecting lines between the sources.
While the crack-bridging patterns between multiple blast holes in a regular pattern are consistent and predictable, there are no reported methods to quantitatively predict and describe these crack patterns. In this section, the Voronoi tessellation and Delaunay triangulation diagrams are used to rapidly generate the final crack-bridging patterns for a collection of arbitrarily located blast wave source locations.

4. Voronoi Tessellation and Delaunay Triangulation Diagrams

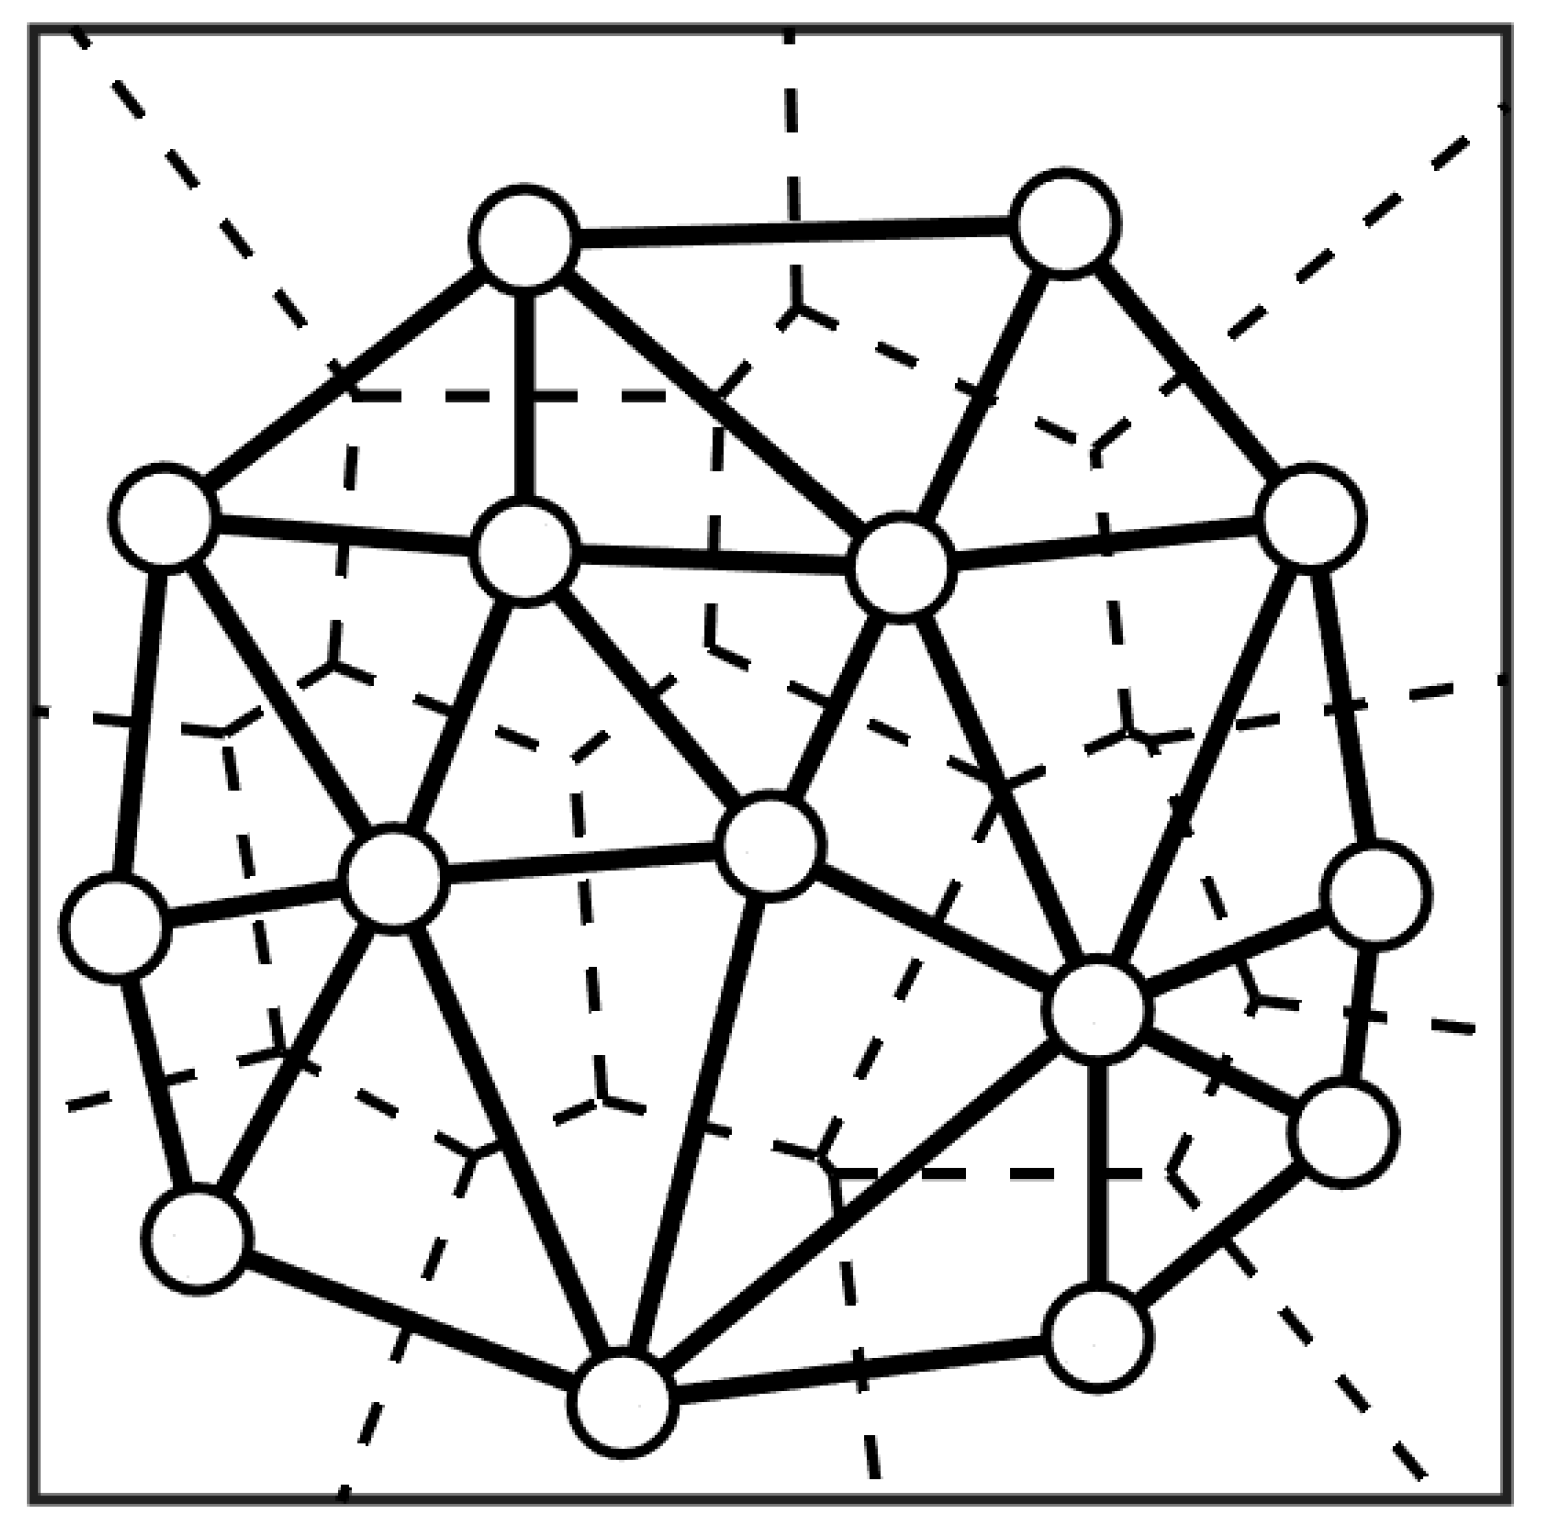
We first consider a discrete set of N blast wave sources with arbitrary source locations, where N is greater than 2. For any propagating source within this set of source locations, there will be at least one adjacent neighboring source located within its vicinity. When the axisymmetric waves propagate and interact, the maximum tensile principal stresses occur along the perpendicular bisecting axis of two neighboring source locations. Revisiting Chew and Dyrsdale’s “expanding waves” analogy [6], we see that as we iterate through all N blast wave source points and construct the corresponding bisector between its neighboring source, the set of point sources generates the corresponding Voronoi tessellation diagram. Figure 6 shows the Voronoi tessellation (dashed lines) and corresponding Delaunay triangulation diagram (solid lines) generated using MATLAB’s built-in voronoi and triangulation functions [24] for 15 arbitrarily located seeds [25].
Mathematically, for a set of finite points, the Voronoi tessellation diagram is the dual graph of the Delaunay triangulation of said set of points. Delaunay triangulation algorithms serve the purpose of joining a set of points within a space into a set of “well-behaved” triangles. The Delaunay triangulation lines will always be perpendicular to the Voronoi tessellation lines. As such, the Delaunay triangulation graph will always indicate the paths of crack bridging for a given set of axisymmetric wave sources. With the Delaunay triangulation algorithm, the size of the smallest angle in any triangle is maximized, thereby minimizing the occurrence of skinny triangles with relatively long edges (i.e., sliver triangles) occurring within the set of points given. The algorithms therefore generate the edges where edge lengths are minimized, which further prevents the issue of cracks bridging across other cracks.

Prediction of Principal Stress and Crack Behavior for Multiple Sources

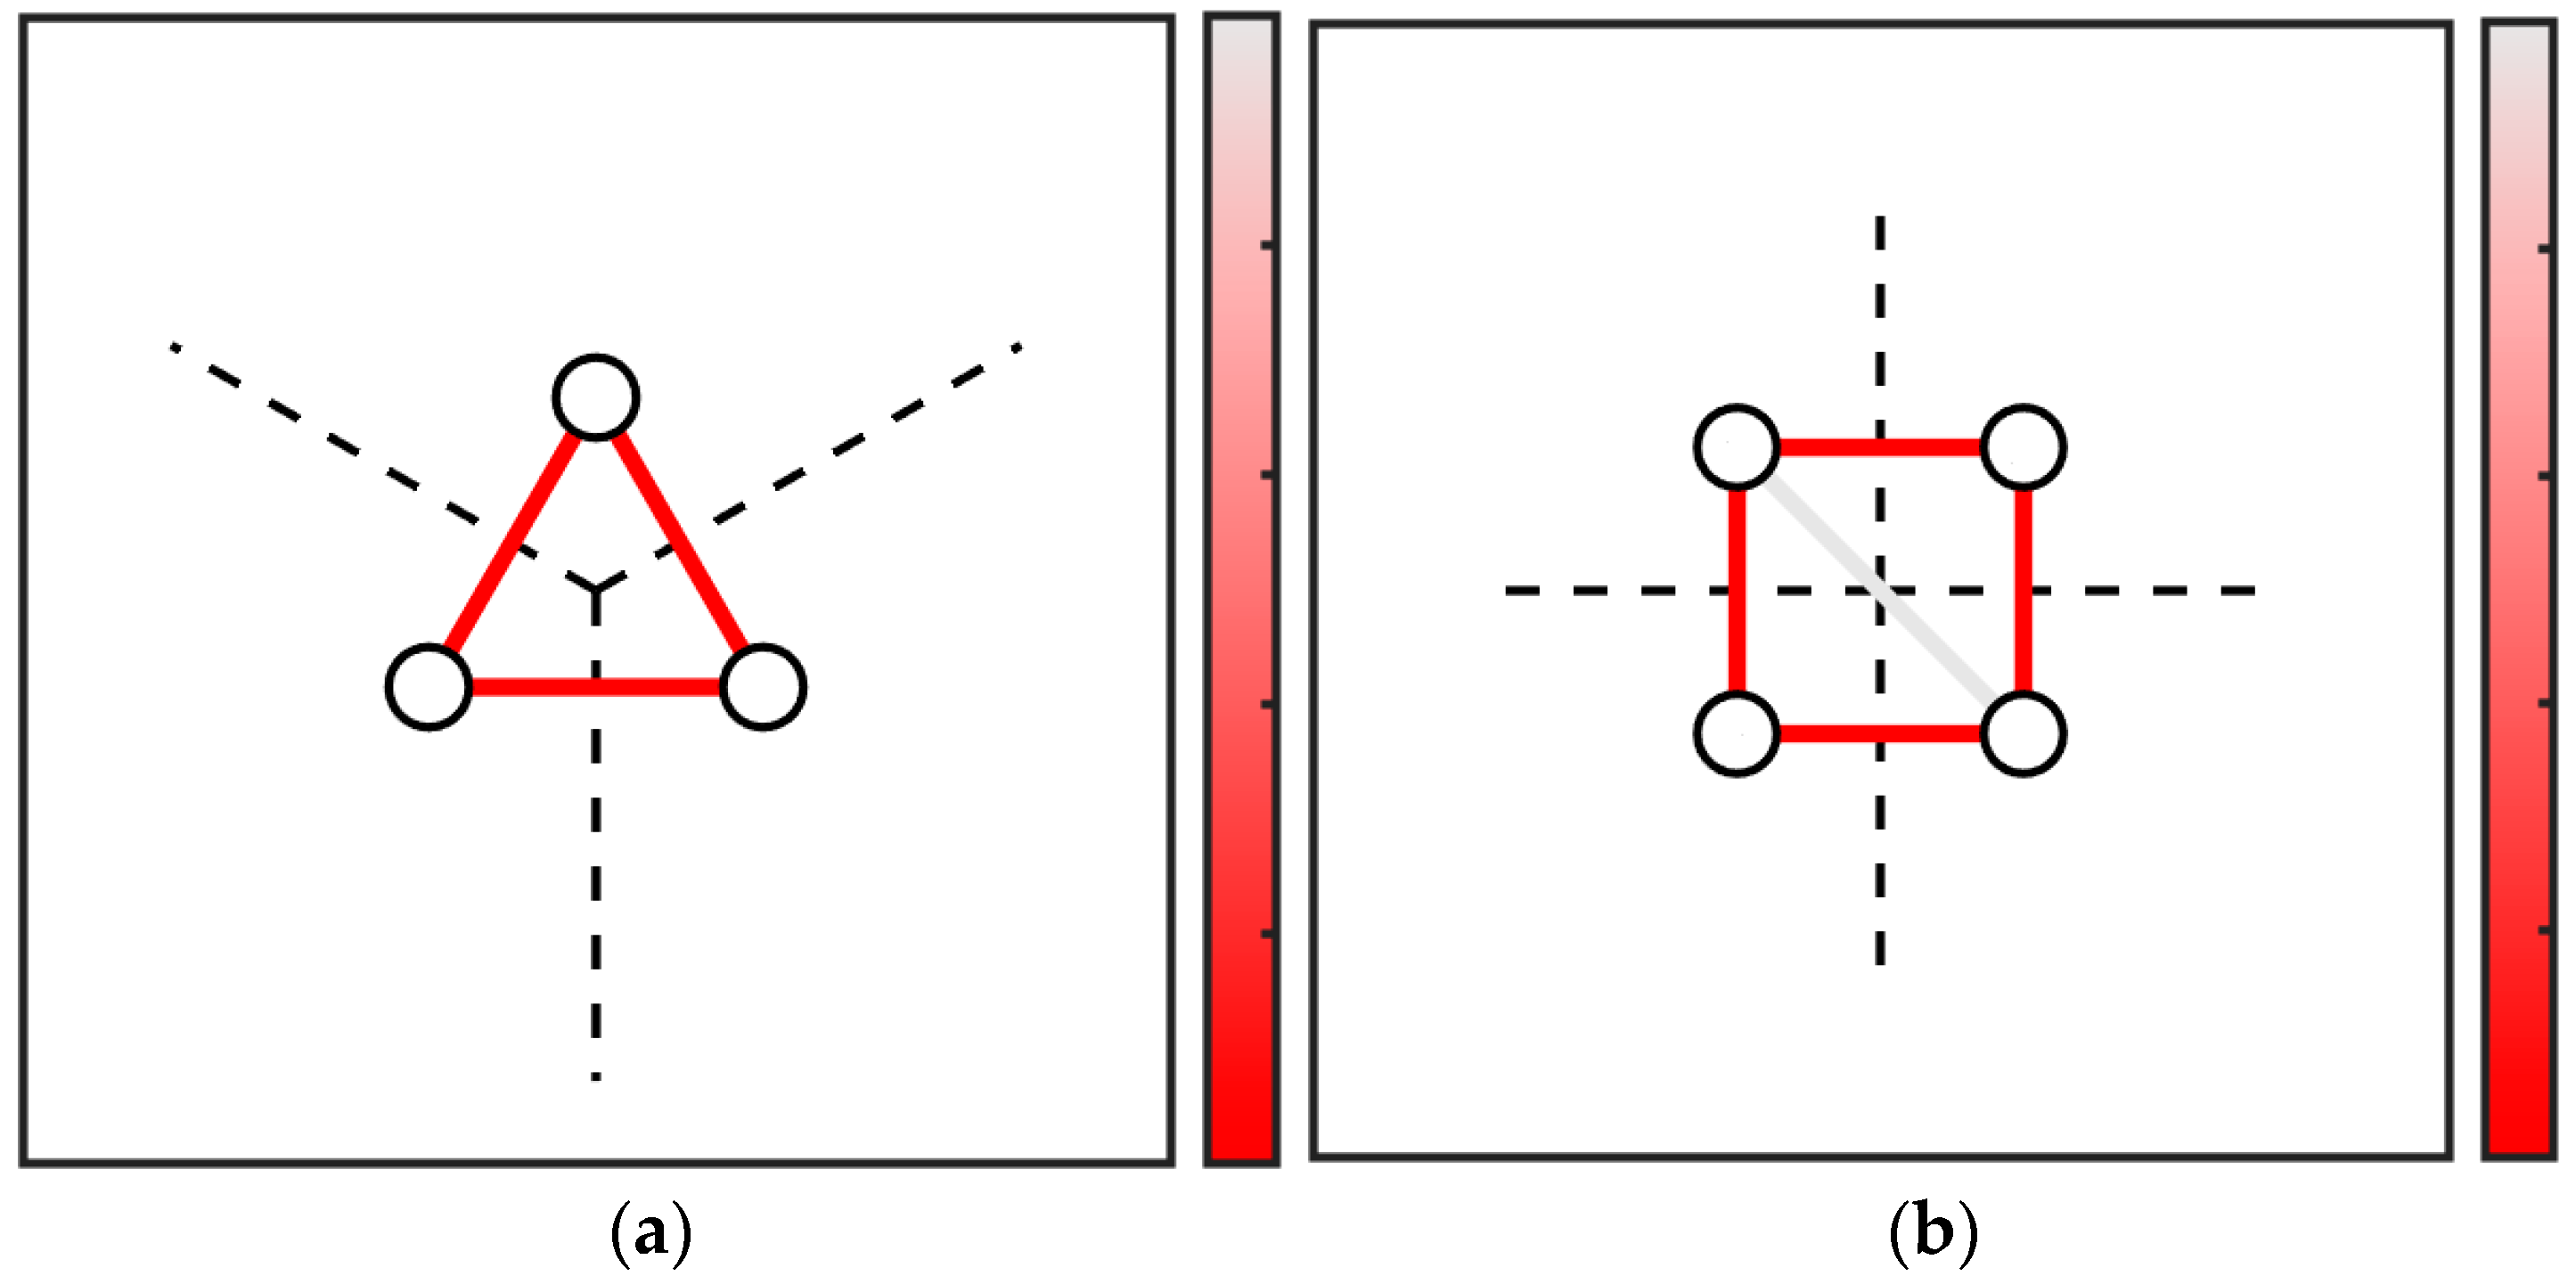
In Figure 7, the Voronoi tessellation and Delaunay triangulation graphs are plotted together for a regularly spaced three and four blasthole source locations as given in the previous section. The dashed Voronoi lines indicate the location and axes of peak tensile stresses. The shortest distance between each blasthole is 120 mm, and these distances are shown in red in the Delaunay triangulation diagram as they are the most likely locations for crack bridging. In Figure 7b, the diagonal (indicated in gray) is less likely to bridge as the distance is much further compared to the edges of the square.
While predicting the maximum principal tensile stress directions and crack bridging directions for regularly spaced blast sources can be useful, the practicality of the Voronoi/Delaunay dual graph method lies in visualizing the stress field for a random distribution of blast wave sources. We demonstrate this with four randomly generated blasthole source locations (Figure 8) with x , y coordinates as A = 0.36,0.126 , B = 0.119 , 0.090 , C = 0.09 , 0.076 , and D = 0.054 , 0.130 for a plate measuring 0.36 m × 0.36 m. The edges generated by the voronoi function were then sorted by their lengths, and the time of arrival (ToA) of the P-wave interaction was calculated via the equation
t P = L 2 a C p
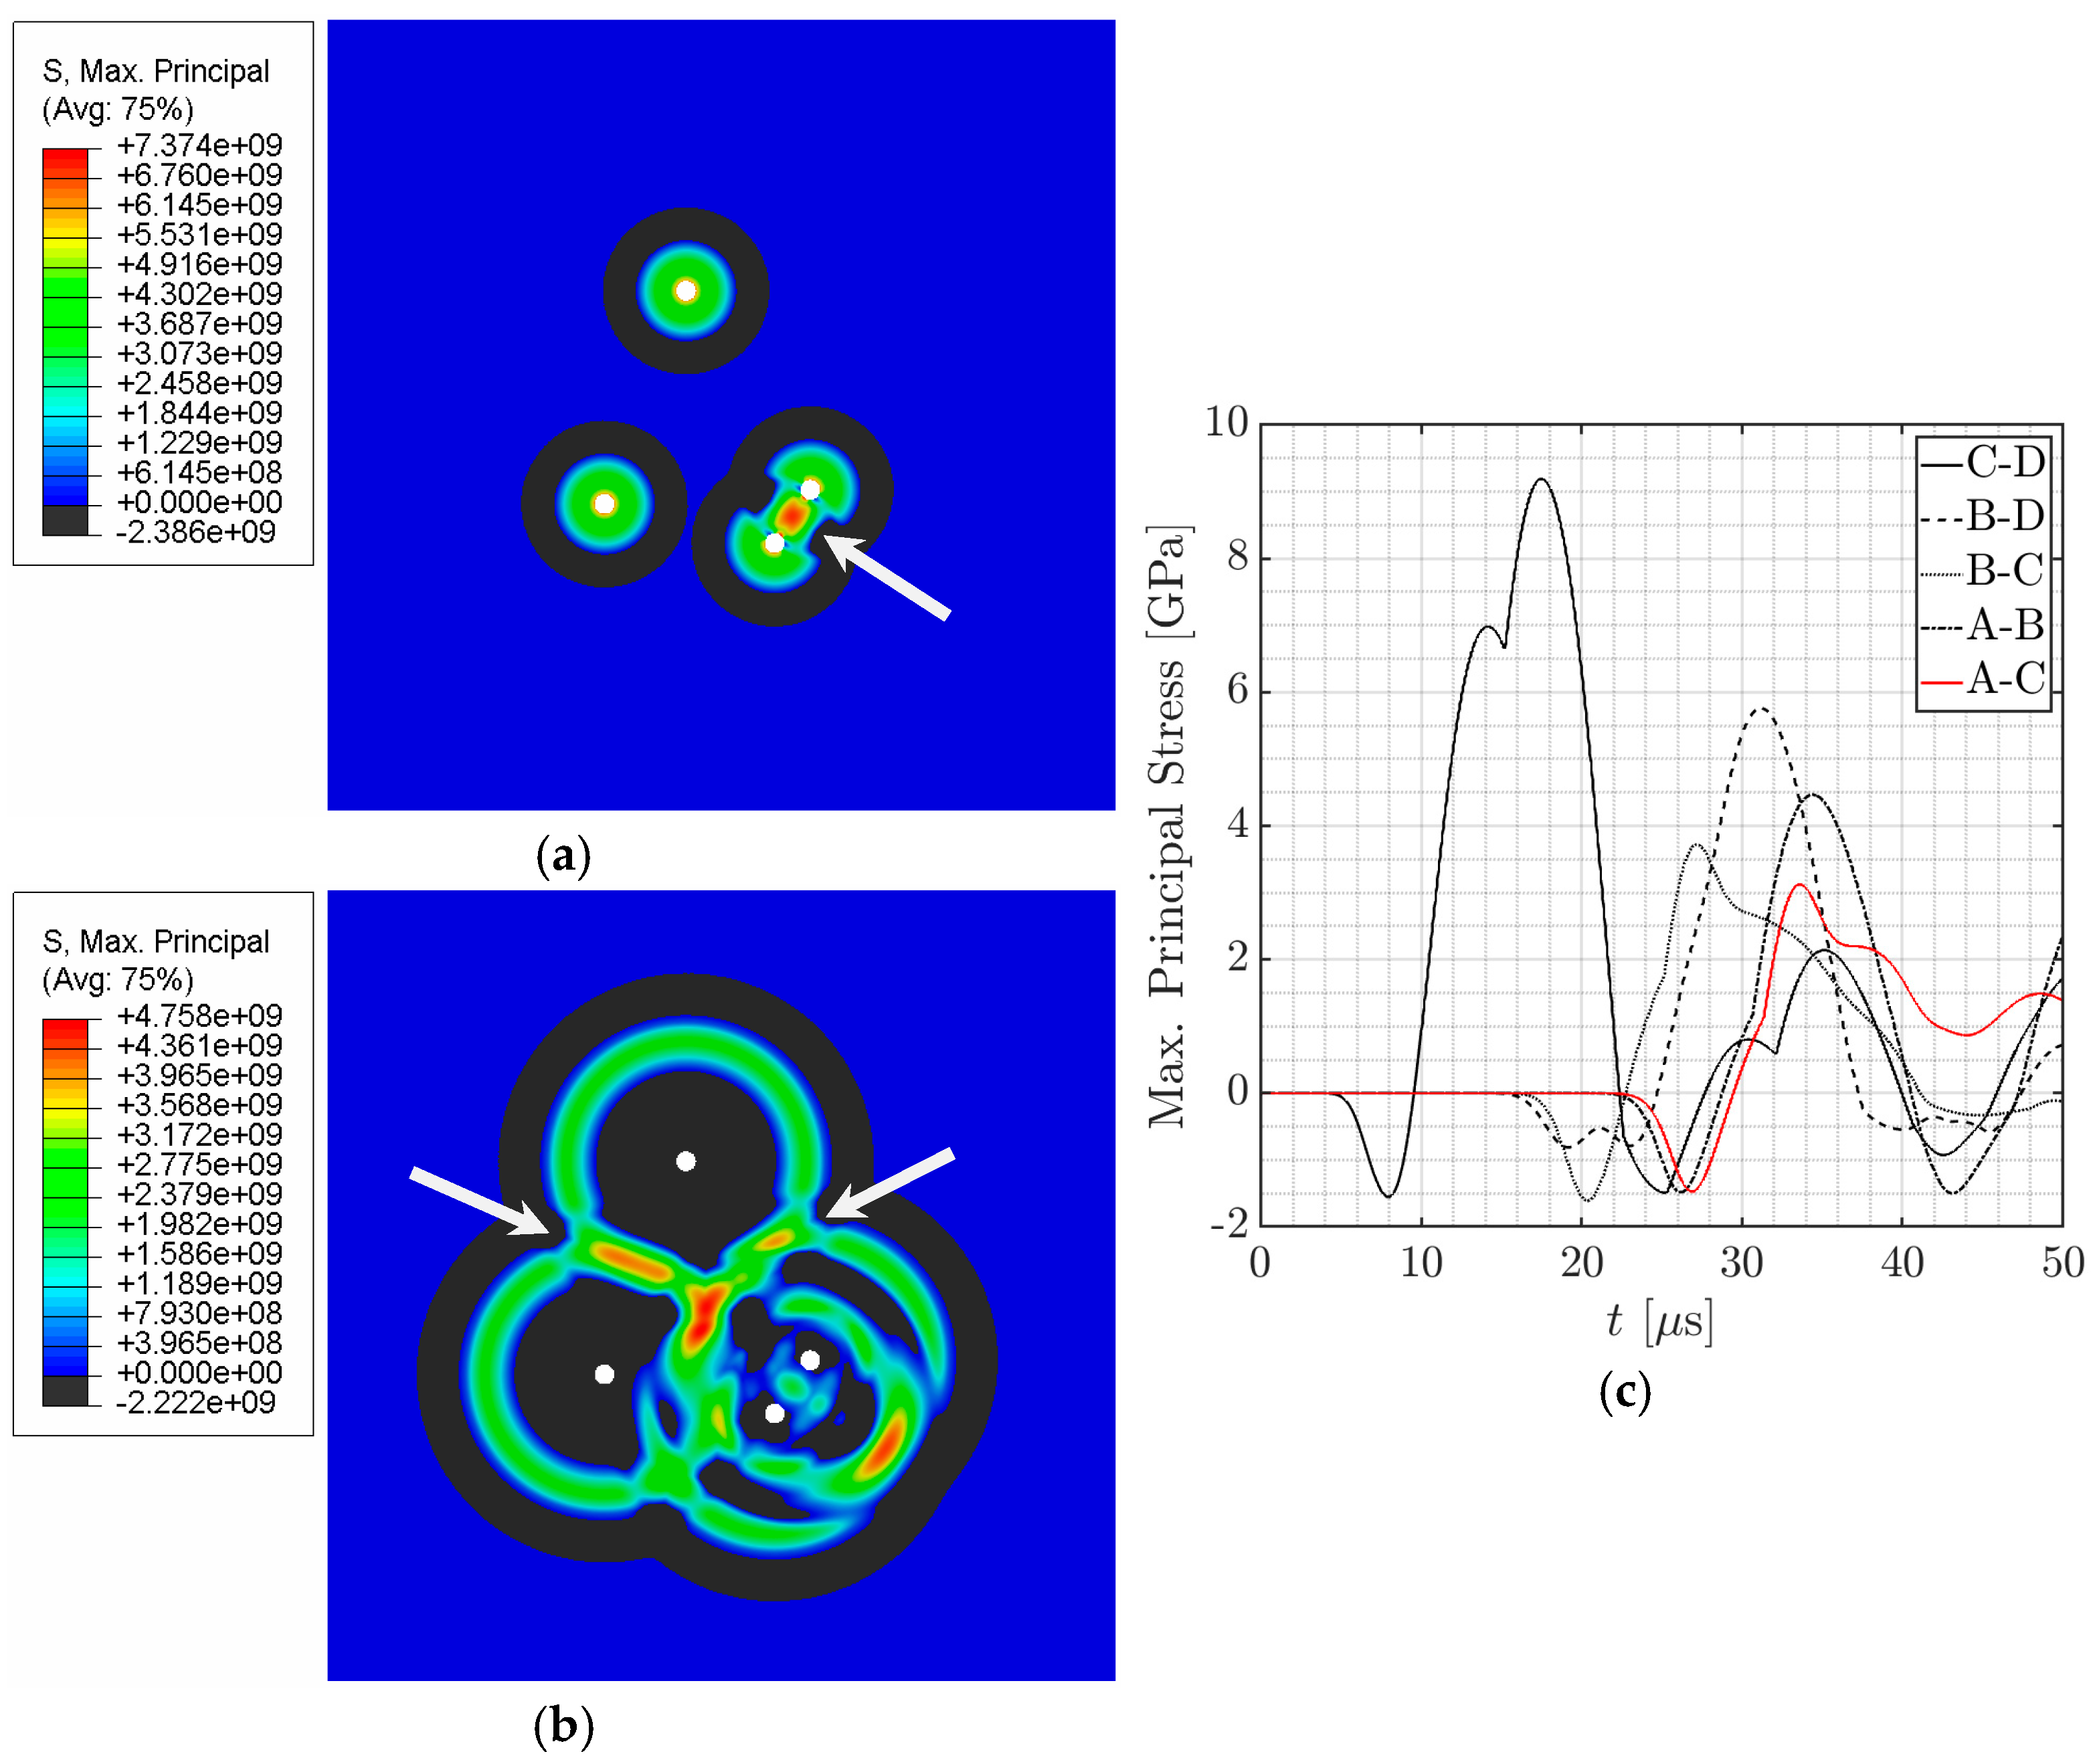
where L is the distance between two adjacent sources. A red-gray colormap was subsequently generated in Matlab to easily visualize the relative times of P-wave arrivals at the midpoints, which would further indicate the relative times of onset of crack propagation and bridging. Table 1 gives the full list of edge lengths and times of P-wave arrivals using the Voronoi tessellation method. The relative times of arrival are well predicted, with slight differences between the analytical solution and the computational simulation that are likely due to nonlinear effects around the boundary of the blast source for the Abaqus simulations. Similarly, the differences between the analytically computed stresses with Equations (1)–(12) and the Abaqus simulations are likely due to the idealized geometries assume by the analytical solution, while obtaining stresses at the single midpoint node requires integration of stresses around the element and will result in errors. Nonetheless, the Voronoi tessellation method gives decent first order predictions for the expected stresses along the perpendicular bisector.

5. Stress Wave Interaction and Fracture Pattern Prediction Using Abaqus/Explicit

5.1. Visualization of Stress Interactions in Simplified Rock Model

Computational simulations were performed using Abaqus/Explicit to examine the temporal evolution of the transient stress field within the vicinity of the blasts for the four randomly distributed blast sources. In the model, each borehole has a diameter a = 10 mm, and the rock plate has dimensions of 500 mm × 500 mm × 100 mm to prevent boundary wave reflections for longer duration simulations. We first examine the wave interactions using the simplified material properties, i.e., use ν = 0.23 , E = 50 GPa, and ρ = 2700 kg/m3. Note that this simplified rock material model is purely elastic and does not account for failure, fracture, or plasticity of the rock medium. The pressure profile given in Equation (12) and Figure 1 was used as the boundary conditions within each blast hole. To reduce computational time and cost, a simplified 2D plane–strain model was used. The model mesh was generated with CPE3 plane strain triangular elements with characteristic length of 2 mm. The total simulation duration for this model was 50 µs.
The locations of maximum principal stress from the simulations occur when the P-waves from the sources interact (Figure 9a,b), and the simulations results correspond to the locations predicted by the Voronoi tessellation diagram in Figure 8. Further, the time of P-wave interactions is well predicted by the Voronoi tessellation method.

5.2. Visualization of Stress Wave Interactions and Fracture Patterns in Granite

To demonstrate the Voronoi/Delaunay visualization method for complex material models, Abaqus/Explicit simulations were performed to examine the stress wave interactions and fracture patterns within a more realistic rock model. Instead of the simplified purely-elastic rock material used by Yi et al. [5], the Johnson–Holmquist II (JH-2) material model was used to simulate the mechanical response of granite. The JH-2 parameters were collated from He et al. [4] and are given in Appendix A. Simulation parameters were kept the same from the previous section, with a total simulation duration of 500 µs to allow material fracture and cracks to bridge between the blast holes.
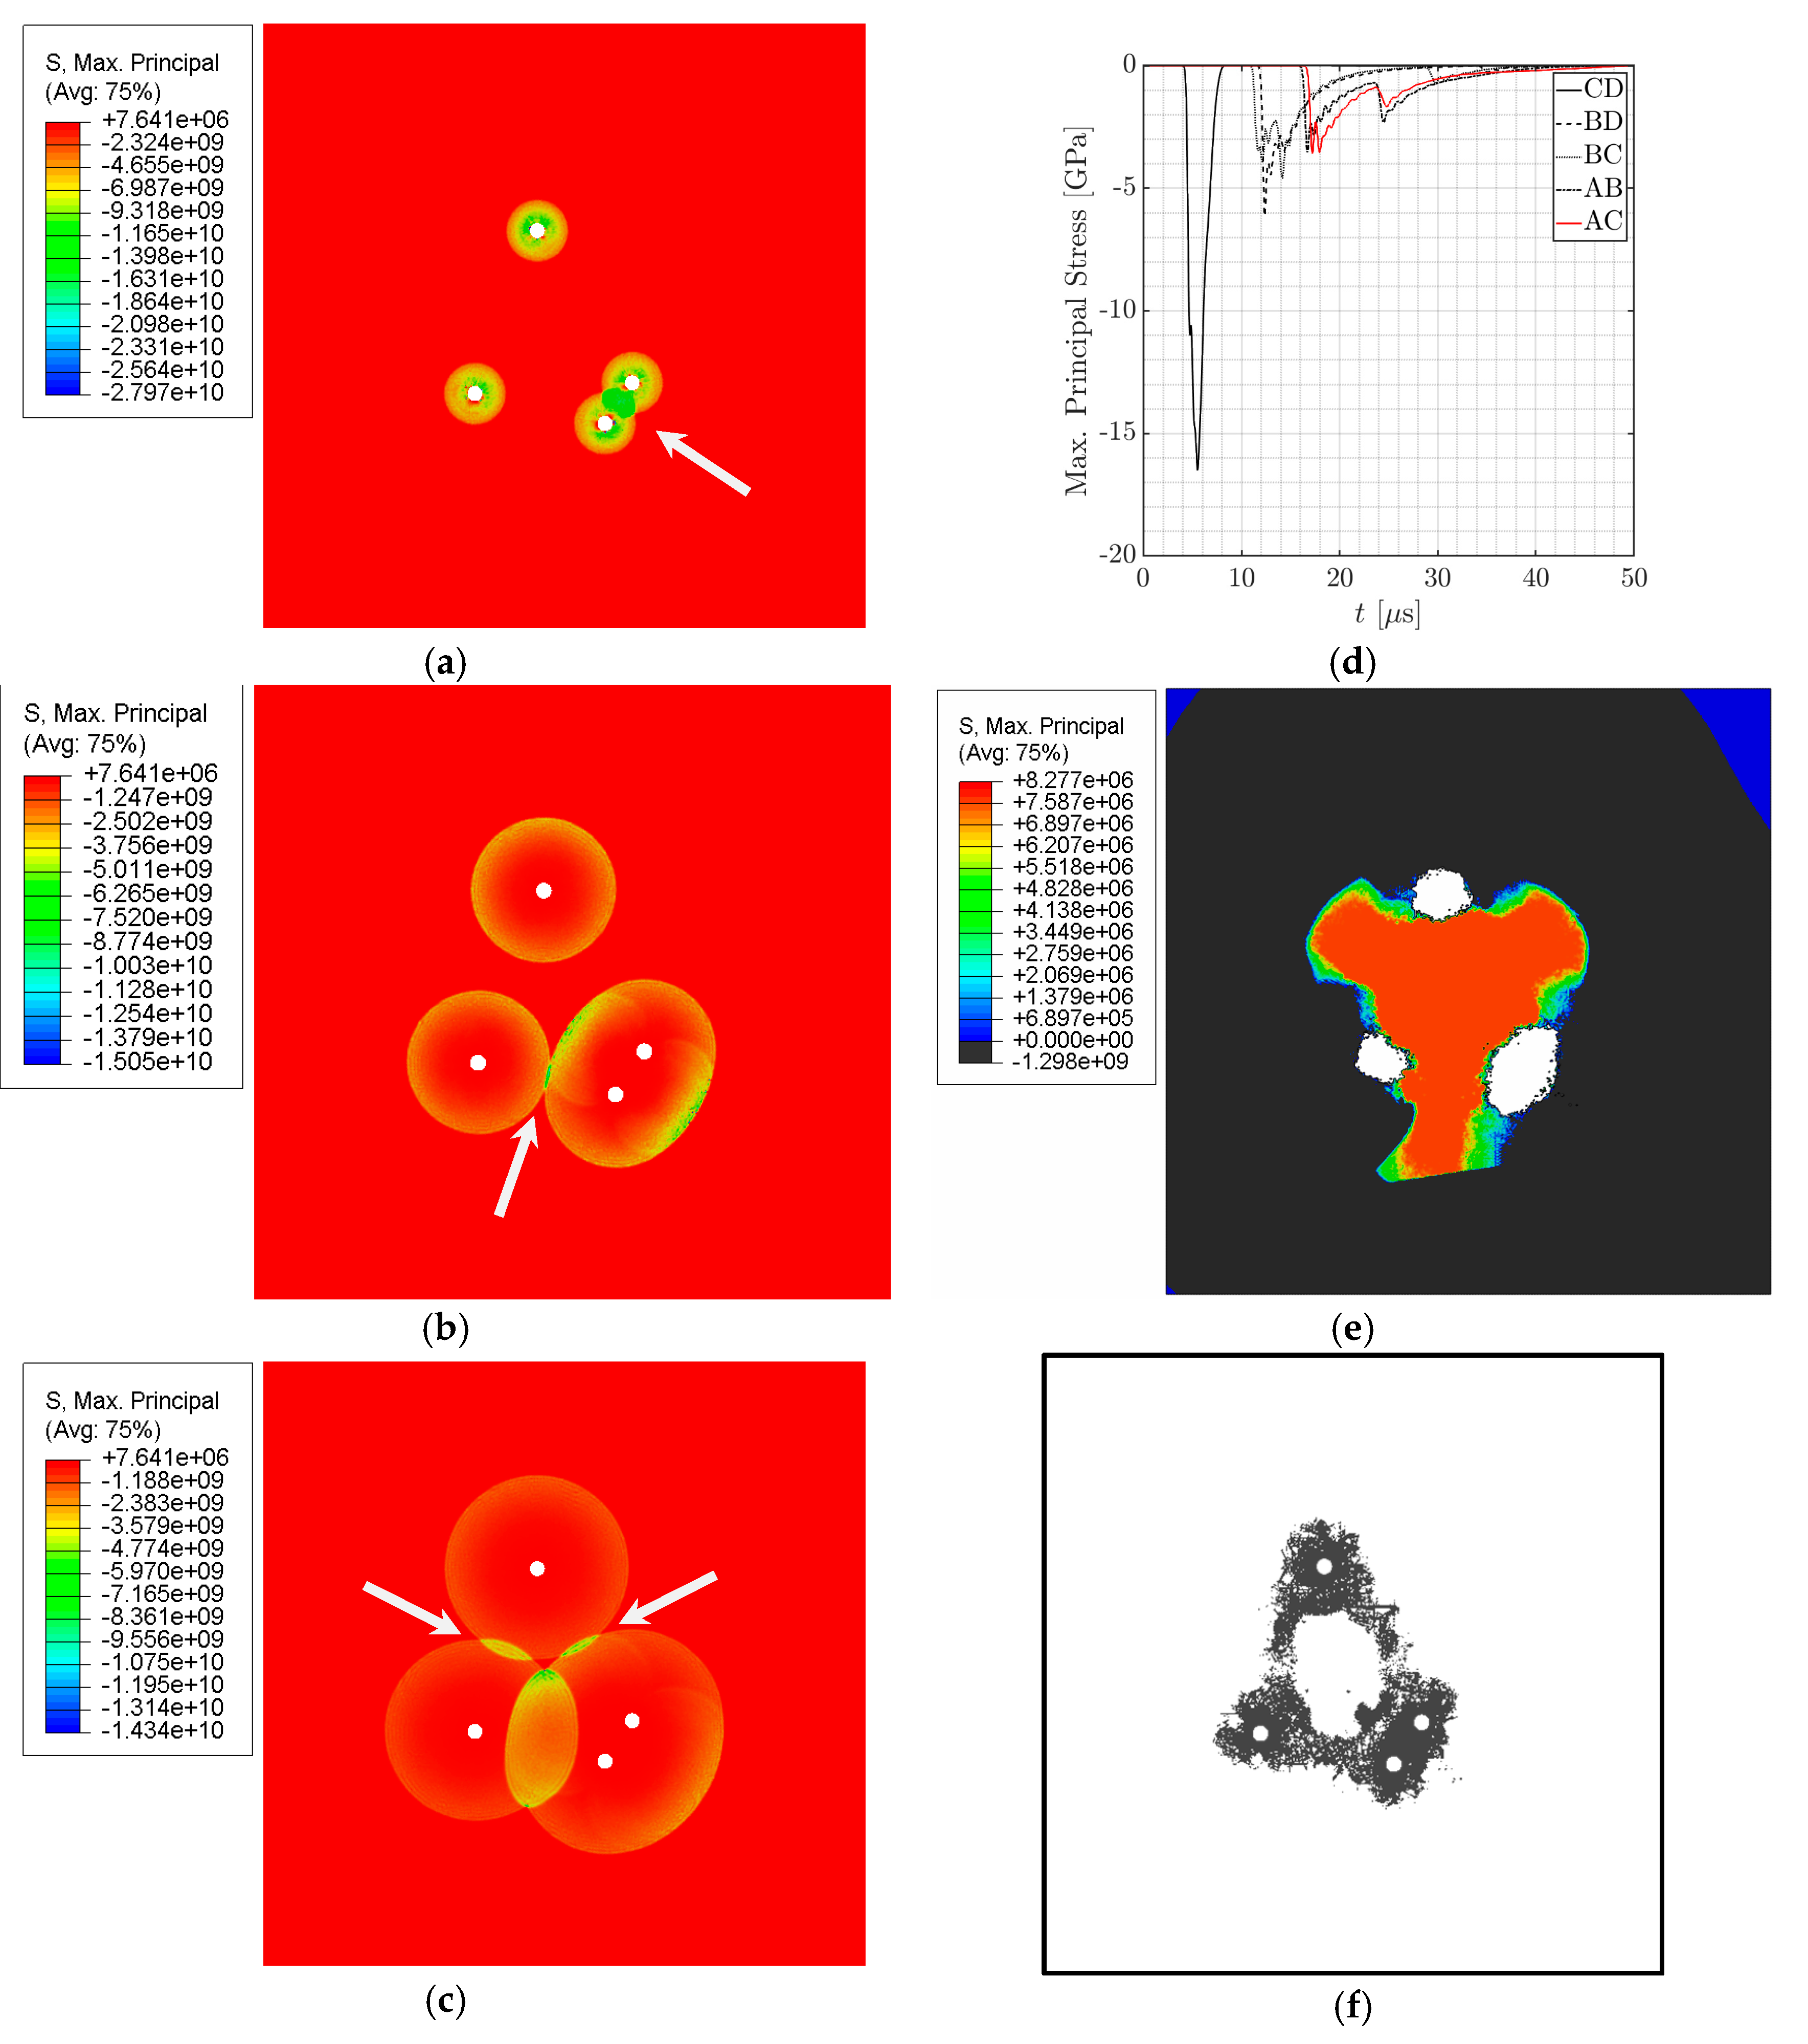
The stress wave propagation for such a material model is extremely complex, as it involves shock loading, brittle fracture at early stages of the blast process, as well as tension-compression asymmetry of rock material under deformation and failure. Nonetheless, if we consider the general stress wave interactions of the simulation, we see that the Voronoi/Delaunay visualization scheme still applies. Similarly to the simplified rock model, the first peak stresses occur between C-D at 4.9 µs after the blast is initiated (Figure 10a), followed by B-D at 10.3 µs (Figure 10b), and then between sources A-B and A-C at 14.3 µs (Figure 10c). These peak stress locations and directions correspond exactly to the Delaunay triangulation diagram in Figure 8.
The stress time history for all five source-line midpoints (Figure 10d) shows very large compressive stresses when the stress waves interact, followed by very weak tensile tails after a long duration. To estimate the dilatational wave speed of granite for the Voronoi tessellation method, we use ν = 0.23 , E = 70 GPa, and ρ = 2660 kg/m3, giving c p = 5523 m/s. Predictions are accurate for line C-D (Table 2), but begin to deviate severely for the other lines. This is likely due to the behavior of granite under blast loading—we observe a very large compressive peak when the waves interact, resulting in compressive damage around the borders of the blast hole. This compressive peak is followed by a tensile tail that, while existent, is orders of magnitude smaller (Figure 10d). We can see this in the stress field approximately 75 µs after the blast occurs by only displaying any positive, i.e., tensile principal stresses from the simulation results (Figure 10e), where the peak tensile stress is approximately 8.3 MPa along the Voronoi tessellation lines. The final fracture and crack bridging pattern (Figure 10f) correspond to the Voronoi tessellation pattern as predicted, but line B-C is absent from the final crack bridging pattern, likely due to the complex superposition of more than two stress waves.

5.3. Visualization of Stress Wave Interactions and Fracture Patterns in Silicon Carbide

In this final section, we further demonstrate the Voronoi/Delaunay visualization method for an unlikely rock substrate material, silicon carbide, which is much stronger than granite and often used in protective armor systems. Nonetheless, the brittle failure mode of silicon carbide makes it a good candidate for demonstrating the Voronoi/Delaunay visualization scheme. The Johnson–Holmquist II (JH-2) user material model abq_jh2 for silicon carbide was used (Table A2) [26]. Simulation and blast parameters were kept the same from the previous sections, with a total simulation duration of 100 µs to allow material fracture and cracks to bridge between the blast holes. The dilatational wave speed c p for silicon carbide is approximately 12,500 m/s.
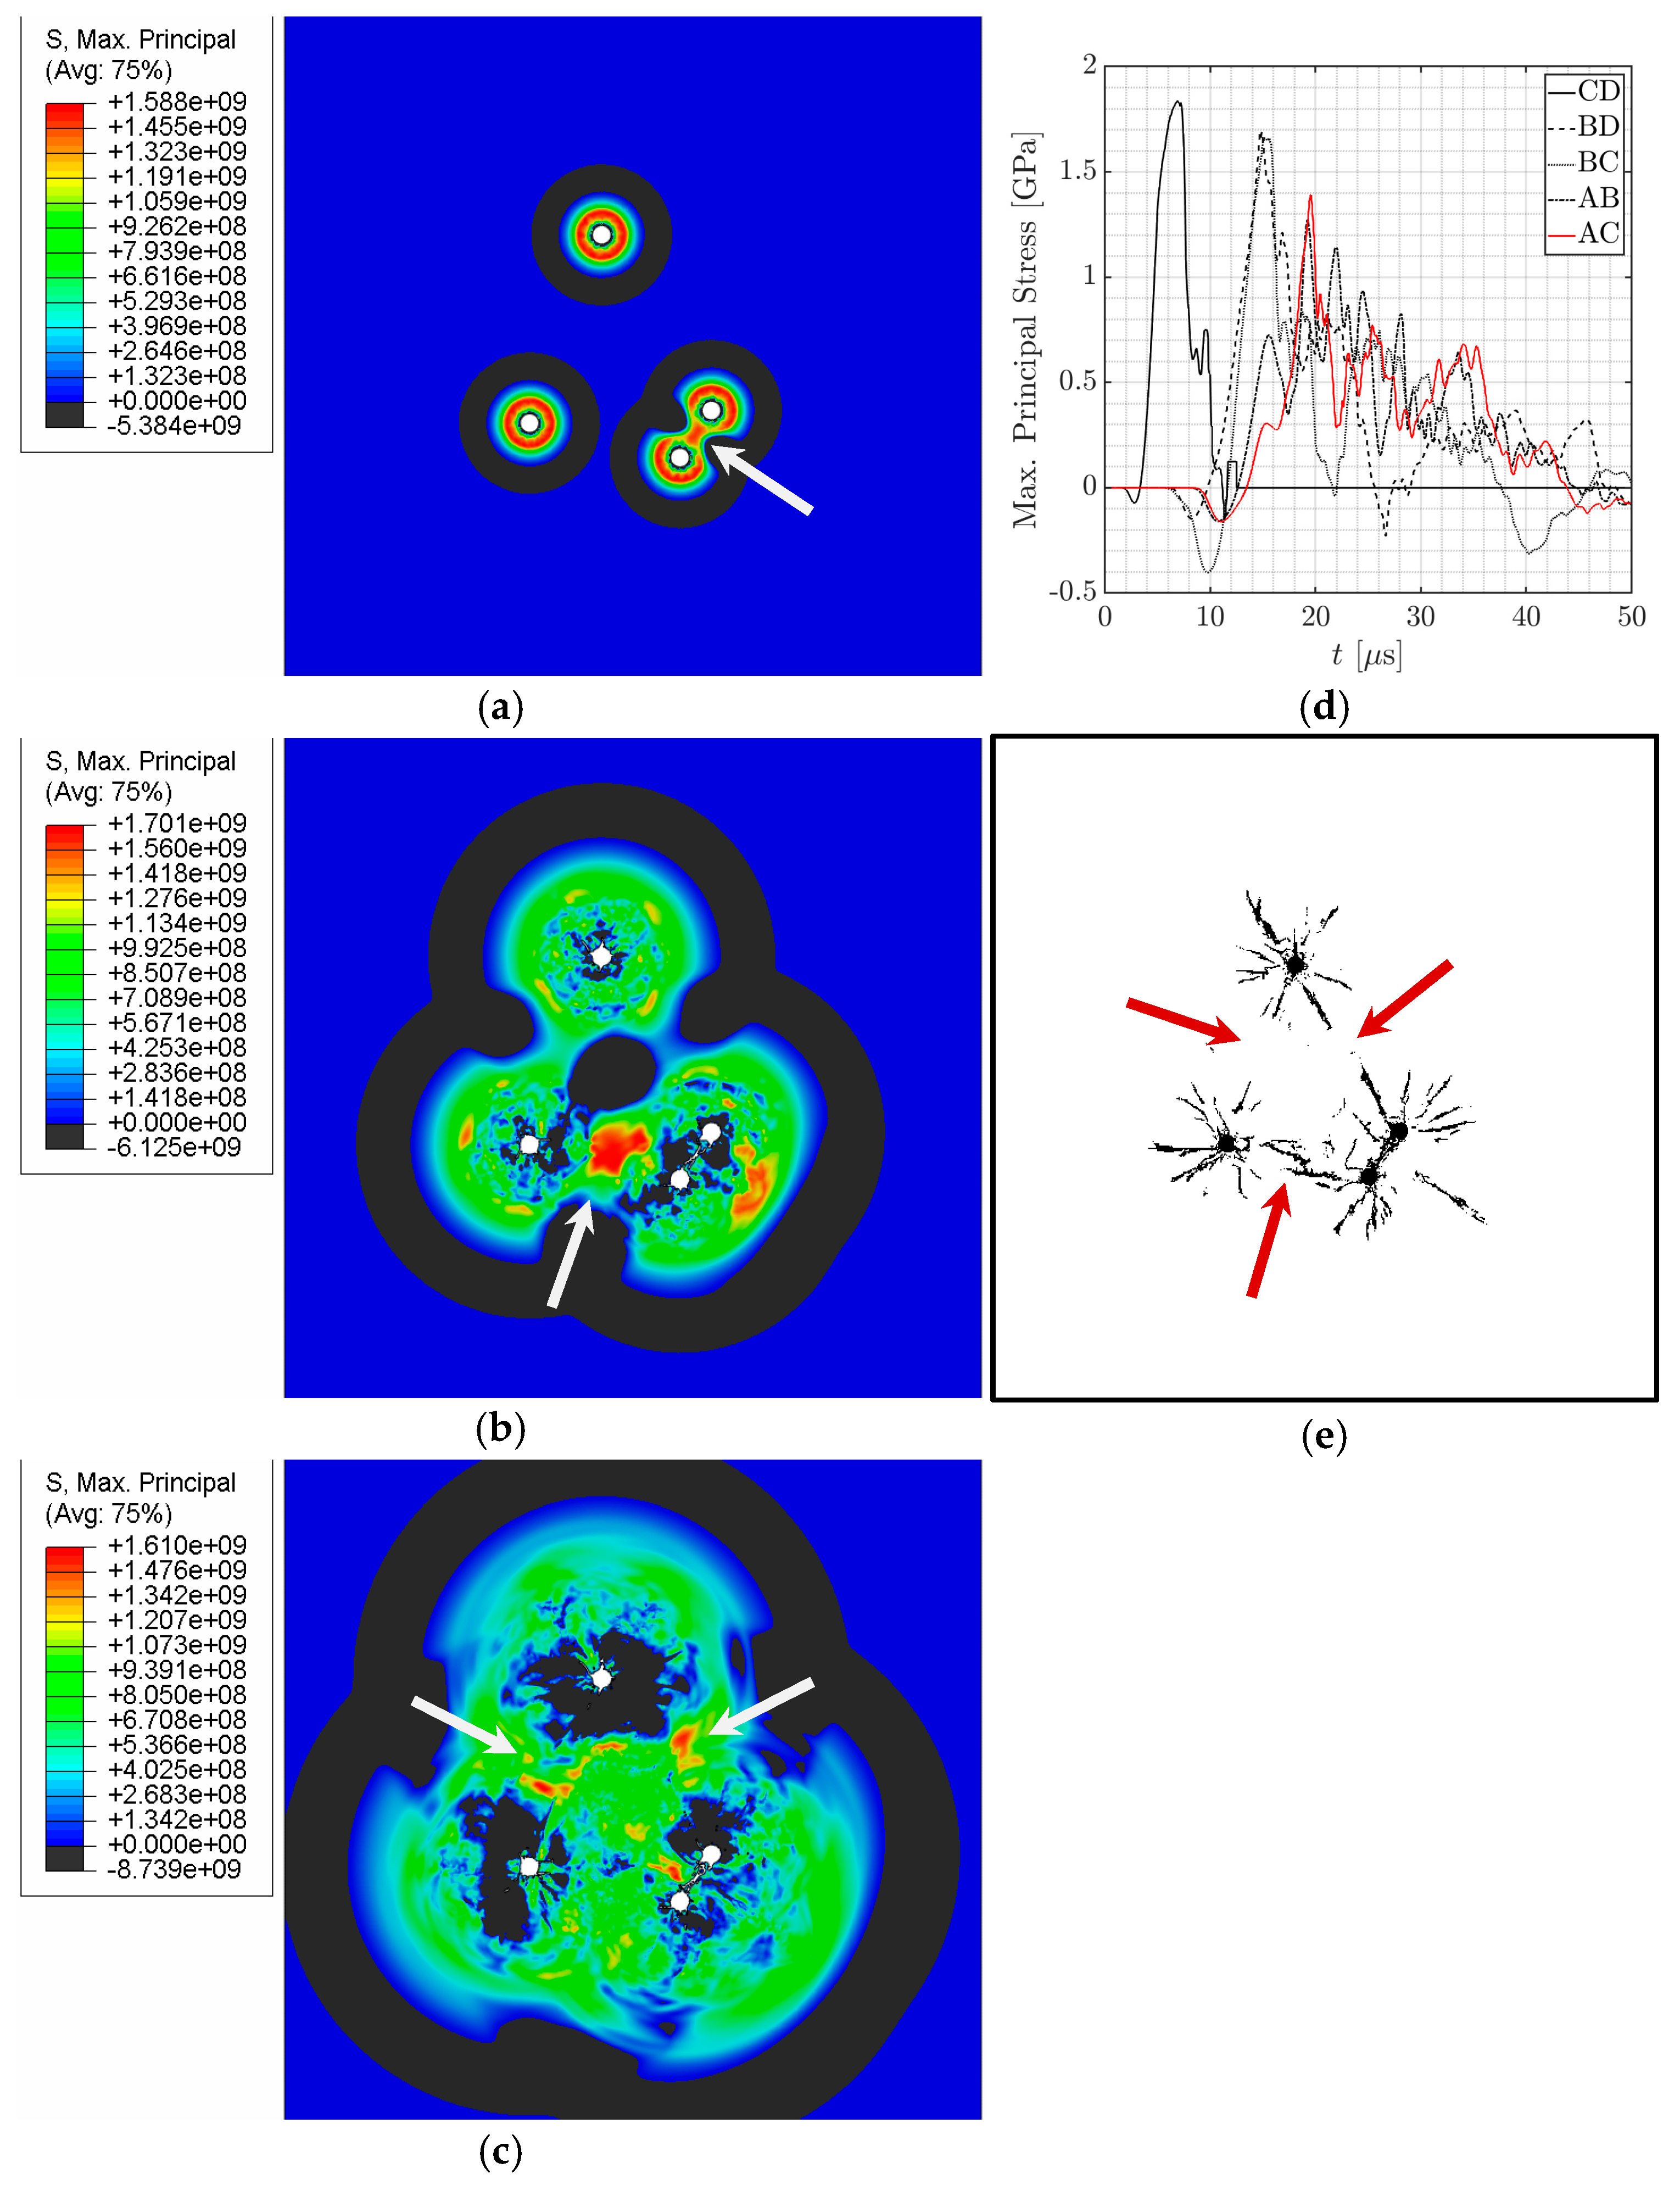
The accuracy of predictions for silicon carbide (Table 3) is much higher due to the relatively “well-behaved” fracture behavior near the blast holes. The final crack bridging pattern is more prominent in this case (Figure 11), as there is less fracture and material removal around the blast holes. The stress wave interactions result in cracks bridging across points C-D as per the Voronoi tessellation diagram in Figure 8, but the stresses along the other lines are insufficient to cause complete crack bridging, although the onset of the bridging can be observed especially along B-D.

6. Further Discussion

Although the current work focuses on the wave propagation behavior and interaction of simultaneously initiated blast waves, the proposed Voronoi/Delaunay visualization model is relevant to any application where multiple point sources of axisymmetric radially propagating waves are likely to occur, such as the interaction of blast shock waves in air, or the interaction of cone cracks within brittle materials under ballistic impact. For example, a prior work by Qiu and Eliasson [1] investigating the interaction of blast waves in air shows that the pressure within the interaction zone is symmetric about the midpoint bisector between the shock point sources. In the same work, Qiu and Eliasson examined the effects of delayed blast initiation of multiple point sources, which gives rise to a slightly different diagram than the typical Voronoi tessellation diagram. This suggests potential for future work in using similar tessellation algorithms for delayed-initiation wave sources.

7. Conclusions

In this work, we show that the Voronoi tessellation diagram and its symmetric dual graph, the Delaunay triangulation diagram, can be used to predict maximum principal stress locations and crack bridging patterns for axisymmetric blast waves within brittle materials. Additionally, the timing of P-wave interactions can be approximated using the edges of the Delaunay triangulation for any arbitrary set of source locations. To exemplify this method, the dynamic response of rock material was examined via analytical solutions and finite element simulations. A simplified rock material model was used for the analytical solution of the blast wave propagation partial differential equation, and Johnson–Holmquist material models were used for computational simulations of blasting within granite and silicon carbide. The proposed method in this work offers an efficient and low-cost method of obtaining first-order predictions of the fracture response of simultaneous blasts along the spacing and burden directions. Future work will examine generating similar diagrams for delayed blasts.

Funding

This research received no external funding.

Data Availability Statement

Data are available from the authors upon request.

Acknowledgments

The author would like to thank the late NSH for her spiritual guidance. This work is dedicated to you.

Conflicts of Interest

The author declares no conflicts of interest.

Appendix A

The Johnson–Holmquist II parameters for granite (collated from He et al. [4]) and silicon carbide [26] are given in this appendix.
Table A1. Johnson–Holmquist II model parameters for granite [4].
ParameterUnitValue
Density kg/m32660
Bulk modulusK1GPa20.45
Polynomial EOS constantK2GPa4500
Polynomial EOS constantK3GPa0.0003
Shear modulusGGPa15.33
Hugoniot Elastic LimitHELGPa4.19
Intact strength constantA-0.97
Intact strength exponentN-0.64
Strain rate constantC-0.005
Reference strain rate ε ˙ 0 s−11.0
Fractured strength constantB-0.32
Fractured strength exponentM-0.64
Normalized tensile strengthT *-0.014
Pressure at Hugoniot Elastic LimitPHELGPa3.63
Damage constantD1-0.005
Damage constantD2-0.70
Bulking constantβ-0.50
Table A2. Johnson–Holmquist II model parameters for silicon carbide.
ParameterUnitValue
Density kg/m33215
Bulk modulusK1GPa220
Polynomial EOS constantK2GPa361
Polynomial EOS constantK3GPa0
Shear modulusGGPa193
Hugoniot Elastic LimitHELGPa11.7
Intact strength constantA-0.96
Intact strength exponentN-0.65
Strain rate constantC-0.009
Reference strain rate ε ˙ 0 s−11.0
Fractured strength constantB-0.35
Fractured strength exponentM-1.0
Tensile strengthT-0.75
Pressure at Hugoniot Elastic LimitPHELGPa5.13
Damage constantD1-0.48
Damage constantD2-0.48
Bulking constantβ-1.0
Max. equivalent plastic fracture strain ε ¯ f , m a x p l -1.2
Min. equivalent plastic fracture strain ε ¯ f , m i n p l -0.0
Element deletion parameterFS-0.2

References

  1. Qiu, S.; Eliasson, V. Interaction and coalescence of multiple simultaneous and non-simultaneous blast waves. Shock Waves 2016, 26, 287–297. [Google Scholar] [CrossRef]
  2. Almustafa, M.K.; Nehdi, M.L. Fundamental review on collision of blast waves. Phys. Fluids 2023, 35, 031302. [Google Scholar] [CrossRef]
  3. Rossmanith, H.P.; Uenishi, K.; Kouzniak, N. Blast wave propagation in rock mass—Part I: Monolithic medium. Fragblast 1997, 1, 317–359. [Google Scholar] [CrossRef]
  4. He, C.; Gao, J.; Chen, D.; Xiao, J. Investigation of Stress Wave Interaction and Fragmentation in Granite During Multihole Blastings. IEEE Access 2020, 8, 185187–185197. [Google Scholar] [CrossRef]
  5. Yi, C.; Johansson, D.; Nyberg, U.; Beyglou, A. Stress Wave Interaction Between Two Adjacent Blast Holes. Rock Mech. Rock Eng. 2016, 49, 1803–1812. [Google Scholar] [CrossRef]
  6. Chew, L.P.; Dyrsdale, R.L. Voronoi diagrams based on convex distance functions. In Proceedings of the First Annual Symposium on Computational Geometry—SCG’85, Baltimore, MD, USA, 5–7 June 1985; ACM Press: Baltimore, MD, USA, 1985; pp. 235–244. [Google Scholar] [CrossRef]
  7. Zhang, Z.-X. Rock Fracture and Blasting: Theory and Applications; Elsevier: Oxford, UK, 2016. [Google Scholar]
  8. Yuan, W.; Liu, S.; Wang, W.; Su, X.; Li, Z.; Li, J.; Wen, L.; Chang, J.; Sun, X. Numerical study on the fracturing mechanism of shock wave interactions between two adjacent blast holes in deep rock blasting. Earthq. Eng. Eng. Vib. 2019, 18, 735–746. [Google Scholar] [CrossRef]
  9. Yang, R.; Fang, S.; Yang, A.; Xie, H.; Yang, L. In Situ Stress Effects on Smooth Blasting: Model Test and Analysis. Shock Vib. 2020, 2020, 2124694. [Google Scholar] [CrossRef]
  10. Ding, C.; Yang, R.; Feng, C. Stress wave superposition effect and crack initiation mechanism between two adjacent boreholes. Int. J. Rock Mech. Min. Sci. 2021, 138, 104622. [Google Scholar] [CrossRef]
  11. Rossmanith, H.P. The Use of Lagrange Diagrams in Precise Initiation Blasting. Part I: Two Interacting Blastholes. Fragblast 2002, 6, 104–136. [Google Scholar] [CrossRef]
  12. Tang, H.-L.; Yang, J.; Yu, Q. Experimental Investigation of the Effect of Delay Time on Rock Fragmentation in Multi-Hole Bench Blasting. Appl. Sci. 2023, 13, 7329. [Google Scholar] [CrossRef]
  13. Rossmanith, H.P.; Knasmillner, R.E.; Daehnke, A.; Mishnaevsky, L. Wave propagation, damage evolution, and dynamic fracture extension. Part II. Blasting. Mater. Sci. 1996, 32, 403–410. [Google Scholar] [CrossRef]
  14. Needham, C.E. Blast Waves; Springer International Publishing: Cham, Switzerland, 2018. [Google Scholar] [CrossRef]
  15. Scott, R.A.; Miklowitz, J. Transient Compressional Waves in an Infinite Elastic Plate with a Circular Cylindrical Cavity. J. Appl. Mech. 1964, 31, 627–634. [Google Scholar] [CrossRef]
  16. Miklowitz, J. The Theory of Elastic Waves and Waveguides; North Holland Publishing Company: Amsterdam, NY, USA, 1984. [Google Scholar]
  17. Blair, D.P. A comparison of Heelan and exact solutions for seismic radiation from a short cylindrical charge. Geophysics 2007, 72, E33–E41. [Google Scholar] [CrossRef]
  18. Grady, D.E.; Kipp, M.E.; Smith, C.S. Explosive Fracture Studies on Oil Shale. Soc. Pet. Eng. J. 1980, 20, 349–356. [Google Scholar] [CrossRef]
  19. Larson, D.B. Explosive energy coupling in geologic materials. Int. J. Rock Mech. Min. Sci. Geomech. Abstr. 1982, 19, 157–166. [Google Scholar] [CrossRef]
  20. Bezanson, J.; Edelman, A.; Karpinski, S.; Shah, V.B. Julia: A Fresh Approach to Numerical Computing. SIAM Rev. 2017, 59, 65–98. [Google Scholar] [CrossRef]
  21. MethodOfLines.jl: Automated Finite Difference for Physics-Informed Learning. Available online: https://docs.sciml.ai/MethodOfLines/stable/ (accessed on 26 March 2025).
  22. Kutter, H.H.K.; Fairhurst, C. On the fracture process in blasting. Int. J. Rock Mech. Min. Sci. Geomech. Abstr. 1971, 8, 181–202. [Google Scholar] [CrossRef]
  23. Whittaker, B.N.; Singh, R.N.; Sun, G. Rock Fracture Mechanics: Principles, Design, and Applications; Elsevier: Amsterdam, NY, USA, 1992. [Google Scholar]
  24. MATLAB Software, Version R2023b; The MathWorks, Inc.: Natick, MA, USA, 2023.
  25. Voronoi Diagrams—MATLAB & Simulink. Available online: https://www.mathworks.com/help/matlab/math/voronoi-diagrams.html (accessed on 2 November 2024).
  26. ABAQUS Software/Standard User’s Manual, Version 2014; Dassault Systèmes: Vélizy-Villacoublay, France, 2014.
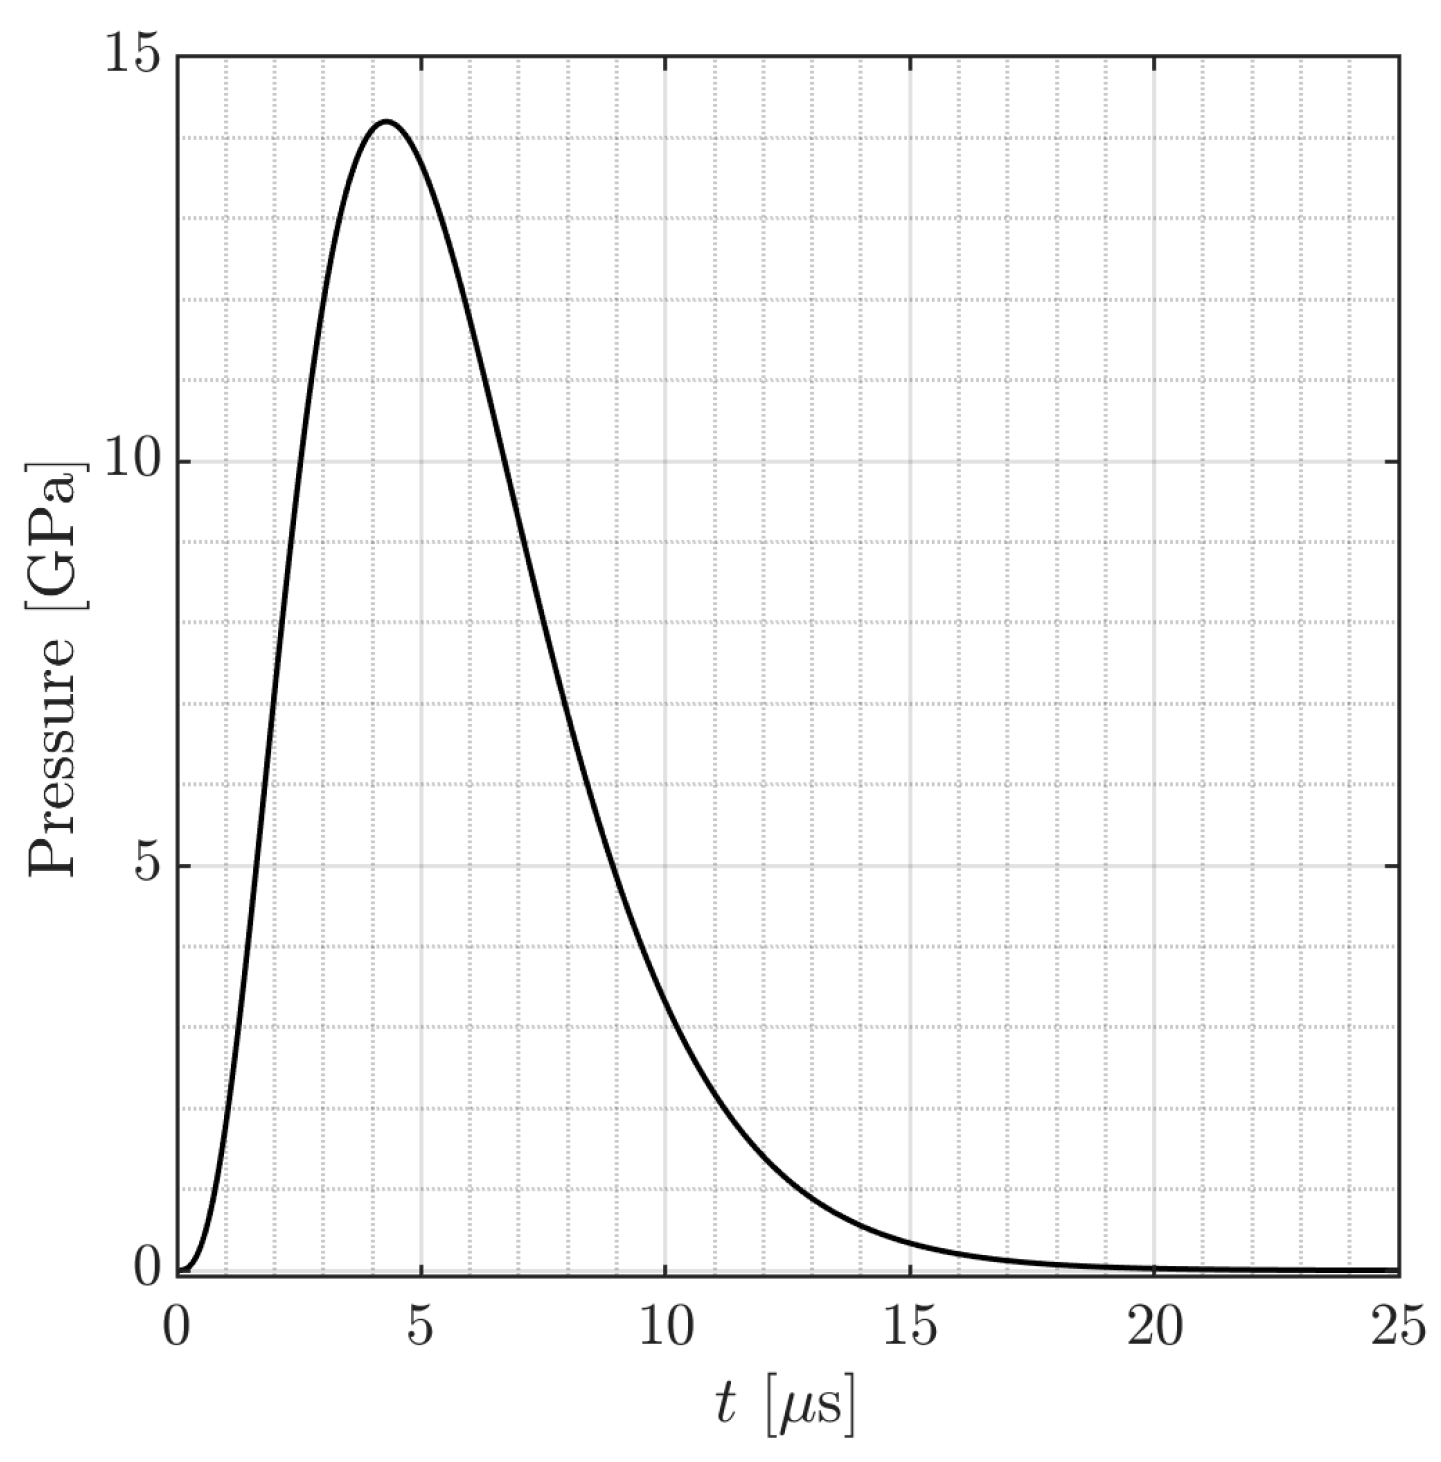
Figure 1. Blast pressure profile from Blair et al. [5], given in Equation (12).
Symmetry 17 00555 g001
Figure 2. Example of stress profile against time for radial and hoop stresses at a distance of r / a = 10 from the blast source.
Symmetry 17 00555 g002
Figure 3. Schematic of P-wave propagation and the corresponding transient stress field resulting in tensile fracture around the hole.
Symmetry 17 00555 g003
Figure 4. Schematic of P-wave interaction between two blast sources, resulting in a maximum tensile stress along the perpendicular bisector and a corresponding brittle crack bridging between the two sources.
Symmetry 17 00555 g004
Figure 5. Illustrated crack bridging pattern based on (a) two, (b) three, and (c) four blastholes.
Symmetry 17 00555 g005
Figure 6. Voronoi tessellation diagram (dashed lines) generated by 15 randomly distributed seeds (white circles) and the Delaunay triangulation dual graph (bold lines) of the same set of seeds.
Symmetry 17 00555 g006
Figure 7. Visualization of stress field interaction and potential crack bridging zones using Voronoi tessellation and Delaunay triangulation for (a) an equilateral triangle hole pattern, and (b) a square hole pattern. Colormap indicates earliest onset of crack bridging locations (red) to latest crack bridging locations (light gray).
Symmetry 17 00555 g007
Figure 8. Voronoi tessellation diagram of four random blasthole source locations (dashed lines) and corresponding Delaunay triangulation diagram (solid lines) indicating earliest to latest (red to gray) crack bridging locations.
Symmetry 17 00555 g008
Figure 9. Abaqus/Explicit simulation of simplified isotropic homogeneous rock model at (a) 14.2 µs and (b) 35.9 µs. Location of maximum principal stresses (denoted by arrows) correspond to the dashed Delaunay triangulation lines in Figure 8. Time history of maximum principal stress at midpoint locations between respective source locations (c) shows that the arrival of the maximum principal stresses (i.e., arrival of the P-waves at the midpoint) correspond to the predicted times of arrival given in Figure 8.
Symmetry 17 00555 g009
Figure 10. Abaqus/Explicit simulation of blast wave interaction in granite at (a) 4.9 μs; (b) 10.3 μs; and (c) 14.3 μs after blast initiation. The green zones indicate maximum principal stresses due to stress wave interaction, highlighted by white arrows; (d) time history of maximum principal stress showing largely compressive stresses during stress wave interactions; (e) map of maximum principal tensile stresses at 75 μs after blast initiation acting along Voronoi tessellation lines predicted in Figure 8; (f) Abaqus/Explicit simulation of blast wave interaction causing crack initiation and propagation. Dark zones indicate failed elements in the simulation, and the location and direction of crack bridging corresponds to the red Delaunay triangulation lines in Figure 8.
Symmetry 17 00555 g010
Figure 11. Abaqus/Explicit simulation results for fracture pattern and crack bridging in silicon carbide at (a) 5.3 µs, (b) 14.7 µs, and (c) 21.6 µs. The red zones indicate maximum principal tensile stresses due to stress wave interaction, highlighted by white arrows; (d) the time history of principal stresses at the midpoints show extremely large tensile stresses after the small initial compressive wave; (e) Abaqus/Explicit simulation of blast wave interaction shows crack initiation and bridging. Dark zones indicate failed elements in the simulation, and the location and direction of crack bridging corresponds to the red Delaunay triangulation lines in Figure 8. Partial onset of bridging between points A-B, A-C, and B-D are observed (red arrows).
Symmetry 17 00555 g011
Table 1. Edge lengths and comparison of peak stresses and times of arrival of P-waves (TOA) between analytical and simulation results for simplified rock model.
AnalyticalAbaqus Simulations
EdgeLength [mm] Max .   σ b b
[GPa]
t P [µs]Max. Principal
Tensile Stress [GPa]
t P [µs]
A-B231.33.2322.84.4722.2
A-C237.73.4423.53.1222.7
B-C209.32.2320.43.7216.4
B-D177.32.4317.05.7615.7
C-D64.97.734.89.195.0
Table 2. Comparison of times of arrival of P-waves (TOA) between Voronoi tessellation method and Abaqus simulation results for granite.
EdgeLength [mm]Prediction [µs]Simulation [µs]
A-B231.319.116.40
A-C237.719.715.90
B-C209.317.110.90
B-D177.314.211.70
C-D64.94.14.10
Table 3. Comparison of times of arrival of P-waves (TOA) between Voronoi tessellation method and Abaqus simulation results for silicon carbide.
EdgeLength [mm]Prediction [µs]Simulation [µs]
A-B231.38.79.05
A-C237.78.58.75
B-C209.37.66.30
B-D177.36.36.60
C-D64.91.82.05
Disclaimer/Publisher’s Note: The statements, opinions and data contained in all publications are solely those of the individual author(s) and contributor(s) and not of MDPI and/or the editor(s). MDPI and/or the editor(s) disclaim responsibility for any injury to people or property resulting from any ideas, methods, instructions or products referred to in the content.