Abstract
The importance of measurement error in studies of asymmetry has been acknowledged for a long time. It is now common practice to acquire independent repeated measurements of trait values and to estimate the degree of measurement error relative to the amount of asymmetry. Methods also allow obtaining unbiased estimates of asymmetry, both at the population and individual level. One aspect that has been ignored is potential between-individual variation in measurement error. In this paper, I develop a new method to investigate this variation in measurement error and to generate unbiased estimates of individual asymmetries. Simulations show that variation in measurement error can indeed result in biased estimates of individual asymmetry and that the proposed method adequately provides unbiased estimates. The method is applied to two empirical datasets and shows that, at least in some traits, substantial variations in measurement occur. The limitations of the model are discussed.1. Introduction
Developmental instability (DI), i.e., the sensitivity of a developing trait to random perturbations [1], is most often estimated by subtle, directionally random asymmetries (fluctuating asymmetry (FA)). For over half a century, DI and FA have been studied in relation to stress and fitness, and the results have been equivocal [2,3]. Initially, studies and analyses were mainly performed at the population level, where population FA was related to genetic and environmental stress. Since the early nineteen-nineties, research has also focused on individual FA. To a large extent, this was motivated by the results of a study on male tail asymmetry and their attractiveness to females in barn swallows [4] and presumed as evidence for a genetic basis of developmental instability [5]. However, in spite of a large body of research in a variety of species, research relating FA to measures of individual phenotypic quality and fitness remains highly equivocal [6,7]. This study does not aim to add to that specific aspect, but aims at developing a statistical model that may improve the estimation of individual asymmetries herewith increasing the power of the analysis of associations between individual FA and measures of quality or health.
While it remains largely unknown what biological factors cause variation among study systems, it has been repeatedly emphasized that measurement error can take up a large proportion of the variation in asymmetry and, as such, mask associations between DI and measures of stress and/or fitness [8–10]. Furthermore, directional asymmetry (DA) and/or antisymmetry (AS) may also complicate the identification of asymmetries due to developmental noise only (the so-called “real FA”) [1,8]. In order to separate this “real FA” from DA and AS, guidelines can be found in [8]. Palmer and Strobeck [8] were among the first to emphasize the importance of obtaining repeated measurements on both sides and to apply a two-way mixed effects Analysis of Variance (ANOVA) to identify the importance of measurement error (ME) and DA in asymmetry studies. This model was slightly modified into a likelihood framework to obtain unbiased estimates of individual FA [9,10]. The use of this mixed model provides unbiased estimates of both population level and individual level asymmetry, however, assuming a constant measurement error variance (the classic homoscedasticity assumption in linear models). To allow some differences in measurement error, this model was later extended in a Bayesian framework to explicitly model differences in ME between a priori identified groups of subjects [10]. In this way, individual asymmetry estimates are corrected for the appropriate degree of ME and correlate more closely with the existing morphological asymmetries [10]. The use of repeated measures and mixed model analysis to identify potential problems of ME and DA are now common practice in nearly all studies of FA and are crucial to be able to perform valid analyses of patterns in FA.
One aspect that has been ignored is the possibility that ME varies among groups of individuals for reasons that are not known a priori. Measurements of left and right sides have been collected from a very wide range of organisms and traits, using either direct measurements or measurements taken from pictures or scans. In any case, it is crucial to have clear predefined start- and end-points in order to be able to measure the trait accurately. It may, however, occur that those points are not always easy to determine, leading to sometimes more inaccurate measurements for some subjects compared to others, while such difficulties are seldom reported or taken into account. In many cases, one might decide to discard such individuals a priori, because they behave as outliers, but such an approach can be problematic. In addition, variation in the clarity of the start- and end-points on a trait may be more subtle, leading to variation in ME that cannot be evaluated easily. As a consequence, in spite of having a validated measurement protocol, a traditionally-applied mixed model, which assumes a common degree of ME (i.e., the residual variance of the model), can be expected to lead to biased asymmetry estimates for a whole range of individuals. Keeping in mind that, on average, ME can take up a high proportion of the amount of observed asymmetries (e.g., [8]), ignoring possible between-individual variation in ME can result in a substantial confounding between ME and FA and, thus, invalid analyses of patterns in individual FA. The model I develop here can thus also be viewed as a way to validate the measurement protocol.
In this paper, I develop a new model that allows evaluating the amount of variation in ME and provides estimates of individual asymmetry that are appropriately corrected for this heterogeneity in ME. Below, I first develop the model. Next, I perform a set of simulations to illustrate if and when heterogeneity in ME results in a poorer estimation of individual asymmetries in the sense that they correlate more weakly with the true asymmetry values. Finally, I show that the newly-developed model does provide estimates that more closely reflect the true asymmetries. I apply this model to two real datasets to provide estimates of variation in measurement error in data collected on the basis of pictures and collected in the field.
2. Materials and Methods
2.1. Description of the Statistical Model
In order to model heterogeneity in measurement error of unknown origin, I propose a relatively simple and straightforward extension of the mixed regression model [9], where side is treated as a continuous covariate and individual and the individual-times-side interaction as random effects. The observed trait value y in individual i on side j is modeled as follows:
Between-individual variation in asymmetry (b1,i) is assumed to follow a normal distribution with an individual-specific variance, reflecting the individual-specific level of developmental instability (see also [10]):
The between-individual variation in developmental instability was assumed to follow a gamma-distribution at the level of the standard deviation (see also [11,12] for more details) with shape and rate parameters indicated as α1 and β1:
At this point, I have used the same model as developed in earlier papers with respect to measurement error and variation in developmental instability [11,12]. To examine sources of variation in measurement error of unknown origin, this model is extended using a mixture type of analysis, assuming that the residual values follow a normal distribution with zero mean and error variance being specific for each individual. This is parameterized as follows:
In the same way as for between-individual variation in DI, between-individual variation in ME was assumed to follow a gamma distribution at the level of the standard deviation with shape and rate parameters indicated as α2 and β2:
The mean and variance of a gamma distribution can be calculated as α/β and α/β2, respectively. In the simulations below, different levels of coefficients of variation (i.e., standard deviation/mean) will be used to illustrate the effects on individual asymmetry values.
Note that this model does not incorporate antisymmetry or possible mixtures of “real FA” with antisymmetry and/or directional asymmetry. These aspects are not related to measurement error and, thus, not incorporated here. The between-individual variation in ME, however, can be incorporated in the mixture approach developed by Van Dongen et al. [13].
2.2. Parameter Estimation
The parameters of the above model will be estimated using the Monte Carlo Markov chain (MCMC) methodology in a Bayesian setting. In all simulations and analyses below, weak uninformative priors were used. For parameters βs and βDA, a normal distribution with mean equal to zero and variance equal to one million were chosen. For the between-individual variation in trait size ( , a uniform prior between 0 and 1000 was imposed at the level of the standard deviation. Finally, for the size and shape parameters of the gamma distributions, also a uniform prior between 0 and 1000 was used.
Posterior distributions of the parameters of interest were summarized by their posterior mean and standard deviation. Posterior distributions were obtained by running 5 independent chains of length 5000, after a burn-in of 10,000 iterations and thinning of 100. In this way, within-chain autocorrelation was minimized, and convergence was obtained rapidly. Analyses were performed in Openbugs [14].
2.3. Simulations
First, to illustrate the possible effects of between-individual variation in measurement error on the estimates of individual asymmetry, a series of simulations was performed in which for each the coefficient of determination was calculated for the regression model with the true simulated asymmetry value as the explanatory variable and the estimated individual asymmetries from the mixed regression model proposed by Van Dongen et al. [9] (thus, uncorrected for the variation in ME) as the response variable. In each simulation, true underlying asymmetry values were generated for 10,000 subjects. For each subject, the level of developmental instability ( ) was sampled from a gamma distribution with shape and rate parameters equal to 1. Individual asymmetry was then sampled from a normal distribution with mean equal to zero and variance equal to . This resulted in asymmetry values following a mixture of normal distributions of which, overall, the mean equaled zero and the overall variance equaled 1.
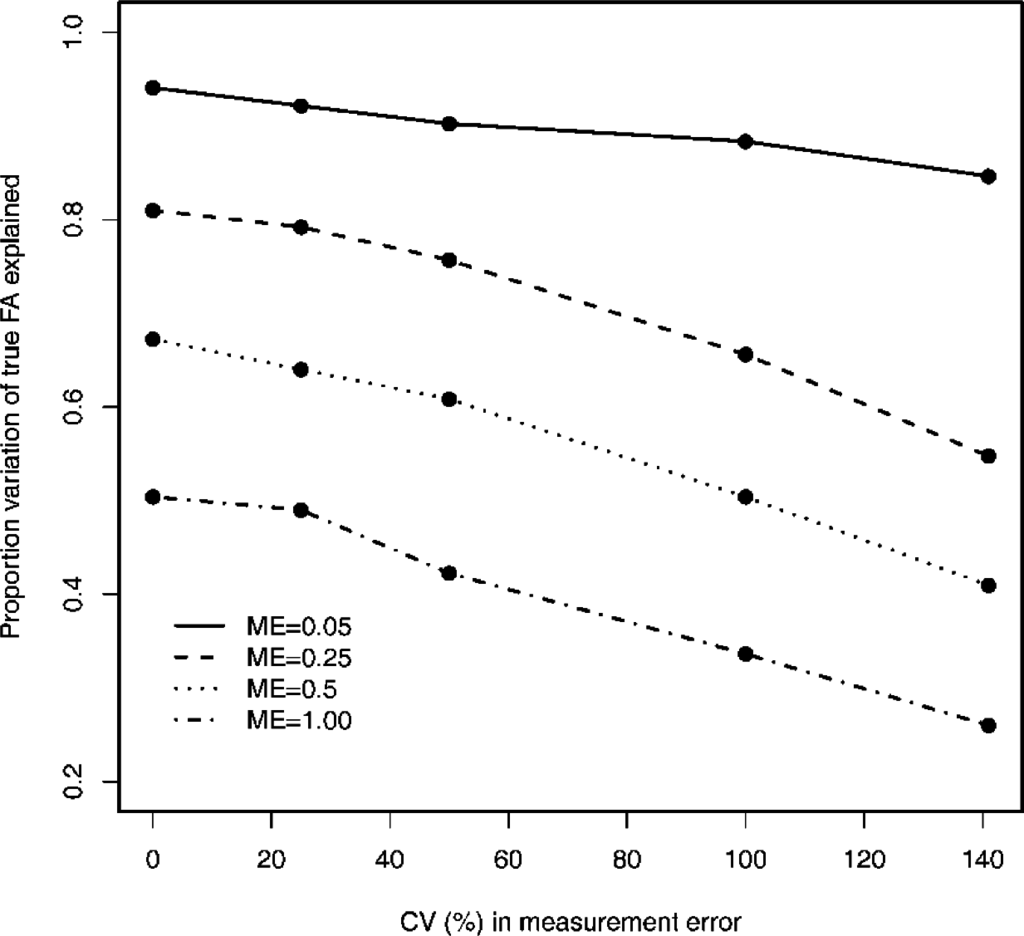
Four sets of simulations were performed with different levels of ME and the coefficient of variation (CV) in order to cover a wide range of possible values observed in empirical datasets. The average degree (variance) of measurement error was equal to 0.05, 0.25, 0.5 or 1 in these four simulations, respectively. In each of these sets of simulations, five different degrees of between-individual variation in ME were simulated (CV = 0, 0.25, 0.5, 1 and 1.41, respectively). Between-individual variation was simulated by obtaining individual ME-variances from gamma distributions with the following shape and rate values: CV = 0.25: shape = rate = 16; CV = 0.5: shape = rate = 4; CV = 1: shape = rate = 1; CV = 1.41: shape = rate = 0.5. Each of these distributions shows an average of 1. To simulate lower levels of ME, the individual ME-variances were multiplied by 0.05, 0.25 or 0.5, respectively. Changes in the coefficients of determination of the regression of estimated versus expected individual asymmetries with increasing levels of ME and variation in ME will be presented graphically.
Second, to illustrate that the proposed Bayesian model is capable of producing corrected asymmetry variables adequately taking the between-individual variation in ME into account, a simulated dataset was analyzed using the mixed regression model [9] and the Bayesian model with variation in ME as developed in this paper. I restricted this aspect to one simulation of 1000 individuals, as described above, with average ME equal to 1 and its coefficient of variation equal to 1 (average ME = 0.25, CV = 0.5). Other combinations consistently confirmed the result (details not shown).
2.4. An Application of the Model
The method developed here was applied to two datasets. The first dataset had been studied before to investigate associations between developmental instability and life history traits in post-menopause woman from Finland (see [15] for details). On the basis of landmarks digitized on scans of the hands, the length (among other traits) of Digits 2, 3, 4 and 5 and hand palm width were obtained repeatedly on both sides and expressed in 0.1-mm units. Data were available for 223 women. The second dataset contains unpublished data of the great tit (Parus major) tarsus and wing lengths collected in 2007 in the region of Antwerp, Belgium. Tarsus lengths were determined by digital calipers with up to a 0.01-mm accuracy, while wing lengths were obtained using a ruler up to a 0.5-mm accuracy. Tarsus lengths were determined three times independently on each side, while wing lengths were measured twice on each side. For each trait in both datasets, the above model was applied and the posterior distributions summarized. In addition, the distribution of the between-individual variation in measurement error was explored graphically for those traits showing relatively high coefficients of variation (see below).
3. Results and Discussion
3.1. Simulations
As expected, the coefficient of determination of the regression analysis of the estimated (uncorrected for variation in ME) and true underlying individual asymmetries decreased with the increasing degree of measurement error (Figure 1). In addition, coefficients of determination decreased with increasing between-individual variation in ME. This decrease was strongest and of similar magnitude when the average level of ME equaled 0.25 or more (Figure 1). Finally, the decrease was relatively small when the coefficient of variation of between-individual variation in ME equaled 25%, but became stronger for values of 50% and higher (Figure 1).
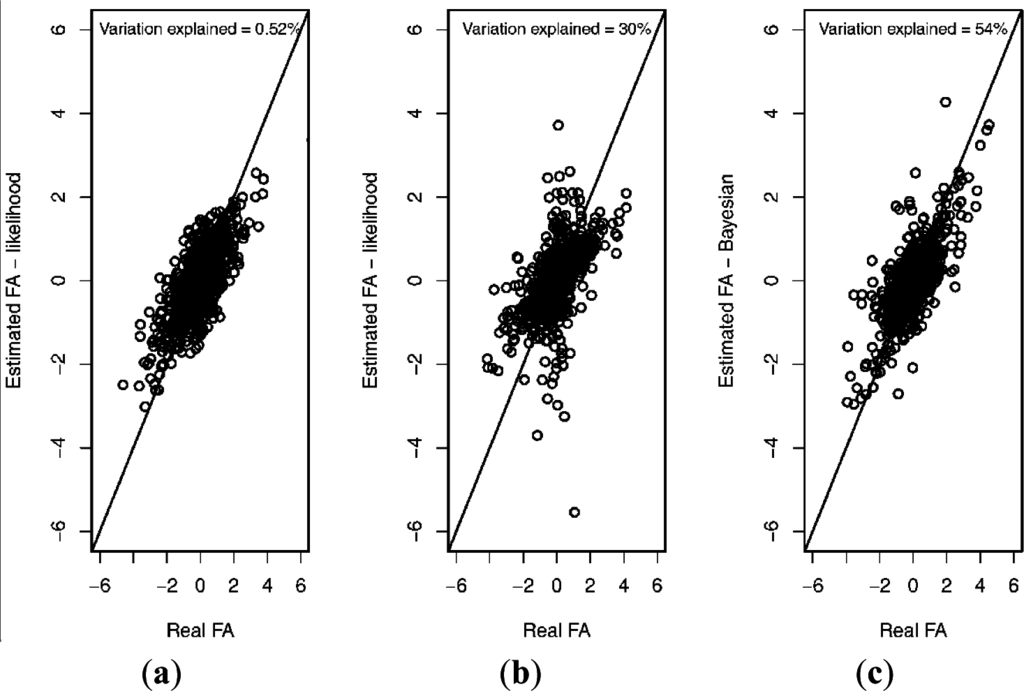
The reason for this decrease can be found in Figure 2. The left panel shows the association between the true and estimated asymmetries in the absence of between-individual variation in ME, where the level of ME and FA were equal to one (i.e., using the appropriate mixed regression model [9]). The observed coefficient of determination equaled 0.52 (Figure 2). Introducing between-individual variation in ME (CV = 100%) in the simulation of the data, but ignoring this in the estimation of individual asymmetries (again, using the mixed regression model [9], which is now not appropriate) resulted in a much smaller coefficient of determination (i.e., r2 = 0.30; see also Figure 1), apparently mainly as a consequence of a limited number of asymmetry estimates being largely under- or over-estimates (Figure 2). These observations correspond to individuals with relatively high ME (values not shown). However, applying the Bayesian model developed in this paper resulted in a coefficient of determination similar to the one obtained in the absence of between-individual variation in ME (i.e., r2 = 0.54) (right panel in Figure 2), and the plot did not show such large over- or under-estimates of individual asymmetry values (Figure 2). It can therefore be concluded that the newly proposed model leads to unbiased estimates of individual asymmetry in the presence of variation in measurement error.
3.2. Application of the Model
Table 1 gives an overview of parameter estimates and properties of the distribution of variation in developmental instability and measurement error. Most traits (except Digit 4 (D4)) showed directional asymmetry, which was right biased, except for D5, which was left biased (Table 1). In all traits, the average level of asymmetry was larger than the average measurement error. For all traits, variation in developmental instability was quite low (Table 1).

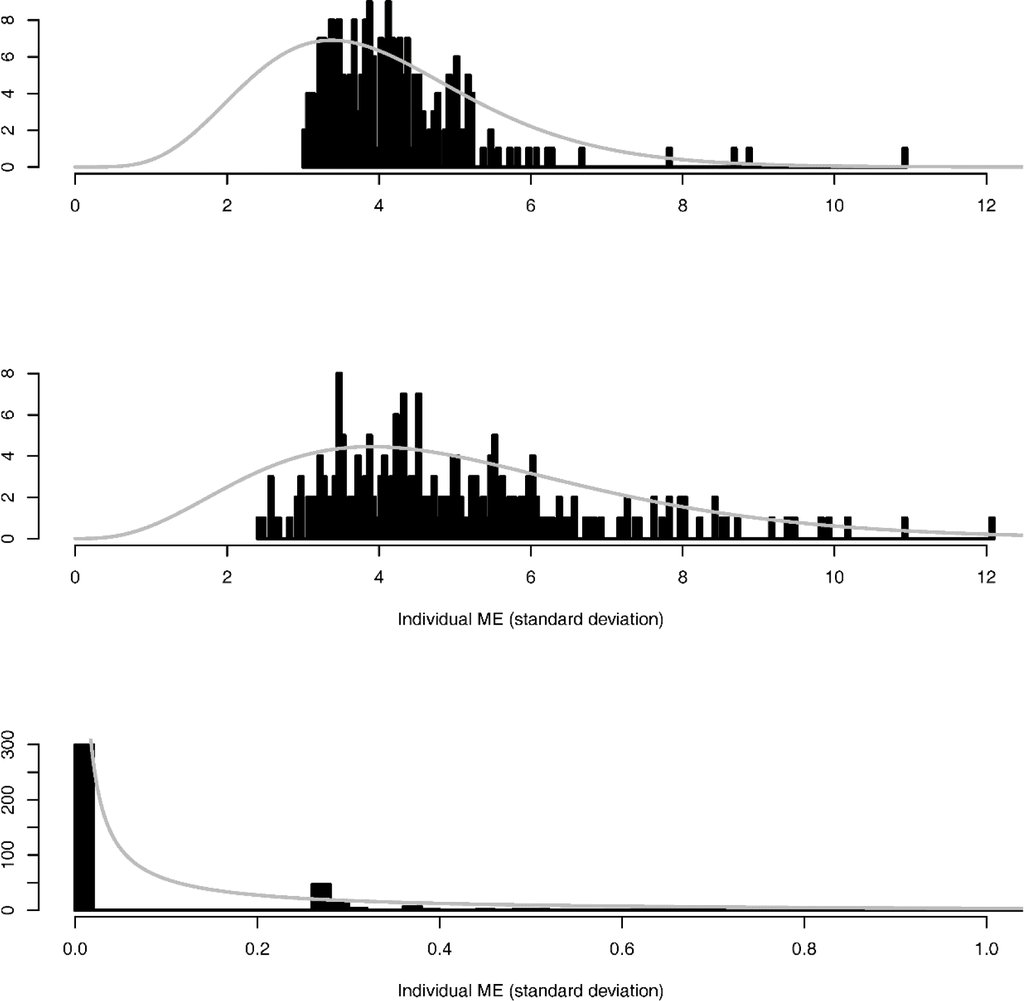
With respect to the variation in measurement error, in three traits, the coefficient of variation was above 0.4, which can be considered as influential on the basis of the above simulations. When investigating the distribution, for D2 in the human hand, variation in individual ME was somewhat skewed where many varied around four and a few individuals showed ME above six (Figure 3). For this trait, the estimated gamma distribution does not appear to fit well for the smaller values of individual ME (Figure 3). For D4, the distribution appears less skewed and somewhat wider, and there appears to be a better fit of the estimated gamma distribution (Figure 3). Finally, for wing length in great tits, the coefficient of variation in ME was extremely high, which appears to be an artifact of the crude measurements (up to a 0.5-mm accuracy in this case). The distribution shows three peaks (Figure 3). The first one appeared to correspond to subjects without measurement error, the second with individuals, where, on one side, the two repeated measurement differed by 0.5 mm, and a third peak corresponding to individuals, where repeated measurements differed by 0.5 mm on both sides. This suggests that the proposed model is not appropriate for these types of traits.
4. Concluding Remarks
In this paper, I expanded upon the traditional mixed model approach to allow for between-individual variation in measurement error implementing a mixture approach [11,12]. The importance of measurement error in studies of asymmetry has been acknowledged for a long time. The application of a mixed two-way ANOVA to obtain unbiased estimates of FA was introduced by Leamy [16] and strongly advocated by Palmer and Strobeck [8]. Since then, the method has been widely applied and only slightly modified to be able to obtain unbiased individual asymmetries [9] and to allow ME to differ between known groups of subjects, like measurements from different observers [10]. To what extent measurement error differs among subjects has never been studied before. Simulations showed that the influence of variation in ME becomes substantial when the coefficient of variation of ME equals 50% or more. Unbiased estimates of individual asymmetry can be obtained correctly with the proposed model. When analyzing two empirical datasets, some traits did show relatively high variation in ME. The application of this new model will allow a systematic study of the amount of variation in ME and how it is distributed in a broad range of species and traits. It will not only provide better insights into the amount of variation in ME that is present, but also yield improved estimates of individual FA and, thus, more powerful statistical analyses. Nevertheless, further attention is required to understand the implications of the lack of fit of the imposed gamma distribution for small levels of ME (as observed in Digit 2 of the human hand dataset) and to possibly adapt the model for traits with low accuracy relative to the amount of asymmetry.
Acknowledgments
I thank John Graham for inviting me to contribute this paper. Two anonymous reviewers provided constructive input for improving the manuscript. Great tit measurements were performed by Xavier Baecke.
Conflicts of Interest
The author declares no conflict of interest.
References
- Klingenberg, C.P. A developmental perspective on developmental instability: Theory, models and mechanisms. In Developmental Instability: Causes and Consequences; Polak, M., Ed.; Oxford University Press: New York, NY, USA, 2003; pp. 14–34. [Google Scholar]
- Polak, M. Developmental Instability: Causes and Consequences; Oxford University Press: New York, NY, USA, 2003. [Google Scholar]
- Van Dongen, S.; Gangestad, S.W. Human fluctuating asymmetry in relation to health and quality: A meta-analysis. Evolut. Hum. Behav. 2011, 32, 380–398. [Google Scholar]
- Møller, A.P. Female swallow preference for symmetrical male sexual ornaments. Nature 1992, 357, 238–240. [Google Scholar]
- Møller, A.P.; Thornhill, R. A meta-analysis of the heritability of developmental stability. J. Evolut. Biol. 1997, 10, 1–16. [Google Scholar]
- Houle, D. Comment on “A meta-analysis of the heritability of developmental stability” by Moller and Thornhill. J. Evolut. Biol. 1997, 10, 17–20. [Google Scholar]
- Palmer, A.R.; Strobeck, C. Fluctuating asymmetry and developmental stability: Heritability of observable variation vs. heritability of inferred cause. J. Evolut. Biol. 1997, 10, 39–49. [Google Scholar]
- Palmer, A.R.; Strobeck, C. Fluctuating asymmetry: Measurement, analysis, patterns. Annu. Rev. Ecol. Syst. 1986, 17, 391–421. [Google Scholar]
- Van Dongen, S.; Molenberghs, G.; Matthysen, E. The statistical analysis of fluctuating asymmetry: REML estimation of a mixed regression model. J. Evolut. Biol. 1999, 12, 94–102. [Google Scholar]
- Van Dongen, S. Unbiased estimation of individual asymmetry. J. Evolut. Biol. 2000, 13, 107–112. [Google Scholar]
- Van Dongen, S.; Talloen, W.; Lens, L. High variation in developmental instability under non-normal developmental error: A Bayesian perspective. J. Theor. Biol. 2005, 236, 263–275. [Google Scholar]
- Van Dongen, S.; Møller, A.P. On the distribution of developmental errors: Comparing the normal, gamma, and log-normal distribution. Biol. J. Linn. 2007, 92, 197–210. [Google Scholar]
- Van Dongen, S.; Lens, L.; Molenberghs, G. Mixture analysis of asymmetry: Modelling directional asymmetry, antisymmetry and heterogeneity in fluctuating asymmetry. Ecol. Lett. 1999, 2, 387–396. [Google Scholar]
- OpenBugs. Available online: http://www.openbugs.net/w/FrontPage accessed on 12 December 2014.
- Van Dongen, S.; Sprengers, E.; Helle, S. Hand asymmetry does not relate to key life history traits in post-menopausal contemporary Finnish women. PLoS ONE 2012, 7, 1–6. [Google Scholar]
- Leamy, L. Morphometric studies in inbred and hybrid house mice. V. directional and fluctuating asymmetry. Am. Nat. 1984, 123, 579–593. [Google Scholar]
© 2015 by the authors; licensee MDPI, Basel, Switzerland This article is an open access article distributed under the terms and conditions of the Creative Commons Attribution license (http://creativecommons.org/licenses/by/4.0/).