Article

Micro-Raman Spectroscopy Assessment of Chemical Compounds of Mantle Clinopyroxenes

by
Anastasiya D. Kalugina
1,2 and
Dmitry A. Zedgenizov
1,2,*
1
Geology and Geophysics Department, Novosibirsk State University, 630090 Novosibirsk, Russia
2
V.S. Sobolev Institute of Geology and Mineralogy, Siberian Branch of Russian Academy of Science, 630090 Novosibirsk, Russia
*
Author to whom correspondence should be addressed.
Minerals 2020, 10(12), 1084; https://doi.org/10.3390/min10121084
Submission received: 18 November 2020 / Revised: 30 November 2020 / Accepted: 1 December 2020 / Published: 2 December 2020

Abstract

:
The composition of clinopyroxenes is indicative for chemical and physical properties of mantle substrates. In this study, we present the results of Raman spectroscopy examination of clinopyroxene inclusions in natural diamonds (n = 51) and clinopyroxenes from mantle xenoliths of peridotites and eclogites from kimberlites (n = 28). The chemical composition of studied clinopyroxenes shows wide variations indicating their origin in different mantle lithologies. All clinopyroxenes have intense Raman modes corresponding to metal-oxygen translation (~300–500 cm−1), stretching vibrations of bridging O-Si-Obr11~670 cm−1), and nonbridging atoms O-Si-Onbr16~1000 cm−1). The peak position of the stretching vibration mode (ν11) for the studied clinopyroxenes varies in a wide range (23 cm−1) and generally correlates with their chemical composition and reflects the diopside-jadeite heterovalent isomorphism. These correlations may be used for rough estimation of these compounds using the non-destructive Raman spectroscopy technique.

1. Introduction

Mineral inclusions in natural diamonds carry important information about the chemical physical conditions of the Earth’s mantle. The sources of mineral inclusions in diamonds can be divided into three common parageneses: peridotite, eclogite, and rare websterite types. The major inclusions of the peridotite associations are olivine (forsterite), orthopyroxene (enstatite), garnet (Cr-rich pyrope), Cr-spinel (chromite), clinopyroxene (Cr-diopside), and Fe-Ni-sulfides; eclogite associations are usually represented by garnet (pyrope-almandine-grossular), clinopyroxene (omphacite), quartz (coesite), and Fe-sulfides [1]. Websteritic inclusions are generally presented by clinopyroxene and orthopyroxene, which associate with garnet and olivine in some rare cases.
Clinopyroxenes of different parageneses are considerably diverse in their chemical composition. Peridotite clinopyroxenes are represented by Cr-diopside with Na2O < 6 wt.%, Cr2O3 0.6–2.4 wt.%, and Mg#~0.92–0.94. Eclogite clinopyroxene (omphacite) has a jadeite component (NaAl[Si2O6]) varying from 10% to 60% and Cr2O3 < 0.4% and Mg# < 80% [2]. Peridotite and eclogite clinopyroxene inclusions can be distinguished by the borderline of the Cr# (Cr/(Cr + Al)) molar ratio ranging from 0.07 to 0.10 (Figure 1a). Taylor and Neal (1989) subdivided eclogites by clinopyroxenes jadeite components into three groups: (1) group A eclogites (high-pressure igneous cumulates formed as dikes within the upper mantle) with low-jadeite clinopyroxenes; (2) group B eclogites with moderate-jadeite clinopyroxenes (metamorphic products of a subducted oceanic crustal protolith); and (3) group C eclogites (a relic of the Earth’s primary differentiation shortly after accretion) with high-jadeite clinopyroxenes (Figure 1b) [3]. Websterite clinopyroxenes cannot be determined with certainty, and they are considered to be transitional in composition between clinopyroxenes of peridotite and eclogite.
The analysis of the chemical composition of inclusions traditionally involves the partial destruction of the samples, e.g., study of the chemical composition of inclusions in diamonds by EPMA (electron probe microanalysis) requires specific sample preparation, such as polishing or crushing of the host. Therefore, the methods of study of mineral inclusions using non-destructive methods are becoming more demanded [4,5,6,7,8,9]. Raman spectroscopy is an alternative high-resolution non-invasive non-destructive technique, which provides information about specific vibrations in solid materials reflecting the chemical and structural features of minerals, including those presented as inclusions in natural diamonds. In this study, we present new data on the Raman spectroscopic characteristics of clinopyroxenes inclusions in natural diamonds and clinopyroxenes from the series of peridotite and eclogite xenoliths from kimberlite. These data are used to define the correlations between Raman features of mantle clinopyroxenes and their chemical composition.

2. Materials and Methods

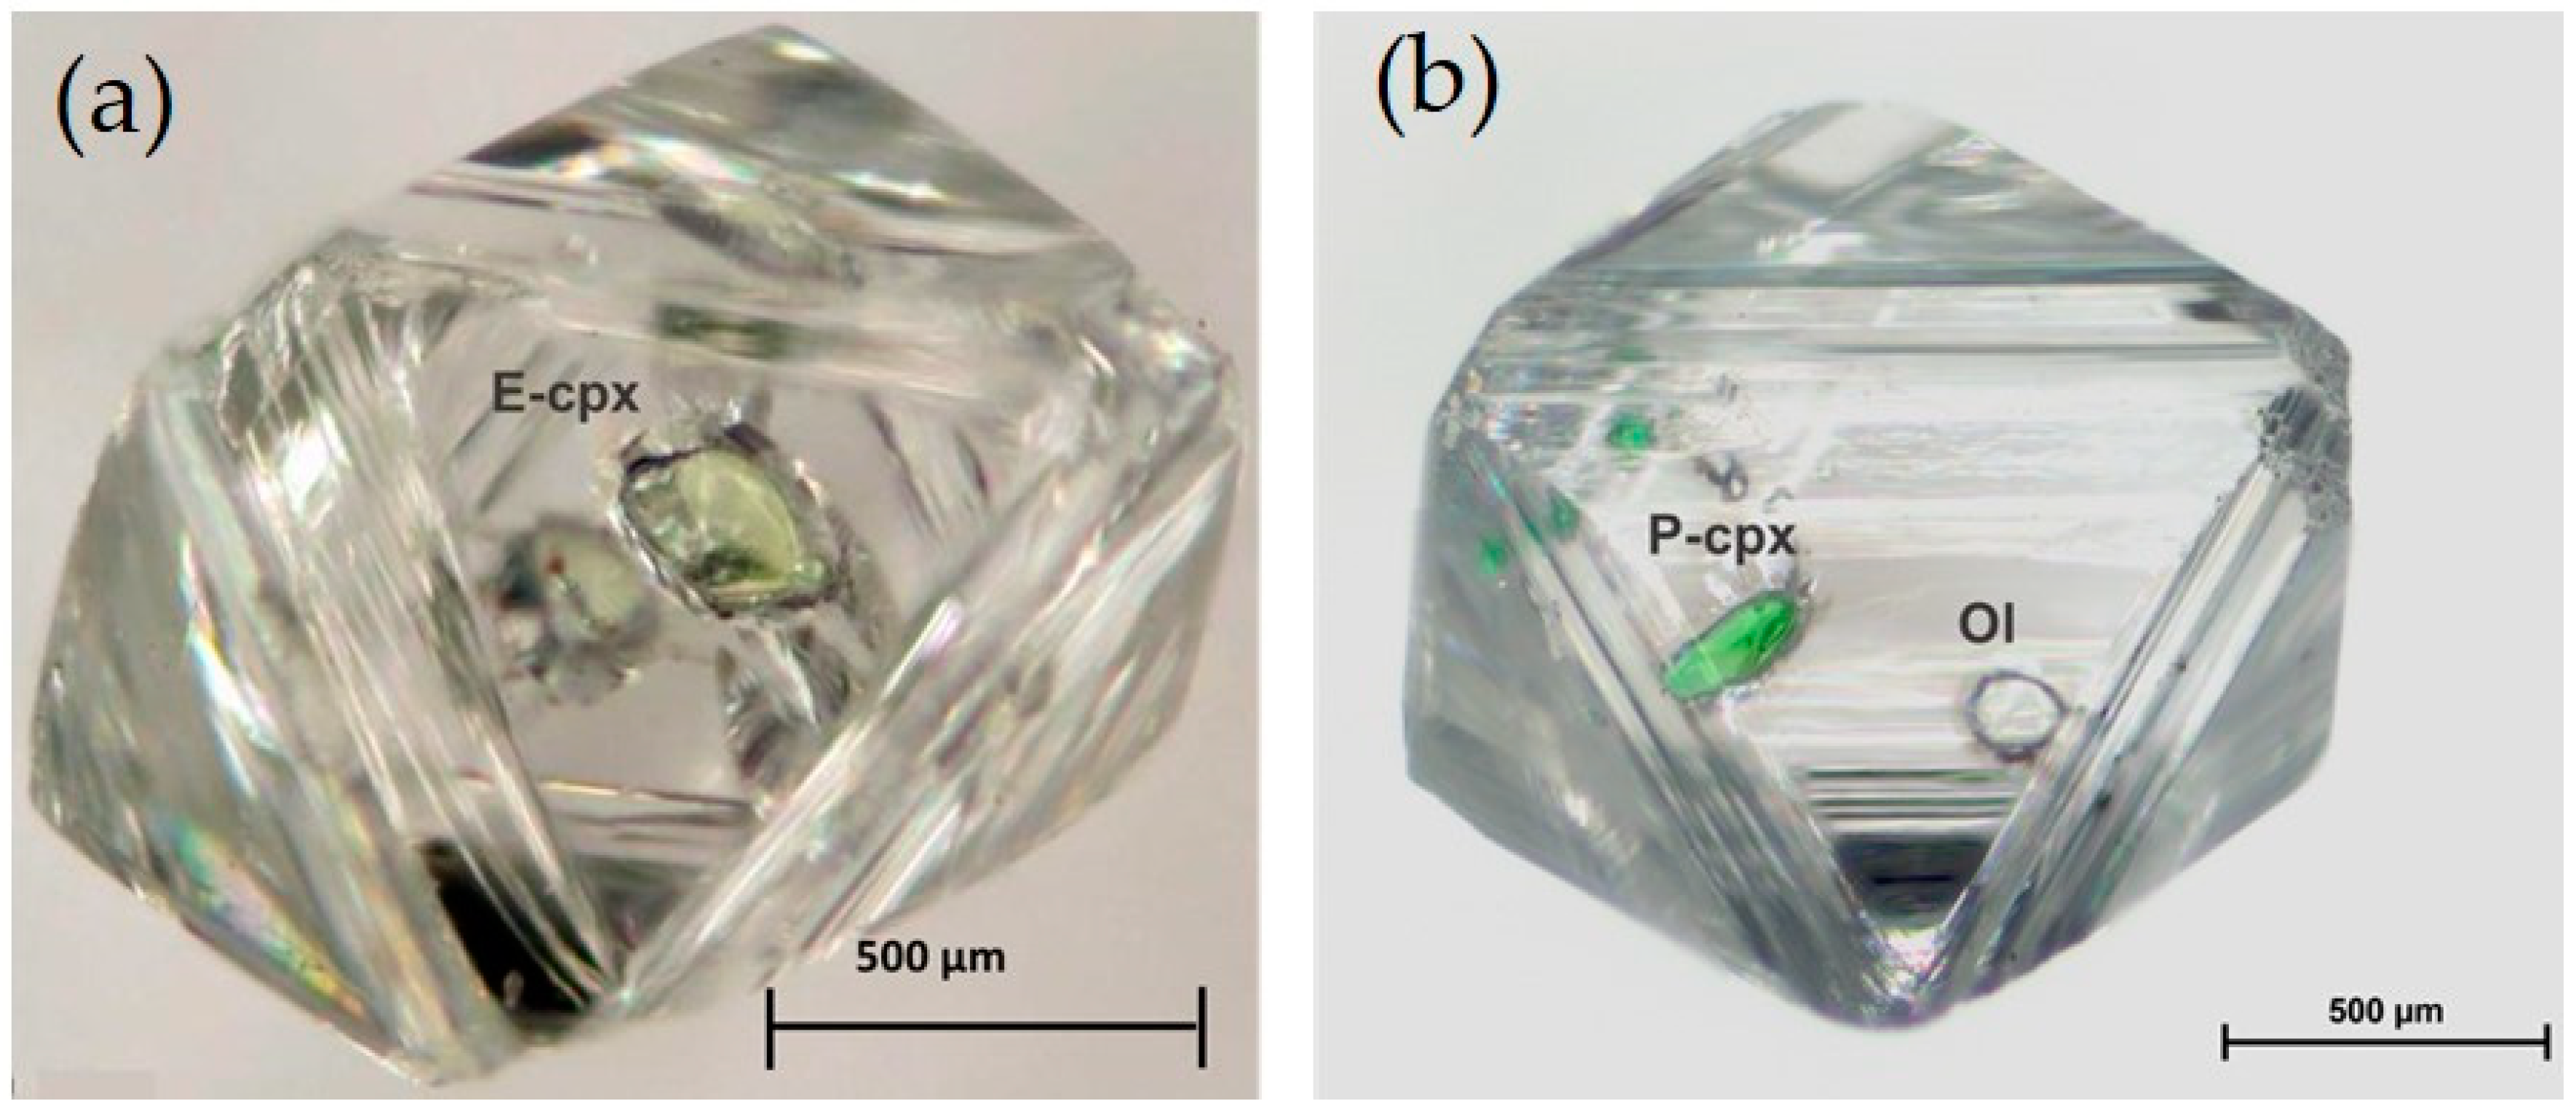
In total, 51 natural diamonds were selected from different occurrences of Yakutian diamondiferous province (Internatsional’naya (n = 9), Yubileynaya (n = 4), Udachnaya (n = 4), Mir (n = 1), Komsomolskaya (n = 1), Nyurbinskaya (n = 2) kimberlite pipes, Ebelyakh river deposits (n = 30)). The studied diamonds were represented by both octahedral and rounded dodecahedral crystals with the inclusions of peridotite or eclogite parageneses (Figure 2). The sample preparation includes polishing of a diamond parallel to the (110) plane in order to recover the inclusions to the surface for further analysis of chemical composition by EMPA. Some inclusions were examined by Raman spectroscopy before and after the polishing and several fully extracted inclusions from diamond were studied to avoid the ambiguity as clinopyroxene inclusions may be affected by the residual strain of a diamond host [10,11]. In total, 28 clinopyroxene grains were also selected from peridotite (n = 8) and eclogite (n = 20) xenoliths from Udachnaya kimberlite pipe. The characterization of the clinopyroxenes from these samples is provided in [12,13].
The chemical composition of the clinopyroxenes was determined on a JEOL JXA-8100 electron probe microanalyzer (EPMA), equipped with five wavelength-dispersive spectrometers and an energy-dispersive (EDX) spectrometer at an accelerating voltage of 20 kV and probe current of 100 nA. The beam diameter was 1–3 μm. The ZAF correction routine were applied. Natural standards were used: BD (diopside), O-145 (pyrope), Ud-92 (Cr-pyrope)—Lavrent’ev et al. (2015) [14]. The chemical composition of some clinopyroxene inclusion was taken from the published data (MT, HI—[15]; NBI—[16]; Ud10—[17]).
Raman spectra were collected using a Horiba Jobin Yvon LabRAM HR800 Raman microspectrometer with a multichannel air-cooled (−70 °C) CCD detection system and a 532-nm Nd:YAG laser, equipped with an Olympus BX41 microscope (×50). Spectra were recorded in back-scattering geometry in the range 100–1200 cm−1, through 7–10-s exposure and 10–15 acquisitions. The width of slit was 100 μm and the power of the laser was 10 mW. The spectra were calibrated using known emission lines of the Ne-lamp, also the Si-band at 520.6 cm−1 was used for monitoring of the frequencies of the Raman spectra. Additionally, the spectra were obtained at different crystallographic orientations via rotation (for each 15°) because some modes can change their intensity and disappear or are overlapped [18]. The spectroscopic software OPUS 8.2. (Bruker Optik GmbH, Ettlingen, Germany) was used for manipulation with spectra: the peak position was obtained by a regression least-squares curve fitting calculation using a Gaussian–Lorentzian mixed peak shape and baseline correction. This procedure yields a precision for peak of ±0.5 cm–1.

3. Results

Most of the studied inclusions are presented by clinopyroxenes, which correspond to either peridotite (n = 16) or eclogite (n = 34) parageneses and single inclusion (Cr# 0.08 and Mg# 0.89) falls into the field of compositions transitional between these two principal parageneses (Figure 1a,b). The inclusions of peridotite clinopyroxene are Cr-rich diopside (Cr2O3 0.31–5.74 wt.%, CaO 12.81–22.9 wt.%, MgO 12.25–18.3 wt.%) with relatively low FeO 1.81–3.45 wt.%, Al2O3 0.31–5.41 wt.%, and Na2O 0.28–5.09 wt.%. They have relatively high Mg# 0.87–0.94 and Cr# 0.17–0.64. The inclusions of eclogite clinopyroxenes are omphacites (Na2O 3.12–8.12 wt.%, Al2O3 4.46–17.9 wt.%, CaO 9.81–17.2 wt.%, MgO 5.65–15.1 wt.%, FeO 2.22–11.4 wt.%). These clinopyroxenes have low Cr2O3 < 0.3 wt.% and wide variation of Mg# from 0.57 to 0.87. Most studied clinopyroxene inclusions fall into the range of clinopyroxenes of groups B and C eclogites and rare inclusions correspond to clinopyroxenes of group A eclogites (Figure 1b) [3].
The clinopyroxenes from peridotites have a limited variation of composition (MgO 16.2–20 wt.%, FeO 1.92–4.62 wt.%, CaO 17–20.7 wt.%, Na2O 2.01–7.01 wt.%, Al2O3 0.82–2.71 wt.%, Cr2O3 0.80–1.21 wt.%) with high Mg# 0.87–0.94 and Cr# 0.17–0.45. The clinopyroxenes from eclogites show wider compositional variations (MgO 6.98–15.6 wt.%, FeO 1.41–7.16 wt.%, CaO 10.6–20.3 wt.%, Na2O 2.25–7.24 wt.%, Al2O3 3.37–15.3 wt.%) with lower Cr2O3 content (<0.3 wt.%) and Mg# 0.72–0.91. Most of these clinopyroxenes from eclogites belong to group B (n = 14), four samples belong to group A and two belong to group C. All clinopyroxenes display positive sufficient correlations between CaO and MgO (r = 0.80) and between Na2O and Al2O3 (r = 0.94), and negative correlations between CaO and Na2O (r = −0.92) and between MgO and Al2O3 (r = −0.95). These correlations correspond to diopside-jadeite isomorphism in clinopyroxene (Table 1).
The structure of clinopyroxene is known to consist of SiO4-tetrahedra chains parallel to [001] linked by cation layers of M1O6-octahedron and M2O8-coordinated polyhedral. The factor group analysis of the clinopyroxene structure (C2/c) defines 30 Raman active modes (14Ag + 16Bg) [19,20,21,22,23]. The Raman spectra of the studied clinopyroxenes generally exhibit several intense modes near ~300–500, 670, and 1000 cm−1 assigned to metal-oxygen translation, stretching vibrations of bridging O-Si-Obr11), and non-bridging atoms O-Si-Onbr16), respectively (Figure 3). Raman modes in the metal-oxygen translation range overlap and it is difficult to separate each peak by fitting. The O-Si-Onbr mode (ν16) of clinopyroxenes shows the peak position shifting from 1010 to 1025 cm−1, which depends on the composition. The intensities of this mode depend on the crystal orientation, and the Raman shift (up to 7 cm−1) in different crystallographic orientations of single inclusion is possible. The peak positions of the stretching O-Si-Obr mode vary in the range up to 23 cm−1 for the clinopyroxenes of different compositions (665.6–675.5 cm−1 for peridotite clinopyroxene inclusions and 673.8–688.2 cm−1 for eclogite clinopyroxene inclusions; 666.8–670.9 cm−1 for clinopyroxenes from peridotites and 671.5–687.2 cm−1 for clinopyroxenes from eclogites). This mode has only slight variations (always <0.7 cm−1) in the different crystallographic orientations of the studied clinopyroxenes. The peak position frequencies of the stretching O-Si-Obr mode for the studied clinopyroxene from the same inclusions in diamonds before and after polishing have discrepancies less than 0.79 cm−1 (Appendix A, Figure A1). Thus, the stretching O-Si-Obr mode may be precisely fitted and seems to be most suitable for estimation of the possible dependencies with composition.

4. Discussion

The elements can continuously substitute each other in the structure of clinopyroxene (e.g., diopside CaMg[Si2O6]—omphacite Na0.5Ca0.5Mg0.5Al0.5[Si2O6]—jadeite NaAl[Si2O6] join in eclogite clinopyroxenes and diopside CaMg[Si2O6]—cosmochlor NaCr[Si2O6] joins in peridotite clinopyroxenes) [24]. Isostructural substitutions of the cations influence the lengths and angles of bonds, which changes the energy of Si-O vibrations and, consequently, the wavenumbers of Raman peak positions. In clinopyroxenes, heterovalent isomorphism Na+Al3+—Ca2+Mg2+ affects Raman shifts close to linear [18]. These Raman shifts may be calibrated with the chemical composition of clinopyroxenes obtained by other techniques. It makes it possible to use the Raman technique for quantitative estimation of the contents of the major chemical compounds of this mineral.
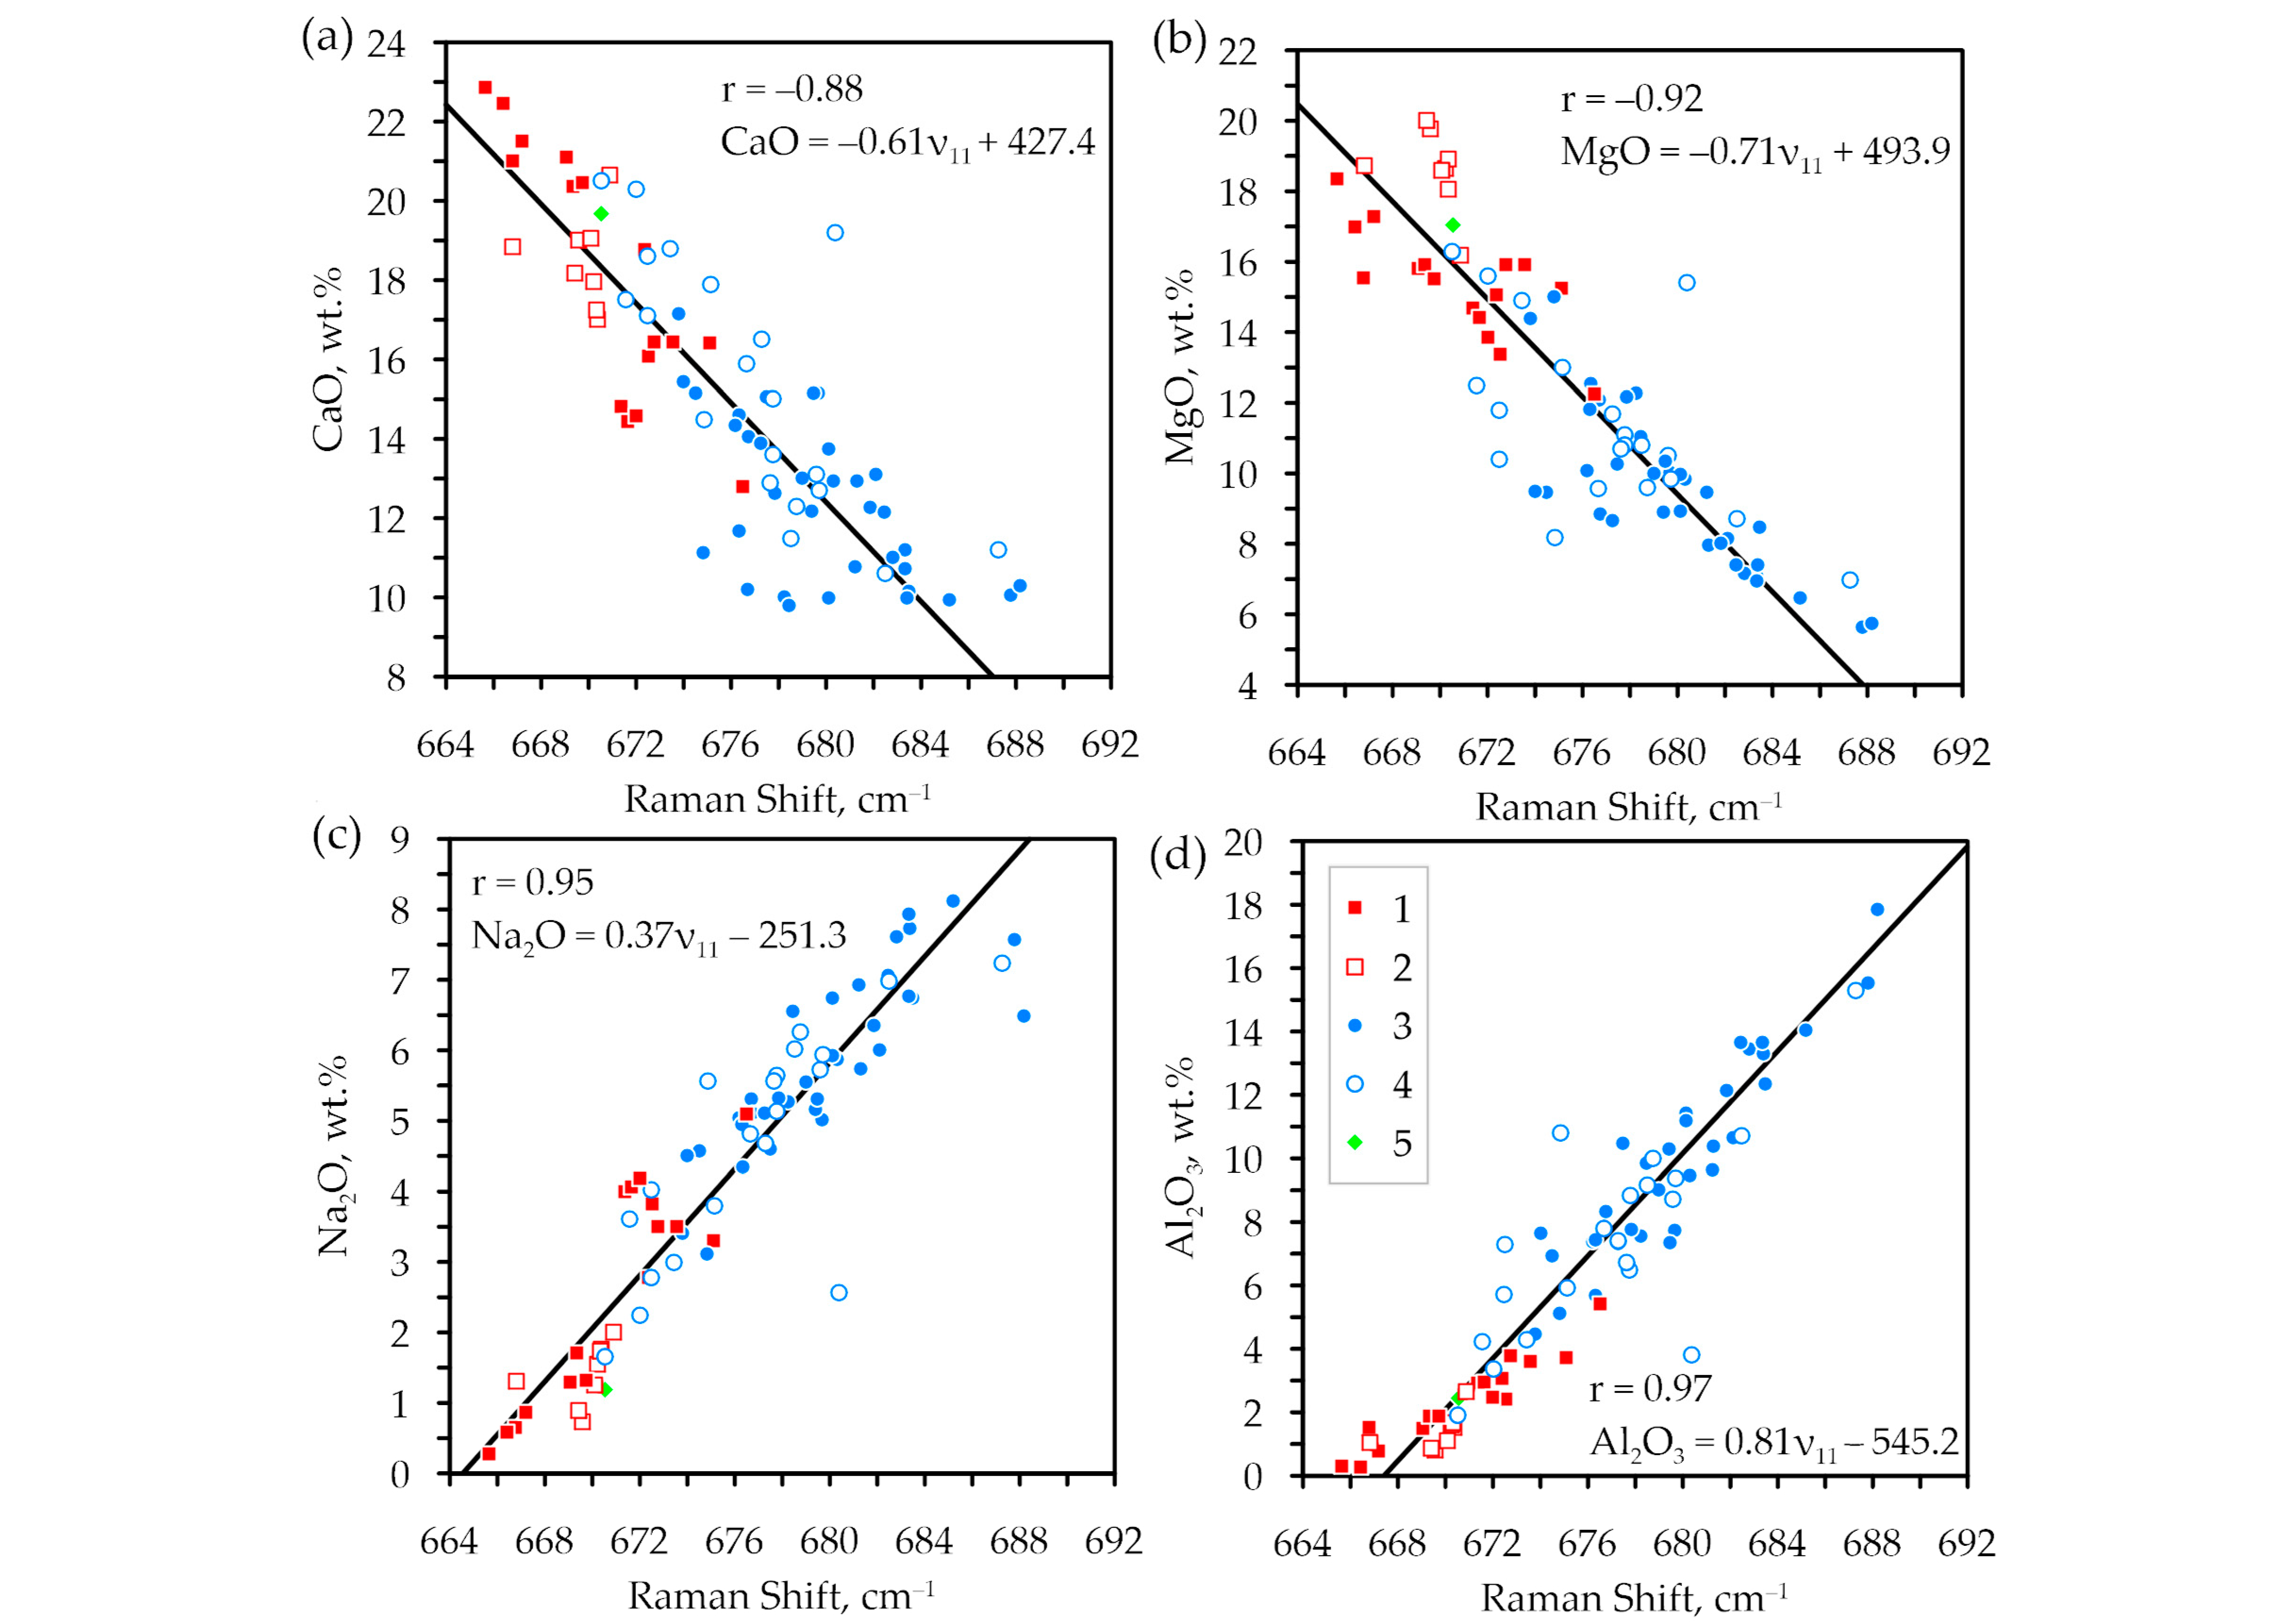
We compared the peak position frequencies of the stretching O-Si-Obr mode (ν11) with the chemical composition of the studied clinopyroxenes. Large variations in the composition, accompanied by wide Raman shifts of the ν11 mode, allowed determination of adequate linear dependences and the regression parameters of these correlations. The correlation coefficients for all observed linear dependences for α (the level of significance or the probability of a type I error) = 10−4 are summarized in Table 1. Several linear dependences between the Raman shift of the ν11 mode and content of some major elements were found. The most prominent are positive correlations with Na2O (r = 0.95) and Al2O3 (r = 0.97) contents and negative correlations with CaO (r = −0.88) and MgO (r = −0.92) contents. We did not observe any significant dependences with content of Cr2O3 and FeO. It may be caused by the fact that Fe and Cr atoms of different valence can occupy different structural positions (M2O8 or M1O6) [25,26].
The observed dependences can be described as Deming regression equations as functions on Raman shift (significant at α = 0.05):
CaO = −0.61 (± 0.1) × ν11 + 427.4 (± 61.9)
MgO = −0.71 (± 0.08) × ν11 + 493.9 (± 59.1)
Na2O = 0.37 (± 0.04) × ν11 − 251.3 (± 32.5)
Al2O3 = 0.81 (± 0.05) × ν11 − 545.2 (± 37.2)
where Na2O, Al2O3, CaO, MgO in wt.%; ν11—frequency of the peak position of the O-Si-Obr Raman mode. The observed correlations and calculated regression lines are shown in Figure 4.
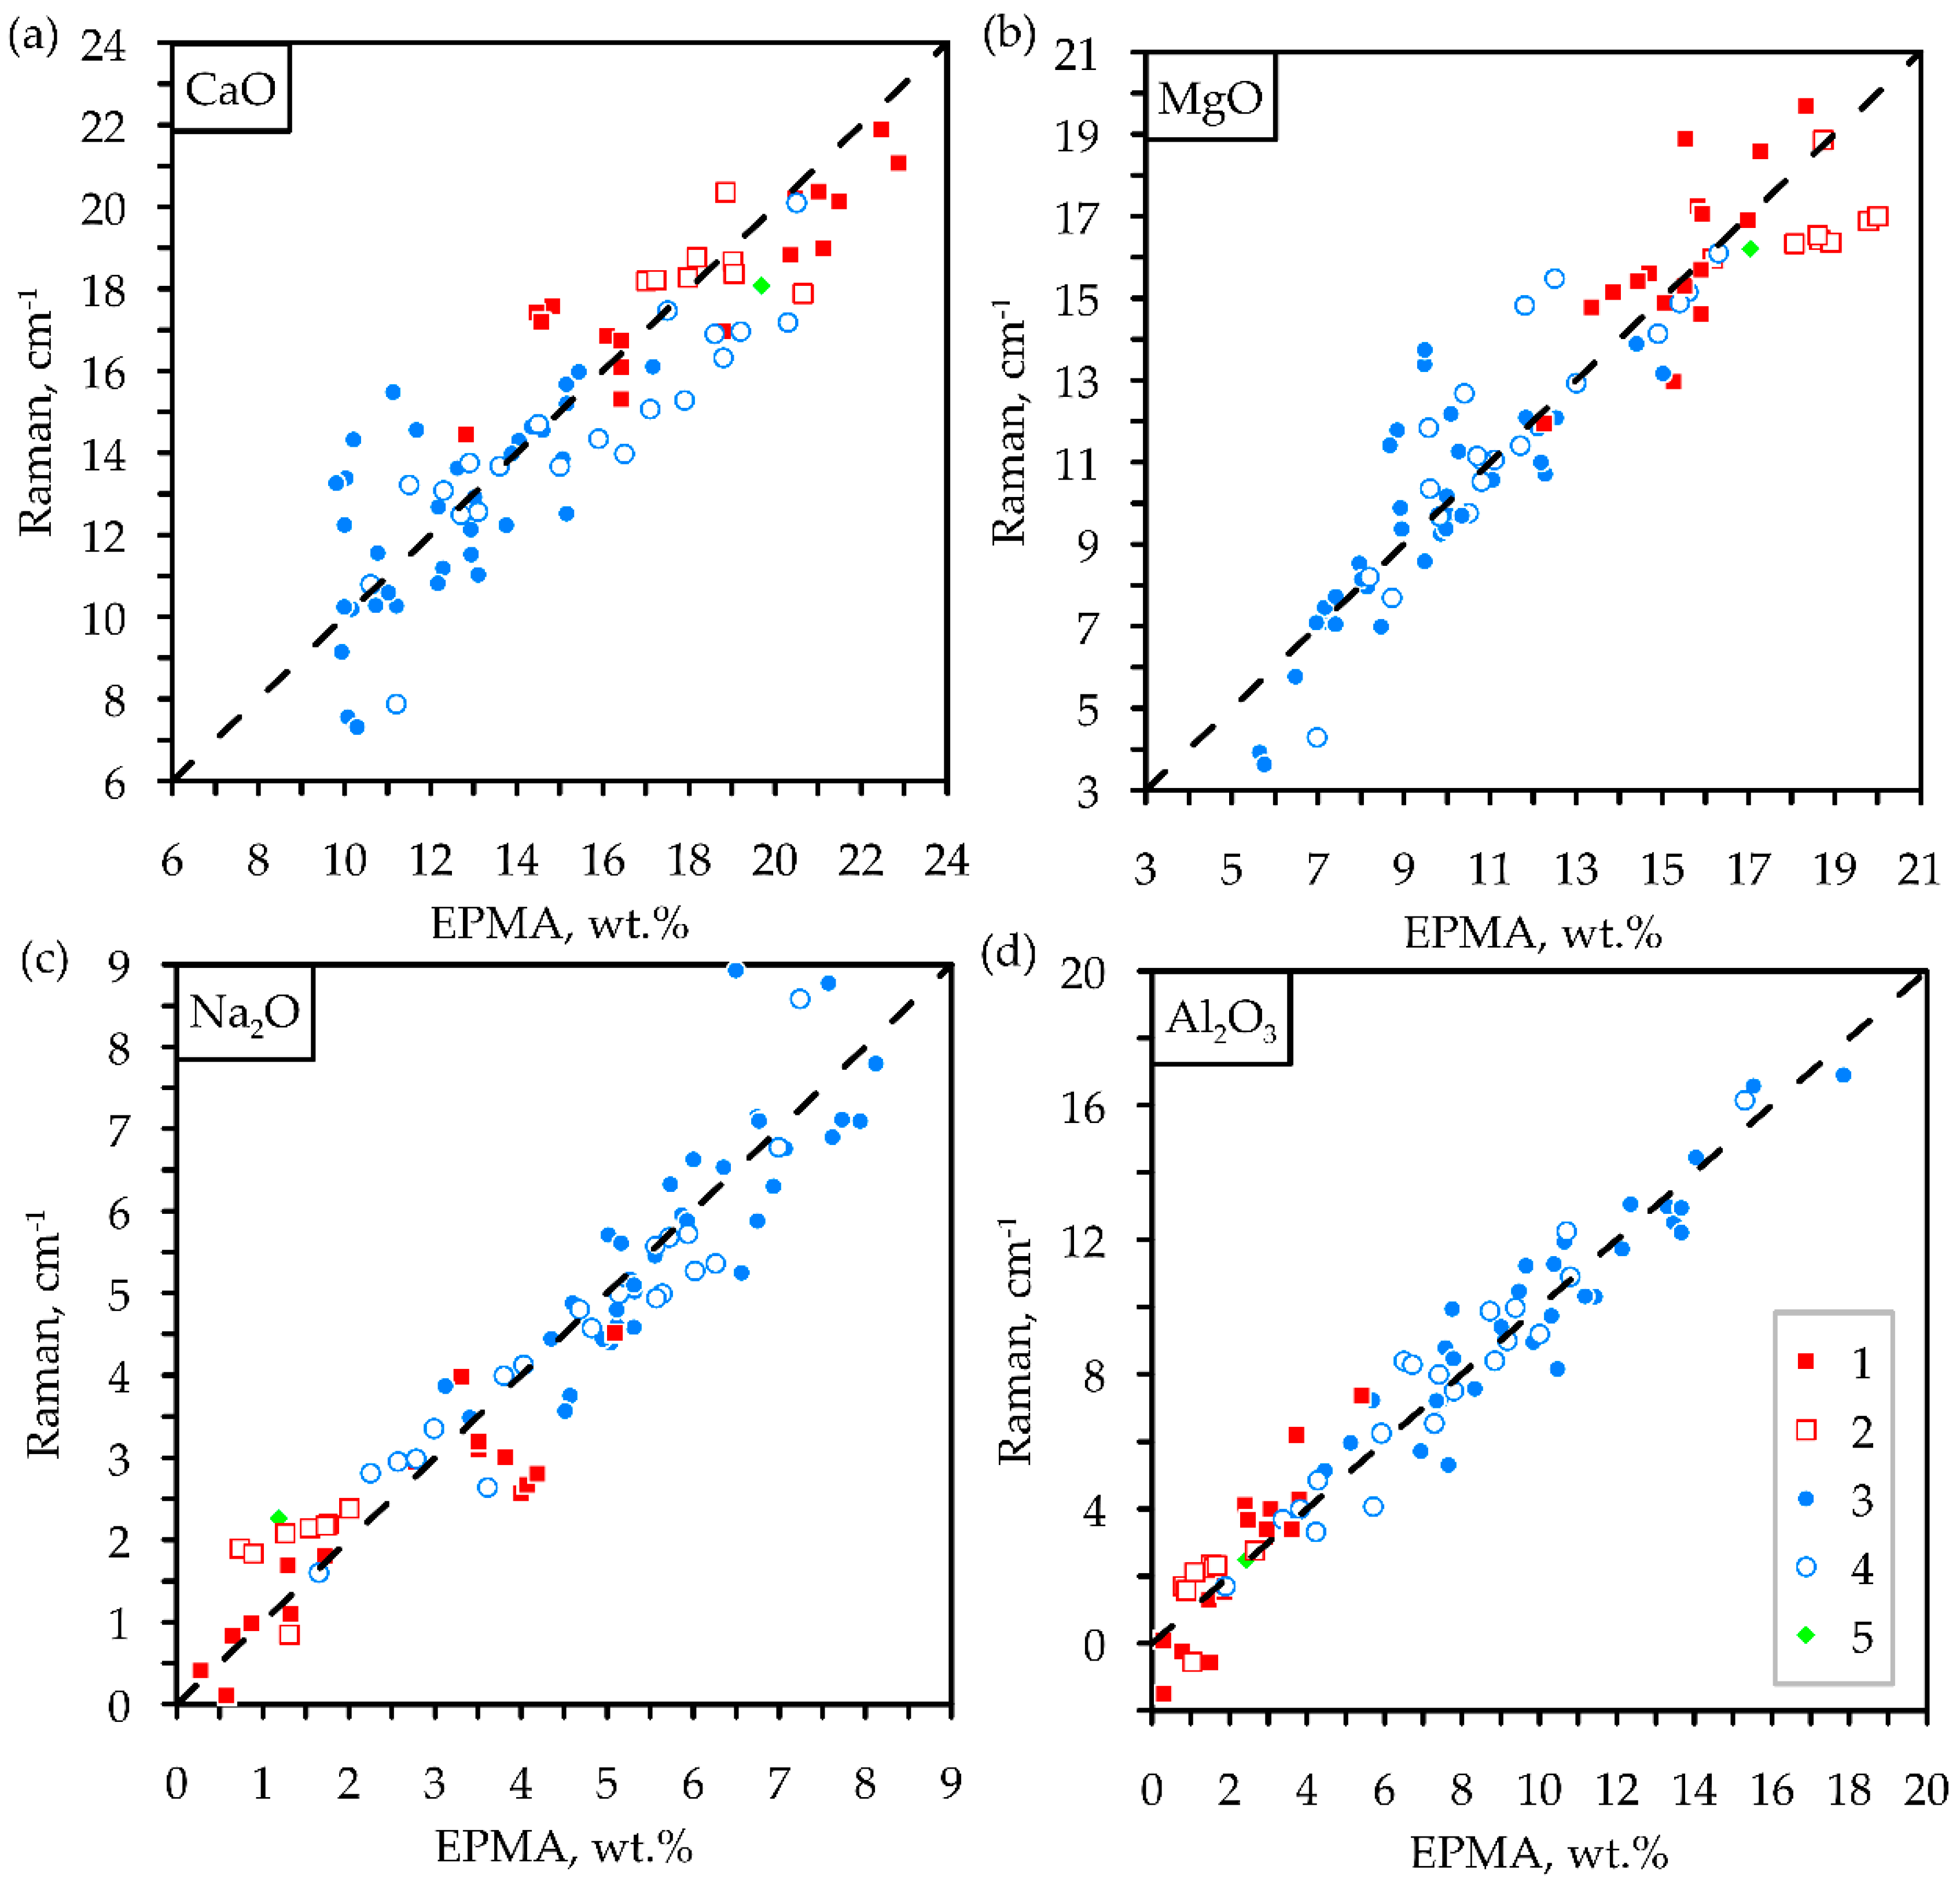
The data calculated from the regression equations and EPMA data yield sufficiently good convergence (Figure 5). Hereby, the equations of regression lines (1–4) can be used for a quantitative assessment of the chemical composition of mantle clinopyroxenes using only Raman spectroscopy technique. The discrepancies between Raman calculated data and EPMA data are <5.0 wt.% for CaO (mean 1.1 wt.%), <4.2 wt.% for MgO (mean 0.6 wt.%), <2.5 wt.% for Na2O (mean 0.4 wt.%), and <2.5 wt.% for Al2O3 (mean 0.5 wt.%). Some high discrepancies may occur because Cr2O3 and FeO were not considered in the calculations of the regression lines. It is known that strain pressure can also affect the Raman shifts of peak positions for anisotropic crystals [27]. However, the completely extracted and in situ inclusions of clinopyroxenes and clinopyroxenes from eclogites and peridotites give similar regression lines. It may suggest that the Raman shift of v11 stretching mode for clinopyroxene inclusions in diamonds depends on the composition rather than residual internal pressure.
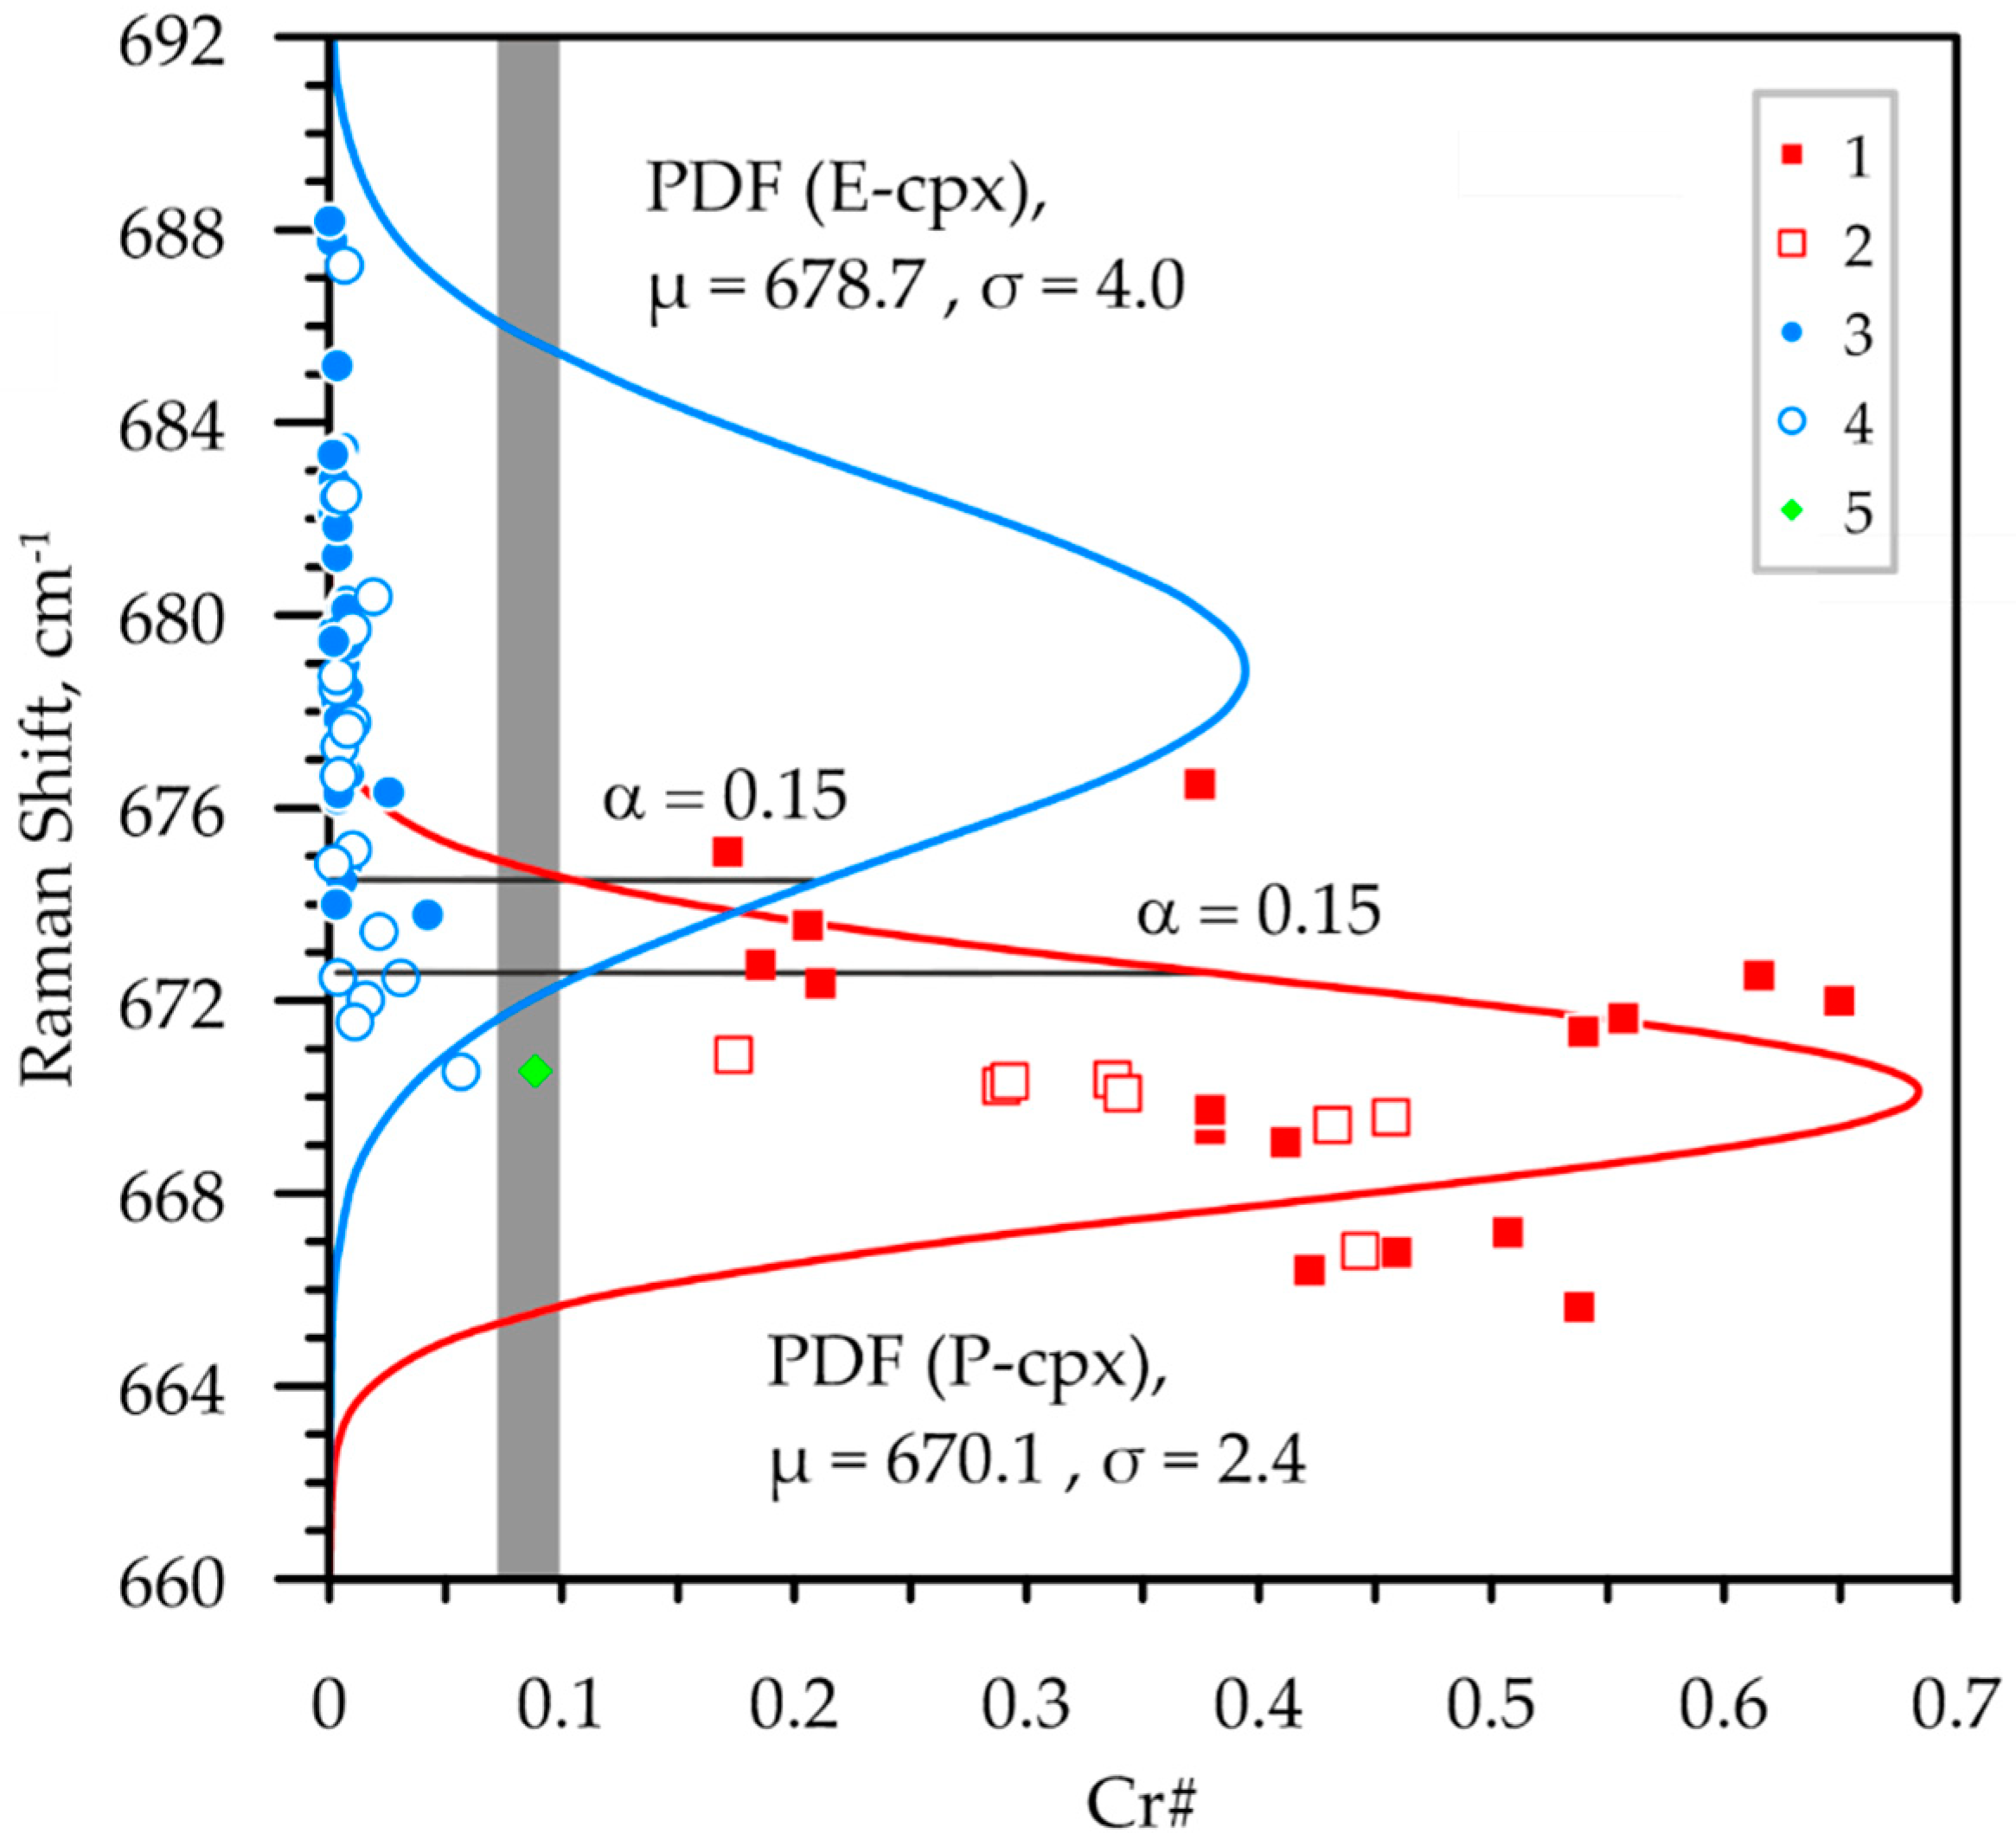
The previously published data reveal that peridotite and eclogite clinopyroxenes can be discriminated by the Cr# [1,2]. The lack of sufficient correlations of the stretching mode ν11 with the Cr and Fe contents do not allow assessment of these components using solely Raman data. It makes it difficult to discriminate the clinopyroxenes of different parageneses. Despite this, the clinopyroxenes of peridotite paragenesis and eclogite parageneses can roughly be separated by the peak position of the stretching ν11 mode. We calculated two separate distributions by the peak position of ν11 mode for peridotite and eclogite clinopyroxenes (Figure 6). These distributions are characterized by different parameters of the mean value and standard deviation (µ = 670.2, σ = 2.3 for peridotite clinopyroxenes and µ = 678.9, σ = 4.0 for eclogite clinopyroxenes), assuming that these distributions are normal. The Raman spectra of peridotite clinopyroxene has the stretching ν11 mode with a peak position frequency lower than 672 cm−1 with a probability of 85% (α = 0.15). Similarly, the clinopyroxene is likely to belong to eclogite (with probability of 85%, α = 0.15) if the peak position of the stretching ν11 mode is higher than 675 cm−1. The uncertainty range takes place between 672 and 675 cm−1. This extended uncertainty range is due to the existence of Na2O rich with peridotite clinopyroxenes (4.19–5.09 wt.%), which significantly overlap the range of eclogite clinopyroxenes and have the upshifted peak position of ν11 Raman mode. Some eclogite clinopyroxenes with relatively low Na2O ~2.25 wt.% and elevated Cr2O3 ~0.27 wt.% also fall into the uncertainty range.

5. Conclusions

Raman spectroscopy is a non-destructive technique for the identification of structural and chemical properties of minerals, and in particular is appropriate to study inclusions in natural diamonds. The new dataset of the Raman spectroscopic features of clinopyroxene inclusions in natural diamonds of different paragenesis (peridotite and eclogite) and clinopyroxenes from xenoliths peridotites and eclogites in kimberlite were obtained in this study. The wide variations of the peak position in a wide range for the ν11 mode of stretching vibrations of Si-O-Sibr were found. These variations correlate well with the chemical composition of the studied clinopyroxenes. The correlations, described as linear regression lines, generally reflect heterovalent jadeite-diopside isomorphism and can potentially be applied to evaluate the chemical composition of mantle clinopyroxenes using only the Raman spectroscopy technique. The peak position of the stretching Si-O-Sibr Raman mode (v11) can be satisfactorily used to separate clinopyroxenes of different parageneses. The clinopyroxenes with the peak position of v11 mode lower than 672 cm−1 are likely to belong to peridotites; and the clinopyroxenes with the peak position of v11 mode higher than 675 cm−1 are likely to belong to eclogites.

Author Contributions

A.D.K. and D.A.Z. equally contributed in this study. All authors have read and agreed to the published version of the manuscript.

Funding

The Raman spectroscopic study of clinopyroxenes and data processing was supported by Russian Science Foundation (16-17-10067). The sample preparation and study of chemical composition of clinopyroxenes was supported by Russian Science Foundation (18-17-00249).

Conflicts of Interest

The authors declare no conflict of interest.

Appendix A

Figure A1. The convergence of the peak positions of stretching Si-O-Sibr mode (ν11) for clinopyroxene inclusions in studied diamonds before and after polishing.
Minerals 10 01084 g0a1

References

  1. Sobolev, N.V. Deep Inclusions in Kimberlites and the Problem of the Upper Mantle Composition; Sobolev, V.S., Ed.; Nauka: Moscow, Russia, 1974. [Google Scholar]
  2. Stachel, T.; Harris, J.W. The origin of cratonic diamonds—Constraints from mineral inclusions. Ore Geol. Rev. 2008, 34, 5–32. [Google Scholar] [CrossRef]
  3. Taylor, L.A.; Neal, C.R. Eclogites with oceanic crustal and mantle signatures from the Bellsbank kimberlite, South Africa, Part I: Mineralogy, petrography, and whole rock chemistry. J. Geol. 1989, 97, 551–567. [Google Scholar] [CrossRef]
  4. Liu, L.G.; Mernagh, T.P.; Jaques, A.L. A mineralogical Raman spectroscopy study on eclogitic garnet inclusions in diamonds from Argyle. Contrib. Mineral. Petrol. 1990, 105, 156–161. [Google Scholar] [CrossRef]
  5. Izraeli, E.S.; Harris, J.W.; Navon, O. Raman barometry of diamond formation. Earth Planet. Sci. Lett. 1990, 173, 351–360. [Google Scholar] [CrossRef]
  6. McMillan, P. Theory and practice–lattice vibrations and spectroscopy of mantle phases. In Treatise on Geophysics; Price, D.G., Ed.; Elsevier: Amsterdam, The Netherlands, 2007; Volume 2, pp. 153–196. [Google Scholar]
  7. Kagi, H.; Odake, S.; Fukura, S.; Zedgenizov, D.A. Raman spectroscopic estimation of depth of diamond origin: Technical developments and the application. Russ. Geol. Geophys. 2009, 50, 1183–1187. [Google Scholar] [CrossRef]
  8. Nestola, F.; Alvaro, M.; Casati, M.N.; Wilhelm, H.; Kleppe, A.K.; Jephcoat, A.P.; Domeneghetti, M.C.; Harris, J.W. Source assemblage types for cratonic diamonds from X-ray synchrotron diffraction. Lithos 2016, 265, 334–338. [Google Scholar] [CrossRef]
  9. Kalugina, A.D.; Zedgenizov, D.A. Raman discrimination of garnet inclusions in Siberian diamonds. J. Raman Spectrosc. 2020, 51, 1438–1444. [Google Scholar] [CrossRef]
  10. Chopelas, A.; Serghiou, G. Spectroscopic evidence for pressure-induced phase transitions in diopside. Phys. Chem. Miner. 2002, 29, 403–408. [Google Scholar] [CrossRef]
  11. Lin, C.C. Pressure-induced polymorphism in enstatite (MgSiO3) at room temperature: Clinoenstatite and orthoenstatite. J. Phys. Chem. Solids 2004, 65, 913–921. [Google Scholar] [CrossRef]
  12. Kolesnichenko, M.V.; Zedgenizov, D.A.; Litasov, K.D.; Safonova, I.Y.; Ragozin, A.L. Heterogeneous distribution of water in the mantle beneath the central Siberian Craton: Implications from the Udachnaya Kimberlite Pipe. Gondwana Res. 2017, 47, 249–266. [Google Scholar] [CrossRef]
  13. Kolesnichenko, M.V.; Zedgenizov, D.A.; Ragozin, A.L.; Litasov, K.D.; Shatsky, V.S. The role of eclogites in the redistribution of water in the subcontinental mantle of the Siberian craton: Results of determination of the water content in minerals from the Udachnaya pipe eclogites. Russ. Geol. Geophys. 2018, 59, 763–779. [Google Scholar] [CrossRef]
  14. Lavrent’ev, Y.G.; Karmanov, N.S.; Usova, L.V. Electron probe microanalysis of minerals: Microanalyzer or scanning electron microscope? Russ. Geol. Geophys. 2015, 56, 1154–1161. [Google Scholar] [CrossRef]
  15. Shatsky, V.S.; Zedgenizov, D.A.; Ragozin, A.L.; Kalinina, V.V. Diamondiferous subcontinental lithospheric mantle of the northeastern Siberian Craton: Evidence from mineral inclusions in alluvial diamonds. Gondwana Res. 2015, 28, 106–120. [Google Scholar] [CrossRef]
  16. Zedgenizov, D.A.; Ragozin, A.L.; Kalinina, V.V.; Malkovets, V.G.; Pomazansky, B.S. Mineral inclusions in diamonds from Nyurbinskaya kimberlite pipe (Yakutia). In Geology and Mineral Resources of the North-East of Russia, Proceedings of Russian Scientific-Practical Conference “Geology and Mineral Resources of the North-East of Russia”, Yakutsk, Russia, 31 March–2 April 2015; Biller, A.Y., Ed.; M.K. Ammosov North-Eastern Federal University: Yakutsk, Russia, 2015; pp. 173–176. [Google Scholar]
  17. Gubanov, N.; Zedgenizov, D.; Sharygin, I.; Ragozin, A. Origin and evolution of high-Mg carbonatitic and low-Mg carbonatitic to silicic high-density fluids in coated diamonds from Udachnaya kimberlite pipe. Minerals 2019, 9, 734. [Google Scholar] [CrossRef] [Green Version]
  18. Smith, D.C. The RAMANITA1© method for non-destructive and in situ semi-quantitative chemical analysis of mineral solid-solutions by multidimensional calibration of Raman wavenumber shifts. Spectrochim. Acta A Mol. Biomol. Spectrosc. 2015, 61, 2299–2314. [Google Scholar] [CrossRef]
  19. Wang, A.; Jolliff, B.L.; Haskin, L.A.; Kuebler, K.E.; Viskupic, K.M. Characterization and comparison of structural and compositional features of planetary quadrilateral pyroxenes by Raman spectroscopy. Am. Mineral. 2001, 86, 760–806. [Google Scholar] [CrossRef]
  20. Mernagh, T.P.; Hoatson, D.M. Raman Spectroscopic Study of Pyroxene Structures from the Layered Intrusion, Munni Munni Western Australia. J. Raman Spectrosc. 1997, 28, 647–658. [Google Scholar] [CrossRef]
  21. Chopelas, A. Estimates of mantle relevant Clapeyron slopes in the MgSiO3 system from high-pressure spectroscopic data. Am. Mineral. 1999, 84, 233–244. [Google Scholar] [CrossRef]
  22. Huang, E.; Chen, C.H.; Huang, T.; Lin, E.H.; Xu, J.A. Raman spectroscopic characteristics of Mg-Fe-Ca pyroxenes. Am. Mineral. 2000, 85, 473–479. [Google Scholar] [CrossRef]
  23. Prencipe, M.; Maschio, L.; Kirtman, B.; Salustro, S.; Erba, A.; Dovesi, R. Raman spectrum of NaAlSi2O6 jadeite. A quantum mechanical simulation. J. Raman Spectrosc. 2014, 45, 703–709. [Google Scholar] [CrossRef]
  24. Deer, W.A.; Howie, R.A.; Zussman, J. Pyroxene Group. In An Introduction to the Rock-Forming Minerals, 2nd ed.; Longman Scientific & Technical: London, UK, 1992. [Google Scholar]
  25. Safonov, O.G.; Litvin, Y.A.; Perchuk, L.L. Synthesis of omphacites and isomorphic features of clinopyroxenes in the system CaMgSi2O6–NaAlSi2O6–KAlSi2O6. Petrology. 2004, 12, 84–97. [Google Scholar]
  26. Papike, J.J.; Karner, J.M.; Shearer, C.K. Comparative planetary mineralogy: Valence state partitioning of Cr, Fe, Ti, and V among crystallographic sites in olivine, pyroxene, and spinel from planetary basalts. Am. Mineral. 2005, 90, 277–290. [Google Scholar] [CrossRef] [Green Version]
  27. Compomenosi, N.; Mazzucchelli, M.L.; Mihailova, B.; Scambelluri, M.; Angel, R.J.; Nestola, F.; Reali, A.; Alvaro, M. How geometry and anisotropy affect residual strain in host-inclusion systems: Coupling experimental and numerical approaches. Am. Mineral. 2018, 103, 2032–2035. [Google Scholar] [CrossRef]
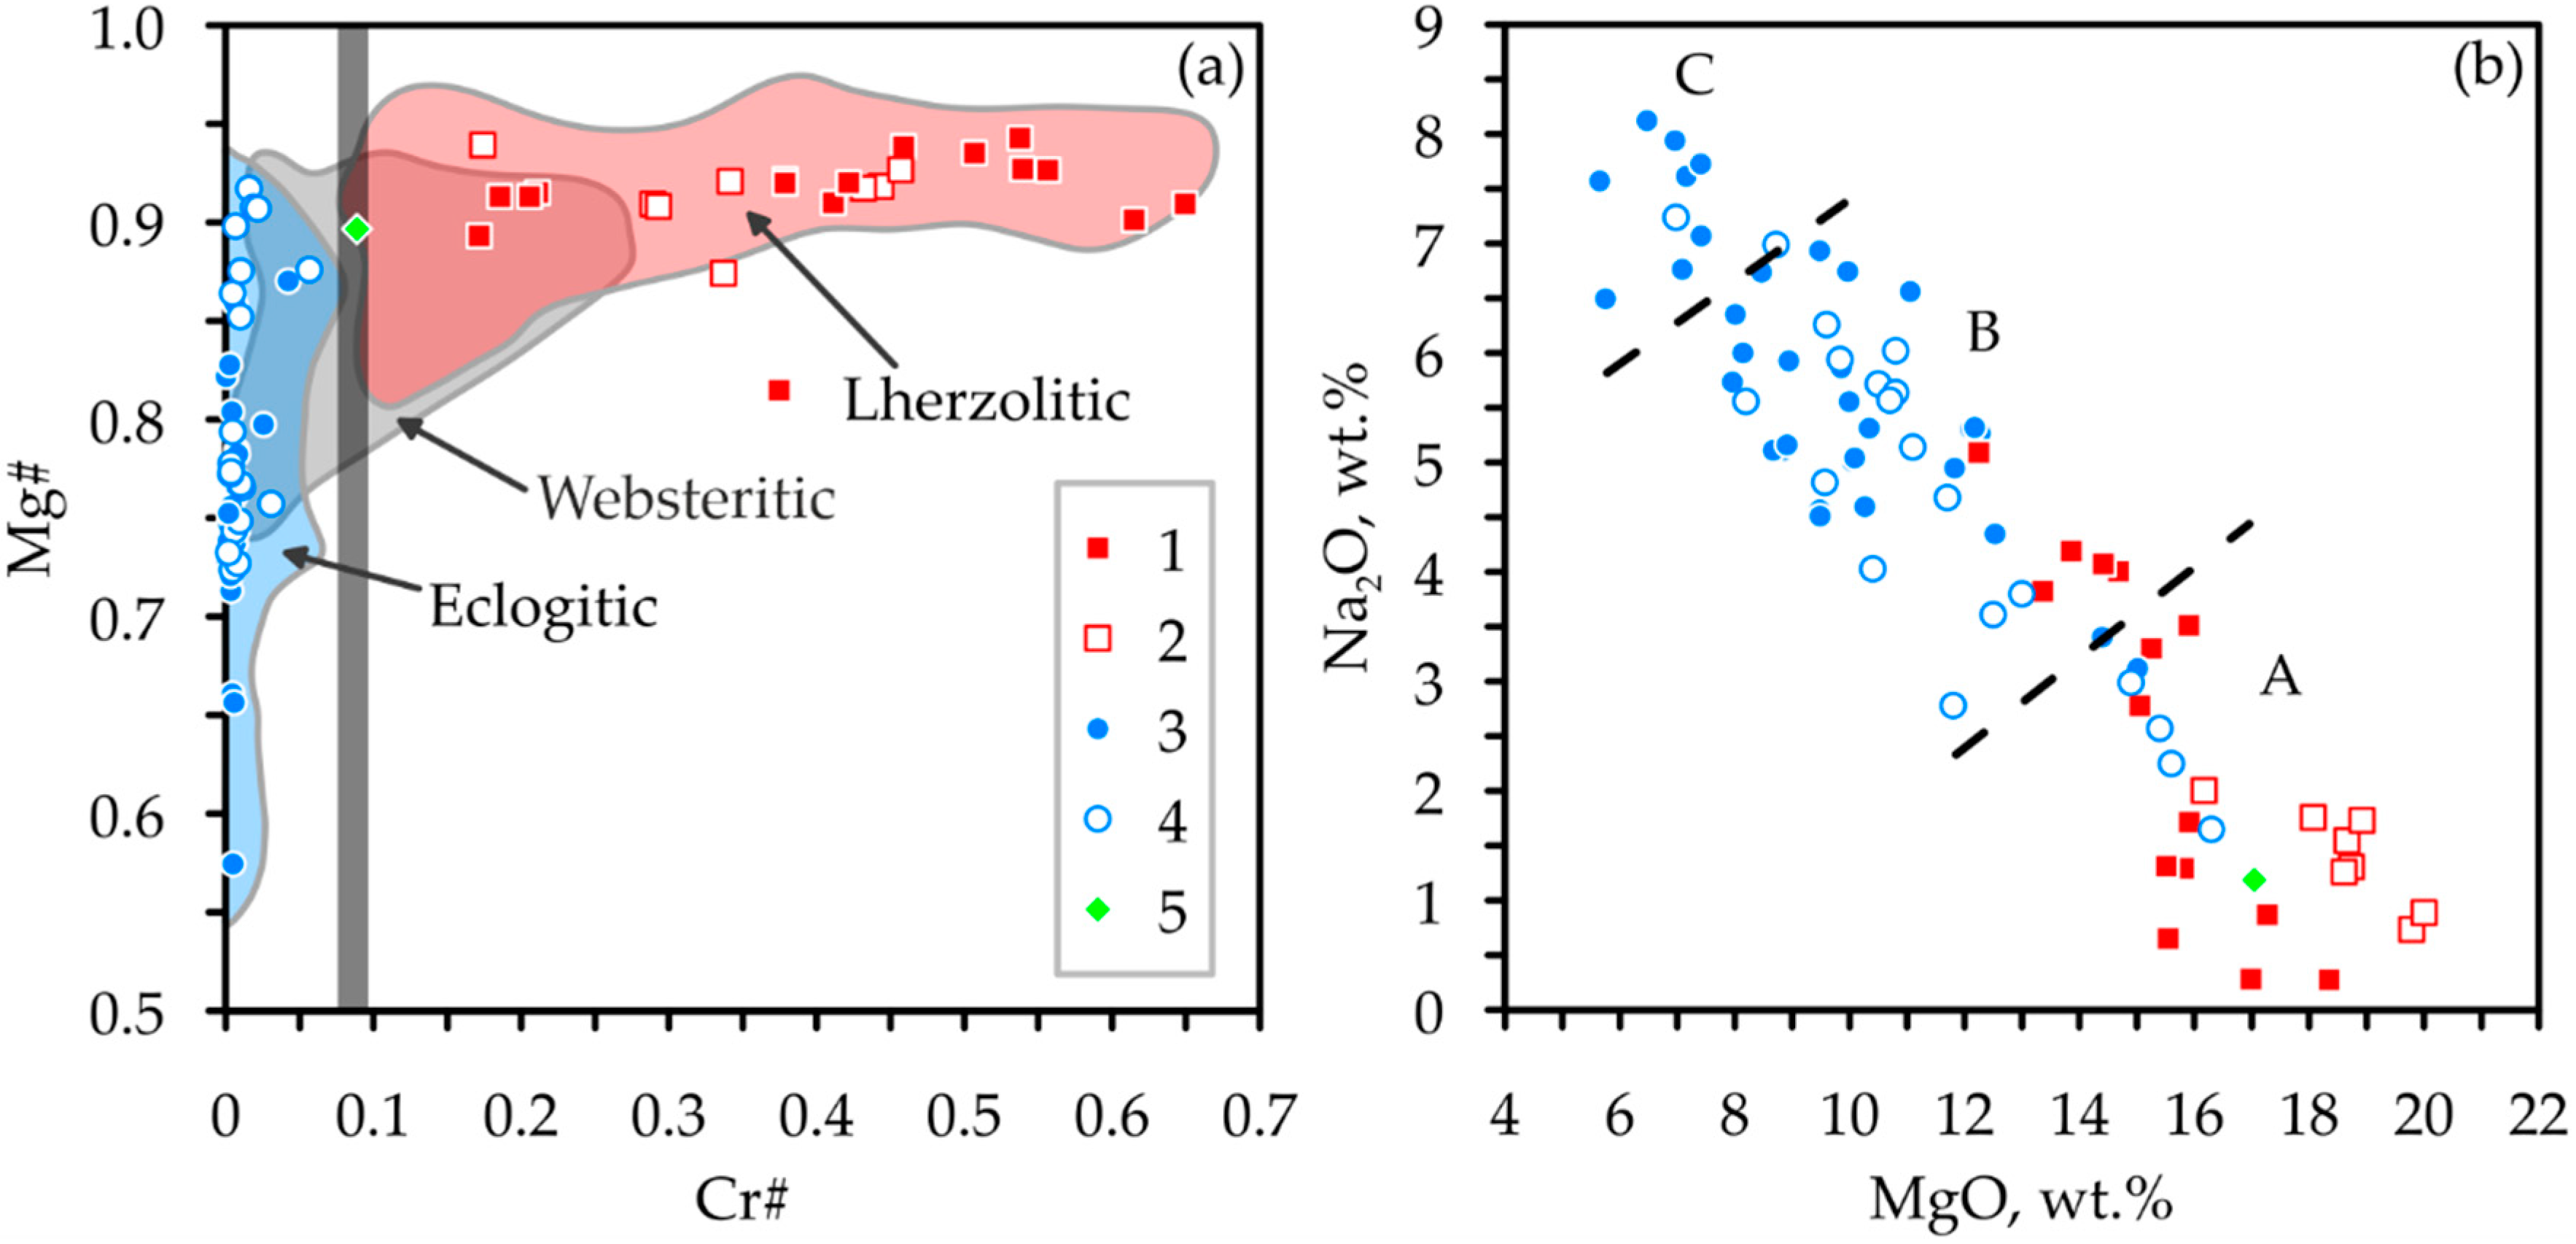
Figure 1. The discrimination of clinopyroxenes of different paragenesis: (a) Mg# vs. Cr# of clinopyroxenes—lherzolitic, websteritic, and eclogitic compositional fields and the transition from peridotite to eclogite clinopyroxenes at Cr# 0.07–0.10 (gray vertical stripe) are taken from [2]; (b) Na2O vs. MgO contents in clinopyroxenes (A, B, C are the groups of eclogites are shown according to [3]). 1—peridotite clinopyroxene inclusions in diamonds, 2—clinopyroxenes from peridotites, 3—eclogite clinopyroxene inclusions in diamonds, 4—clinopyroxenes from eclogites; 5—single clinopyroxene inclusion in diamond with transitional composition [2].
Minerals 10 01084 g001
Figure 2. Two octahedral diamonds with (a) peridotite and (b) eclogite inclusion associations; E-cpx—eclogite clinopyroxene, P-cpx—peridotite clinopyroxene, Ol—olivine.
Minerals 10 01084 g002
Figure 3. Raman spectra of clinopyroxenes of different parageneses: (a) Eclogite clinopyroxenes (1, 4, 5—inclusions in diamonds from Ebelyakh river deposits; 2,3,6,7—inclusions in diamonds from Internatsional’naya pipe); (b) peridotite clinopyroxenes (1—inclusion in diamond from Udachnaya pipe; 2–5—inclusions in diamonds from Internatsional’naya pipe; 6,7—clinopyroxenes from Udachnaya pipe). ν11—stretching bridging vibration mode O-Si-Obr, ν16—stretching non-bridging vibration mode O-Si-Onbr.
Minerals 10 01084 g003
Figure 4. The correlation of the Raman shift of the frequency position of O-Si-Obr mode (ν11) in clinopyroxenes with contents of CaO (a), MgO (b), Na2O (c), and Al2O3 (d) determined from EPMA: 1—peridotite clinopyroxene inclusions in diamonds, 2—clinopyroxenes from peridotites, 3—eclogite clinopyroxene inclusions in diamonds, 4—clinopyroxenes from eclogites; 5—single clinopyroxene inclusion in diamond with transitional composition [2]. The equations of Deming regression lines (1–4) are shown.
Minerals 10 01084 g004
Figure 5. The convergence of CaO (a), MgO (b), Na2O (c), and Al2O3 (d) contents in clinopyroxenes determined by EPMA and calculated from Raman spectroscopy by using the parameters of the regression equations: 1—peridotite clinopyroxene inclusions in diamonds, 2—clinopyroxenes from peridotites, 3—eclogite clinopyroxene inclusions in diamonds, 4—clinopyroxenes from eclogites; 5—clinopyroxene inclusion in diamond with transitional composition [2]). The dashed line shows ideal convergence (EPMA = Raman).
Minerals 10 01084 g005
Figure 6. Raman shift of stretching mode ν11 vs. Cr# of clinopyroxenes: 1—peridotite clinopyroxene inclusions in diamonds, 2—clinopyroxenes from peridotites, 3—eclogite clinopyroxene inclusions in diamonds, 4—clinopyroxenes from eclogites; 5—clinopyroxene inclusion in diamond with transitional composition [2]. The transition from peridotite to eclogite clinopyroxenes occurs at the range 672–675 cm−1 of the peak position of ν11 mode; PDF—probability density function of normal distribution with parameters µ (mean) and σ (standard deviation) for clinopyroxenes of peridotite (P-cpx) and eclogite (E-cpx) parageneses, α—the level of significance for boundary lines of uncertainty area. The transition from peridotite to eclogite clinopyroxenes at Cr# 0.07–0.10 is taken from [2].
Minerals 10 01084 g006
Table 1. The correlation coefficients for linear dependences between major elements and stretching vibration mode (ν11) in clinopyroxenes (the bold are significant at α = 10−4).
SiO2TiO2Al2O3Cr2O3FeOMgOCaONa2Oν11
SiO21
TiO2−0.061
Al2O30.270.481
Cr2O3−0.11−0.32−0.511
FeO−0.400.360.33−0.491
MgO−0.09−0.51−0.950.42−0.451
CaO−0.23−0.47−0.860.35−0.520.801
Na2O0.190.500.94−0.370.42−0.94−0.921
ν110.270.420.97−0.480.36−0.92−0.880.951
Publisher’s Note: MDPI stays neutral with regard to jurisdictional claims in published maps and institutional affiliations.