Abstract
Limonitic laterite contains low iron and nickel grades and much high smelting minerals and loss on ignition (LOI), identified as refractory iron ore for sintering. Thus, sinter pot tests of limonitic laterite via pressurized densification sintering and its intensification mechanism were conducted, and the industrial application prospect was explored. The results indicate that the sintering performance of the limonitic laterite of the new process is significantly improved with the tumble index and productivity increased by 19.2% and 18.6%, respectively, and solid fuel rate lowered by 10.3%. The external pressure field promotes the synchronization of heat front velocity and combustion front velocity for better sintering heat and mass transfer conditions, which also greatly improves the mineral compositions and microstructure of the product sinter. The microstructure is converted from large thin-wall pores into small thin-wall or large thick-wall pores with the sinter porosity decreased by 42.4%. Much close interlocking texture between hercynite and silico-ferrite of calcium and alumina (SFCA) is formed with hercynite grains aggregation and growth, and SFCA amount substantially increased. The better sintering performance will bring about a remarkable economic benefit of 282.78 million RMB/a if the industrial application is implemented. The pressurized densification sintering process is considered as one of the effective technologies for improving limonitic laterite sintering.
1. Introduction
As the worldwide demand for stainless steel products increasingly exceeds supply, nickel sulfide resources acting as the main source of extracting nickel for stainless steel are sharply depleted [1,2,3]. Thus, the abundant nickel laterite resources with a share of as high as 70% of total nickel resources tend to be more and more concerning [4,5,6]. It is noteworthy that limonitic laterite characterized as high-iron and low-nickel laterite ore accounts for 60% of the total nickel laterite resources, which has been massively imported from Indonesia and Philippines to China in recent years because of the scarcity of nickel laterite resources in China and the export restriction of high-grade laterite to overseas countries [7,8,9,10]. Therefore, the effective utilization of limonitic laterite is of critical importance for stainless steel production.
Currently, the relatively mature pyrometallurgical smelting processes to extract nickel from laterite mainly consist of the Rotary Kiln-Electric Furnace (RKEF) process and the sintering-blast furnace process [11,12]. As confirmed in previous studies [13,14,15,16], the former is preferably applicable to high-nickel and low-iron laterite ore to produce ferronickel containing 10–25% Ni with the vast majority of iron left in the slag, while limonitic laterite is suitable for the sintering-blast furnace process to produce low-grade ferronickel alloy at lower cost owing to its comparatively higher iron grade and lower price. However, although many experimental tests of limonitic laterite sintering have been carried out successfully and the relevant industrial production has already been achieved in Chinese research institutions and stainless-steel enterprises, the poor sintering performance of limonitic laterite remains a bottleneck to smooth production [17,18,19]. This is principally because the high crystal water (>30%) and LOI (>10%) contents of limonitic laterite contribute to the formation of highly porous loose sinter [20,21,22,23], and the massive existence of high-melting-point minerals, such as Al2O3, MgO, and Cr2O3 is deleterious to liquid-phase flowing, leading to the substantial increase of solid fuel consumption [24,25,26,27]. Meanwhile, compared with ordinary iron ores, limonitic laterite possesses rather lower total iron content (40–50%), indicating the limited amount of liquid bonding phases [28,29,30,31]; all of which eventually lead to a poor tumble index (<50%), low productivity (<1.0 t·m−2·h−1), and high solid fuel rate (>140 kg/t) of a product sinter of limonitic laterite. Hence, it is essential to strengthen limonitic laterite sintering by using efficient methods.
According to the studies of high-proportioned ordinary limonite ore sintering [32,33], many investigations have been conducted on improving the sinter microstructure of limonitic laterite through blending the laterite ore with ordinary iron ores such as magnetite concentrates for sintering. Although this method is proved to be an alternative way to reduce sinter porosity and then improve the relevant sintering performance, the nickel grade of pig iron is weakened while the proportion of limonitic laterite is always no more than 50%, which is unfavorable for the extensive utilization of limonitic laterite and the production of stainless steel at low cost [34,35]. Also, as evidenced in the literature [18], the sinter of limonitic laterite is much looser and more porous compared with that of ordinary limonite ore. Conventional strengthening sintering processes such as proper pressing of the sinter bed before ignition or deep-bed sintering processes are expected to be insufficient for promoting the densification of loose sinter of limonitic laterite. It is considered that the sinter of limonitic laterite cannot be achieved with the self-densification at a deadweight pressure combined with the results of the references [18,21,36]. Thus, a new process—the pressurized densification sintering—is put forward by the authors, where a continuous external pressure field is supposed to be applied upon the top of the sinter bed after ignition in order to favor the densification of the loose and porous sinter during sintering, and then obtain superior sintering performance of limonitic laterite.
In this paper, based on the characterization of the adopted limonitic laterite, the sinter pot tests of 100% limonitic laterite were conducted for clarifying the effects of the external mechanical pressure upon the sinter bed top on the limonitic nickel laterite sintering, including sintering indices and metallurgical performance of product sinter. The intensification mechanism of the external pressure field on improving the sintering performance was revealed by the analysis of the thermodynamic and kinetic conditions during sintering and the mineralogy of the product sinter of limonitic nickel laterite. The relevant industrial application prospect was also evaluated.
2. Materials and Methods
2.1. Physicochemical Properties of Raw Materials
The analyses of raw materials, including chemical compositions, industrial analysis of solid fuel, size distributions, and mineralogical analyses of lateritic nickel ore, were conducted. The chemical compositions were analyzed by X-ray fluorescence (XRF), and the industrial analysis was carried out according to the standard of GB/T 212-2008. The size distributions were determined by using a series of standard sieves. Mineralogical analyses consist of mineral phase identification and microstructure analysis. The former was clarified by X-ray diffraction (XRD) with Cu Kalpha and operated at 40 kV in step mode with 0.02° 2θ step and a count time of 0.5 s per step over a 2θ range from 10° to 80°. The latter was revealed by the aid of the optical microscope (Leica DM4500P, Wetzlar, Germany) and Scanning Electron Microscopy (FEI Quanta-200 scanning electron microscope, FEI, Hillsboro, OR, USA).
The raw materials adopted in the sinter pot tests mainly include lateritic nickel ore, fluxes, and solid fuel and the physicochemical properties of all materials have been investigated in the previous literature [18]. The results indicate that the used laterite ore imported from the Philippines is identified as limonitic nickel laterite with 1.09% NiO and 3.45% Cr2O3, which is characterized by a much lower iron grade of only 45.09% and higher Al2O3, MgO, and LOI contents as high as 4.50%, 5.58%, and 12.49%, respectively, compared with that of the ordinary iron ores. This has serious adverse impacts on the sintering performance of limonitic laterite leading to a poor tumble index, low productivity, and high solid fuel rate [18,24,28]. Thus, it is pretty necessary to improve the sintering performance of limonitic laterite via effectively strengthened sintering technologies. The sinter fluxes include ferronickel tailing and burnt lime. The former is a solid waste produced from the direct reduction-magnetic separation process of lateritic nickel ore and could be used to substitute for conventional sinter fluxes such as dolomite because of the similar chemical compositions, as confirmed in the previous study [37]. Burnt lime assaying 82.07% CaO acts, not only as a binder to improve granulation of the sinter mixture, but also as a flux to adjust its basicity. Anthracite as the only solid fuel for sintering contains high-fixed carbon content and calorific values of 79.66% and 28.27 MJ/kg, respectively, and then provides sufficient heat for the sintering process. Besides, the contents of hazardous elements of all raw materials, such as P and S are below 0.01% and 0.10%, respectively, contributing to reducing the stainless-steel production cost.
In addition, as described in the reference [18], the content of particles over 5 mm of limonitic laterite reaches up to 16.16%, which will prolong the sintering time and then weaken the productivity of the sinter [38]. Nuclear particles of 1–3 mm fractions with content of as high as 44.78% are beneficial to the granulation process [39]. Moreover, fluxes and anthracite with over 70% passing 3 mm all satisfy the granularity requirement of the sinter production.
Meanwhile, according to the results of prior investigations [18], limonitic laterite is mainly composed of goethite, maghemite, hematite, enstatite, and stishovite. In order to ensure the accuracy and reproducibility of the relevant results of limonitic nickel laterite, its mineralogy was re-conducted in this paper. As shown in Figure 1a, the ballability of limonitic laterite is considered excellent due to the irregular particles with coarse surface. Combined with the descriptions of Figure 1b,c, and Table 1, it can be seen that alumina is primarily enriched in earthy or vitreous goethite through Al3+ ions substituting for Fe3+ ions to form alumogoethite [40]. Also, magnesium mainly exists in enstatite, whereas most of the silicon occurs in enstatite and stishovite. The occurrence of alumina, silicon and, magnesium of limonitic laterite greatly differs from that of ordinary iron ores, which is expected to largely affect the sintering metallogenic mechanism, and then the relevant sintering performance. Moreover, a small amount of lamellar or granular maghemite, hematite, and Cr-spinel is also observed sporadically embedded in goethite. The mineralogy results of limonitic nickel laterite are commendably consistent with that in reference [18].
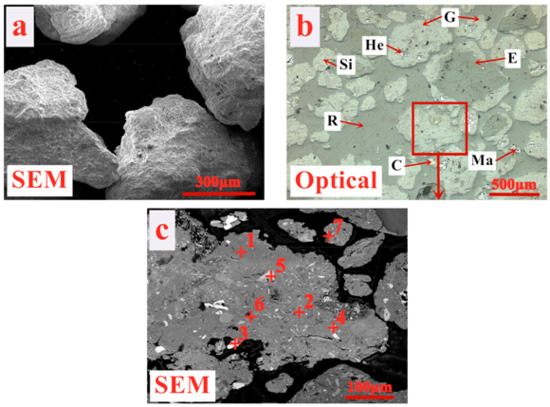
Figure 1.
The mineralogy of limonitic nickel laterite (G—Goethite, He—Hematite, Ma—Maghemite, E—Enstatite, Si—Stishovite, C—Chromite spinel, R—Resin). (a) Morphology photograph, (b) Optical photograph, (c) SEM analysis photograph.

Table 1.
Energy dispersive spectrum (EDS) analysis results for areas in Figure 1.
2.2. Experimental Procedure
Limonitic laterite and anthracite are adopted as the only iron-bearing material and high-quality solid fuel, respectively, for sintering tests carried out in a pilot scale pot with 200 mm in diameter and 1000 mm in height. Besides, burnt lime is used to maintain sinter basicity at 1.4, as well as improve the granulation properties of the sinter mixture, whereas the ratios of ferronickel tailing and return fines remain at 1.5% and 30% on a total dry mix basis, respectively. Furthermore, the detailed methods of the traditional sintering process without external pressure field are consistent with the descriptions of the previous literature [18], including proportioning, mixing, granulation, ignition, sintering, cooling, sieving, and quality testing of sinter.
Figure 2 illustrates the schematic diagram of the pressurized densification sintering process of limonitic laterite. Compared with the traditional sintering process, the new sintering process possesses an external mechanical pressure field by adjusting the weight of the pressure device upon the top of the sinter bed after ignition. The bottom of the pressure device consists of a bar grate contributing to satisfying the requirement of the sinter layer permeability during sintering. The upper part is a steel tray used to load the pressurized weight with the mass of the pressure device elevated from 5 kg to 25 kg, signifying that the relevant external mechanical pressure varies from 1561 Pa to 7803 Pa by calculation. The rest of the operational procedures of the pressurized densification sintering process are identical with that of the traditional sintering process. According to the previous investigations [18,37], sinter indices, including the tumble index, productivity, and solid fuel rate and metallurgical performances, such as low temperature reduction degradation (RDI) and reducibility (RI) were determined. In the meantime, the exhaust-gas temperature and vertical sintering speed of the sintering process and mineralogy of the product sinter were characterized to reveal the relevant mechanism of the pressurized densification sintering process in improving the sintering performance of limonitic laterite.
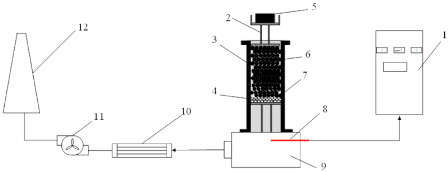
Figure 2.
Schematic diagram of the pressurized densification sintering process of limonitic nickel laterite in sinter pot tests (1—control cabinet, 2—pressure device, 3—sinter pot, 4—hearth layer, 5—pressurized weight, 6—sinter bed, 7—bar grate, 8—thermocouple, 9—vacuum chamber, 10—condenser tube, 11—air blower, 12—chimney).
3. Results and Discussion
3.1. Influence of External Pressure Field on Limonitic Nickel Laterite Sintering
3.1.1. Effect of External Mechanical Pressure on Sintering Performance
Figure 3 shows the effect of external mechanical pressure on the sintering performance of limonitic laterite and the detail results are summarized in Table 2. As external mechanical pressure is elevated from 0 Pa to 6242 Pa, the tumble index and productivity of the product sinter are increased rapidly from 45.87% and 0.97 t·m−2·h–1 to 54.67% and 1.15 t·m−2·h−1, respectively, and the solid fuel rate is substantially reduced from 140.52 kg/t to 126.12 kg/t. With the external mechanical pressure further coming up to 7803 Pa, the tumble index and the productivity are weakened to 53.87% and 1.08 t·m−2·h−1, respectively, and the solid fuel rate is increased to 128.97 kg/t. The application of external pressure field promotes the progressive densification of loose sinter of limonitic laterite leading to the great reduction of sinter porosity. Thus, the proper increase of external mechanical pressure (0–6242 Pa) is conducive to the significant improvement of sintering performance of limonitic laterite. However, as the external mechanical pressure exceeds the appropriate value, the permeability of the sinter bed is overly lowered because of the excessive densification of the sinter, resulting in rather low vertical sintering speed, and then the deterioration of the sintering performance [41]. Hence, the optimum external mechanical pressure is recommended at 6242 Pa. The sintering performance of limonitic laterite is substantially improved via the pressurized densification sintering with the tumble index and productivity increased by 19.2% and 18.6%, respectively, and the solid fuel rate lowered by 10.3%, compared with that of the traditional sintering process (0 Pa).
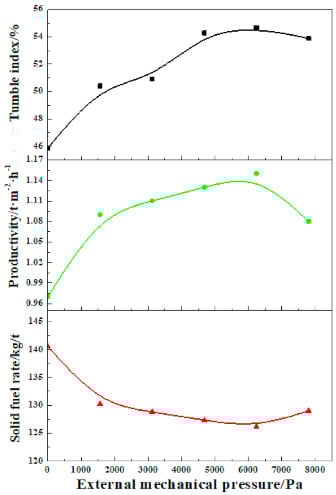
Figure 3.
Sintering performance of limonitic laterite under various external mechanical pressure.
Table 2.
The detail varying of sinter indices of limonitic laterite with external mechanical pressure.
3.1.2. Comparison of Metallurgical Performance of the Product Sinter
Table 3 summarizes the chemistry of the product sinter of the two sintering processes. The chemical compositions of the product sinter of the traditional sintering process is in accordance with the previous investigations [18]. The results indicate that the chemical compositions of the limonitic laterite product sinter of different sintering processes are similar characterized by lower iron and higher alumina, magnesium, chromium oxide, and FeO contents. All of which reflects the refractory sintering performance of limonitic laterite. Therefore, it is of great necessity to improve the sintering performance of limonitic laterite via effective strengthening technologies, such as the pressurized densification sintering process.
Table 3.
Chemical compositions of product sinter of different sintering processes (wt%).
Figure 4 compares the metallurgical performance of the product sinter of the traditional and pressurized densification sintering processes. RI of product sinter is reduced slightly from 81.34% to 75.33% via pressurized densification sintering due to the densification of the product sinter unfavorable for reducing gas diffusing into the sinter [42], but it still perfectly satisfies the requirement of blast furnace production. Moreover, the RDI of the two sintering processes was close to the RDI+6.3mm and RDI+3.15mm of both over 90.00% and RDI−0.5mm of about 1.00%, owing to the high FeO content [43]. Thus, the product sinter of the pressurized densification sintering process also possesses adequate hot sinter strength in the blast furnace. Overall, the excellent metallurgical performance of the product sinter of the pressurized densification sintering process could be achieved.
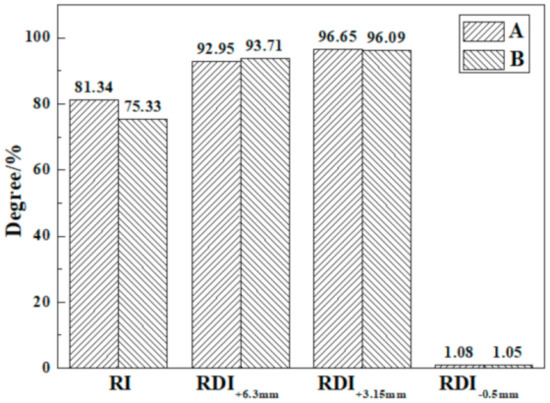
Figure 4.
Metallurgical performance of the product sinter of different sintering processes (A) Traditional sintering process, (B) Pressurized densification sintering process.
3.2. Intensification Mechanism of Pressurized Densification Sintering
In this part, the thermodynamic and kinetic conditions of the sintering process and mineralogy of the relevant product sinter were determined for clarifying the intensification mechanism of the pressurized densification sintering of limonitic laterite.
3.2.1. Thermodynamic and Kinetic Conditions during Sintering
Figure 5 describes the variations of sintering speed and exhaust-gas temperature with external mechanical pressure. It can be seen from Figure 5a that the exhaust-gas temperature is increased slightly and then lowered with the ignition procedure from beginning to end. Afterward, the exhaust-gas temperature is maintained at a certain level because of the continuous water evaporation. With the further proceeding of sintering process, the exhaust-gas temperature substantially rises to the maximum value due to heat transfer and chemical reaction [44,45]. When sintering is finished, the exhaust-gas temperature is reduced gradually. Remarkably, a significant variation of the exhaust-gas temperature peak is observed under different external mechanical pressure. As shown in Figure 5a, the peak value of the exhaust-gas temperature is only 281 ℃ without external mechanical pressure, while that is substantially elevated to 363 °C with the external mechanical pressure increased to 7803 Pa. Meanwhile, the relevant holding time at high temperature is also extended synchronously with external mechanical pressure.
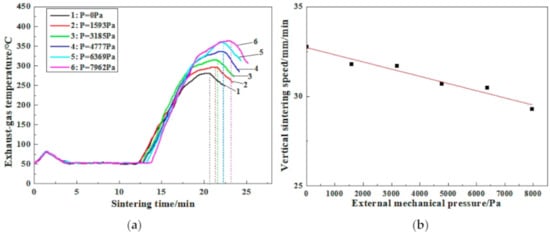
Figure 5.
Variations of exhaust-gas temperature (a) and vertical sintering speed (b) with external mechanical pressure.
It is well known that the decomposition of extensive crystal water of limonite ores such as limonitic nickel laterite during sintering leads to the formation of high porous sinter and then rather low heat front velocity [44,45,46]. Thus, the heat generated by the combustion of anthracite cannot be effectively transferred to the sinter mixture in a high-temperature zone and the temperature of the high-temperature zone is insufficient to answer the demand of the sintering mineralization consequently. Meanwhile, the air from the top is unable to be commendably preheated by the high-temperature zone, hindering the improvement of the temperature of the combustion zone. Besides, the high-temperature exhaust gas from the combustion zone is also not adequately utilized in the lower part. The asynchrony of the heat front velocity and combustion front velocity contributes to the formation of the high-temperature zone with large thickness and low temperature. All of which eventually results in the poor sintering performance of the limonitic nickel laterite.
As indicated in Figure 5a, the peak value of the exhaust-gas temperature is obviously improved with an external mechanical pressure applied. This is mainly owing to the fact that the external mechanical pressure contributes to particles diffusion in solid-phase and liquid-phase reactions, as well as the densification of the loose sinter and then better conditions of heat and mass transfer [47], which is beneficial to the synchronization of the heat front velocity and combustion front velocity during sintering. In the meantime, the more formation of liquid bonding phases and great improvement of the sinter microstructure of limonitic laterite are expected to be achieved further, leading to heighten the relevant sintering performance [48,49].
On the other hand, it is found that the maximum exhaust-gas temperature is proliferated dramatically with external mechanical pressure increased from 0 Pa to 6242 Pa, while that rises slightly as the external mechanical pressure continues to reach 7803 Pa. Furthermore, the sintering time is prolonged constantly with external mechanical pressure and the relevant vertical sintering speed is continuously lowered, as shown in Figure 5b due to the densification of the loose sinter from the surface to the central layer under external mechanical pressure [41]. This is harmful to the productivity of the product sinter to some extent. Therefore, considering the yield and the quality of the product sinter simultaneously, the suitable external mechanical pressure is supposed to be recommended at 6242 Pa, which is consistent with the results of Figure 3.
3.2.2. Sinter Porous Characters
Figure 6 illustrates the porous structure of the product sinter of different sintering processes through macrographs and optical photographs. Comparing Figure 6b with Figure 6a, it is observed that the sinter macrostructure of the pressurized densification sintering process is much denser overall while that of the traditional sintering process remains rather looser especially for the lower part. This proves that heat accumulation behavior of limonitic laterite sintering from top to bottom is extremely poorer due to the high crystal water, MgO, and Al2O3 contents, resulting in the massive loss of heat [22,23,24,25,46]. As it turned out, the poor sintering performance of the product sinter of the traditional sintering process is obtained corresponding to the results of Figure 3. Meanwhile, after an external mechanical pressure is applied, the tighter connection of particles contributes to the densification of the sinter and then the improving of the tumble index. All of which is further supported by Figure 6c,d. It can be found that the product sinter of the traditional sintering process is highly porous, mainly possessing large size and irregular pores with thinner walls, while the sinter microstructure of the pressurized densification sintering process is converted into large thick-wall or small thin-wall pores.
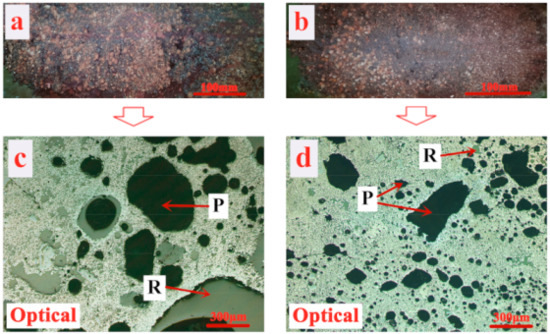
Figure 6.
Porous structure of product sinter of different sintering processes (P—Pore, R—Resin), (a) and (b) are porous macrostructures of the sinter of the traditional and pressurized densification sintering processes, respectively; (c) and (d) are porous microstructures of the product sinter of the traditional and pressurized densification sintering processes, respectively.
Combined with Figure 7, the sinter’s shrinkage of the pressurized densification sintering process reaches as high as 48.92%, much higher than that of the traditional sintering process, where it is also confirmed that the loose sinter tends to be much denser via pressurized densification. In the meantime, the relevant sinter porosity is dramatically reduced from 44.12% to 25.42%. Thus, the sintering performance of limonitic laterite is able to be greatly improved by the pressurized densification sintering process.
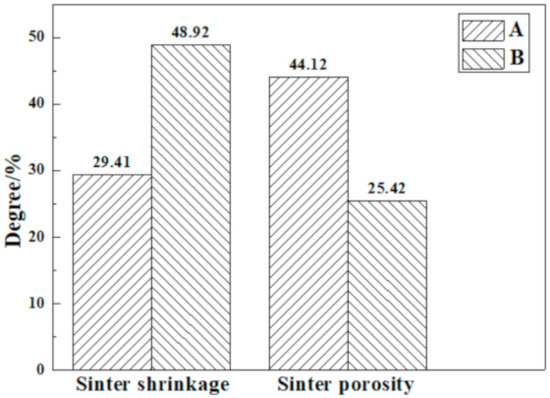
Figure 7.
Porosity and shrinkage of the product sinter of different sintering processes (A) Traditional sintering process, (B) Pressurized densification sintering process.
3.2.3. Consolidation Characteristics
Figure 8 demonstrates the occurrence of the main minerals of the product sinter of the two sintering processes. Hercynite ((Fe, Mg)·(Fe, Al)2O4) acts as the major solid phase formed by Mg2+ and Al3+ ions substituting for Fe2+ and Fe3+ ions, respectively [40]. Liquid bonding phases mainly include kirschsteinite (CaO·FeO·SiO2), monticellite (CaO·MgO·SiO2), fayalite (2FeO·SiO2) and silico-ferrite of calcium and alumina (SFCA). The former two minerals are identified as eutectic olivine phases generated by the eutectic reaction of fayalite (2FeO·SiO2) with gangue minerals or excessive lime (CaO) [50]. SFCA is considered as the most desirable liquid bonding phase in iron ore sinter due to its excellent reducibility, high mechanical strength, and low reduction degradation [42]. It is found that the intensity and quantity of diffraction peaks of SFCA and fayalite (2FeO·SiO2) in product sinter of pressurized densification sintering process are much higher than that of traditional sintering process while kirschsteinite (CaO·FeO·SiO2), monticellite (CaO·MgO·SiO2) and hercynite ((Fe, Mg)·(Fe, Al)2O4) present the opposite rule. This indicates that pressurized densification sintering is in favor of the formation of more high-quality liquid bonding phases, especially for SFCA, through promoting particles diffusion in solid-phase and liquid-phase reactions. Hence, sintering performance of limonitic laterite could be obviously improved via pressurized densification sintering.
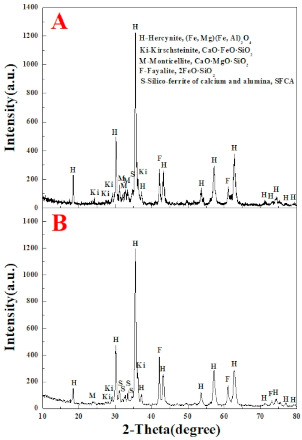
Figure 8.
X-ray diffraction patterns of the product sinter of different sintering processes (A) Traditional sintering process, (B) Pressurized densification sintering process.
As evidenced in Figure 9 and Table 4, the major solid phase (hercynite) presents in disseminated, tabular, or granular texture characterized as (Fe, Mg)·(Fe, Al)2O4, Fe(Fe, Al)2O4, and (Fe, Mg)Fe2O4, respectively, which is mainly formed by Mg from enstatite and Al from alumogoethite substituting for Fe of iron-bearing minerals. Besides hercynite, solid phases in the product sinter also contain a small amount of granular nickel-ferric spinel (NiFe2O4) and nubbly chromite spinel ((Fe, Mg)·(Cr, Fe, Al)2O4). The grains of the three types of solid phases distribute in a scattered manner with limited size and poor interconnection and could not be commendably wetted by liquid bonding phases such as eutectic spinel olivine and SFCA. Eutectic spinel olivine phases are divided into three types including CaO (Fe, Mg)Al2O4·SiO2, CaO·FeAl2O4·SiO2 and CaO (Fe, Mg)Fe2O4·SiO2 generated by the eutectic reaction of kirschsteinite (CaO·FeO·SiO2), monticellite (CaO·MgO·SiO2) and fayalite (2FeO·SiO2) with hercynite in various proportions. The three eutectic spinel olivine phases are identified as high smelting minerals due to the high MgO and Al2O3 contents, of which the formation needs more heat supply, namely higher solid fuel rate. SFCA exists in acicular, dendritic or tabular primarily found at the edge of pores with limited formation amount. Thus, the poor wettability of the liquid bonding phases on solid phases and limited amount of SCFA lead to low sinter strength. The massive formation of the solid phases and eutectic spinel olivine phases with high melting point results in a high solid fuel rate. The rather higher sinter porosity of 44.12% and the texture of the large thin-wall pores contribute to exceedingly fast sintering velocity, and then the rapid deterioration of sintering metallogenic condition, greatly reducing productivity of product sinter. It is extremely important to effectively improve the sintering performance of limonitic laterite.
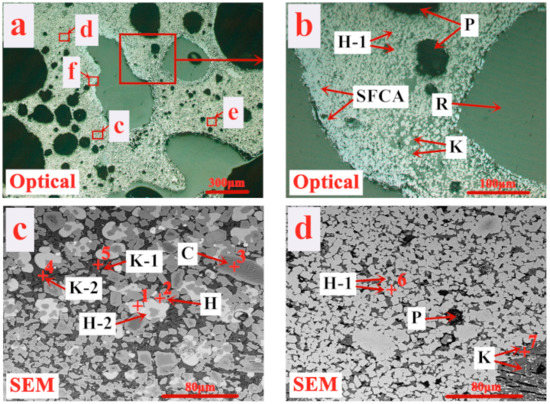
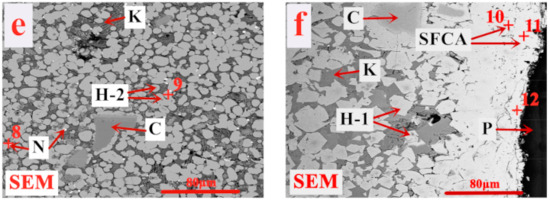
Figure 9.
Microstructure of product sinter (A) of traditional sintering process (H—(Fe, Mg)·(Fe, Al)2O4, H-1—Fe(Fe, Al)2O4, H-2—(Fe, Mg)Fe2O4, K—CaO·(Fe, Mg) Al2O4·SiO2, K-1—CaO·FeAl2O4·SiO2, K-2—CaO·(Fe, Mg)Fe2O4·SiO2, SFCA—silico-ferrite of calcium and alumina, N—NiFe2O4, C—(Fe, Mg)·(Cr, Fe, Al)2O4, P—Pore, R—Resin). (b–f) are the selected areas in (a).
Table 4.
EDS analysis results for areas in Figure 9.
Figure 10 presents the microstructure of the product sinter (B) of the pressurized densification sintering process. Combined with Table 5, it is observed that the pressurized densification sintering is more conducive to the formation of SFCA, especially for acicular and dendritic SFCA, which possess relatively higher self-strength [51]. Meanwhile, the external mechanical pressure field is available to promote the diffusion of particles in solid-phase and liquid-phase reactions and the extension of holding time at higher temperature, leading to the hercynite grains aggregation and growth and the formation of much tighter interlocking texture between hercynite and SFCA. Besides, the three types of eutectic spinel olivine phases are transformed into one type (CaO·(Fe, Mg)Al2O4·SiO2), further contributing to the homogenization and densification of sinter microstructure under better conditions of heat and mass transfer. Hence, the drastic improvement of the sinter microstructure and mineral compositions of limonitic laterite is achieved via the pressurized densification sintering process and eventually favors better sintering performance.
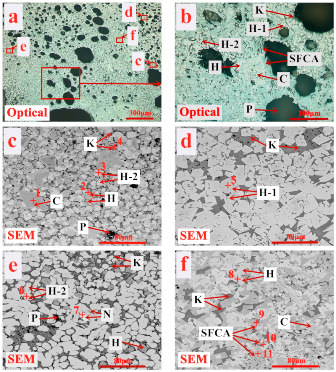
Figure 10.
Microstructure of the product sinter (B) of the pressurized densification sintering process (H—(Fe, Mg)(Fe, Al)2O4, H-1—Fe(Fe, Al)2O4, H-2—(Fe, Mg)Fe2O4, K—CaO·(Fe, Mg)Al2O4·SiO2, SFCA—silico-ferrite of calcium and alumina, N—NiFe2O4, C—(Fe, Mg)(Cr, Fe, Al)2O4, P—Pore). (b–f) are the selected areas in (a).
Table 5.
EDS analysis results for the areas in Figure 10.
Mineral compositions of product sinter of different sintering processes are determined, as shown in Table 6. Comparing the pressurized densification sintering process with the traditional sintering process of limonitic laterite, the amount of SCFA is significantly increased from 8.78% to 19.62% while the amounts of hercynite and eutectic spinel olivine are lowered to some extent agreeing with the results of Figure 8, Figure 9 and Figure 10. The more formation of high-strength liquid bonding phase (SFCA) is beneficial for sintering performance of the limonitic laterite. Overall, according to the above investigations, pressurized densification sintering contributes to better heat and mass transfer conditions during sintering and effectively improving mineral compositions and microstructure of product sinter, eventually achieving superior sintering performance of limonitic laterite.
Table 6.
Mineral compositions of product sinter of different sintering processes (area-%).
3.3. Industrial Application Prospect
Figure 11 describes the schematic diagram of the pressurized densification sintering process in industrial applicatiosn. Based on the sinter pot tests of the pressurized densification sintering of limonitic laterite, the relevant industrial application is arranged to be conducted in the sinter plant of Guangxi Beibu Gulf New Material Co., Ltd. (Beihai, China) acting as a major stainless-steel enterprise in China. This enterprise possesses an annual output of about 2.8 million tons of crude stainless steel and 2 million tons of product sinter. Its sinter plant contains two 132 m2 sintering machines with a length of 44 m and a width of 3 m and one 180 m2 sinter machine with a length of 45 m and a width of 4 m. The sintering performance of limonitic laterite of traditional sintering process in industrial application is confirmed pretty poor with tumble index and productivity of only 51.07% and 0.90 t·m−2·h−1 respectively and solid fuel rate of as high as 161.04 kg/t referring to the literature [18], which is the result of the formation of loose and porous sinter with a limited amount of high-strength liquid bonding phases. Thus, a series of compression rollers will be mounted on the top of the sinter bed to provide an external pressure field for the densification of the loose sinter (Figure 11). As shown in Table 6, the sinter indices of the limonitic laterite of the traditional process in industrial production has been obtained in the previous investigation [18]. It is expected that the tumble index and the productivity of the product sinter are both able to be improved by 15% and the solid fuel rate can be reduced by 10% via the pressurized densification sintering process (Table 7). According to the production planning, an increased production of product sinter of 300 thousand t/a and a saving of anthracite consumption of 37.04 thousand t/a are supposed to be achieved. On the basis of the unit prices of the product sinter and anthracite of 850 RMB/t and 750 RMB/t, respectively, a total new economic benefit of 282.78 million RMB/a can be created, as shown in Table 8. Therefore, the pressurized densification sintering process should be considered as an effective technology, not only for substantially improving the sintering performance of limonitic laterite but also bringing remarkable economic benefits for stainless steel enterprises.
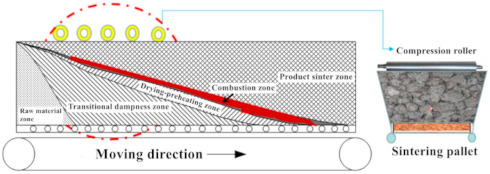
Figure 11.
Schematic diagram of the pressurized densification sintering process in industrial applications.
Table 7.
Comparison of the sinter indices of limonitic laterite sintering in industrial production.
Table 8.
Anticipated techno-economic benefits of pressurized densification sintering process.
4. Conclusions
Comparing the traditional sintering process with pressurized densification sintering process of limonitic laterite, sinter indices, metallurgical performance, and the relevant mechanism were investigated. In the meantime, the industrial application prospect of pressurized densification sintering process of limonitic laterite was explored. The conclusions are drawn as follows.
- With the optimization of an external mechanical pressure on top of the sinter bed during limonitic nickel laterite sintering, the tumble index, and productivity are increased by 19.2% and 18.6%, respectively, and solid fuel rate is lowered by 10.3%. A great improvement in the sintering performance of limonitic laterite is achieved via pressurized densification sintering. Besides, the metallurgical performance remains excellent with RI and RDI+3.15mm of over 75% and 95%, respectively.
- The exhaust-gas temperature peak value is increased significantly with external mechanical pressure. In the meantime, excessive vertical sintering speed is under control due to the the densification of loose sinter. The application of an external pressure field promotes the synchronization of the heat front velocity and combustion front velocity during sintering and then better heat and mass transfer conditions.
- The mineralogy of the product sinter indicates that the external pressure field contributes to homogenizing and densifying the sinter microstructure during sintering with sinter porosity reduced by 42.4% and SFCA amount increased from 8.78% to 19.62%. The more efficient diffusion of particles in solid-phase and liquid-phase reactions leads to hercynite grains aggregation and growth and the formation of tighter interlocking texture between hercynite and SFCA. Pressurized densification sintering dramatically improves the microstructure and mineral compositions of product sinter and eventually achieves superior sintering performance of limonitic laterite.
- Industrial application of pressurized densification sintering process of limonitic laterite will be carried out in the sinter plant of one major Chinese stainless-steel enterprise. The sintering performance of limonitic laterite is expected to be improved significantly with the tumble index and the productivity both increased by 15% and solid fuel rate lowered by 10%. A total new economic benefit of 282.78 million RMB/a can be created. Thus, the pressurized densification sintering process should be identified as an effective technology not only obtaining better sintering performance of limonitic laterite but also bringing about remarkable economic benefits.
Author Contributions
Conceptualization was done by D.Z. and J.P. Data curation and writing—original draft were performed by Y.X. Investigation was carried out by Y.X., H.T. and X.D. Methodology was conceived by Y.X., D.Z. and J.P. Resources were provided by D.Z., J.P., Q.H., L.P. and X.H. Supervision was completed by Z.G. and C.Y. Writing—review and editing was conducted by D.Z. All authors have read and agreed to the published version of the manuscript.
Funding
This research was funded by the Major Project of Master Alloy Manufacture for Heat Resistant Stainless-Steel Production, grant number [AA18242003].
Acknowledgments
Financial support from the Major Project of Master Alloy Manufacture for Heat Resistant Stainless-Steel Production No. (AA18242003) approved by the Provincial Government of Guangxi Zhuang Autonomous District, is sincerely acknowledged. We are also thankful to the Analytical and Testing Center of Central South University, which supplied us with facilities to fulfill the measurement.
Conflicts of Interest
The authors declare no conflict of interest.
References
- Reck, B.K.; Rotter, V.S. Comparing growth rates of nickel and stainless steel use in the early 2000s. J. Ind. Ecol. 2012, 16, 518–528. [Google Scholar] [CrossRef]
- Komnitsas, K.; Petrakis, E.; Pantelaki, O.; Kritikaki, A. Column leaching of Greek low-grade limonitic laterites. Minerals 2018, 8, 377. [Google Scholar] [CrossRef]
- Roki, F. Climate change policy to foster pollution prevention and sustainable industrial practices-A case study of the global nickel industry. Miner. Eng. 2012, 39, 196–205. [Google Scholar]
- Thorne, R.; Roberts, S.; Herrington, R. Climate change and the formation of nickel laterite deposits. Geology 2012, 40, 331–334. [Google Scholar] [CrossRef]
- Orberger, B.; Van Der Ent, A. Nickel laterites as sources of nickel, cobalt and scandium: Increasing resource efficiency through new geochemical and biological insights. J. Geochem. Explor. 2019, 204, 297–299. [Google Scholar] [CrossRef]
- Guo, Z.; Zhu, D.; Pan, J.; Zhang, F. Mineralogical characteristics and preliminary beneficiation of nickel slag from reduction roasting-ammonia leaching. Minerals 2017, 7, 98. [Google Scholar]
- Cracknell, M.J.; Jansen, N.H. National virtual core library hylogging data and ni–co laterites: A mineralogical model for resource exploration, extraction and remediation. Aust. J. Earth Sci. 2016, 63, 1053–1067. [Google Scholar] [CrossRef]
- Isatelle, F.; Rivoirard, J. Mineral resources classification of a nickel laterite deposit: Comparison between conditional simulations and specific areas. J. S. Afr. Inst. Min. Met. 2019, 119, 871–882. [Google Scholar] [CrossRef]
- Rodrigues, F.; Pickles, C.A.; Peacey, J.; Elliott, R.; Forster, J. Factors affecting the upgrading of a nickeliferous limonitic laterite ore by reduction roasting, thermal growth and magnetic separation. Minerals 2017, 7, 176. [Google Scholar] [CrossRef]
- Mudd, G.M.; Jowitt, S.M. A detailed assessment of global nickel resource trends and endowments. Econ. Geology 2014, 109, 1813–1841. [Google Scholar] [CrossRef]
- Eckelman, M.J. Facility-level energy and greenhouse gas life-cycle assessment of the global nickel industry. Resour. Conserv. Recycl. 2010, 54, 256–266. [Google Scholar] [CrossRef]
- Moskalyk, R.; Alfantazi, A. Nickel laterite processing and electrowinning practice. Miner. Eng. 2002, 15, 593–605. [Google Scholar] [CrossRef]
- Liu, P.; Li, B.; Cheung, S.C.; Wu, W. Material and energy flows in rotary kiln-electric furnace smelting of ferronickel alloy with energy saving. Appl. Therm. Eng. 2016, 109, 542–559. [Google Scholar] [CrossRef]
- Mudd, G.M. Global trends and environmental issues in nickel mining: Sulfides versus laterites. Ore Geol. Rev. 2010, 38, 9–26. [Google Scholar] [CrossRef]
- Tsuji, H. Behavior of reduction and growth of metal in smelting of saprolite Ni-ore in a rotary kiln for production of ferro-nickel alloy. ISIJ Int. 2012, 52, 1000–1009. [Google Scholar] [CrossRef][Green Version]
- Tian, H.; Pan, J.; Zhu, D.; Yang, C.; Guo, Z.; Xue, Y. Improved beneficiation of nickel and iron from a low-grade saprolite laterite by addition of limonitic laterite ore and CaCO3. J. Mater. Res. Technol. 2020, 9, 2578–2589. [Google Scholar] [CrossRef]
- Lv, X.W.; Bai, C.G.; He, S.P.; Huang, Q.Y. Mineral change of Philippine and Indonesia nickel lateritic ore during sintering and mineralogy of their sinter. ISIJ Int. 2010, 50, 380–385. [Google Scholar] [CrossRef]
- Zhu, D.; Xue, Y.; Pan, J.; Yang, C.; Guo, Z.; Tian, H.; Liao, H.; Pan, L.; Huang, X. An investigation into the distinctive sintering performance and consolidation mechanism of limonitic laterite ore. Powder Technol. 2020, 367, 616–631. [Google Scholar] [CrossRef]
- Zhang, T.; Zuo, H.B.; Zhang, J.L.; Xu, C.F.; Du, S. Analysis of application of high proportion laterite nickel ore in sinter production. Sinter. Pellet. 2013, 38, 6–9. (In Chinese) [Google Scholar]
- Panychev, A.A. Potential for the use of low-grade limonite ores from dumps. Metallurgist 2006, 50, 45–48. [Google Scholar] [CrossRef]
- Kawaguchi, T.; Usui, T. Summarized achievements of the porous meso-mosaic texture sinter research project. ISIJ Int. 2005, 45, 414–426. [Google Scholar] [CrossRef][Green Version]
- Landers, M.; Gilkes, R. Dehydroxylation and dissolution of nickeliferous goethite in New Caledonian lateritic Ni ore. Appl. Clay Sci. 2007, 35, 162–172. [Google Scholar] [CrossRef]
- Landers, M.; Gilkes, R.; Wells, M. Dissolution kinetics of dehydroxylated nickeliferous goethite from limonitic lateritic nickel ore. Appl. Clay Sci. 2009, 42, 615–624. [Google Scholar] [CrossRef]
- Li, T.; Sun, C.; Liu, X.; Song, S.; Wang, Q. The effects of MgO and Al2O3 behaviours on softening? Melting properties of high basicity sinter. Ironmak. Steelmak. 2018, 45, 755–763. [Google Scholar] [CrossRef]
- Li, H.; Wu, S.; Hong, Z.; Zhang, W.; Zhou, H.; Kou, M. The mechanism of the effect of Al2O3 content on the liquid phase fluidity of iron ore fines. Processes 2019, 7, 931. [Google Scholar] [CrossRef]
- Lu, L.; Holmes, R.J.; Manuel, J.R. Effects of alumina on sintering performance of hematite iron ores. ISIJ Int. 2007, 47, 349–358. [Google Scholar] [CrossRef]
- Umadevi, T.; Deodar, A.V.; Mahapatra, P.C.; Prabhu, M.; Ranjan, M. Influence of alumina on iron ore sinter properties and productivity in the conventional and selective granulation sintering process. Steel Res. Int. 2009, 80, 686–692. [Google Scholar]
- Pownceby, M.I.; Webster, N.A.S.; Manuel, J.R.; Ware, N. The influence of ore composition on sinter phase mineralogy and strength. Miner. Process. Extr. Met. 2016, 125, 140–148. [Google Scholar] [CrossRef]
- Kawaguchi, T.; Matsumura, M. Development of sinter quality and the technology with corresponding to the change of iron ore resources: 100 years of sintering process and to the future. Etsu Hagane J. Iron Steel Inst. Jpn. 2014, 100, 148–159. [Google Scholar] [CrossRef]
- Umadevi, T.; Sah, R.; Mahapatra, P.C. Influence of sinter basicity (CaO/SiO2) on low and high alumina iron ore sinter quality. Miner. Process. Extr. Met. 2014, 123, 75–85. [Google Scholar] [CrossRef]
- De Magalhaes, M.S.; Brandao, P.R.G. Microstructures of industrial sinters from Quadrilatero Ferrifero’s iron ores, Minas Gerais State Brazil. Miner. Eng. 2003, 16, 1251–1256. [Google Scholar] [CrossRef]
- Zhang, F.; Zhu, D.Q.; Pan, J. Sintering Performance of Blends Containing High Proportion of Limonite. In Proceedings of the 8th International Symposium on High-Temperature Metallurgical Processing, San Diego, CA, USA, 26 February–2 March 2017. [Google Scholar]
- Liu, D.-H.; Zhang, J.; Xue, X.; Wang, G.; Kang, Q.-F. Basic characteristics of Australian iron ore concentrate and its effects on sinter properties during the high-limonite sintering process. Int. J. Miner. Met. Mater. 2017, 24, 991–998. [Google Scholar] [CrossRef]
- Fan, B.; Wang, Z.H.; Wang, J.C.; Zhou, F.Q.; Quan, Q. Experiment research on limonitic laterite ore sintering. Ferro. Alloys 2015, 11, 21–24. (In Chinese) [Google Scholar]
- Pan, L.T. Laterite nickel ore sintering production practice research. Ferro. Alloys 2013, 2, 7–10. (In Chinese) [Google Scholar]
- Loo, C.E.; Heikkinen, J. Structural transformation of beds during iron ore sintering. ISIJ Int. 2012, 52, 2158–2167. [Google Scholar] [CrossRef]
- Zhu, D.Q.; Xue, Y.X.; Pan, J.; Yang, C.C.; Guo, Z.Q.; Tian, H.Y.; Wang, D.Z. Strengthening Sintering of Limonitic Nickel Laterite by Substituting Ferronickel Tailings for Sintering Fluxes. In Proceedings of the 11th International Symposium on High-Temperature Metallurgical Processing, San Diego, CA, USA, 23–27 February 2020. [Google Scholar]
- Umadevi, T.; Deodhar, A.; Mahapatra, P.; Prabhu, M.; Ranjan, M. Influence of coating granulation process on iron ore sinter quality and productivity. Steel Res. Int. 2010, 81, 716–723. [Google Scholar] [CrossRef]
- Zhu, D.; Shi, B.; Pan, J.; Zhang, F. Effect of pre-briquetting on the granulation of sinter mixture containing high proportion of specularite concentrate. Powder Technol. 2018, 331, 250–257. [Google Scholar] [CrossRef]
- Contreras, J.; Castillo, G.; Rodríguez, E.A.; Das, T.; Guzmán, A. Microstructure and properties of hercynite–magnesia–calcium zirconate refractory mixtures. Mater. Charact. 2005, 54, 354–359. [Google Scholar] [CrossRef]
- Zhao, J.; Loo, C.E. Dependence of flame front speed on iron ore sintering conditions. Miner. Process. Extr. Met. 2016, 125, 165–171. [Google Scholar] [CrossRef]
- Ono, H.; Dohi, Y.; Arikata, Y.; Usui, T. Effect of mineral composition and pore structure on reducibility of composite iron ore sinter. ISIJ Int. 2009, 49, 722–728. [Google Scholar] [CrossRef]
- Zhu, D.; Chou, J.; Shi, B.; Pan, J. Influence of MgO on low temperature reduction and mineralogical changes of sinter in simulated COREX shaft furnace reducing conditions. Minerals 2019, 9, 272. [Google Scholar] [CrossRef]
- Wang, Y.-Z.; Liu, Z.; Zhang, J. Characteristics of combustion zone and evolution of mineral phases along bed height in ore sintering. Int. J. Miner. Met. Mater. 2017, 24, 1087–1095. [Google Scholar] [CrossRef][Green Version]
- Loo, C.E.; Tame, N.; Penny, G.C. Effect of iron ores and sintering conditions on flame front properties. ISIJ Int. 2012, 52, 967–976. [Google Scholar] [CrossRef]
- Okazaki, J.; Hosotani, Y. Effect of mineralogical properties of iron ore on pore formation of sinter. Tetsu Hagane 2001, 87, 298–304. [Google Scholar] [CrossRef]
- Wu, F.; Zhou, B.Y.; Li, Z.J.; Qu, D.L.; Xu, N.; Li, L.S. Hot-pressing sintering performance of block magnesite ore. J. Chin. Ceram. Soc. 2014, 42, 1600–1604. (In Chinese) [Google Scholar]
- Liu, D.; Evans, G.; Loo, C.E. Iron ore sinter structure development under realistic thermal conditions. Chem. Eng. Res. Des. 2018, 130, 129–137. [Google Scholar] [CrossRef]
- Liu, D.; Loo, C.E.; Evans, G. Flow characteristics of the molten mix generated during iron ore sintering. Int. J. Miner. Process. 2016, 149, 56–68. [Google Scholar] [CrossRef]
- Sokol, E.; Sharygin, V.; Kalugin, V.; Volkova, N.; Nigmatulina, E. Fayalite and kirschsteinite solid solutions in melts from burned spoil-heaps, South Urals, Russia. Eur. J. Miner. 2002, 14, 795–807. [Google Scholar] [CrossRef]
- Webster, N.A.S.; Churchill, J.G.; Tufaile, F.; Pownceby, M.I.; Manuel, J.R.; Kimpton, J.A. Fundamentals of Silico-Ferrite of Calcium and Aluminium (SFCA) and SFCA-I Iron Ore Sinter Bonding Phase Formation: Effects of Titanomagnetite-based Ironsand and Titanium Addition. ISIJ Int. 2016, 56, 1715–1722. [Google Scholar] [CrossRef]


© 2020 by the authors. Licensee MDPI, Basel, Switzerland. This article is an open access article distributed under the terms and conditions of the Creative Commons Attribution (CC BY) license (http://creativecommons.org/licenses/by/4.0/).