Article

Growth Interruptions in Arctic Rhodoliths Correspond to Water Depth and Rhodolith Morphology

1
GeoZentrum Nordbayern, Friedrich-Alexander-Universität Erlangen-Nürnberg (FAU), 91054 Erlangen, Germany
2
Senckenberg am Meer, Marine Research Department, 26382 Wilhelmshaven, Germany
*
Author to whom correspondence should be addressed.
Minerals 2021, 11(5), 538; https://doi.org/10.3390/min11050538
Submission received: 28 April 2021 / Revised: 12 May 2021 / Accepted: 13 May 2021 / Published: 19 May 2021
(This article belongs to the Special Issue Polar Marine Carbonates)

Abstract

:
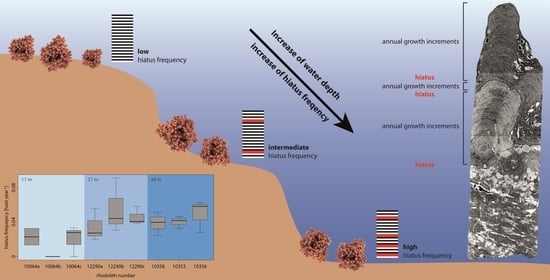
Coralline algae that form rhodoliths are widespread globally and their skeletal growth patterns have been used as (paleo-) environmental proxies in a variety of studies. However, growth interruptions (hiati) within their calcareous skeletons are regarded as problematic in this context. Here we investigated how hiati in the growth of Arctic rhodoliths from the Svalbard archipelago correspond to their environment and morphology. Using X-ray micro-computed tomography and stepwise model selections, we found that rhodoliths from deeper waters are subject to more frequent hiatus formation. In addition, rhodoliths with a higher sphericity (i.e., roundness) are less often affected by such growth interruptions. We conclude that these correlations are mainly regulated by hydrodynamics, because, in deeper waters, rhodoliths are not turned frequently enough to prevent a dieback of coralline algal thalli forming on the underside of the rhodolith. In this coherence, spheroidal rhodoliths are turned more easily, therefore shortening the amount of time between turnover events. Moreover, the incidence of light is more advantageous in shallower waters where rhodoliths exhibit a greater share of their surface to diffused ambient light, thus enabling thallus growth also on the down-facing surface of the rhodoliths. In consequence, information on the frequency of hiatus formation combined with rhodolith morphology might serve as a valuable proxy for (paleo-)environmental reconstructions in respect to light availability and the hydrodynamic regime.

Graphical Abstract

1. Introduction

The rhodoliths that mainly consist of the coralline algal species Lithothamnion glaciale Kjellman 1883 are major contributors to the local carbonate production, with an output ranging from 100.9 g (CaCO3) m−2 yr−1 in Nordkappbukta at 80.5° N over 119.8 g (CaCO3) m−2 yr−1 in Mosselbukta at 79.9° N to 200.3 g (CaCO3) m−2 yr−1 in Isfjorden at 78.3° N [1]. These rhodoliths form extensive beds along the coasts of Spitsbergen and Nordaustlandet [2,3], some of which have been known since the nineteenth century [4]. The rhodoliths of Svalbard occur in a variety of shapes and internal structures, including nucleated and hollow forms. From an ecological perspective, especially the hollow rhodoliths are of great importance as they provide ecological niches for organisms of various clades, thereby increasing significantly the local biodiversity [5].
As a consequence of the short growing season at such high latitudes, the rhodolith-forming specimens of L. glaciale grow very slow, with an average crust thickness increase of 0.075 ± 0.024 (SD) mm yr−1 (Teichert, own observations). Therefore, large L. glaciale rhodoliths with a crust thickness of several centimeters are usually several tens to hundreds of years old [1], which renders them as a potential archive for climate proxy data [6,7], as they often expose banding patterns with an annual resolution [8,9]. The annual banding pattern results from an alternation of larger cells formed in summer and smaller cells formed in winter [8], allowing for an assignation of each increment to a specific year, comparable to dendrochronology. In this context, structural and chemical properties of L. glaciale growth increments have successfully been correlated with Greenland ice sheet runoff [10], ambient water temperatures [11], and atmospheric CO2 concentrations [7]. However, since the rhodoliths are not attached to the seafloor and can be moved under various circumstances [12,13], the formation of growth interruptions can be a significant issue. These growth interruptions—so-called hiati (Sg. hiatus, like the interruption between sedimentological strata)—form when a specific area of a rhodolith, that hitherto has been exposed to sufficient growth conditions in terms of light availability and gas exchange [14], is facing downwards after rhodolith movement. Consequently, this area is not receiving enough light for photosynthesis and, in addition, may become covered by sediment. The specific thallus area of the coralline alga can die back after some time, depending also on the substrate quality [14]. Later and after another movement, this spot of the rhodolith can be recolonized by the very same species. Such a hiatus is easily distinguishable from the common succession of growth increments, because the primigenous filaments of newly colonizing thallus have much larger and perpendicularly arranged cells [15]. Estimating the amount of time comprised in a hiatus by radiometric methods is seldom possible due to the diminutive amounts of skeletal material contained in the growth increments. Therefore, there is no pragmatic possibility to assign the underlying increments (i.e., the ones formed before the hiatus occurred) to specific years. For this reason, when they appear in the shape of rhodoliths, the usability of coralline algae as geochemical archive is limited, because only skeletal transects without hiati can be used for such analyses. Consequently, when it comes to correlation measures between coralline algal geochemistry and environmental parameters like water temperature, coralline algal specimens that grow attached to a fixed substratum generally provide more reliable results than those that grow as unattached rhodoliths, since growth interruptions as a consequence of turning do not occur in attached specimens [6], as for example in the so-called clathrostromes built by Clathromorphum compactum (Kjellman) Foslie 1898 [16,17].
However, the existence of hiati in rhodoliths might in turn offer a valuable environmental proxy. Rhodoliths have been used extensively to reconstruct (paleo-)environmental conditions, but mostly with regards to their size and morphology, wherein rhodoliths with a higher sphericity (i.e., roundness) have been attributed to higher water energies [18,19,20]. Moreover, changes in the taxonomic composition during the life cycle of a rhodolith have been associated to changes in water depth [21] and the presence of specific genera or higher taxonomical units has been used to reconstruct climatic regions [22,23]. Nevertheless, several studies note that water energy like waves and currents is not the only force capable of moving rhodoliths, but that organisms do also play an important role [12,20,24]. At the Svalbard archipelago, for example, it has been shown that echinoids are the main biological force in moving rhodoliths while browsing the seafloor for food [12].
Another issue that has been widely neglected with regard to rhodolith shape analysis is the presence of nuclei within rhodoliths. In the area around Svalbard, most of the rhodoliths do feature glaciogenic cobbles as nuclei in their interior. Glaciogenic cobbles expose a great variety of shapes and even in rhodoliths that are several tens to hundreds of years old, the shape of the former nucleus is still pronounced [3]. This makes it difficult to rely the reconstruction of hydrodynamics solely on the rhodolith morphology—at least in polar, glacier-imprinted environments like the Svalbard archipelago.
Therefore, the analysis of rhodolith hiati patterns instead of rhodolith morphologies may serve as an alternative for the reconstruction of hydrodynamics, as they are not overprinted by the rhodolith nuclei. Using rhodoliths collected from Mosselbukta in the Arctic Svalbard archipelago from three different water depths (11, 27, and 46 m), this study tests if there is a significant difference in the formation of hiati according to water depth, implying that shallow waters are characterized by regular wave- or storm-induced movement of the rhodoliths, while such movement in deeper water levels is restricted to occasional storm events and is limited to more regular and restricted movement via biotic interactions only. Additionally, the light regime in Mosselbukta indicates that the shallow areas at 11 m are located in the euphotic zone, while at 27 m depth, there is a transition to the dysphotic zone and at 46 m water depth, the light regime is entirely dysphotic [3,12]. Additionally, the presence of fine sediments—which are especially detrimental when rhodoliths are covered by them [14]—is more common in deeper than in shallow waters at Mosselbukta [25]. Furthermore, the analysis incorporates the potential effects of rhodolith morphology and weight on the formation of hiati, testing three hypotheses:
  • Hiatus frequency increases with water depth as shallow-water specimens are turned more regularly by currents and by wave action (i.e., no thallus dieback between turning events), while the hydrodynamically induced turning of deep-water specimens is restricted to storm events so that chiefly biotic interactions cause movement (i.e., dieback between turning events). Additionally, the photosynthetically active radiation which is necessary for rhodolith growth decreases with water depth and the presence of detrimental fine sediments increases with water depth.
  • Hiatus frequency decreases with sphericity, considering that (a) rounder rhodoliths are turned more easily, and because (b) the rounder the rhodolith, the less surface is in direct contact to the sediment when facing downward and the more rhodolith surface is reached by ambient light.
  • Rhodolith weight and volume do not significantly affect hiatus frequency since both hydrodynamics and biotic interactions (such as for instance rhodolith-moving echinoids [12]) are able to move rhodoliths of all the size classes we have studied.

2. Materials and Methods

2.1. Rhodolith Sampling

Rhodolith samples were obtained during the MSM 55 expedition (ARCA) of RV Maria S. Merian from 11th to 29th June 2016 [25]. Rhodoliths were collected from three different water depths in Mosselbukta (see Table 1 for an overview), a bay situated at the north coast of Spitsbergen, Svalbard archipelago, using the manned submersible JAGO or a beam trawl (Figure 1). All rhodoliths were dried in cabinet desiccators at 30 °C for 48 h and stored in sealed plastic bags containing silica gel as a drying agent.
Three rhodoliths from each water depth (11, 27, 46 m) were selected for further analysis, thereby choosing specimens with differing weights and morphologies. This was done to add more variables that might explain the hiatus frequency. Rhodoliths were weighed using a Kern EMB lab balance and measured across the main axes (long, intermediate, short) using a Hazet digital caliper. Sphericities (ΨP maximum projection sphericity) were calculated using the equation
S p h e r i c i t y = S 2 L I 3
where S is the short axis, L the long axis, and I the intermediate axis of each rhodolith, respectively, according to Sneed and Folk [26]. Rhodolith shape was furthermore visualized using TRI-PLOT version 1.4.2 [27]. Volumes of each rhodolith were obtained by µCT scanning, corresponding to the procedure used for protuberance analysis which is outlined in detail below.

2.2. Protuberance Sampling and Examination

All sampled rhodoliths were formed by the coralline algal species Lithothamnion glaciale Kjellman 1883. In this species, the formation of protuberances is very common and they are the main production areas of skeletal material [1]. Therefore, these areas of the rhodolith are most suitable for growth pattern analyses. To obtain the respective material, three protuberances per rhodolith were chosen and sampled by a water-cooled, hollow diamond drill bit with an inner diameter of 4.5 mm. The drill bit was mounted to a Fein ASCM 18 QM electric drill operated in a Fein drill rig. Due to different thicknesses of the coralline algal skeleton in the respective samples, the lengths of the drill cores differ and are as long as possible. However, this is no issue regarding the statistical analyses because we did not count the absolute numbers of hiati, but their frequency.
To visualize the growth patterns within the protuberances via X-ray micro-computed tomography (µCT), the drill cores were mounted on borosilicate glass rods using hot-melt adhesive.
Scans were performed on a General Electric Phoenix v|tome|x s 240 µCT scanner (GE/Phoenix, Wunstdorf, Germany) with a 180 kV Nanotube, using a 0.1 mm copper filter. During a full rotation of each sample, 1500 frames were taken at 200 ms exposure time at 100 kV and 100 mA of current. These settings were kept the same for all samples as these values gave the best results in terms of resolution and brightness. Depending on the size of the sample, the scanning time varied between 20 to 160 min.
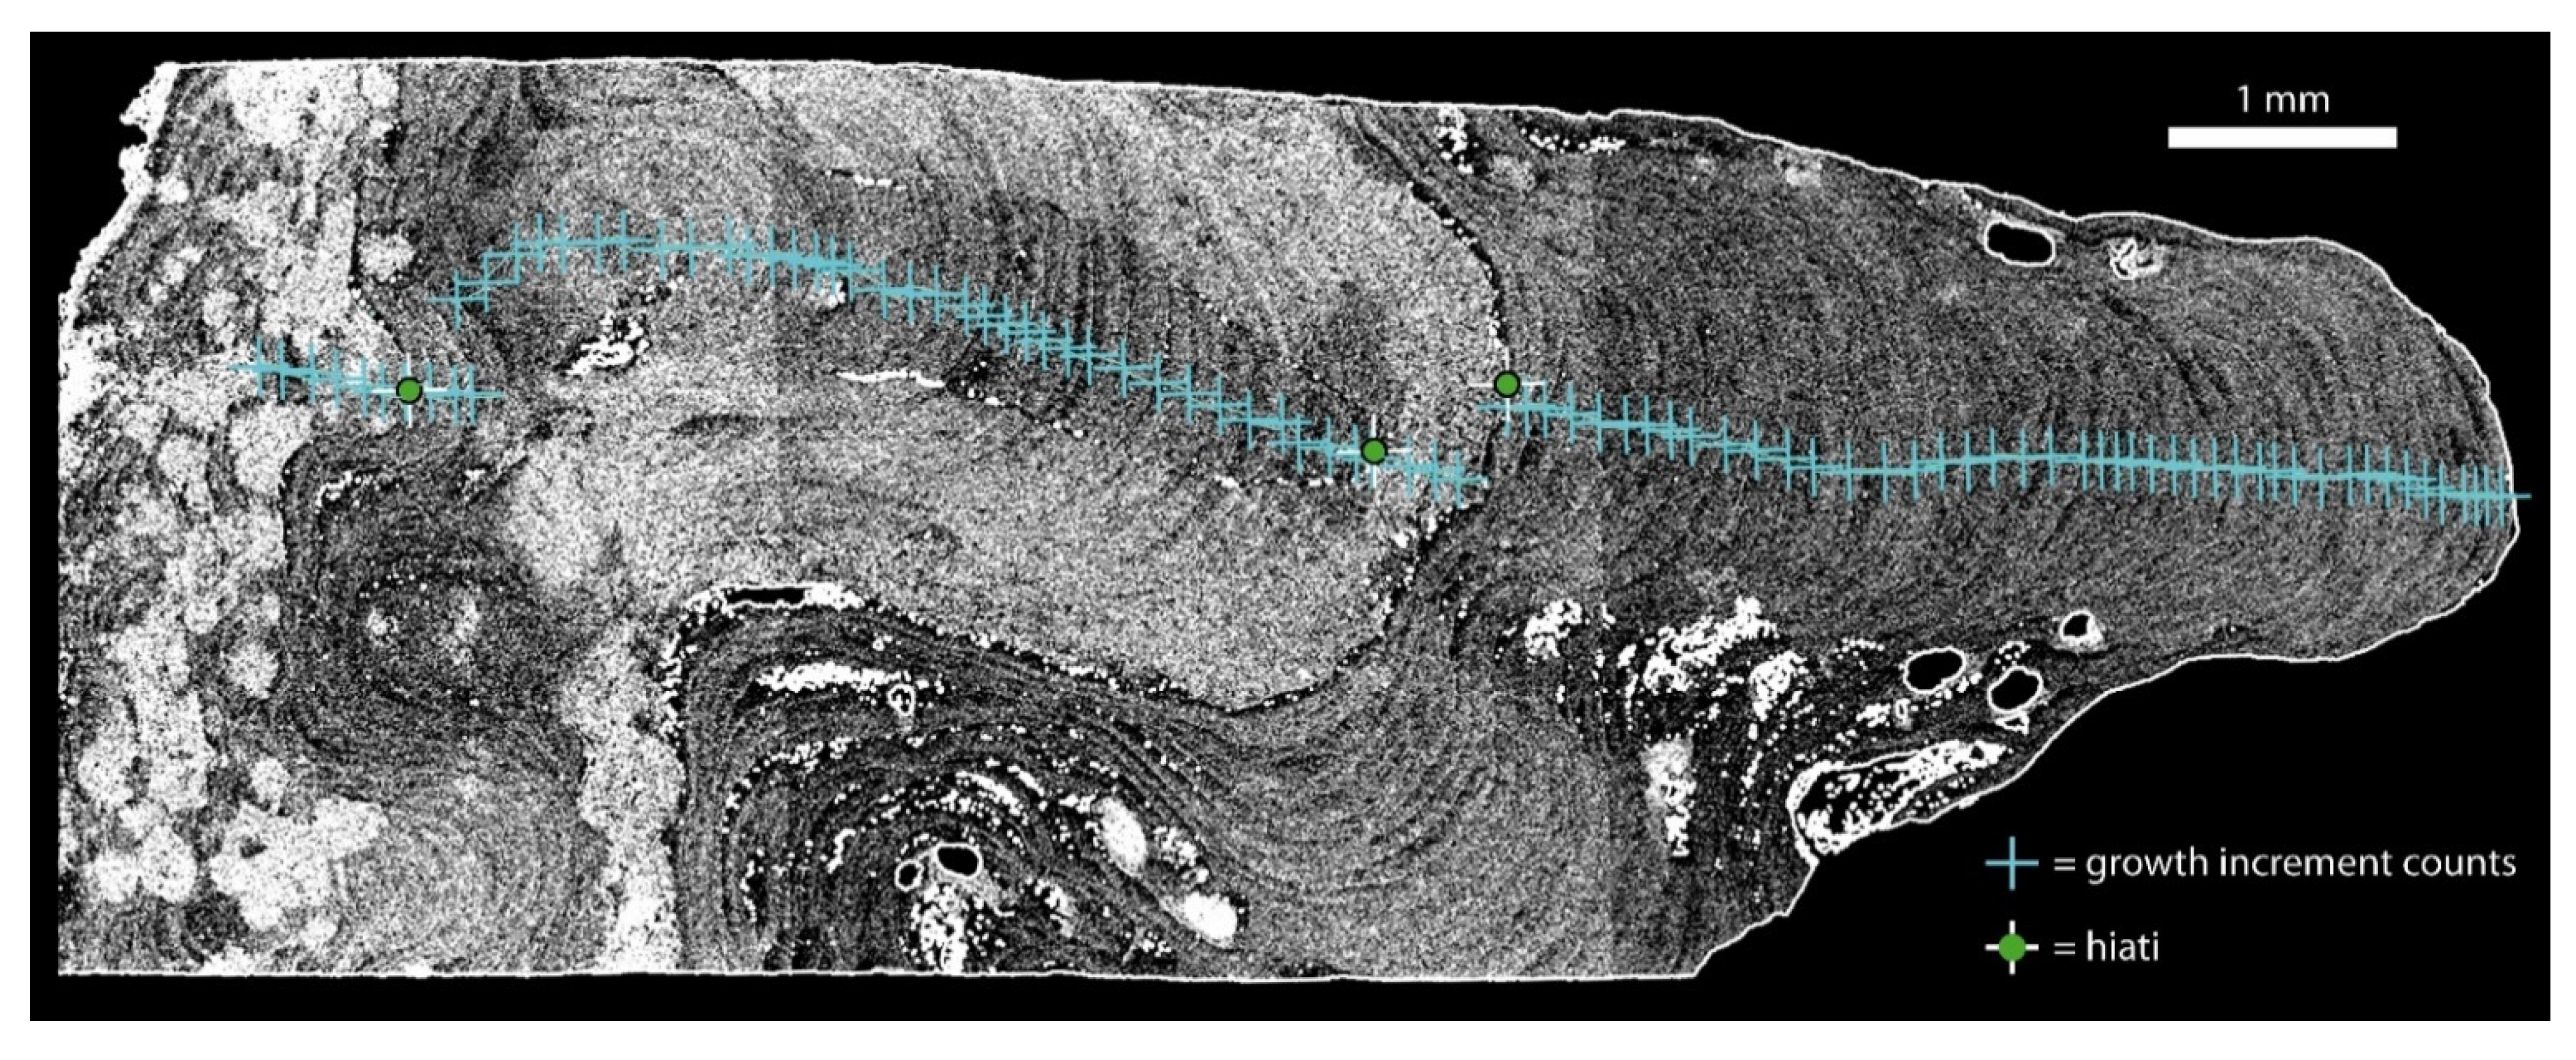
Raw data were reconstructed with the GE datos|x software version 2.4 (GE/Phoenix, Wunstdorf, Germany), using a Feldkamp algorithm based on a filtered back projection. For noise reduction of the reconstructed data set, a median filter (VolumeGraphics Studio MAX software version 3.0, VolumeGraphics, Heidelberg, Germany) within a local neighborhood of 3 voxels (diameter of neighborhood area) was used. All post-processing was performed with the VolumeGraphics software, resulting in longitudinal sections through the center of each protuberance. In order to do a growth pattern analysis in ImageJ version 1.53c, each longitudinal section was exported to a TIFF-format file. In ImageJ, the annual growth increments (visible as an alternation of bright and dark bandings) and hiati (visible in terms of the large and perpendicularly running primigenous cells) were counted and the hiatus frequency was calculated, expressed as hiati per year.

2.3. Statistical Analyses

All statistical analyses were performed in R version 3.6.0 [28]. Hiatus frequency for each rhodolith and each water depth was visualized by boxplots. The dataset was then split according to water depth, resulting in three different datasets (11, 27, 46 m). For each of them, hiatus frequency data were checked for normal distribution using a Shapiro–Wilk normality test and for homogeneity of variances (homoscedasticity, i.e., variables have the same finite variance) using a Levene’s test. To assess if the protuberances from each water depth could be used as one basic population individually, all three datasets were tested with a variance analysis. For the datasets with normally distributed data, this was done by fitting an analysis of variance model (one-way ANOVA). For non-normally distributed data, this was done by a Kruskal–Wallis rank sum test. The variables potentially influencing hiatus frequency (water depth, rhodolith weight, rhodolith volume, and rhodolith sphericity) were tested for collinearity. Their potential impact on hiatus frequency was estimated by stepwise model selection based on the Akaike Information Criterion (AIC) for linear regression models using the complete dataset (11, 27, and 46 m water depth) and model functions were visualized.

3. Results

3.1. Rhodolith and Protuberance Data

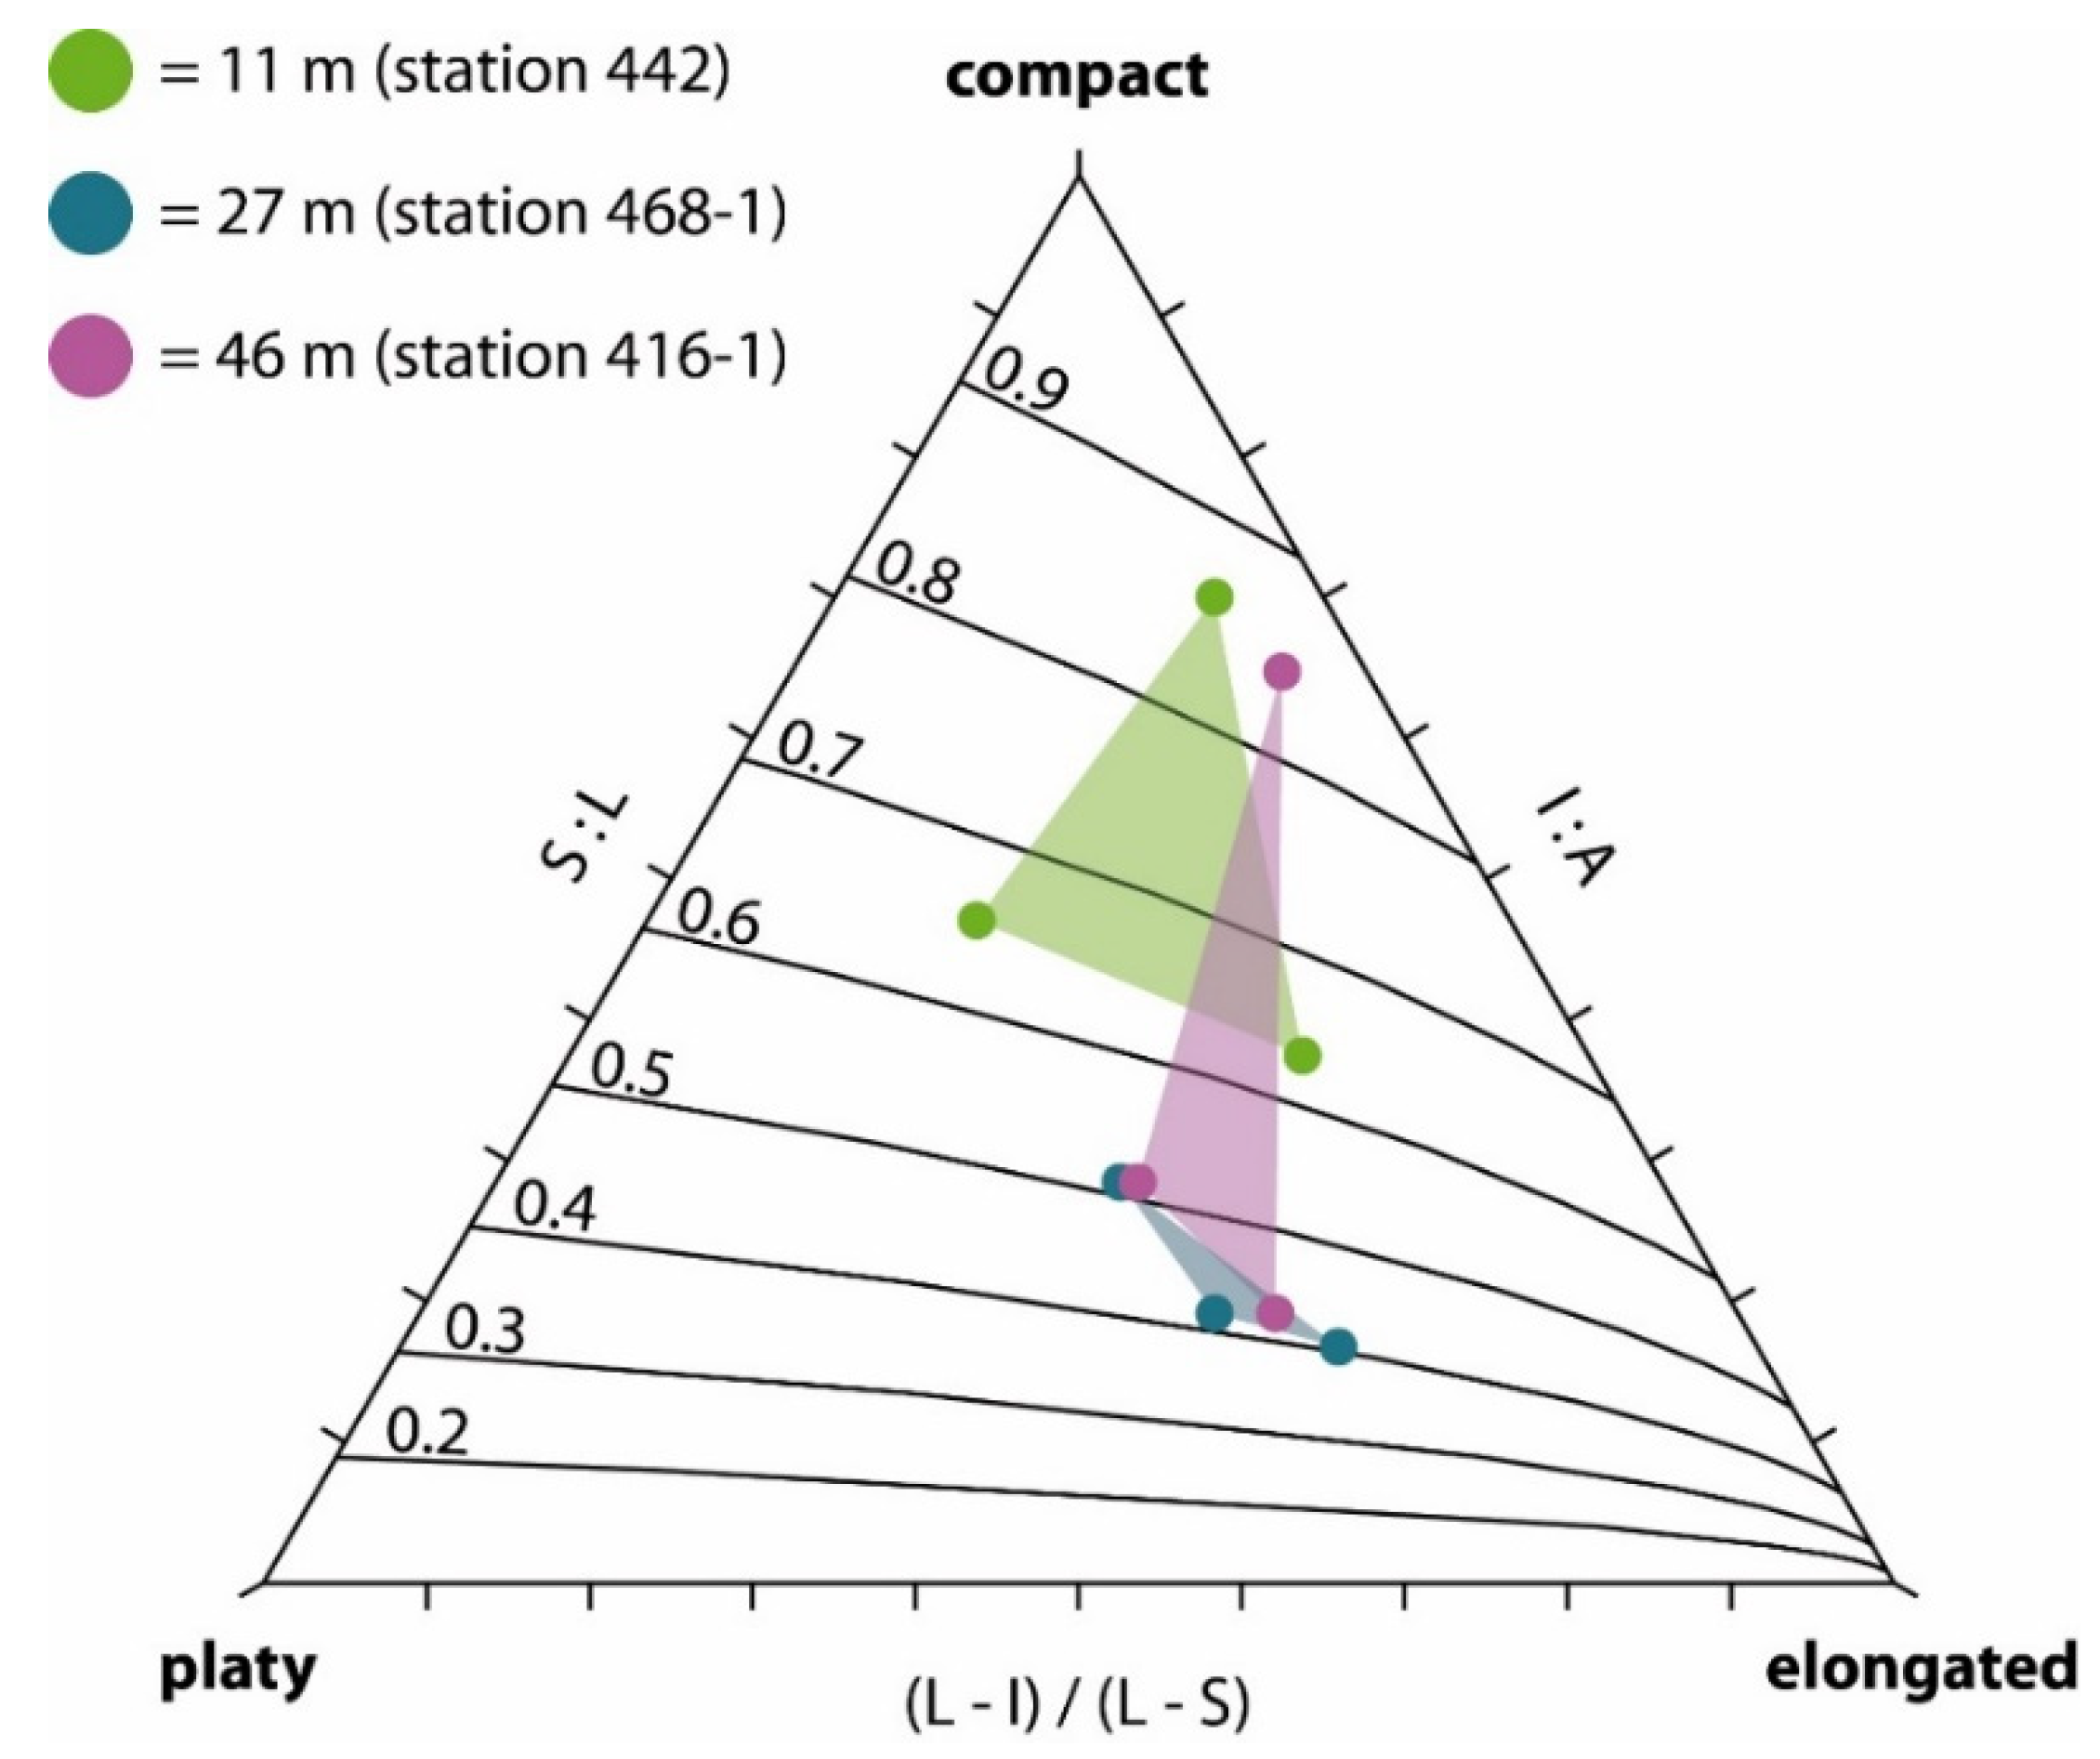
Rhodolith shapes classified according to SneedandFol [26] indicate that compact shapes occur only at 11 m water depth, while the other depths are dominated by platy and elongate shapes (Figure 2). For each protuberance, the associated rhodolith data (water depth, rhodolith weight, rhodolith volume, and rhodolith sphericity) as well as the number of increments and hiati and the resulting hiatus frequency are compiled in Table 2. An example of a longitudinal section of a protuberance examined in ImageJ is shown in Figure 3. Growth increments and hiati were countable straightforward in all protuberances except for protuberance numbers 3 and 5, which did not expose a linear growth pattern and therefore, were excluded from the subsequent analysis.

3.2. Statistical Analyses

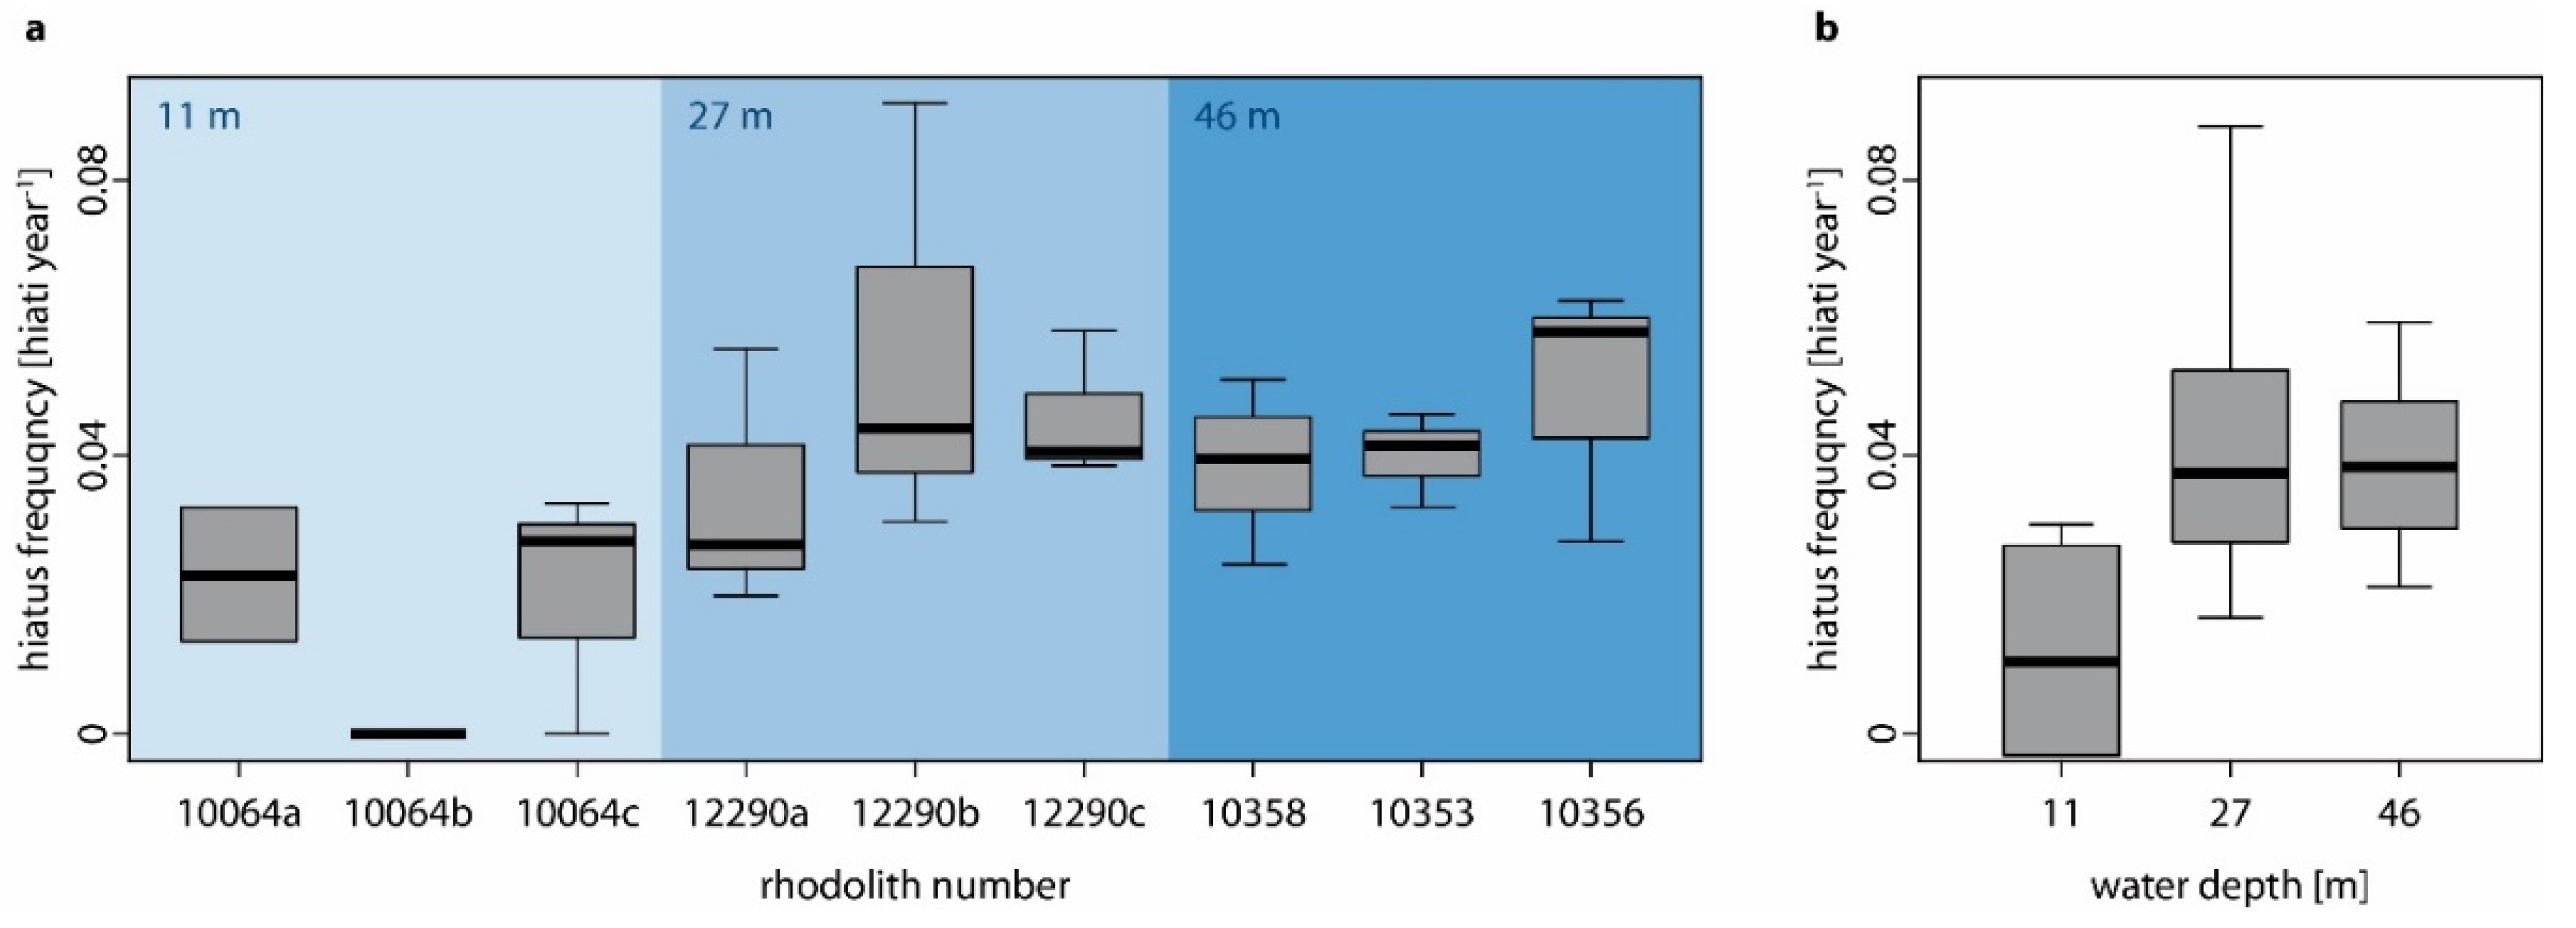
Hiatus frequencies for each rhodolith and each water depth are shown in Figure 4a,b.
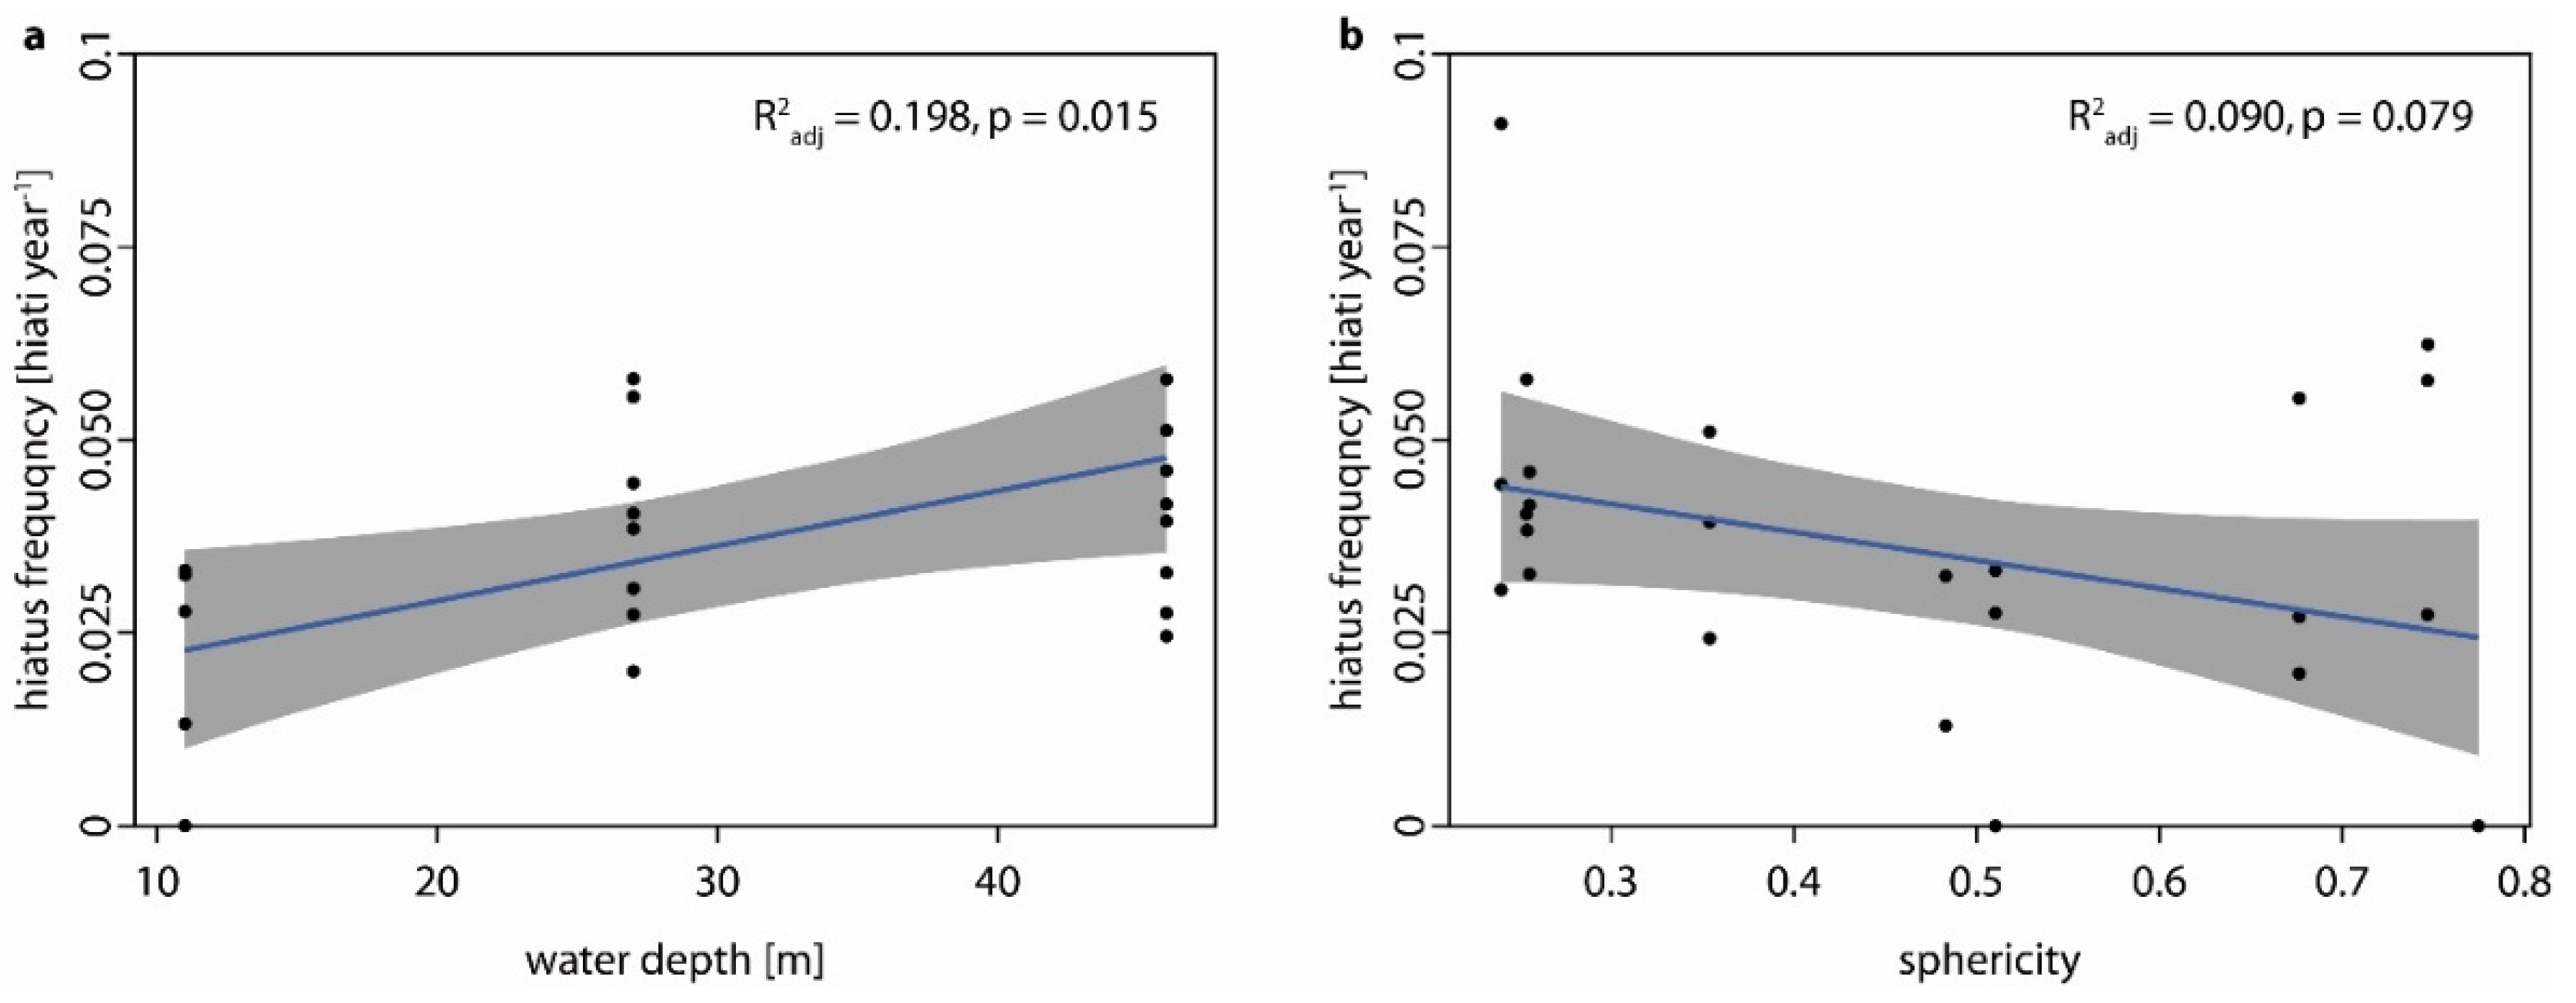
Except for the 11 m dataset, all hiatus frequencies are normally distributed and the assumption of homoscedasticity is true for all datasets (Table 3). Regarding variance analyses, there were no significant differences in hiatus frequencies between the rhodoliths at one water depth so these could be used as one basic population each in the subsequent analysis. All results from the Shapiro–Wilk normality tests, the Levene’s tests, the Kruskal–Wallis rank sum test, and the analysis of variance models are compiled in Table 3. Collinearities between potentially influencing variables are visualized in Figure 5, indicating a very high correlation between rhodolith weight and rhodolith volume. However, because both variables were excluded during the stepwise model selection, this is not problematic. Stepwise model selection based on the Akaike Information Criterion (AIC) for linear regression models using the complete dataset (11, 27, and 46 m water depth) suggests water depth as the significantly influencing variable, while sphericity appears to have a subordinate effect (Table 4). Model functions show that greater water depths are associated with higher hiatus frequencies, while greater rhodolith sphericities are associated with lower hiatus frequencies (Figure 6a,b).

4. Discussion

4.1. The Environmental Tolerances of Lithothamnion glaciale

Lithothamnion glaciale is resilient against changes in a variety of environmental parameters, including salinity, temperature, and heavy metal contamination [14]. However, burial, especially in fine or anoxic sediments, can be lethal or cause significant stress [14]. It is considerable, however, that the susceptibility of L. glaciale to burial does not seem to be mainly caused by the limited amount of light. Coralline algae are generally adapted to extreme low-light conditions because of their accessory photopigments phycoerythrin and phycocyanin [29]. Nevertheless, the photosynthetic capacity and therefore, also the production of coralline algae increases with irradiance [14], so sufficient light conditions are beneficial for the thriving and survival of the coralline algal thalli. With regard to the long term, coralline algae can also cope with several months of darkness, as for example during the polar night, as they deploy reservoirs of floridean starch within their perithallial tissue [30]. This is also the reason why specimens of L. glaciale can survive several months of polar night in Svalbard (122 days at Mosselbukta [1]). The problem rather seems to be the limited gas exchange when the algal thalli become buried in sediment, as experiments have shown that burial in coarse sediments has less severe effects on the algae than burial in fine sediments [14]. These fine, silty sediments are indeed not present between the rhodoliths, as they are winnowed by water currents, but they constitute the major part under the thin layer of rhodolith beds in Mosselbukta [3,25] and, as a consequence, turned rhodoliths and their buried parts likely suffer from the lack of light and the limited gas exchange as well.

4.2. The Influence of Water Depth on Hiatus Frequency

The stepwise model selection indicated water depth as the only variable significantly correlating with hiatus frequency. This is in line with the first hypothesis, suspecting that hiatus frequency increases with water depth because shallow-water specimens are turned more regularly (i.e., no thallus dieback between turning events) by normal wave action, while the hydrodynamically induced turning of deep-water specimens is restricted to storm events (i.e., dieback between turning events).
The area of Mosselbukta is characterized by a complex hydrodynamic regime, featuring a tidal range of one meter maximum and seasonally changing water masses [12]. These range from the rather warm Atlantic Water (AW), which is cooling during the winter and mixing continuously with Arctic Water (ArW), forming first the Modified or Transformed Atlantic Water (MAW or TAW) and later Polar Surface Water (PSWw or PSW) or even the very cold Winter Cooled Water (WCW) [31,32]. During the MSM55 expedition in summer 2016, the weather station of RV Maria S. Merian recorded maximum wind speeds of 40 kn over several hours, corresponding to stormy wind conditions, which is sufficient to create waves affecting at least the rhodolith beds located at 11 m water depth. Svalbard is situated in the transit zone between cold Arctic air in the north, and mild maritime air in the south. Thus, the cyclonic activity is high and unstable and stormy weather conditions are common, with maximum wind speeds being a strong breeze or stronger for 50–60 days around Svalbard [33]. However, while shallow water movement is common at Mosselbukta [12], storm events that also effect the deeper water layers are not that frequent. Additionally, Mosselbukta is a quite protected bay, so only wind from southwestern to northwestern directions should be able to produce the according storm waves. Additionally, at the northern coast of Svalbard, sea ice extent plays a major role in wave formation since wave height scales with the fetch (i.e., the length of open ocean over which the wind blows) [33]. The area around Mosselbukta features an annual mean sea ice concentration of 48% between 1979 and 2012; nevertheless, ice can be present all year around with minimum concentrations in September [34]. Thus, the development of waves strong enough to reach the deeper rhodolith beds (27 and 46 m) is likely limited to the summer and early autumn months. In this coherence, it would be interesting to investigate to which extent the reduced sea ice cover over the last decade influences hiatus frequency; however, this is beyond the scope of our present study. In correspondence with the environmental tolerances known for L. glaciale [14], the short-term turnover, as it happens in order to regular movement in the shallow water areas, is likely to be survived by the rhodoliths. We conclude this from experiments which have shown that prolonged periods of darkness and even burial in fine silty sediments for one week already has detrimental effects on the algae, but usually the thalli can recover. Nevertheless, long-term burial after one of the rare storm events in the deeper rhodolith beds will likely result in a dieback of the buried parts of the crust. In this context, another factor probably influencing the lower hiatus frequency in shallow waters is that silty sediments are more common at the deeper stations, whereas, due to the increased hydrodynamics, they are either winnowed or replaced by sand in the shallow areas, leading to dense dropstone pavements [25]. In contrast to silt, burial in coarse sand can be survived by coralline algae for several weeks, probably due to the less limited gas exchange [14].
Besides hydrodynamics, the irradiance within the different water depths probably influences the hiatus frequency. On the one hand, the more favorable light conditions in shallow waters in general facilitate the survival of coralline algal thalli, for example, over long intervals of gloomy weather conditions. On the other hand, it has to be considered that light which penetrates the water column is strongly scattered, therefore reaching also areas of the underside of a rhodolith, especially if the rhodolith is very spherical. Because of that, a turned rhodolith can still be reached by light radiation at the surface areas that facing downward but are not covered by sediment, resulting in the survival of the respective thallus regions. As the amount of scattered light decreases with water depth, the chances of thallus dieback and hiatus formation become more likely.

4.3. Morphological Aspects Influencing Hiatus Frequency

Besides water depth, the stepwise model selection also tested rhodolith volume, rhodolith weight, and rhodolith sphericity as potential variables with an impact on hiatus frequency. The reason why weight and volume—which rather obviously exhibited a high collinearity—were excluded by the model selection might be that the movement of rhodoliths by organisms takes places at all water depths and therefore, the effect is superimposed by the hydrodynamical and irradiance effects outlined above. Additionally, observations of a rhodolith bed at 46 m water depth in Mosselbukta over several days [12] have shown that even larger rhodoliths (up to 13 cm diameter) are indeed moved by organisms, primarily echinoids and large crustaceans, ploughing below or moving across the rhodoliths. In fact, in the six-day window of observation, such biotic interactions were found to be the only trigger for movement of the rhodoliths. With regard to the impact of organisms, the grazing activity of echinoids and chitons could also be considered as a potential reason for hiatus formation. Grazing by echinoids is commonly expressed by distinct scratches of pentaradiate symmetry [35] and chitons produce subparallel furrows much smaller in dimension [36]. However, none of these patterns were visible at the sites of hiatus formation, although these were the most abundant traces of bioerosion on experimentally deployed limestone and bivalve substrates in Mosselbukta (unpublished data). Instead, the hiati occurred as more or less sharp surfaces with a concordant onset of the new layers of rhodolith cells and traceable over the whole protuberance body. Moreover, grazing by echinoids and gastropods seldom leads to the dieback of coralline algae, because the algae are adapted to the grazing activity and rather benefit from it as it removes fleshy algae and other detrimental epiphytes from their surface [37,38].
Regarding rhodolith sphericity, this was kept by the model selection but not rendered significant. The correlation is negative (i.e., the more spherical a rhodolith is, the less hiati appear over a given time interval). This subordinate coherence might be reasoned as two different relationships. Firstly, spheroidal rhodoliths are more easily moved than discoidal ones [13], so if a rhodolith with a low sphericity is turned once, the probability of being turned again within the critical time interval before dieback, is smaller than for a specimen with a higher sphericity. Secondly, the feature of light diffusion is to be considered in this context, since, within the water, light is scattered and reflected, so it does not only reach the rhodoliths from directly above, but from all directions. Therefore, a spheroidal rhodolith exposes more surface to the open water and the ambient light compared to its area of support than a specimen with lower sphericity. As a result, coralline algal thalli growing as a spheroidal rhodolith have a higher chance of receiving sufficient light even after a turnover event.

5. Conclusions

Rhodoliths from different water depths and with various morphologies expose different patterns of hiatus frequencies. Water depth is the main driver of this effect, because, in shallow waters, rhodolith turnover triggered by wave action is likely sufficiently frequent to prevent long-term burial of coralline algal thalli, which would lead to a dieback of the particular parts of the rhodolith. Additionally, the amount of scattered light—that would also reach the lower parts of turned rhodoliths—decreases in greater depths. In this context, also the sphericity of the rhodoliths is of some importance, since the diffusive light within the water column can reach a comparatively larger area of round rhodoliths. Likewise, spheroidal rhodoliths are turned more easily, therefore shortening the critical time between two turning events. Because of that, information on patterns of hiatus formation combined with rhodolith morphology might serve as a valuable proxy for (paleo-)environmental reconstructions regarding water depth and the hydrodynamic regime.

Author Contributions

Conceptualization, S.T., M.W. and I.P.; methodology, S.T., I.P., M.S. and C.S.; validation, S.T., I.P. and M.S.; writing—original draft preparation, S.T. and M.W.; writing—review and editing, M.S., I.P., M.W., C.S. and S.T.; supervision, S.T.; project administration, S.T. and M.W.; funding acquisition, M.W. All authors have read and agreed to the published version of the manuscript.

Funding

We gratefully acknowledge the German Research Foundation (DFG) for funding the General Electric/Phoenix v|tome|x S 240 µCT, reference number 274877207. Funding for the Maria S. Merian cruise 55 was provided to M.W. by the DFG in concert with the Leitstelle Deutsche Forschungsschiffe.

Acknowledgments

We thank the captain, Ralf Schmidt, the crew, and the shipboard party of the RV Maria S. Merian cruise No. 55. In particular, we acknowledge Karen Hissman and Jürgen Schauer (both GEOMAR Kiel) for rhodolith sampling and seafloor video documentation with the JAGO submersible.

Conflicts of Interest

The author declares no conflict of interest.

References

  1. Teichert, S.; Freiwald, A. Polar coralline algal CaCO3-production rates correspond to intensity and duration of the solar radiation. Biogeosciences 2014, 11, 833–842. [Google Scholar] [CrossRef] [Green Version]
  2. Teichert, S.; Woelkerling, W.J.; Rüggeberg, A.; Wisshak, M.; Piepenburg, D.; Meyerhöfer, M.; Form, A.; Büdenbender, J.; Freiwald, A. Rhodolith beds (Corallinales, Rhodophyta) and their physical and biological environment at 80°31′N in Nordkappbukta (Nordaustlandet, Svalbard Archipelago, Norway). Phycologia 2012, 51, 371–390. [Google Scholar] [CrossRef]
  3. Teichert, S.; Woelkerling, W.J.; Rüggeberg, A.; Wisshak, M.; Piepenburg, D.; Meyerhöfer, M.; Form, A.; Freiwald, A. Arctic rhodolith beds and their environmental controls. Facies 2014, 60, 15–37. [Google Scholar] [CrossRef]
  4. Kjellman, F.R. The algae of the Arctic Sea. In Kongliga Svenska Vetenskaps-Akademiens Handlingar; P.A. Norstedt & söner: Stockholm, Sweden, 1883; Volume 20, pp. 1–350. [Google Scholar]
  5. Teichert, S. Hollow rhodoliths increase Svalbard′s shelf biodiversity. Sci. Rep. 2014, 4, 6972. [Google Scholar] [CrossRef] [PubMed] [Green Version]
  6. Williams, S.; Halfar, J.; Zack, T.; Hetzinger, S.; Blicher, M.; Juul-Pedersen, T. Comparison of climate signals obtained from encrusting and free-living rhodolith coralline algae. Chem. Geol. 2018, 476, 418–428. [Google Scholar] [CrossRef] [Green Version]
  7. Teichert, S.; Voigt, N.; Wisshak, M. Do skeletal Mg/Ca ratios of Arctic rhodoliths reflect atmospheric CO2 concentrations? Polar Biol. 2020, 43, 2059–2069. [Google Scholar] [CrossRef]
  8. Freiwald, A.; Henrich, R. Reefal coralline algal build-ups within the Arctic Circle: Morphology and sedimentary dynamics under extreme environmental seasonality. Sedimentology 1994, 41, 963–984. [Google Scholar] [CrossRef]
  9. Blake, C.; Maggs, C.A. Comparative growth rates and internal banding periodicity of maerl species (Corallinales, Rhodophyta) from northern Europe. Phycologica 2003, 42, 606–612. [Google Scholar] [CrossRef]
  10. Kamenos, N.A.; Hoey, T.B.; Nienow, P.; Fallick, A.E.; Claverie, T. Reconstructing Greenland ice sheet runoff using coralline algae. Geology 2012, 40, 1095–1098. [Google Scholar] [CrossRef]
  11. Kamenos, N.A.; Law, A. Temperature controls on coralline algal skeletal growth. J. Phycol. 2010, 46, 331–335. [Google Scholar] [CrossRef]
  12. Wisshak, M.; Neumann, H.; Rüggeberg, A.; Büscher, J.; Linke, P.; Raddatz, J. Epibenthos dynamics and environmental fluctuations in two contrasting Polar carbonate factories (Mosselbukta and Bjørnøy-Banken, Svalbard). Front. Mar. Sci. 2019, 6, 667. [Google Scholar] [CrossRef]
  13. Bosence, D.W.J. The occurrence and ecology of recent Rhodoliths—A review. In Coated Grains; Peryt, T.M., Ed.; Springer: Berlin/Heidelberg, Germany, 1983; pp. 225–242. [Google Scholar]
  14. Wilson, S.; Blake, C.; Berges, J.A.; Maggs, C.A. Environmental tolerances of free-living coralline algae (maerl): Implications for European marine conservation. Biol. Conserv. 2004, 120, 279–289. [Google Scholar] [CrossRef]
  15. Woelkerling, W.J. The Coralline Red Algae; Oxford University Press: Oxford, UK, 1988. [Google Scholar]
  16. Halfar, J.; Williams, B.; Hetzinger, S.; Steneck, R.; Lebednik, P.A.; Winsborough, C.; Omar, A.; Chan, P.; Wanamaker, A.D., Jr. 225 years of Bering Sea climate and ecosystem dynamics revealed by coralline algal growth-increment widths. Geology 2011, 39, 579–582. [Google Scholar] [CrossRef]
  17. Hetzinger, S.; Halfar, J.; Zajacz, Z.; Wisshak, M. Early start of 20th-century Arctic sea-ice decline recorded in Svalbard coralline algae. Geology 2019. [Google Scholar] [CrossRef] [Green Version]
  18. Bosence, D. Ecological studies on two unattached coralline algae from western Ireland. Palaeontology 1976, 19, 365–395. [Google Scholar]
  19. Bosence, D.W.J. Coralline algae: Mineralization, taxonomy, and palaeoecology. In Calcareous Algae and Stromatolites; Riding, R., Ed.; Springer: Berlin/Heidelberg, Germany, 1991; pp. 98–113. [Google Scholar]
  20. Marrack, E.C. The Relationship between Water Motion and Living Rhodolith Beds in the Southwestern Gulf of California, Mexico. PALAIOS 1999, 14, 159–171. [Google Scholar] [CrossRef]
  21. Quaranta, F.; Tomassetti, L.; Vannucci, G.; Brandano, M. Coralline algae as environmental indicators: A case study from the Attard member (Chattian, Malta). Geodiversitas 2012, 34, 151–166. [Google Scholar] [CrossRef]
  22. Lüning, K. Seaweeds. Their Environment, Biogeography and Ecophysiology; Wiley Interscience: London, UK, 1990; p. 544. [Google Scholar]
  23. Aguirre, J.; Riding, R.; Braga, J.C. Diversity of coralline red algae: Origination and extinction patterns from the Early Cretaceous to the Pleistocene. Paleobiology 2000, 26, 651–667. [Google Scholar] [CrossRef]
  24. O′Connell, L.G.; James, N.P.; Harvey, A.S.; Luick, J.; Bone, Y.; Shepherd, S.A. Reevaluation of the Inferred Relationship between Living Rhodolith Morphologies, Their Movement, and Water Energy: Implications for Interpreting Paleoceanographic Conditions. Palaios 2021, 35, 543–556. [Google Scholar] [CrossRef]
  25. Wisshak, M.; Bartholomä, A.; Beuck, L.; Büscher, J.; Form, A.; Freiwald, A.; Halfar, J.; Hetzinger, S.; van Heugten, B.; Hissmann, K.; et al. Habitat Characteristics and Carbonate Cycling of Macrophyte-Supported Polar Carbonate Factories (Svalbard)—Cruise No. MSM55—11 June–29 June 2016—Reykjavik (Iceland)—Longyearbyen (Norway); MARIA S. MERIAN-Berichte: Bremen, Germany, 2017; p. 58. [Google Scholar]
  26. Sneed, E.D.; Folk, R.L. Pebbles in the lower Colorado river, Texas. A study in particle morphogenesis. J. Geol. 1958, 66, 114–150. [Google Scholar] [CrossRef]
  27. Graham, D.J.; Midgley, N.G. Graphical representation of particle shape using triangular diagrams: An Excel spreadsheet method. Earth Surf. Process. Landf. 2000, 25, 1473–1477. [Google Scholar] [CrossRef]
  28. R Core Team. R: A Language and Environment for Statistical Computing; R Foundation for Statistical Computing: Vienna, Austria, 2019. [Google Scholar]
  29. Gantt, E. Pigmentation and photoacclimation. In Biology of the Red Algae; Cole, K.M., Sheath, R.G., Eds.; Cambridge University Press: Cambridge, UK, 1990; pp. 203–219. [Google Scholar]
  30. Bilan, M.I.; Usov, A.I. Polysaccharides of calcareous algae and their effect on the calcification process. Russ. J. Bioorganic Chem. 2001, 27, 2–16. [Google Scholar] [CrossRef] [PubMed]
  31. Rudels, B.; Meyer, R.; Fahrbach, E.; Ivanov, V.V.; Østerhus, S.; Quadfasel, D.; Schauer, U.; Tverberg, V.; Woodgate, R.A. Water mass distribution in Fram Strait and over the Yermak Plateau in summer 1997. Ann. Geophys. 2000, 18, 687–705. [Google Scholar] [CrossRef]
  32. Cottier, F.; Tverberg, V.; Inall, M.; Svendsen, H.; Nilsen, F.; Griffiths, C. Water mass modification in an Arctic fjord through cross-shelf exchange: The seasonal hydrography of Kongsfjorden, Svalbard. J. Geophys. Res. 2005, 110. [Google Scholar] [CrossRef] [Green Version]
  33. Hanssen-Bauer, I.; Førland, E.; Hisdal, H.; Mayer, S.; Sandø, A.B.; Sorteberg, A. Climate in Svalbard 2100; Norwegian Environment Agency (Miljødirektoratet): Trondheim, Norway, 2019; p. 207. [Google Scholar]
  34. Onarheim, I.H.; Smedsrud, L.H.; Ingvaldsen, R.B.; Nilsen, F. Loss of sea ice during winter north of Svalbard. Tellus A Dyn. Meteorol. Oceanogr. 2014, 66, 23933. [Google Scholar] [CrossRef] [Green Version]
  35. Bromley, R.G. Comparative analysis of fossil and recent echinoid bioerosion. Palaeontology 1975, 18, 725–739. [Google Scholar]
  36. Lopes, R.P.; Pereira, J.C. Molluskan Grazing Traces (Ichnogenus Radulichnus Voigt, 1977) on a Pleistocene Bivalve from Southern Brazil, With the Proposal of a New Ichnospecies. Ichnos 2019, 26, 141–157. [Google Scholar] [CrossRef]
  37. Steneck, R.S. Herbivory and the evolution of nongeniculate coralline algae (Rhodophyta, Corallinales) in the North Atlantic and North Pacific. In Evolutionary Biogeography of the Marine Algae of the North Atlantic; Garbary, D.J., South, G.R., Eds.; Springer: Berlin/Heidelberg, Germany, 1990; Volume G22, pp. 107–129. [Google Scholar]
  38. Steneck, R.S. The ecology of coralline algal crusts: Convergent patterns and adaptive strategies. Annu. Rev. Ecol. Syst. 1986, 17, 273–303. [Google Scholar] [CrossRef]
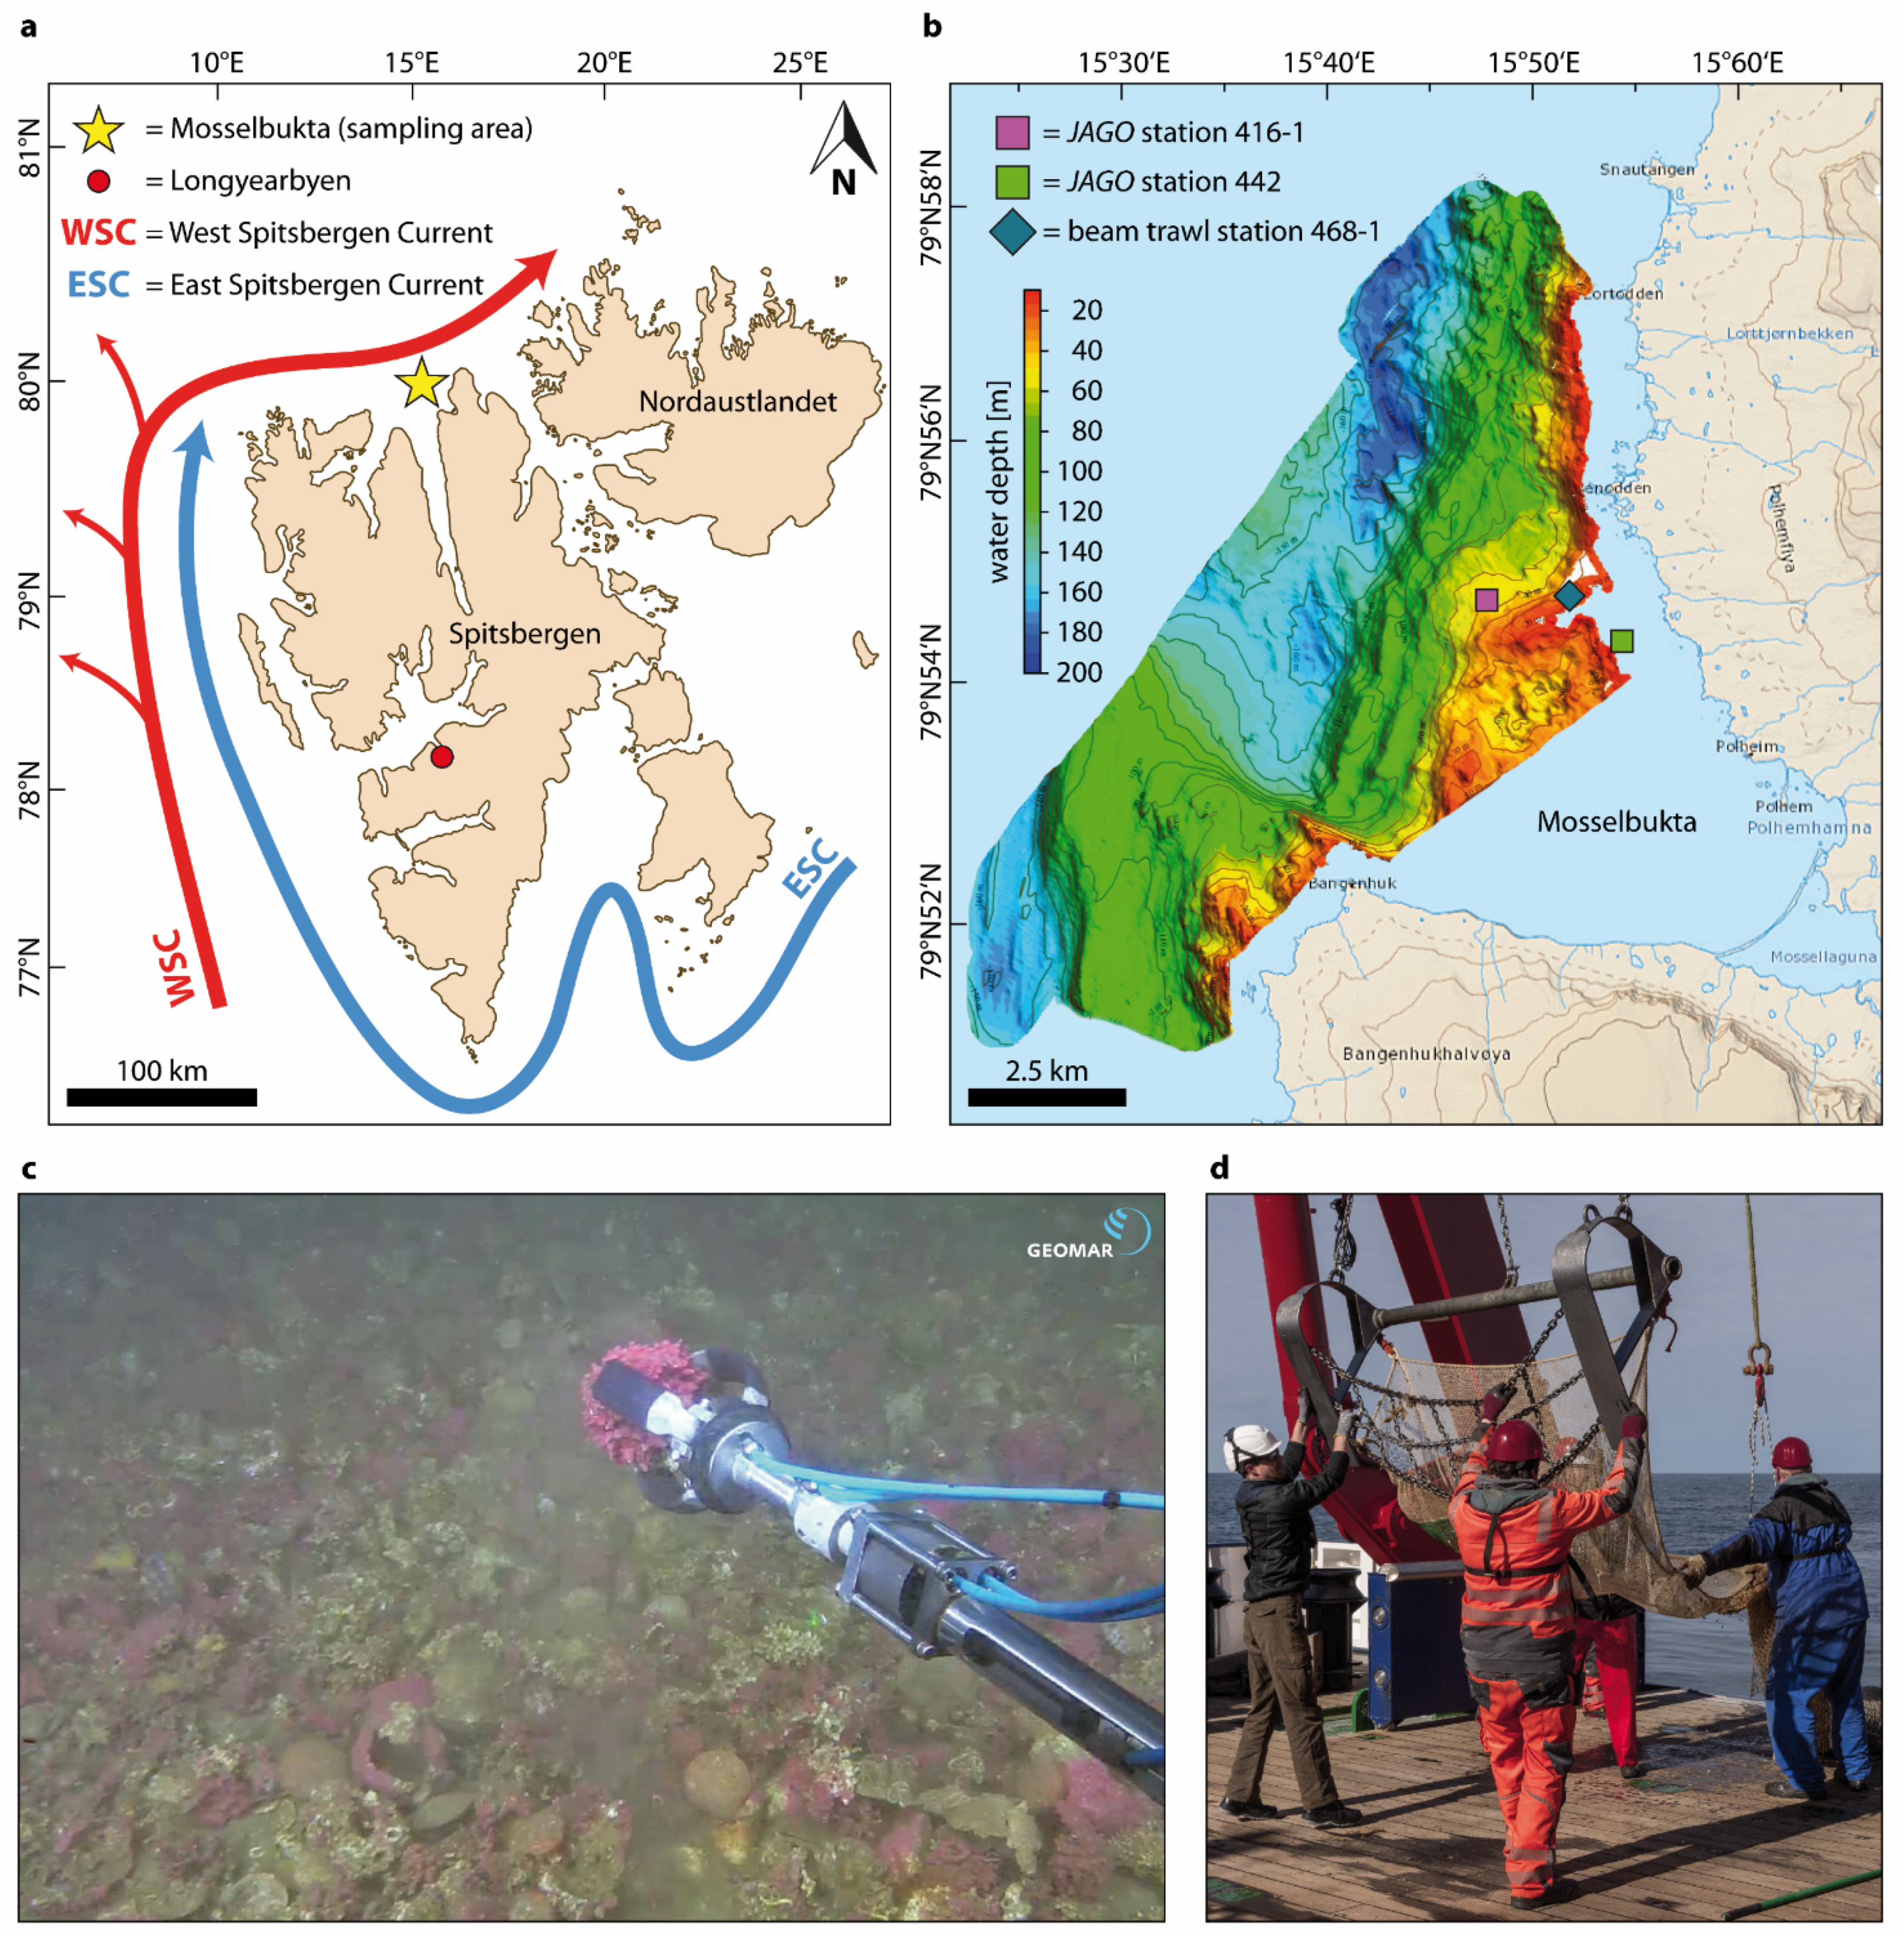
Figure 1. Rhodolith study area and sampling. (a) Location of the sampling area Mosselbukta, northern Spitsbergen, Svalbard archipelago. (b) Multibeam map of Mosselbukta indicating sampling stations; topographic map extract is used with courtesy of the Norwegian Polar Institute. (c) Rhodolith sampling at station 416-1 at 46 m water depth. (d) Beam trawl device used at station 468-1.
Minerals 11 00538 g001
Figure 2. Ternary diagram according to Sneed and Folk [26], indicating the predominant shapes and sphericities of the rhodoliths from 11, 27, and 46 m water depth. Curved lines with values 0.2–0.9 represent maximum projection sphericity isolines, S = short rhodolith axis, I = intermediate rhodolith axis, L = long rhodolith axis.
Minerals 11 00538 g002
Figure 3. X-ray micro-computed tomography (µCT) of a rhodolith protuberance. Annual growth increments are visible as an alternation of bright and dark bandings; hiati are visible in terms of larger and perpendicularly running primigenous cells.
Minerals 11 00538 g003
Figure 4. Hiatus frequencies. (a) Box plots of hiatus frequencies according to rhodolith numbers; blue numbers and shadings indicate water depth. (b) Box plots of hiatus frequencies according to water depth.
Minerals 11 00538 g004
Figure 5. Collinearities between environmental parameters.
Minerals 11 00538 g005
Figure 6. Model functions. (a) Greater water depths are associated with higher hiatus frequencies. (b) Greater rhodolith sphericities are associated with lower hiatus frequencies.
Minerals 11 00538 g006
Table 1. Rhodolith collection sites.
Rhodolith NrStationWater Depth [m]Sampling GearLatitudeLongitude
10064aMSM55/44211submersible79°54.85′ N15°54.85′ E
10064bMSM55/44211submersible79°54.85′ N15°54.85′ E
10064cMSM55/44211submersible79°54.85′ N15°54.85′ E
12290aMSM55/468-127beam trawl79°54.78′ N15°52.65′ E
12290bMSM55/468-127beam trawl79°54.78′ N15°52.65′ E
12290cMSM55/468-127beam trawl79°54.78′ N15°52.65′ E
10358MSM55/416-146submersible79°54.69′ N15°48.61′ E
10353MSM55/416-146submersible79°54.69′ N15°48.61′ E
10356MSM55/416-146submersible79°54.69′ N15°48.61′ E
Table 2. Protuberance and rhodolith data (NA = no data).
Protuberance NrRhodolithNrWater Depth [m]Rhodolith Weight [g]Rhodolith Volume [mm3]Rhodolith SphericityGrowth
Increments [n]
Hiati [n]Hiatus
Frequency
110064a1134.512,4210.6167510.0133
210064a1134.512,4210.6169230.0326
310064a1134.512,4210.616NANANA
410064b11148.368,7790.8449000
510064b11148.368,7790.844NANANA
610064b11148.368,7790.8449000
710064c11361.1140,1110.6386300
810064c11361.1140,1110.6387220.0278
910064c11361.1140,1110.6383010.0333
1012290a2718.392450.7717320.0274
1112290a2718.392450.7715010.02
1212290a2718.392450.7715430.0556
1312290b2772.942,5050.3877770.0909
1412290b2772.942,5050.3879040.0444
1512290b2772.942,5050.3876520.0308
1612290c27234136,7300.4022610.0385
1712290c27234136,7300.4026940.058
1812290c27234136,7300.4027430.0405
19103584675.732,9410.512230.0246
20103584675.732,9410.53920.0513
21103584675.732,9410.510140.0396
221035346135.464,3530.40212240.0328
231035346135.464,3530.4028740.046
241035346135.464,3530.4029640.0417
251035646286.4109,1180.82311270.0625
261035646286.4109,1180.82312170.0579
271035646286.4109,1180.82314540.0276
Table 3. Summary of the statistical tests for water depth datasets.
Water Depth [m]Shapiro–WilkLevene’sANOVAKruskal–Wallis
WpFpFpChi-Squaredp
110.8030.0440.7410.532NANA2.6150.270
270.9090.3160.4770.6430.6830.541NANA
460.9660.8600.3450.7220.5240.617NANA
Table 4. Results of the stepwise model selection, suggesting water depth as the significantly influencing variable, while sphericity appears to have a subordinate effect.
Overall Model
AIC = −197.18
R2adj = 0.24
p < 0.02
AIC for Omitting ParameterEstimatep
water depth−193.810.0006165<0.05
sphericity−196.73−0.03249940.1465
Publisher’s Note: MDPI stays neutral with regard to jurisdictional claims in published maps and institutional affiliations.