Article

Stability of Atrazine–Smectite Intercalates: Density Functional Theory and Experimental Study

by
Daniel Moreno-Rodríguez
1,*,
Ľuboš Jankovič
1,
Eva Scholtzová
1 and
Daniel Tunega
2,3
1
Institute of Inorganic Chemistry, Slovak Academy of Science, Dúbravská Cesta 9, 84536 Bratislava, Slovakia
2
Institute of Soil Research, University of Natural Resources and Life Sciences, Peter-Jordan-Strasse 82, Wien 1190, Austria
3
School of Pharmaceutical Sciences and Technology, Tianjin University, Tianjin 300072, China
*
Author to whom correspondence should be addressed.
Minerals 2021, 11(6), 554; https://doi.org/10.3390/min11060554
Submission received: 28 April 2021 / Revised: 14 May 2021 / Accepted: 21 May 2021 / Published: 24 May 2021
(This article belongs to the Special Issue Recent Advances in Molecular Modeling of Clay Minerals Interfaces)

Abstract

:
Atrazine (A) is one of the most applied herbicides and has a negative impact on the environment and health. Density functional theory (DFT) and experimental methods were used in the study of the immobilization of atrazine in two smectites, montmorillonite (Mt) and beidellite (Bd), as well as in their organically modified structures. Four systems were examined: A-Mt and A-Bd, as well as the structures modified by tetramethylphosphonium cation (TMP), A-TMP-Mt and A-TMP-Bd. The calculations revealed a flat arrangement of the atrazine in the interlayer space of both smectites with higher stability of beidellite structures. The presence of the TMP cation increased the fixation of atrazine in both organically modified smectites. The calculated vibrational spectra allowed a detailed analysis of the overlapping bands observed in the experimental FTIR spectra and their correct assignment. Further, selected FTIR bands unambiguously assigned to atrazine and both smectites served for the estimation of the adsorbed amount of atrazine. It was shown that the adsorption capacity of both TMP-modified smectites did not increase in comparison to the adsorption capacity of unmodified smectite samples.

Graphical Abstract

1. Introduction

Atrazine (2-chloro-4-ethylamino-6-isopropylamino-s-triazine) (Scheme 1) belongs to the s-triazine family and is one of the most used herbicidal ingredients. Due to the extensive use of herbicides containing atrazine, it remains as a residue in the natural environment [1]. Atrazine presents a negative impact on biodiversity, with impacts on fish and amphibians [2,3,4], mammals [5,6] and human health [7,8,9,10,11]. Atrazine may affect the endocrine and reproductive systems in animals [12,13,14,15,16,17,18,19,20], and there is a possible association between atrazine exposure and cancer in humans [10,21]. Atrazine has been banned in the European Union since 2004 [22]; however, in the United States [23], it is commonly used, e.g., on corn and sugarcane crops. Atrazine is a very weak base that shows a moderate hydrophobicity, and it is almost insoluble in water at room temperature since its solubility is below 0.1 mol L−1 [24].
Clay minerals, such as smectites, being natural components of soils, can play an important role in the immobilization of numerous organic contaminants, e.g., atrazine and other pesticides [24,25,26,27,28,29,30], Moreover, they are an interesting option for the preparation of sorbents for remediation and purification processes because of their low cost and high abundance in nature [31]. Montmorillonite (Mt) and beidellite (Bd), as smectites, have a high cation exchange capacity, swelling behavior, adsorption properties and large surface area [32]. Smectites have a layered structure based on tetrahedral (T) and octahedral (O) sheets linked together to the TOT layers through the apical oxygens of the tetrahedra. The isomorphous substitutions in the T sheet (e.g., Al3+/Si4+) and O sheet (e.g., Fe2+ and Mg2+/Al3+) generate a negative net charge, which is compensated by the presence of exchangeable inorganic cations (e.g., Ca2+, Mg2+, Na+, K+ or Li+) in the interlayer space. Owing to the hydration of inorganic exchangeable cations, smectites are mainly hydrophilic [33,34], limiting their capacity to adsorb weakly polar or non-polar molecules into their interlayer space and/or onto their surface [35,36,37]. The cation exchange reaction in the interlayer space with organic cations (e.g., of alkylammonium type) forms complexes that produce a hydrophobic surface and yield organoclay [38]. The properties of the organically modified clays depend on the concentration and spatial arrangement of the organic cations in the interlayer space. The length of the alkyl chain and charge density in smectite layers play a key role. Longer alkyl chains of the organic surfactants increase the hydrophobicity by displacing water in the interlayer space [36,38,39,40].
The interactions and the arrangement of the surfactants are determined by the length of the alkyl chains and the concentration of the amphiphilic molecules [41]. The most used organic surfactants in organoclay preparation are quaternary alkylammonium compounds [37,38]. Recent studies have shown that using phosphonium-based organic cations can improve the physicochemical properties and stability of organoclays in comparison to organoclays prepared from alkylammonium cations [42,43,44,45,46,47,48].
Organoclays have been successfully used in several environmental applications [37,49,50,51,52], showing their capacity to remove, adsorb and immobilize herbicides with different solubilities such as soluble 2-4-D [53] or dicamba [54]; moderately soluble malathion, butachlor [55], diuron and ametryn [31]; and weakly soluble penconazole and atrazine [26,56].
Despite the numerous experimental works devoted to the immobilization of organic pollutants by clay minerals, a detailed description of the structure and interactions of these organic molecules in clay minerals is still lacking. Thus, in this situation, molecular simulation methods are very useful to provide a detailed, molecular-scale view, in the local environment, e.g., the arrangement of organic species in the interlayer space or at the mineral surfaces [57,58,59]. The density functional theory (DFT) method is a good option to study the models of organoclays with acceptable computational demand and the provision of reliable results [60,61,62].
This study was focused on the adsorption and stability of atrazine, as one of the frequently used herbicides, in montmorillonite and beidellite smectites. The sorption capacities of unmodified and organically modified (by tetramethylphosphonium cation) smectites were compared. The work also aimed to explain the arrangement of atrazine molecules and their interactions in the interlayer space of clays at the molecular level by performing molecular simulations at the DFT level. Moreover, the DFT results were also used in the detailed interpretation of experimental FTIR spectra of atrazine–clay/organoclay structures.

2. Materials and Methods

2.1. Experimental Details

Tetramethylphoshonium chloride and atrazine were obtained from Sigma-Aldrich Inc. (Milwaukee, WI, USA) and used without further purification.
The smectites used in this study were beidellite (SBId-1) and charge-reduced montmorillonite (SAz-2) [63] obtained from the Clay Minerals Society, Source Clay Repository (Department of Agronomy, Purdue University, West Lafayette, IN, USA).
The purified beidellite fractions were obtained by dispersing 20 g of beidellite lumps (SBId) in 10 L of deionized water (0.2% (w/v)). They were allowed to swell overnight and then stirred (200 rpm) for 90 min. The supernatant slurry having the desired clay particles size (<2 µm) was collected at a specific time (12 h) and height (18 cm) at room temperature (25 °C) and a pre-calculated time according to Stoke’s law of sedimentation. The clay slurry obtained was Na-saturated by repeated treatment with 1 M NaCl, and the <2 μm fraction was collected. The excess salt was removed by washing with deionized water until the AgNO3 test for chlorides gave a negative result. The sample was dried at 60 °C and ground to pass a 0.2 mm sieve.
The organobeidellites were prepared from Na-Bd and tetramethylphosphonium chloride. The organic salt was used as received from Sigma-Aldrich. Two grams of Na-Bd were dispersed in 400 mL of distilled water and stirred overnight. An ethanolic solution (50 mL), containing the alkylphoshonium salt in an amount corresponding to 50% of the CEC of Na-Bd, was slowly (2 mL min−1) added to the stored suspension of sodium beidellite under extensive stirring (500 RPM). Afterwards, the slurry was stirred for another 24 h at 40 °C and left to cool to laboratory temperature. The final product was obtained by repeated centrifugation and washing with water to remove soluble side products (NaCl) created during the cation-exchange procedure. A similar procedure was used for preparation of atrazine–(organo)clay (beidellite, montmorillonite or modified clays) samples, and only one concentration (30 mg L−1) was used. The synthesized samples were then quickly frozen, freeze dried (Labconco Freezone 4.5 freeze drying instrument) and stored in a desiccator for later use.
The pure beidellite, montmorillonite and organoclay samples were characterized by powder XRD, FT-IR and thermal analysis. X-ray powder diffraction data were collected on a D8 Advance Bruker diffractometer using Cu Kα (40 kV, 40 mA, λ = 1.541 78 Å) radiation and a secondary beam graphite monochromator (Bruker EAS GmbH, Hanau, Germany). Diffraction patterns were collected in the 1–10° 2Θ range in steps of 0.02° 2Θ and with 2 s counting time per step. XRD results were used for the determination of the changes in the basal spacing (d001) after intercalation.
The infrared spectra were obtained on a Nicolet 6700 FTIR spectrometer from Thermo Scientific by co-addition of 128 scans at a resolution of 4 cm−1 (Thermo Fisher Scientific, Waltham, MA, USA). The KBr pressed disk technique (1 mg of sample and 200 mg of KBr) and Smart Diffuse Reflectance Accessory were used to measure the spectra in the mid-IR (MIR, 4000–400 cm−1) region. Spectra manipulations were performed using the OMNIC™ software package from Thermo Scientific (OMNIC version 9.1, Thermo Fisher Scientific, Waltham, MA, USA).

2.2. Computational Details

The DFT calculations were performed using the Vienna ab initio simulation package (VASP) program Scientific (VASP 5 version, VASP Software GmbH, Vienna, Austria) [64,65]. Blochl’s projector augmented wave (PAW) technique [66,67] was used to describe the electron–ion interactions. The exchange-correlation energy was defined as a generalized gradient approximation (GGA), and the functional proposed by Perdew, Burke and Ernzerhof (PBE) [68] was used in combination with the D3 scheme for dispersion corrections [69]. Owing to the large computational cells, the Brillouin-zone sampling was restricted to the Γ-point [70,71].
The calculations were completed by ab initio molecular dynamics (AIMD) simulation to obtain additional information about the vibrational dynamics of atrazine molecule. Owing to the computational demands of AIMD, the energy cut-off was reduced to 400 eV and the required convergence in total energy was reduced to 10−4 eV. The Verlet velocity algorithm [72] with a time step of 1 fs was chosen for the numerical solution of the equations of motion. As a first step, the finite-temperature calculations were performed on a canonical NVT ensemble (constant number of particles (N), constant volume (V) and constant temperature (T)) applying the Nosé–Hoover thermostat procedure [73] at the simulation temperature of 300 K to equilibrate the structure and using the molecular dynamics (MD) length of 10 ps. Then, the system was changed to microcanonical NVE (E indicates constant energy) ensemble to obtain the vibrational density of states (VDOS). In this case, the total length of the MD run was 10 ps. The results of the AIMD calculations were interpreted in a wavenumber domain by calculating the Fourier transform of the velocity autocorrelation functions to obtain VDOS.

2.3. Computational Models

Clay minerals usually present a wide diversity in structure and composition. Hence, a simplification of the models is necessary, especially in quantum chemical modeling. The structural models of clay minerals from our previous studies were used: montmorillonite [36] and beidellite [47]. To build the smectite models, the most abundant isomorphous substitutions, i.e., Al3+ by Mg2+ in the octahedral sheet of Mt and Si4+ by Al3+ in the tetrahedral sheet of Bd, were considered. Six substitutions were introduced in each model without considering the neighboring positions, which were close to the experimental structure of clays used in the experimental part. The negative layer charge (−6 |e|) was compensated by six hydrated Na cations and/or five hydrated Na cations and one organic cation, tetramethylphosphonium (TMP), in the interlayer space. Each Na cation was coordinated with four water molecules, [Na(H2O)4]+, to be close to a water content in the experimental samples.
The final computational cell of the models was 4a2bc of the Na-Bd/Mt elementary cell to cover the size of the surfactants with the initial lattice parameters a = 20.966 Å, b = 18.178 Å and c = 19.000 Å. The chemical composition of the extended Na-Bd model (Na6(Si58Al6)(Al32)O160(OH)32) corresponded to the structural formula of Na0.75(Si7.25Al0.75)(Al4)O20(OH)4, being in agreement with the composition of the beidellite mineral (Ca0.02K0.03Na0.68(Si7.28Al0.72)(Al3.78Fe0.10 Mg0.20)O20(OH)4), and the extended Na-Mt model (Na6(Si64)(Al26Mg6)O160(OH)32) corresponded to the structural formula of Na0.75(Si8)(Al3.25Mg0.75)O20(OH)4, agreeing with the composition of the montmorillonite mineral (Na0.64Ca0.03K0.02(Si8.00)(Al3.13Fe0.09Mg0.78)O20(OH)4).
Three models were proposed for each smectite in total: (1) pure Mt/Bd clay with six hydrated Na cations in the interlayer space of Mt/Bd (Na-Mt/Bd); (2) the atrazine intercalated into the Na-Mt/Bd structures in a parallel arrangement with the interlayer space, A-Mt/Bd, with the summary formulae (C8H14ClN5)[Na6(Si64)(Al26Mg6)O160(OH)32(H2O)24] and/or (C8H14ClN5)[Na6(Si58Al6)(Al32)O160(OH)32(H2O)24], respectively; and (3) the one TMP cation replaced by one of the [Na(H2O)4]+ cations in the A-Mt/Bd structures to reveal its influence on the adsorption of atrazine and the stability of the A-TMP-Mt/Bd model structures with summary formulae (C4H12P)(C8H14ClN5)[Na5(Si64)(Al26Mg6)O160(OH)32(H2O)20] and/or (C4H12P)(C8H14ClN5)[Na5 (Si58Al6)(Al32)O160(OH)32 (H2O)20], respectively.
The structure of the proposed models was fully relaxed. Furthermore, the stability of the atrazine–smectite complexes (A-Mt, A-Bd, A-TMP-Mt and A-TMP-Bd) was determined as an intercalation energy (ΔEint), calculated according to a general reaction scheme:
ΔEint = ∑Eproducts − ∑Ereactants
where Eproducts is the sum of the total energies of the products and Ereactants is the sum of the total energies of the reactants; e.g., for the A-Bd model, ΔEint ABd = (EABd) − (ENaBd + EA).

3. Results and Discussion

3.1. Structural Relaxation

The optimized interlayer distances (d001) of the proposed models were in a good agreement with the experimental values determined by means of powder X-ray diffraction (XRD) (Table 1). The partial discrepancy with the experimental d001 value (14.1 Å) for A-TMP-Mt structure can be caused by the fact that the theoretical model represents the ideal structure, while the experimental A-TMP-Mt sample exhibits a little higher value, probably due to heterogeneity of charge densities frequently present in the natural smectites [74]. In addition, in the case of the modified organobeidellite, a small deviation exists between the calculated (13.0 Å) and experimental (13.9 Å) d001 values for the same reason as in the case of the A-TMP-Mt organoclay. This indicates that individual smectite tactoids (or at least domains larger than the coherence lengths of the X-rays) exhibit various slightly diverse and overlapping hydration levels, which most likely is caused by different charge density levels of these nanolayers [74].

3.1.1. Montmorillonite Complex Structures

The [Na(H2O)4]+ cations in the DFT optimized structure of the Na-Mt model with d001 = 12.1 Å are positioned in a monolayer configuration, near the octahedral substitutions (Osubs). The Na+ cation is coordinated by four water molecules on the plane with average Na···Ow distances of ~2.4 Å (Figure 1a).
In the A-Mt model structure with d001 = 12.7 Å, the atrazine has a quasi-planar arrangement, nearly parallel to the Mt surface, in the central part of the computational cell. The chlorine of the atrazine is located in the center of a ditrigonal hole with two octahedral substitutions on both interlayer sides (Figure 1b). The [Na(H2O)4]+ cations are located in the ditrigonal holes next to the Osubs. The water molecules are in a monolayer configuration near the Na+ cations with Na··· Ow distances from ~2.4 to 4.7 Å.
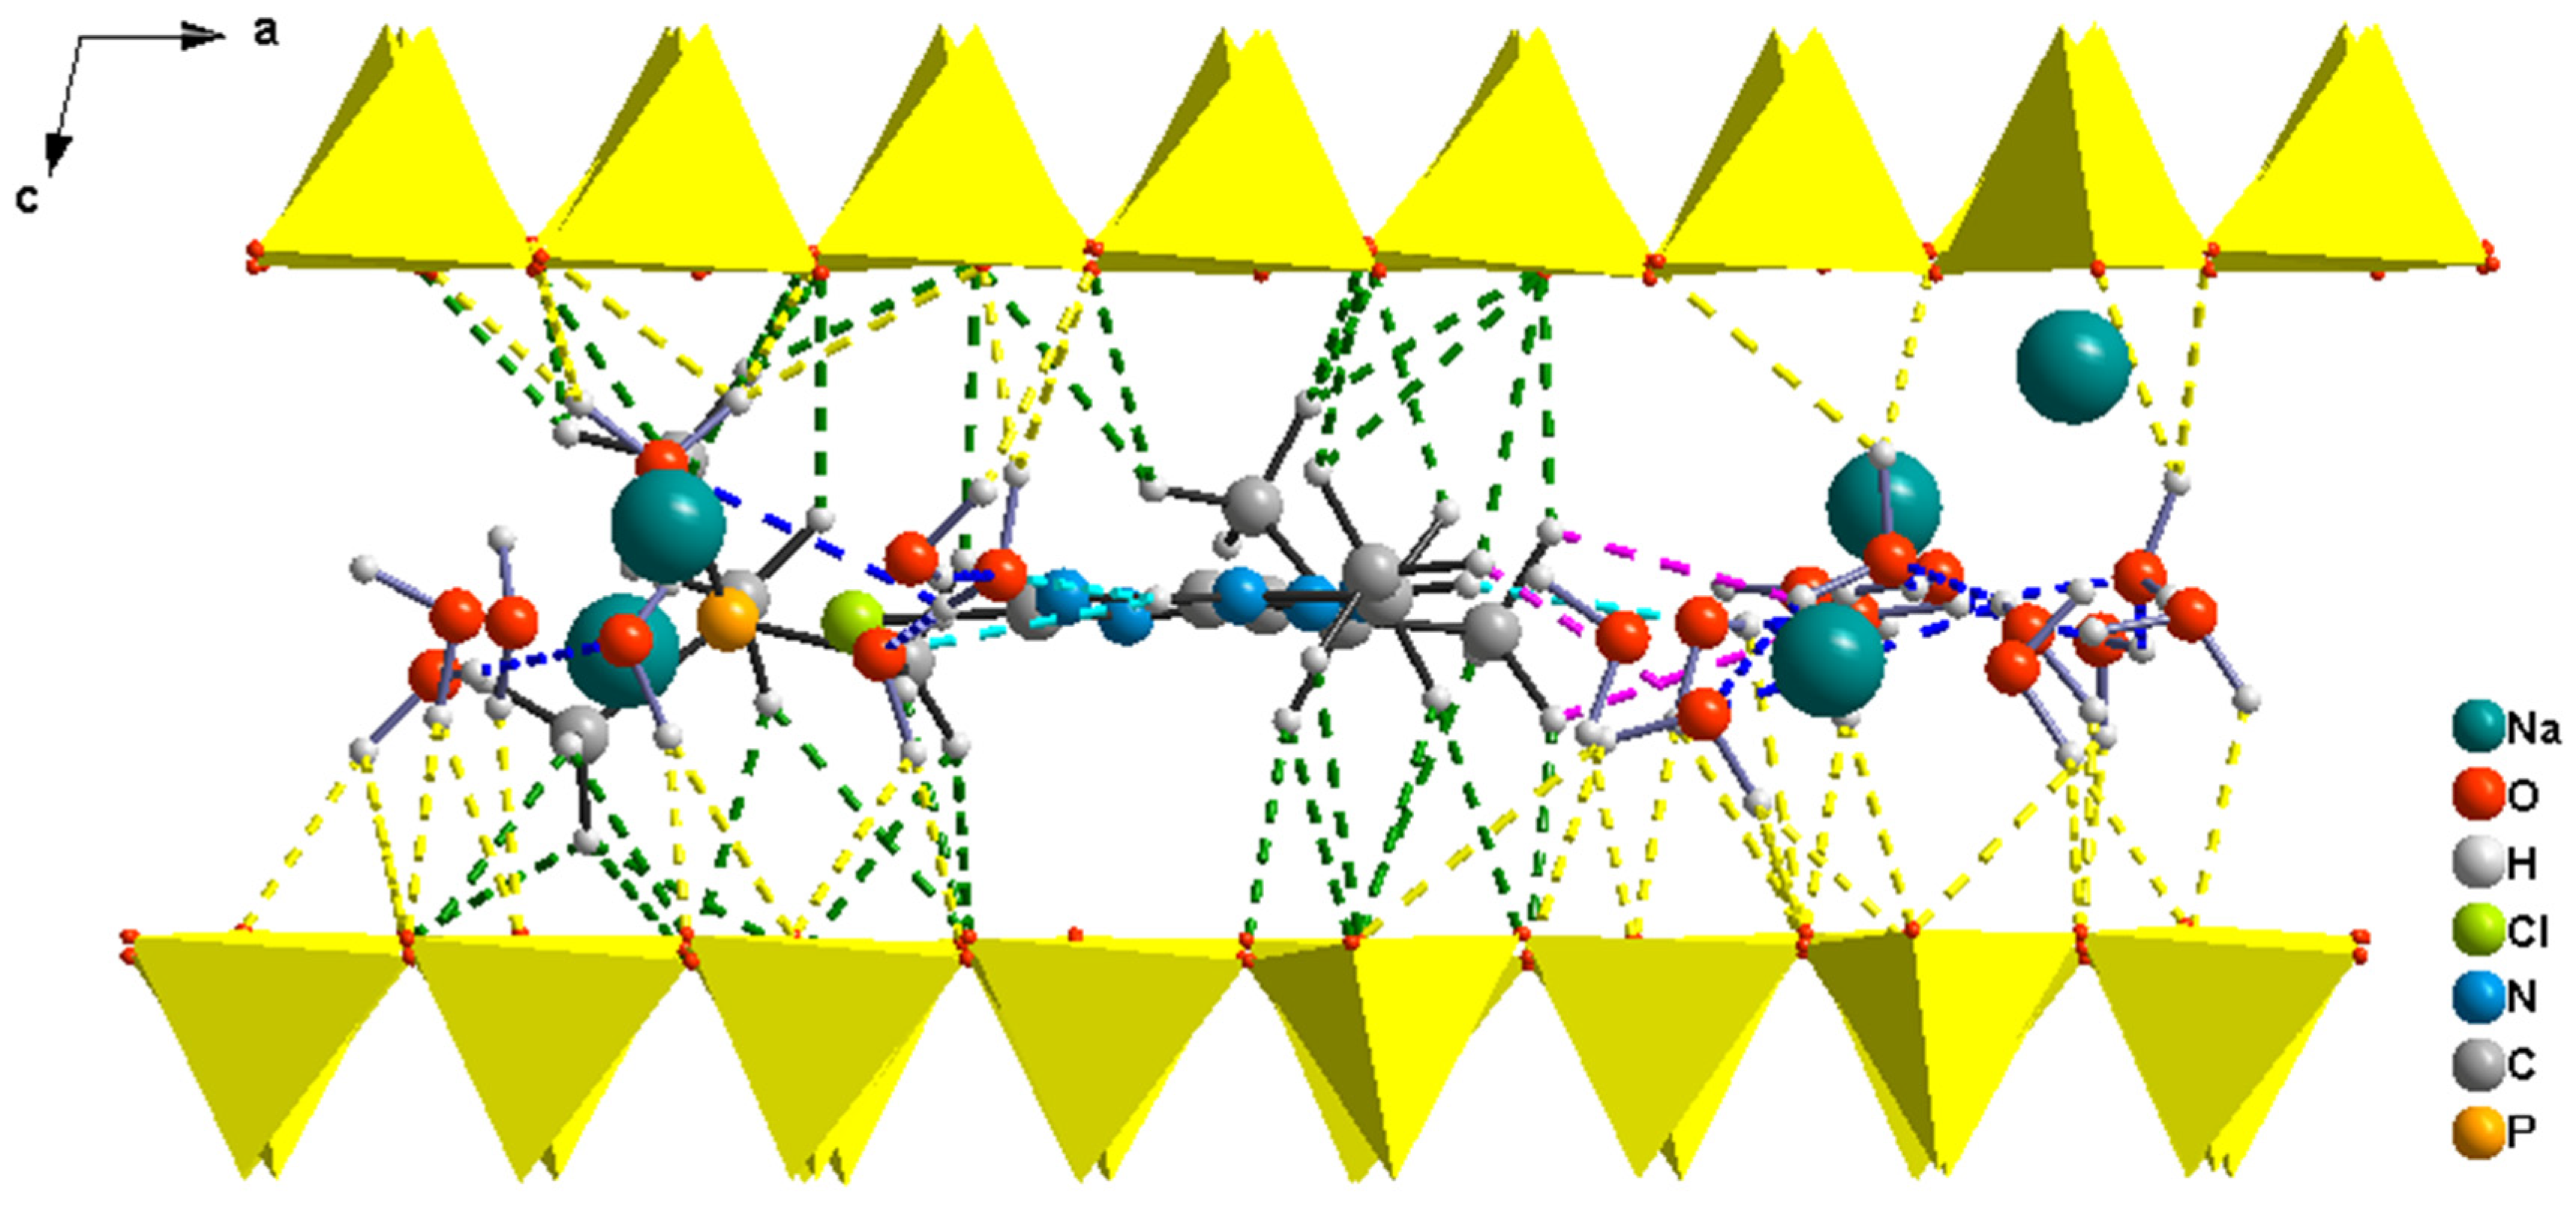
In the case of the A-TMP-Mt structure (d001 = 13.0 Å), the atrazine molecule also has a quasi-planar configuration parallel to the clay surface, and its chlorine atom is out of the center of the ditrigonal hole, pointing mildly towards the TMP cation (Figure 2). Water molecules coordinate the Na+ cation planarly with Na··· Ow distances of ~2.4 Å; however, four water molecules are out of the coordination shell of Na+, reaching the distance of ~4.3 Å, due to the presence of a further organic compound (TMP cation) in the interlayer space. The organic cation TMP is located near an isomorphous substitution (Osubs) (Figure 1c).

3.1.2. Beidellite Complex Structures

The [Na(H2O)4]+ cations are located closer to the tetrahedral substitutions (Tsubs) in the interlayer space in the optimized Na-Bd model with d001 of 12.0 Å (Figure 1c and Table 1). The hydrated sodium cations form a monolayer in the interlayer space with Na··· Ow distances from ~2.3 to 3.7 Å in the Na-Bd model (Figure 1c).
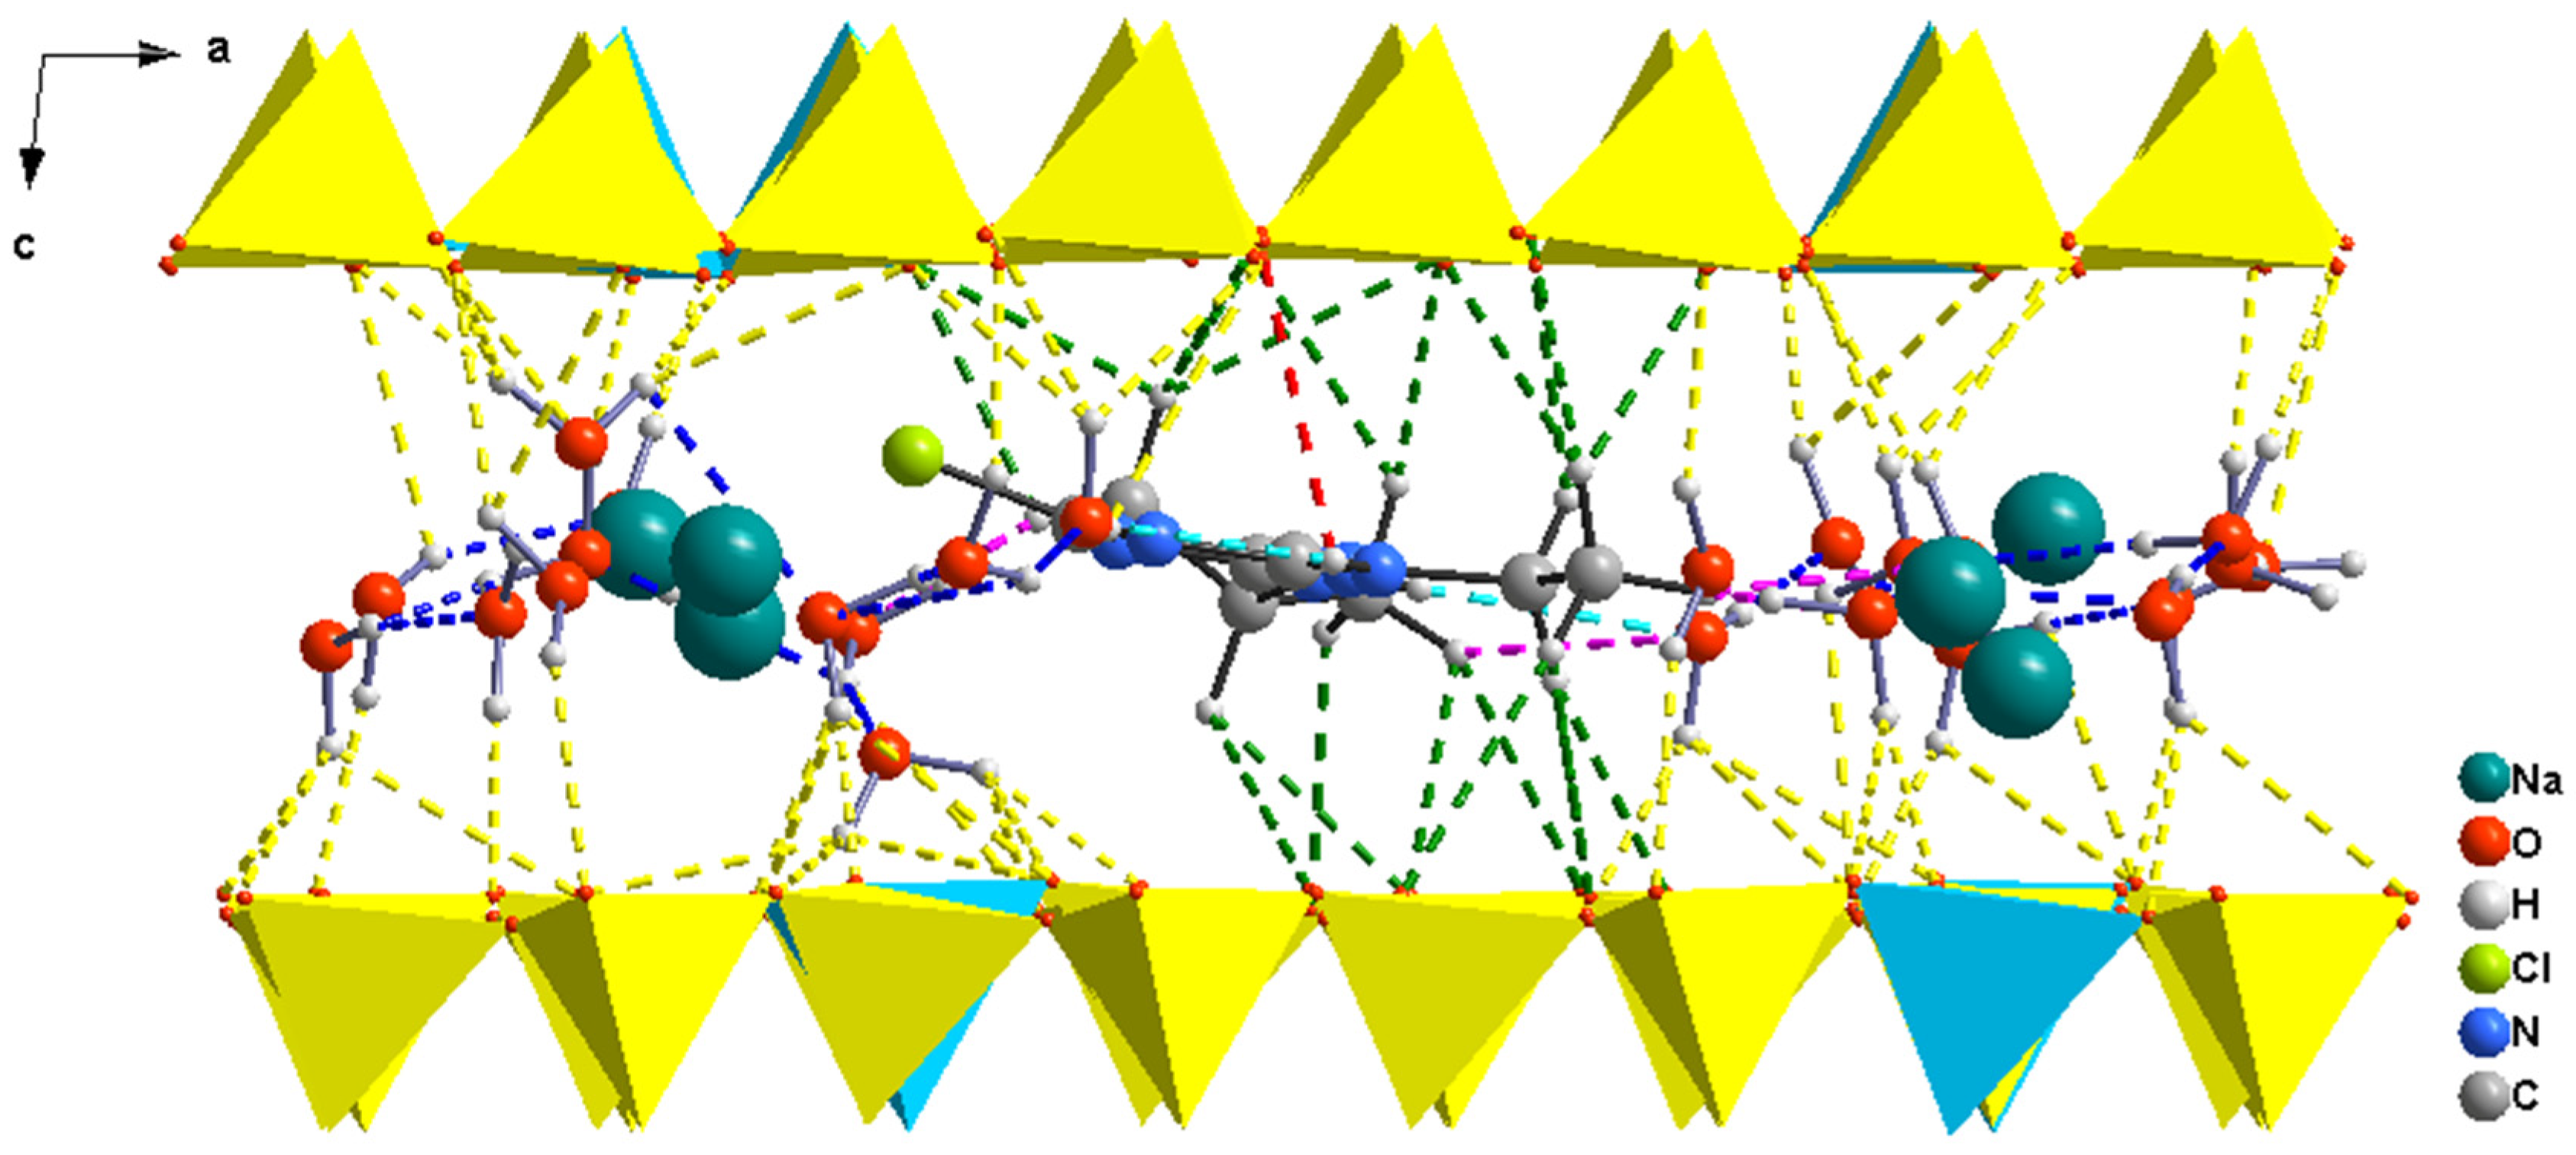
In the A-Bd model (d001 = 12.7 Å), the atrazine molecule has a quasi-planar arrangement (the triazine ring shows a small slope) in the middle of the interlayer space with an angle of ~12° for chlorine with regards to its triazine ring (Figure 3). Chlorine is centered in a ditrigonal hole near the Tsubs. The [Na[(H2O)4]+ cations form a vague monolayer and tend to be closer to the Tsubs. The water molecules coordinate Na+ on the plane with Na··· Ow distances from ~2.4 to 4.4 Å (Figure 1e).
Finally, in the A-TMP-Bd model with d001 = 13.0 Å, the atrazine molecule displays planar arrangement, being centered in the interlayer space. The chlorine is not bent, slightly oriented towards the TMP cation, which is close to the Tsubs. The TMP and [Na(H2O)4]+ cations form a messy monolayer. The water molecules have a planar coordination of the Na cations with Na···Ow distances from ~2.4 to 4.4 Å (Figure 1f).

3.2. Hydrogen Bonding

The atrazine molecule and TMP cation in the interlayer space are anchored onto the Mt/Bd surface through weak hydrogen bonds [75]. The –CH3 and –CH2 groups of the atrazine molecule and –CH3 groups of the TMP cation form weak hydrogen bonds with the basal oxygen atoms (Ob) of the Mt/Bd tetrahedral sheets, C–H···Ob, and with the water molecules, C–H···Ow. The NH groups of atrazine are involved in the hydrogen bonding with the water molecules, forming the N–H···Ow hydrogen bonds, as well as with the Ob atoms of the Mt/Bd surface, forming the N–H···Ob hydrogen bonds. Water molecules mutually interact, forming the Ow–H···Ow hydrogen bonds of moderate strength. The interactions among the water molecules and the basal oxygen atoms of both smectites generate weaker Ow–H···Ob hydrogen bonds (Table 2).
The interactions of the atrazine with the surface of both smectites through –CH2 and –CH3 groups and basal oxygens revealed slight differences between the models with and without organic surfactant (TMP cation). The Catz–H···Ob hydrogen bond distances in the range of 2.38–3.14 and 2.42–3.05 Å are present in the A-Mt and/or A-Bd structures, respectively. They are very similar, slightly favoring the A-Bd structure, especially with the numbers of the present Catz–H···Ob hydrogen bonds (16 for A-Bd and 13 for A-Mt). Further, in the A-TMP-Mt model, the Catz–H···Ob distances are in the range of 2.43–2.85 (Figure 2) and 2.39–2.93 Å for the A-TMP-Bd model. The Catz–H···Ob hydrogen bonds are stronger in the presence of TMP cation. The –CH3 groups of TMP cation are involved in the weak hydrogen bonds, having CTMP–H···Ob distances in the range of 2.32–2.81 Å in the A-TMP-Mt and 2.21–2.91 Å in the A-TMP-Bd, respectively. There are no hydrogen bonds between the TMP cation and the water molecules in the interlayer space of both smectites.
The atrazine –NH groups form a few N–H···Ow weak hydrogen bonds, stronger in the A-Mt structure than in the A-Bd structure, which is similar in the structures with the TMP cation. Together with the stronger mutual interactions of moderate strength among the water molecules (Ow–H···Ow), it can cause the lower stability of the Mt intercalates compared to in the Bd structures. The weaker Ow–H···Ob hydrogen bonds also support this fact, and they are stronger in the A-TMP-Bd structure.
A weak N–H···Ob hydrogen bond was found in the A-Bd model with a distance of 2.98 Å (Table 2), which might also contribute to the higher stability of this structure compared with the A-Mt one.
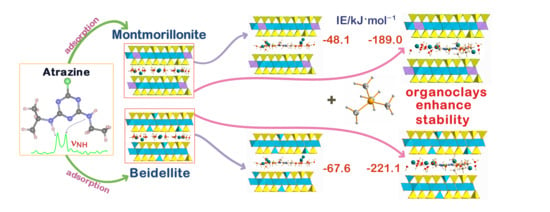
The intercalation energies (ΔEint) calculated as a measure of stability of the model structures correlate well with the strength of hydrogen bonds among the atrazine molecule and the basal surfaces of both clays (Table 2). The beidellite models show a higher stability than montmorillonite complexes, without and with TMP cation in the interlayer space. The presence of the TMP cation remarkably improves the stability of the systems (e.g., −67.6 kJ.mol−1 for A-Bd vs. −221.1 kJ.mol−1 for A-TMP-Bd).
Assuming experimental knowledge, we could estimate that the main driving force for the adsorption of the atrazine molecules on unmodified smectites covers ion–dipole interaction and hydrogen bonds. For pure neutral molecules, e.g., atrazine, the adsorption on hydrophilic clay mineral differs from electrostatic interaction or ion exchange (as in the case of TMP) and keeps in the clay structure the inorganic exchangeable cations, which play an important role for the interactions with other species. However, in the case of TMP organocations, the generally accepted explanation is the extensive intercalation, underlining electrostatic interaction as the main force for their adsorption [37].

3.3. Infrared Spectra

The measured FTIR spectra of the A-Mt/Bd and A-TMP-Mt/Bd organoclays show a good agreement with the calculated VDOS from the AIMD simulations (Figure 4, Figure 5, Figure 6, Figure 7 and Figure 8). The advantage of calculating the projected VDOS is the possibility to unambiguously assign the particular vibrations, which can help to interpret the overlapped broad bands in the experimental FTIR spectra.

3.3.1. A-Mt and A-TMP-Mt Structures

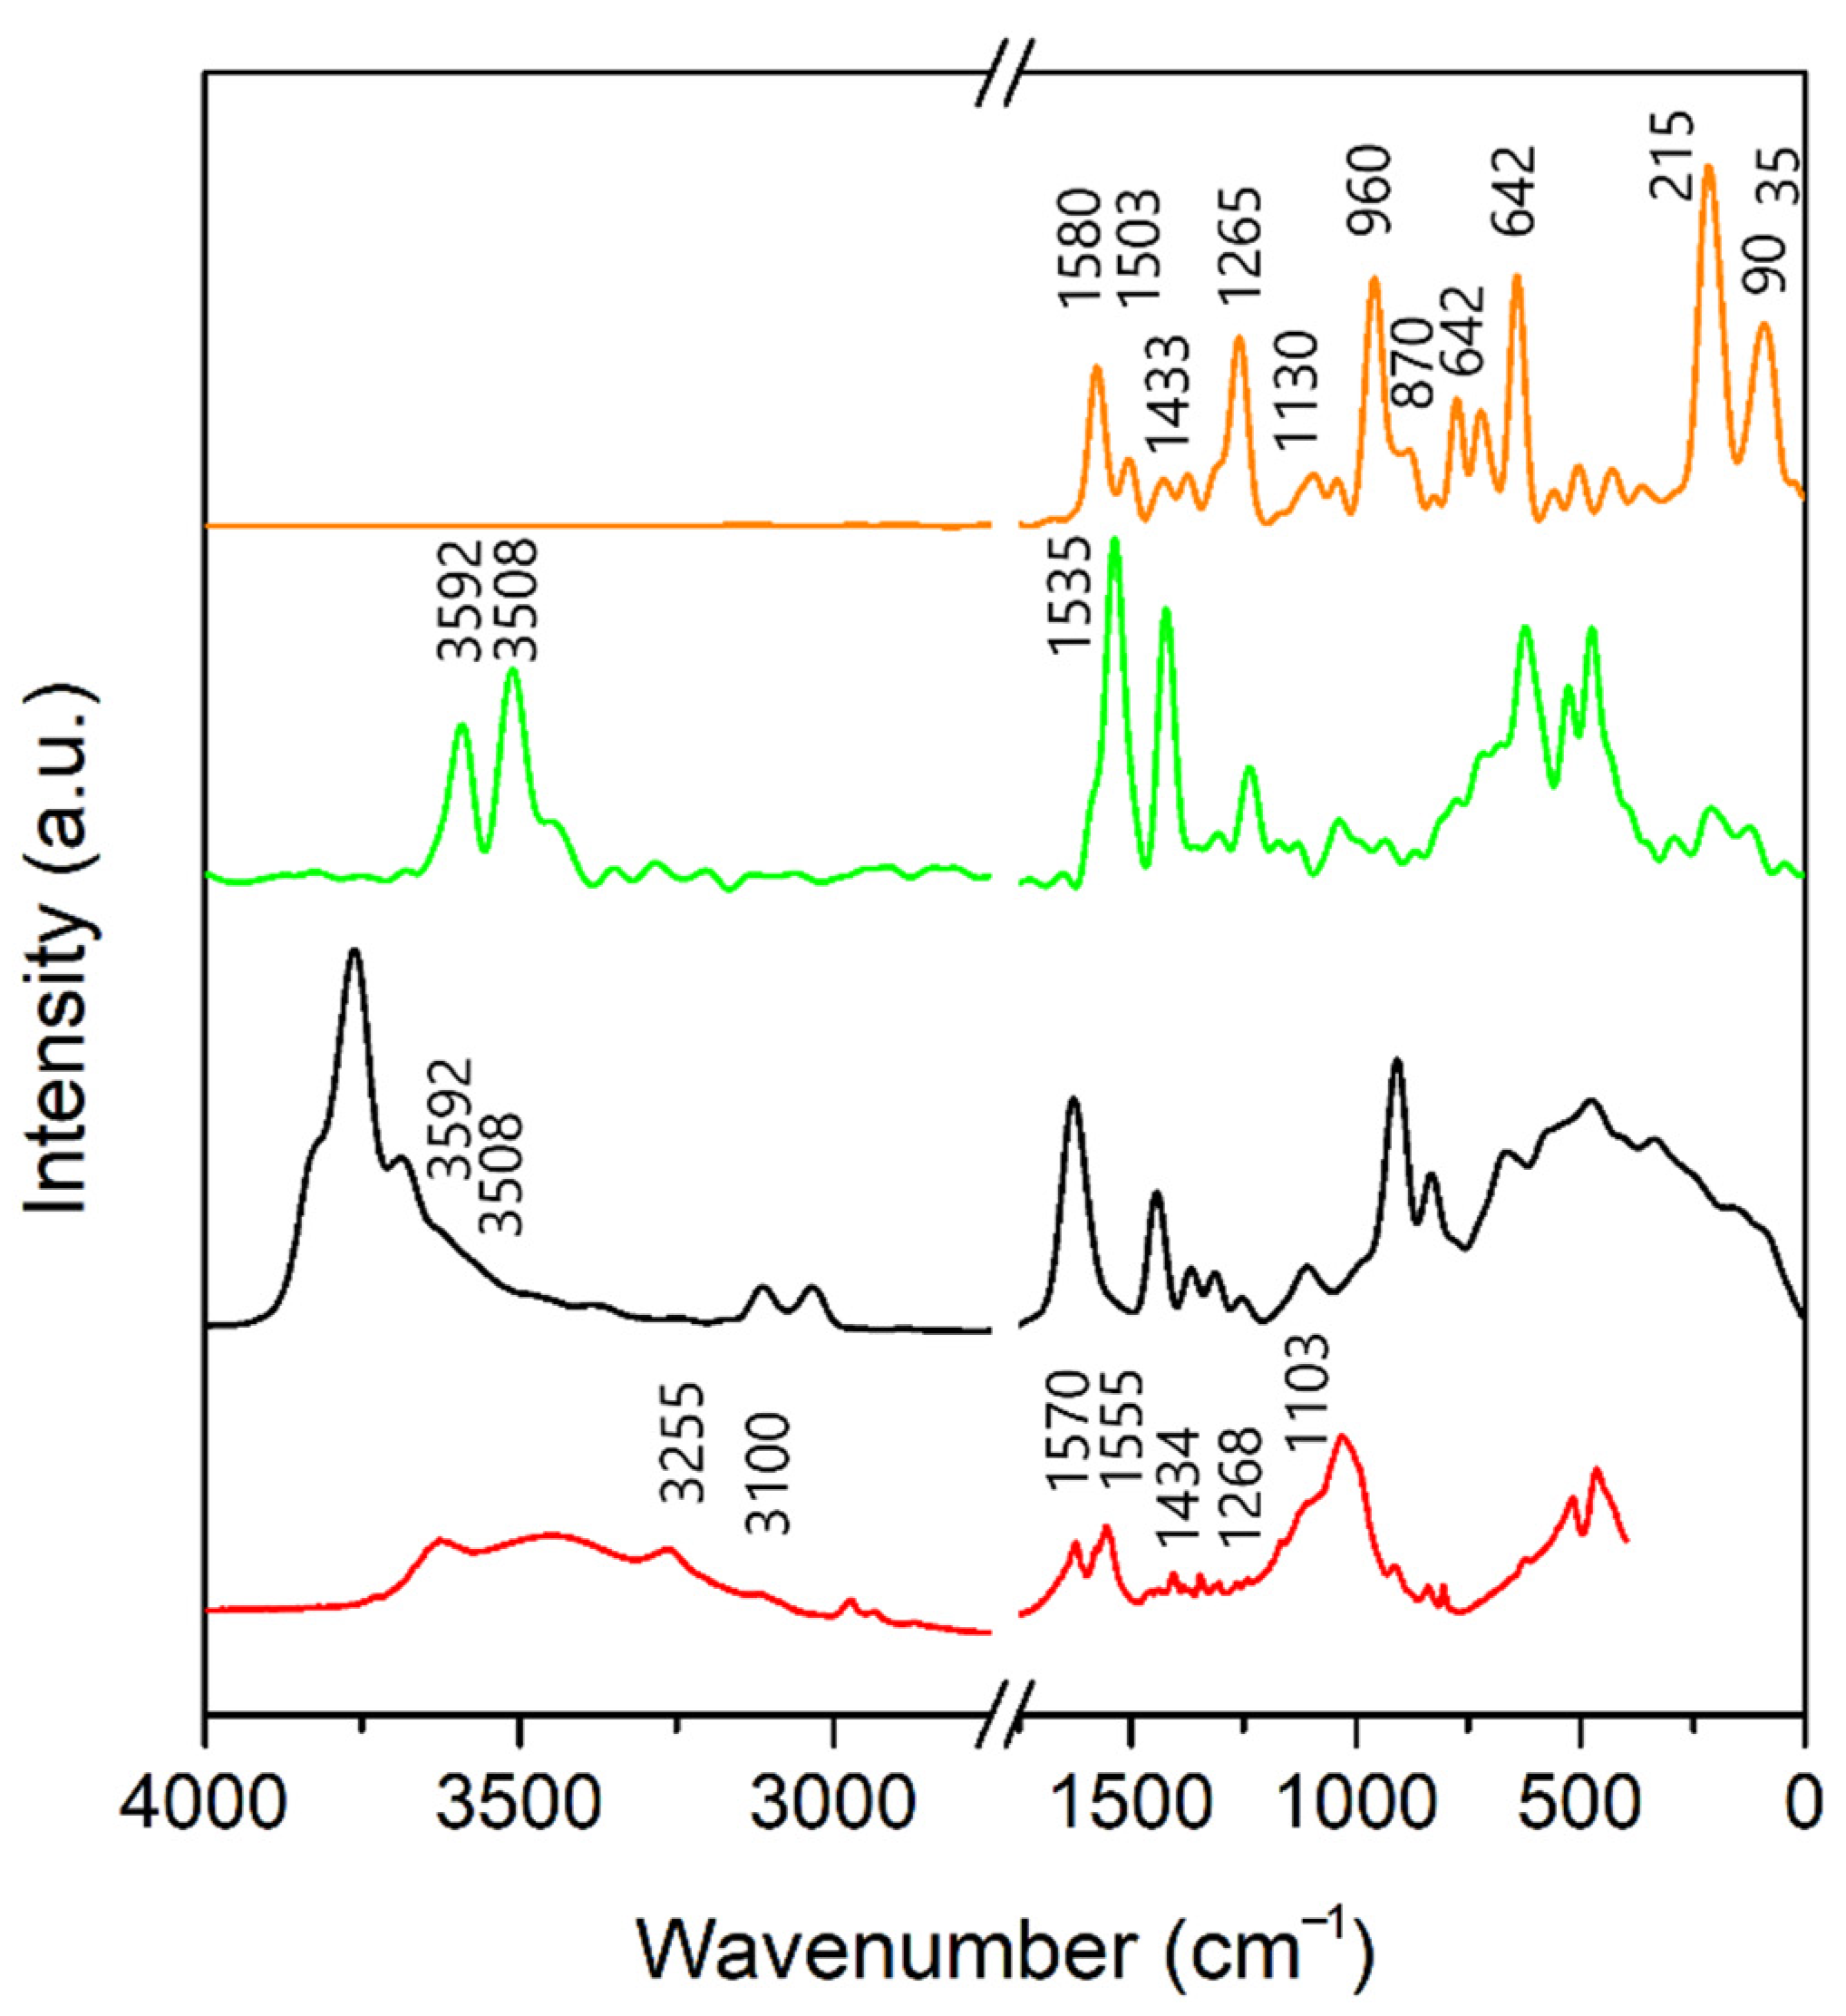
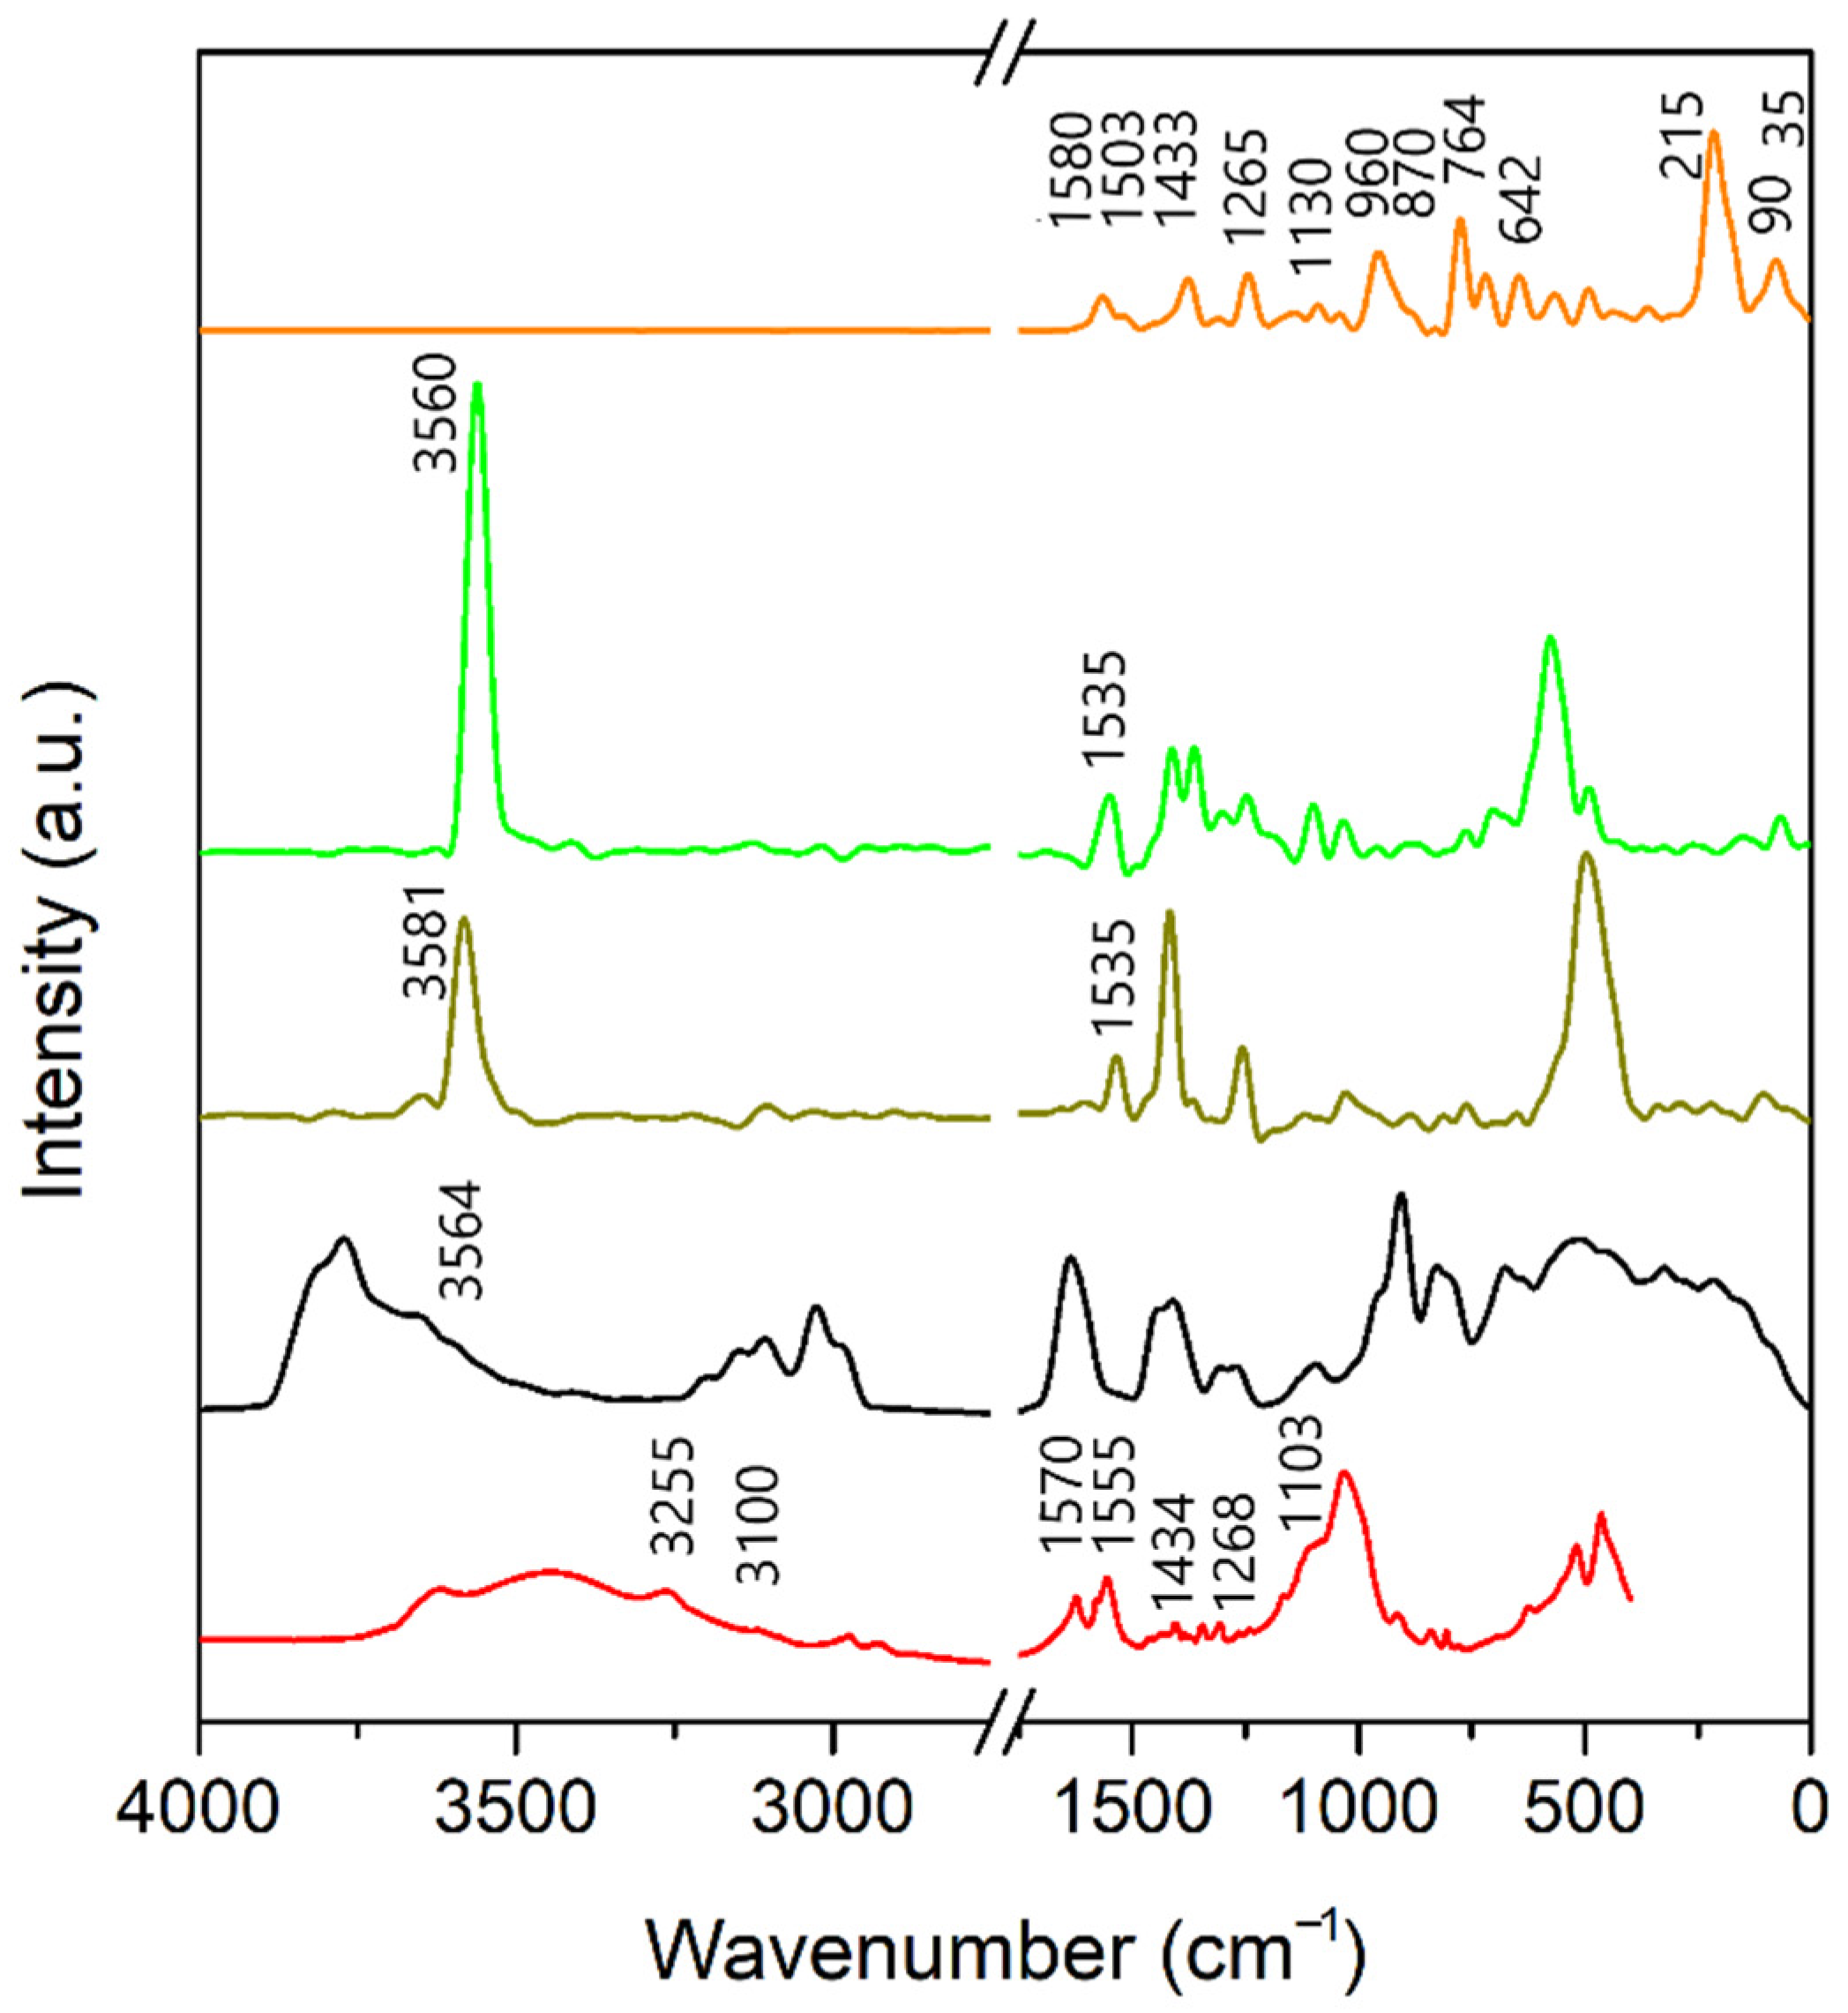
Measured FTIR and calculated spectra of atrazine–montmorillonite organoclays agree well for the A-Mt and A-TMP-Mt structures (Figure 4 and Figure 5). The typical bands of montmorillonite in the highest energy region (3700–4000 cm−1) and below 2000 cm−1 were discussed in detail by Scholtzová (2019). N–H stretching vibrations were assigned at 3592 and 3508 cm−1 for A-Mt and 3564 cm−1 for A-TMP-Mt (calculated). These bands correspond to bands at 3255 and 3100 cm−1 in the FTIR spectra, respectively. One slightly broader band in the calculated spectra for both –NH groups of A-TMP-Mt (3564 cm−1) was analyzed in detail, and it was revealed that the N–H stretching vibration energies of both -NH groups are close to each other (3560 and 3581 cm−1), differing only by 21 cm−1 (Figure 5). The analysis of the N–H···Ow hydrogen bonds revealed this tiny effect. The N–H···Ow hydrogen bond distances in values, with 2.30 Å for the –NH1 group and 2.67 and 2.55 Å double-centered hydrogen bonds for the –NH2 group, are close to each other. The N–H bending vibration appeared at 1535 cm−1 (calculated), which corresponds to the experimental band at 1555 cm−1.
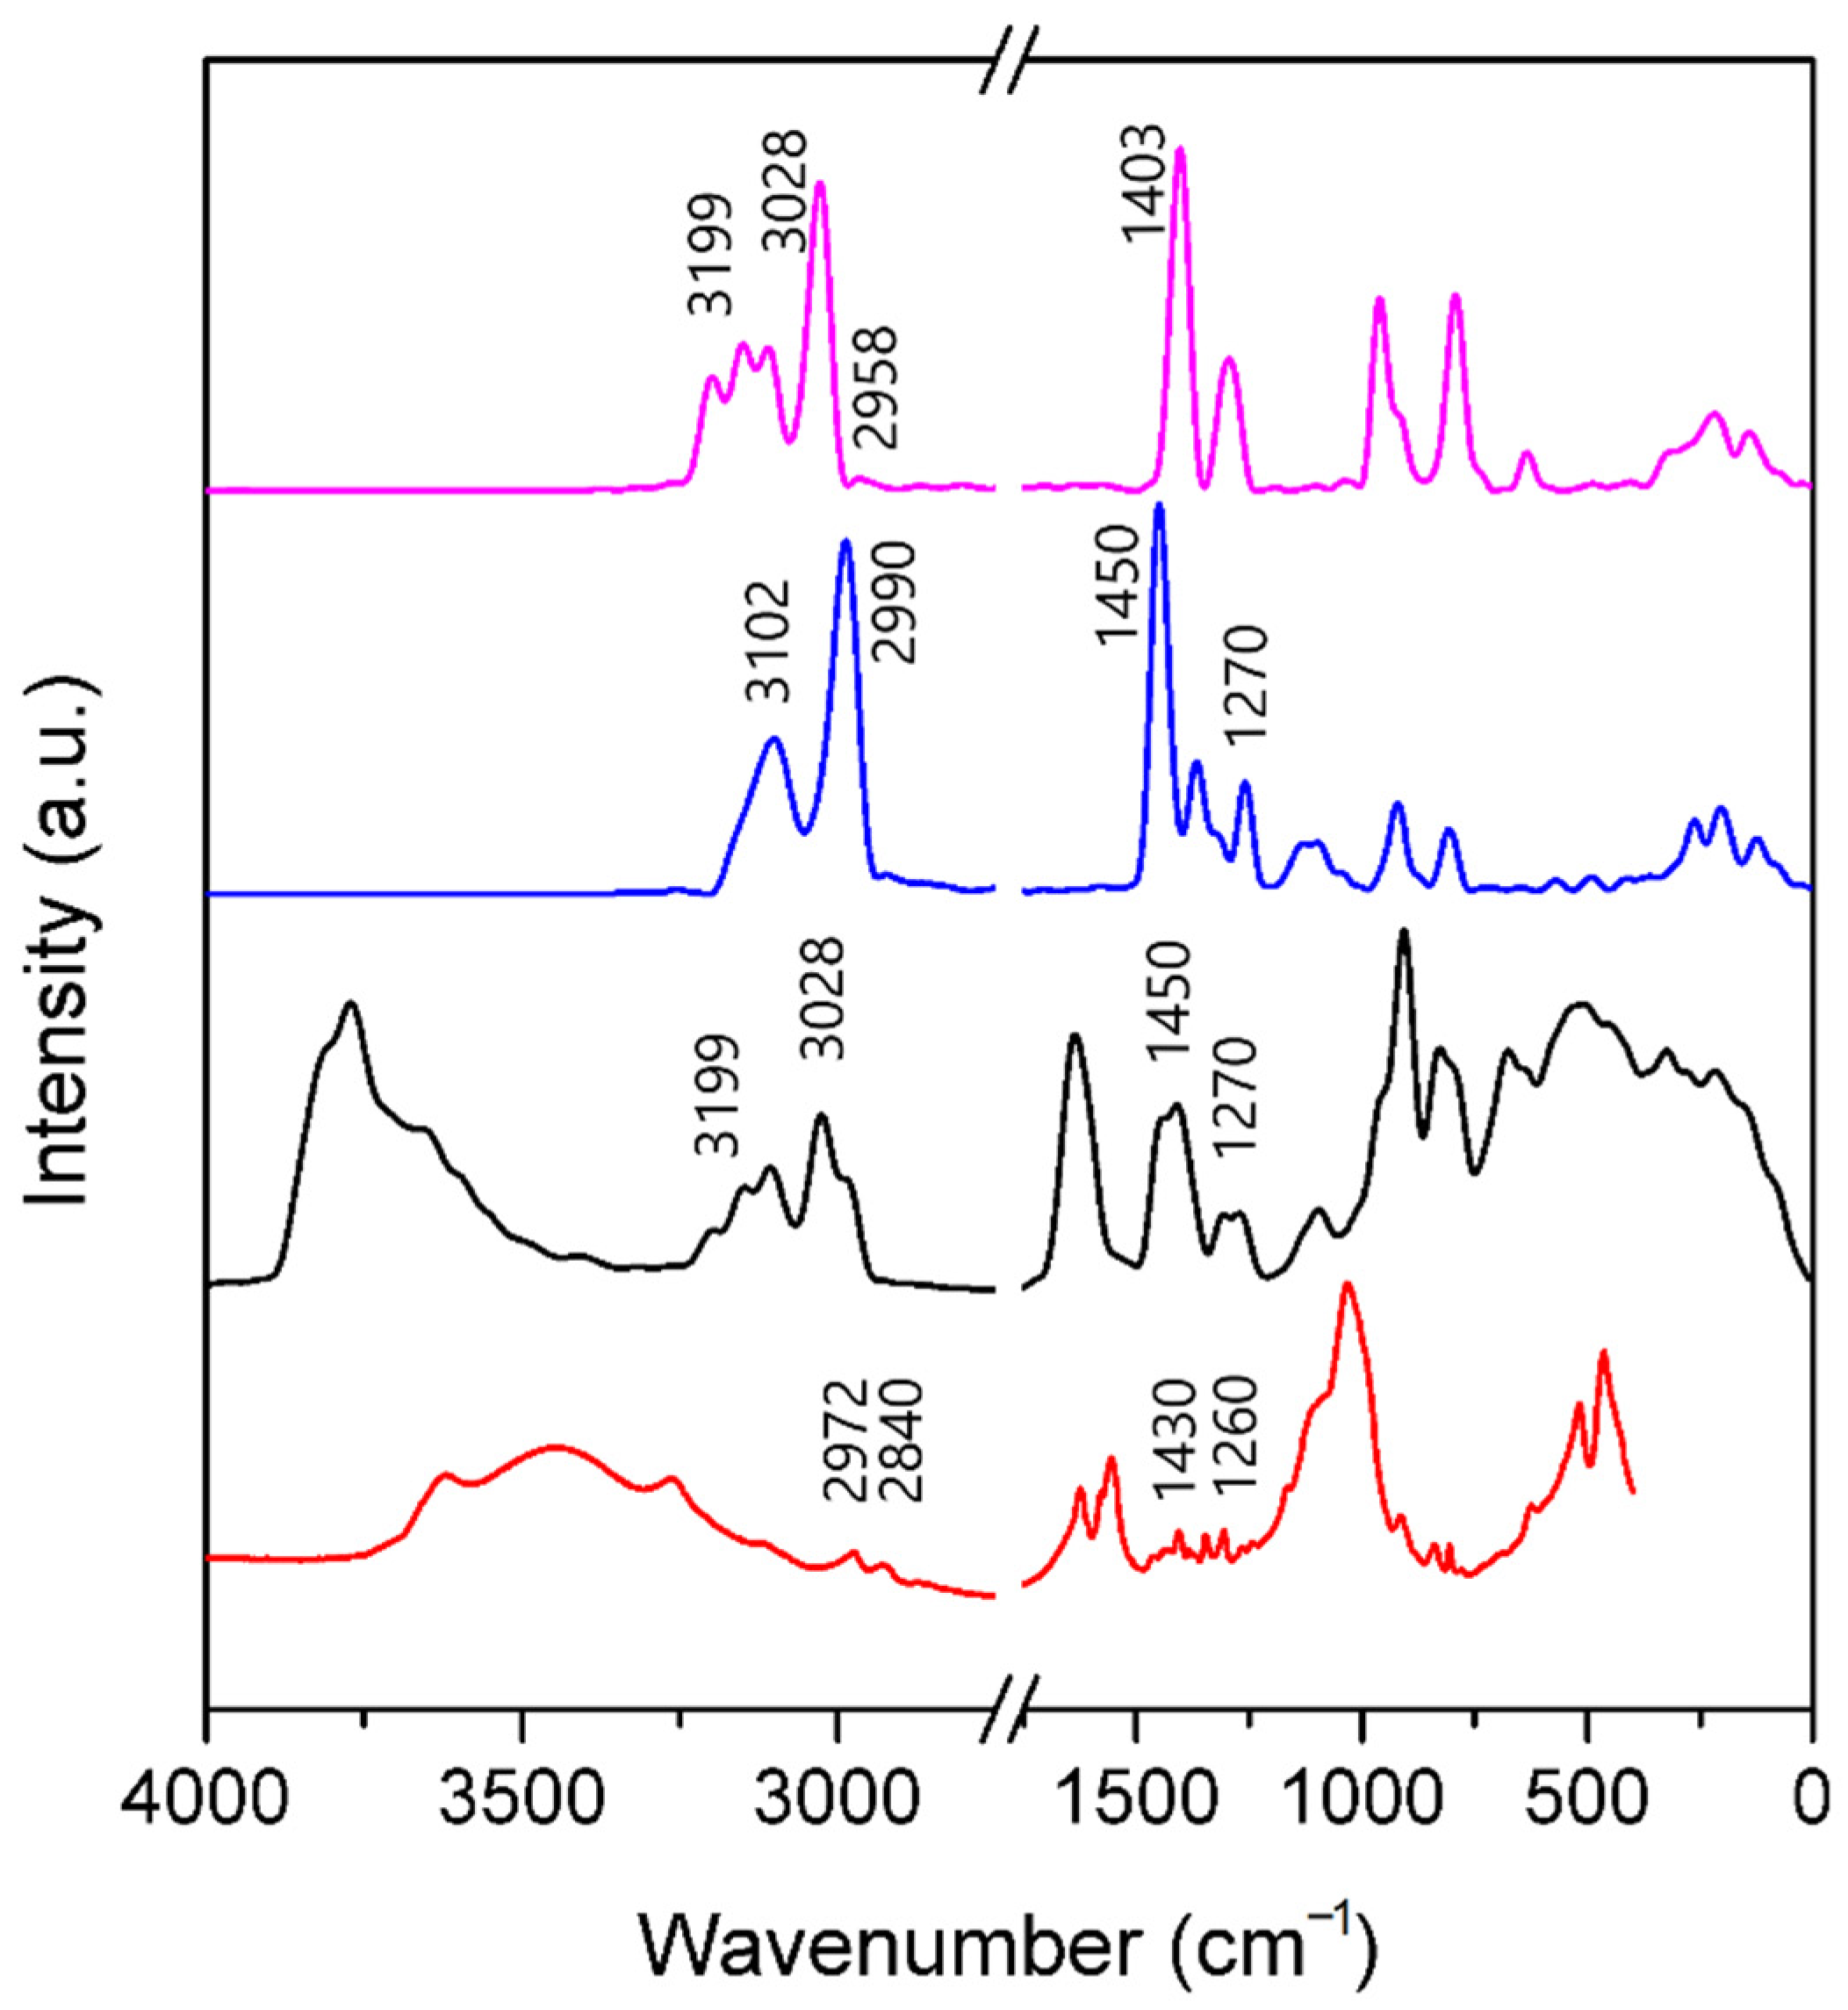
The triazine ring vibrations in the atrazine molecule appeared at 1580, 1503, 1433, 1265 and 1130 cm−1 in PDOS, corresponding well with 1570, 1434, 1268 and 1103 cm−1 in the measured FTIR spectra (Figure 4 and Figure 5). These bands overlap with the O–H bending vibrations from water molecules (1570 cm−1), N–H vibrations (~1535 cm−1), C-H bending (~1430 and ~1260 cm−1) and Si–O stretching vibrations (1100 cm−1). Overlapped bands from the triazine ring in the experimental FTIR spectrum below 1000 cm−1 (e.g., by Si–O–Al stretching and bending modes and skeletal vibrations from clay structure) were well resolved in calculated spectra (960, 870, 764, 642, 215, 90 and 35 cm−1) in both A-Mt and A-TMP-Mt intercalates (Figure 4 and Figure 5).
The C-H stretching vibrations were assigned in the range of 3199–2958 cm−1 in the calculated spectrum (2972–2840 cm−1 in FTIR) and bending vibrations in the range of 1450–1270 cm−1 (calculated) and 1430–1260 cm−1 (experimental) for both atrazine–montmorillonite intercalates (Figure 4 and Figure 5). The calculated C–H stretching vibrations of the TMP cation in the A-TMP-Mt structure (Figure 6) have higher energy than those of the C–H stretching vibrations from the atrazine molecule (ΔνCH = 97 cm−1 for the highest energy bands), correlating well with the strength of hydrogen bonds (Table 2), which are slightly stronger than those for the C–H group of atrazine.
The blue shifts to the higher wavenumbers of the C–H stretching vibrations of the TMP cations in the both Bd/Mt intercalates are not obvious because, in standard X–H···Y hydrogen bonds, a red shift of X–H stretching vibration is typical [75]. However, mainly for the sp3 hybridized carbon, examples where the blue shift of C–H wavenumbers is observed have been found. Several theories exist for this effect, which can be found (see, e.g., [76]) together with examples showing that the C–H bonds are shortened, being involved in hydrogen bonding [36].

3.3.2. A-Bd and A-TMP-Bd Structures

The characteristic beidellite bands (925, 534, 474 and 418 cm−1) visible in the experimental spectrum were recognized in the measured and calculated spectra for both beidellite organoclays. The detailed analysis of beidellite spectrum was done in our previous work [47]. The focus on the N–H and C–H vibrations of the atrazine molecule was done in the present work as in the Mt organoclays discussed above.
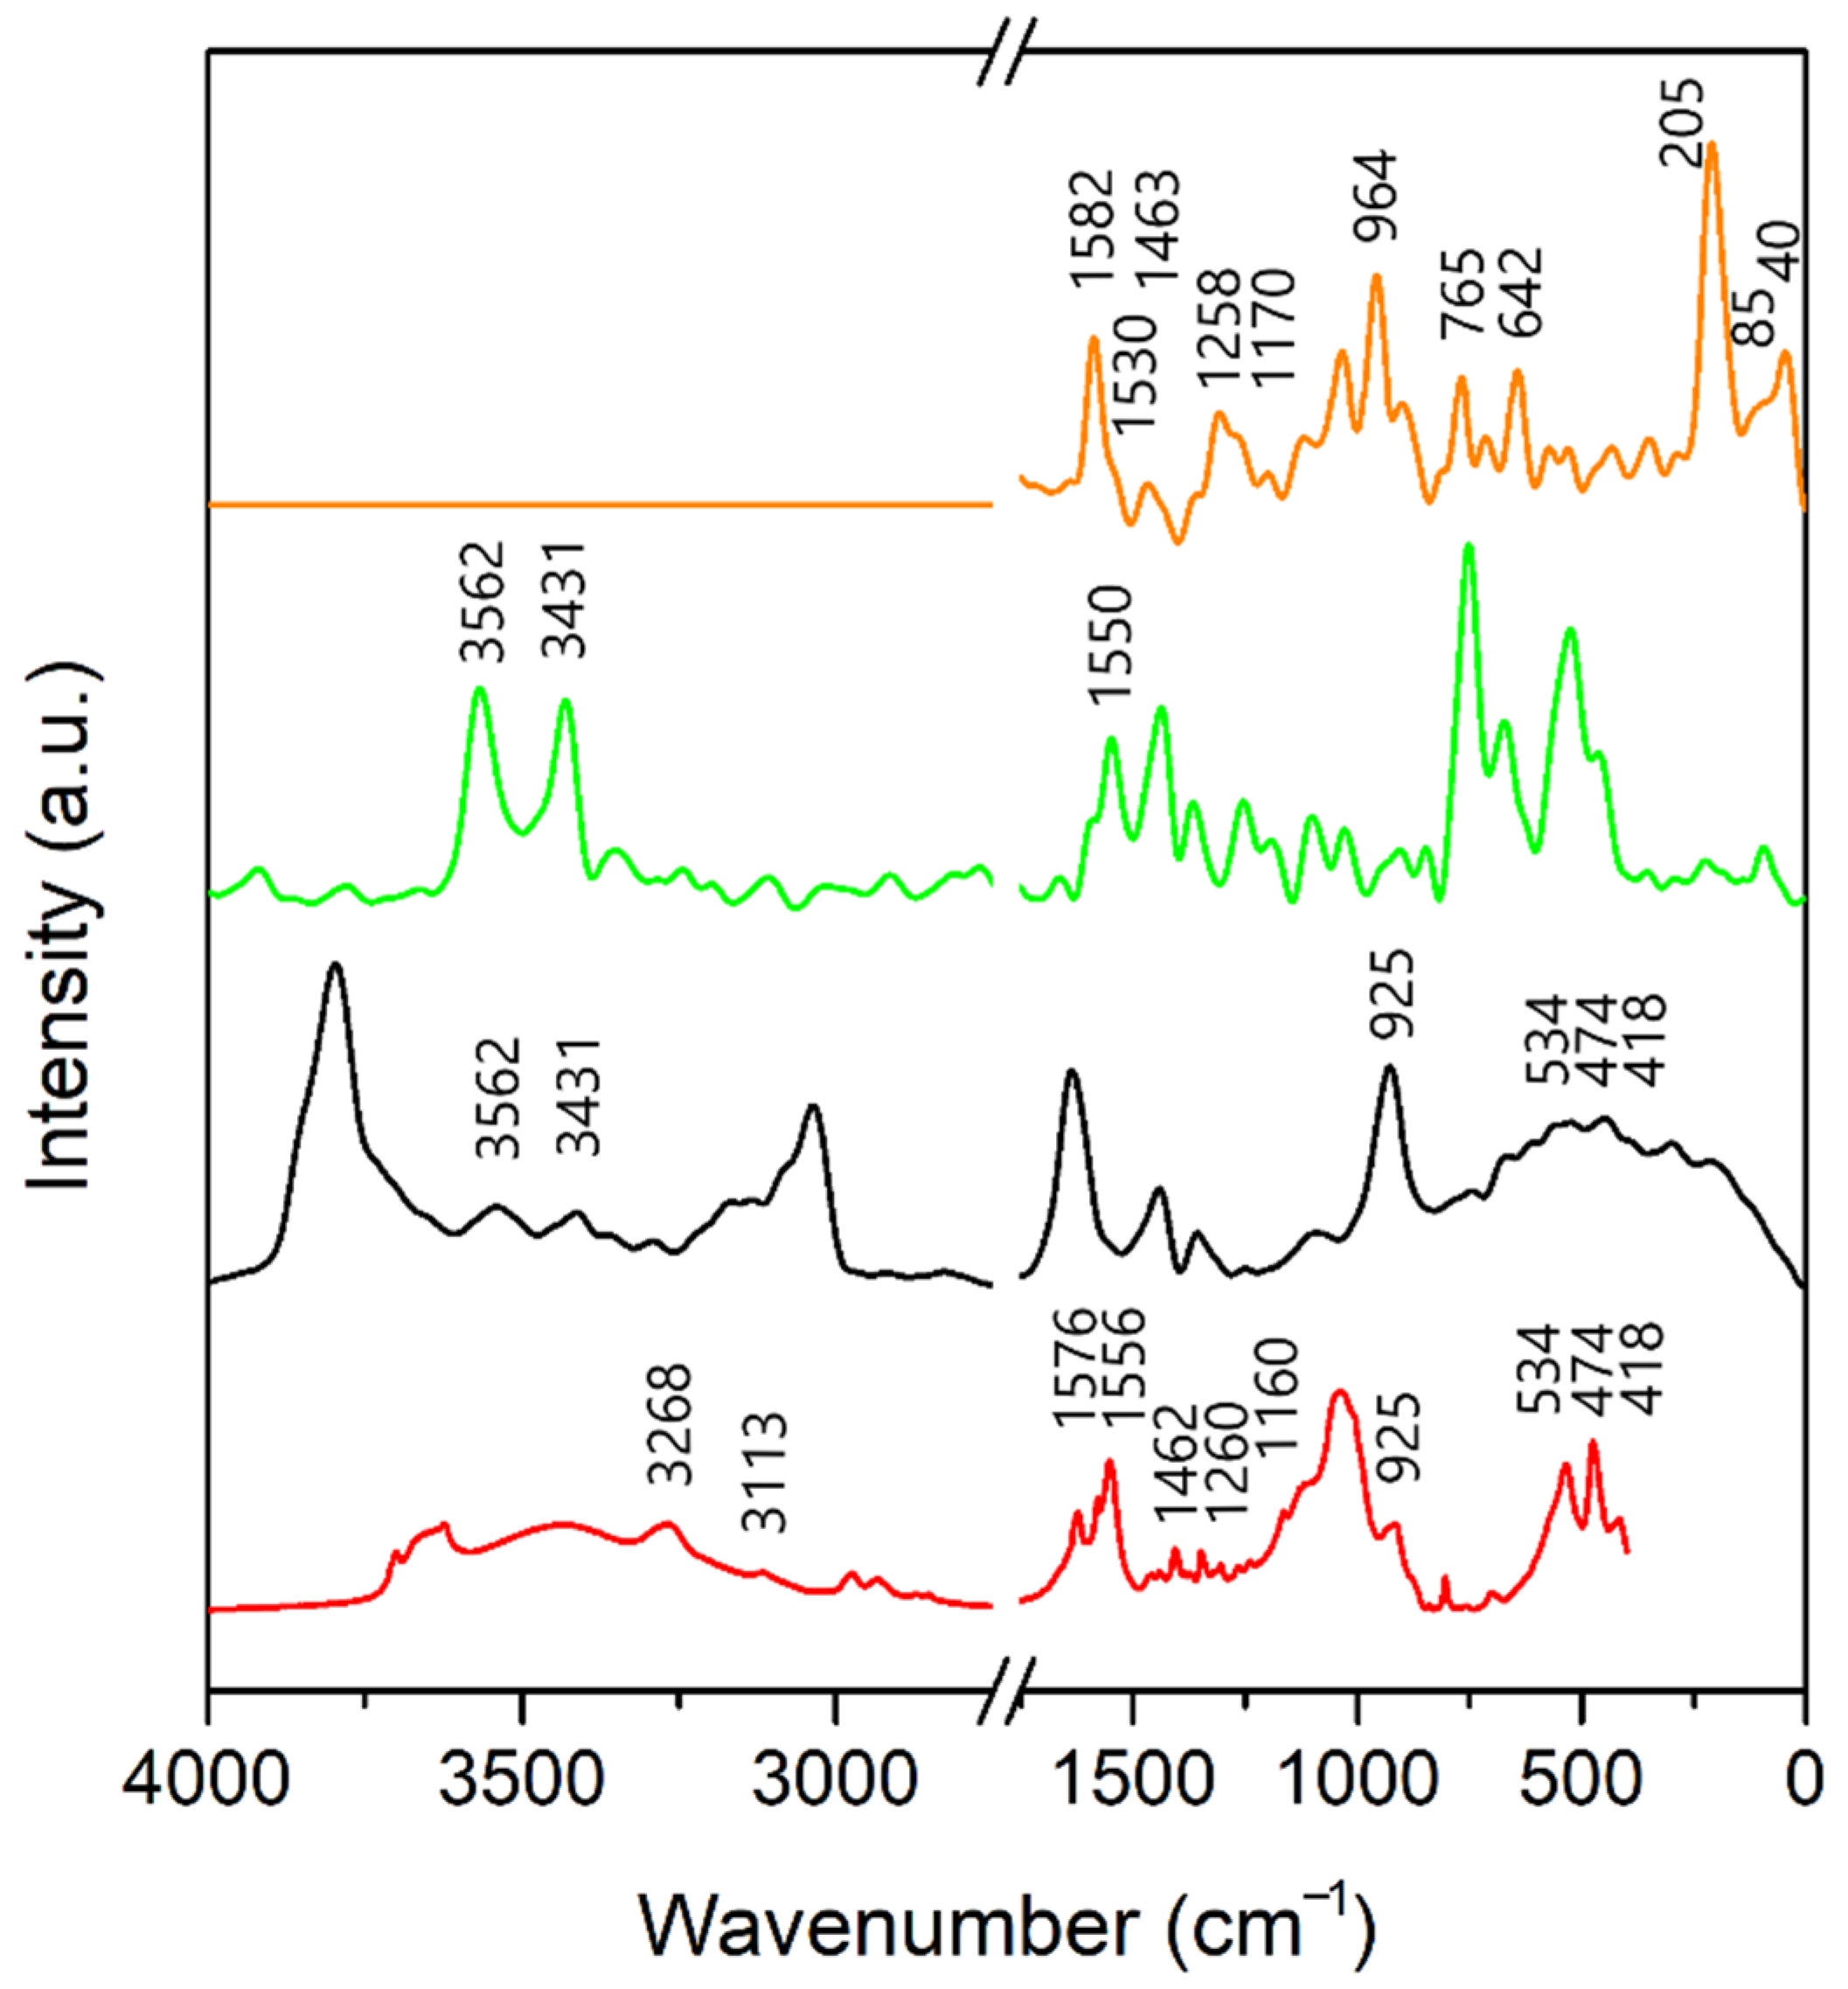
Projected N–H stretching vibrations from the atrazine molecule appeared at 3562 and 3431 cm−1 for A-Bd (Figure 7) and at 3595 and 3492 cm−1 for A-TMP-Bd (Figure 8), corresponding with 3268 and 3113 cm−1 in the FTIR spectra of both intercalates. N–H bending vibrations appeared at 1550 cm−1 in the calculated spectra and at 1556 cm−1 in the experimental spectra for both intercalates.
The typical bands of triazine ring vibrations in atrazine molecule appeared at 1582 cm−1 with a shoulder at 1530 cm−1; furthermore, bands at 1463, 1258 and 1170 cm−1 in PVDOS corresponded with 1576, 1555, 1462, 1260 and 1160 cm−1 in the measured FTIR spectra (Figure 7 and Figure 8). Well resolved calculated bands at 964, 840, 765, 642, 205, 85 and 40 cm−1 in PDOS could not be easily detected in the experimental spectra due to overlapping bands in the FTIR spectra of both A-Bd and A-TMP-Bd intercalates (Figure 7 and Figure 8). The overlapping of bands in this region is the same as for the montmorillonite clays discussed above.
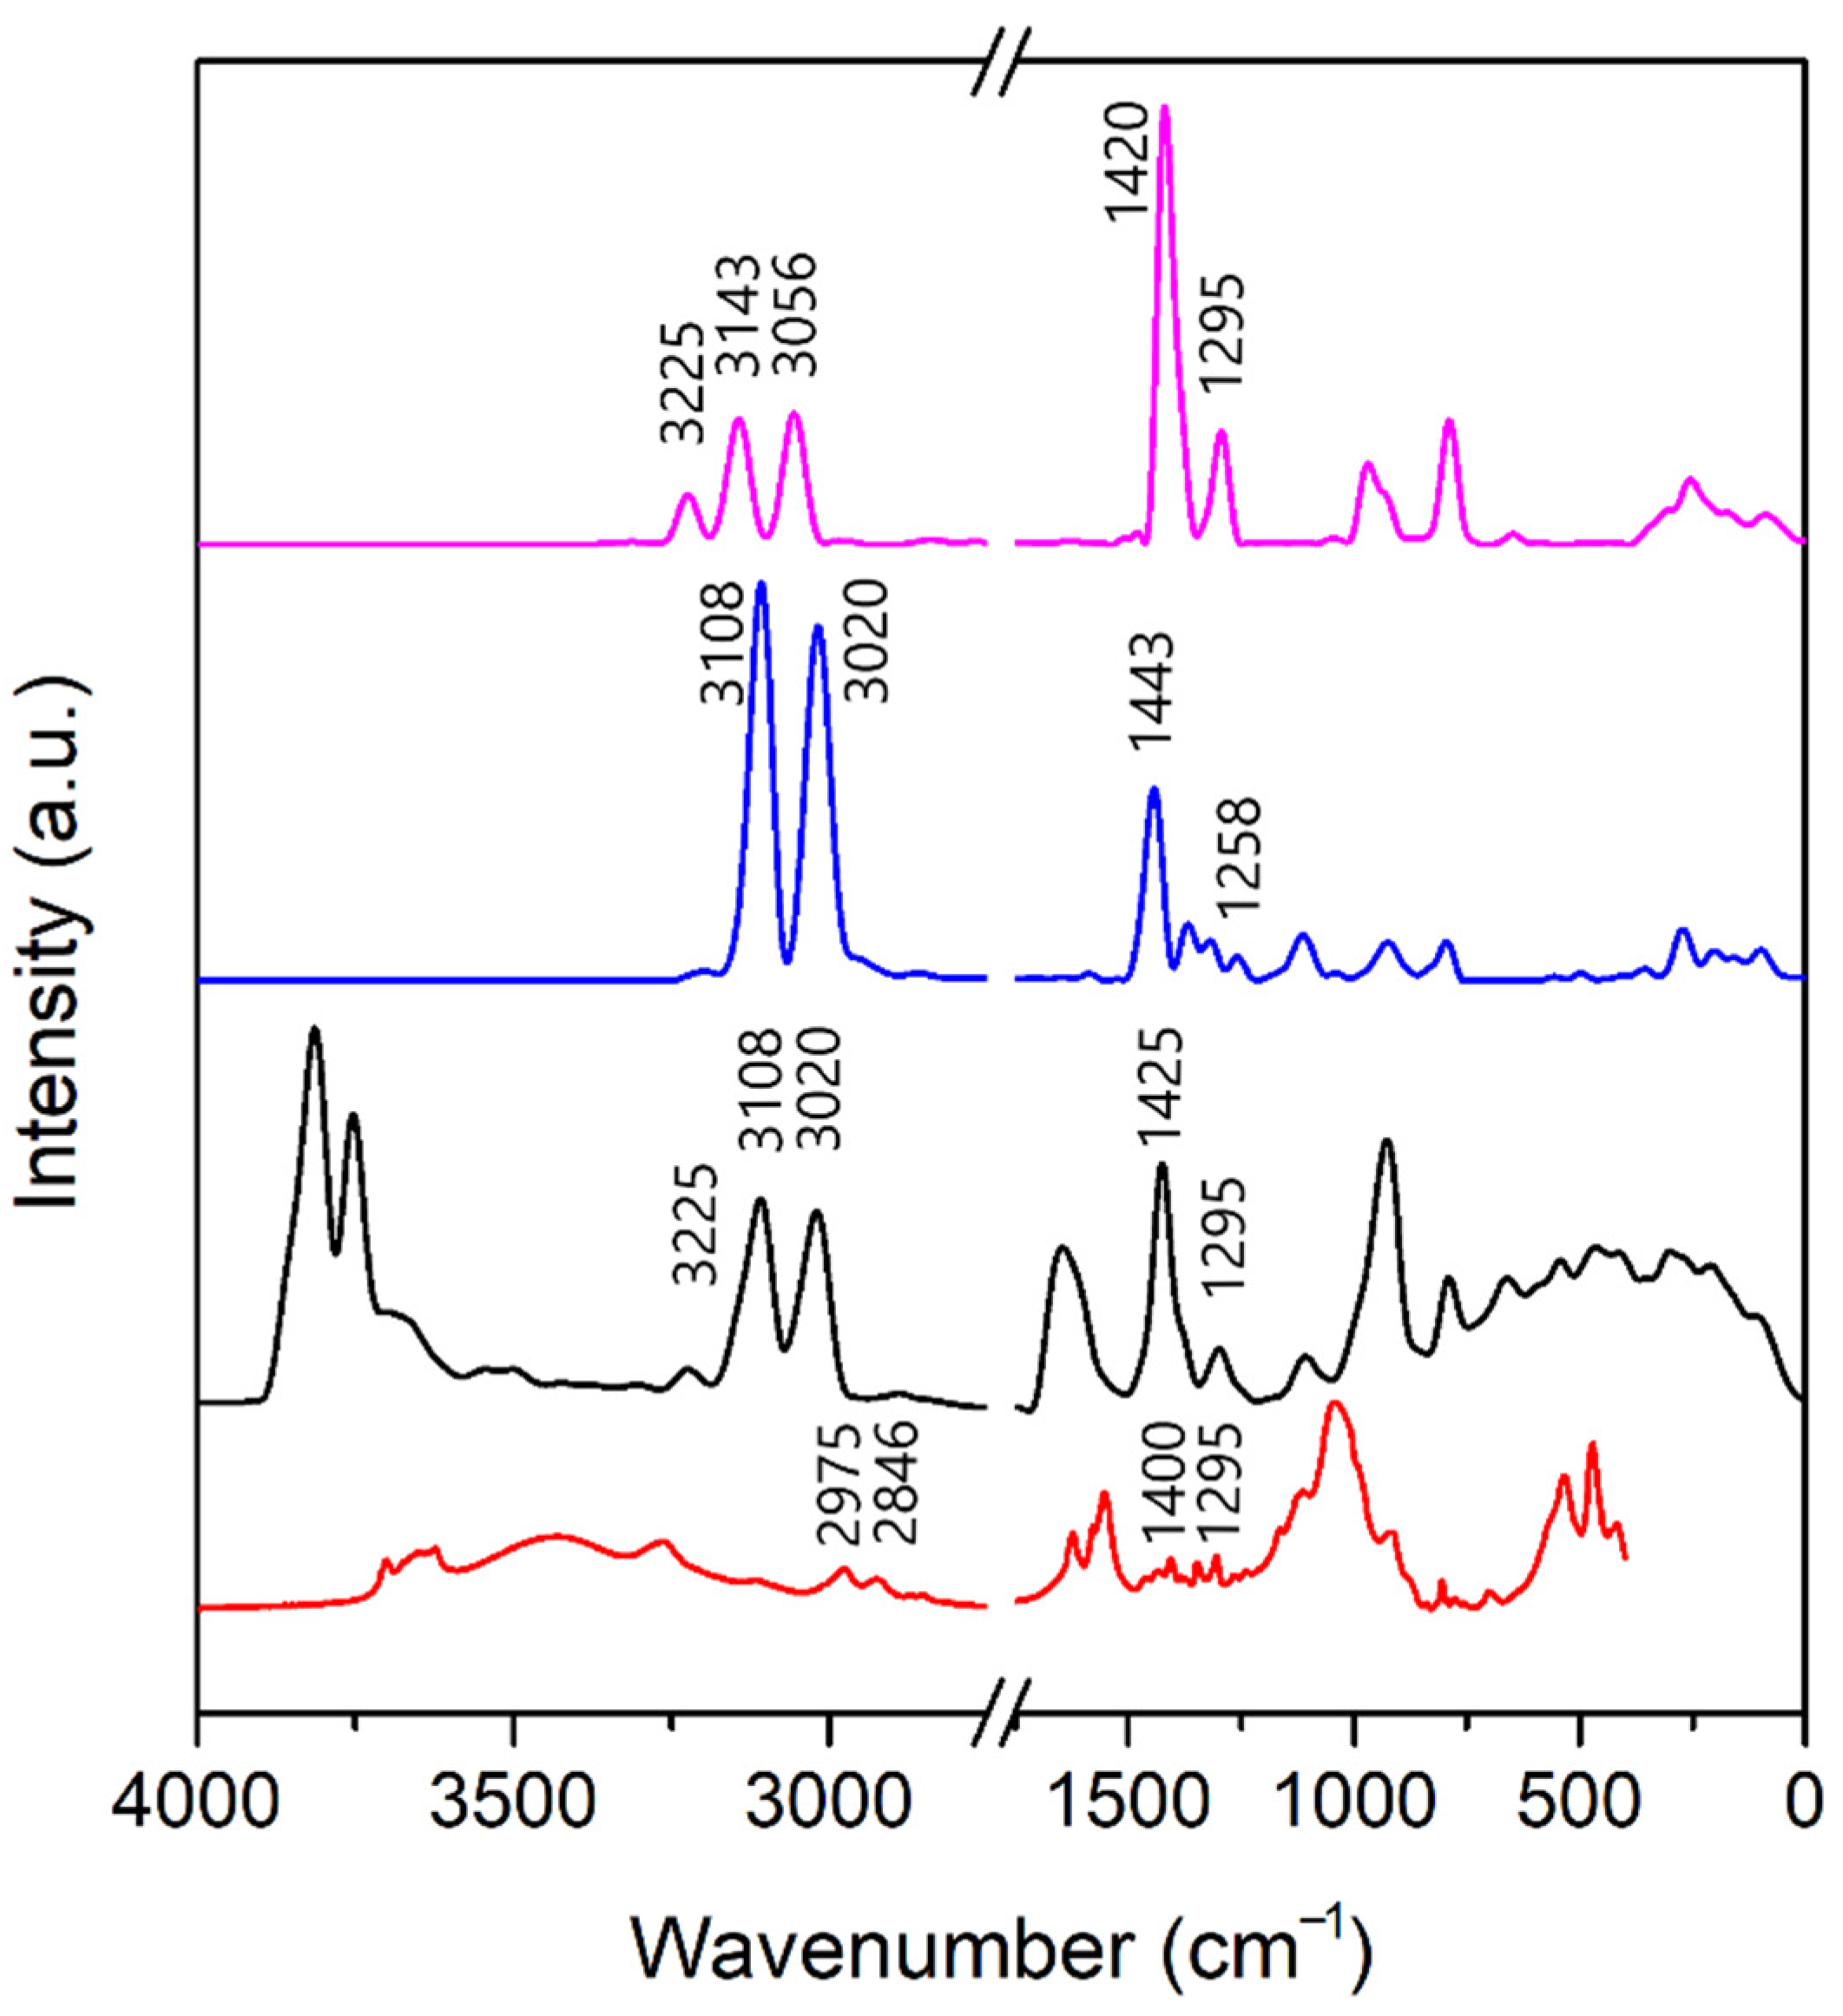
Contributions of C–H stretching vibrations are well resolved in the experimental spectra (2975–2846 cm−1), as well as the bending vibrations (1400–1295 cm−1) for both Bd intercalates. In the case of A-TMP-Bd, the calculated projected VDOS clearly distinguishes among the C–H vibrations from the TMP cation and the atrazine molecule, as shown in Figure 9.
The energy of C–H stretching vibrations from the TMP cation is higher (3143 cm−1) than that from the atrazine molecule (3108 cm−1), which corresponds with the slightly stronger hydrogen bonds of these functional groups (Table 2). The energy of C–H stretching vibrations of the TMP cation is also higher in the A-TMP-Bd intercalate than in the A-TMP-Mt structure (~26 cm−1 for the highest energy bands).
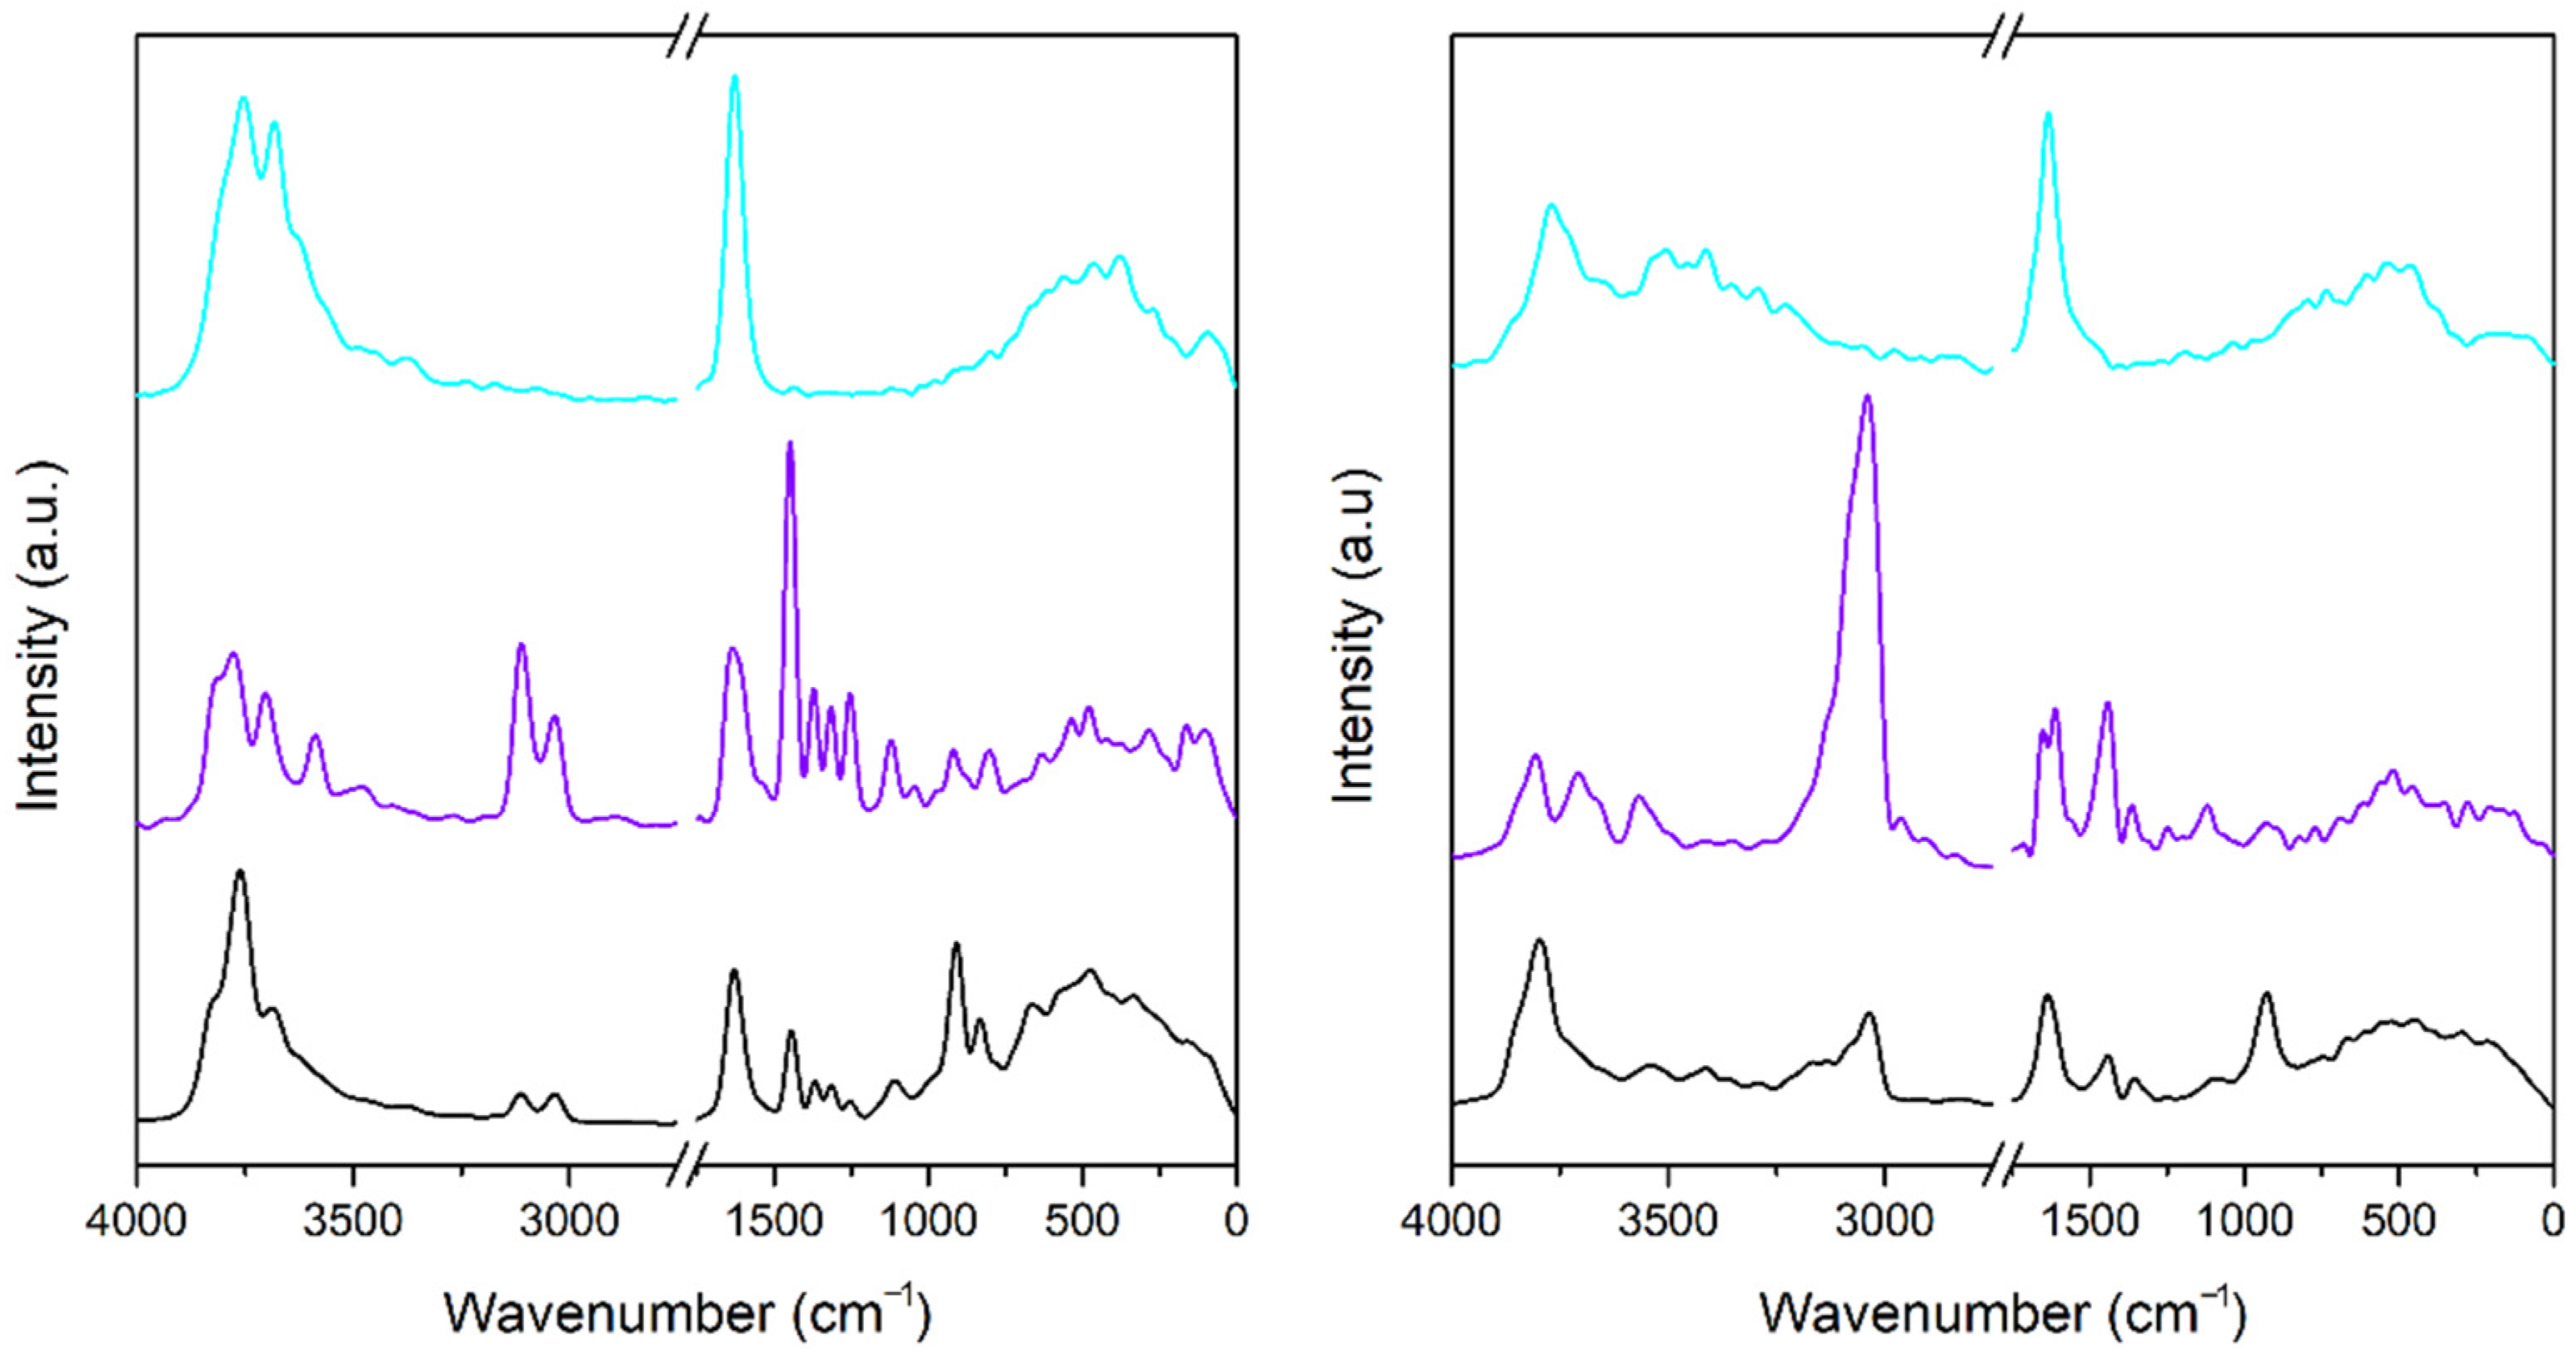
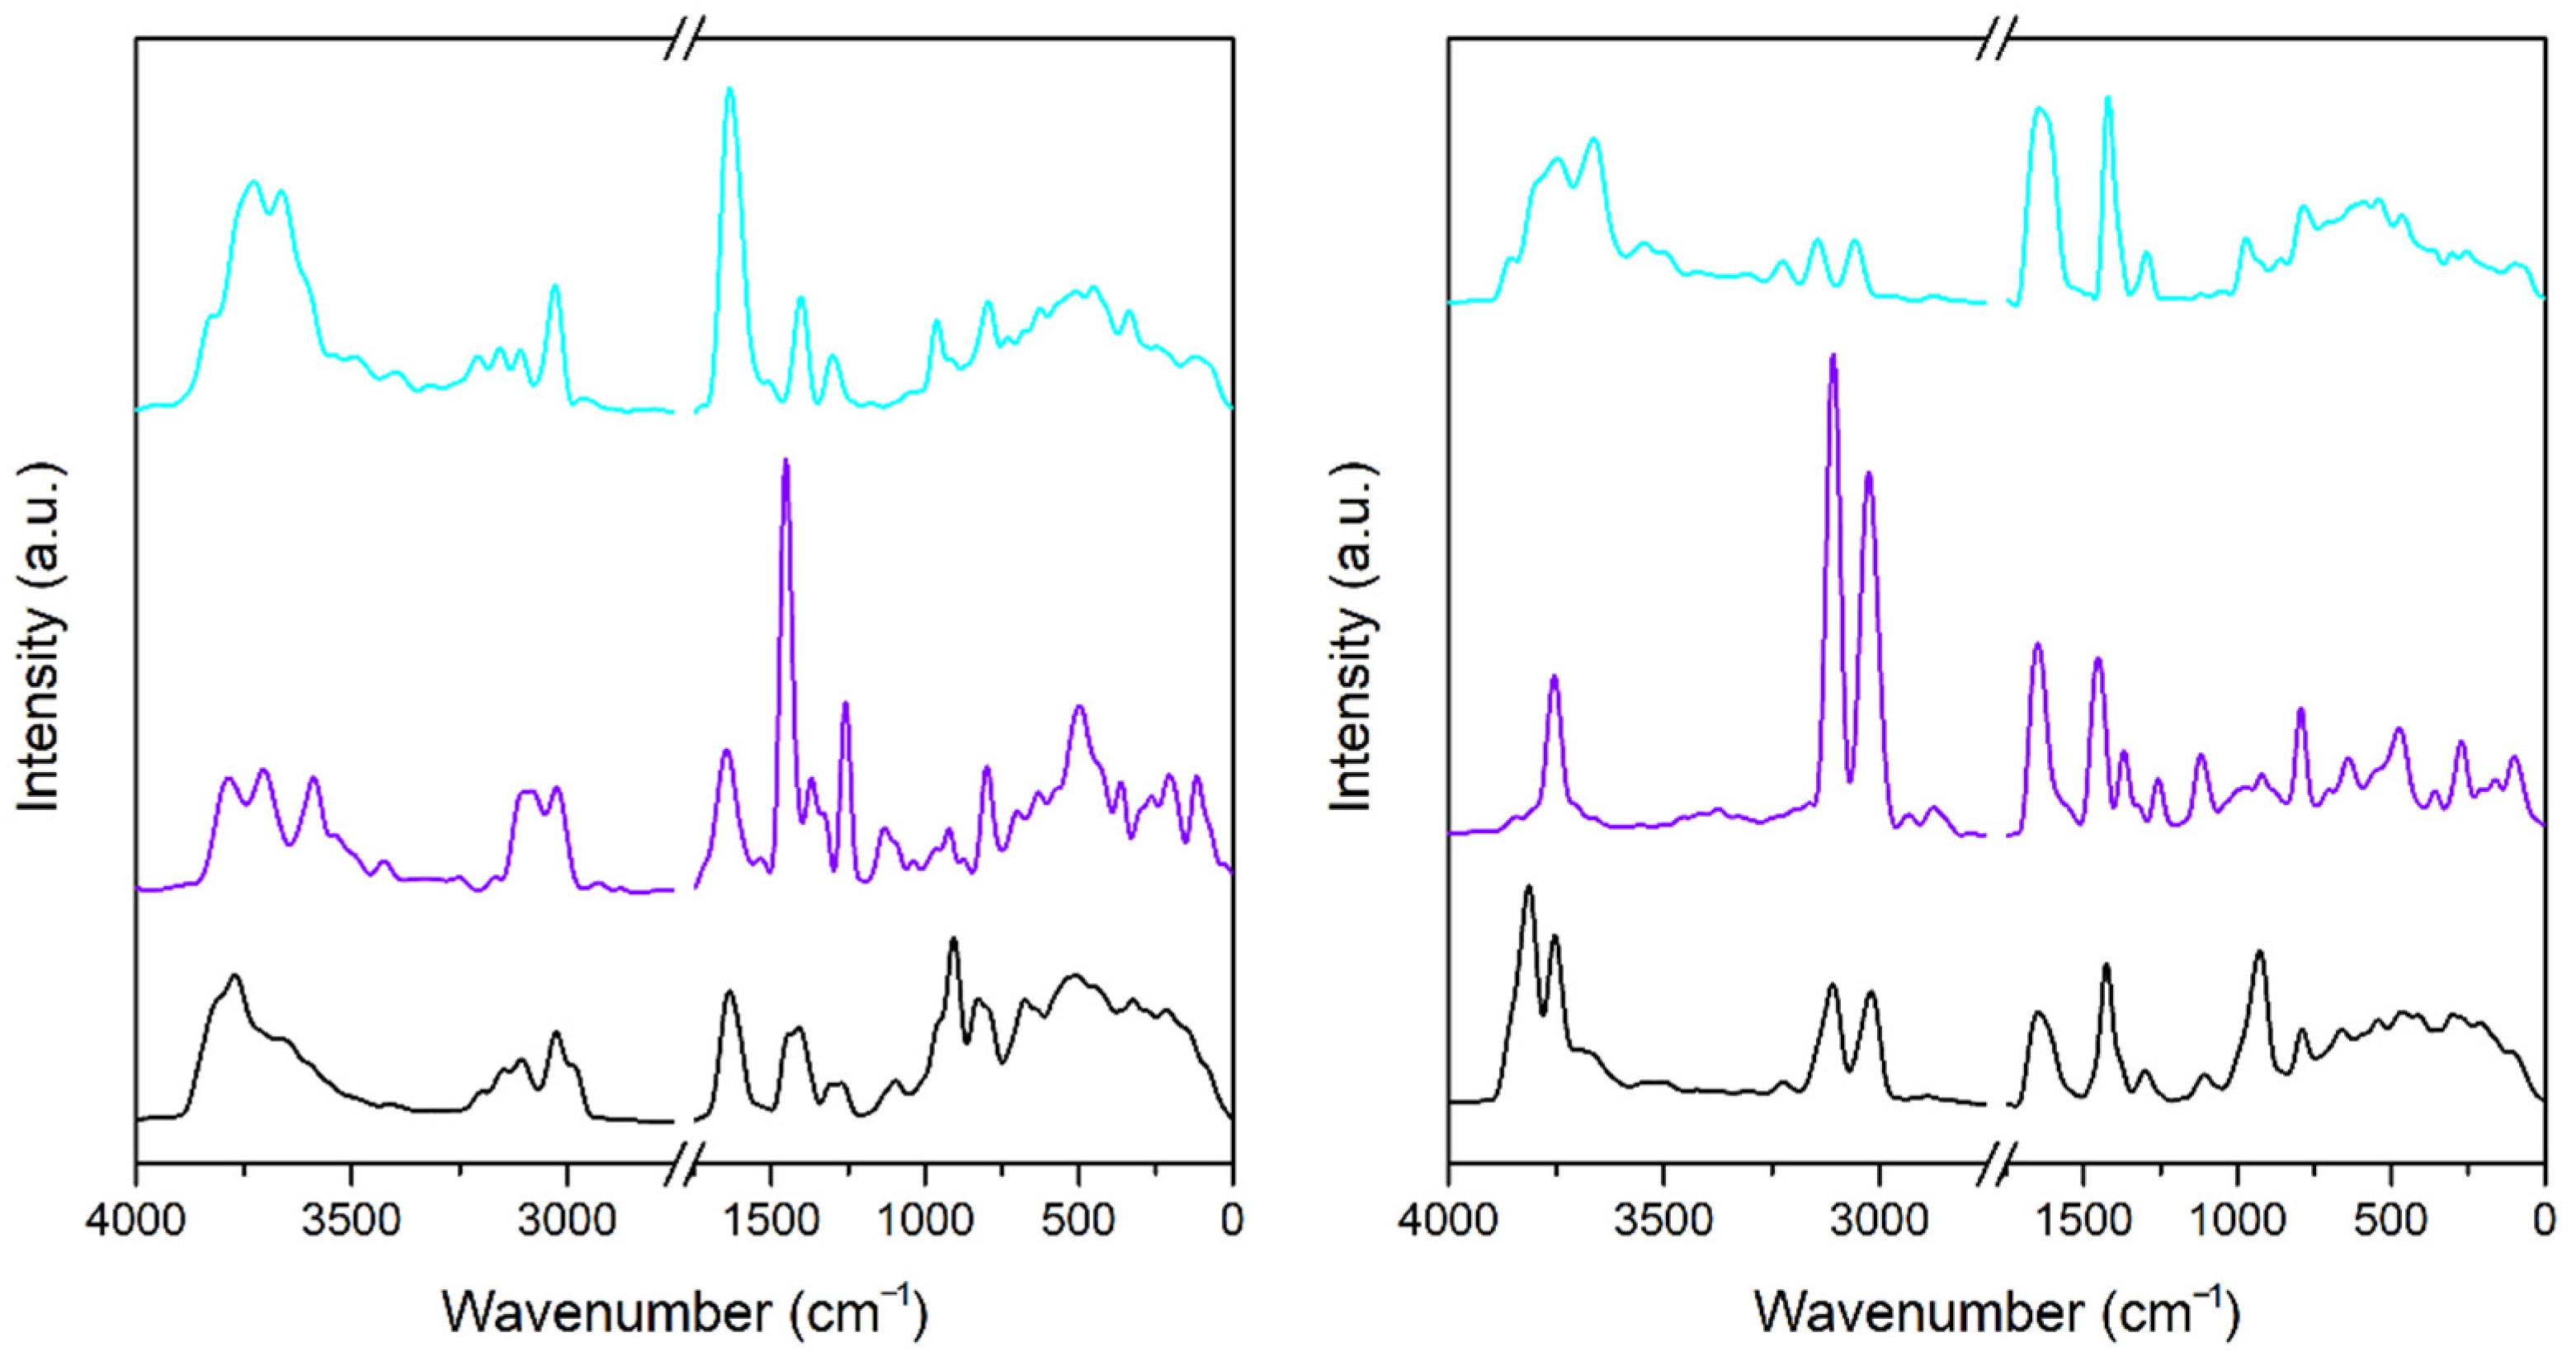
When the experimental spectra from Bd and Mt organoclays are compared, noticeable changes are observed in the area of the C–H stretching modes, and the Bd structures are favored with regard to the higher energy of C–H vibrations. The bands of C–H vibrations in the A-Bd structure have higher energy than those for the A-Mt structure (Figure 10). The same conclusion can be applied for the modified clays (Figure 11).
The most noticeable band splitting corresponding to the blue shift of the C–H stretching vibrations was observed for A-TMP-Bd (Figure 11) in comparison with the other structures (Figure 10 and Figure 11).
This finding is also supported by the projected VDOS of water molecules (Figure 10 and Figure 11). The presence of band splitting in the C–H region in the modified organoclays is caused by interactions of water molecules with the TMP cation. No bands are present in the VDOS spectra of water molecules of unmodified clays in this region. In addition, the bands of OH bending vibrations of water molecules are more structured in the spectra of modified clays than in those of the unmodified clays. The sharper bands with the highest energy are caused by stronger interactions in the Bd modified clay.
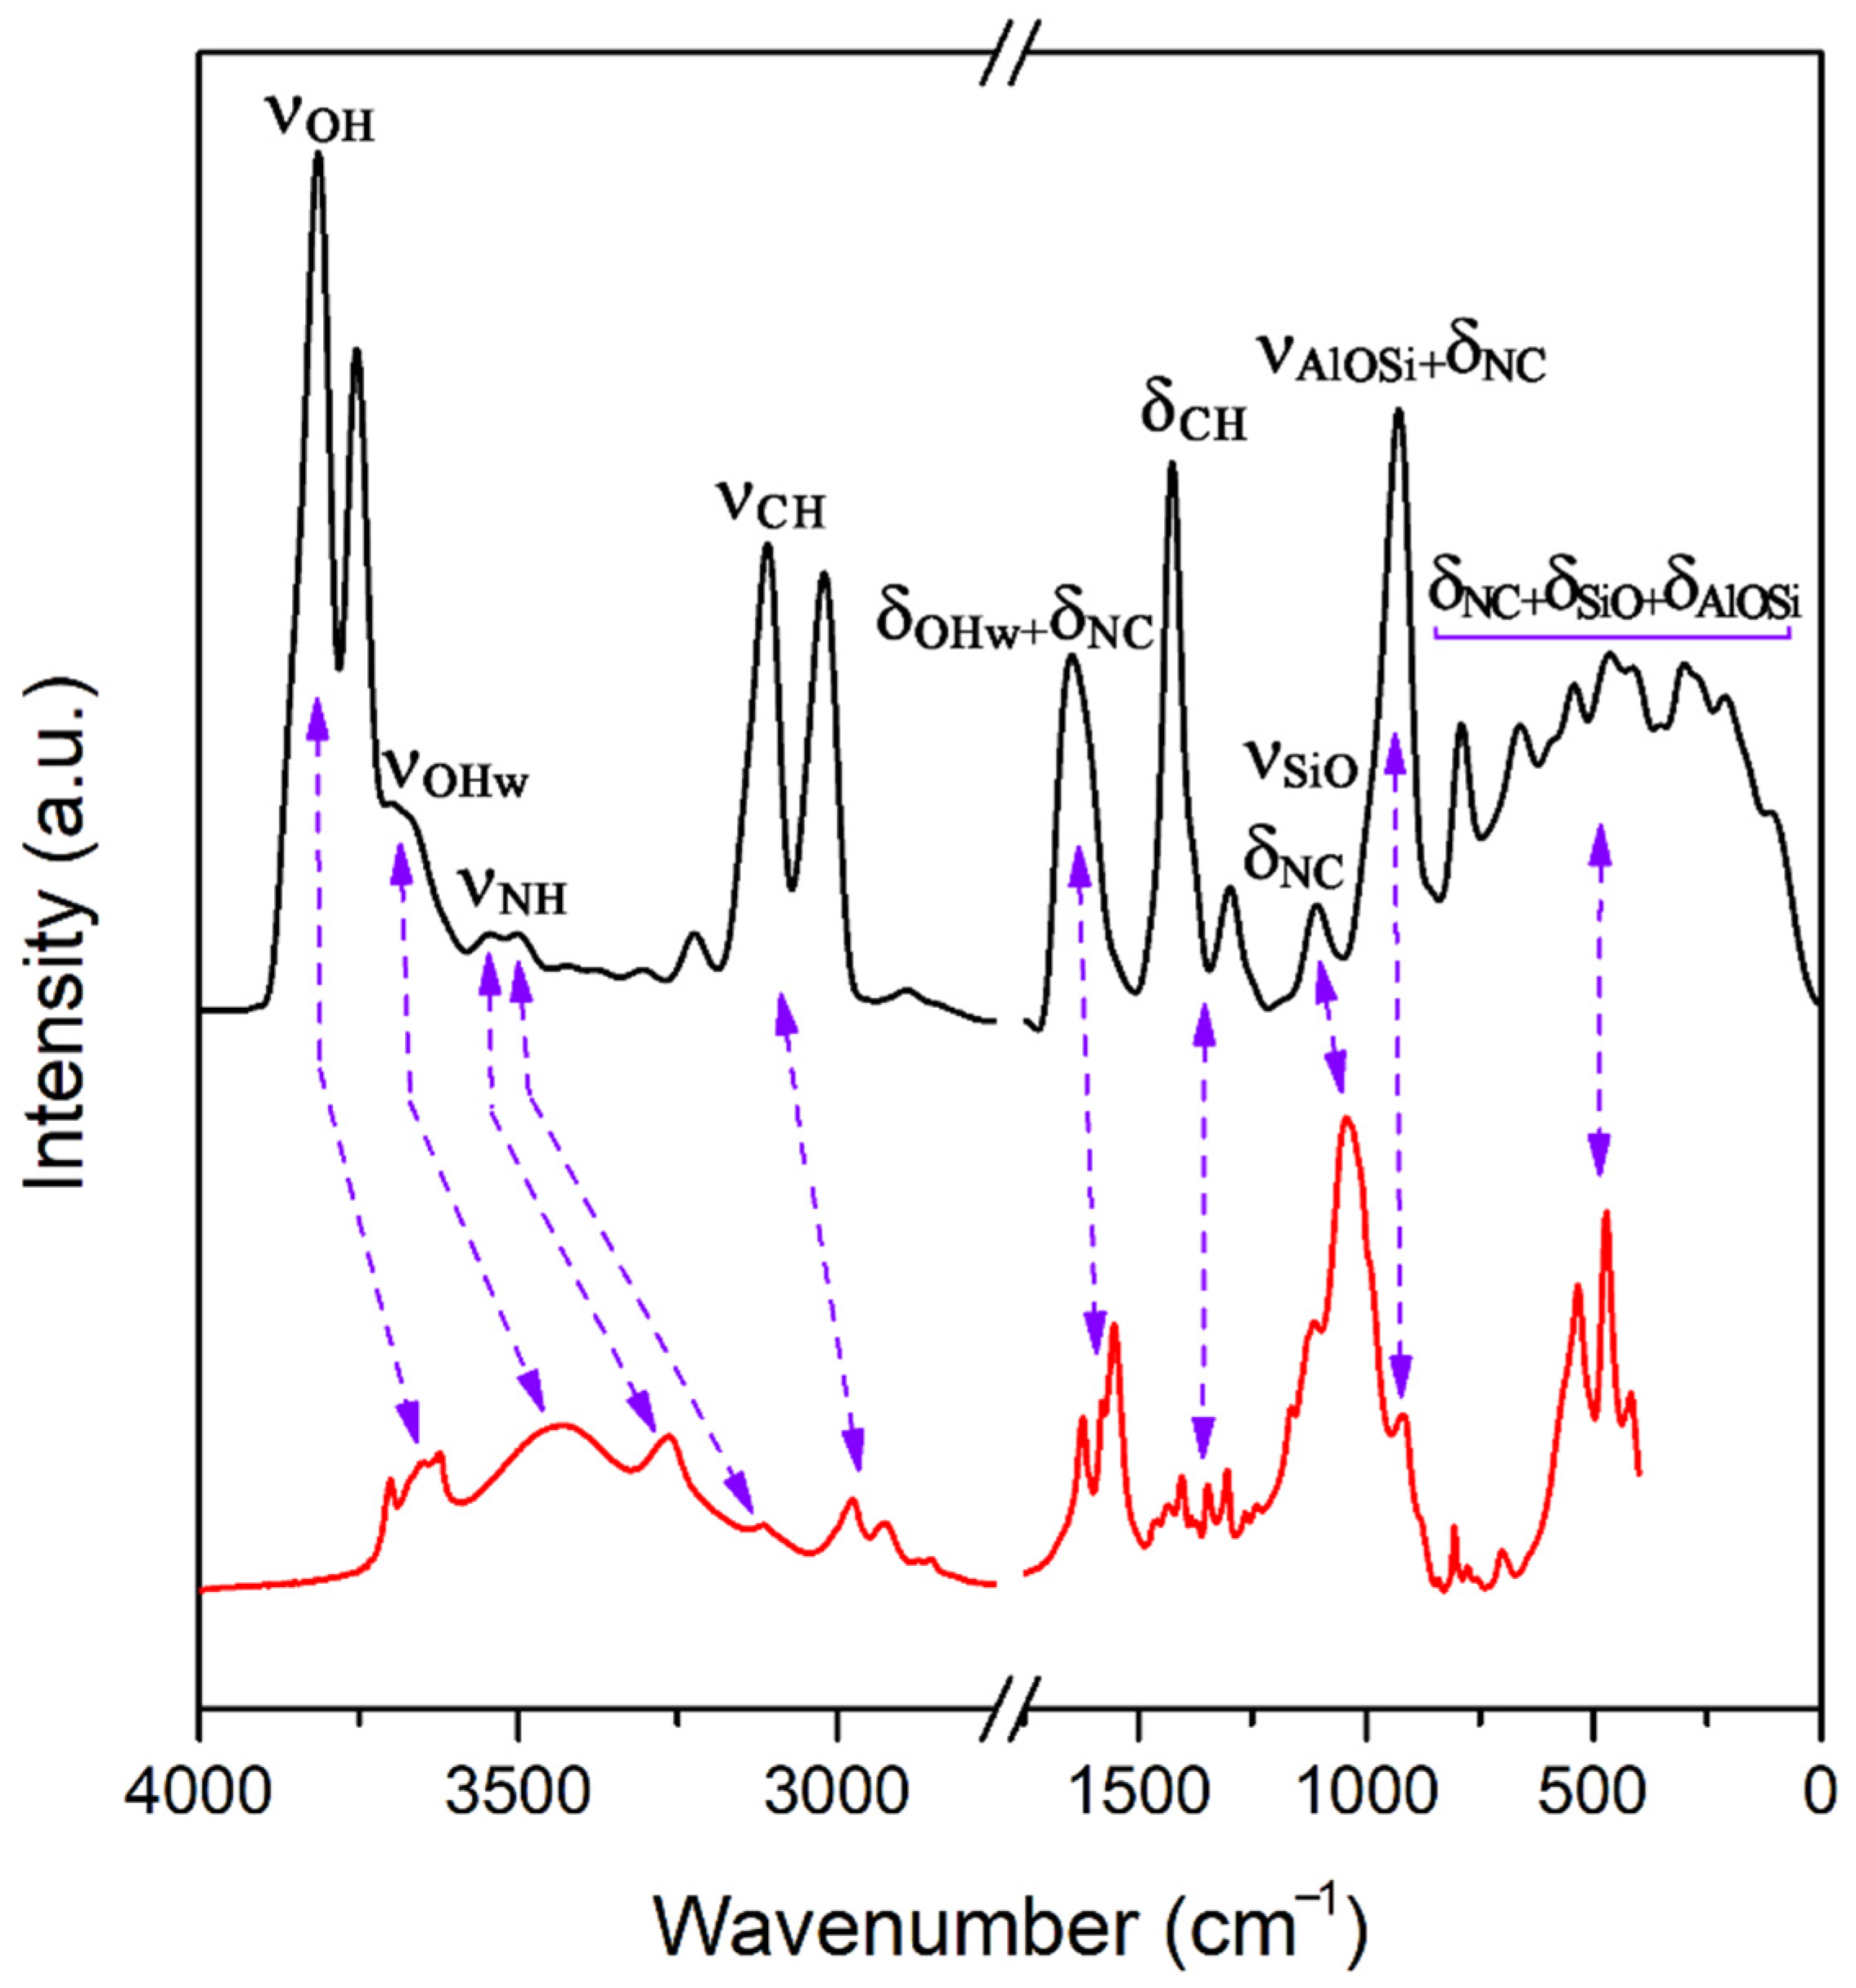
The modification of clays thus facilitates better adsorption of nonpolar pollutant molecules, such as atrazine. These findings can explain the shifts in the C–H region in the experimental spectra. The changes are not so evident at first glance, but some tiny changes of the C–H vibrations can be seen (Figure 12) for both clays after using the organic surfactant. The small shift to the highest energies was obtained for the A-TMP-Bd-modified clay, confirming the findings from the analysis of the theoretical results (Figure 13).

3.4. Estimation of Adsorption Amount of Atrazine through FTIR Spectra Analysis

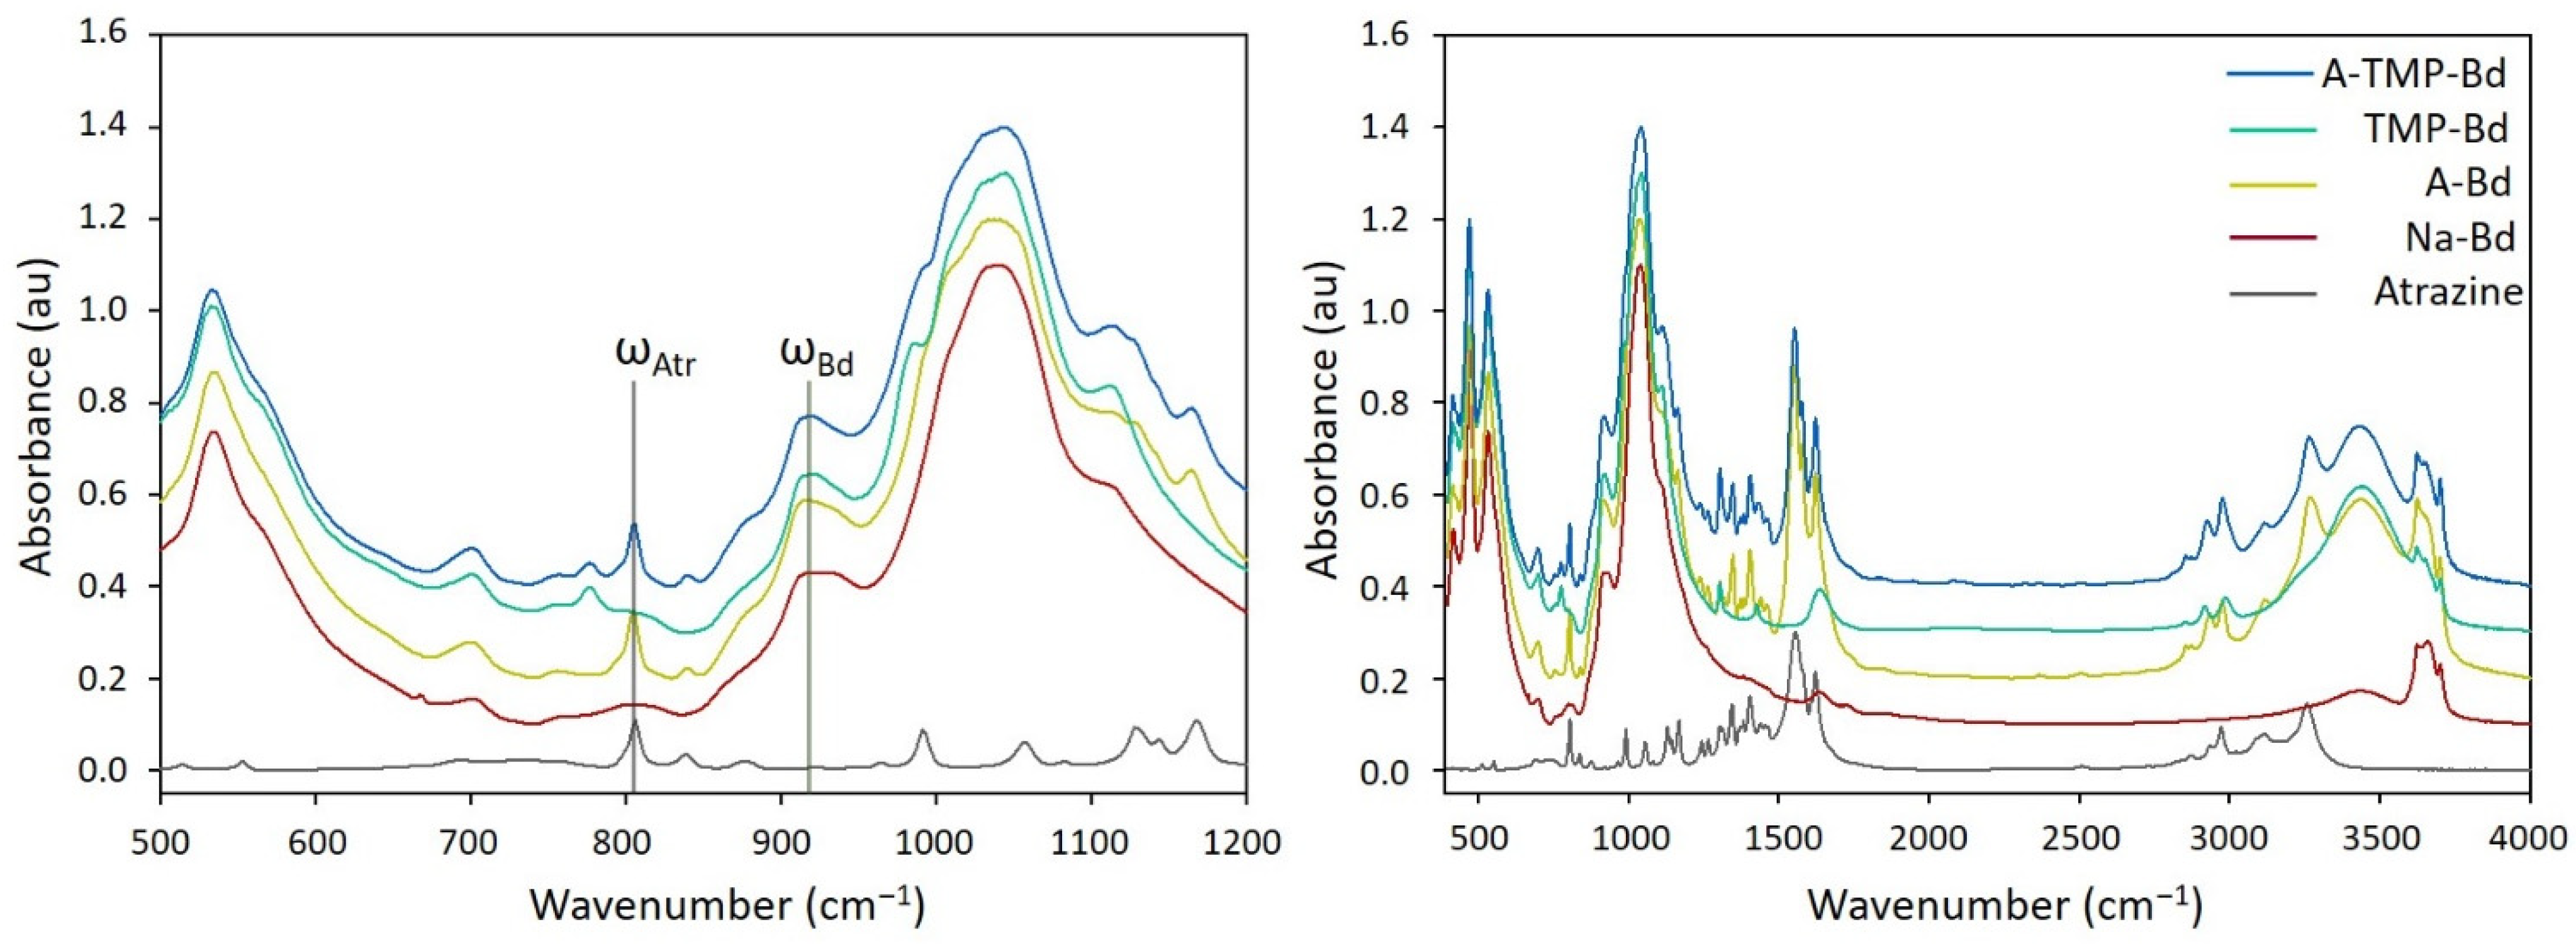
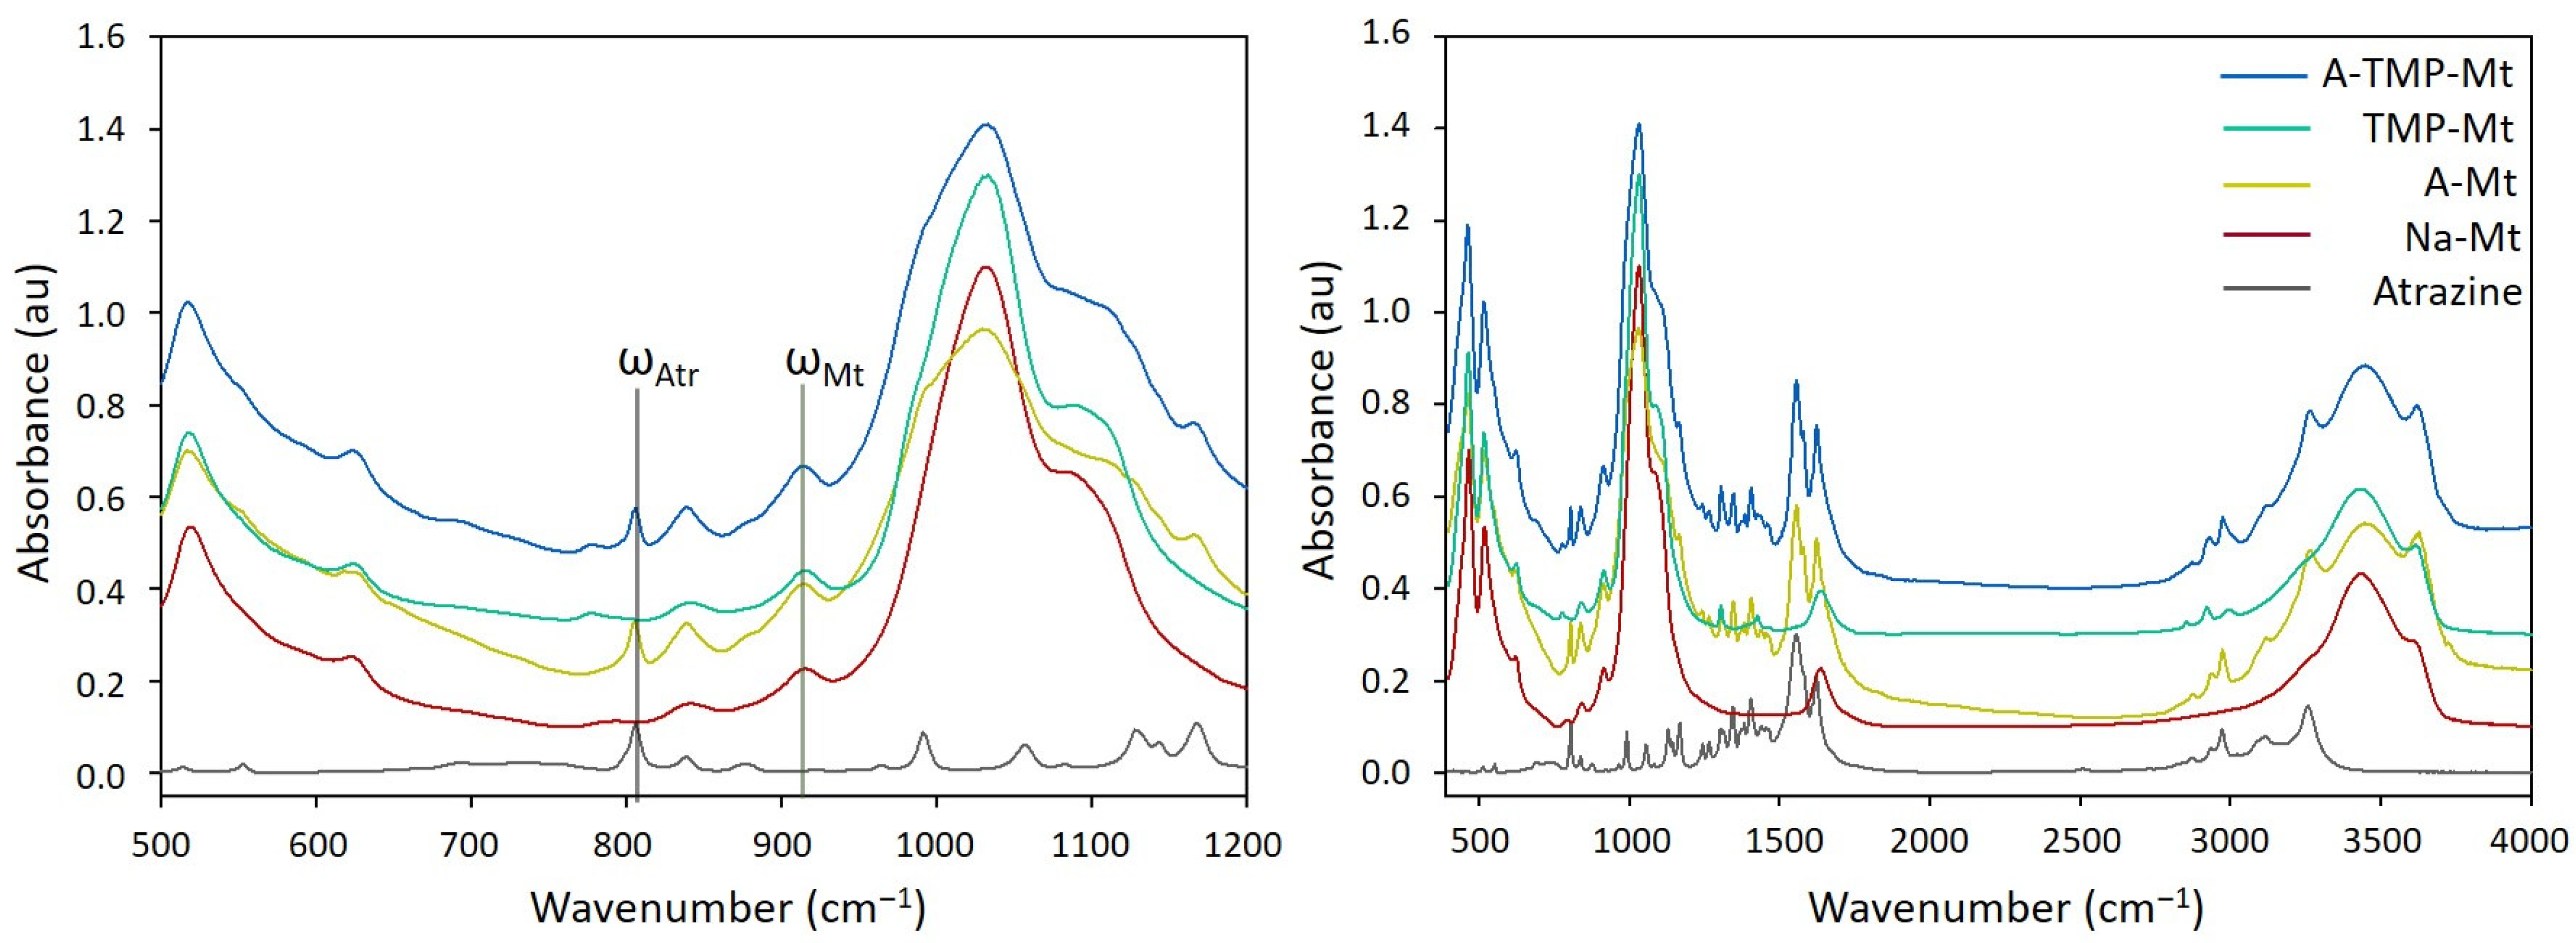
The changes in the adsorbed amount of atrazine in pure and modified clays were estimated from the relation between the intensities of bands that do not overlap with other bands, particularly the band at 806 cm−1 for atrazine and the bands at 925/914 cm−1 for beidellite/montmorillonite clays (Figure 14 and Figure 15). The calculated ωAtrBd/Mt rates of 0.39/0.37 for unmodified/modified beidellite and 0.71/0.65 for unmodified/modified montmorillonite indicate almost no change in the adsorbed amount of atrazine in the unmodified and modified clays, respectively. It means that the modification of both clays by TMP did not improve their sorption capacities with respect to a nonpolar organic moiety such as atrazine. This could be explained by fact that the TMP cation is too small to significantly improve the hydrophobicity of the organoclay and, therefore, the sorption capacity for nonpolar molecules. Such assumption, however, should be proved by further adsorption experiments with different concentrations of atrazine as well as using organoclays modified by organic surfactants with longer alkyl chains.

4. Conclusions

The stability and the way of anchoring of atrazine in beidellite and montmorillonite clays was studied and quantified at the molecular level for the first time. The DFT-D3 calculations applied to the models of the montmorillonite and beidellite structures intercalated with the atrazine molecule and the TMP cation showed good agreement with the calculated and experimental d001 values. The atrazine molecule had a flat arrangement in the interlayer space of both smectites.
Regarding the interactions, the TMP cation and atrazine formed weak hydrogen bonds among the C–H groups and the basal surface oxygen atoms of the Mt and Bd layers.
The analysis of the hydrogen bond distances, the d001 value and the intercalation energies showed that the presence of the TMP cations in the interlayer space improves the interactions and, consequently, the stability of atrazine in the interlayer space of both modified smectites. Furthermore, the beidellite organoclays A-Bd and A-TMP-Bd were found to be more stable than the equivalent montmorillonite organoclays, A-Mt and A-TMP-Mt.
The calculated vibrational spectra of the models were interpreted in terms of the individual vibrational modes, which showed good concordance with the experimental FTIR spectra. The employment of the projected VDOS allowed a detailed interpretation of the vibrational modes of the respective functional groups, e.g., N–H groups and the triazine ring, and to distinguish the C–H group vibrational modes of the TMP cation and the atrazine molecule.
The analysis of the calculated data showed a stronger fixation of atrazine into the two organically (TMP) modified clay minerals, which was notably higher into beidellite than into montmorillonite. However, the comparison of the intensities of the selected typical bands in the measured FTIR spectra showed that the adsorption capacity of the modified Bd/Mt clays practically did not change with respect to unmodified original clays.

Author Contributions

Conceptualization, E.S. and D.T.; methodology, Ľ.J.; software, D.M-R.; validation, Ľ.J., E.S. and D.T.; formal analysis, D.M.-R.; investigation, D.M.-R.; resources, Ľ.J.; data curation, D.M-R.; writing—original draft preparation, D.M.-R.; writing—review and editing, E.S. and D.T.; visualization, D.M.-R.; supervision, E.S. and D.T.; project administration, D.M.-R.; and funding acquisition, E.S. All authors have read and agreed to the published version of the manuscript.

Funding

This research was funded by the Scientific Grant Agency (project No. VEGA 02/0021/19) and Slovak Research and Development Agency (projects No. APVV-18-0075, APVV-19-0487).

Acknowledgments

D.M-R., E.S. and L.J. are grateful for the financial support by the Scientific Grant Agency (project No. VEGA 02/0021/19) and Slovak Research and Development Agency (project Nos. APVV-18-0075 and APVV-19-0487). DT acknowledges the support by the Austrian Grant Agency (FWF) (project No. I3263-N34). Some of the calculations were performed in the Computing Centre of the Slovak Academy of Sciences using the supercomputing infrastructure acquired in projects ITMS 26230120002 and 26210120002 (Slovak infrastructure for high-performance computing) supported by the Research & Development Operational Programme funded by the ERDF.

Conflicts of Interest

The authors declare no conflict of interest.

References

  1. Jablonowski, N.D.; Schaffer, A.; Burauel, P. Still present after all these years: Persistence plus potential toxicity raise questions about the use of atrazine. Environ. Sci. Pollut. Res. 2011, 18, 328–331. [Google Scholar] [CrossRef] [Green Version]
  2. Langlois, V.S.; Carew, A.C.; Pauli, B.D.; Wade, M.G.; Cooke, G.M.; Trudeau, V.L. Low Levels of the Herbicide Atrazine Alter Sex Ratios and Reduce Metamorphic Success in Rana pipiens Tadpoles Raised in Outdoor Mesocosms. Environ. Health Perspect. 2010, 118, 552–557. [Google Scholar] [CrossRef] [Green Version]
  3. Olivier, H.M.; Moon, B.R. The effects of atrazine on spotted salamander embryos and their symbiotic alga. Ecotoxicology 2010, 19, 654–661. [Google Scholar] [CrossRef]
  4. Rohr, J.R.; McCoy, K.A. A Qualitative Meta-Analysis Reveals Consistent Effects of Atrazine on Freshwater Fish and Amphibians. Environ. Health Perspect. 2010, 118, 20–32. [Google Scholar] [CrossRef] [Green Version]
  5. Enoch, R.R.; Stanko, J.P.; Greiner, S.N.; Youngblood, G.L.; Rayner, J.L.; Fenton, S.E. Mammary gland development as a sensitive end point after acute prenatal exposure to an atrazine metabolite mixture in female long-evans rats. Environ. Health Perspect. 2007, 115, 541–547. [Google Scholar] [CrossRef] [Green Version]
  6. Hayes, T.B.; Anderson, L.L.; Beasley, V.R.; de Solla, S.R.; Iguchi, T.; Ingraham, H.; Kestemont, P.; Kniewald, J.; Kniewald, Z.; Langlois, V.S.; et al. Demasculinization and feminization of male gonads by atrazine: Consistent effects across vertebrate classes. J. Steroid Biochem. Mol. Biol. 2011, 127, 64–73. [Google Scholar] [CrossRef] [PubMed] [Green Version]
  7. Munger, R.; Isacson, P.; Hu, S.; Burns, T.; Hanson, J.; Lynch, C.F.; Cherryholmes, K.; VanDorpfe, P.; Hausler, W.J. Intrauterine growth retardation in Iowa communities with herbicide-contaminated drinking water supplies. Environ. Health Perspect. 1997, 105, 308–314. [Google Scholar] [CrossRef]
  8. MacLennan, P.A.; Delzell, E.; Sathiakumar, N.; Myers, S.L.; Cheng, H.; Grizzle, W.; Chen, V.W.; Wu, X.C. Cancer incidence among triazine herbicide manufacturing workers. J. Occup. Environ. Med. 2002, 44, 1048–1058. [Google Scholar] [CrossRef]
  9. De Roos, A.J.; Zahm, S.H.; Cantor, K.P.; Weisenburger, D.D.; Holmes, F.F.; Burmeister, L.F.; Blair, A. Integrative assessment of multiple pesticides as risk factors for non-Hodgkin’s lymphoma among men. Occup. Environ. Med. 2003, 60, 11. [Google Scholar] [CrossRef] [Green Version]
  10. Rusiecki, J.A.; De Roos, A.; Lee, W.J.; Dosemeci, M.; Lubin, J.H.; Hoppin, J.A.; Blair, A.; Alavanja, M.C.R. Cancer incidence among pesticide applicators exposed to atrazine in the agricultural health study. J. Natl. Cancer Inst. 2004, 96, 1375–1382. [Google Scholar] [CrossRef]
  11. Villanueva, C.M.; Durand, G.; Coutte, M.B.; Chevrier, C.; Cordier, S. Atrazine in municipal drinking water and risk of low birth weight, preterm delivery, and small-for-gestational-age status. Occup. Environ. Med. 2005, 62, 400–405. [Google Scholar] [CrossRef] [Green Version]
  12. Gojmerac, T.; Kartal, B.; Ćurić, S.; Žurić, M.; Kušević, S.; Cvetnić, Ž. Serum biochemical changes associated with cystic ovarian degeneration in pigs after atrazine treatment. Toxicol. Lett. 1996, 85, 9–15. [Google Scholar] [CrossRef]
  13. Pruett, S.B.; Fan, R.P.; Zheng, Q.; Myers, L.P.; Hebert, P. Modeling and predicting immunological effects of chemical stressors: Characterization of a quantitative biomarker for immunological changes caused by atrazine and ethanol. Toxicol. Sci. 2003, 75, 343–354. [Google Scholar] [CrossRef] [Green Version]
  14. McMullin, T.S.; Andersen, M.E.; Nagahara, A.; Lund, T.D.; Pak, T.; Handa, R.J.; Hanneman, W.H. Evidence that atrazine and diaminochlorotriazine inhibit the estrogen/progesterone induced surge of luteinizing hormone in female Sprague-Dawley rats without changing estrogen receptor action. Toxicol. Sci. 2004, 79, 278–286. [Google Scholar] [CrossRef] [Green Version]
  15. Modic, W.M. The Role of Testicular Aromatase in the Atrazine Mediated Changes of Estrone and Estradiol in the Male Wistar Rat. Master’s Thesis, North Carolina State University, Raleigh, NC, USA, 2004. [Google Scholar]
  16. Giusi, G.; Facciolo, R.M.; Canonaco, M.; Alleva, E.; Belloni, V.; Dessi’-Fulgheri, F.; Santucci, D. The Endocrine Disruptor Atrazine Accounts for a Dimorphic Somatostatinergic Neuronal Expression Pattern in Mice. Toxicol. Sci. 2006, 89, 257–264. [Google Scholar] [CrossRef] [Green Version]
  17. Cooper, R.L.; Laws, S.C.; Das, P.C.; Narotsky, M.G.; Goldman, J.M.; Tyrey, E.L.; Stoker, T.E. Atrazine and reproductive function: Mode and mechanism of action studies. Birth Defects Res. Part B-Dev. Reprod. Toxicol. 2007, 80, 98–112. [Google Scholar] [CrossRef]
  18. Suzawa, M.; Ingraham, H.A. The Herbicide Atrazine Activates Endocrine Gene Networks via Non-Steroidal NR5A Nuclear Receptors in Fish and Mammalian Cells. PLoS ONE 2008, 3, e2117. [Google Scholar] [CrossRef]
  19. Laws, S.C.; Hotchkiss, M.; Ferrell, J.; Jayaraman, S.; Mills, L.; Modic, W.; Tinfo, N.; Fraites, M.; Stoker, T.; Cooper, R. Chlorotriazine Herbicides and Metabolites Activate an ACTH-dependent Release of Corticosterone in Male Wistar Rats. Toxicol. Sci. 2009, 112, 78–87. [Google Scholar] [CrossRef] [Green Version]
  20. Gore, A.C.; Chappell, V.A.; Fenton, S.E.; Flaws, J.A.; Nadal, A.; Prins, G.S.; Toppari, J.; Zoeller, R.T. EDC-2: The Endocrine Society’s Second Scientific Statement on Endocrine-Disrupting Chemicals. Endocr. Rev. 2015, 36, E1–E150. [Google Scholar] [CrossRef]
  21. Fan, W.Q.; Yanase, T.; Morinaga, H.; Ondo, S.; Okabe, T.; Nomura, M.; Komatsu, T.; Morohashi, K.I.; Hayes, T.B.; Takayanagi, R.; et al. Atrazine-induced aromatase expression is SF-1 dependent: Implications for endocrine disruption in wildlife and reproductive cancers in humans. Environ. Health Perspect. 2007, 115, 720–727. [Google Scholar] [CrossRef]
  22. E.U Commission Decision of 10 March 2004. 2004. Available online: https://eur-lex.europa.eu/eli/dec/2004/248/oj (accessed on 3 August 2018).
  23. USEPA Decision Documents for Atrazine. 2006. Available online: https://archive.epa.gov/region5/teach/web/pdf/atrazine_summary.pdf (accessed on 3 August 2018).
  24. Belzunces, B.; Hoyau, S.; Benoit, M.; Tarrat, N.; Bessac, F. Theoretical Study of the Atrazine Pesticide Interaction with Pyrophyllite and Ca2+—Montmorillonite Clay Surfaces. J. Comput. Chem. 2017, 38, 133–143. [Google Scholar] [CrossRef] [PubMed]
  25. Davies, J.E.D.; Jabeen, N. The Adsorption of Herbicides and Pesticides on Clay Minerals and Soils. Part 2. Atrazine. J. Incl. Phenom. 2003, 46, 57–64. [Google Scholar] [CrossRef]
  26. Grundgeiger, E.; Lim, Y.H.; Frost, R.L.; Ayoko, G.A.; Xi, Y. Application of organo-beidellites for the adsorption of atrazine. Appl. Clay Sci. 2015, 105–106, 252–258. [Google Scholar] [CrossRef] [Green Version]
  27. Zarpon, L.; Abate, G.; dos Santos, L.B.; Masini, J.C. Montmorillonite as an adsorbent for extraction and concentration of atrazine, propazine, deethylatrazine, deisopropylatrazine and hydroxyatrazine. Anal. Chim. Acta 2006, 579, 81–87. [Google Scholar] [CrossRef] [PubMed]
  28. Belzunces, B.; Hoyau, S.; Bessac, F. Interaction of Metamitron and Fenhexamid with Ca2+-Montmorillonite Clay Surfaces: A Density Functional Theory Molecular Dynamics Study. J. Comput. Chem. 2019, 40, 1449–1462. [Google Scholar] [CrossRef] [PubMed]
  29. Polati, S.; Angioi, S.; Gianotti, V.; Gosetti, F.; Gennaro, M.C. Sorption of pesticides on kaolinite and montmorillonite as a function of hydrophilicity. J. Environ. Sci. Heal. Part B Pestic. Food Contam. Agric. Wastes 2006, 41, 333–344. [Google Scholar] [CrossRef]
  30. Aggarwal, V.; Li, H.; Teppen, B.J. Triazine adsorption by saponite and beidellite clay minerals. Environ. Toxicol. Chem. 2006, 25, 392–399. [Google Scholar] [CrossRef]
  31. Manzotti, F.; dos Santos, O.A.A. Evaluation of removal and adsorption of different herbicides on commercial organophilic clay. Chem. Eng. Commun. 2019, 206, 1526–1543. [Google Scholar] [CrossRef]
  32. Paiva, L.B.; Morales, A.R. Organophilic bentonites based on argentinean and brazilian bentonites. Part 1: Influence of intrinsic properties of sodium bentonites on the final properties of organophilic bentonites prepared by solid-liquid and semisolid reactions. Braz. J. Chem. Eng. 2012, 29, 525–536. [Google Scholar] [CrossRef] [Green Version]
  33. Szczerba, M.; Kalinichev, A.G.; Kowalik, M. Intrinsic hydrophobicity of smectite basal surfaces quantitatively probed by molecular dynamics simulations. Appl. Clay Sci. 2020, 188, 105497. [Google Scholar] [CrossRef]
  34. Andrunik, M.; Bajda, T. Modification of bentonite with cationic and nonionic surfactants: Structural and textural features. Materials 2019, 12, 3772. [Google Scholar] [CrossRef] [PubMed] [Green Version]
  35. Kukkadapu, R.K.; Boyd, S.A. Tetramethylphosphonium-smectite and tetramethylammonium-smectite as adsorbents of aromatic and chlorinated hydrocarbons—Effect of water on adsorption efficiency. Clays Clay Miner. 1995, 43, 318–323. [Google Scholar] [CrossRef]
  36. Scholtzová, E.; Madejová, J.; Tunega, D. Structural properties of montmorillonite intercalated with tetraalkylammonium cations—Computational and experimental study. Vib. Spectrosc. 2014, 74, 120–126. [Google Scholar] [CrossRef]
  37. Guégan, R. Organoclay applications and limits in the environment. Comptes Rendus Chim. 2019, 22, 132–141. [Google Scholar] [CrossRef]
  38. de Paiva, L.B.; Morales, A.R.; Diaz, F.R. V Organoclays: Properties, preparation and applications. Appl. Clay Sci. 2008, 42, 8–24. [Google Scholar] [CrossRef]
  39. Chun, Y.; Sheng, G.Y.; Boyd, S.A. Sorptive characteristics of tetraalkylammonium-exchanged smectite clays. Clays Clay Miner. 2003, 51, 415–420. [Google Scholar] [CrossRef]
  40. Lagaly, G.; Ogawa, M.; Dékány, I. Clay Mineral-Organic interactions. In Developments in Clay Science; Bergaya, B.K.G., Theng, G., Lagaly, H., Eds.; Elsevier: Amsterdam, The Netherlands, 2013; pp. 435–506. [Google Scholar]
  41. Vaia, R.A.; Teukolsky, R.K.; Giannelis, E.P. Interlayer structure and molecular environment of alkylammonium layered silicates. Chem. Mater. 1994, 6, 1017–1022. [Google Scholar] [CrossRef]
  42. Mishra, A.K.; Allauddin, S.; Narayan, R.; Aminabhavi, T.M.; Raju, K. Characterization of surface-modified montmorillonite nanocomposites. Ceram. Int. 2012, 38, 929–934. [Google Scholar] [CrossRef]
  43. Mittal, V. Modification of montmorillonites with thermally stable phosphonium cations and comparison with alkylammonium montmorillonites. Appl. Clay Sci. 2012, 56, 103–109. [Google Scholar] [CrossRef]
  44. Carvalho, P.J.; Ventura, S.P.M.; Batista, M.L.S.; Schroder, B.; Goncalves, F.; Esperanca, J.; Mutelet, F.; Coutinho, J.A.P. Understanding the impact of the central atom on the ionic liquid behavior: Phosphonium vs ammonium cations. J. Chem. Phys. 2014, 140, 064505. [Google Scholar] [CrossRef]
  45. Alves, J.L.; Rosa, P.; Morales, A.R. A comparative study of different routes for the modification of montmorillonite with ammonium and phosphonium salts. Appl. Clay Sci. 2016, 132, 475–484. [Google Scholar] [CrossRef]
  46. Palkova, H.; Zimowska, M.; Jankovic, L.; Sulikowski, B.; Serwicka, E.M.; Madejova, J. Thermal stability of tetrabutyl-phosphonium and -ammonium exchanged montmorillonite: Influence of acid treatment. Appl. Clay Sci. 2017, 138, 63–73. [Google Scholar] [CrossRef]
  47. Scholtzova, E.; Jankovic, L.; Tunega, D. Stability of Tetrabutylphosphonium Beidellite Organoclay. J. Phys. Chem. C 2018, 122, 8380–8389. [Google Scholar] [CrossRef]
  48. Scholtzova, E.; Tunega, D. Density functional theory study of the stability of the tetrabutylphosphonium and tetrabutylammonium montmorillonites. Clay Miner. 2019, 54, 41–48. [Google Scholar] [CrossRef]
  49. Krajňák, A.; Viglašová, E.; Galamboš, M.; Krivosudský, L. Application of HDTMA-intercalated bentonites in water waste treatment for U(VI) removal. J. Radioanal. Nucl. Chem. 2017, 314, 2489–2499. [Google Scholar] [CrossRef]
  50. Mellouk, S.; Cherifi, S.; Sassi, M.; Marouf-Khelifa, K.; Bengueddach, A.; Schott, J.; Khelifa, A. Intercalation of halloysite from Djebel Debagh (Algeria) and adsorption of copper ions. Appl. Clay Sci. 2009, 44, 230–236. [Google Scholar] [CrossRef]
  51. Wang, P.; Tang, Y.; Liu, Y.; Wang, T.; Wu, P.; Lu, X.Y. Halloysite nanotube@carbon with rich carboxyl groups as a multifunctional adsorbent for the efficient removal of cationic Pb(ii), anionic Cr(vi) and methylene blue (MB). Environ. Sci. Nano 2018, 5, 2257–2268. [Google Scholar] [CrossRef]
  52. Guégan, R.; Giovanela, M.; Warmont, F.; Motelica-Heino, M. Nonionic organoclay: A “Swiss Army knife” for the adsorption of organic micro-pollutants? J. Colloid Interface Sci. 2015, 437, 71–79. [Google Scholar] [CrossRef] [PubMed] [Green Version]
  53. Hermosin, M.C.; Cornejo, J. Removing 2,4-D from water by organo-clays. Chemosphere 1992, 24, 1493–1503. [Google Scholar] [CrossRef]
  54. Carrizosa, M.J.; Koskinen, W.C.; Hermosin, M.C.; Cornejo, J. Dicamba adsorption—Desorption on organoclays. Appl. Clay Sci. 2001, 18, 223–231. [Google Scholar] [CrossRef]
  55. Pal, O.R.; Vanjara, A.K. Removal of malathion and butachlor from aqueous solution by clays and organoclays. Sep. Purif. Technol. 2001, 24, 167–172. [Google Scholar] [CrossRef]
  56. Sanchez-Martin, M.J.; Rodriguez-Cruz, M.S.; Andrades, M.S.; Sanchez-Camazano, M. Efficiency of different clay minerals modified with a cationic surfactant in the adsorption of pesticides: Influence of clay type and pesticide hydrophobicity. Appl. Clay Sci. 2006, 31, 216–228. [Google Scholar] [CrossRef]
  57. Kubicki, J.D. Molecular Modeling of Geochemical Reactions; John Wiley & Sons, Ltd.: Chichester, UK, 2016; ISBN 9781118845226. [Google Scholar]
  58. Churakov, S.V.; Liu, X.D. Quantum-chemical modelling of clay mineral surfaces and clay mineral-surface-adsorbate interactions. In Surface and Interface Chemistry of Clay Minerals 9; Schoonheydt, R., Johnston, C.T., Bergaya, F., Eds.; Elsevier: Amsterdam, The Netherlands, 2018; Volume 9, pp. 49–87. ISBN 1572-4352978-0-08-102433-1. [Google Scholar]
  59. Scholtzová, E. Computational Modeling of Nanoclays in: Micro & Nano Technologies Series, Clay Nanoparticles. In Properties and Applications; Cavallaro, G., Fakhrullin, R., Pasbakhsh, P., Eds.; Elsevier: Amsterdam, The Netherlands, 2020; ISBN 978-0-12-816783-0. [Google Scholar]
  60. Matusik, J.; Scholtzová, E.; Tunega, D. Influence of synthesis conditions on the formation of a Kaolinitemethanol complex and simulation of its vibrational spectra. Clays Clay Miner. 2012, 60, 227–239. [Google Scholar] [CrossRef]
  61. Scholtzová, E.; Madejová, J.; Jankovič, L.; Tunega, D. Structural and spectroscopic characterization of montmorillonite intercalated with N-butylammonium cations (N = 1–4)—Modeling and experimental study. Clays Clay Miner. 2016, 64, 401–412. [Google Scholar] [CrossRef]
  62. Chen, J.; Min, F.; Liu, L.; Liu, C.; Lu, F. Experimental investigation and DFT calculation of different amine/ammonium salts adsorption on kaolinite. Appl. Surf. Sci. 2017, 419, 241–251. [Google Scholar] [CrossRef]
  63. Madejova, J.; Andrejkovicova, S.; Bujdak, J.; Ceklovsky, A.; Hrachova, J.; Valuchova, J.; Komadel, P. Characterization of products obtained by acid leaching of Fe-bentonite. CLAY Miner. 2007, 42, 527–540. [Google Scholar] [CrossRef]
  64. Kresse, G.; Hafner, J. Ab-initio molecular-dynamics for open-shell transition-metals. Phys. Rev. B 1993, 48, 13115–13118. [Google Scholar] [CrossRef] [PubMed]
  65. Kresse, G.; Furthmuller, J. Efficiency of ab-initio total energy calculations for metals and semiconductors using a plane-wave basis set. Comput. Mater. Sci. 1996, 6, 15–50. [Google Scholar] [CrossRef]
  66. Blochl, P.E. Projector Augmented-wave method. Phys. Rev. B 1994, 50, 17953–17979. [Google Scholar] [CrossRef] [Green Version]
  67. Kresse, G.; Joubert, D. From ultrasoft pseudopotentials to the projector augmented-wave method. Phys. Rev. B 1999, 59, 1758–1775. [Google Scholar] [CrossRef]
  68. Perdew, J.P.; Burke, K.; Wang, Y. Generalized gradient approximation for the exchange-correlation hole of a many-electron system. Phys. Rev. B 1996, 54, 16533–16539. [Google Scholar] [CrossRef] [Green Version]
  69. Grimme, S.; Antony, J.; Ehrlich, S.; Krieg, H. A consistent and accurate ab initio parametrization of density functional dispersion correction (DFT-D) for the 94 elements H-Pu. J. Chem. Phys. 2010, 132. [Google Scholar] [CrossRef] [Green Version]
  70. Monkhorst, H.J.; Pack, J.D. Special points for Brillouin-zone integrations. Phys. Rev. B 1976, 13, 5188–5192. [Google Scholar] [CrossRef]
  71. Kratzer, P.; Neugebauer, J. The Basics of Electronic Structure Theory for Periodic Systems. Front. Chem. 2019, 7, 106. [Google Scholar] [CrossRef] [Green Version]
  72. Ferrario, M.; Ryckaert, J.P. Constant pressure-constant temperature molecular-dynamics for rigid and partially rigid molecular-systems. Mol. Phys. 1985, 54, 587–603. [Google Scholar] [CrossRef]
  73. Nose, S. A unified formulation of the constant temperature molecular-dynamics methods. J. Chem. Phys. 1984, 81, 511–519. [Google Scholar] [CrossRef] [Green Version]
  74. Tombacz, E.; Nyilas, T.; Libor, Z.; Csanaki, C. Surface charge heterogeneity and aggregation of clay lamellae in aqueous suspensions. In Proceedings of the from Colloids to Nanotechnology; Zrinyi, M., Horvolgyi, Z., Eds.; Springer: Berlin/Heidelberg, Germany, 2004; Volume 125, pp. 206–215. [Google Scholar]
  75. Desiraju, G.R.; Steiner, T. The Weak Hydrogen Bond in Structural Chemistry and Biology, 2nd ed.; Oxford University Press: Oxford, UK, 2006. [Google Scholar]
  76. Scheiner, S.; Dykstra, C.E.; Frenking, G.; Kim, K.S.; Scuseria, G.E. Theory and Applications of Computational Chemistry: The First Forty Years; Elsevier: Hoboken, NJ, USA, 2005; pp. 831–858. [Google Scholar]
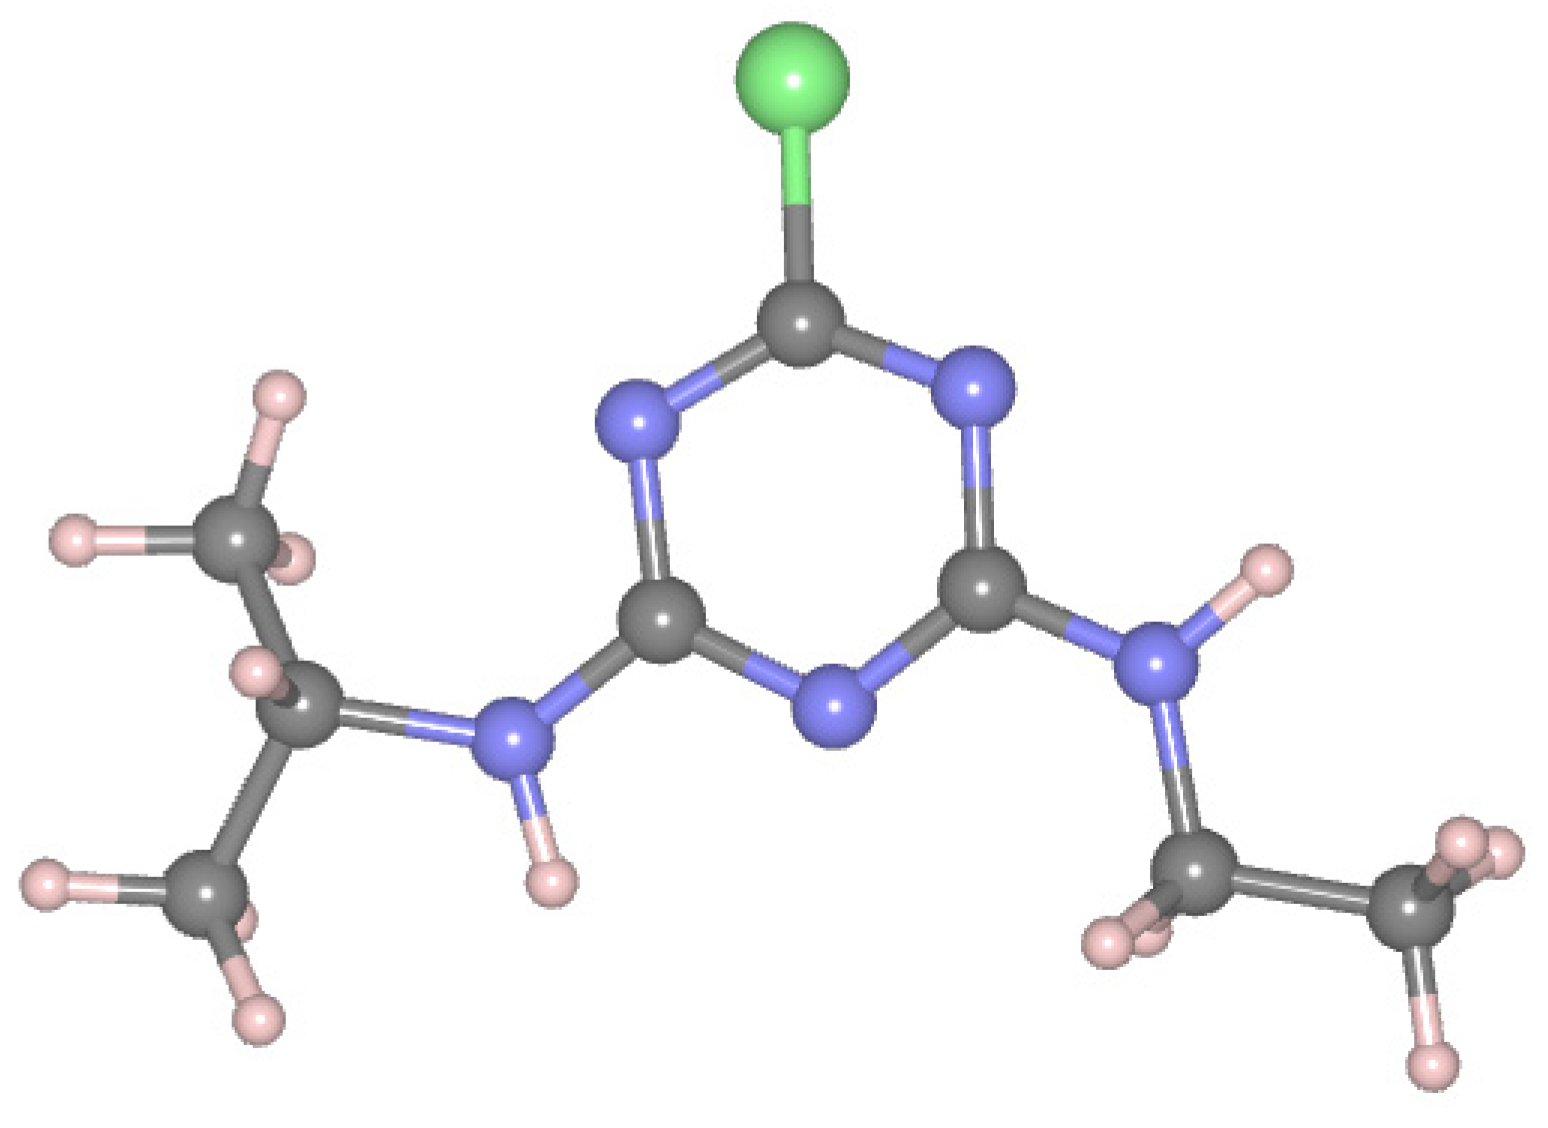
Scheme 1. Atrazine molecule.
Minerals 11 00554 sch001
Figure 1. Interlayer space arrangement from c-view of: Na-Mt (a); A-Mt (b); A-TMP-Mt (c); Na-Bd (d); A-Bd (e); and A-TMP-Bd (f). The Si4+ tetrahedra are in yellow, the Al3+ tetrahedra and octahedra are in cyan and the Mg2+ octahedra are in magenta.
Minerals 11 00554 g001
Figure 2. The hydrogen bonds in the A-TMP-Mt model as an example: green (C–H···Ob), magenta (C–H···Ow), yellow (Ow–H···Ob), blue (Ow–H···Ow) and cyan (N–H···Ow). Only the tetrahedral sheets are illustrated for better viewing of the hydrogen bonds.
Minerals 11 00554 g002
Figure 3. The hydrogen bonds in the A-Bd model as an example: green (C–H···Ob), magenta (C–H···Ow), yellow (Ow–H···Ob), blue (Ow–H···Ow), cyan (N–H···Ow) and red (N–H···Ob); b-view. Only tetrahedral sheets are illustrated for better viewing of the hydrogen bonds.
Minerals 11 00554 g003
Figure 4. The experimental (red) and calculated total VDOS (black), the projected VDOS of the -NH groups (green) and the projected VDOS of the triazine ring (orange) for the A-Mt model.
Minerals 11 00554 g004
Figure 5. The experimental (red) and calculated VDOS (black), the projected VDOS of the NH1 group (green), the projected VDOS of the NH2 group (olive) and the projected VDOS of the triazine ring (orange) for the A-TMP-Mt model.
Minerals 11 00554 g005
Figure 6. The contribution of the projected VDOS of C–H vibrations for the atrazine molecule (blue) and the TMP cation (magenta). The calculated total VDOS (black) and the experimental FTIR (red) for the A-TMP-Mt model.
Minerals 11 00554 g006
Figure 7. The experimental (red) and calculated VDOS (black), the projected VDOS of the NH groups (green) and the projected VDOS of the triazine ring (orange) for the A-Bd model.
Minerals 11 00554 g007
Figure 8. The experimental (red) and total VDOS (black), the projected VDOS of the NH groups (green) and the projected VDOS of the triazine ring (orange) for the A-TMP-Bd model.
Minerals 11 00554 g008
Figure 9. The contribution of the calculated projected VDOS of the C–H vibrations for atrazine (blue) and the TMP cation (magenta), the calculated total VDOS (black) and the experimental FTIR spectrum (red) for the A-TMP-Bd model.
Minerals 11 00554 g009
Figure 10. The calculated total VDOS (black) of A-Mt (left) and A-Bd (right), the calculated VDOS of the atrazine molecule (violet) and the calculated VDOS of water molecules in the interlayer (cyan).
Minerals 11 00554 g010
Figure 11. The calculated total VDOS (black) of A-TMP-Mt (left) and A-TMP-Bd (right), the calculated VDOS of the atrazine molecule (violet) and the calculated VDOS of water molecules in the interlayer (cyan).
Minerals 11 00554 g011
Figure 12. Comparison of the C–H regions: (left) the FTIR spectra of A-Mt (blue) and A-TMP-Mt (red); and (right) the FTIR spectra of A-Bd (magenta) and A-TMP-Bd (green).
Minerals 11 00554 g012
Figure 13. Comparison of the FTIR spectra (red) and the calculated total VDOS (black) in A-TMP-Bd as an example. νOH, stretching vibration of hydroxyl groups of clay; νOHw, stretching vibration of water molecules; νNH, stretching vibration of –NH groups; νCH, stretching vibration of –CH groups; δOHw, bending vibrations of water; νSiO, stretching vibrations of Si–O bonds; δNC, bending of –NC triazine ring; mixed νAlOSi, stretching vibrations of Al-O-Si bonds; δNC+ δSiO+ δAlOSi, the region of mixed δNC bending from triazine ring of atrazine and skeletal vibrations of clay (δSiO+ δAlOS).
Minerals 11 00554 g013
Figure 14. Comparison of the FTIR spectra for atrazine, pure beidellite (Na-Bd) and modified beidellite samples (A-Bd, TMP-Bd and A-TMP-Bd). For clarity, the spectra are consecutively shifted with respect to 0.0 au baseline and the spectrum of atrazine is scaled by a factor 0.3: (Left) spectra in the range 500–1200 cm−1; and (right) complete spectra in the range 500–4000 cm−1.
Minerals 11 00554 g014
Figure 15. Comparison of the FTIR spectra for atrazine, pure montmorillonite (Na-Mt) and modified montmorillonite samples (A-Mt, TMP-Mt and A-TMP-Mt). For clarity, the spectra are consecutively shifted with respect to 0.0 au baseline and the spectrum of atrazine is scaled by a factor 0.3: (Left) spectra in the range 500–1200 cm−1; and (right) complete spectra in the range 500–4000 cm−1.
Minerals 11 00554 g015
Table 1. Calculated (d001 calc) and experimental (d001 exp) values (Å) for Na-Mt, Na-Bd, A-Mt, A-Bd, A-TMP-Mt and A-TMP-Bd structures.
Models d 001 calc d 001 exp
Na-Mt12.112.4
Na-Bd12.012.3
A-Mt12.712.8
A-Bd 12.712.7
A-TMP-Mt 13.014.1
A-TMP-Bd 13.013.9
Table 2. The hydrogen bond distances, H···A, (min; median; max) (Å), intercalation energy, ΔEint, [kJ.mol−1], in the A-Mt, A-Bd, A-TMP-Mt and A-TMP-Bd models.
Models/H Bonds/A-MtA-BdA-TMP-MtA-TMP-Bd
Catz–H···Ow2.46; 2.72; 2.742.48; 2.55; 2.752.56; 2.98; 2.992.62; 2.77; 2.88
Catz–H···Ob2.38; 2.61; 3.142.42; 2.62; 3.052.43; 2.63; 2.852.39; 2.56; 2.93
CTMP–H···Ob--2.32; 2.53; 2.812.21; 2.55; 2.91
N–H···Ow2.152.57; 2.832.30; 2.55; 2.672.31; 2.79; 2.90
N–H···Ob-2.98--
Ow–H···Ow1.74; 1.88; 2.751.76; 1.95; 2.951.72; 1.81; 2.971.78; 1.95; 2.94
Ow–H···Ob1.85; 2.53; 2.981.71; 2.63; 2.991.86; 2.47; 2.991.75; 2.57; 2.95
Eint−48.1−67.6−189.0−221.1
Publisher’s Note: MDPI stays neutral with regard to jurisdictional claims in published maps and institutional affiliations.