Abstract
Understanding the origin of acid mine drainage (AMD) in a closed mine and groundwater flow system around the mine aids in developing strategies for environmental protection and management. AMD has been continuously collected and neutralized at Osarizawa Mine, Akita Prefecture, Japan, since the mine was closed in the 1970s, to protect surrounding river water and groundwater quality. Thus, water samples were taken at the mine and surrounding groundwaters and rivers to characterize the chemical properties and environmental isotopes (δ2H and δ18O). The results showed that the quality and stable isotope ratios of AMD differed from those of groundwater/river water, indicating that the recharge areas of AMD. The recharge area of AMD was evaluated as the mountain slope at an elevation of 400–500 m while that of the surrounding groundwater was evaluated at an elevation of 350–450 m, by considering the stable isotopes ratios. This indicates that the groundwater affected by AMD is limited to the vicinity of the mine and distributed around nearby rivers.
1. Introduction
Acid mine drainage (AMD) is generally characterized by low pH and high concentrations of sulfate, heavy metals, and metalloids, and is a serious environmental problem at many active, closed, and abandoned mines worldwide [1,2,3,4]. Japan has a long history of metal mining, and was a global metal producer in the 17th to 19th centuries, with some 5000 mines extracting mineral resources. Sulfide minerals such as pyrite, chalcopyrite, sphalerite, and galena were mined, and the remaining minerals in excavated areas react with groundwater and the atmosphere to generate AMD, even today after mines were closed or abandoned [5].
From the beginning of the 20th century to the 1960s, acidification of river water caused by the inflow of untreated AMD became a social problem in many parts of Japan, with contamination of agricultural land downstream of mines by copper (Cu) and cadmium (Cd) being problematic and, in some cases, leading to human health problems. In response, mining concession holders and local governments have implemented mine pollution prevention projects, and the local governments as well as the Ministry of Economy, Trade and Industry of Japan provided support for the reliable and sustainable treatment of mine drainage under the mine pollution prevention fund program [6]. Therefore, no serious contamination has occurred in recent decades. On the other hand, tunnels and excavated areas created during mining are suitable for investigations of properties of rock and groundwater deep underground, with depths from the ground surface exceeding several hundred meters. As many mines in Japan were still in operation up to the 2000s, it was possible to undertake studies in mine tunnels, including on the permeability of rock fractures [7] and the quality and quantity of AMD seepage from tunnel walls [8,9,10]. In the period since most of the mines were closed after the 2000s, further studies have been undertaken to reduce the burden of AMD treatment, which is expected to continue semi-permanently, such as studies of the formation and reaction of AMD with minerals [11], future forecast for the quality of AMD [12,13,14,15], adsorption and sedimentation of heavy metals from wastewater [16,17,18,19], mechanisms of AMD generation [20,21], and the effects of backfilling of excavated areas on the quantity and quality of AMD [22,23]. The findings of these studies have been incorporated into mine pollution control projects undertaken by the government, mine operators, and researchers with some success. At the same time, in-depth studies of the impact of mining on the groundwater environment have recently been conducted worldwide. Based on this historical background, we focused on the relationship between AMD and groundwater around mines. Over the last decade, studies of the impact of mining on the surrounding groundwater environment have been vigorously pursued worldwide, with examples being the impact of AMD generated in coal mines on karst groundwater [24,25], estimation of natural and mining impacted contributions to instream metals [26,27], and the evaluation of AMD attenuation using stable-isotope ratios of metals as tracers [28]. Case studies have also been reported, including on the calculation of mixing ratios of AMD and surface water based on stable-isotope ratios [29], chemical transfer processes in waste-rock piles [30,31], and conceptualization of underground flooded mine reservoirs and groundwater flow modeling [32]. On the other hand, metal mines in Japan were mainly underground mines, and some mines still have drainage tunnels accessible to the public. Geochemical studies have examined the origin of AMD and groundwater flowing from old mine workings, but more detailed information is required to address all relevant issues [33,34].
An understanding of the origin and flow of groundwater in closed and abandoned mines can provide information useful in developing reasonable countermeasures such as back filling of excavated areas and revegetation of surfaces. However, there is little hydrological information for abandoned mines, and the way in which groundwater is impacted by AMD from abandoned mines has received scarce attention. Few studies have identified the recharge areas of AMD and groundwater around abandoned mines or evaluated the relationship between them. The Osarizawa Mine area, northern Honshu Island, Japan, was selected for this study because this is a closed non-ferrous sulfide mine that had produced chalcopyrite, galena, and sphalerite, and these sulfide minerals still exist in the mine. In addition, there are many springs nearby the Osarizawa Mine, which are used for sake brewing as valuable groundwater resources in the local industry. To prevent AMD from affecting these groundwater resources, a project to drain AMD from the drainage tunnels and lower the groundwater table is underway. However, lowering the groundwater table may stimulate AMD, so it is important to clarify whether AMD affects the groundwater and, if so, to what extent. The objectives of the study were to evaluate the geochemistry of AMD, and to assess its impact on the surrounding groundwater and river for restricting the influenced areas by the AMD. Characteristics of AMD, groundwater, and river water were evaluated based on major anion, cation, and heavy-metal concentrations, and stable isotope ratios by considering topography, and geology around the mine.
2. Materials and Methods
2.1. Geology and History of the Osarizawa Mine
The Osozawa Mine is located in northern Akita Prefecture, Japan (Figure 1). The ore deposit is classified as a vein type deposit formed through Tertiary igneous activity, and the host rocks are Neogene green tuff, lava, and siliceous shale. There are about 470 veins distributed over an area of 2 km E–W and 3 km N–S (Figure 2). Ore minerals are mainly chalcopyrite and pyrite, with sphalerite at the periphery of the deposit. Galena and gold (Au) occur in the upper parts of the veins. Quartz and chlorite occur universally as vein minerals, with barite at the periphery of the deposit [35].
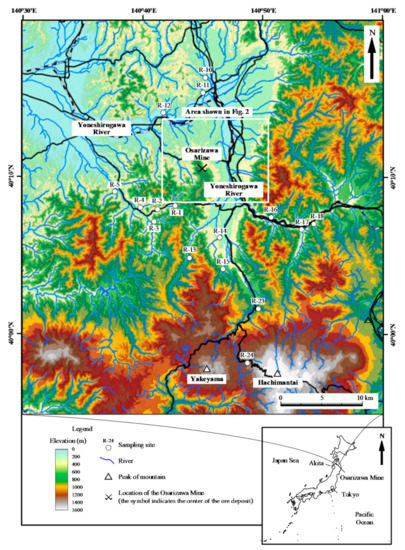
Figure 1.
Topographic map of the study area showing the locations of water sampling points. The inset shows the location of the mine area in Japan.
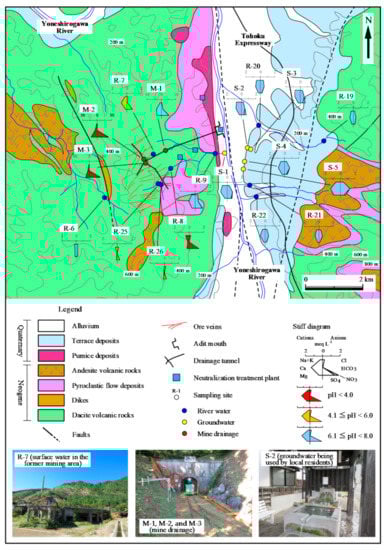
Figure 2.
Geological map and locations of water sampling sites, with corresponding water sample properties indicated by Stiff diagrams.
The mine has a long history of operation since it opened in the 8th century, according to oral tradition. Detailed records of mining are available since the 16th century, and the mine flourished as a leading Cu mine in Japan. By 1963, the annual crude ore output was 807,000 tons with average Cu, lead (Pb), and zinc (Zn) grades of 1.07%, 0.19%, and 0.13%, respectively. Decreasing metal prices and appreciating Japanese Yen eventually made the operation unprofitable, and it was closed in 1978 [36,37]. The mine is located in the green tuff region where Neogene formations, Quaternary volcanic rocks, and pyroclastic flow deposits are widely distributed on pre-Tertiary basement rocks. The area around the mine is mountainous, and there are two peaks of the Quaternary volcanoes Mt. Hachimantai (1613 m above sea level, a.s.l.) and Mt. Yakeyama (1366 m a.s.l.) located 25 km to the south of the mine, with decreasing elevation northward. The mine lies on a mountain at an elevation of 500–600 m a.s.l., and the ruins of an old concentrator and other facilities still exist. Some old mine workings, such as tunnels and excavated areas, are open to the public for tourism and are maintained as drainage tunnels. To the east of the mine, the Yoneshirogawa River flows northward from its source on Mt. Hachimantai. Terrace deposits are distributed along this river, with groundwater springs at the foot of terraces being used by local residents for drinking and a raw material for sake.
All operations involved underground mining, with two excavation methods used depending on the strength of host rocks: cutting and filling with sand slime, sludge, and tailings, or the shrinkage stoping method [30]. Following mine closure, old workings deeper than the drainage level (−5.5 L level; 140 m a.s.l.) were submerged, and AMD from shallower mining areas was drained through the drainage tunnel. Since then, AMD neutralization has been continued by the operator to protect surrounding groundwater and rivers. Four treatment plants are operating for treatment of AMD from former mining areas including dumping sites, the concentrator, and buried adit mouths.
2.2. Water Sample Collection and Analysis
Samples of river water, groundwater, and mine drainage were collected during 4–6 September and 9–11 December 2020, from sites shown in Figure 1 and Figure 2. In the drainage tunnel, the seepage sample was collected from the tunnel wall (sample M-1) and AMD samples were collected from cross cuts to the drainage tunnel (samples M-2 and M-3). Groundwater samples were collected at springs on five locations around the mine (samples S-1 to S-5). River water samples were also collected from at the tributaries of the Yoneshirogawa River (samples R-1 to R-26). To elucidate the effect of elevation on H–O stable-isotope ratios, river water sampling locations ranged from lowlands to highlands around the mine. All samples were divided into three 0.25 L polypropylene bottles; one was filtered through a 0.45 μm membrane filter, and the other two were unfiltered. One of the unfiltered samples was kept aside in case reanalysis was necessary. In the laboratory, samples were acidified with 1% (v/v) nitric acid (HNO3). Temperature, pH, electrical conductivity (EC), and oxidation–reduction potential (ORP) were measured in situ using a pH meter (HM-30P, DKK-TOA, Tokyo, Japan), an EC meter (CM-31P, DKK-TOA, Japan), and an ORP meter (RM-30P, DKK-TOA, Japan), respectively. The ORP meter was equipped with an Ag–AgCl electrode, and measured values were converted to standard redox potentials (Eh) by applying a temperature-dependent constant appropriate for the electrode solution.
Collected water samples were analyzed as follows. Alkalinity was determined by the drop-test method, by titration with 0.02 M sulfuric acid (H2SO4) to pH 4.8, using 50 mL of unfiltered samples. Major anion (Cl−, SO42− and NO3−) concentrations of filtered samples were determined by ion chromatography with a Dionex Integrion RFIC System (Thermo Fisher Scientific K.K., Tokyo, Japan). Major cation (Na+, K+, Ca2+, and Mg2+), Si, total Fe, Cu, and Zn concentrations of filtered samples were determined using a multitype inductively coupled plasma emission spectrometer (ICPE-9000; Shimadzu Corporation, Kyoto, Japan). For heavy metals, the major components targeted by the AMD neutralization process were selected. Three repeat analyses by ion chromatography and spectrometry were performed for each sample. The standard deviation (S.D.) of the repeated measurements was within 1% of the concentration value for all samples collected in both September and December 2020.
H–O isotopic ratios were determined by laser absorption spectroscopy using a liquid-water isotope analyzer (DLT-100; Los Gatos Research, San Jose, CA, USA). The δD (1000((2H/1H)sample/(2H/1H)VSMOW) − 1), ‰) and δ18O (1000((18O/16O)sample/(18O/16O)VSMOW) − 1), ‰) values were calculated relative to Vienna Standard Mean Ocean Water (VSMOW) with analytical precisions of 1.0‰ and 0.1‰, respectively.
2.3. Principal Component Analysis
Multivariate principal component analysis (PCA) was undertaken to examine major trends and interrelationships in the analysis results for each sample. The approach has been applied in many studies comparing the qualities of AMD, groundwater, and river water in mine areas [38,39,40]. Here, PCA was performed using the multivariate analysis software IBM SPSS Statistics 25 (IBM Japan, Ltd., Tokyo, Japan), and it was applied to four variables measured in situ (temperature, pH, EC, and Eh), the concentrations of seven major ions (Na+, K+, Ca2+, Mg2+, Cl−, HCO3−, SO42−, and NO3−), Si, three heavy metals (total Fe, Cu, Zn), and the isotopic ratios of δD and δ18O.
3. Results and Discussion
3.1. Geochemistry of Water Samples
The geochemical and isotopic properties of water samples collected from the Osarizawa mine area and the surrounding areas are summarized in Table 1 and Table 2. Stiff diagrams are shown in Figure 2, and the Piper diagrams are shown in Figure 3.

Table 1.
Physicochemical properties of water samples collected during 4–6 September 2020.
Table 2.
Physicochemical properties of water samples collected during 9–11 December 2020.
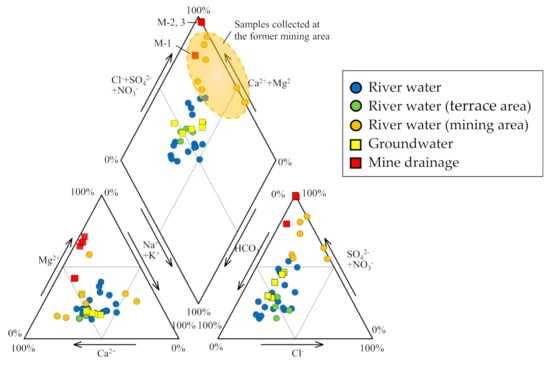
Figure 3.
Piper diagram showing the hydrochemical facies of river water, groundwater, and mine drainage.
The pH, EC, Eh, and temperature of river water samples were in the ranges of 3.5–7.5, 5.5–29.9 mS m−1, +339 to +657 mV, and 5.5 °C–29.9 °C, respectively (Table 1 and Table 2). The HCO3 type, which is rich in Ca2+ and HCO3−, was relatively common, but there were other types in which Na+ and Mg2+ were the predominant cations and SO42− the predominant anion. HCO3− was the dominant anion in the Yoneshirogawa River tributaries (Na, Ca, Mg−HCO3 type water) while SO42− was the dominant anion when the pH was low (3.5–6.4) of the samples collected at the former mining area (Ca, Mg−SO4 type water; samples R-7, R-8, R-9, R-25, and R-26). In the Piper diagram (Figure 3), some river water samples collected at the former mining area had chemical compositions similar to those of AMD. This implies that river samples collected at the former mining area may be affected by AMD, although no AMD inflow or outflow was observed. Tailings remain in the former mining area, and these may cause acidification of rainwater due to the oxidation of sulfide minerals. River water samples in the area of terrace sediments were of the Ca−HCO3 type, similar to groundwater samples (R-19 to R-22). Concentrations of heavy metals (total Fe, Cu, Zn) were <1 mg L−1 in the former mining area, and concentrations of other elements were below the detection limit.
The pH, EC, Eh, and temperature of groundwater samples were in the ranges of 6.3–6.7, 15.7–55.6 mS m−1, +411 to +446 mV, and 8.3 °C–13.0 °C, respectively (Table 1 and Table 2). All samples (S-1 to S-5) were Ca–HCO3 type, with higher concentrations of dissolved ions than river water. The groundwater samples were characterized by NO3− rich (7.6–19.9 mg L−1) relative to river water samples (0.3–2.8 mg L−1) and mine drainage samples (2.4–4.7 mg L−1). Thus, the groundwater quality is considered to be controlled by reactions between dissolved CO2 and minerals in sediments such as feldspar and is affected by fertilizer [41,42].
The pH, EC, Eh, and temperature of mine drainage samples (M-1, M-2, and M-3) were in the ranges of 3.2–7.2, 60.5–387 mS m−1, +252 to +609 mV, and 12.2 °C–14.5 °C, respectively (Table 1 and Table 2). Sample M-1 (seepage from tunnel wall) was a Ca–SO4 type although samples M-2 and M-3 were Mg–SO4 type (Figure 2). AMD samples M-2 and M-3 from the mining cross cuts had lower pH and higher EC values than seepage sample M-1, indicating the influence of oxidation of ore minerals that remain in the excavated areas. The pH of seepage sample M-1 was 7.2 in both sampling periods, and was similar to that of groundwater samples. The EC value of seepage sample M-1 was 60.5–61.8 mS m−1, slightly higher than that of groundwater. A similar trend was observed for concentrations of total Fe, Cu, and Zn in three mine drainage samples. Total Fe, Cu, and Zn concentrations in samples M-2 and M-3 were >31, 0.6, and 45 mg L−1, respectively, while those in sample M-1 were below the detection limit. The difference in water quality between AMD samples and seepage sample was also evident in Eh values, with the former ranging from 591 to 601 mV and the latter from 252 to 262 mV, indicating that seepage sample was reductive in nature (Table 1 and Table 2).
3.2. H–O Isotopic Ratios
The δD and δ18O values of river water samples were in the ranges of −71.5‰ to −60.9‰ and −11.4‰ to −9.3‰ for samples collected in September 2020, and −69.2‰ to −60.3‰ and −11.1‰ to −9.6‰ for samples collected in December 2020, respectively, as illustrated in Figure 4. The meteoric water line in the area of the Japan Sea around northern Japan [43] is depicted in this figure. From these figures, there was no significant difference in values between the two periods, but there was a slight difference between the obtained date and the local meteoric water line (LMWL; Figure 4), likely due to the different sampling sites. The ranges of δ18O and δD values of groundwater and mine drainage samples approximate those of river water samples, and are plotted near LMWL. Therefore, it is considered that groundwater and mine drainage were originated from rainwater on the area, the same as river water. River water samples from higher elevations (samples R-23 and R-24) have lower δ18O and δD values, with the relationship between elevation and isotopic ratios likely being due to isotopic fractionation during precipitation (Figure 4b) [44,45]. Samples R-17 and R-18 also have low isotopic ratios, reflecting values of the catchment area, as the upper reaches of the rivers at these two sites are at high elevations (Figure 4a).
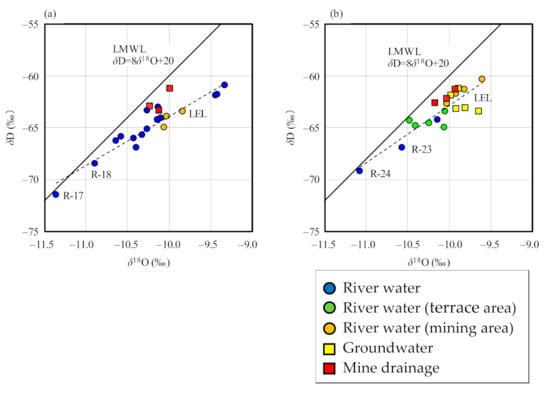
Figure 4.
Relationship between δD and δ18O values of water samples, relative to the local meteoric water line (LMWL). (a) September 2020; (b) December 2020.
There is a clear negative correlation between the average catchment elevation of river which was calculated with that of the water sampling site and most upstream site, and isotopic ratios, for both δ18O and δD values (Figure 5). The origin of groundwater and mine drainage can be inferred by comparing these values with those of river water. As the spring is located at the foot of a terrace, it was assumed that groundwater originated from rainwater on the terrace, but the isotopic ratios do not match river water on the terrace. The recharge area assumed from the isotopic ratios is at 350–450 m a.s.l., which corresponds to the elevation of the boundary between terrace and mountain (Figure 5c,d). The difference in isotopic ratios between groundwater and river water suggests that the river water on the terrace is upstream of the high-elevation Neogene mountains, and that the groundwater originates from rainwater infiltrating the terrace surface. The mine drainage generally originates at 400–500 m a.s.l., which corresponds to the elevation of the mountain body where the ore veins are distributed (Figure 2), in both sampling periods.
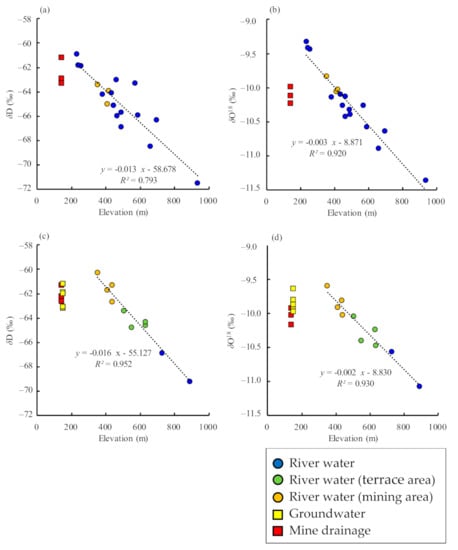
Figure 5.
Relationship between the elevation of river catchment areas and stable-isotope ratios, including regression lines. (a) September 2020, δD; (b) September 2020, δ18O; (c) December 2020, δD; (d) December 2020, δ18O. The elevation of the river catchment area was calculated by averaging the elevations of the water sampling site and the most upstream site.
3.3. Principal Component Analysis
PCA results are shown in Table 3. Three principal components (PC1, PC2, and PC3) were selected, which together account for 80% of the total variability of the dataset, with water quality thus being dominated by these factors. PC1 had high loadings for EC, pH, K+, Ca2+, Mg2+, SO42−, total Fe, Cu, and Zn with an absolute value of >0.79. The low pH and SO42− loadings may be explained by oxidation of pyrite (FeS2), a common sulfide mineral in metal deposits and altered rocks. Pyrite oxidation is facilitated by Fe3+ formed through the oxidation of Fe2+ by dissolved O2, and promotes dissolution of Cu and Zn [45,46]. The high Ca2+ loading is related to reactions of AMD and calcite (CaCO3), which is a vein mineral, and possibly to interactions of river water in the mining area with concrete used in drainage roads. The significant Mg2+ loading is related to reactions of AMD with the mineral chlorite ((Mg,Fe,Al)6(Al,Si)4O10(OH)8) associated with veins.
Table 3.
Factor loadings and contributions of principal components.
For PC2, there were high loadings for Na+ and Si with values of >0.61, and it is considered to be the groundwater and river water quality were controlled by reactions between dis-solved CO2 and silicate minerals such as feldspar. The relatively high load of HCO3 was 0.63, supporting this consideration. In addition, for PC2, there was high loading for NO3− with values of 0.79, reflecting the high concentrations of NO3− in groundwater. Orchards on the terrace were assumed to be a recharge area for groundwater, with NO3− originating from artificial fertilizer.
For PC3, there were high loadings for H–O isotopic ratios with absolute values of >0.61, reflecting the effect of isotopic fractionation (Figure 5).
The sum of the contributions of PC1, PC2, and PC3 is 69% (Table 3), indicating that the geochemistry of river water, groundwater, and mine drainage were satisfactorily explained by the three PCs. A scatterplot of PC1 vs. PC2 and PC1 vs. PC3 are shown in Figure 6, indicating three different data groups: (a) river water, (b) groundwater, and (c) mine drainage and river water in the mining area. The figure shows that seepage water (sample M-1) from mine drainage was similar to groundwater in terms of water quality and isotopic ratios.
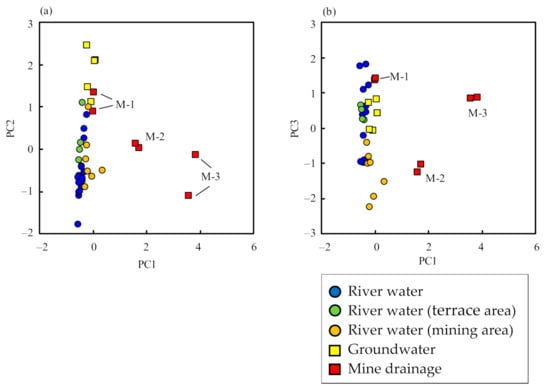
Figure 6.
Principal component scores of (a) PC1 vs. PC2 and (b) PC1 vs. PC3.
3.4. Groundwater Flow and Discharge
A conceptual model of infiltration and groundwater flow was devised on the basis of results described in Section 3.1, Section 3.2 and Section 3.3, as shown in Figure 7. Groundwater infiltrating from the terrace and mountain surface (350–450 m a.s.l.) on the true right bank of the Yoneshirogawa River reacts with felspars in terrace deposits, releasing Ca2+, Na+, and HCO3− before discharge as spring water. Some groundwater also enters the river, affecting the composition of the river water. The orchard terrace surface releases fertilizer NO3− to groundwater. Infiltration and groundwater enter rivers on the surrounding mountain surface, with the water quality being altered by reaction with feldspars in Neogene volcanic rocks.
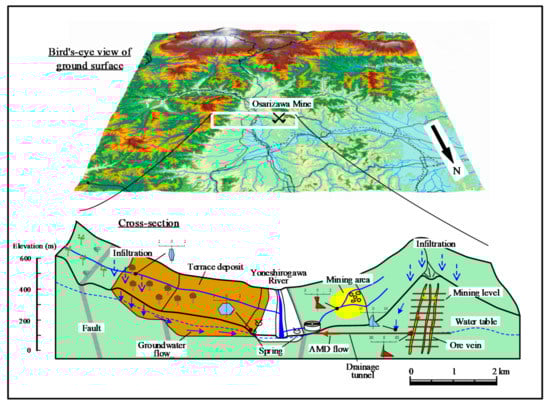
Figure 7.
Conceptual model of discharge and groundwater flow from the Osarizawa Mine area.
The Osarizawa Mine is on the left bank of the Yoneshirogawa River, and groundwater that has infiltrated to the excavated areas from the directly overlying mountain surface (400–500 m a.s.l.) reacts with sulfide minerals to generate AMD, which flows from the drainage tunnel to the treatment facility. The water table is maintained at a constant level by drainage. Mine drainage seepage from the walls of the drainage tunnel has a neutral pH, a low content of heavy metals, and is not significantly affected by the AMD. River water in the former mining area is affected by tailings remaining on the ground surface, and is relatively acidic. The area affected by AMD is limited to near the mining area, with no effect on surrounding groundwater, mainly because the flooded surface of the Osarizawa Mine is maintained at a constant level.
4. Conclusions
The findings of this geological, hydrological, geochemical, and isotopic study of groundwater at the Osarizawa Mine area are as follows:
- (1)
- AMD is formed through interactions between groundwater and sulfide minerals in excavated areas.
- (2)
- The groundwater recharge area for AMD formation is located on the mountain slope at 400–500 m a.s.l.
- (3)
- Groundwater infiltrating from the terrace and mountain surface at 350–450 m a.s.l. reacts with felspars in terrace deposits and is discharged as spring water.
- (4)
- Based on a conceptual model of discharge and groundwater flow at the mine area, the area affected by AMD is limited to near the mine area, with no effect on surrounding groundwater.
Author Contributions
Conceptualization, N.N. and S.T.; software, N.N.; validation, T.I. and S.Y.; investigation, N.N., S.T. and Y.Y.; writing—original draft preparation, N.N. and S.T.; writing—review and editing, T.I.; visualization, S.T.; supervision, S.T. All authors have read and agreed to the published version of the manuscript.
Funding
This research received no external funding.
Data Availability Statement
Data for this study are presented in the paper.
Acknowledgments
The authors thank the editor and anonymous reviewers for their constructive comments that improved this manuscript. We also thank the staff of Mitsubishi Materials Corporation, Eco-Management Corporation, and Mitsubishi Materials Techno Corporation for their help, advice, and cooperation during this study.
Conflicts of Interest
The authors declare no conflict of interest.
References
- Simate, G.S.; Ndlovu, S. Acid mine drainage: Challenges and opportunities. J. Environ. Chem. Eng. 2014, 2, 1785–1803. [Google Scholar] [CrossRef]
- Anawar, H.M. Sustainable rehabilitation of mining waste and acid mine drainage using geochemistry, mine type, mineralogy, texture, ore extraction and climate knowledge. J. Environ. Manag. 2015, 158, 111–121. [Google Scholar] [CrossRef]
- Kefeni, K.; Msagati, T.; Mamba, B. Acid mine drainage: Prevention, treatment options, and resource recovery: A review. J. Clean. Prod. 2017, 151, 475–493. [Google Scholar] [CrossRef]
- Vriens, B.; Plante, B.; Seigneur, N.; Jamieson, H. Review Mine Waste Rock: Insights for Sustainable Hydrogeochemical Management. Minerals 2020, 10, 728. [Google Scholar] [CrossRef]
- JOGMEC (Japan Oil, Gas and Metals National Corporation). Mine Pollution Control. Available online: http://www.jogmec.go.jp/english/mp_control/index.html (accessed on 11 May 2021).
- Ministry of Economy, Trade and Industry. Safety of Mines. Available online: https://www.meti.go.jp/english/policy/safety_security/industrial_safety/index.html#mines (accessed on 11 May 2021).
- Kondo, S. On fissures and percolation of water in the rock formation. Bull. Geol. Suev. Japan 1958, 9, 67–76. Available online: https://www.gsj.jp/data/bull-gsj/09-02_01.pdf (accessed on 11 May 2021). (In Japanese, with English abstract).
- Demura, O. Practice of mine water at the Yanahara Mine. J. MMIJ 1961, 77, 312–318, (In Japanese, with English abstract). [Google Scholar] [CrossRef][Green Version]
- Imai, H.; Takenouchi, S. Some hot springs flowing out from the gold-Quartz veins in Japan. J. MMIJ 1961, 77, 305–311, (In Japanese, with English abstract). [Google Scholar] [CrossRef][Green Version]
- Ito, J.; Zimpo, K.; Makiuchi, S.; Fuchimoto, H. Underground water of the Makimine Main. J. MMIJ 1961, 77, 327–331, (In Japanese, with English abstract). [Google Scholar] [CrossRef]
- Tabelin, C.B.; Igarashi, T.; Villacorte-Tabelin, M.; Park, I.; Opiso, E.M.; Ito, M.; Hiroyoshi, N. Arsenic, selenium, boron, lead, cadmium, copper, and zinc in naturally contaminated rocks: A review of their sources, modes of enrichment, mechanisms of release. Sci. Total Environ. 2018, 645, 1522–1553. [Google Scholar] [CrossRef]
- Tokoro, C.; Fukaki, K.; Kadokura, M.; Fuchida, S. Forecast of AMD quantity by a series tank model in three stages: Case studies in two closed Japanese mines. Minerals 2020, 10, 430. [Google Scholar] [CrossRef]
- Iwasaki, K.; Fukaya, K.; Fuchida, S.; Matsumoto, S.; Araoka, D.; Tokoro, C.; Yasutaka, T. Projecting future changes in element concentrations of approximately100 untreated discharges from legacy mines in Japan by a hierarchicallog-linear model. Sci. Total Environ. 2021, 786, 147500. [Google Scholar] [CrossRef]
- Khoeurn, K.; Sasaki, A.; Tomiyama, S.; Igarashi, T. Distribution of zinc, copper, and iron in the tailings dam of an abandoned mine in Shimokawa, Hokkaido, Japan. Mine Water Environ. 2019, 38, 119–129. [Google Scholar] [CrossRef]
- Khoeurn, K.; Sakaguchi, A.; Tomiyama, S.; Igarashi, T. Long-term acid generation and heavy metal leaching from the tailings of Shimokawa mine, Hokkaido, Japan: Column study under natural condition. J. Geochem. Explor. 2019, 201, 1–12. [Google Scholar] [CrossRef]
- Sasaki, K.; Nakamuta, Y.; Hirajima, T.; Tuovinen, O.H. Raman characterization of secondary minerals formed during chalcopyrite leaching with Acidithiobacillus ferrooxidans. Hydrometallurgy 2009, 95, 153–158. [Google Scholar] [CrossRef]
- Tokoro, C.; Yatsugi, Y.; Sasaki, H.; Owada, S. A quantitative modeling of co-precipitation phenomena in wastewater containing dilute anions with ferrihydrite using a surface complexation model. Resour. Process. 2008, 55, 3–8. [Google Scholar] [CrossRef][Green Version]
- Tokoro, C.; Yatsugi, Y.; Koga, H.; Owada, S. Sorption mechanisms of arsenate during coprecipitation with ferrihydrite in aqueous solution. Environ. Sci. Technol. 2010, 44, 638–643. [Google Scholar] [CrossRef]
- Tokoro, C. Removal mechanism in anionic co-precipitation with hydroxides in acid mine drainage treatment. Resour. Process. 2015, 62, 3–9. [Google Scholar] [CrossRef][Green Version]
- Villafane, O.R.S.; Igarashi, T.; Kuroswa, M.; Takase, T. Comparison of potentially toxic metals leaching from weathered rocks at a closed mine site between laboratory columns and field observation. Appl. Geochem. 2012, 27, 2271–2279. [Google Scholar] [CrossRef]
- Villafane, O.R.S.; Igarashi, T.; Kuroswa, M.; Takase, T. Porewater Monitoring Under Different Layer Systems on a Sloping Surface at a Closed Mine Sit. Water Air Soil Pollut. 2013, 224, 1480. [Google Scholar] [CrossRef]
- Yamaguchi, K.; Tomiyama, S.; Metugi, H.; Ii, H.; Ueda, A. Flow and geochemical modeling of drainage from Tomitaka mine, Miyazaki, Japan. J. Environ. Sci. 2015, 36, 130–143. [Google Scholar] [CrossRef]
- Yamaguchi, K.; Tomiyama, S.; Igarashi, T.; Yamagata, S.; Ebato, M.; Sakoda, M. Effects of backfilling excavated underground space on reducing acid mine drainage in an abandoned mine. Minerals 2020, 10, 777. [Google Scholar] [CrossRef]
- Jiang, C.; Gao, X.; Hou, B.; Zhang, S.; Zhang, J.; Li, C.; Wang, W. Occurrence and Environmental Impact of Coal Mine Goaf Water in Karst Areas in China. J. Clean. Prod. 2020, 275, 123813. [Google Scholar] [CrossRef]
- Ren, K.; Zeng, J.; Liang, J.; Yuan, D.; Jiao, Y.; Peng, C.; Pan, X. Impacts of acid mine drainage on karst aquifers: Evidence from hydrogeochemistry, stable sulfur and oxygen isotopes. Sci. Total Environ. 2020, 10, 143223. [Google Scholar] [CrossRef] [PubMed]
- Runkel, R.L.; Kimball, B.A.; Nimick, D.A.; Walton-Day, K. Effects of flow regime on metal concentrations and the attainment of water quality standards in a remediated stream reach, Butte, Montana. Environ. Sci. Technol. 2016, 50, 12641–12649. [Google Scholar] [CrossRef]
- Runkel, R.L.; Verplanck, P.L.; Kimball, B.A.; Walton-Day, K. Cinnamon Gulch revisited: Another look at separating natural and mining-impacted contributions to instream metal load. Appl. Geochem. 2018, 95, 206–217. [Google Scholar] [CrossRef]
- Skierszkan, E.K.; Mayer, K.U.; Weis, D.; Beckie, R.D. Molybdenum and zinc stable isotope variation in mining waste rock drainage and waste rock at the Antamina mine, Peru. Sci. Total Environ. 2016, 550, 103–113. [Google Scholar] [CrossRef]
- Salifu, M.; Hallstrom, L.; Aiglsperger, T.; Alakangas, L. A simple model for evaluating isotopic (18O, 2H and 87Sr/86Sr) mixing calculations of mine—impacted surface waters. J. Contam. Hydrol. 2020, 232, 103640. [Google Scholar] [CrossRef]
- Lahmira, B.; Lefebvre, R.; Michel Aubertin, M.; Bussière, B. Effect of heterogeneity and anisotropy related to the construction method on transfer processes in waste rock piles. J. Contam. Hydrol. 2016, 184, 35–49. [Google Scholar] [CrossRef]
- Ethier, M.P.; Bussière, B.; Broda, S.; Aubertin, M. Three-dimensional hydrogeological modeling to assess the elevated-water-table technique for controlling acid generation from an abandoned tailings site in Quebec, Canada. Hydrogeol. J. 2018, 26, 1201–1219. [Google Scholar] [CrossRef]
- Gongzalez-Quiros, A.; Fernandez-Alvarez, J.P. Conceptualization and finite element groundwater flow modeling of a flooded underground mine reservoir in the Asturian Coal Basin, Spain. J. Hydrol. 2019, 578, 124036. [Google Scholar] [CrossRef]
- Tomiyama, S.; Igarashi, T.; Tabelin, C.B.; Tangviroon, P.; Ii, H. Modeling of the groundwater flow system in excavated areas of an abandoned mine. J. Contam. Hydrol. 2020, 230, 103617. [Google Scholar] [CrossRef]
- Tomiyama, S.; Igarashi, T.; Tabelin, C.B.; Tangviroon, P.; Ii, H. Acid mine drainage sources and hydrogeochemistry at the Yatani mine, Yamagata, Japan: A geochemical and isotopic study. J. Contam. Hydrol. 2020, 225, 103502. [Google Scholar] [CrossRef]
- Shimizu, H.; Matsunaga, E. Observations on the Tanosawa Veins at the Osarizawa Mine. J. MMIJ 1964, 14, 126–133, (In Japanese, with English abstract). [Google Scholar] [CrossRef]
- Takahashi, H.; Yasuda, K. Osarizawa Mine. J. MMIJ 1967, 83, 1640–1646. (In Japanese) [Google Scholar] [CrossRef]
- Saito, S. The Changes of a Community with the Decline of its Mining Industry–A Case of the Osarizawa Mining Industry Ltd. Ann. Tohoku Geogr. Assoc. 1979, 31, 1–7, (In Japanese, with English abstract). [Google Scholar] [CrossRef][Green Version]
- Abdi, H.; Williams, L.J. Principal component analysis. Wiley Interdisciplinary Reviews. Comput. Stat. 2010, 2, 433–459. [Google Scholar] [CrossRef]
- Barrio-Parra, F.; Izquierdo-Díaz, M.; Fernández-Gutiérrez del Álamo, L.J.; Biosca, B.; De Miguel, E. Modelling the Transference of Trace Elements between Environmental Compartments in Abandoned Mining Areas. Int. J. Environ. Res. Public Health 2020, 17, 5117. [Google Scholar] [CrossRef]
- Khaska, M.; La Salle CL, G.; Sassine, L.; Cary, L.; Bruguier, O.; Verdoux, P. Arsenic and metallic trace elements cycling in the surface water-groundwater-soil continuum down-gradient from a reclaimed mine area: Isotopic imprints. J. Hydrol. 2018, 558, 341–355. [Google Scholar] [CrossRef]
- Holland, H.D. The Chemistry of the Atomosphere and Oceans; Wiley: New York, NY, USA, 1978; p. 351. [Google Scholar]
- Walter, J.; Chesnaux, R.; Cloutier, V.; Gaboury, D. The influence of water/rock—water/clay interactions and mixing in the salinization processes of groundwater. J. Hydro. Reg. Stud. 2017, 13, 168–188. [Google Scholar] [CrossRef]
- Mizota, C.; Kusakabe, M. Spatial distribution of δD–δ18O values of surface and shallow groundwater from Japan, south Korea and east China. Geochem. J. 1994, 28, 387–410. [Google Scholar] [CrossRef]
- Dansgaard, W. Stable isotopes in precipitation. Tellus 1964, 16, 436–438. [Google Scholar] [CrossRef]
- Singer, P.C.; Stumm, W. Acidic mine drainage: The rate-determining step. Science 1970, 167, 1121–1123. [Google Scholar] [CrossRef] [PubMed]
- Moses, C.O.; Nordstrom, D.K.; Herman, J.S.; Mills, A.L. Aqueous pyrite oxidation by dissolved oxygen and ferric iron. Geochim. Cosmochim. Acta 1987, 51, 1561–1571. [Google Scholar] [CrossRef]


Publisher’s Note: MDPI stays neutral with regard to jurisdictional claims in published maps and institutional affiliations. |
© 2021 by the authors. Licensee MDPI, Basel, Switzerland. This article is an open access article distributed under the terms and conditions of the Creative Commons Attribution (CC BY) license (https://creativecommons.org/licenses/by/4.0/).