Article

Analysis of Soil As Pollution and Investigation of Dominant Plants in Abandon Gold Mining Area

1
School of Earth Science and Resources, Chang’an University, Xi’an 710054, China
2
School of Land Engineering, Shaanxi Key Laboratory of Land Consolidation, Key Laboratory of Degraded and Unused Land Consolidation Engineering, Ministry of Natural Resources of the People’s Republic of China, Chang’an University, Xi’an 710054, China
3
Shaanxi Provincial Land Engineering Construction Group, Xi’an 710075, China
*
Author to whom correspondence should be addressed.
Minerals 2022, 12(11), 1366; https://doi.org/10.3390/min12111366
Submission received: 6 September 2022 / Revised: 20 October 2022 / Accepted: 24 October 2022 / Published: 27 October 2022
(This article belongs to the Special Issue Mobility of Potentially Toxic Elements: Environmental Hazards)

Abstract

:
Soil arsenic (As) pollution in mining areas have seriously affected the surrounding environment and human health. To explore the degree of soil As contamination and phytoremediation strategies, a study was undertaken to identify suitable native plants for the phytoremediation in mining area. Geo-accumulation index and potential ecological risk index were sed to assess the As pollution degree. As content in dominant plants was analyzed by enrichment coefficient. The results show that (1) The pulp deposition area had the most serious As pollution of soil and the largest potential ecological risk index. (2) The composition of the plant community in the study area was dominated by herbaceous plants, among which gramineous, composites and legumes are the dominant plant types in the vegetation community restoration in the mining area. (3) The plant species diversity was lower in As polluted area. (4) The plants with strong As enrichment ability were Erigeron annuus (L.) Pers., Periploca sepium Bunge, and Setaria viridis (L.) Beauv., which can be considered as As-repair plants. This study can provide a basis and reference for phytoremediation and ecological restoration of As contamination in mining areas.

1. Introduction

Tailings have always been one of the main sources of environmental pollution caused by mining, especially metal mining [1]. The mining of minerals will lead to the diffusion of potential toxic elements (PTEs) in the environment [2,3]. When these minerals are mined, PTEs are transferred from the depths of the earth to the surface. As a result, their geo-chemical conditions are changed, and may become very active, which leads to an increased PTEs concentration [4] and causes pollution in soil. PTEs in the soil can lead to unfavorable effects on soil quality and productivity, endangering the health and well-being of humans via the food chain [5].
Arsenic (As) is a common element in Carlin-type gold deposits [6]. It is a non-essential element for the human body. As is highly toxic and carcinogenic. There are few natural As or As metal compounds in nature, and most of them are mixed in the form of sulfide in gold, copper, lead, zinc, tin, nickel, and cobalt ores [7]. It is a common concern of all countries in the world to strengthening the comprehensive management of the mine environment. The basis of PTEs pollution control of soil is the identification of pollution characteristics and environmental risk assessment [8]. On the other hand, the investigation and evaluation of the pollution degree of PTEs contaminated soil are helpful to understand the soil pollution status in the area [9,10], and provide a useful reference for the treatment and prevention of PTEs pollution of soil.
As is extremely harmful to humans and higher animals [11,12], and poses a serious threat to the ecological environment. Therefore, the restoration of As-contaminated soil is an urgent problem to be solved. Phytoremediation is an in-situ restoration technology. The appearance of the vegetation can not only protect the surface soil, but also reduce water and soil erosion. It can be applied to vegetation and landscape restoration of PTEs contaminated sites and the reclamation of mines [13]. Hyperaccumulator plants have been widely used in PTEs restoration research due to their remarkable ability to tolerate, enrich and transfer PTEs [14]. At present, the internationally reported As hyperaccumulators mainly include Pteris vittata L. [15,16], Pityrogramma calomelanos (L.) [17], Pteris cretica L. var. laeta (Wall.) C.Chr.et Tard. –Blot P. laete Wall. [18], Pteris cretica L. var. nervosa (Thunb.) Ching et S. H. Wu [19], P. ryukyuensis [20], etc. However, most of these plants grow in areas with sufficient water and are not suitable for water limited regions. So, it is very important to select As-tolerant plants whose habitat characteristics are compatible with the local environment. In addition, due to the limitations of hyperaccumulator, researchers currently have begun to pay attention to ordinary plants with great vitality, wide adaptability, and large aboveground biomass [21]. Various measures such as biological, chemical and physical, are taken to increase the effectiveness of PTEs in the soil to arouse and strengthen the absorption of PTEs by such plants [22]. For example, Cyperus papyrus L. [23], Buddleja officinalis Maxim., Anaphalis margaritacea (L.) Benth. et Hook. f., Amaranthus Paniculatus L. [24], willos [25] have also been shown to be resistant to As, which provides abundant species resources for phytoremediation of As-contaminated soil.
Usually, As-tolerant plants grow around As-contaminated fields. Plants can absorb As from soil and accumulate it in their bodies, especially plants growing in As-contaminated areas have strong tolerance to soil As pollution [26]. Phytoremediation should consider local features, plants communities and life-traits [27]. Although these enriched plants do not have the super-absorption and enrichment capacity of ferns such as Pteris vittata L., their habitat characteristics are compatible with the local environment, and they also have application value for the remediation of local As-contaminated soil. Thus, investigating plants growing in As-contaminated fields is one of the effective ways to find As-tolerant plants that are compatible with the local environment.
This paper aims to investigate plant communities in an abandoned gold mining area to determine their potential for phytoremediation of soil As pollution. The main objectives are: (i) to assess the soil As contamination degree and its potential ecological risk. (ii) to determine the plant diversity of plant communities in mining area. (iii) the selection of dominant plants suitable for the phytoremediation. The findings here are expected to provide a theoretical basis and suggestions for the treatment and restoration of As-contaminated soil in mining areas, the improvement of the local ecological environment, and the construction of beautiful and livable villages.

2. Materials and Methods

2.1. Study Area

The study area is located in the southeastern part of Shangluo City, Shaanxi Province, China (Figure 1). It is between 108°34′20″–111°1′25″ E and 33°2′30″–34°24′40″ N. The study area is located in the Qinling Mountains, which is on the diving line between North and South China and the 800 mm precipitation line. In the horizontal direction, there are transitional characteristics of two climatic zones, the southern part has a northern subtropical climate and the northern part has a warm temperate climate. The annual average temperature is 7.8–13.9 °C, the annual average precipitation is 696–830 mm, and the annual average sunshine duration is 1848–2055 h. The soil type in the south of Shangluo City is yellow cinnamon soil [28]. According to the types of ore-bearing wall rock, the study area can be divided into primary ores (pyrite type gold ore and arsenopyrite-pyrite type gold ore) and oxidized ores (limonite type gold ore). Arsenopyrite and mispickel are the main gold-bearing minerals, and gold is closely related to Ae, Fe, especially As element. The Gold Production Company in research area operated in 1993 until 2006, a dam failure occurred. In 2016, Shangluo City’s first comprehensive treatment project for PTEs pollution in farmland soil (area C) was launched. The project adopted “microorganism + phytoremediation” technology for PTEs pollution in farmland soil (area C), and the project was completed in 2018. According to the Chinese Soil Environmental Quality Risk Control Standard for Soil Contamination of Development Land [29] and the Soil Environmental Quality Risk Control Standard for Soil Contamination of Agricultural Land [30], the study area can be divided into three subregions with different types (Figure 1). Area A is a pulp deposition area belonging to category 2 development lands where abandoned sludge accumulates with high As content. Area B is a hillside belonging to category 1 development lands, which is the buffer zone between the sludge deposition area and sloping farmland. Area C is farmland, belonging to agricultural land.

2.2. Acquisition and Determine of Soil Data

According to the results of previous field investigations, the As content in soil in the mining area is mainly affected by human activities and shows a large difference. Fifty soil samples were collected (Figure 1). Four 1 kg topsoil samples (0–20 cm) were collected from each sampling site, and about 500 g soil samples were retained after mixing. Stones, plant residues, and other large debris were removed from each fresh sample, which was then mixed thoroughly and then stored in a labeled plastic bag. There were three members in the research group with unified training on the sampling method. A real-time kinematic (RTK) was used to precisely locate every sampling location. All samples were air-dried at room temperature. Small stones and plant residuals were manually removed and the soil samples were then run through a 0.15 mm sieve [31]. The samples were divided into two parts, one was used for chemical determination of pH and soil As content, the other was sealed for backup. As content in the soil was determined by the atomic fluorescence spectrometry (Haiguang AFS-9760 atomic fluorescence spectrophotometer) [32], and the detection limits was 0.01 mg·kg−1; the pH value of the soil was measured using a glass electrode pH meter with a soil/water ratio of 1:2.5 [33]. All reagents used in this study were high-purity reagents, and Chinese national standard soil samples were used for quality control. In the sample determination, one sample was randomly selected from each 10 samples as a parallel sample for detection. When the error between samples and their parallel samples was not more than 5%, it was judged to be qualified.

2.3. Acquisition and Determination of Plant Data

There were 23 vegetation survey samples of 16 square meters (4 m × 4 m) set up to investigated the composite of the plants. We used RTK to record the center point coordinates of the sampling party, and the sampling location is shown in Figure 1. We measured the number and average height of each plant in the sample square, and collected the dominant plants with whole individual. The names of the collected plants are shown in Table 1. The plant samples dried naturally after being washed. After 30 min of deactivation of fixating at 105 °C, then weighed to constant weight at 80 °C, crushed and passed through a 20-mesh nylon sieve [34]. Plant As content was determined by an atomic fluorescence spectrometry (Haiguang AFS-9760 atomic fluorescence spectrophotometer) [34], and the detection limit was 0.001 mg·kg−1. In the sample determination, one sample was randomly selected from each 10 samples as a parallel sample for detection. When the error between samples and their parallel samples was not more than 5%, it was judged to be qualified.

2.4. Evaluation of Pollution Degree

2.4.1. Index of Geo-Accumulation

The Igeo [35] can not only reflect the natural change characteristics of the distribution of PTEs, but also judge the impact of human activities on the environment. Calculated as follows:
I geo = log 2 ( C n / 1.5 B n )
where Igeo is the geo-accumulation index, Cn is the concentration of element (mg·kg1), and Bn is the background value of As in Shangluo city, Shaanxi province, China (mg·kg1), take the background value of 11.2 mg·kg1 [36] of As in Shaanxi Province as B n . Igeo are classified as shown in Table 2.

2.4.2. Potential Ecological Risk Index (PERI)

The PERI was proposed by the Swedish scientist Hakanson [37]. It is mainly used to evaluate the degree of PTEs pollution in the soil of the mining area. This method links the ecological effects, environmental effects and toxicology of PTEs together. It can not only reflect the impact of various pollutants in sediments on the environment in a particular environment, but also use a quantitative method to classify the potential harm of PTEs. PERI is currently the most widely used method in this type of research [38,39,40,41,42,43]. The calculation formula of PEIR of a single element is:
E i = T i × ( C i / S i )
where Ei is the potential ecological risk index, Ti is the toxicity response coefficient of element i, Ci is the measured concentration of PTEs (mg·kg1), and Si is the background value of Shangluo city, Shaanxi province, China (mg·kg1). Taking the background value of 11.2 mg·kg1 [36] and the toxicity response coefficient TAs = 10 [44]. The classification standards of PERI are shown in Table 2.

2.5. Calculation of Species Diversity Index

Species diversity index refers to the ratio of the number of species to that of individuals in a particular biological community, commonly employed to describe the structural characteristics of the community. Three indicators are involved to evaluate the plant species diversity: Sics Abundance Index (Margalef Index, R), Shannon-Wiener Index (H), Pielou species Evenness Index (E) [45]:
R = ( S 1 ) / lnN
H = i = 1 s ( P i lnP i )
E = H / lnS
where S is the total number of species in the community, N is the total number of individuals observed, and Pi is the proportion of individuals of species i to the total number of individuals in the community.

2.6. Bioaccumulation Factor (BCF)

BCF [46] is one of the most important indicators to measure the content of PTEs in plants. The calculation formula is:
BCF = C i / C S
where Ci is the content of PTEs in plants (mg·kg1), and Cs is the content of PTEs in the soil (mg·kg1).

2.7. Data Statistics and Analysis

All data were processed by EXCEL 2016 software. MATLAB 2017R software was used for statistical analysis and drawing.

3. Results

3.1. Descriptive Statistics

Table 3 provides the descriptive statistics of As contents and pH values of 50 sampling points and indicates that the average pH values of the soil in the whole study area were greater than 8.1, which was alkaline. The respective range of soil As content in the three areas were: 54.0–231.0 mg·kg1, 13.3–100.0 mg·kg1, and 16.1–41.5 mg·kg1. The average value of As in area A was 150.7 mg·kg1, indicating serious pollution, which was 1.08 times more than the intervention value of the second type land of development land. The average values of As in area B was 35.2 mg·kg1, indicating heavy pollution, which exceeded 1.41 times the soil pollution risk screening value of agricultural land. The average values of As in area C was 25.9 mg·kg1, indicating light pollution, which exceeded 1.03 times the soil pollution risk screening value of agricultural land. The coefficient of variation can be used to describe the degree of dispersion of the data values in the data set, which includes the average difference coefficient, the span coefficient, and the standard deviation coefficient. Due to the different pollution conditions in three regions, the average As content is not equal, which makes it impossible to compare the dispersion degree of each element through an absolute indicator such as standard deviation. Therefore, it is necessary to use the coefficient of variation to explain the dispersion degree. The standard deviation coefficient was selected in this paper. This is the ratio of the standard deviation of the group of data to the average value. The larger the value is, the more uneven the spatial distributions of the elements are. The coefficients of variation of soil As content in the six areas were ranked from large to small: B > A > C. Area B had the largest coefficient of variation and belonged to the strong variation type. It means that the As content in area B is unevenly distributed, and the source might be human activities.
Figure 2 shows the over-standard situation of soil points in the mining area. It can be seen intuitively in Figure 2 that all soil samples in area A exceeded the standard, and 10 points exceeded the control value; 10 samples in area B exceeded the risk filter value of soil As contamination of agricultural land, and there were 8 points in area C that exceed the risk filter value.

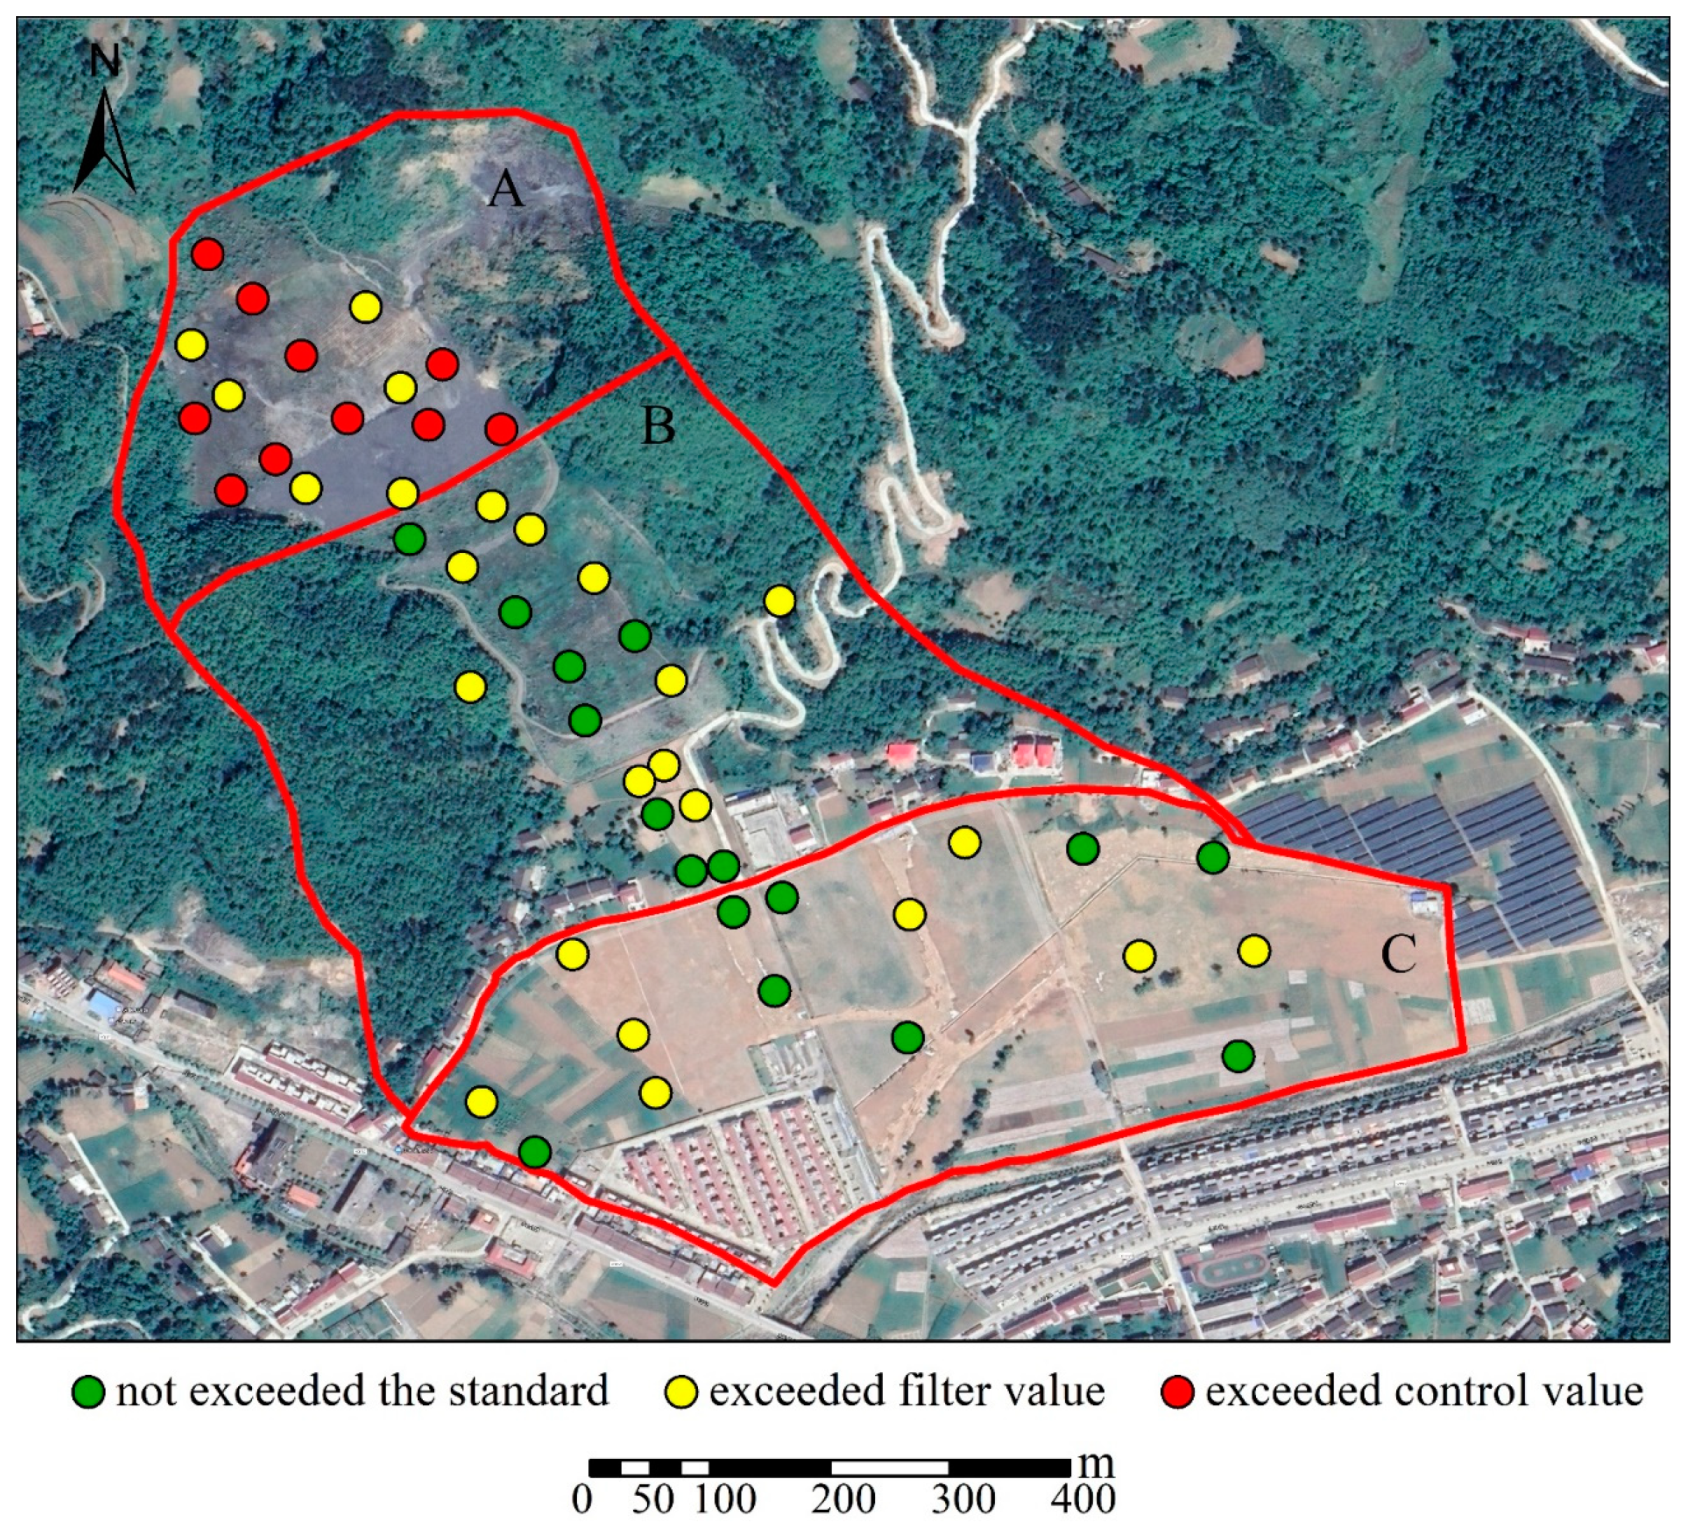
3.2. Evaluation of As Pollution Degree of Soil in Mining Area

3.2.1. Index of Geo-Accumulation

The calculation result is shown in Figure 3. Table 4 shows the Igeo values of different areas in the mining area. The Igeo values of As in the mining area ranged from −0.34 to 3.78, and the average value was 1.57, which is moderately polluted. The average value of the soil As pollution coefficient in each region from high to low is A > B > C. The As pollution in the soil of the area A was particularly serious. Among them, there were 11 points in area A that are heavily polluted accounting for 22% of all points, and 6 points in area B were heavily polluted accounting for 12% of all points. It suggests that area A may be the source of pollution for the entire study area and even the entire village, threatening the ecological environment of the surrounding area.

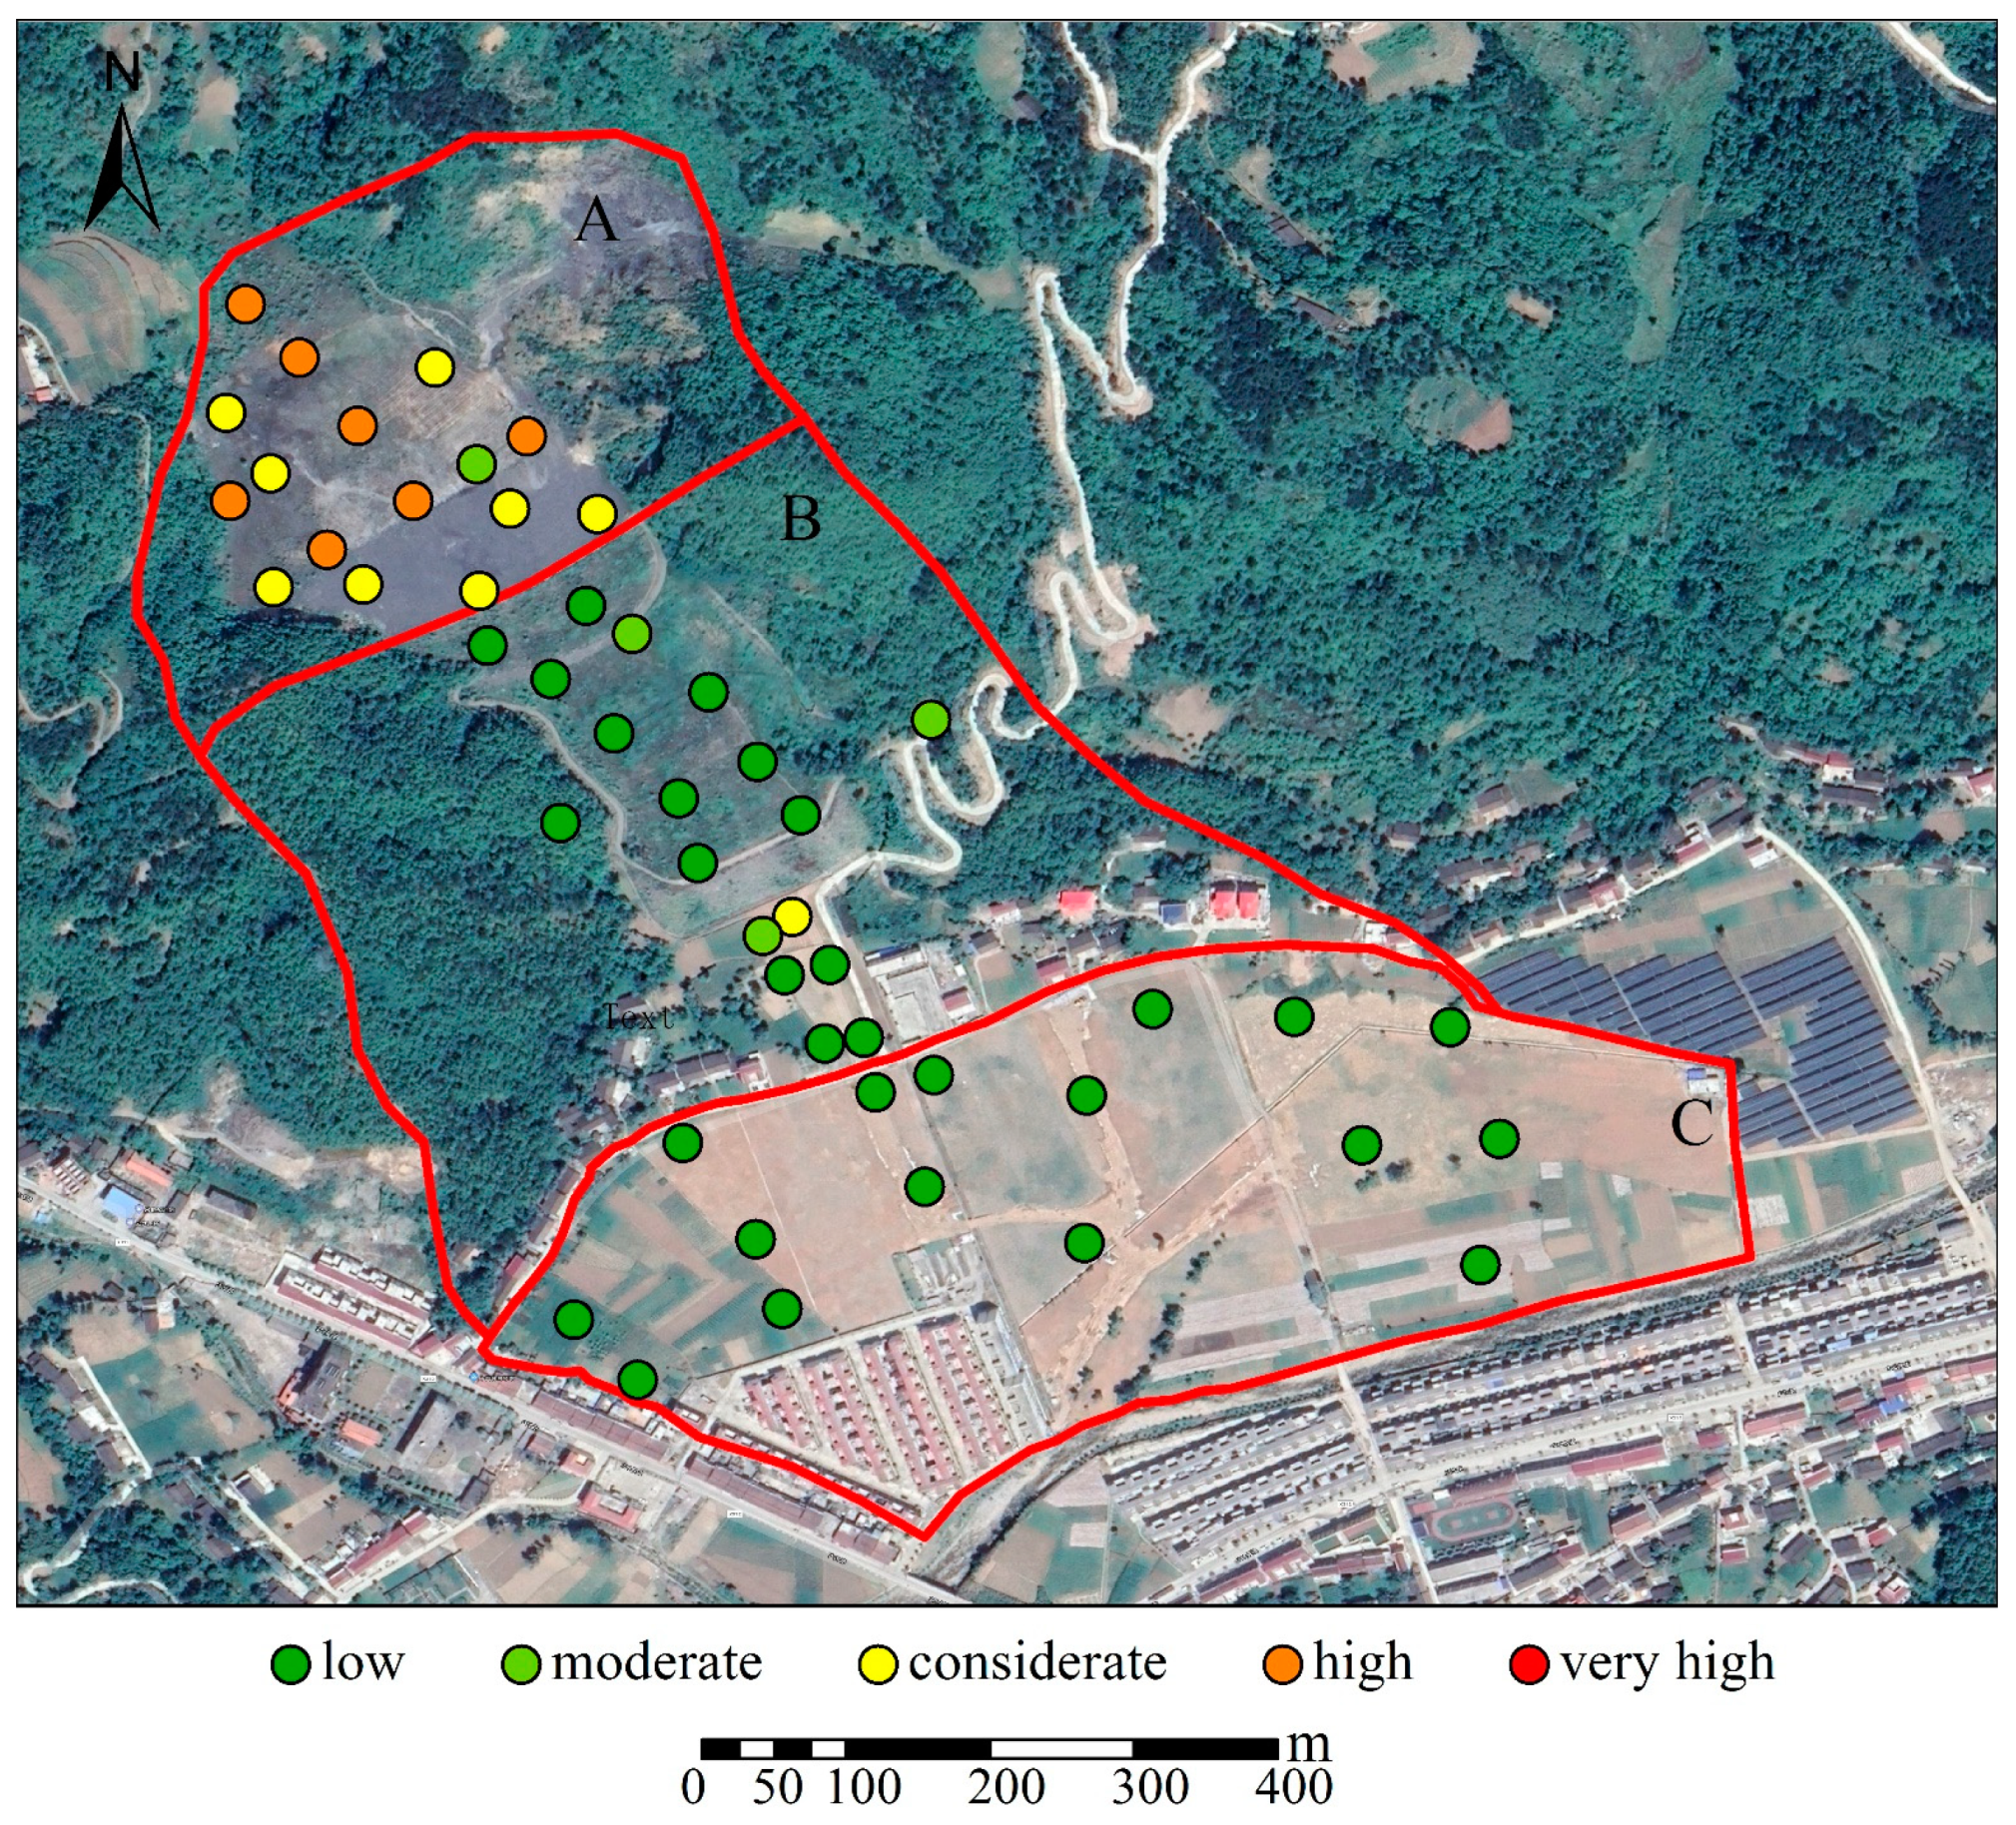
3.2.2. Potential Ecological Risk Assessment

Figure 4 shows the evaluation results of the PERI of soil As pollution in the mining area. It can be seen that 32% of the points belonged to considerate degree hazards, in which the proportion of high ecological risk reached 14% and all of them were in area A, indicating that the soil As pollution in area A has been considerably serious. Generally, places far away from on-site pollution sources have lower potential ecological risks. Area A is the closest area to the tailings dam break area, whose pollution is the most serious and the PERI was the largest. It is also an area most likely to bring potential ecological risk to surrounding regions. Area B is a hillside with low soil As content. But there is a certain ecological risk because of a small amount of residue. Area C has undergone artificial land treatments and a restoration project and thus having the lowest soil As content, and smallest PERI. Table 5 shows the PERI of soil As in the mining area. It can be seen that the PERI values of soil As content in the mining area ranged from 11.88–191.07 with an average value of 63.03, reaching a moderate degree of harm. The average value of PERI of As in each region decreased in the order of A > B > C, indicating that the ecological risk of As in the soil of the slurry deposition area (area A) reached considerate pollution degree. The PERI of soil As in hillsides and remediation fields was less than 40, showing a low pollution level.

3.3. Vegetation Composition and As Accumulation Characteristics

3.3.1. Vegetation Composition in the Mining Area

There were 20 families and 39 species of plants in the surveyed quadrat (Table 6). The plants in the survey area were mainly herbaceous, and the more abundant plants are Phragmites communis (Cav.) Trin. ex Steud., Imperata cylindrica (L.) Beauv., Setaria viridis (L.) Beauv., Macleaya cordata (Willd.) R. Br., Erigeron annuus (L.) Pers. and other herbaceous plants. There were fewer shrubs and less coverage with only Periploca sepium Bunge, Lespedeza bicolor Turcz. Sophora davidii (Franch.) Skeels. The arbors were mainly artificially planted Robinia pseudoacacia L., as well as seedlings of Ailanthus altissima and Periploca sepium Bunge.
According to the survey results, leguminous, gramineous and composite plants accounted for the majority of plant species. There were 6 species of Gramineae, accounting for 15% of the number of species, 8 species of compositae, accounting for 20% of the number of species, 9 species of Leguminosae accounting for 17.5% of the number of species, and other plant species account for the largest number of species. 49.5%. Clearly, as the dominant plant types in the early stage of natural succession of vegetation communities in the mining area, gramineous, composite and leguminous plants play an important role in the process of vegetation restoration at this stage.
According to vegetation survey information such as the number of species, the number of individuals, and the distribution characteristics, the Sics Abundance Index, Shannon-Wiener Index and Pielou Evenness Index of the plant community are calculated to quantitatively reflect the species diversity characteristics of the plant community. The result is shown in Figure 5. The range of Sics Abundance Index was from 0.454 to 1.838 with an average value of 1.067. The range of Shannon-Wiener Index was from 0.857 to 1.833 with an average value of 1.244. The range of Pielou Evenness Index was from 0.450 to 0.921 with an average value of 0.697. In general, the vegetation composition in the study area is relatively simple. Plant species diversity is a comprehensive evaluation index of species richness and species uniformity, which reflect the stability of the community. The greater the diversity of the community is, the better the stability of the community is, and vice versa. The mining area was in the early stage of natural succession in vegetation restoration after the tailings dam broke. Thus, the species diversity was small and the stability of the vegetation community was poor.

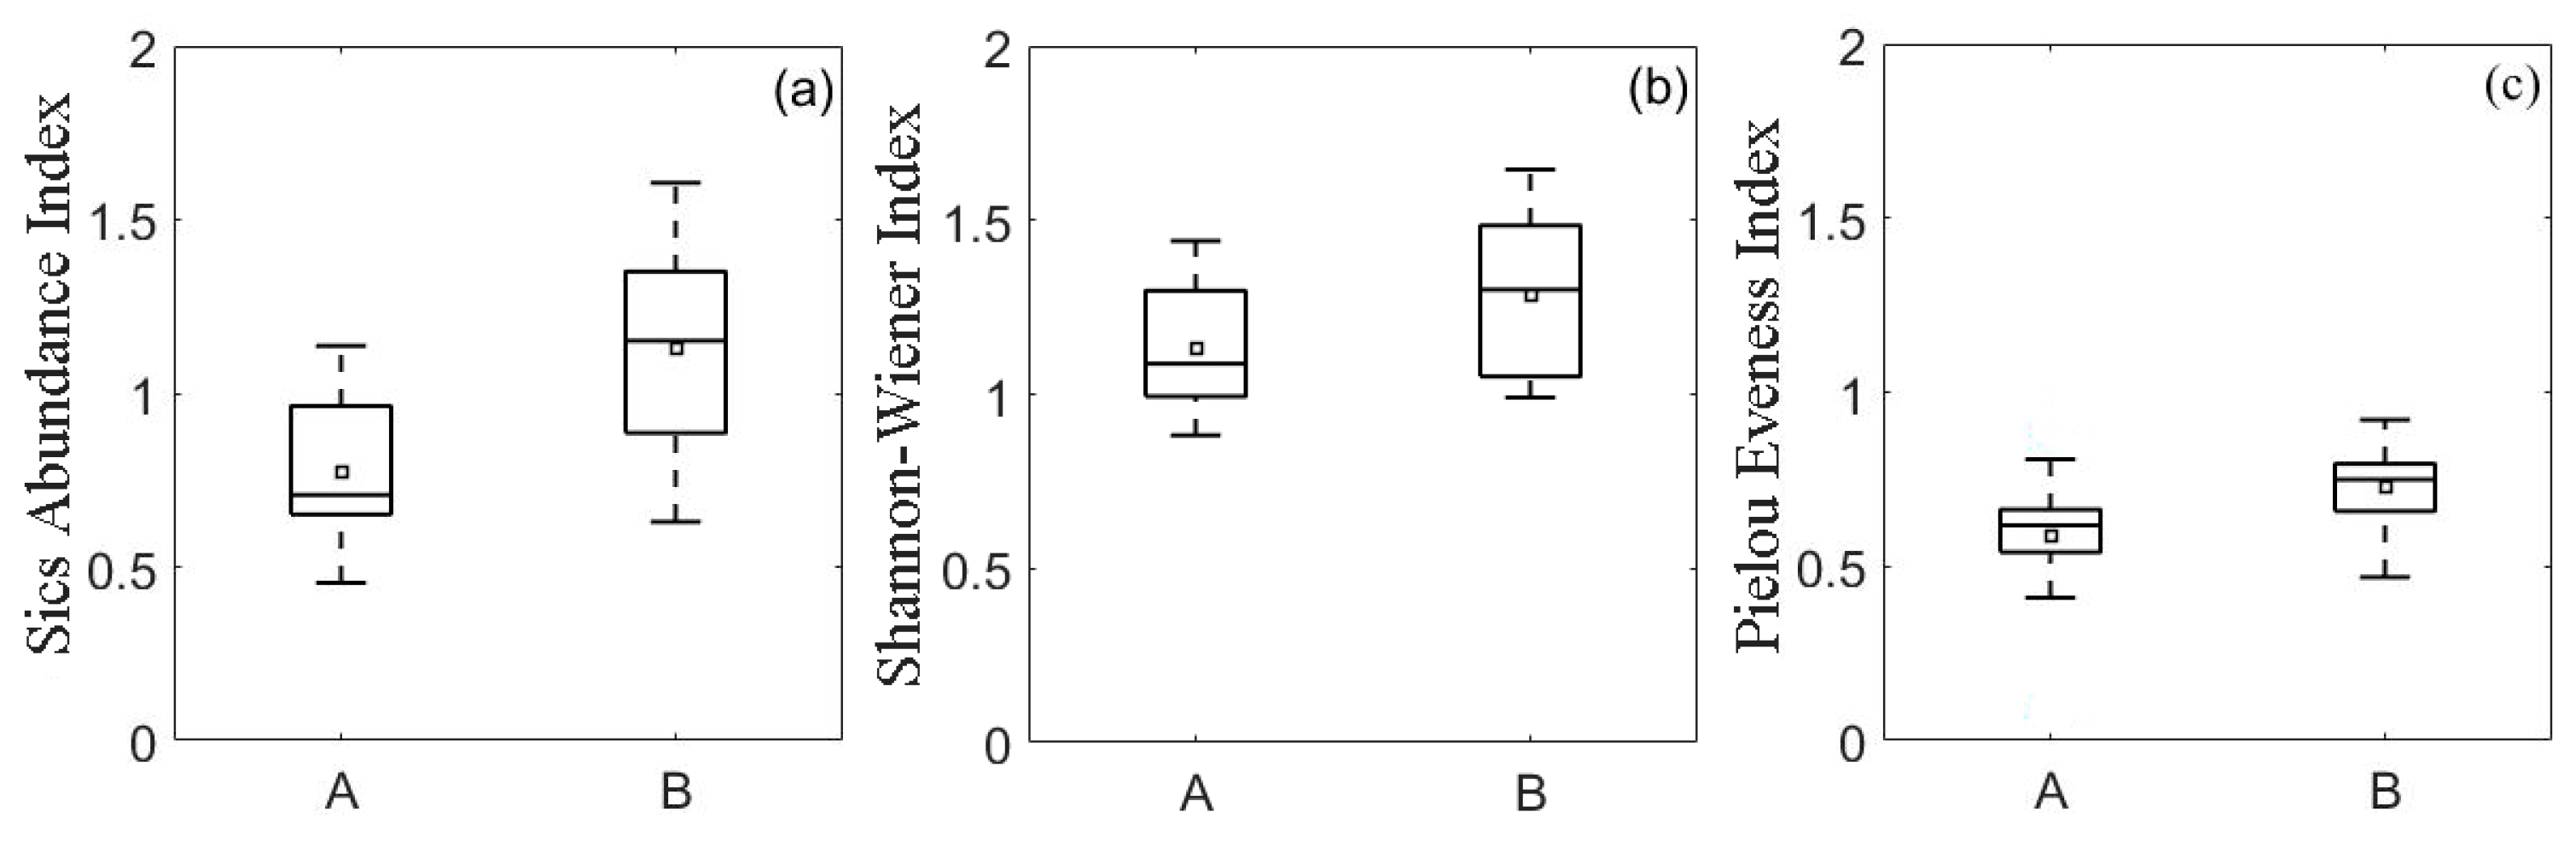
3.3.2. Correlation between Species Diversity Index and Soil As Pollution Degree

The analysis of the species diversity index of the plant samples showed that the Sics Abundance Index, Shannon-Wiener Index and Pielou Evenness Index in the severely As-polluted areas (area A) was 1.018, 1.211 and 0.674 respectively, and in the non-As-polluted areas (area B) was 1.129, 1.287 and 0.726 respectively. It suggests that the vegetation species diversity of As-contaminated soil is less than that of uncontaminated soil, which means that the stability of vegetation community in polluted soil is worse than that of unpolluted soil. The Pearson correlation analysis results of the plant species diversity index of contaminated soil and the corresponding accumulation index (Table 7) showed that the accumulation index of As pollution had a significant negative correlation with the plant species diversity at the level of 0.05, and the correlation coefficient was −0.498, −0.423, −0.465 respectively.

3.3.3. Enrichment Characteristics of As in Dominant Plants

In the pulp deposition area, the As content of the soil was relatively high, the plant species are few with poor growth status, and most of them are relatively short. The dominant species include: Periploca sepium Bunge, Robinia pseudoacacia L., Phragmites communis (Cav.) Trin. ex Steud., Setaria viridis (L.) Beauv., Imperata cylindrica (L.) Beauv., Erigeron annuus (L.) Pers. The As content of hillside soil was low, and there are many kinds of plants with lush growth, whose height are relatively high. The dominant species include: Periploca sepium Bunge, Medicago Sativa Linn, Erigeron annuus (L.) Pers., Aster subulatus Michx., etc. After remediation measures such as ex-situ stabilization and stabilized backfilling, the As content of the remediation field soil has been relatively low. There are many types of plants in the remediation field. However, no crops have been planted since it is still in the recovery period. The dominant species include: Solanum nigrum L., Digitaria sanguinalis (L.) Scop., Chenopodium album L., Polygonum L., Setaria viridis (L.) Beauv., Macleaya cordata (Willd.) R. Br., etc. The dominant plants from area A and area B were collected and brought back to the laboratory to determine the As content. The results are shown in Table 8. The range of As content in plants in A area is 1.1–15.9 mg·kg1, with an average value of 6.8. The range of As content in plants in area B is 0.1–0.8 mg·kg1, with an average value of 0.3 mg·kg1. Among these dominant plants, the plants with strong As accumulating ability are Erigeron annuus (L.) Pers., Periploca sepium Bunge, Setaria viridis (L.) Beauv., Phragmites communis (Cav.) Trin. ex Steud., with BCF of 0.107, 0.050, 0.047, and 0.036, respectively. The enrichment coefficient is not large, indicating that As is not easy to migrate from the soil to the plants and be enriched.

4. Discussion

4.1. Potential Analysis of Phytoremediation

Phytostabilization refers the techniques that use metal-tolerant plants to reduce soil metal(loid) through adsorption and/or precipitation in plant, which is a common method of phytoremediation [47]. Dominant plants with phytostabilization potential are of great value for vegetation restoration in contaminated mining areas In this study, we collected the dominant plant samples in the mining area, and calculated the enrichment factors. The results showed that the enrichment factors of Erigeron annuus (L.) Pers, Setaria viridis (L.) Beauv. and Periploca sepium Bunge for As were 0.107, 0.050 and 0.047 respectively, which indicated that they could adapt to the environment of As pollution and had a certain tolerance to As. Erigeron annuus (L.) Pers. and Setaria viridis (L.) Beauv. belong to compositae and gramineae respectively. These plants have developed roots, strong reproductive capacity, and strong ability to absorb soil water and nutrients. Some studies have shown that Setaria viridis (L.) Beauv. has a strong tolerance to soil As pollution [48]. Therefore, Setaria viridis (L.) Beauv. can be considered as phytostabilization material. Erigeron annuus (L.) Pers [49], Periploca sepium Bunge [50] are common weeds with strong vitality, which have strong adaptability to soil environmental stress. Once settled, they can quickly cover the surface, form dense roots underground, and improve the surrounding habitat. At the same time, Periploca sepium Bunge can provide favorable conditions for the settlement of other species and accelerate the process of vegetation restoration [51]. These plants can be used to improve the quality of soil environment and benefit to the ecological reconstruction in the mining area.
Qinling Mountains is rich in species resources. The suitable climate conditions offer beneficial assistance for vegetation restoration in the mining area. Although the dominant plant species change little in 2019 and 2020, the vegetation coverage and growth in 2020 are better than that in 2019 at the same time in different years (Figure 6). Among them, Erigeron annuus (L.) Pers., Periploca sepium Bunge and Setaria viridis (L.) Beauv., are dominant species with good growth status, strong fecundity and large number, and can enrich As in soil. According to the local climate environment and soil conditions, the selection of dominant plants that can enrich As to control As pollution is conducive to repairing the chain ecological damage caused by mining, restoring the mine ecological environment, accelerating the process of vegetation restoration, and promoting the sustainable development of the ecological environment in the mining area. In addition, the dominant plants screened in this experiment can be used as alternative plants for remediation of As pollution in mining area soil, laying a foundation for the next pollution remediation experiment of the project team.

4.2. Limitations and Future Work

In the evaluation of soil As pollution, due to the diversity of protection objects, exposure methods and standards, there are certain differences in soil environmental quality standard systems in various countries. Therefore, the evaluation standards for the degree of soil As pollution are also different in different regions, and there is no unified background value standard. Using different background values for the same object, such as national soil element background values, local soil element background values or national soil environmental quality risk values, will lead to different results. The soil As pollution in this study area is also the same. The calculation results of the national soil As element background value and the national soil environmental quality As risk value are not the same, and there is currently no unified regulation.
In addition, due to the limitations of research time and cost, we only analyzed the soil As pollution degree of an abandoned gold mine in Shangluo City and initially investigated the plant diversity and As content of the abandoned mine area. Compared with the same type of research, the plant samples are relatively single because of the small research area. In terms of As analysis in plants, the difference in the enrichment of As in various parts of the plant has not been analyzed. Further, the harm of As to the environment is not only related to the total content, but also to the speciation and migration characteristics [52]. In future research, it is possible to appropriately increase the number of quadrats to analyze soil As speciation and enrichment in various parts of the plant. Further work needs to be done to select the dominant plant species for ecological restoration in mining areas through plant biomass and its effects on As enrichment and transfer. Pot experience could be conducted to explore the mechanism of As impact on plants (to quantify the impact of soil As pollution on plant physiological growth), and the remediation effect of dominant plants on soil As pollution in mining areas. Eventually, these research results may provide a basis for the ecological management of As contaminated areas.

5. Conclusions

The As pollution of soil in metal mining areas and their surrounding areas has been highly concerned by countries all over the world, which has become a hot issue studied by scholars. In this study, we conducted an investigation on soil As pollution and vegetation status in an abandoned gold mining area in Shaanxi Province. The main conclusions are as follows:
(1) Among the 50 sample points measured, 48% of the points’ As contents exceeded the risk value of soil environmental quality, 20% of the points’ As contents exceeded the control value, and all of which were located in area A.
(2) The average Igeo indicating the moderate pollution degree, and the pollution degree in area A is the most serious; The average value of the soil As PERI suggests the moderate ecological risk. The PERI of area A was the largest. It is also an important factor that causes the overall potential ecological risk of the site and threatens the ecological environment of the surrounding area.
(3) The vegetation composition in the study area is relatively simple and the composition of the plant community was dominated by herbaceous plants. Gramineae, composite, and leguminous plants are the dominant plant types in the restoration of vegetation communities in this mining area. The average value of the Sics Abundance Index, Shannon-Wiener Index, Pielou Evenness Index was 1.067, 0.244 and 0.697 respectively, and the plant species diversity in area A was smaller than area B.
(4) Different plants have great differences in As accumulation capacity. Periploca sepium Bunge, Phragmites communis (Cav.) Trin. ex Steud., Setaria viridis (L.) Beauv., and Erigeron annuus (L.) Pers. can be considered as As-tolerant plants used in the next step of restoration experimental research. This result has important guiding significance for the restoration and reconstruction of the vegetation ecosystem in the mining area.

Supplementary Materials

The following supporting information can be downloaded at: https://www.mdpi.com/article/10.3390/min12111366/s1, Table S1: Risk filter and control values for soil contamination of agricultural land (mg·kg1); Table S2: Risk filter and control values for soil contamination of development land (mg·kg1).

Author Contributions

Conceptualization, L.H., and R.C.; Data curation, L.H.; Formal analysis, R.C. and Z.L.; Funding acquisition, L.H.; Investigation, L.H., R.C., Z.L. and Y.Z. (Yunmeng Zhai); Methodology, R.C.; Project administration, L.H.; Resources, R.L., L.X., Y.Z. (Yonghua Zhao), and Z.L.; Software, R.C., Y.Z. (Yunmeng Zhai) and L.X.; Supervision, Z.L., R.L., L.X. and Y.Z. (Yonghua Zhao); Validation, Y.Z. (Yonghua Zhao) and R.L.; Visualization, R.C. and Y.Z. (Yunmeng Zhai); Writing—original draft, R.C.; Writing—review and editing, Z.L., Y.Z. (Yunmeng Zhai), L.X., R.L., and Y.Z. (Yonghua Zhao). All authors have read and agreed to the published version of the manuscript.

Funding

This work was supported by the funding from the Key Laboratory of Degraded and Unused Land Consolidation Engineering, Ministry of Natural Resources of the People’s Republic of China (Program No. SXDJ2017-9), and the Shaanxi Key Laboratory of Land Reclamation Engineering: (Program No. 2018-ZZ03).

Data Availability Statement

Not applicable.

Acknowledgments

We are grateful to the editor and anonymous reviewers whose comments have helped to clarify and improve the text.

Conflicts of Interest

The authors declare no conflict of interest.

References

  1. Wang, J.X.; Xing, Y.; Li, P.; Xia, J.C.; Liu, T.; Feng, X.B. Chemically-assisted phytoextraction from metal(loid)s-polluted soil at a typical Carlin-type gold mining area in southwest China. J. Clean. Prod. 2018, 189, 612–619. [Google Scholar] [CrossRef]
  2. Luo, G.F.; Han, Z.W.; Xiong, J.; He, Y.P.; Liao, J.H.; Wu, P. Heavy metal pollution and ecological risk assessment of tailings in the qinglong dachang antimony mine, China. Environ. Sci. Pollut. Res. 2021, 28, 33491–33504. [Google Scholar] [CrossRef] [PubMed]
  3. Teng, Y.; Liu, L.; Zheng, N.; Liu, H.; Wu, L.; Yue, W. Application of different indices for soil heavy metal pollution risk assessment comparison and uncertainty: A case study of a copper mine tailing site. Minerals 2022, 12, 1074. [Google Scholar] [CrossRef]
  4. Xiao, T.F.; Hong, B.; Yang, Z.H.; Yang, F. Hydrogeochemistry of arsenic and its environmental effects. Bull. Geol. Sci. Technol. 2001, 1, 71–76. (In Chinese) [Google Scholar]
  5. Liu, B.; Ai, S.; Zhang, W.; Huang, D.; Zhang, Y. Assessment of the bioavailability, bioaccessibility and transfer of heavy metals in the soil-grain-human systems near a mining and smelting area in NW China. Sci. Total Environ. 2017, 609, 822–829. [Google Scholar] [CrossRef]
  6. Large, R.R.; Maslennikov, V.V. Invisible gold paragenesis and geochemistry in pyrite from orogenic and sediment-hosted gold deposits. Minerals 2020, 10, 339. [Google Scholar] [CrossRef] [Green Version]
  7. Han, D.; Li, X.; Wang, M.; Liang, S. Spatial contamination and potential ecological risk assessment of heavy metals in farmland soil around nonferrous metal smeltery in north China. Minerals 2021, 11, 1357. [Google Scholar] [CrossRef]
  8. Bourliva, A.; Papadopoulou, L.; Aidona, E.; Giouri, S.K.; Vourlias, G. Characterization and geochemistry of technogenic magnetic particles (TMPs) in contaminated industrial soils: Assessing health risk via ingestion. Geoderma 2017, 295, 86–97. [Google Scholar] [CrossRef]
  9. Liang, J.H.; Liu, P.P.; Chen, Z.; Sun, G.X.; Li, H. Rapid evaluation of arsenic contamination in paddy soils using field portable X-ray fluorescence spectrometry. J. Environ. Sci. 2018, 64, 345–351. [Google Scholar] [CrossRef] [PubMed]
  10. Yuan, X.H.; Xue, N.D.; Han, Z.G. A meta-analysis of heavy metals pollution in farmland and urban soils in China over the past 20 years-science direct. J. Environ. Sci. 2021, 101, 217–226. [Google Scholar] [CrossRef] [PubMed]
  11. Alka, S.; Shahir, S.; Ibrahim, N.; Ndejiko, M.J.; Manan, F.A. Arsenic removal technologies and future trends: A mini review. J. Clean. Prod. 2020, 278, 123805. [Google Scholar] [CrossRef]
  12. Zheng, Y. Global solutions to a silent poison. Science 2020, 368, 818–819. [Google Scholar] [CrossRef]
  13. Manoj, S.R.; Karthik, C.; Kadirvelu, K.; Arulselvi, I.; Rajkumar, M. Understanding the molecular mechanisms for the enhanced phytoremediation of heavy metals through plant growth promoting rhizobacteria: A review. J. Environ. Manag. 2020, 254, 109779. [Google Scholar] [CrossRef]
  14. Cui, X.Q.; Zhang, J.W.; Wang, X.T.; Pan, M.H.; Lin, Q.; Khan, K.Y.; Yan, B.B.; Li, T.Q.; He, Z.L.; Yang, X.E.; et al. A review on the thermal treatment of heavy metal hyperaccumulator: Fates of heavy metals and generation of products. J. Hazard. Mater. 2021, 405, 123832. [Google Scholar] [CrossRef] [PubMed]
  15. Ma, K.; Shi, X.; You, X.G.; Liu, J.L. Relationship of the heavy metal distribution in sediments to vegetion diversity and macroinvertebrate communities in riparian wetlands. Acta Ecol. Sin. 2021, 41, 2001–2010. (In Chinese) [Google Scholar]
  16. Chen, T.B.; Wei, C.Y.; Huang, Z.C.; Huang, Q.F.; Lu, Q.G.; Fan, Z.L. Arsenic hyperaccumulator plant Pteris vittata L. and its arsenic accumulation characteristics Chin. Sci. Bull. 2002, 47, 207–210. (In Chinese) [Google Scholar] [CrossRef]
  17. Meharg, A.A. Variation in arsenic accumulation: Hyperaccumulation in ferns and their allies. New Phytol. 2003, 157, 25–31. [Google Scholar] [CrossRef] [PubMed]
  18. Wei, C.Y.; Chen, T.B.; Huang, Z.C.; Zhang, X.Q. Cretan Brake (Pteris cretica L.): An arsenic-accumulating plant. Acta Ecol. Sin. 2002, 22, 777–778. (In Chinese) [Google Scholar]
  19. Yan, H.L.; Gao, Y.W.; Wu, L.L.; Wang, L.Y.; Zhang, T.; Dai, C.H.; Xu, W.X.; Feng, L.; Ma, M.; Zhu, Y.G.; et al. Potential use of the Pteris vittata arsenic hyperaccumulation-regulation network for phytoremediation. J. Hazard. Mater. 2019, 368, 386–396. [Google Scholar] [CrossRef] [PubMed]
  20. Srivastava, M.; Ma, L.Q.; Santos, J.A.G. Three new arsenic hyperaccumulating ferns. Sci. Total Environ. 2006, 364, 24–31. [Google Scholar] [CrossRef]
  21. Wang, H.J.; Cui, S.P.; Wu, D.M.; Yang, X.Y.; Wang, H.B.; Wang, Z.Z. Effects of kinetin on arsenic speciation and antioxidative enzymes in fronds of the arsenic hyperaccumulator Pteris cretica var. nervosa and non-hyperaccumulator Pteris ensiformis. Environ. Exp. Bot. 2021, 191, 104622. [Google Scholar] [CrossRef]
  22. Zhang, N.M.; Xia, Y.S.; Chen, B.D.; Zhang, X.; Bao, L.; Lu, W.H.; Xue, X.R.; Qin, T.F.; Zhong, X.; Wang, X.Y.; et al. Mycorrhiza and Iron Chemical Remediation of Arsenic Contaminated Soil; Science Press: Beijing, China, 2019. [Google Scholar]
  23. Nateewattana, J.; Trichaiyaporn, S.; Saeouy, M.; Nateewattana, J.; Thavornyutikarnm, P.; Choonluchanon, S.; Pengchai, P. Phytoremediation of arsenic in submerged soil by wetland plants. Int. J. Phytorem. 2011, 13, 35–46. [Google Scholar] [CrossRef]
  24. Rodriguez-Lado, L.; Sun, G.; Berg, M.; Zhang, Q.; Xue, H.; Zheng, Q.; Johnson, C.A. Groundwater arsenic contamination throughout China. Science 2013, 341, 866–868. [Google Scholar] [CrossRef]
  25. Zou, X.L.; Zhou, Y. Arsenic (As) uptake, accumulation and translation by willows in wetlands. J. Jiangxi Univ. Sci. Technol. 2004, 35, 7–12. (In Chinese) [Google Scholar]
  26. Bali, A.S.; Sidhu, G.P.S. Arsenic acquisition, toxicity and tolerance in plants-from physiology to remediation: A review. Chemosphere 2021, 283, 131050. [Google Scholar] [CrossRef]
  27. Guarino, G.; Zuzolo, D.; Marziano, M.; Baiamonte, G.; Morra, L.; Benotti, D.; Gresia, D.; Stacu, E.R.; Cicchella, D.; Sciarrillo, R. Identification of native-metal tolerant plant species in situ: Environmental implications and functional traits. Sci. Total Environ. 2019, 650, 3156–3167. [Google Scholar] [CrossRef]
  28. Xi, C.F.; Zhu, K.G.; Zhou, M.Z.; Du, G.H.; Li, X.R.; Zhang, S.Y.; Yang, B.Q.; Hou, C.Q.; Tang, J.C.; Zhou, C.H. Soil of China; Chinese Agriculture Press: Beijing, China, 1998. [Google Scholar]
  29. GB 15618-2018; Soil Environmental Quality–Risk Control Standard for Soil Contamination of Agricultural Land. Ministry of Ecology and Environment of the People’s Republic of China: Beijing, China, 2018. Available online: http://www.mee.gov.cn/ywgz/fgbz/bz/bzwb/trhj/201807/t20180703_446029.shtml (accessed on 6 June 2018).
  30. GB 36600-2018; Soil Environmental Quality–Risk Control Standard for Soil Contamination of a Development Land. Ministry of Ecology and Environment of the People’s Republic of China: Beijing, China, 2018. Available online: https://www.mee.gov.cn/ywgz/fgbz/bz/bzwb/trhj/201807/t20180703_446027.shtml (accessed on 22 June 2018).
  31. HJ/T 166-2004; The Technical Specification for Soil Environmental Monitoring. Ministry of Ecology and Environment of the People’s Republic of China: Beijing, China, 2004. Available online: https://www.mee.gov.cn/ywgz/fgbz/bz/bzwb/jcffbz/200412/t20041209_63367.shtml (accessed on 9 December 2004).
  32. HJ 680-2013; Soil and Sediment—Determination of Mercury, Arsenic, Selenium, Bismuth, Antimony—Microwave Dissolution/Atomic Fluorescence Spectrometry. Ministry of Ecology and Environment of the People’s Republic of China: Beijing, China, 2013. Available online: https://www.mee.gov.cn/ywgz/fgbz/bz/bzwb/jcffbz/201312/t20131203_264304.shtml (accessed on 21 November 2013).
  33. HJ 962-2018; Soil—Determination of pH—Potentiometry. Ministry of Ecology and Environment of the People’s Republic of China: Beijing, China, 2019. Available online: https://www.mee.gov.cn/ywgz/fgbz/bz/bzwb/jcffbz/201808/t20180815_451430.shtml (accessed on 1 January 2019).
  34. DB61T902.5-2013; Determination of Heavy Mental in Plant Extract-Determination of Arsenic. Inspection and Quarantine of Shaanxi Province: Xi’an, China, 2013. Available online: http://219.144.196.28/std/db_details.asp?id=133 (accessed on 1 May 2014).
  35. Müller, G. Index of geoaccumulation in sediments of the Rhine River. Geojournal 1969, 2, 108–118. [Google Scholar]
  36. Li, K.; Peng, M.; Yang, Z.; Yang, K.; Liu, F.; Zhao, C.D.; Cheng, X.M.; Ma, H.H.; Guo, F.; Tang, S.Q.; et al. Trace metals pollution and health risks for planning area soils of 193 Chinese cities. Environ. Sci. 2020, 41, 1825–1837. (In Chinese) [Google Scholar]
  37. Hakanson, L. An ecological risk index for aquatic pollution control. A sedimentological approach. Water Res. 1980, 14, 975–1001. [Google Scholar] [CrossRef]
  38. Xiao, R.; Guo, D.; Amjsd, A.L.; Mi, S.S.; Liu, T.; Ren, C.Y.; Li, R.H.; Zhang, Z.Q. Accumulation, ecological-health risks assessment, and source apportionment of heavy metals in paddy soils: A case study in Hanzhong, Shaanxi, China. Environ. Pollut. 2019, 248, 349–357. [Google Scholar] [CrossRef] [PubMed]
  39. Lin, W.T.; Wu, K.M.; Lao, Z.L.; Wei, W.; Lin, Y.L.; Fan, H.B.; Hu, J.J. Assessment of trace metal contamination and ecological risk in the forest ecosystem of dexing mining area in northeast Jiangxi Province, China. Ecotoxicol. Environ. Saf. 2019, 167, 76–82. [Google Scholar] [CrossRef] [PubMed]
  40. Joanna, B.K.; Ryszard, M.; Michał, G.; Tomasz, Z. Pollution indices as useful tools for the comprehensive evaluation of the degree of soil contamination-a review. Environ. Geochem. Health 2018, 40, 2395–2420. [Google Scholar] [CrossRef] [Green Version]
  41. Jaime, T.G.; Isabel, G.M.; Eduardo, S.; Manuel, A.B.; Catherine, T.; Elvira, A.D.; Anna, A.P.; Alexander, N. Advanced determination of the spatial gradient of human health risk and ecological risk from exposure to As, Cu, Pb, and Zn in soils near the ventanas industrial complex (Puchuncaví, Chile). Environ. Pollut. 2020, 258, 113388. [Google Scholar] [CrossRef]
  42. Amphalop, N.; Suwantarat, N.; Prueksasit, T.; Chokchai, Y.; Sarawut, S. Ecological risk assessment of arsenic, cadmium, copper, and lead contamination in soil in e-waste separating household area, Buriram Province, Thailand. Environ. Sci. Pollut. Res. 2020, 27, 44396–44411. [Google Scholar] [CrossRef] [PubMed]
  43. Liu, G.; Shi, Y.; Tian, H.J.; Li, H.; Zhang, L.; Niu, J.J.; Guo, G.L.; Zhang, C. Soil pollution characteristics and ecological risk assessment of As at a large-scale arsenic slag-contaminated site. Environ. Sci. 2018, 39, 5639–5646. [Google Scholar] [CrossRef]
  44. Shao, H.Q.; Zhang, Y.W.; Qu, C.; Li, W.H.; Zhao, Y.J.; Cai, H.M.; Wu, C.D.; Liu, J.M.; Liu, M. Analysis of heavy metal contamination in the soil and enrichment capabilities of terrestrial plants around a typical vanadium smelter area. Chin. J. Eng. 2020, 42, 302–312. (In Chinese) [Google Scholar]
  45. Ma, L.; Komar, K.; Tu, C.; Zhang, W.H.; Cai, Y.; Kennelley, E.D. A fern that hyperaccumulates arsenic. Nature 2001, 411, 438. [Google Scholar] [CrossRef]
  46. Wei, S.H.; Zhou, Q.X.; Wang, X.; Zhang, K.S.; Guo, G.L. A newly discovered cadmium hyperaccumulator plant Solanum nigrum L. Chin. Sci. Bull. 2004, 49, 2568–2573. [Google Scholar] [CrossRef]
  47. Verbruggen, N.; Hermans, C.; Schat, H. Molecular mechanisms of metal hyperaccumulation in plants. New Phytol. 2009, 181, 759–776. [Google Scholar] [CrossRef]
  48. Lu, J.Z.; Lu, H.W.; Li, J.; Liu, J.; Feng, S.S.; Guan, Y.L. Multi-criteria decision analysis of optimal planting for enhancing phytoremediation of trace heavy metals in mining sites under interval residual contaminant concentrations. Environ. Pollut. 2019, 255, 113255. [Google Scholar] [CrossRef]
  49. Fu, S.; Wei, C.Y.; Li, L.H. Characterizing the accumulation of various heavy metals in native plants growing around an old antimony mine. Hum. Ecol. Risk Assess. Int. J. 2014, 22, 882–898. [Google Scholar] [CrossRef]
  50. Wang, X.; Xia, J.B.; Cao, X.B. Physiological and ecological characteristics of Periploca sepium Bunge under drought stress on shell sand in the Yellow River Delta of China. Sci. Rep. 2020, 10, 9567. [Google Scholar] [CrossRef] [PubMed]
  51. Liang, X.M.; Zhang, X.P. Perip selocapium bge—A muli-purpose native tree. Mod. Agric. Sci. 2008, 12, 43–55. (In Chinese) [Google Scholar]
  52. Dedic, J.; Djokic, J.; Galjak, J.; Milentijevic, G.; Lazarevic, D.; Šarkočević, Ž.; Lekic, M. An experimental investigation of the environmental risk of a metallurgical waste deposit. Minerals 2022, 12, 661. [Google Scholar] [CrossRef]
Figure 1. Study area and the distribution of soil sampling points; (AC) means the land use types, the pulp deposition area (A), the hillside (B), and the remediation field (C).
Minerals 12 01366 g001
Figure 2. Excess situation of soil As content in mining area. Note: the filter and control value are provided in Supplementary Tables S1 and S2.
Minerals 12 01366 g002
Figure 3. Soil As pollution degree in mining area.
Minerals 12 01366 g003
Figure 4. Potential ecological risk degree of soil As pollution in mining area.
Minerals 12 01366 g004
Figure 5. Vegetation Species diversity index in area A and B. (a) means Sics Abundance Index, (b) means Shannon-Wiener Index, (c) means Pielou Evenness Index.
Minerals 12 01366 g005
Figure 6. Comparison of vegetation coverage at the same location in the study area in 2019 (left) and 2020 (right).
Minerals 12 01366 g006
Table 1. Sampling area and sample types.
Sampling AreaTypes of Samples Collected
The pulp deposition area (A)Soil samples, Periploca sepium Bunge, Robinia pseudoacacia L., Phragmites communis (Cav.) Trin. ex Steud., Setaria viridis (L.) Beauv., Imperata cylindrical (L.) Beauv., Erigeron annuus (L.) Pers.
The hillside (B)Soil samples, Ailanthus altissima, Macleaya cordata (Willd.) R. Br., Periploca sepium Bunge, Medicago Sativa Linn, Erigeron annuus (L.) Pers., Aster subulatus Michx., Solanum nigrum L., Digitaria sanguinalis (L.) Scop., Polygonum L., Chenopodium album L.
The remediation field (C)Soil samples.
Table 2. Pollution degree classification based on Igeo and PERI.
IgeoPollution DegreeEiPollution Degree
Igeo ≤ 0unpollutedEi < 40low
0 < Igeo ≤ 1unpolluted to moderately polluted40 ≤ Ei < 80moderate
1 < Igeo ≤ 2moderately polluted80 ≤ Ei < 160considerate
2 < Igeo ≤3moderately to heavily polluted160 ≤Ei < 320high
3 < Igeo ≤ 4heavily pollutedEi ≥ 320very high
4 < Igeo ≤ 5heavily to extremely polluted
5 < Igeo ≤ 6extremely polluted
Table 3. As concentrations (mg·kg1) and pH values of soil samples in different areas.
Site TypeItemMaxMinMeanCoefficient of
Variation
Risk Filter Value Ratio
Mining areaAAs (mg·kg1)231.054.0150.70.37602.51
pH8.98.08.4
BAs (mg·kg1)100.013.335.20.71251.41
pH8.67.58.2
CAs (mg·kg1)41.516.125.90.28251.03
pH8.47.58.1
Note: The detail information of risk filter and control are provided in Supplementary Tables S1 and S2.
Table 4. Result of soil As accumulation index in the mining area.
Sampling AreaIgeo
MaxMinAverage
A3.781.683.04
B2.57−0.341.06
C1.30−0.060.62
Table 5. Results of PERI of soil As in mining area.
Sampling AreaPERI
MaxMinAverage
A191.0748.21134.55
B89.2911.8831.44
C37.0514.3823.11
Table 6. Dominant plant species and characteristics.
FamilyFormal NameGrowth Form
Leguminosae Medicago L.perennial herb
Robinia pseudoacacia L.macrophanerophyte
Lespedeza bicolor Turcz.shrub
Sophora davidii (Franch.) Skeelsshrub
Melilotus officinalis (L.) Pall.perennial herb
Kummerowia striata (Thunb.) Schindl.annual herb
Medicago Sativa Linnperennial herb
GramineaePhragmites communis (Cav.) Trin. ex Steud.perennial herb
Setaria viridis (L.) Beauv.annual herb
Imperata cylindrica (L.) Beauv.perennial herb
Digitaria sanguinalis (L.) Scop.annual herb
Arthraxon hispidus (Thunb.) Makinoannual herb
Eriochloa villosa (Thunb.) Kunthannual herb
CompositaeAster subulatus Michx.annual herb
Erigeron annuus (L.) Pers.annual herb
Bidens pilosa L.annual herb
Artemisia carvifolia Buch.-Ham. ex Roxb. Hort. Beng.annual herb
Ageratina Adenophora (Spreng.) R.M. King et H.Rob.perennial herb
Sonchus arvensis L.perennial herb
Inula japonica Thunb.perennial herb
Artemisia argyiperennial herb
SolanaceaeSolanum nigrum L. therophyte
EquisetaceaeEquisetum ramosissimum Desfperennial herb
AsclepiadaceaePeriploca sepium Bungeshrub
Simaroubaceae DC.Ailanthus altissimamacrophanerophyte
ChenopodiaceaeChenopodium album L.perennial herb
PolygonaceaePolygonum L.perennial herb
Rubiaceae Juss.Rubia cordifolia L.perennial herb
MoraceaeHumulus scandens (Lour.) Merr.perennial herb
Papaveraceae Juss.Macleaya cordata (Willd.) R. Br.perennial herb
ValerianaceaePatrinia scabiosifolia Fisch. ex Trevir.perennial herb
LabiataeMentha haplocalyx Briq.perennial herb
Pteridaceae E. D. N. Kirchn.Pteris vittata L.,Pteridophyta
Violaceae BatschViola philippicaperennial herb
Table 7. Correlation between vegetation species diversity index and As pollution index.
IndexCorrelation Coefficient
Sics Abundance Index−0.498 *
Shannon-Wiener Index−0.423 *
Pielou Evenness Index−0.465 *
Note: * is a significant correlation at the 0.05 level.
Table 8. As content of plant–soil (mg·kg1) and BCF.
AreaPlant SpeciesPlant As Content (mg·kg1)Soil As Content (mg·kg1)BCF
APeriploca sepium Bunge9.6192.00.050
Robinia pseudoacacia L.1.682.80.020
Phragmites communis (Cav.) Trin. ex Steud.7.2126.00.036
Setaria viridis (L.) Beauv.4.9105.00.047
Imperata cylindrica (L.) Beauv.1.1135.00.008
Erigeron annuus (L.) Pers.15.9149.00.107
BPeriploca sepium Bunge0.214.00.011
Artemisia carvifolia Buch.-Ham. ex Roxb. Hort. Beng0.143.10.002
Erigeron annuus (L.) Pers.0.219.90.009
Aster subulatus Michx.0.138.50.002
Ailanthus altissima0.427.60.012
Macleaya cordata (Willd.) R. Br.0.221.00.010
Solanum nigrum L.0.319.80.013
Digitaria sanguinalis (L.) Scop.0.537.80.013
Chenopodium album L.0.831.90.024
Polygonum L.0.533.20.016
Publisher’s Note: MDPI stays neutral with regard to jurisdictional claims in published maps and institutional affiliations.

