Abstract
Loading and unloading stress paths play critical roles in investigating the deformation and failure of roadway excavation. In this study, tests under four different loading and unloading stress paths were conducted on red sandstone samples, with the aid of a self-developed true triaxial test system. Meanwhile, the deformation and failure characteristics of the samples were monitored during the tests. The following research conclusions were obtained: The octahedral shear stress is linearly correlated with the average effective stress, and the correlation coefficient R2 is 0.9825. The Mogi–Coulomb strength criterion is superior to the Drucker–Prager strength criterion in reflecting strength failure characteristics of red sandstone during loading and unloading. Shear failure tends to occur under uniaxial compression, whereas shear–tensile composite failure occurs under loading and unloading conditions. Compared with the true triaxial loading test, loading and unloading tests produce a larger strain in the unloading direction. Under loading and unloading stress paths, with the increase in intermediate principal stress (IPS), the strain in the direction of IPS gradually changes from expansion to compression, and the peak strength gradually increases. The state of IPS affects the failure strength of the sample and reflects the strengthening effect of IPS. This paper boasts a certain value and significance for research on the deformation and failure characteristics of sandstone in the actual in situ stress environment with triaxial dynamic changes.
1. Introduction
The underground rock mass is in the original rock stress state before mining. Due to the existence of tectonic stress, the stress of rock mass in a stratum is generally in the true triaxial state () [1,2]. The excavation of rock mass in hydropower, transportation, mining [3,4,5,6,7,8,9], and other projects leads to dynamic changes in three independent axial stress components in surrounding rock, which is reflected in various forms of loading and unloading. The traditional conventional triaxial test does not accurately reflect the complex stress path problem of triaxial dynamic changes. Therefore, research on the law of rock mechanical properties under true triaxial loading and unloading stress paths can faithfully reflect changes of the triaxial stress state of rock, thereby revealing the failure mechanism of underground rock excavation.
Some researchers have begun to develop true triaxial test systems. Mogi [10] was the first to successfully develop a true triaxial test machine that was applicable to rock. In recent years, a large number of indoor true triaxial tests have been conducted [11,12,13,14,15,16,17,18,19,20]. For example, Haimson and Chang [21,22] developed a new true triaxial test system and obtained that an increase in the intermediate principal stress (IPS) could enhance the strength of rock. Based on numerous triaxial test data, Al-Ajmi and Zimmerman [23] found that the octahedral strength criterion achieved an ideal fitting effect, and they called it the Mogi–Coulomb strength criterion. Oda et al. [24] studied the quantitative relationship between damage propagation and permeability changes in granite in paddy fields. He et al. [25] conducted an experimental study on the rockburst process of deep, high-stressed granite and analyzed the frequency spectra of acoustic emission (AE) signals to obtain the frequency amplitude relationship diagram of AE signals during rockburst. Cao et al. [26] explored the fracturing behavior and seismic response of naturally fractured coal under true triaxial stress and hydraulic fracturing. Lu et al. [27], Li et al. [28,29], Shi et al. [30], Zhang et al. [31], and Chen et al. [32] also conducted similar studies. Ma et al. [33] applied through a novel loading path, which maintains a constant Lode angle throughout the test.
Thus far, researchers have paid much attention to the effect of IPS on rock deformation. Xu and Geng [34] investigated the effect of stress path on rock deformation. To obtain working conditions that are more in line with actual projects, researchers have carried out true triaxial loading and unloading tests. With the aid of the AE technology, Xiang et al. [35] experimentally researched the two paths of roadway surrounding rock excavation and support and concluded that the absolute energy parameter in AE could quantitatively describe the brittle failure of hard rock. Du et al. [36,37] characterized the crack initiation and expansion process through AE and infrared radiation. Later, the test on IPS extended from rock materials to other materials such as sand [38] and coal [39], and the test conditions covered a wide range from normal temperature to high temperature [40,41]. After reviewing some strength criteria, including IPS, You [42] proposed a new criterion. Zhang [43] proposed a generalized 3D Hoek–Brown criterion to modify the generalized Hoek–Brown strength criterion. Priest [44] and Wu et al. [45,46] also conducted similar studies. In the study of true triaxial loading and unloading of rocks, Pettitt [47] investigated the mechanics of microcrack damage induced under true-triaxial unloading. The results show that the mechanics of the cracking fits neither a mode I tensile nor shear soume, but a combination of the two. Huang et al. [48] investigated the characteristics of brittle failure and stress drop under triaxial loading and unloading. Cheng [49] also conducted similar studies.
Years of research have led scholars to shed light on the basic law of loading and unloading failure. However, loading and unloading stress paths are generally applied with a fixed confining pressure, during which IPS changes discontinuously. Obviously, this loading method is inconsistent with the actual underground space stress conditions. The strength variation characteristics and failure criteria of rock under complex stress paths with continuous and dynamic IPS change still need to be further explored. In this study, loading and unloading tests were conducted on red sandstone under four stress paths. Based on the test results, the influence of continuous IPS changes on the deformation characteristics of red sandstone was discussed, and the failure criteria of red sandstone under four stress paths were explored. It is verified that the Mogi–Coulomb criterion is suitable for true triaxial loading tests and also has a good linear relationship for rock strength under true triaxial continuous loading and unloading conditions.
2. Experimental Plan
2.1. Test Materials and Instruments
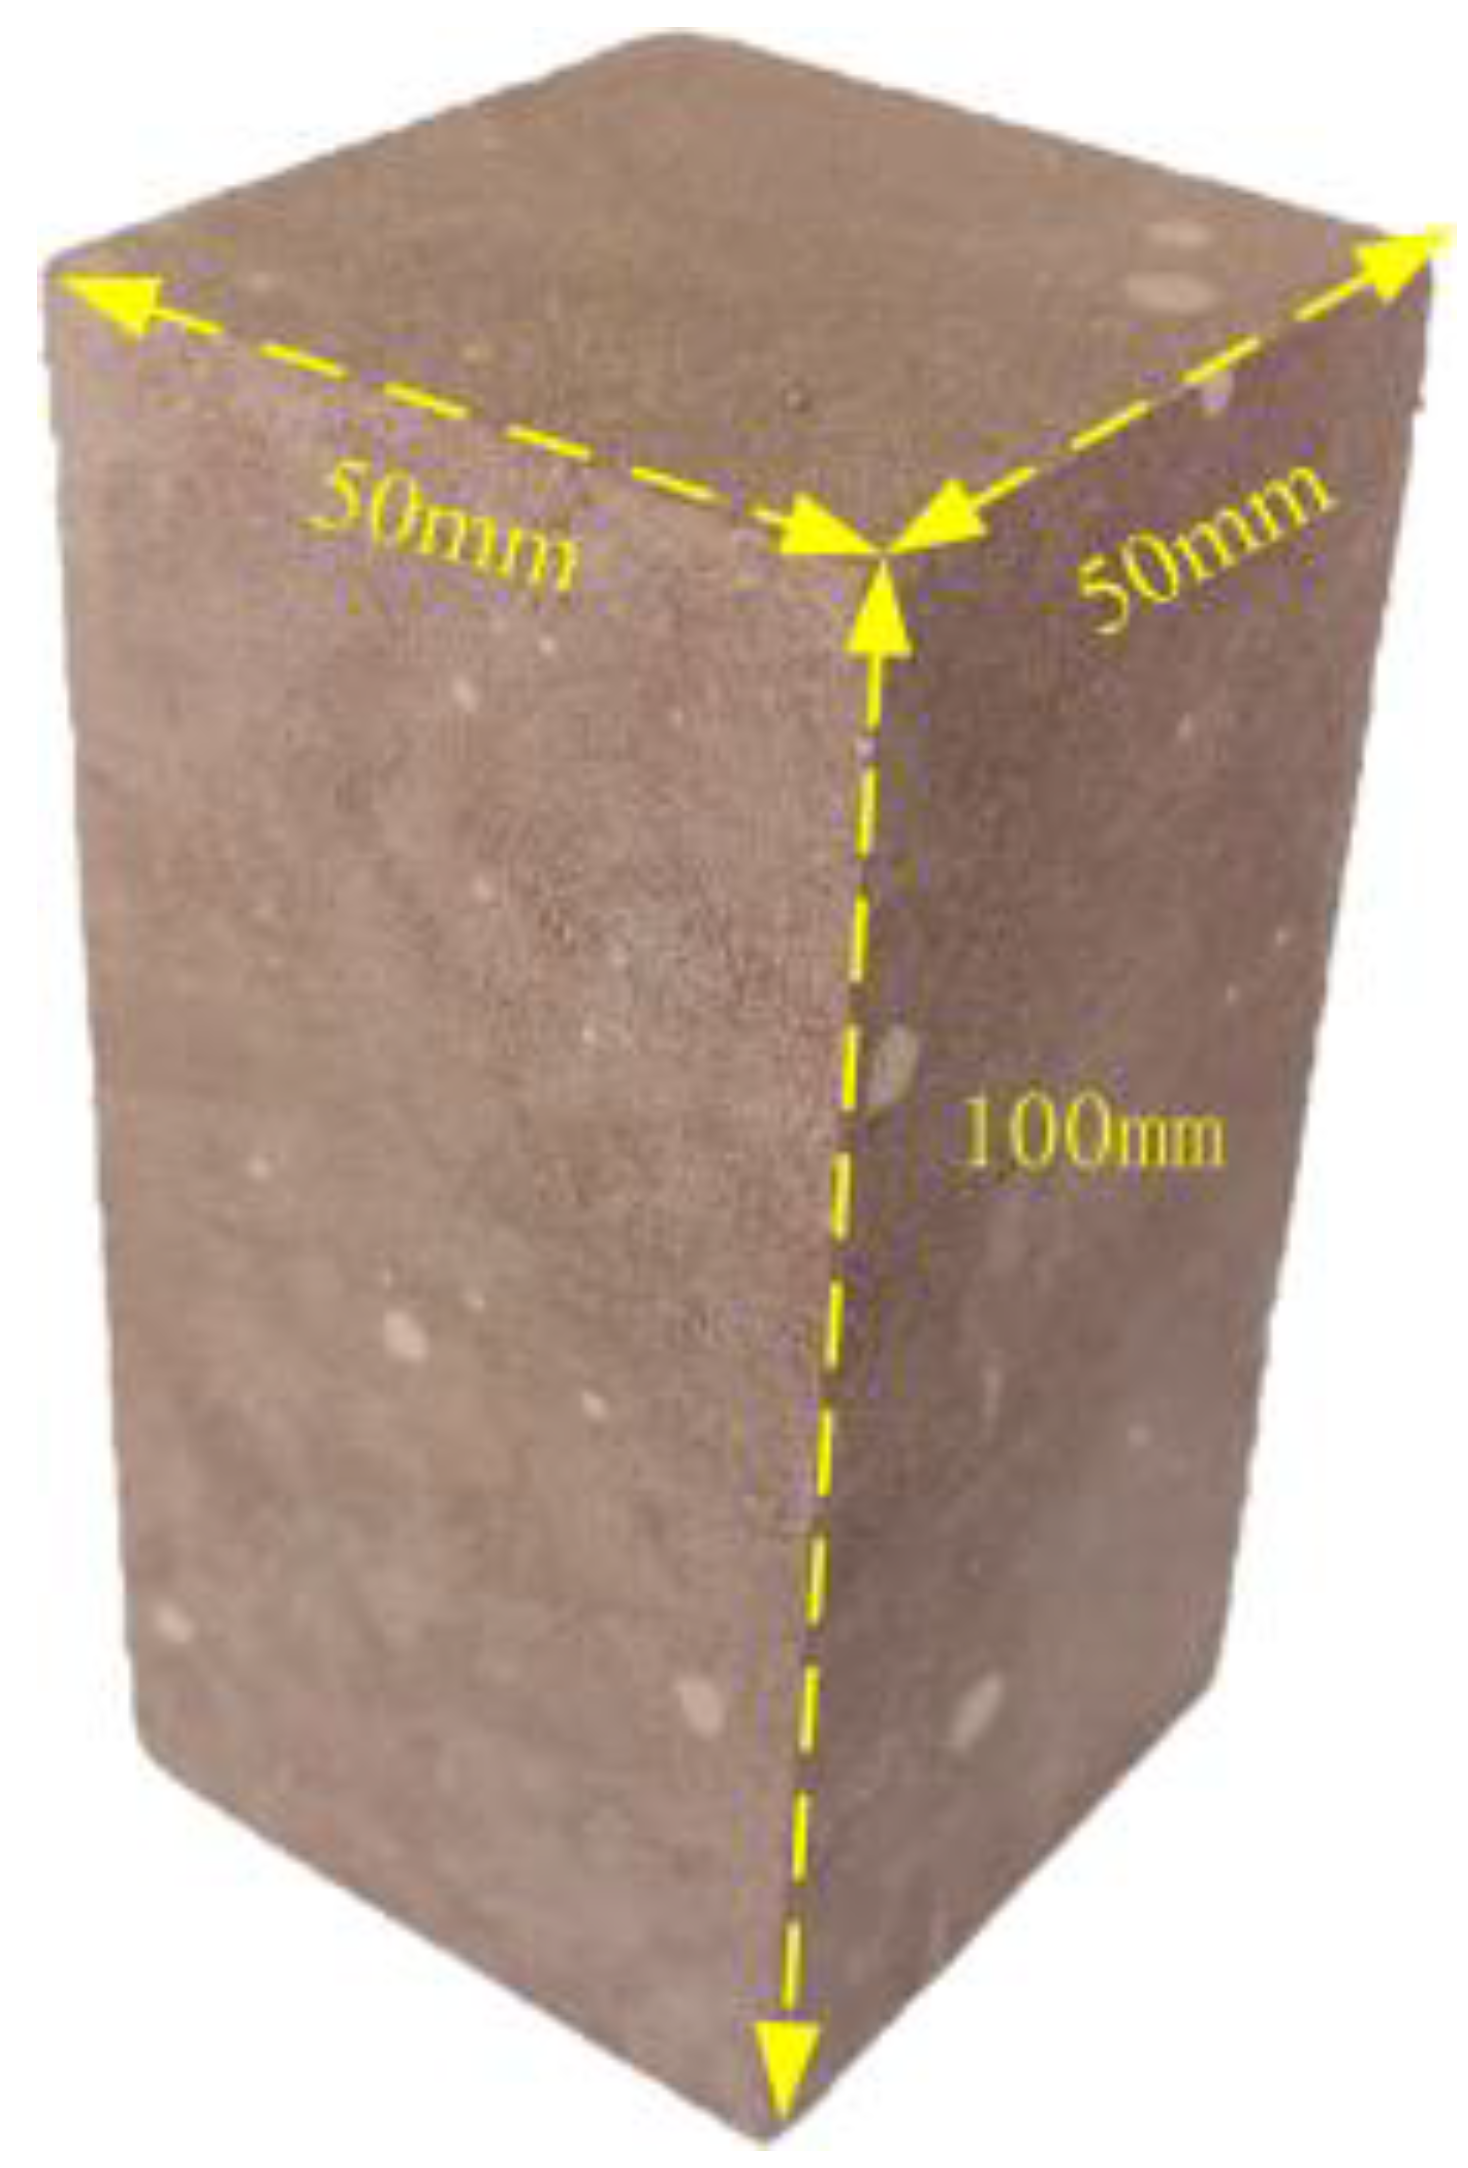
The specimens used in the present study were red sandstone collected from Junan County, Linyi City, Shandong Province, China. They belonged to the Wangshi and Qingshan groups of Mesozoic Cretaceous and were medium grained, with particle sizes of 0.1–0.35 mm and a compact block structure. Their macro-uniformity was consistent, and the average density was approximately 2450 kg/m3. In addition, their initial porosities ranged from 6.2 % to 8.4 %, with the mean value being ca. 7.3 %. According to the results of X-ray diffraction analysis, the main mineral components of the red sandstone were feldspar (ca. 48.5 %), quartz (ca. 12.6 %), kaolinite (ca. 10.5 %), chlorite (ca. 9.2 %), and others (ca. 19.2 %, consisted of illite, smectite, calcite, and siderite) [27]. It was processed to 50 mm × 50 mm × 100 mm samples, and the sample size was designed in this way, with reference to previous literature [12,27,28,41,50,51]. The surfaces of the samples were carefully ground and polished smooth and flat. A total of 12 samples were prepared and equally divided into 4 groups for this test. The photo of a sample is shown in Figure 1. Detailed information about the test samples is presented in Table 1, and the measurement results of the basic mechanical parameters of red sandstone are given in Table 2.

Figure 1.
Red sandstone sample.

Table 1.
Detailed information about the test samples.
Table 2.
Mechanical parameters of red sandstone.
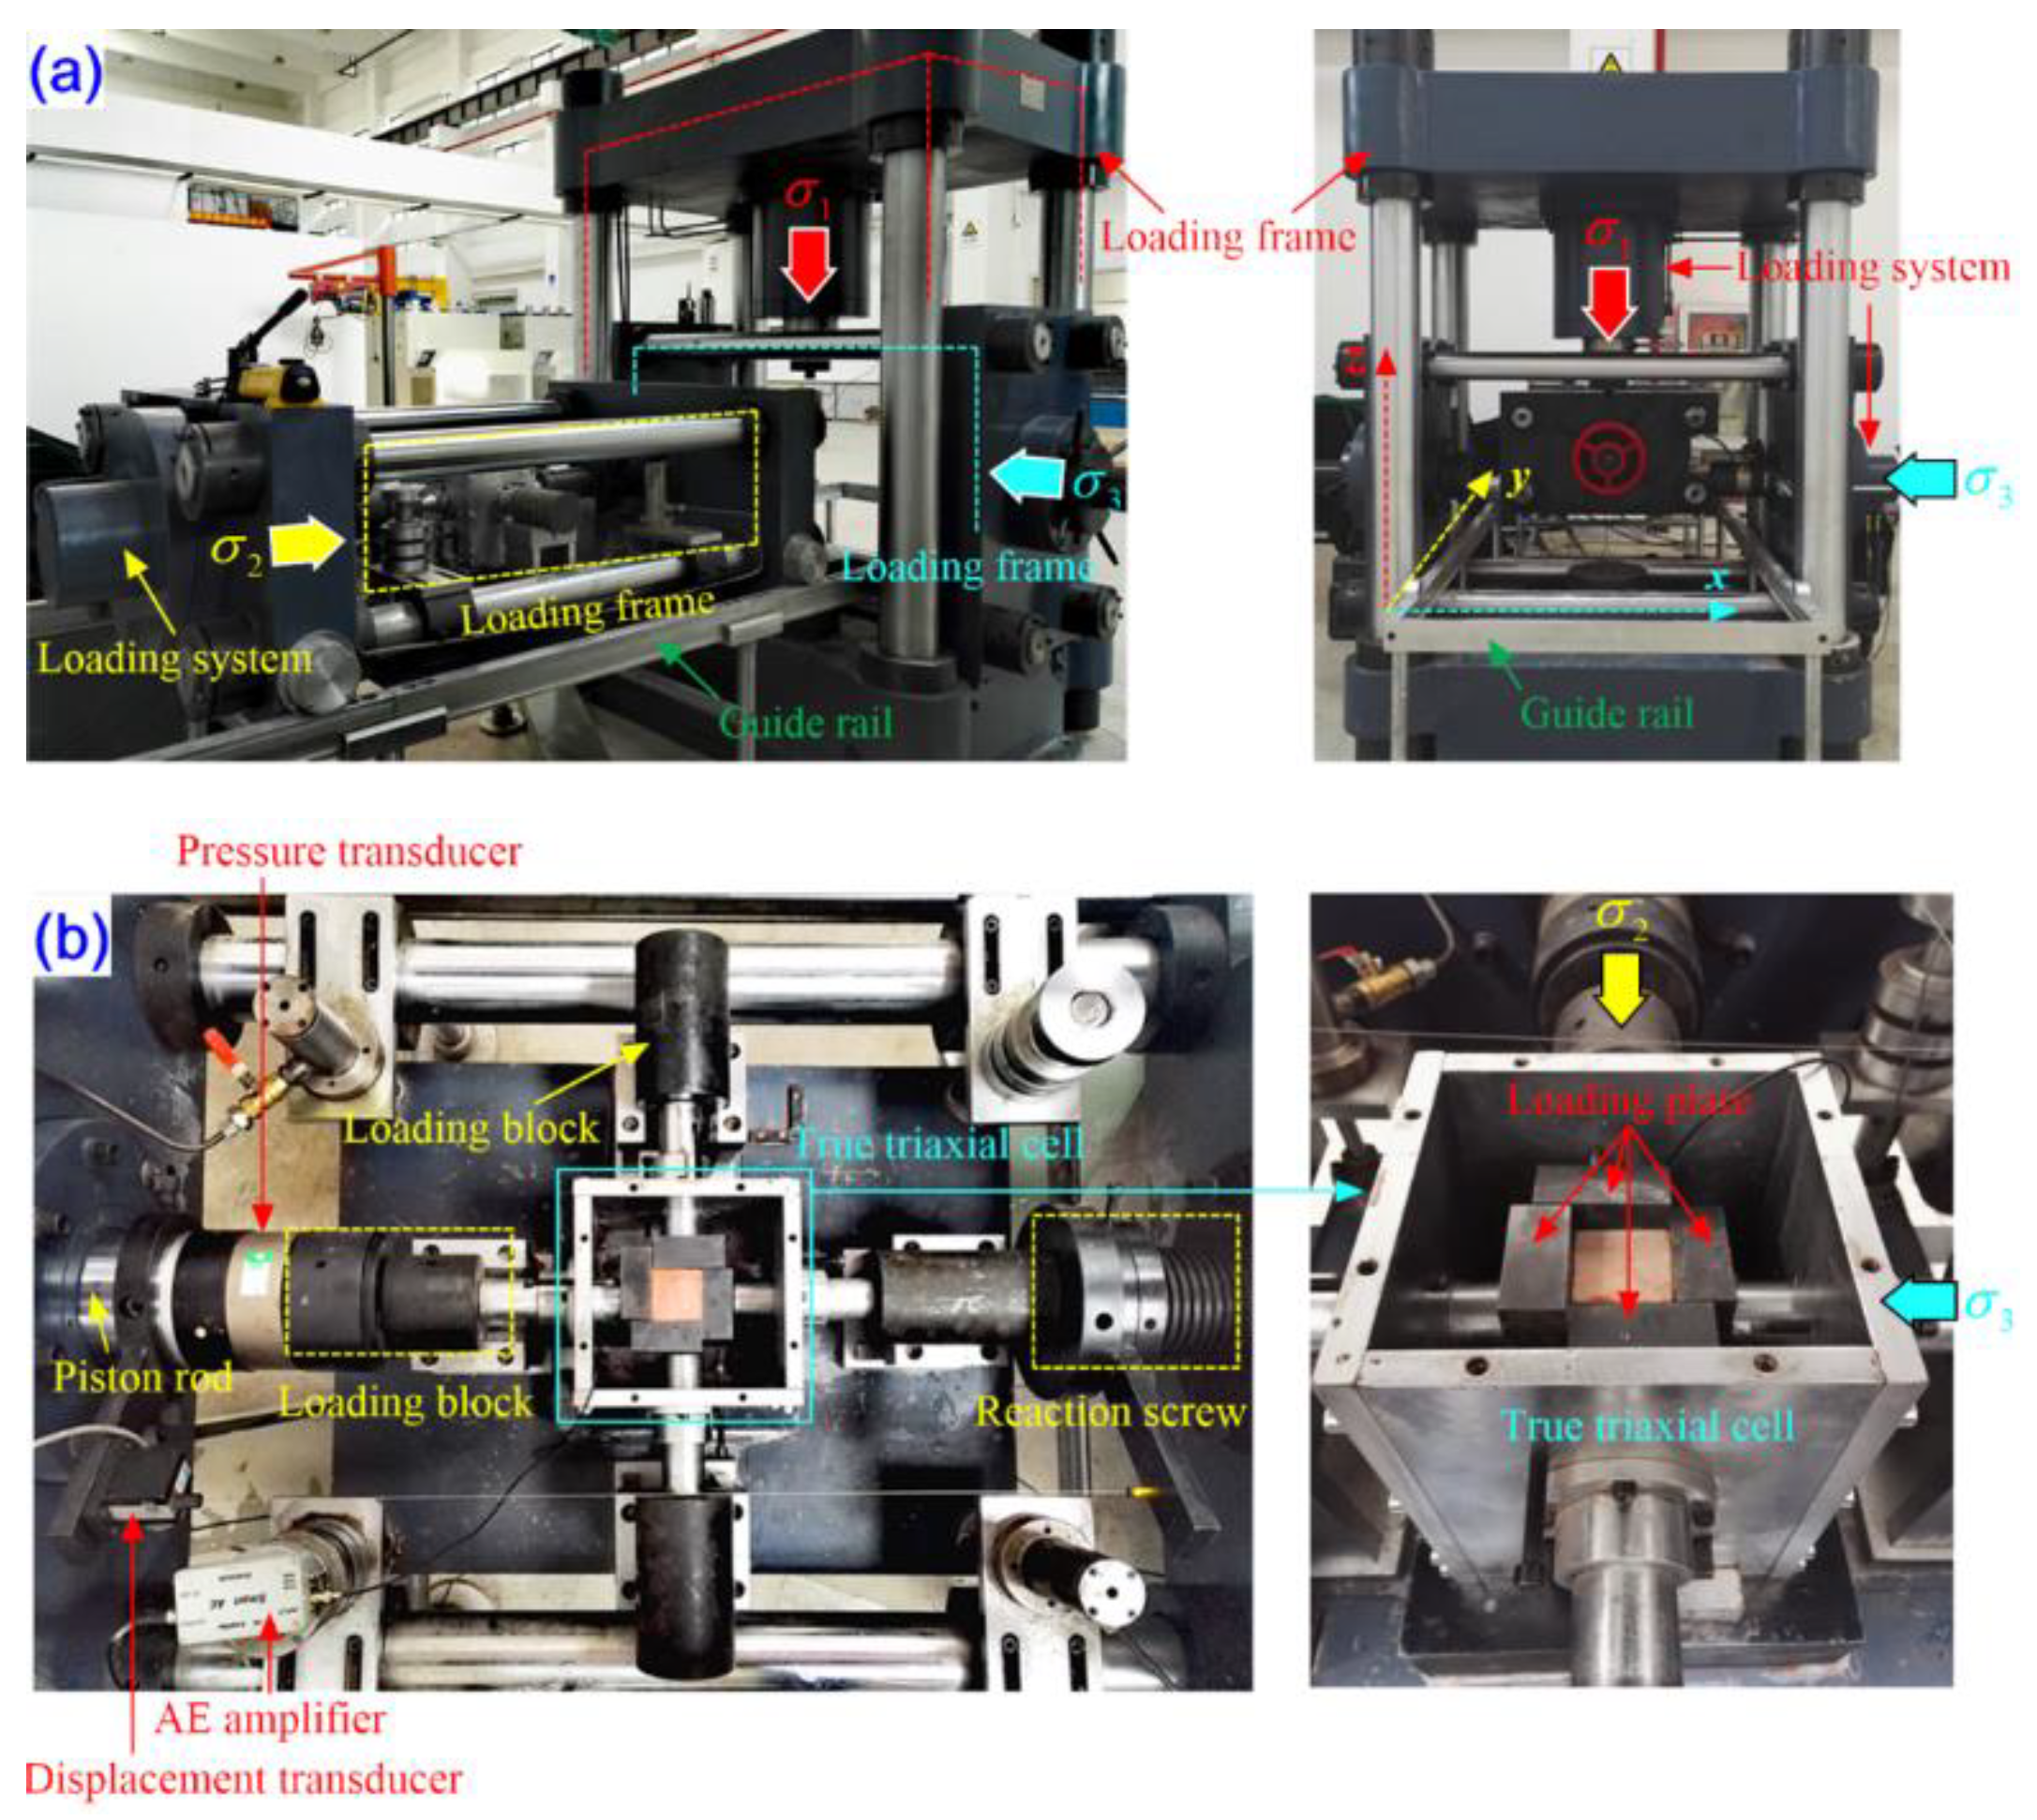
This test was conducted on a self-developed rock true triaxial electro-hydraulic servo loading test system, which mainly comprised a triaxial servo control loading system, a true triaxial pressure chamber, and an automatic acquisition system (Figure 2). The triaxial servo control loading system was composed of three independent loading racks, which were all set in a rigid loading mode. Among the three, the positions of and loading racks were fixed, both of which were placed on the horizontal guide rail. The true triaxial compression chamber was placed in the immediate piston loading space through the guide rail. A loading pressure block was arranged around the true triaxial compression chamber and was connected with the piston rod and reaction screw in and directions, respectively. The automatic acquisition system was connected with a spoke-type pressure sensor and a pull-rope-type displacement sensor through a signal line, respectively. Among them, the pressure sensors were installed between the piston rod and the loading pressure block. The rated loads in , and directions were 1600 kN, 500 kN, and 300 kN, respectively (accuracy, 0.01 kN). The displacement sensors were fixed on the piston rod and reaction screw (accuracy, 0.002 mm).

Figure 2.
True triaxial compression test system: (a) frame of the testing machine; (b) internal structure of the true triaxial compression test system [28].
2.2. Testing Procedure
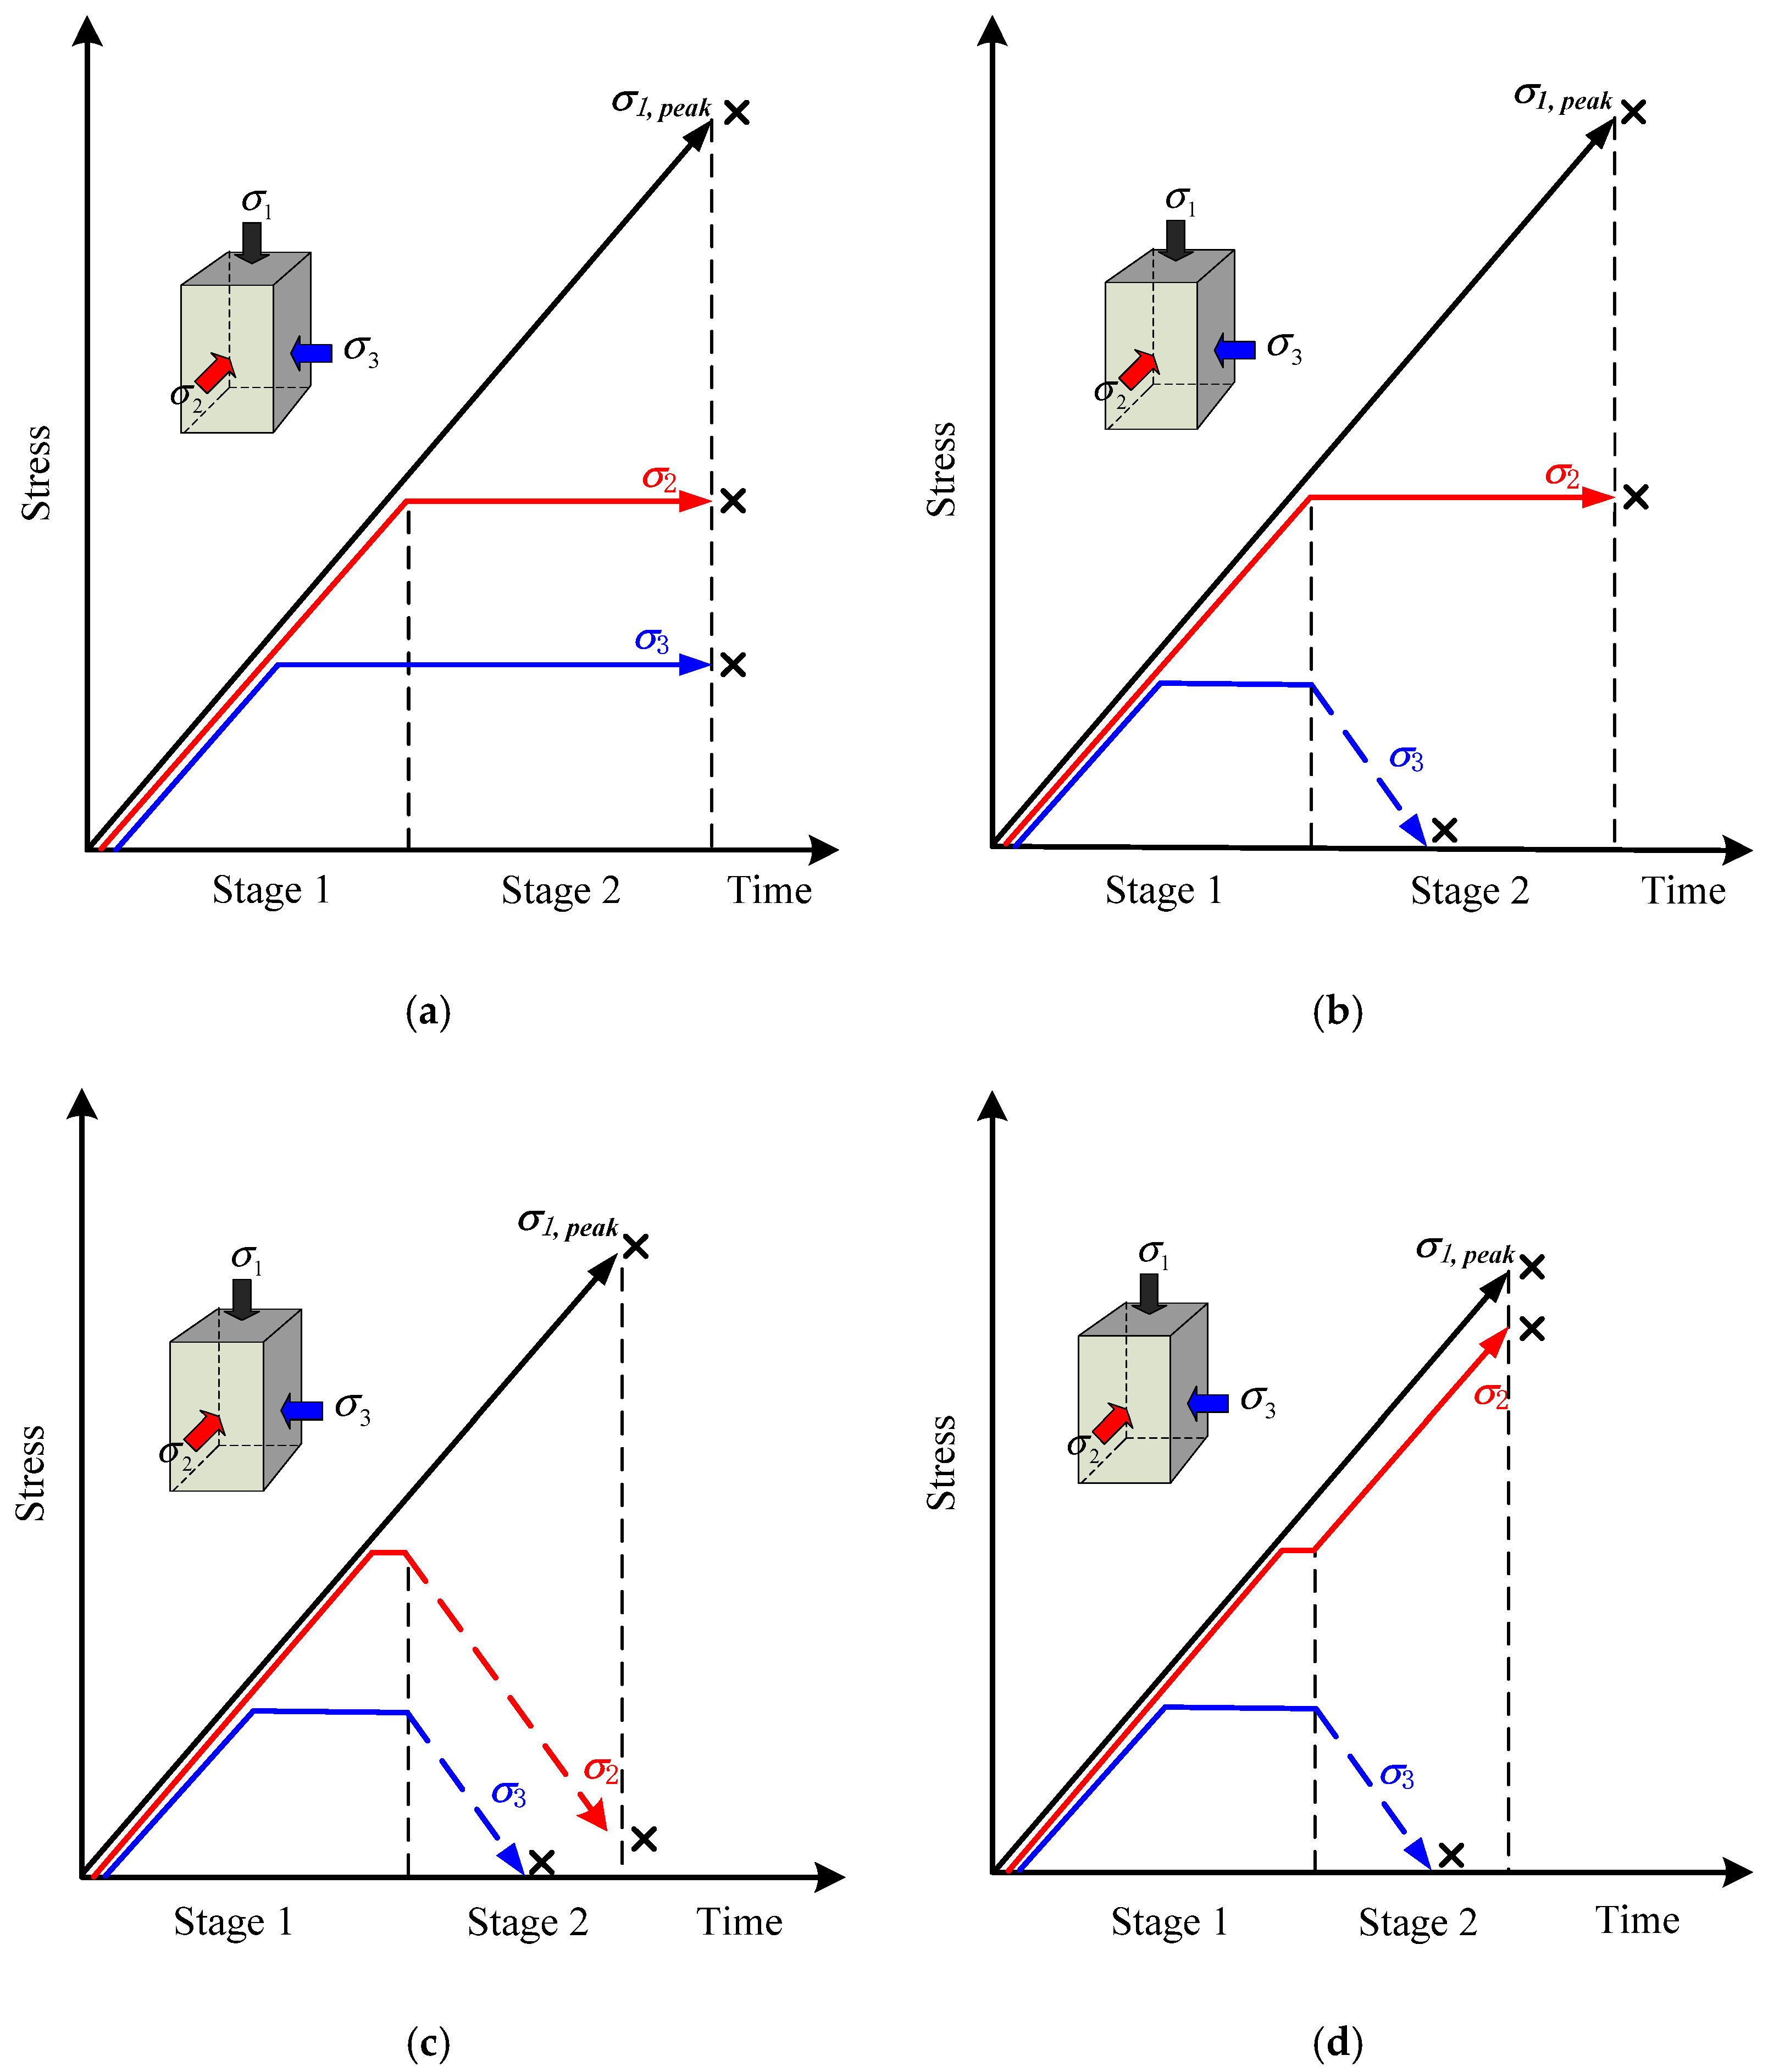
Deep rock mass excavation is a typical loading and unloading process. Taking roadway excavation as an example, before a deep roadway is excavated, the rock mass is in a triaxial stress balance state under the action of original rock stress. The excavation of the roadway leads to the formation of a goaf-side surface inside the original rock mass, and the surrounding rock produces an instantaneous rebound, thereby breaking the original balance state. Among them, , and are the first-, second-, and third-principal stresses, respectively. The first-principal stress corresponds to loading, while the third-principal stress corresponds to unloading. The IPS varies due to different surrounding rock geologies and in situ stress environments. In order to better simulate the actual situation on-site, this paper adopted the method of increasing the axial pressure and unloading the confining pressure. Loading adopted the mode of stress and displacement mixed control, and unloading adopted the mode of stress control. A total of four tests under different true triaxial loading and unloading stress paths, i.e., loading–constant–constant test (LCCT), loading–constant–unloading test (LCUT), loading–unloading–unloading test (LUUT), and loading–loading–unloading test (LLUT), were conducted with the initial triaxial principal stresses , and in the true triaxial test set to 20 MPa, 20 MPa, and 10 MPa, respectively. The specific schemes are described in what follows.
2.2.1. Scheme I: (LCCT, True Triaxial Loading)
Scheme I is aimed at obtaining the true triaxial compression strength, deformation parameters, and failure characteristics of red sandstone for providing a reference for true triaxial loading and unloading tests. Its specific process and stress path are as follows:
A certain preload was applied to fully fix the sample, and then the confining pressure was applied to the hydrostatic pressure state at a rate of 0.04 MPa/s. At this time, .
- With kept unchanged, and were continuously increased at the same rate, to 20 MPa;
- With and kept unchanged, was increased at a rate of 0.004 mm/s, according to the displacement loading method, until the sample failed.
2.2.2. Scheme II: (LCUT, Increasing Axial Stress and Unloading Minimum Principal Stress)
After the deep roadway was excavated, the surrounding rock, which was originally in a triaxial stress state, moved toward the goaf-side surface, and the surrounding rock underwent stress concentration as the tangential mutual compression intensified. Meanwhile, IPS remained unchanged. Scheme II is aimed at simulating the damage caused by such a stress state.
- The initial stress loading procedure was the same as that in Scheme I—namely, ;
- With kept unchanged, σ1 was increased at a rate of 0.004 mm/s, in accordance with the displacement loading method, and meanwhile, was unloaded at a rate of 0.04 MPa/s, in accordance with the force loading method, until the sample failed.
2.2.3. Scheme III: (LUUT, Increasing Axial Stress and Unloading Confining Pressure)
After the deep roadway was excavated, the surrounding rock, which was originally in a triaxial stress state, moved toward the goaf-side surface, and the surrounding rock underwent stress concentration as the tangential mutual compression intensified. Meanwhile, IPS was unloaded. Scheme III is aimed at simulating the damage caused by such a stress state.
- The initial stress loading procedure was the same as that in Scheme I—namely, ;
- Then, was increased at a rate of 0.004 mm/s, according to the displacement loading method, and meanwhile, and were unloaded at a rate of 0.04 MPa/s, according to the force loading method, until the sample failed.
2.2.4. Scheme IV: (LLUT, Increasing Axial Stress and IPS and Unloading Minimum Principal Stress)
After the deep roadway was excavated, the surrounding rock, which was originally in a triaxial stress state, moved toward the goaf-side surface, and the surrounding rock underwent stress concentration as the tangential mutual compression intensified. Meanwhile, IPS was increased. Scheme IV is aimed at simulating the damage caused by such a stress state.
- The initial stress loading procedure was the same as that in Scheme I—namely, ;
- Then, was increased at a rate of 0.04 mm/s, according to the displacement loading method, and meanwhile, was increased, and was unloaded at a rate of 0.04 MPa/s, until the sample failed. The four loading and unloading stress paths are illustrated in Figure 3.
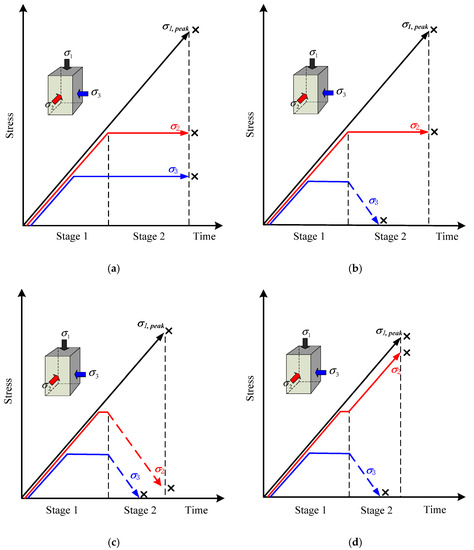 Figure 3. Schematic diagram of loading–unloading stress paths. (a) LCCT; (b) LCUT; (c) LUUT; (d) LLUT.
3. Analysis of Strength Characteristics
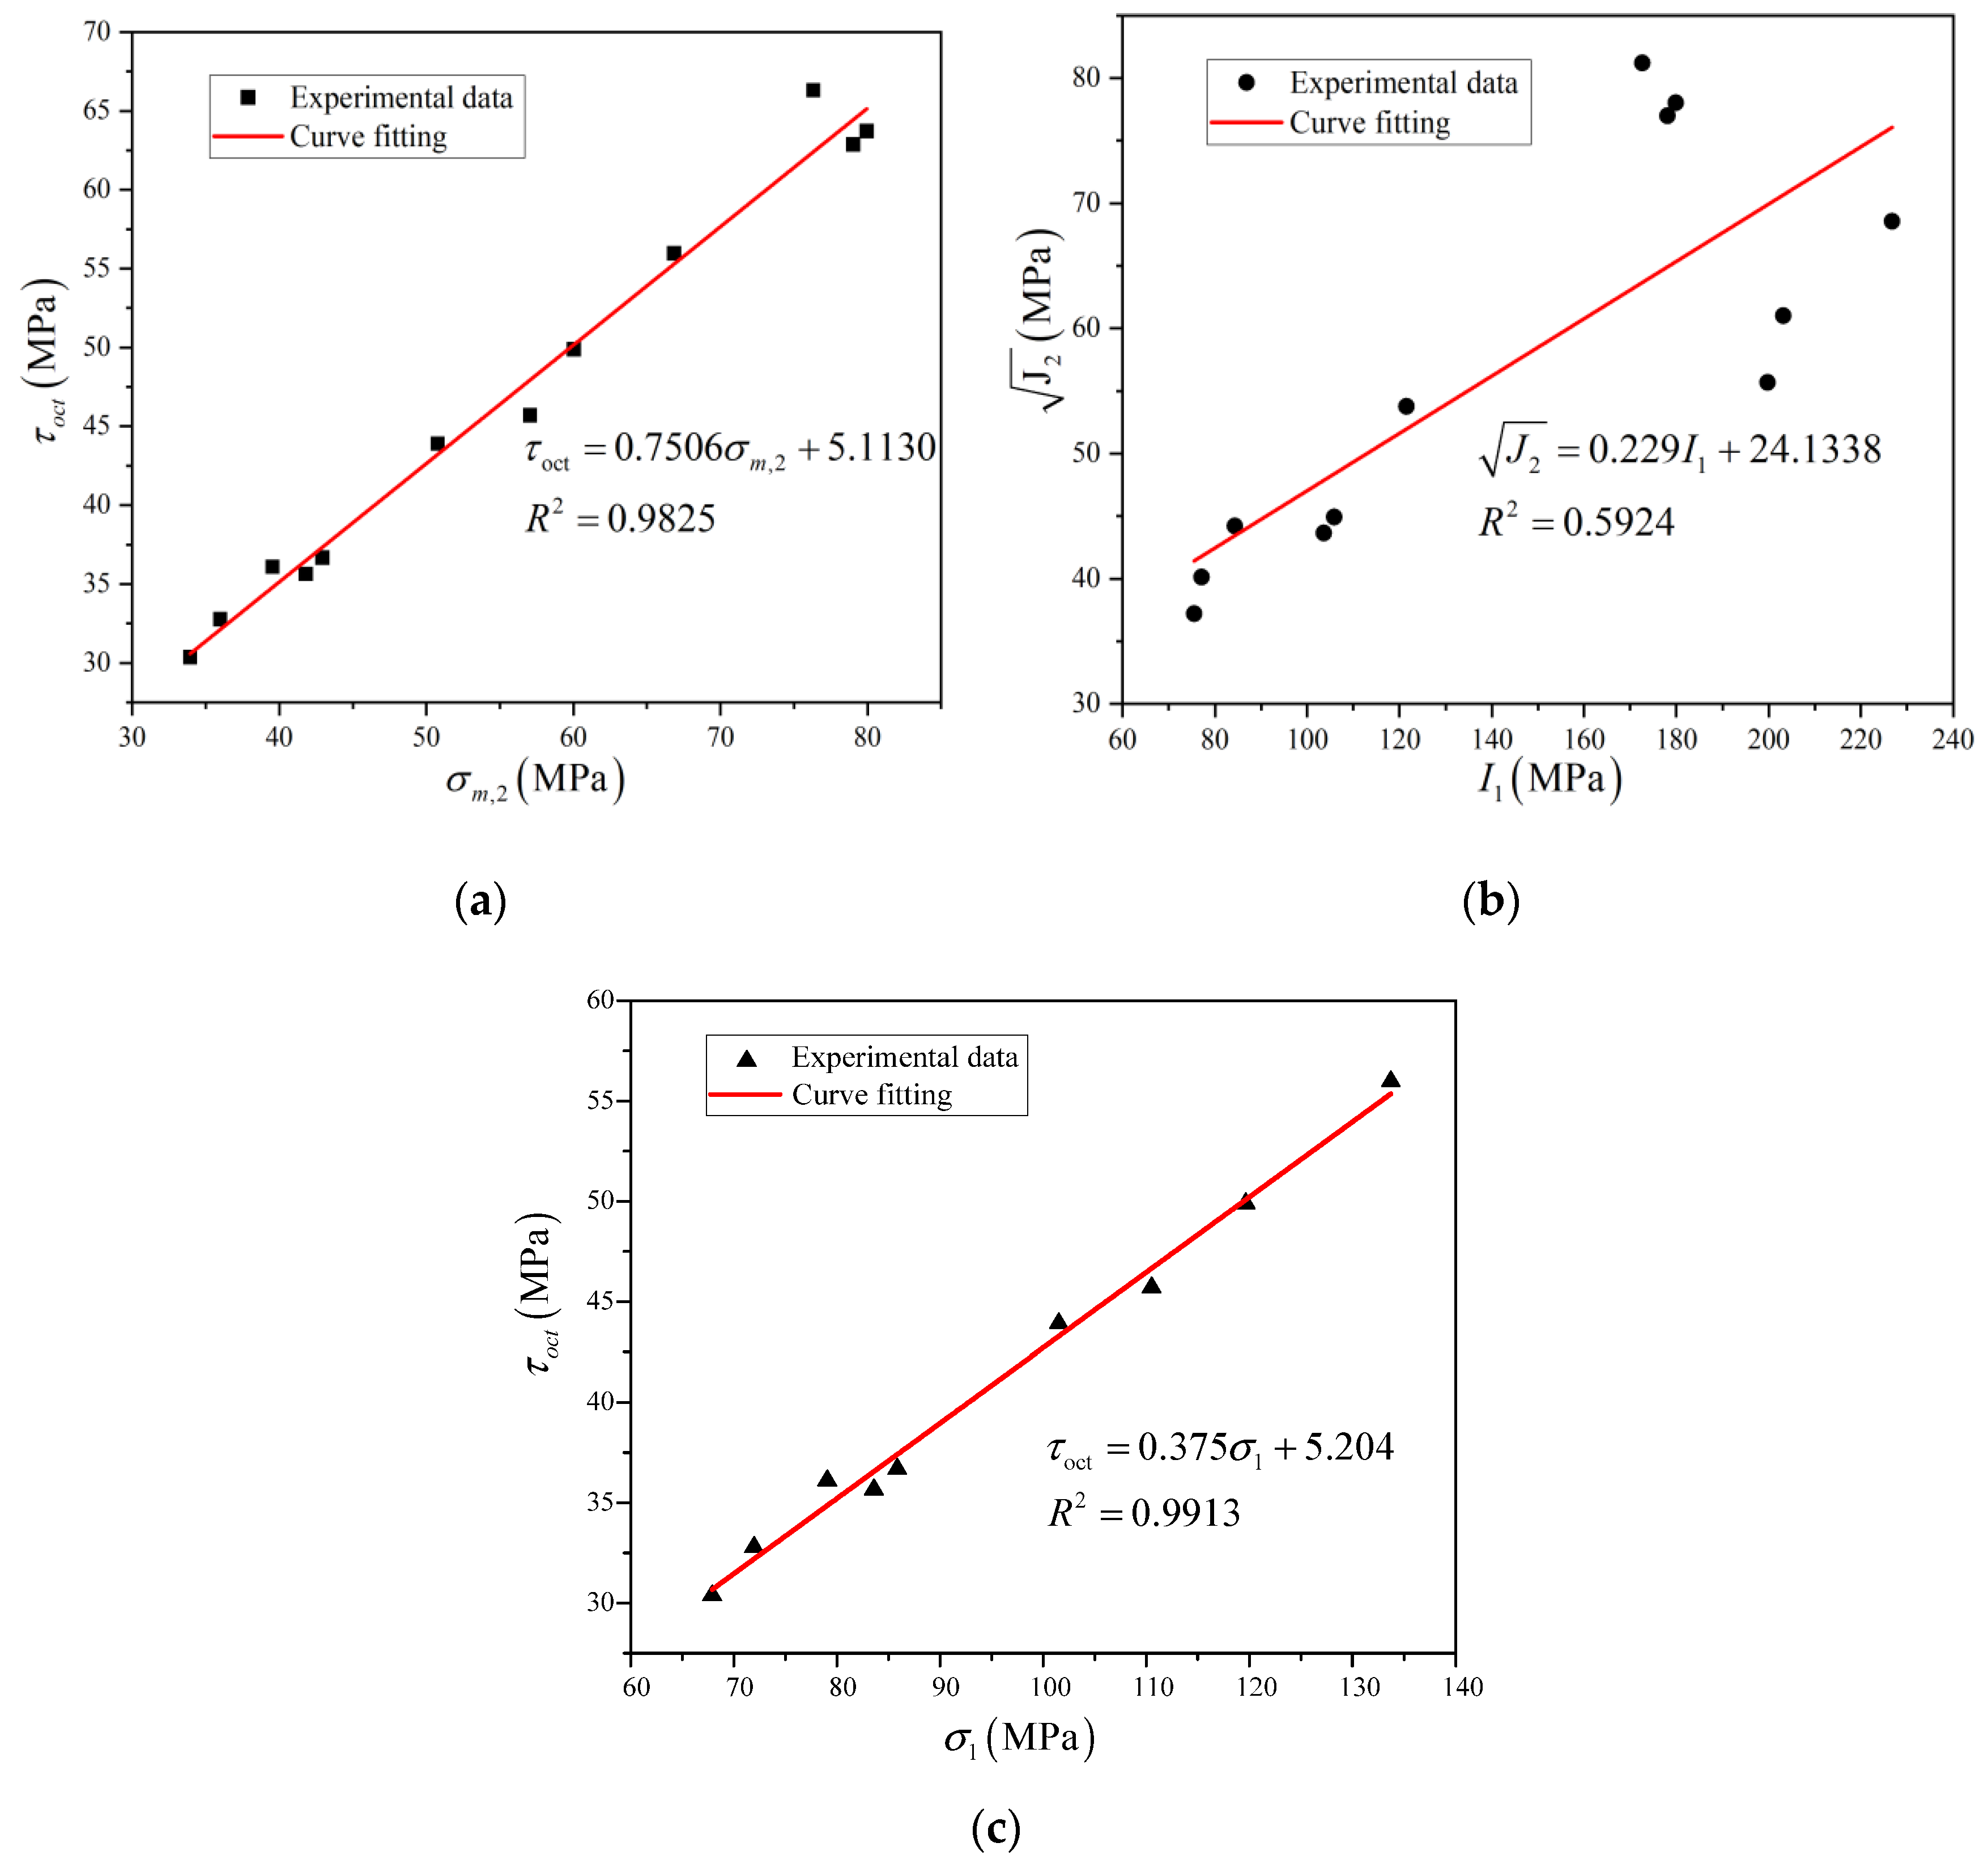
At present, the criteria for rock strength analysis primarily include the Mohr–Coulomb criterion, the Mogi–Coulomb criterion, and the Drucker–Prager criterion are generated. Among them, the Mohr–Coulomb criterion is not suitable for the description of rock strength under true triaxial stress conditions, because it does not indicate the influence of IPS on rock strength. In this paper, the Mogi–Coulomb criterion and the Drucker–Prager criterion were used to comparatively analyze the strength parameters of rock samples under different true triaxial stress paths. The Mogi–Coulomb criterion describes the monotonically increasing functional relationship between the octahedral shear stress and the effective average normal stress—namely,
Al-Ajmi and Zimmerman sorted out a large number of triaxial loading test data and concluded that the linear function form of had an ideal fitting effect in the true triaxial compression test. Its expression is
where and are the material parameters related to rock mechanical properties; is the octahedral shear stress; is the average effective normal stress acting on the shear plane. For the conventional triaxial situation, where ; the Mogi–Coulomb criterion relationship is reduced to the Mohr–Coulomb criterion relationship, and then
The Drucker–Prager criterion is described as
where and are both experimental parameters, i.e., the first invariant of stress and the second invariant of stress deviation.
In the triaxial stress state , the relationship between the parameters of the Drucker–Prager criterion and the Mohr–Coulomb criterion is as follows:
In the 3D Mohr–Coulomb criterion proposed in the literature [52], a relationship is established between the equivalent stress and the maximum principal stress, taking into account the influence of IPS . In contrast, in the new failure criterion proposed in this study, a functional relationship is established between the octahedral shear stress and the maximum principal stress as follows:
where and are the material parameters related to rock mechanical properties; is the octahedral shear stress; is the maximum principal stress. For the conventional triaxial situation in which , the 3D Mohr–Coulomb criterion relationship is reduced to the Mohr–Coulomb criterion relationship, and then
It can be seen from the fitting results in Figure 4 that the correlation coefficients of the Mogi–Coulomb strength criterion and the new strength criterion are both greater than that of the Drucker–Prager strength criterion. This shows that the Mogi–Coulomb strength criterion and the new strength criterion are superior in describing the failure strength characteristics of red sandstone under different true triaxial loading and unloading stress paths. The Mogi–Coulomb strength criterion and the new criterion have higher degrees of fit, because the maximum principal stress is relatively high, which has an absolute advantage over the minimum principal stress. According to the three strength criteria, the fitting parameters are connected with the internal cohesion and internal friction angle of red sandstone. The calculated strength fitting parameters are listed in Table 3.
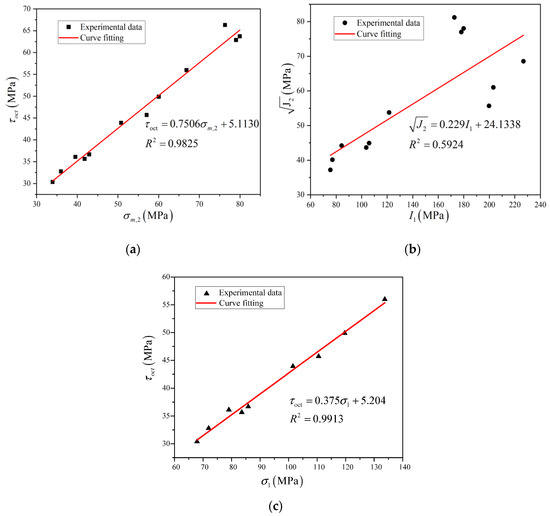
Figure 4.
Strength fitting curves of red sandstone failure under different stress paths. (a) Mogi–Coulomb; (b) Drucker–Prager; (c) New strength criterion.
Table 3.
Comparative analysis on strength criterion parameters.
Through the above fitting data, it is found that the failure strengths of red sandstone under different loading and unloading stress paths conform to the octahedral strength criterion, which is consistent with the analysis results obtained by Al-Ajmi and Zimmerman. Moreover, the results also suggest that the current self-developed true triaxial test system can yield accurate data when used to perform true triaxial tests under different stress paths.
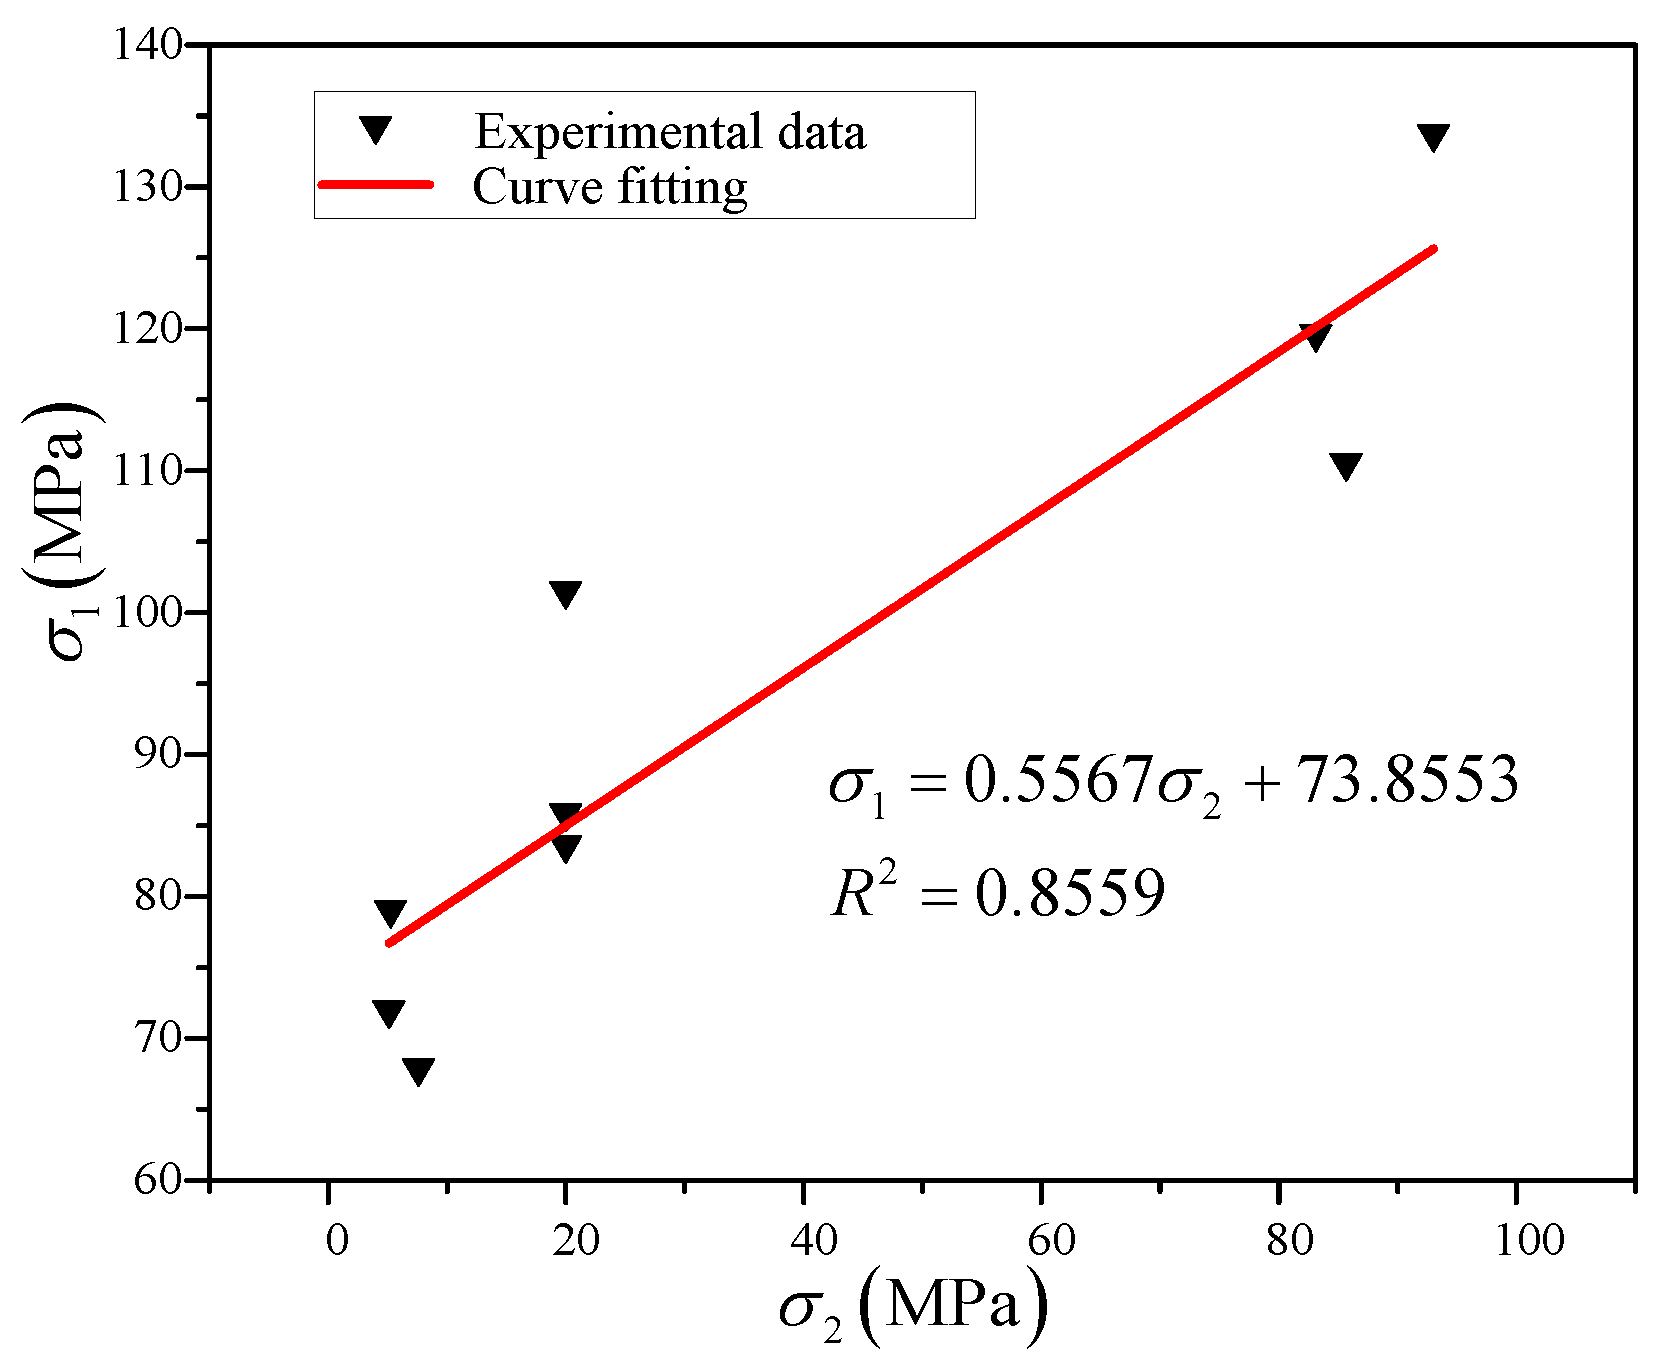
The stress values obtained in three experimental schemes (i.e., LCUT/LUUT/LLUT) are plotted in Figure 5 to reflect the influence of the IPS parameter on the different unloading stress paths. Three experiments were performed in each scheme. It can be seen from the data in Figure 5 that as IPS increases, the peak strength rises gradually. When IPS is in the unloading state, the peak strength is 65–80 MPa, which is the minimum. When the rock sample is broken, IPS starts to exceed 0 MPa. When IPS is constant at 20 MPa, the peak strength is 85–100 MPa. As IPS further increases, the peak strength rapidly increases to 110–135 MPa. The relationship between IPS and peak strength in the three-way compression test can be concluded as follows [27]: the peak strength increases first and then decreases with the increase in IPS. The influence of the IPS parameter during dynamic continuous changes studied in this paper is the variation law under a complex stress path rather than under a single path.
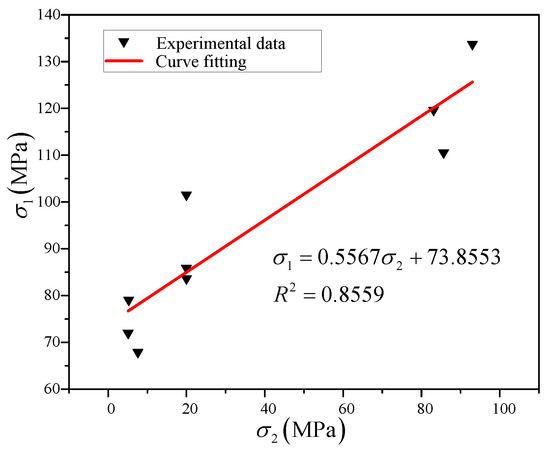
Figure 5.
Fitting curve of strengthening effect of the IPS parameter in different experimental schemes.
4. Test Results and Discussion
4.1. Analysis of Deformation Characteristics
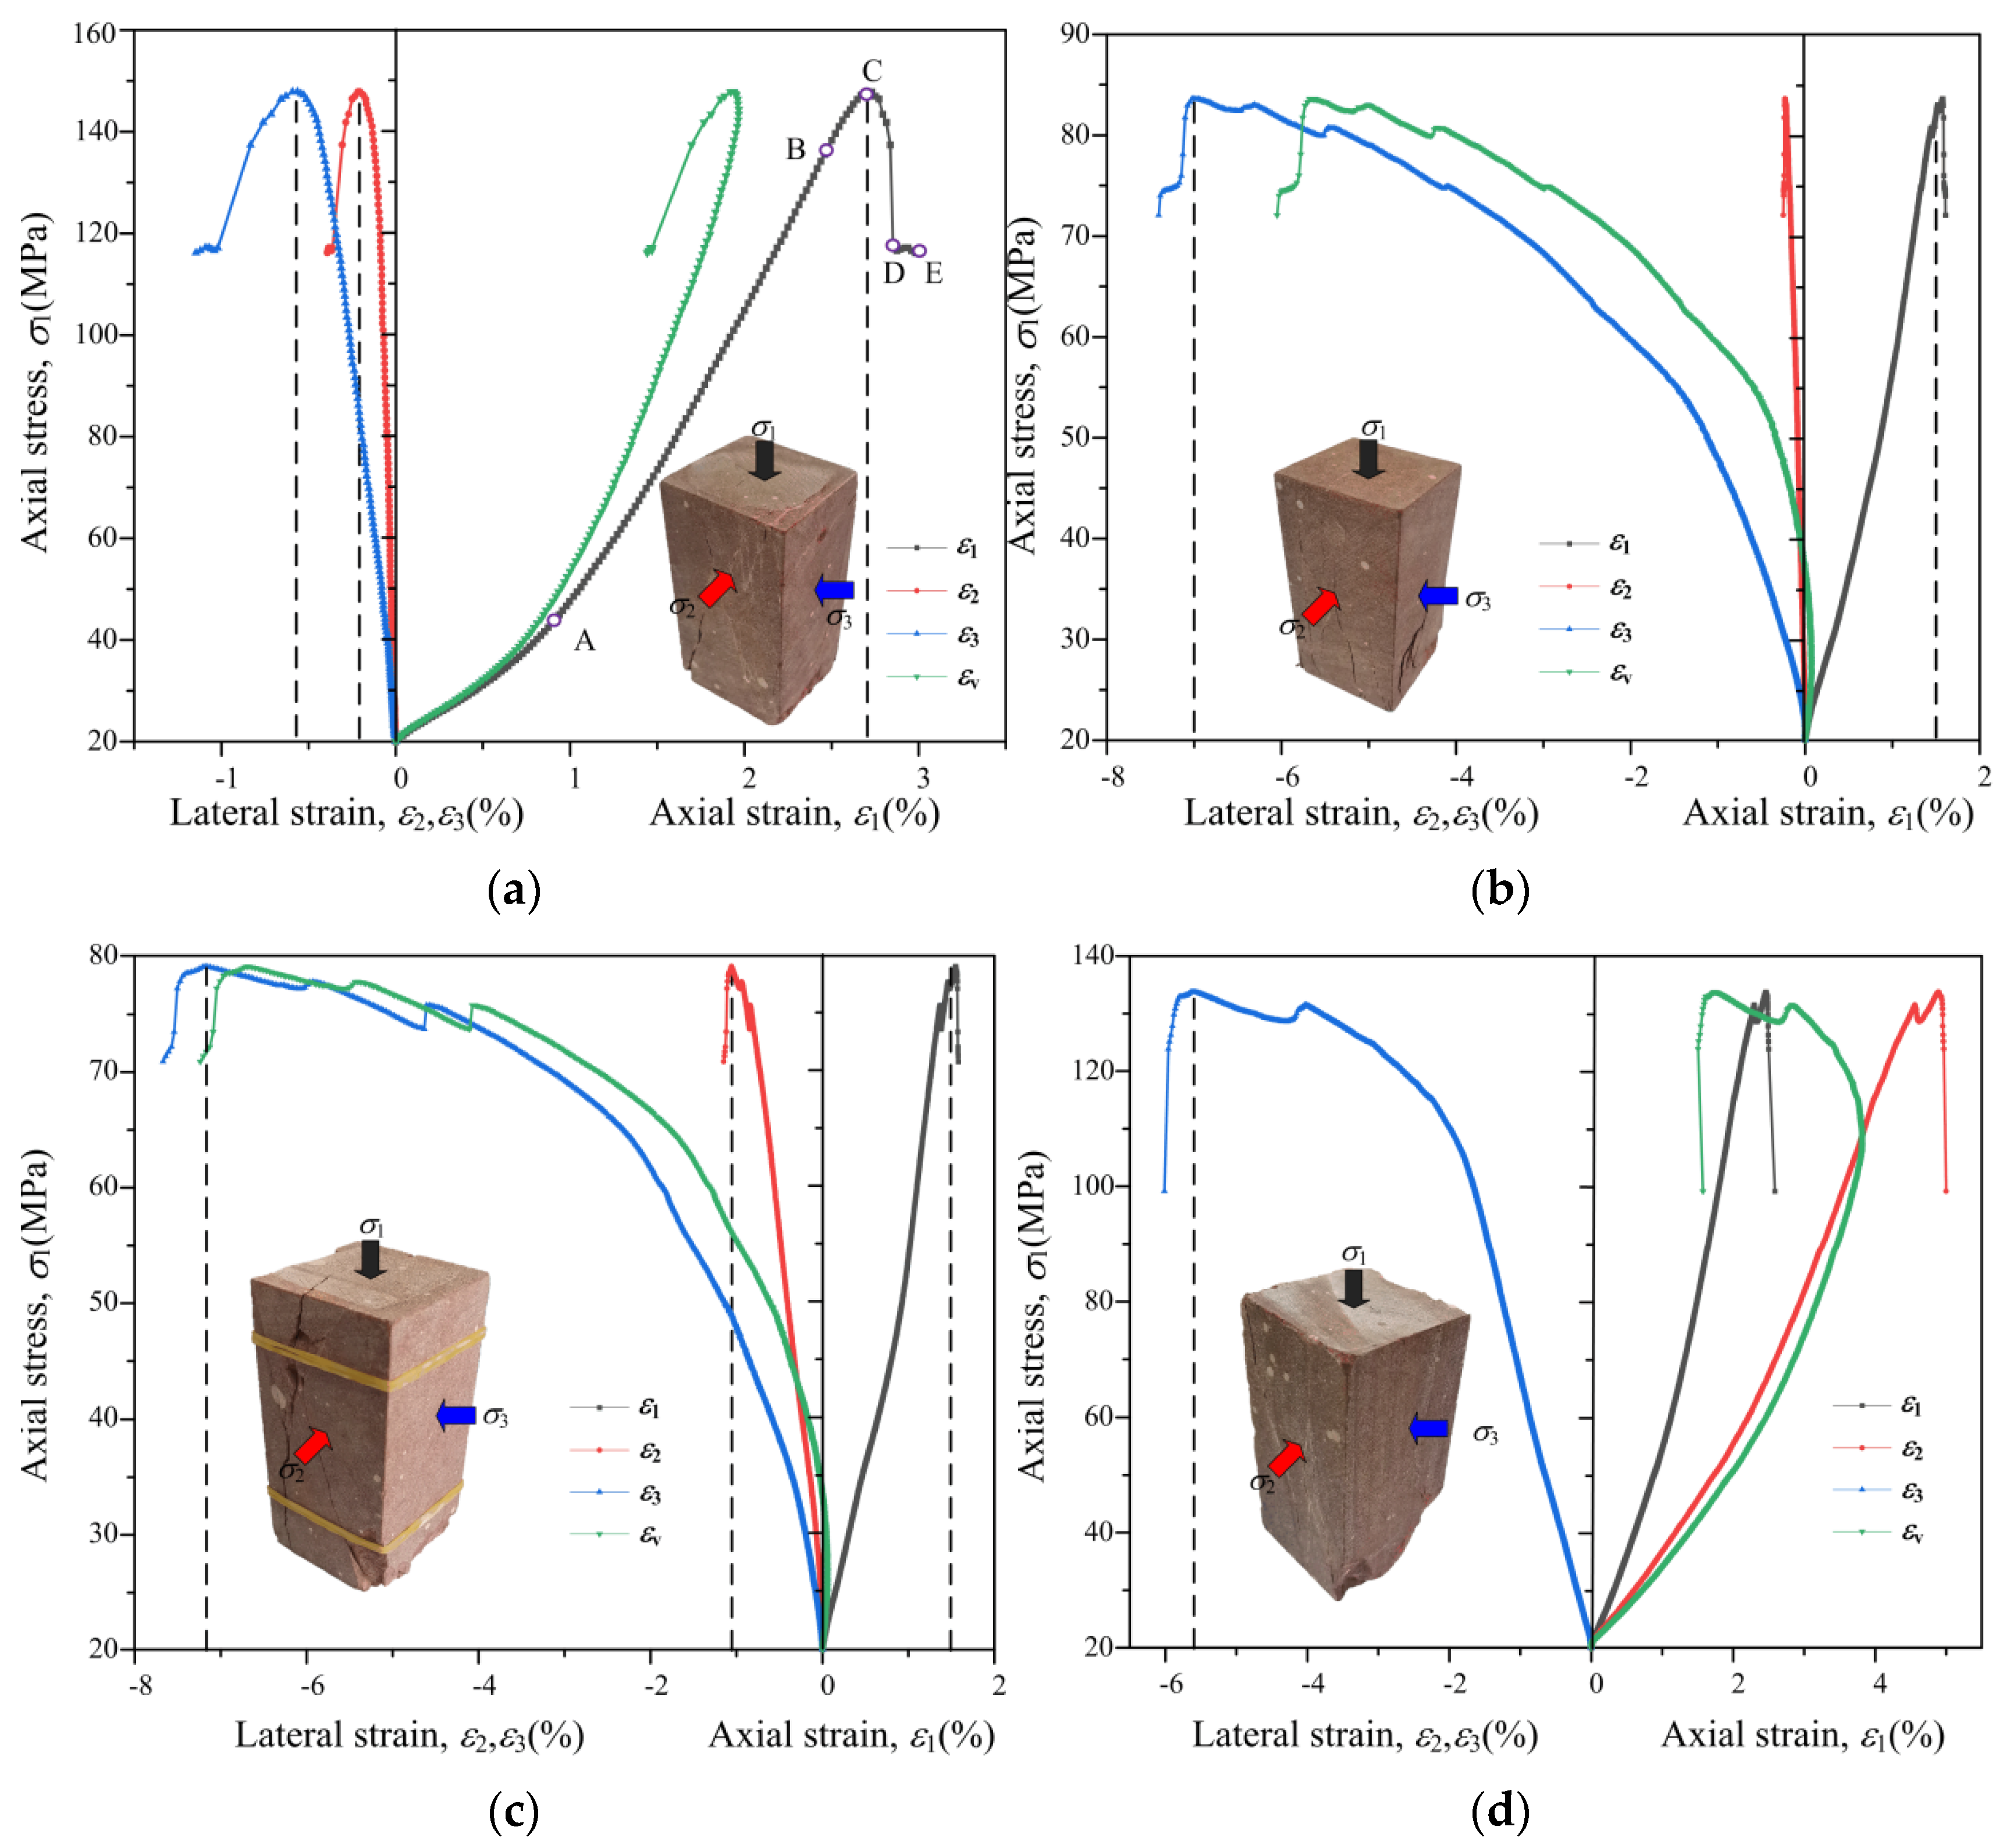
The full stress–strain curves of red sandstone samples under the four true triaxial loading and unloading stress paths are illustrated in Figure 6. Figure 6a shows the rock deformation characteristic curve under LCCT. The axial stress–strain curve presents five distinct stages—namely, the pore-and-crack compaction stage (OA), the stable-crack expansion stage (AB), the unstable-crack development stage (BC), the post-peak strain-softening stage (CD), and the residual strength stage (DE) [53]. The value of volumetric strain is always positive, indicating that the axial strain is much greater than the lateral strain, and the sample is compressed on the whole.

Figure 6.
Complete stress–strain curves of red sandstone under true triaxial loading–unloading stress paths. (a) LCCT; (b) LCUT; (c) LUUT; (d) LLUT.
Compared with the results under LCCT in Figure 6a, the peak strength of the sample decreases considerably from 147.8 MPa to 83.3 MPa, by 43.64%, under LCUT (Figure 6b). In addition, strain , corresponding to the peak strength, increases notably from 0.592% to 7%, by about 10.9 times. It can be seen that the rock sample under LCUT deforms more seriously in the direction when it loses stability and fails, resulting in a significant drop in its bearing capacity.
A comparison between Figure 6b,c discloses that the peak strength of the sample under LUUT is about 7% lower than that under LCUT. Their absolute values of strain in the direction are similar, both being relatively large. Their main difference lies in the direction, where the absolute value of strain surges from 0.23% under LCUT to 1.16% under LUUT, by about 400%. The difference is caused by the stress conditions in the two schemes. Specifically, the two schemes both adopt constant loading and unloading in the σ2 direction, and unloading promotes the deformation and energy release of the samples. In addition, under LUUT, unloading in the σ2 and σ3 directions leads to an increase in strain in these two directions.
According to Figure 6b–d, the value of the sample under LLUT is always positive, indicating that the sample is compressed in this direction. The volumetric strain of the sample under LLUT is the smallest, and those under LCUT and LUUT are both of relatively large and similar values. However, the peak strength of the sample under LLUT is 53% and 62.5% higher than those under LCUT and LUUT, respectively. This demonstrates that the increase in IPS limits the expansion and deformation in the direction, which is not conducive to the expansion and development of internal cracks. Resultantly, the bearing capacity of the sample is improved.
4.2. Analysis of Failure Characteristics
Throughout loading and unloading, the sample experiences the process of crack compaction, micro-crack expansion and connection, and macro-crack formation, in turn. Figure 6 exhibits the failure modes under different stress paths. Under LCCT, multiple shear cracks are generated inside the sample; the failure mode belongs to a typical shear failure caused by axial compression, and V-shaped and X-shaped cracks are formed on the surfaces of the sample. Under LCUT and LUUT, as the lateral confining pressure is unloaded, multiple vertical cracks and inverted V-shaped cracks occur along the unloading surface on the front and back surfaces, and shear cracks expand and connect to form a shear failure surface. The failure mode of the sample gradually becomes a tensile–shear composite failure, and the volume of the sample expands notably. Moreover, large pieces of rock peel off as a result of tension on the surfaces. With the unloading in the two directions under LUUT, the cracks develop vigorously; penetrating macro-cracks are produced, and the sample is more severely damaged and makes a sound when cracking. Compared with LCCT, with the unloading of principal stresses σ2 and σ3, the bearing capacities of the samples in this direction are reduced under LCUT and LUUT. The samples expand in this direction, and the cracks perpendicular to the σ2 direction on surfaces are fully developed.
Nevertheless, the initial principal stress under LUUT, and the unloading rate is the same when the confining pressure is unloaded simultaneously. Thus, the confining pressure of the sample still maintains the relationship . In this way, crack expansion is suppressed on surfaces, and vertical cracks induced by tensile stress appear on surfaces. The failure mode of the sample under LUUT resembles that under the unidirectional unloading test LCUT. The difference between the LLUT test and LCUT and LUUT tests is the state of IPS (loading, constant loading, or unloading). Similar to the previous two tests, the overall failure mode belongs to a tensile–shear composite failure under LUUT. However, under the condition of stress loading, the stability and bearing capacity of the sample are promoted so that the sample is not easily damaged.
In the true triaxial compression experiment, the fracture angle increases with the increase in IPS [14,27]. In this paper, the fracture angle of red sandstone specimens under uniaxial compression is 69°–71°, which is lower than that (80°) of Coconino and Bentheim sandstone [14]. In the LCCT test, σ3 = 10 MPa, σ2 = 20 MPa, and the red sandstone fracture angle is 75°, which is consistent with the conclusions in other studies. However, the fracture angles are 72° (LCUT), 70° (LUUT), and 70° (LLUT) in the loading and unloading tests under different paths, and the influence of the increase in IPS on the fracture angle is not obvious, generally at 70°. This means that under the same confining pressure, the fracture angles in the loading and unloading tests are smaller than those in the loading test. A comparison between (c) LCUT and (d) LUUT reveals that when IPS is lowered, the fracture angle becomes smaller.
As marked by the white dashed lines in Figure 7c–e, the cracks are approximately vertical, which means that tensile cracks will appear in the unloading test, and the failure mode is a tensile–shear composite failure, which is different from the compression–shear single failure in the compression test.
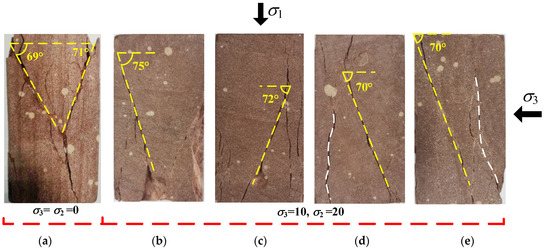
Figure 7.
Failure modes of sandstone samples under true triaxial loading–unloading stress paths: (a) UC; (b) LCCT; (c) LCUT; (d) LUUT; (e) LLUT.
5. Conclusions
- (1)
- The true triaxial loading and unloading stress path has a significant effect on the evolution of deformation and strength characteristics of red sandstone. The deformation and failure characteristics of rock samples under the stress paths LCUT and LUUT are similar.
- (2)
- Under different true triaxial loading and unloading stress paths, the volumetric strains of red sandstone are quite different. The volumetric strain values of the samples under LCCT and LLUT are always positive, indicating that the samples are compressed as a whole. Those under LCUT and LUUT are first positive and then negative, suggesting that the sample volume is compressed at first and expands later.
- (3)
- Compared with the LCCT test, the peak strengths of red sandstone under the other three stress paths are reduced. Among the three loading and unloading stress paths, with the increase in IPS, the strain in the direction of IPS gradually changes from expansion to compression, and the peak strength gradually increases. The state of IPS determines the failure strength of the sample and reflects the strengthening effect of IPS. Moreover, under the three stress paths, the failure modes are all tensile–shear composite failures.
- (4)
- Under the conditions of different true triaxial stress paths, the Mogi–Coulomb strength criterion is superior to the Drucker–Prager strength criterion in describing the failure strength characteristics of red sandstone.
Author Contributions
Conceptualization, S.W. and L.W.; methodology, S.W. and K.D.; software, C.J.; validation, H.F. and K.D.; formal analysis, J.T.; investigation, S.W.; resources, C.J.; data curation, J.T.; writing—original draft preparation, S.W.; writing—review and editing, S.W.; visualization, J.T.; supervision, H.F.; project administration, L.W.; funding acquisition, L.W. All authors have read and agreed to the published version of the manuscript.
Funding
This research was funded by the National Key Research and Development Program of China (No. 2017YFC0603004), Natural Science Foundation of Jiangsu Province, China (No. BK20200628), and China Postdoctoral Science Foundation project (No. 2020M671649).
Data Availability Statement
The data used to support the findings and results of this study are available from the corresponding author upon request.
Acknowledgments
The authors would like to acknowledge the editor for their valuable comments on the improvement of this paper.
Conflicts of Interest
The authors declare that they have no conflict of interest.
References
- Brace, W.F.; Kohlstedt, D.L. Limits on lithospheric stress imposed by laboratory experiments. J. Geophys. Res. Solid Earth 1980, 85, 6248–6252. [Google Scholar] [CrossRef]
- Haimson, B. The hydrofracturing stress measuring method and recent field results. Int. J. Rock Mech. Min. Sci. Geomech. Abstr. 1978, 15, 167–178. [Google Scholar] [CrossRef]
- Cai, W.Q.; Zhu, H.H.; Liang, W.H.; Zhang, L.Y.; Wu, W. A New Version of the Generalized Zhang-Zhu Strength Criterion and a Discussion on Its Smoothness and Convexity. Rock Mech. Rock Eng. 2021, 54, 4265–4281. [Google Scholar] [CrossRef]
- Cai, W.Q.; Zhu, H.H.; Liang, W.H. Three-Dimensional Tunnel Face Extrusion and Reinforcement Effects of Underground Excavations in Deep Rock Masses. Int. J. Rock Mech. Min. Sci. 2022, 150, 104999. [Google Scholar] [CrossRef]
- Ma, D.; Zhang, J.; Duan, H.; Huang, Y.; Zhou, N. Reutilization of gangue wastes in underground backfilling mining: Overburden aquifer protection. Chemosphere 2021, 264, 128400. [Google Scholar] [CrossRef]
- Ji, S.; Zhang, J.; Pan, R.; Karlovšek, J. Local Acceleration Monitoring and its application in physical modelling of underground mining. Int. J. Rock Mech. Min. Sci. 2020, 128, 104282. [Google Scholar] [CrossRef]
- Ji, S.; He, H.; Karlovšek, J. Application of superposition method to study the mechanical behaviour of overlying strata in longwall mining. Int. J. Rock Mech. Min. Sci. 2021, 146, 104874. [Google Scholar] [CrossRef]
- Ji, S.; Karlovšek, J. Calibration and uniqueness analysis of microparameters for DEM cohesive granular material. Int. J. Min. Sci. Technol. 2021. [Google Scholar] [CrossRef]
- Ji, S.; Wang, Z.; Karlovšek, J. Analytical study of subcritical crack growth under mode I loading to estimate the roof durability in underground excavation. Int. J. Min. Sci. Technol. 2021. [Google Scholar] [CrossRef]
- Mogi, K. Fracture and flow of rocks under high triaxial compress. J. Geophys. Res. 1971, 76, 1255–1269. [Google Scholar] [CrossRef]
- Alexeev, A.D.; Revva, V.N.; Alyshev, N.A.; Zhitlyonok, D.M. True triaxial loading apparatus and its application to coal outburst prediction. Int. J. Coal Geol. 2004, 58, 245–250. [Google Scholar] [CrossRef]
- Feng, X.T.; Zhang, X.W.; Kong, R.; Wang, G. A Novel Mogi Type True Triaxial Testing Apparatus and Its Use to Obtain Complete Stress-Strain Curves of Hard Rocks. Rock Mech. Rock Eng. 2016, 49, 1649–1662. [Google Scholar] [CrossRef]
- Li, X.; Du, K.; Li, D. True Triaxial Strength and Failure Modes of Cubic Rock Specimens with Unloading the Minor Principal Stress. Rock Mech. Rock Eng. 2015, 48, 2185–2196. [Google Scholar] [CrossRef]
- Ma, X.; Haimson, B.C. Failure characteristics of two porous sandstones subjected to true triaxial stresses. J. Geophys. Res.-Solid Earth 2016, 121, 6477–6498. [Google Scholar] [CrossRef]
- Matsuoka, H.; Sun, D.A.; Kogane, A.; Fukuzawa, N.; Ichihara, W. Stress-strain behaviour of unsaturated soil in true triaxial tests. Can. Geotech. J. 2002, 39, 608–619. [Google Scholar] [CrossRef]
- Tiwari, R.P.; Rao, K.S. Post failure behaviour of a rock mass under the influence of triaxial and true triaxial confinement. Eng. Geol. 2006, 84, 112–129. [Google Scholar] [CrossRef]
- Zhao, X.G.; Wang, J.; Cai, M.; Cheng, C.; Ma, L.K.; Su, R.; Zhao, F.; Li, D.J. Influence of Unloading Rate on the Strainburst Characteristics of Beishan Granite under True-Triaxial Unloading Conditions. Rock Mech. Rock Eng. 2014, 47, 467–483. [Google Scholar] [CrossRef]
- Zhou, W.; Yang, L.; Ma, G.; Chang, X.; Cheng, Y.; Li, D. Macro-micro responses of crushable granular materials in simulated true triaxial tests. Granul. Matter 2015, 17, 497–509. [Google Scholar] [CrossRef]
- Ma, X.; Haimson, B.C.; Rudnicki, J.W. True triaxial failure stress and failure plane of two porous sandstones subjected to two distinct loading paths. Porous Rock Fract. Mech. 2017, 285–307. [Google Scholar]
- Ma, X.; Rudnicki, J.W.; Haimson, B.C. The application of a Matsuoka-Nakai-Lade-Duncan failure criterion to two porous sandstones. Int. J. Rock Mech. Min. Sci. 2017, 92, 9–18. [Google Scholar] [CrossRef] [Green Version]
- Chang, C.; Haimson, B. True triaxial strength and deformability of the German Continental Deep Drilling Program (KTB) deep hole amphibolite. J. Geophys. Res.-Solid Earth 2000, 105, 18999–19013. [Google Scholar] [CrossRef]
- Haimson, B.; Chang, C. A new true triaxial cell for testing mechanical properties of rock, and its use to determine rock strength and deformability of Westerly granite. Int. J. Rock Mech. Min. Sci. 2000, 37, 285–296. [Google Scholar] [CrossRef]
- Al-Ajmi, A.M.; Zimmerman, R.W. Relation between the Mogi and the Coulomb failure criteria. Int. J. Rock Mech. Min. Sci. 2005, 42, 431–439. [Google Scholar] [CrossRef]
- Oda, M.; Takemura, T.; Aoki, T. Damage growth and permeability change in triaxial compression tests of Inada granite. Mech. Mater. 2002, 34, 313–331. [Google Scholar] [CrossRef]
- He, M.C.; Miao, J.L.; Feng, J.L. Rock burst process of limestone and its acoustic emission characteristics under true-triaxial unloading conditions. Int. J. Rock Mech. Min. Sci. 2010, 47, 286–298. [Google Scholar] [CrossRef]
- Cao, W.; Yildirim, B.; Durucan, S.; Wolf, K.-H.; Cai, W.; Agrawal, H.; Korre, A. Fracture behaviour and seismic response of naturally fractured coal subjected to true triaxial stresses and hydraulic fracturing. Fuel 2021, 288, 119618. [Google Scholar] [CrossRef]
- Lu, Y.L.; Li, W.S.; Wang, L.G.; Li, Z.L.; Meng, X.; Wang, B.; Zhang, K. Damage Evolution and Failure Behavior of Sandstone under True Triaxial Compression. Geotech. Test. J. 2019, 42, 610–637. [Google Scholar] [CrossRef]
- Li, Z.L.; Wang, L.G.; Lu, Y.L.; Li, W.S.; Wang, K.; Fan, H. Experimental investigation on True Triaxial Deformation and Progressive Damage Behaviour of Sandstone. Sci. Rep. 2019, 9, 3386. [Google Scholar] [CrossRef] [Green Version]
- Li, W.S.; Wang, L.G.; Lu, Y.L. Experimental investigation on the strength, deformation and failure characteristics of sandstone under true triaxial compression. J. Min. Saf. Eng. 2019, 36, 191–197. [Google Scholar]
- Shi, L.; Zeng, Z.; Bai, B.; Li, X. Effect of the intermediate principal stress on the evolution of mudstone permeability under true triaxial compression. Greenh. Gases Sci. Technol. 2017, 8, 37–50. [Google Scholar] [CrossRef]
- Zhang, S.; Wu, S.; Zhang, G. Strength and deformability of a low-porosity sandstone under true triaxial compression conditions. Int. J. Rock Mech. Min. Sci. 2020, 127, 104204. [Google Scholar] [CrossRef]
- Chen, G.Q.; Zhang, Y.; Li, Y. Thermal-acoustic precursor information chain of rock failure under true triaxial loading. Chin. J. Geotech. Eng. 2021, 40, 1–13. [Google Scholar]
- Ma, X.; Rudnicki, J.W.; Haimson, B.C. Failure characteristics of two porous sandstones subjected to true triaxial stresses: Applied through a novel loading path. J. Geophys. Res. Solid Earth 2017, 122, 2525–2540. [Google Scholar] [CrossRef]
- Xu, D.J.; Geng, N.G. The various stress paths causing deformation and failure in rocks. Rock Soil Mech. 1986, 7, 17–25. [Google Scholar]
- Xiang, T.B.; Feng, X.T.; Chen, B.R.; Jiang, Q. True triaxial and acoustic emission experimental study of failure process of hard rock under excavating and supporting stress paths. Rock Soil Mech. 2008, 29, 500–506. [Google Scholar]
- Du, K.; Li, X.B.; Li, D.Y.; Weng, L. Failure properties of rocks in true triaxial unloading compressive test. Trans. Nonferrous Met. Soc. China 2015, 25, 571–581. [Google Scholar] [CrossRef]
- Du, K.; Tao, M.; Li, X.-B.; Zhou, J. Experimental Study of Slabbing and Rockburst Induced by True Triaxial Unloading and Local Dynamic Disturbance. Rock Mech. Rock Eng. 2016, 49, 3437–3453. [Google Scholar] [CrossRef]
- Wang, Q.; Lade, P.V. Shear banding in true triaxial tests and its effect on failure in sand. J. Eng. Mech. 2001, 127, 754–761. [Google Scholar] [CrossRef]
- Yin, G.Z.; Liu, Y.B.; Li, M.H.; Deng, B.Z.; Liu, C.; Lu, J. Influence of true triaxial loading-unloading stress paths on mechanical property and permeability of coal. J. China Coal Soc. 2018, 43, 131–136. [Google Scholar]
- He, Z.J.; Ma, Y.N.; Wang, Z.W.; Zhang, X.J.; Zhang, X.S.; Ding, M.J.; Fu, C. Triaxial strength and deformation characteristics and its constitutive model of high-strength concrete before and after high temperatures. Structures 2021, 30, 1127–1138. [Google Scholar]
- Xiao, F.; Jiang, D.Y.; Wu, F.; Zou, Q.L.; Chen, J.; Chen, B.; Sun, Z.G. Effects of high temperature on the mechanical behaviors of sandstone under true-triaxial unloading conditions. Bull. Eng. Geol. Environ. 2021, 80, 4587–4601. [Google Scholar] [CrossRef]
- You, M.Q. True-triaxial strength criteria for rock. Int. J. Rock Mech. Min. Sci. 2009, 46, 115–127. [Google Scholar] [CrossRef]
- Zhang, L. A generalized three-dimensional Hoek–Brown strength criterion. Rock Mech. Rock Eng. 2008, 41, 893–915. [Google Scholar] [CrossRef]
- Priest, S. Three-Dimensional Failure Criteria Based on the Hoek–Brown Criterion. Rock Mech. Rock Eng. 2012, 45, 989–993. [Google Scholar] [CrossRef] [Green Version]
- Wu, S.C.; Zhang, S.H.; Guo, C.; Xiong, L.F. A generalized nonlinear failure criterion for frictional materials. Acta Geotech. 2017, 12, 1353–1371. [Google Scholar] [CrossRef]
- Wu, S.; Zhang, S.; Zhang, G. Three-dimensional strength estimation of intact rocks using a modified Hoek-Brown criterion based on a new deviatoric function. Int. J. Rock Mech. Min. Sci. 2018, 107, 181–190. [Google Scholar] [CrossRef]
- Pettitt, W.S.; Young, R.P.; Marsden, J.R. Investigating the mechanics of microcrack damage induced under true-triaxial unloading. In Proceedings of the SPE/ISRM Rock Mechanics in Petroleum Engineering, Trondheim, Norway, 8–10 July 1998. [Google Scholar]
- Huang, D.; Huang, R.Q.; Zhang, Y.X. Characteristics of Brittle Failure and Stress Drop under Triaxial Loading and Unloading. J. Civ. Archit. Environ. Eng. 2011, 33, 1–6. [Google Scholar]
- Miao, J.L.; Jia, X.N.; Cheng, C. The Failure Characteristics of Granite under True Triaxial Unloading Condition. Procedia Eng. 2011, 26, 1620–1625. [Google Scholar]
- Feng, X.-T.; Haimson, B.; Li, X.C.; Chang, C.D.; Ma, X.D.; Zhang, X.W.; Ingraham, M.; Suzuki, K. ISRM Suggested Method: Determining Deformation and Failure Characteristics of Rocks Subjected to True Triaxial Compression. Rock Mech. Rock Eng. 2019, 52, 2011–2020. [Google Scholar] [CrossRef]
- Fairhurst, C.E.; Hudson, J.A. Draft ISRM suggested method for the complete stress-strain curve for intact rock in uniaxial compression. Int. J. Rock Mech. Min. Sci. 1999, 36, 279–289. [Google Scholar]
- Jiang, H. Simple three-dimensional Mohr-Coulomb criteria for intact rocks. Int. J. Rock Mech. Min. Sci. 2018, 105, 145–159. [Google Scholar] [CrossRef] [Green Version]
- Wu, H.; Ma, D. Fracture response and mechanisms of brittle rock with different numbers of openings under uniaxial loading. Geomech. Eng. 2021, 25, 481–493. [Google Scholar]

Publisher’s Note: MDPI stays neutral with regard to jurisdictional claims in published maps and institutional affiliations. |
© 2022 by the authors. Licensee MDPI, Basel, Switzerland. This article is an open access article distributed under the terms and conditions of the Creative Commons Attribution (CC BY) license (https://creativecommons.org/licenses/by/4.0/).