Article

Recovery of Hematite from Banded Hematite Quartzite of Southern India by Magnetic Separation and Reverse Flotation

by
Aspari Kumara Swamy
1,*,
Suresh Nikkam
1 and
Sharath Kumar Palthur
2
1
Department of Fuel, Minerals and Metallurgical Engineering, IIT, Dhanbad 836206, India
2
Department of Mineral Processing, Vijayanagara Sri Krishnadevaraya University, Ballari 583105, India
*
Author to whom correspondence should be addressed.
Minerals 2022, 12(9), 1095; https://doi.org/10.3390/min12091095
Submission received: 5 July 2022 / Revised: 24 August 2022 / Accepted: 24 August 2022 / Published: 29 August 2022
(This article belongs to the Section Mineral Processing and Extractive Metallurgy)

Abstract

:
Recovery and grade are the two crucial performance parameters commonly used in mineral processing plant operations. These two parameters are interdependent. An increase in recovery would result in a decreased product grade and vice versa. The present study enumerates concentration efficiency (CE),which can be adopted exclusively for processing low-grade hematite ore by WHIMS—the reverse flotation route to produce a pellet grade concentrate. In this study, the ore’s amenability by wet high-intensity magnetic separation followed by the reverse flotation of a magnetic concentrate route is investigated on BHQ samples of the Sandur schist belt (Kumaraswamy hills), India, after its characterization by microscopic and XRD studies. Dodecyl amine acetate was used as a collector to float siliceous gangue while depressing hematite using the freshly synthesized caustic starch as a depressant. The separation efficiency of the flotation was evaluated by estimating the grade, recovery, and concentration efficiency. The WHIMS conducted using the feed with the particle size minus 106 µm (d80 = 82 µm) followed by reverse flotation produced a pellet grade concentrate assaying 64.60% Fe, a 0.32 alumina-to-silica ratio with 60.4% Fe recovery, and a yield of 37.4% with 79.0% concentration separation efficiency.

1. Introduction

Iron ore mining has been a major industrial activity that significantly contributes to the country’s economic development. Almost 100% of the iron ore mined in India comes from open-cast mining methods. Therefore, the overburdened material removed during mining is either lateritic or low-grade banded iron formations that occupy much space at the mine sites, causing land degradation [1].
In India, domestic steel production, commensurable with consumption, is expected to rise annually by ~10%, thereby increasing steel production thrice and iron ore requirement by 500 million tons. On the other hand, the fast depletion of high-grade iron ore deposits, the closure of some of the high-grade iron ore mines due to stringent environmental regulations, and increased demand for quality iron ores/agglomerates have forced mineral engineers to look into low-grade iron ores as an alternative raw material. The utilization of iron ore wash-plant tails and the processing of banded iron formations (BIF) to produce high-grade agglomerates for existing steelmaking technologies such as blast furnace (BF) and the direct reduction in iron (DRI), etc. is challenging. An increase in the BF productivity by 40% is reported when charged fully with pellets [2]. As per the Government of India’s National Policy 2017, India’s finished steel consumption is likely to increase by 230 MT by 2030-31. With this projection, the per capita steel consumption is anticipated to increase to 160 kg. Thus, the steel sector will witness the consolidation of global players entering the steel market. The availability of low-cost labor and optimal utilization of low-grade Iron ore deposits (such as Banded Magnetite Quartzite BHQ) can only roll out the government’s initiatives to make India a “self-reliant country” for a quantum jump in the economy. For more than 500 years, the classical method of blast furnace technology has been used for steel making and will continue to remain for a few more years. For this technology, hematite is the only primary raw material in addition to some fluxes and coke. The only development in BF technology is the installation of large-volume blast furnaces to meet steelmaking economics. India does not lack much in this respect, as 4000 m3 blast furnaces have been operating successfully. The specifications of feed for BF and DRI are shown in Table 1.
India is the fifth-largest producer of iron ore after Brazil, Russia, Australia, and China and has a sizable amount of iron ore resources of about 31,213 million tons, of which about 10,747 million tons (34%) is of magnetite. The rest (66%) belongs to the hematitic type, which is the primary source of supply of iron today [2]. The iron ore deposits are located in well-defined belts in Odissa, Jharkhand, Chhattisgarh, Maharashtra, Goa, and Karnataka. Minor deposits are located in Andhra Pradesh, Madhya Pradesh, and Assam. The Donimalai, Ramandurg, Kumarswamy, and Belagal range of the Sandur schist belt of Karnataka is a vital iron ore reserve of the country, producing 15 million tons of iron ore per year. The Kumarswamy range has a maximum of 253 million tons of ore reserve. Due to the current high demand for low alumina and high-grade iron ore pellets, the beneficiation of BHQ of the Ballari–Hospet–Sandur (BHS) region has become inevitable. Beneficiation of BHQ from the study region will be a vital step in conserving high-grade iron ore resources and helps in achieving the sustainability goals [3]. Studies have shown that the beneficiation of hard BHQ and banded iron ore formations (BIF) in the Orissa and Karnataka regions using only magnetic separation methods has failed to produce the required pellet grade concentrates [4]. The possibility of enriching the iron (Fe) values from low-grade ores by flotation has been assessed [5,6,7] to obtain pellet-grade concentrates. The authors of [8,9] evaluated the flotation of BHJ to obtain pellet grade concentrates. The author of [10] beneficiated BHJ samples from the Donimalai range of the Sandur schist belt, producing pellet-grade concentrates using gravity and magnetic separation. However, the work on the beneficiation of BHQ from the Kumarswamy range, which has the highest iron ore reserve in the Sandur schist belt, is almost scanty. Therefore, the objective of the present work is to carry out beneficiation studies on BHQ samples from the Kumarswamy range to produce a pellet-grade concentrate with Fe > 63%, (SiO2 + Al2O3) < 6%, p < 0.05%, S < 0.05%, and Mn and TiO2 < 1%.This study also enumerates a different index known as concentration efficiency (CE) adopted exclusively to suit the beneficiation of low-grade hematitic ores by Wet High Intensity Magnetic Separation WHIMS reverse flotation. If adopted, this beneficiation approach will augment the deficiency in the supply of iron ore material in blast furnace operations besides an effective utilization of low-grade resources.

2. Materials

The low-grade BHQ sample weighing about 1 ton from the Kumarswamy area, Sandur Schist belt, was collected from the mine using standard sampling methods enumerated by Weiss 1985. For material preparation, a lab model Jaw crusher 150 mm wide × 250 mm supplied by M/s Mineral Processing Equipment (MPE), Mumbai, was used for primary crushing purposes. A 200 mm × 150 mm laboratory roll crusher (MPE-Mumbai) was used for secondary crushing. A 175 mm× 350 mm rod mill with 5 kgs of rods ranging from 25 to 40 mm was used for grinding the ore. A laboratory ferrous wheel-type high-intensity magnetic separator (M/s Creative Engineers, Bangalore) was used for magnetic separation studies. The reverse cationic flotation is the most commonly seen in iron ore beneficiation practices. The studies confirmed that reverse cationic flotation is more sensitive toward floating up the lighter gangue in the flotation feed, whereas the anionic route is sensitive toward the ionic composition of the pulp. The quartz removal from iron ore in reverse cationic flotation is significantly faster than that in reverse anionic flotation. Hence, the commercial-grade dodecyl amine (DDA) supplied by M/S. Hi-Media Laboratories Pvt. Ltd. was used as a cationic collector. A freshly prepared 3:1 ratio of corn starch and commercial-grade NaOH was used as a depressant for iron oxides (1% concentration), and a 1% NaOH (commercial-grade) solution was used as a pH modifier. All of the experiments were conducted at pH 10.

Methods

The sample was stage-crushed in a jaw crusher followed by a roll crusher in a closed circuit and stage ground in a laboratory rod mill at 67% solid pulp density to produce particles of varying sizes, minus 300/150/74 µm. The flotation studies were carried out with varying feed sizes below 300/150 and 75-micron sizes. A pulp density of 20% (w/w) and an RPM of 1200 in the agitator was maintained in the experiments. As the natural pH of the slurry was found to be 6.5, NaOH was added in the slurry to maintain the pH at 10. All of the experimental were carried out at room temperature (25 °C). The mixing times of the depressant, collector, and frother were kept at 6 min, 4 min, and 45 s, respectively. The dosing rate of the collector was varied according to the experimental plan. The other parameters are mentioned in the relevant sections. The flotation products obtained after each experiment were decanted and dried at 80–100 °C. The grade and recovery were calculated using the dry weight of the concentrate and tailing. Fe, SiO2, Al2O3, and LOI assays were carried out by wet chemical methods enumerated in the [11].
In the present study, the Box–Behnken factorial design was chosen to build the relationship between the response functions (grade, recovery, and separation index of the flotation concentrate) and flotation variables, namely feed particle size (A), depressant dosage (B), and collector dosage (C) of the flotation experiments. All of the experiments were conducted per the run order designed by the MINITAB Software (Trial Version), with which the effect of three process variables at three levels was studied. The variables and their levels are given in Table 2. The products of each test were dried, weighed, analyzed, and calculated for %Fe grade, %Fe recovery, and % concentration efficiency CE.
The second-order quadratic models for these responses are of the following form:
Y = b0 + b1X1 + b2X2 + b3X3 + b12X1X2 + b13X1X3 + b23X2X3 + b11X12 + b22X22 + b33X32
where Y = the predicted response function (Fe grade /recovery/SE); b0 = constant; b1, b2, and b3 = linear coefficients; b12, b13, and b23 = cross product coefficients; b11, b22, and b33 = quadratic coefficients;andX1, X2, and X3are the coded values of the variables that varied.

3. Results and Discussion

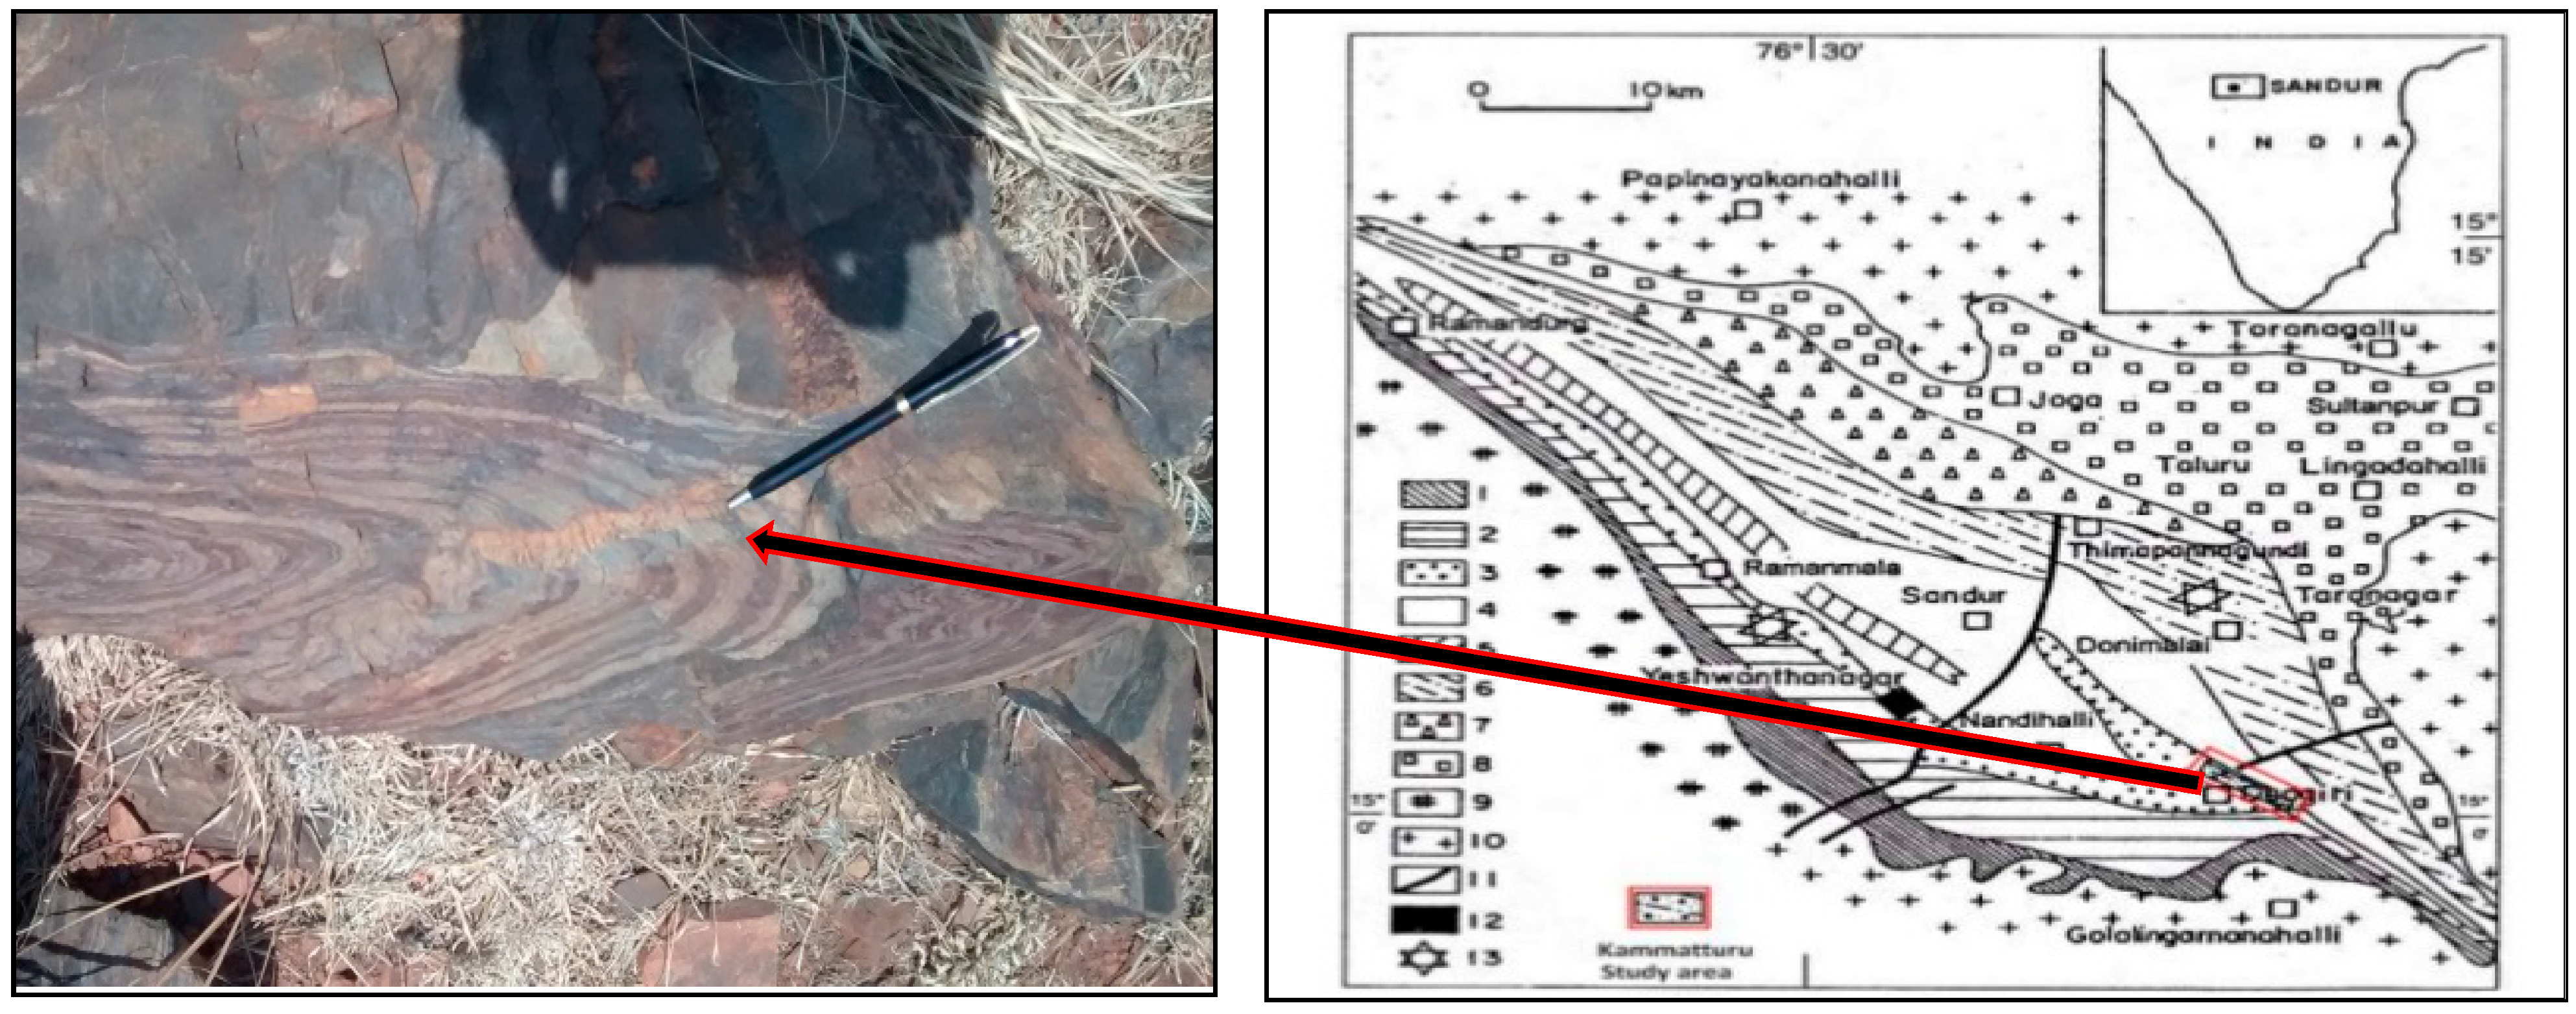
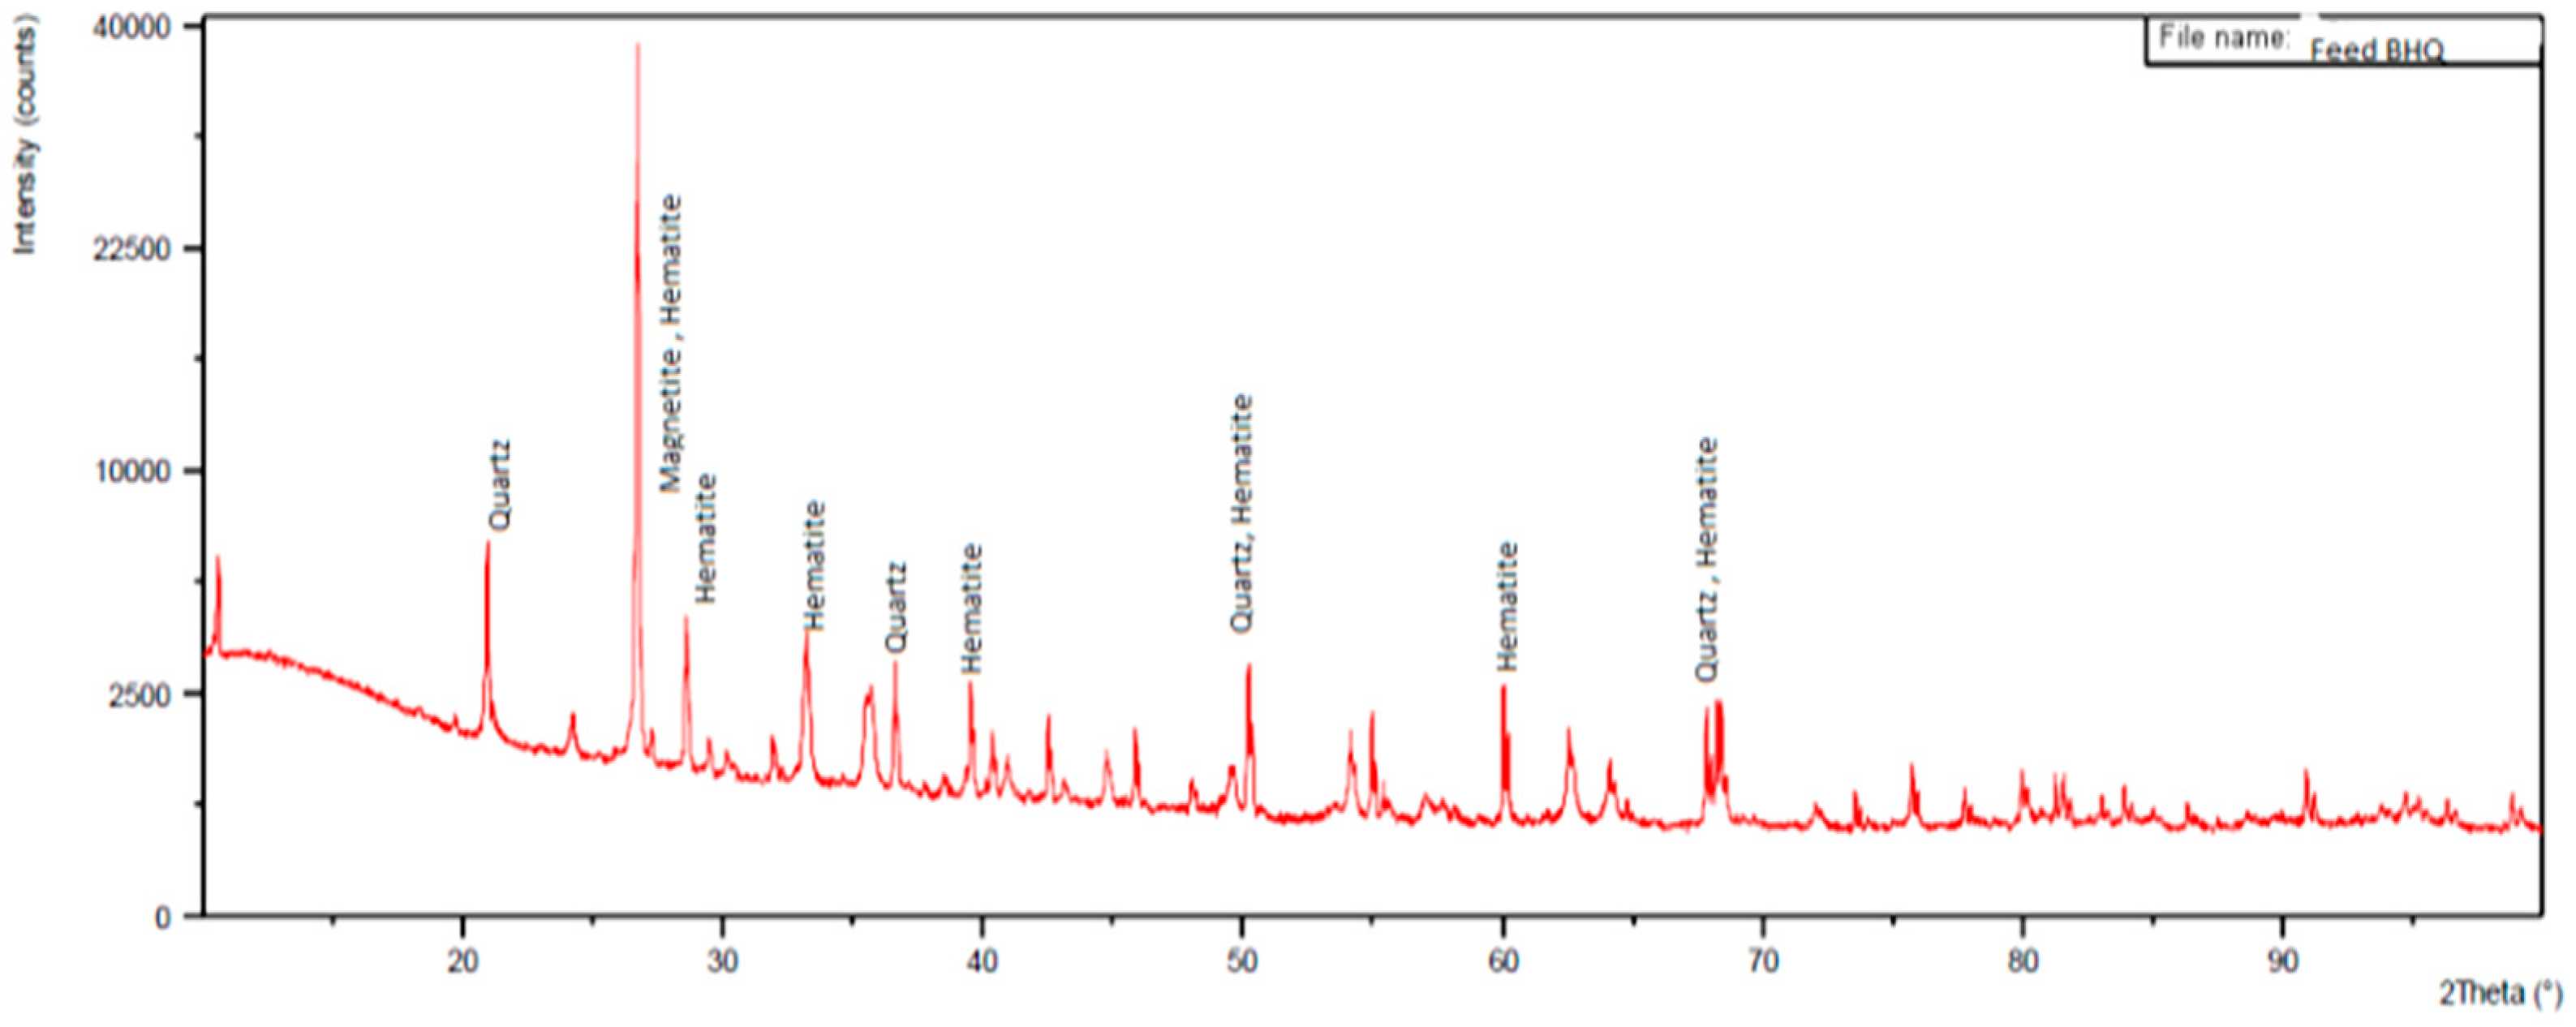
3.1. Feed Material Characterization

The BHQ sample collected had a greyish-brown color, appearing as hard and compact lumps and exhibiting alternative bands of quartz. The sample collection point of iron ore is shown in Figure 1. This ore assayed 42.22% Fe, 34.21% SiO2, 1.98% Al2O3, and 1.06% loss on ignition (LOI). The sample was also analyzed for various physical properties such as the angle of repose, bulk density, specific gravity, and work index (WI). The results were 35°, 1.86 t/m3, and 3.33 and 9.7 Kwh/short ton.

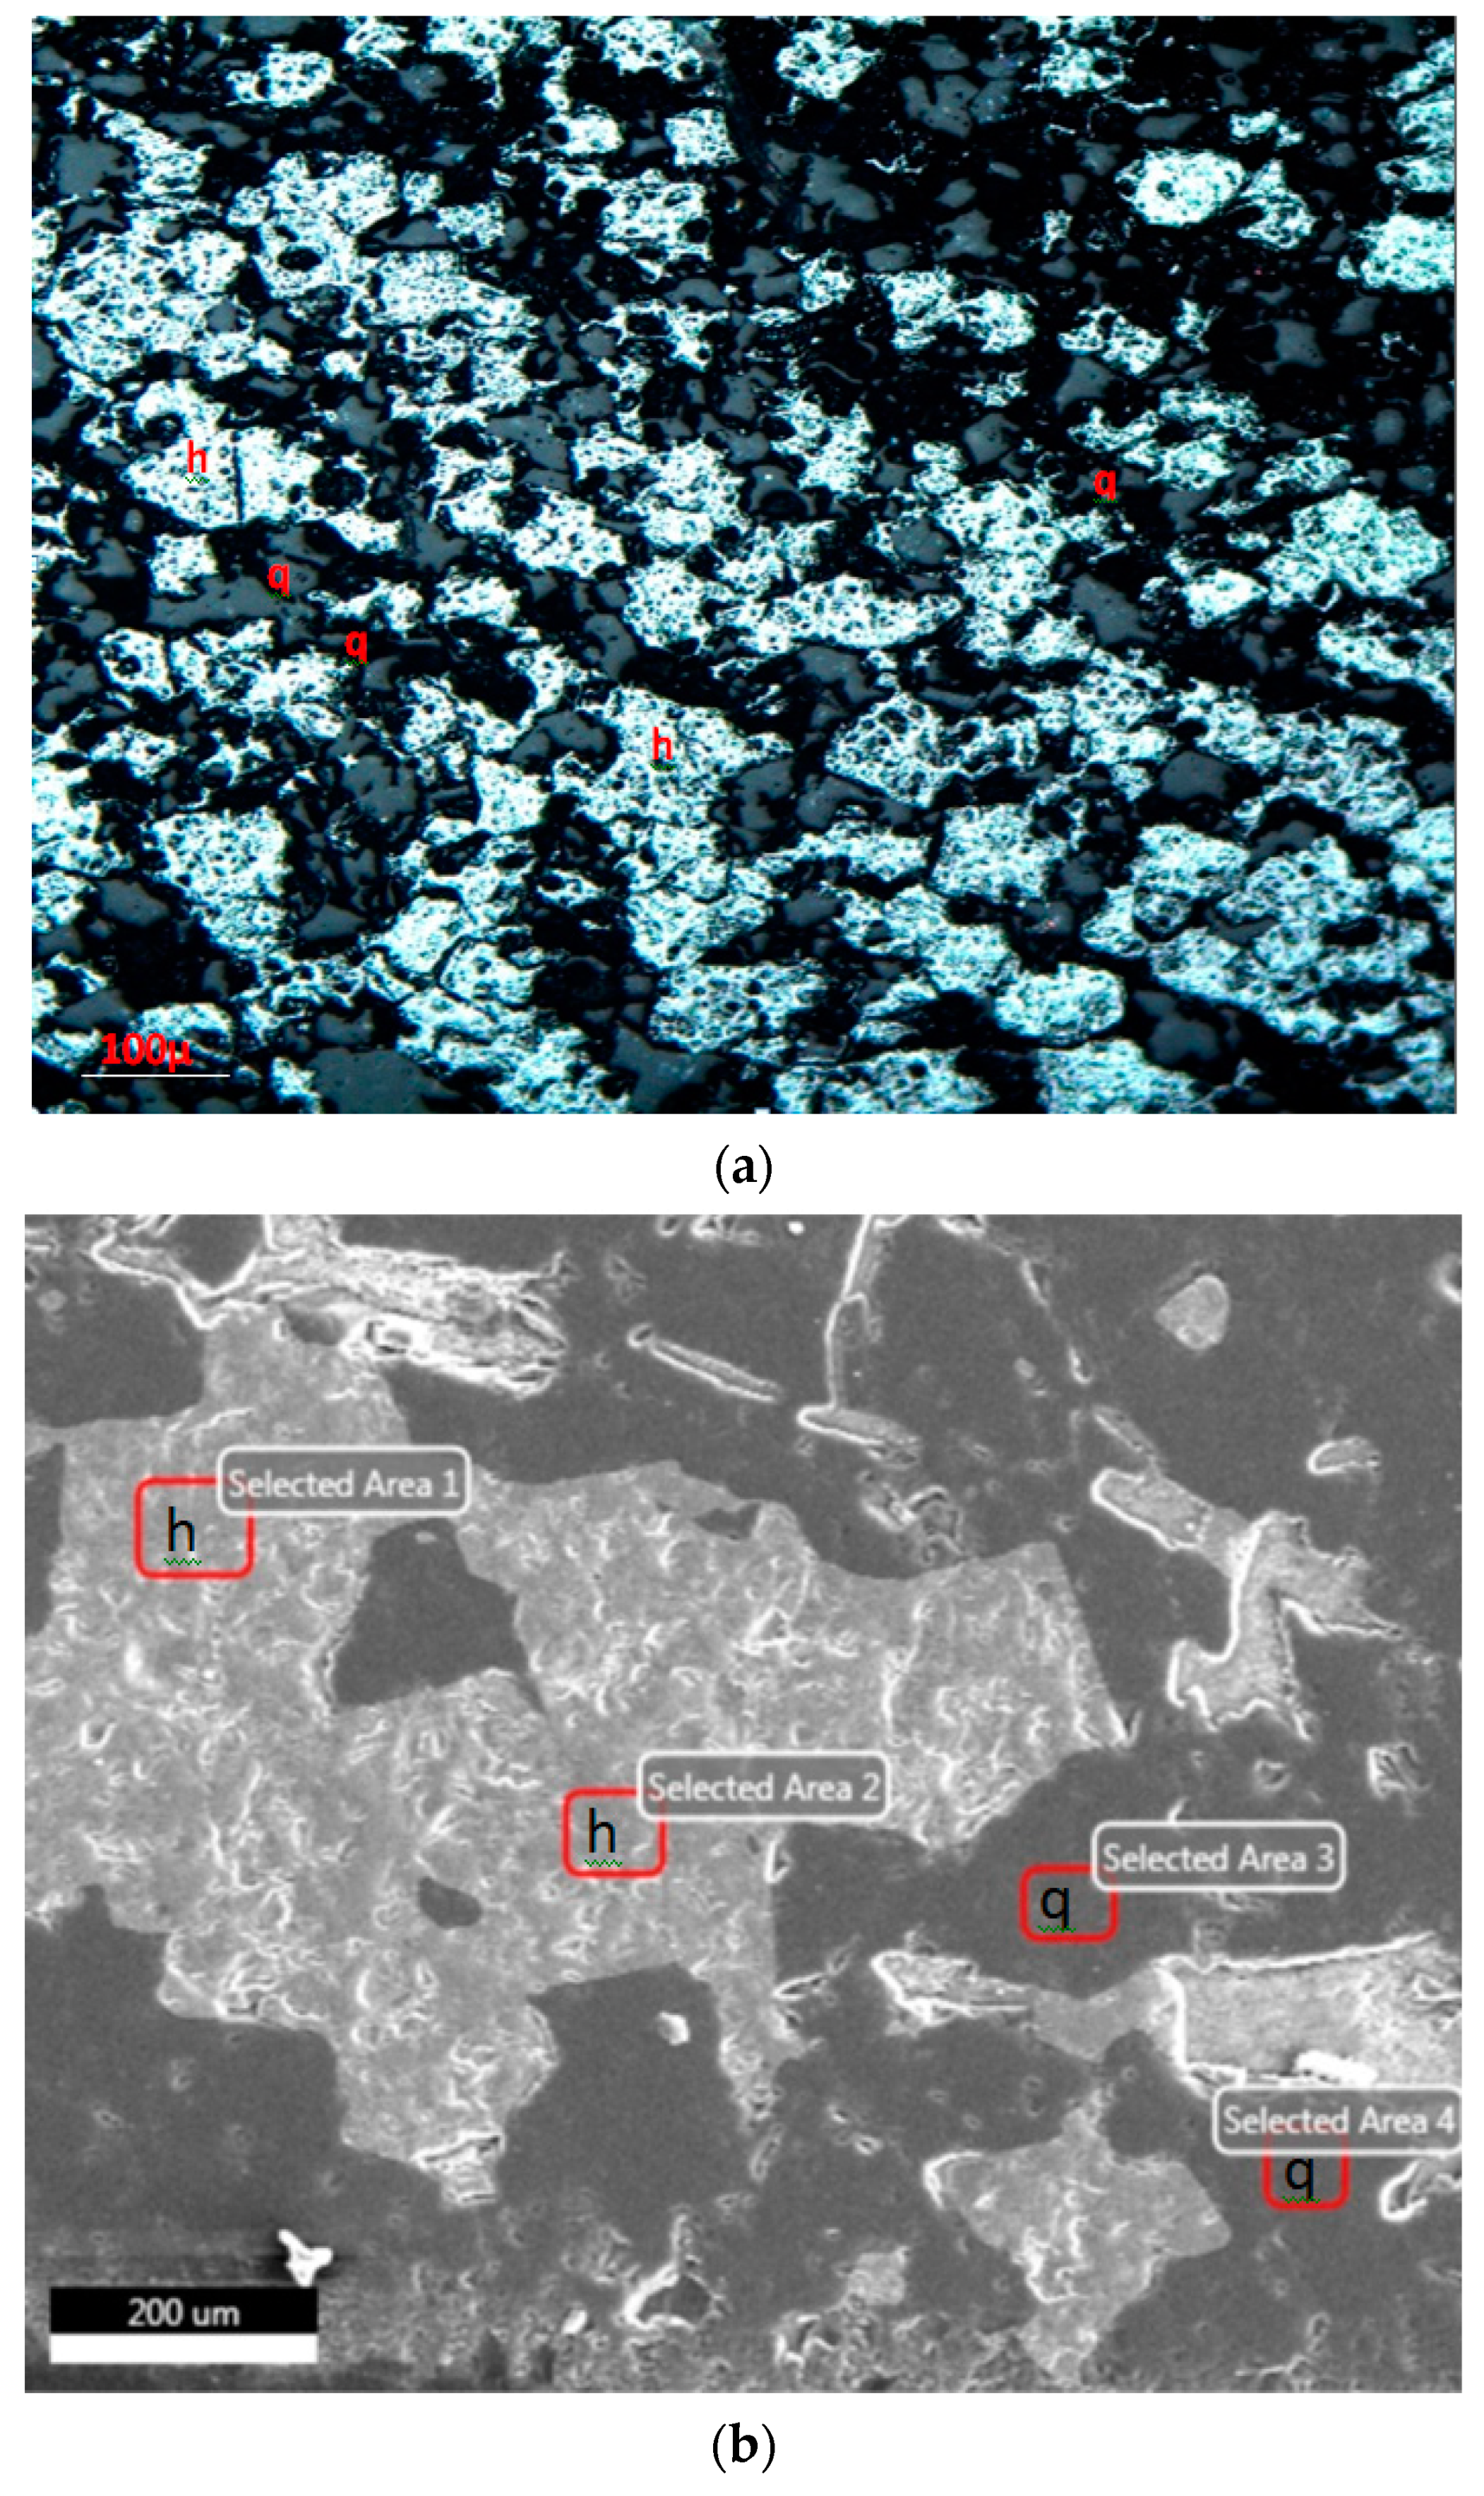
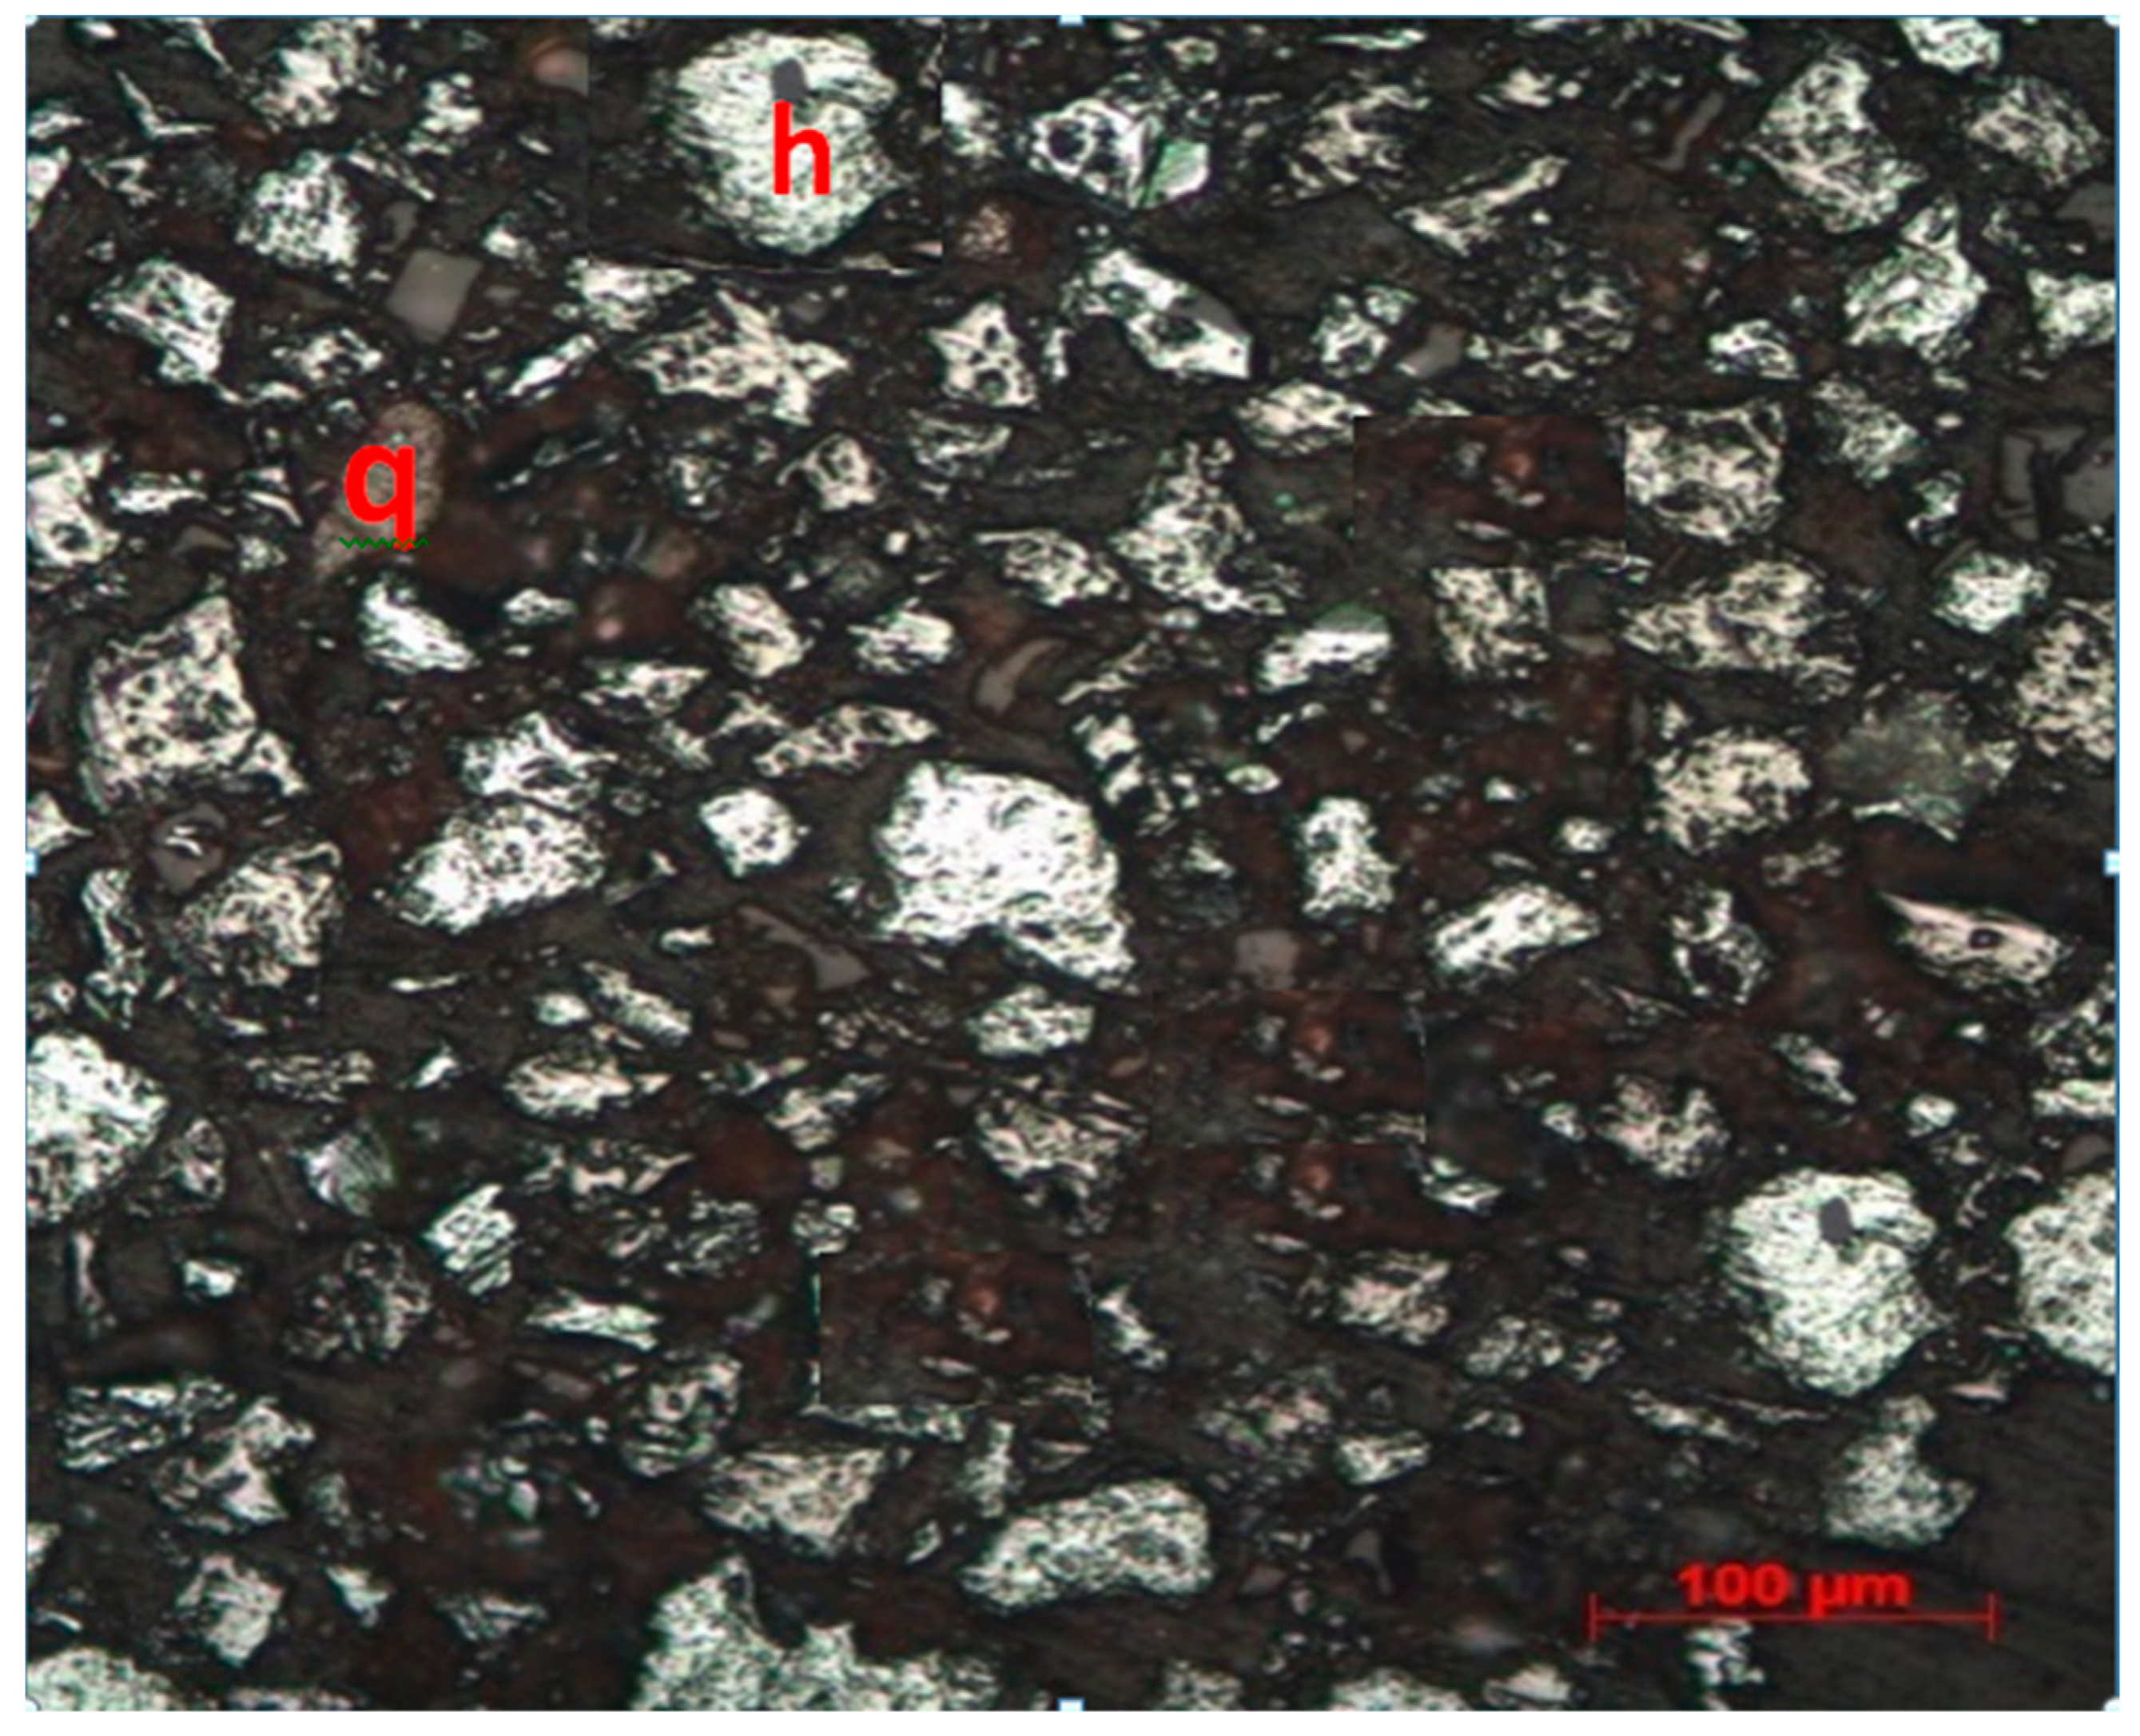
3.2. Mineralogical Studies

The microscopic examination of the as-received sample indicated that the selected BHQ sample contains only “hematite” as the principal iron-bearing mineral. It had mainly about 55%–60% OK to fine-grained hematite in the size range of 0.05–0.1 mm grains intermixed mainly with 30%–35% fine to fine-grained quartz. Minor to trace amounts of ferruginous clay was also observed. In places, hematite and quartz also occur as aggregates and mutual inclusions. The mineralogical studies revealed that the degree of liberation of opaque minerals increased significantly with the increase in size fineness. A fair degree of liberation was noticed at a size of −74 µm, as shown in Figure 2a,b. Figure 2b shows the EPMA image. XRD studies are depicted in Figure 3 and further confirmed by mineralogical findings. The results of liberation are akin to the findings of previous work by [5,6,7,8,9,10,11,12].

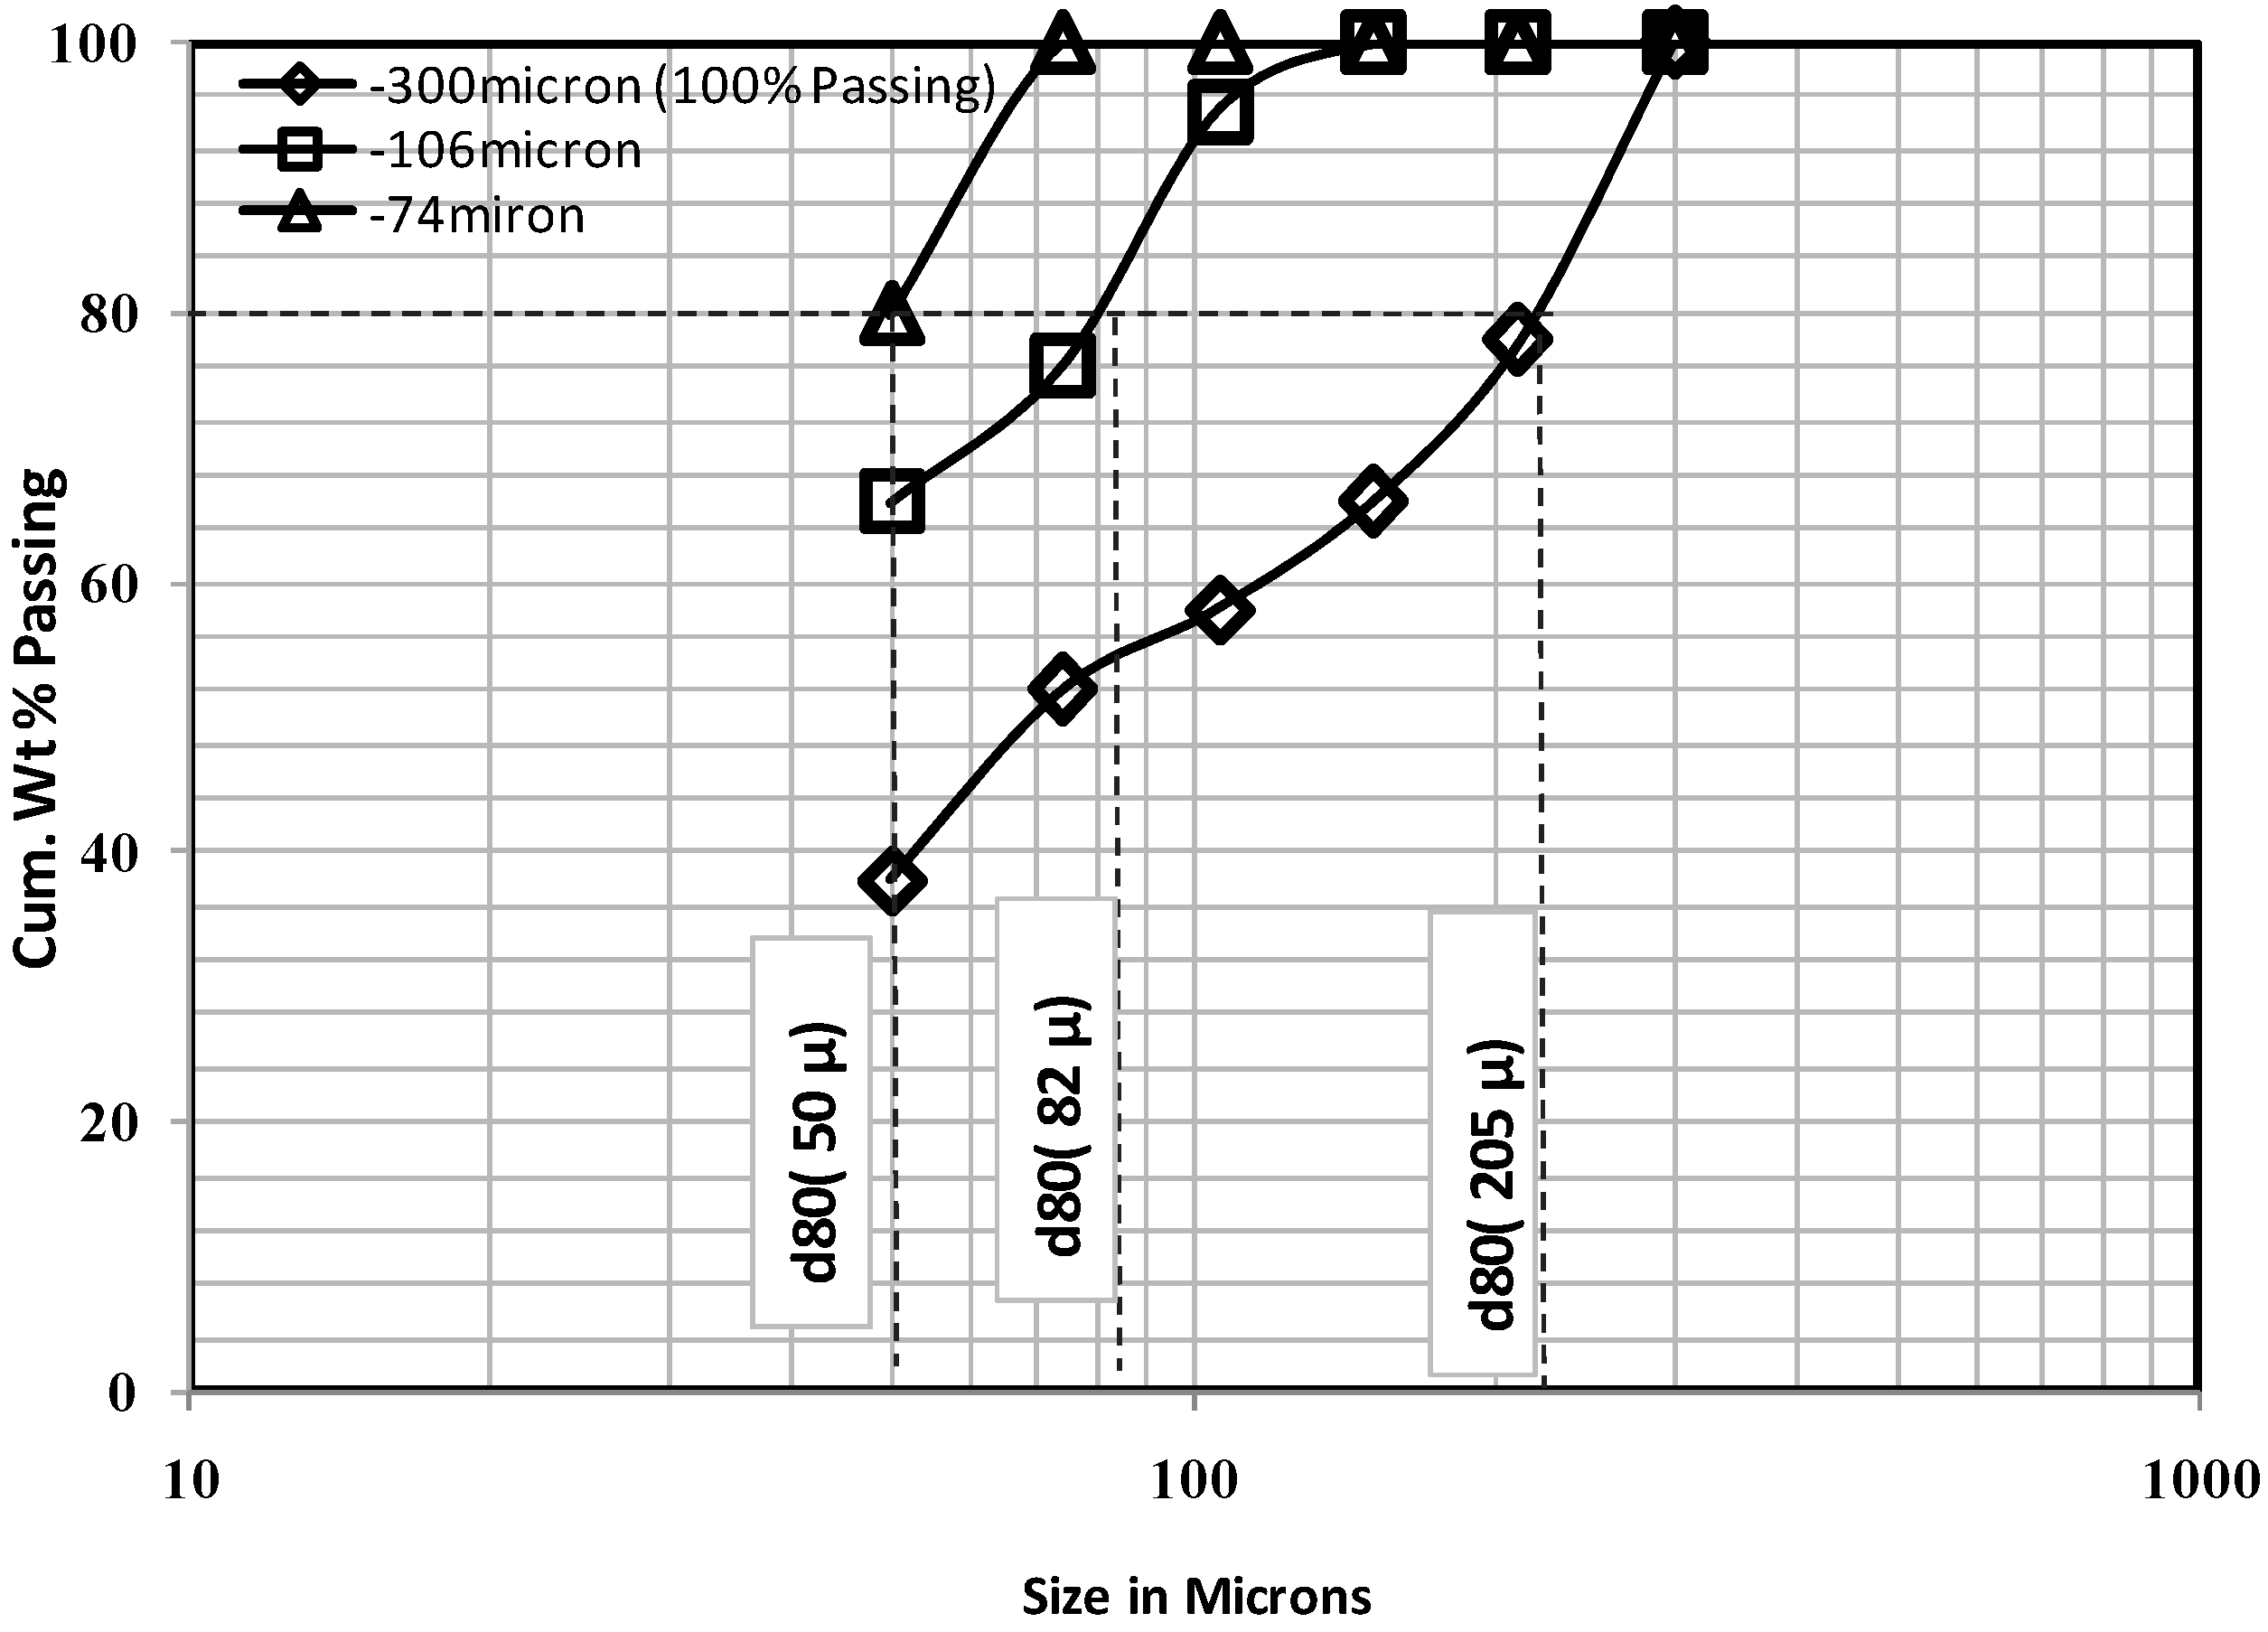
3.3. Process Diagnostic Amenability Tests

Three representative samples were stage ground to 100% passing of 300, 106, and 74-micron sizes separately. The ground sample was subjected to heavy liquid separation tests using Bromoform of 2.89 gm/cc density. Each of these sizes’ float and sink fractions were analyzed for percent Fe recovery. The sink and float tests showed that a decrease in %Fe recovery with a marginal increase in %Fe grade in sinks occurred with the fineness of the ore. Simultaneously, magnetic separation tests were conducted on ground samples using a one-tesla intensity bar magnet. The results indicated that the concentration grade increased with a decrease in particle size. A concentrate assaying about 60% Fe could be obtained at a size of −74 µm.
Furthermore, magnetic bar separation yielded better %Fe recovery than heavy liquid separation. These amenability tests inferred that the sample is amenable to fine-particle separation. Hence, reverse flotation tests were conducted to separate quartz effectively from the hematite of BHQ [13,14,15,16,17]. Batch stage grinding of the BHQ sample was carried out in a laboratory rod mill at 67% solids. The size distribution of the stage-ground samples is shown in Figure 4.

3.4. Wet High-Intensity Magnetic Separation Tests

Wet high-intensity magnetic separation tests were conducted varying MOG minus 500 µm/minus 106 µm and minus 74 µm at 25% solids, 1 T intensity, and 6 mm matrix. The results are shown in Table 2. At a grind of minus 106 µm, optimal results were shown. The %Fe grade and %Fe recovery dropped at a very fine MOG of minus 74 µm due to slime interference and a coarse MOG of minus 300 µm due to interlocking. Similar results were reported by [16,18] while working with BHQ/BHJ of the Ballari area.

3.5. Reverse Flotation Tests

Reverse flotation is the most popular methodology for processing fine-grained low-grade siliceous iron ores such as BHQ/BIF [2]. The earlier researchers had conducted beneficiation tests on the samples of different localities and concluded that reverse flotation is the ultimate solution to enriching the banded iron formations for producing pellet-grade concentrates [19]. In this context, batch reverse flotation tests were attempted for the BHQ samples of Kumaraswamy hills of the Sandur Schist Belt using the three flotation variables, namely feed particle size (A), depressant dosage (B), and collector dosage (C). The experimental test runs designed by the MINITAB for the three variables at three levels are given in Table 3.
The performance of the flotation was evaluated based on the index known as concentration efficiency (CE), also termed separation efficiency [20,21], which provides a measure of the effectiveness of the separation. According to the CE, an index of 100 indicates a perfect separation between the valuable minerals and the gangue, while zero suggests no separation. Therefore, the numerical value of this separation efficiency served as a helpful tool for measuring the extent of separation. Hence, the concentration efficiency of each experiment was evaluated based on the recovery of iron-bearing minerals defined by
Concentration   Efficiency (   %   ) = ( Y × ( c f ) × Cm ) f × ( Cm f )
where: CE is concentration efficiency in %, c is the %iron in the concentrate, cm is the maximum (theoretical) iron %in the concentrate (~70% for hematite), and f is the Fe% in the feed ore Y yield of concentrate in%. So far, the feed value of 42.22% Fe, hence the CE, will be reduced to
CE = 0.059683   X ( Y × ( c 42.22 ) )
The statistically designed experiments (15 numbers) were conducted, and the results were analyzed using the statistical software (MINITAB V.17 trial version) package. From the experimental results shown in Table 3, the second-order response functions representing the %Fe grade, %Fe recovery, and % concentration efficiency (CE%) of the flotation concentrate could be expressed as a function of the MOG of feed (D80 passing), depressant dosage (kg/t), and collector dosage (kg/t). The equations for the %Fe grade, % recovery, and %CE of the flotation product (concentrate) are presented in Equations (2)–(4), respectively.
Grade ( %   F e ) = 97.85 0.3087 × A 48.6 × B 59.6 × C + 17.99 × B × B + 655 × C × C + 0.2510 × A × B 122 × B × C
Recovery ( %   F e ) = 9.29 + 0.3951 × A + 65.49 × B + 293 × C 0.196 e 3 × A × A 24.11 × B × B 438.5 × C × C 0.1433 × A × B 0.7303 × A × C
ConcentrationEfficiency     % = 2211 0.0201 × A 160 × B 24127 × C + 352 × B × B + 1.02 e 5 × C × C + 0.0127 × A × B 0.001 × A × C 6264 × B × C
An analysis of variance (ANOVA) is presented in Figure 4 and Figure 5 to describe the relative significances of the variables and their interactional effects on grade, recovery, and CE. Figure 4 and Figure 5 show that the combination of particle size and the depressant dosage is the most influential parameter (Equation (2)). However, the depressant dosage has emerged as a significant independent parameter for the recovery and concentration efficiency models.
The relationship between the predicted and observed values of responses is expressed as the coefficient of multiple determinations. The importance of R2 estimated for grade, recovery, and CE is 0.937, 0.994, and 0.857, respectively, within acceptable limits (Table 4).

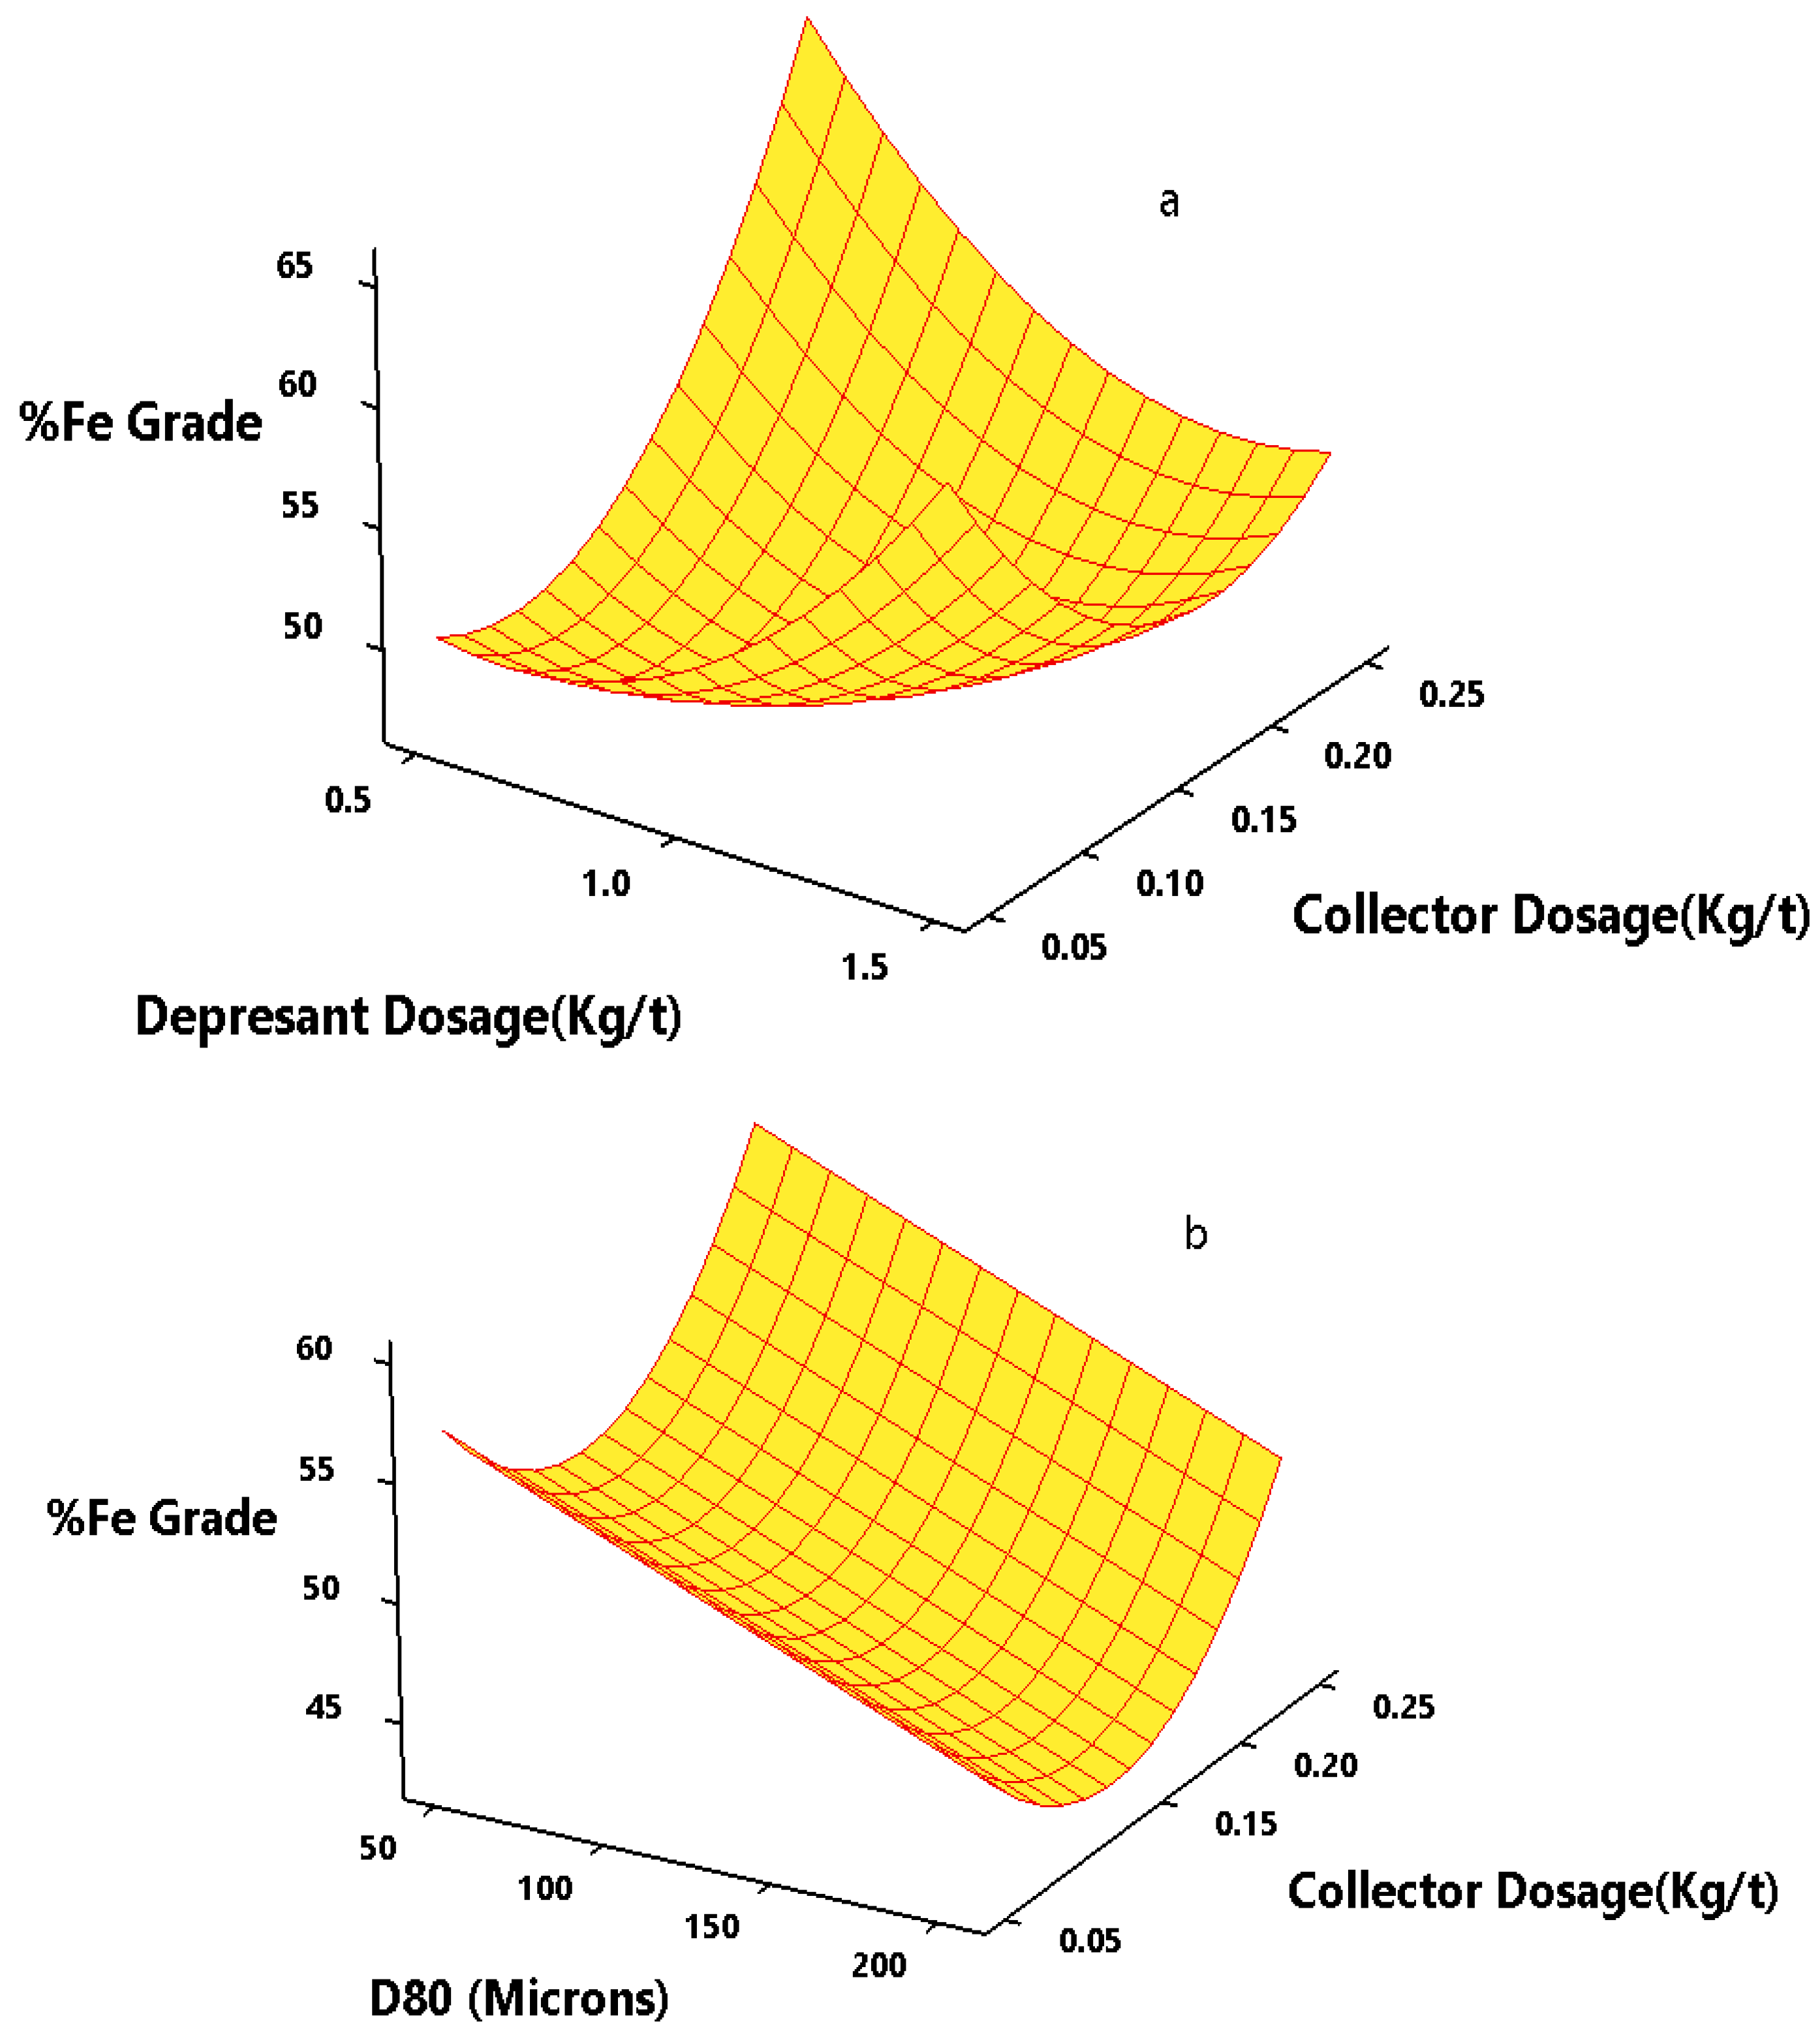
3.5.1. Effect of Flotation Variables on Grade (%Fe) of Concentrate

The effect of depressant and collector dosages on the grade (%Fe) of the flotation concentrate at the central level of the feed particle size (D80 = 82 µm) is shown in Figure 5a. It is observed that a higher grade concentrate is obtained at a lower level of depressant dosage and a higher level of collector dosage. Higher levels of depressant dosage have decreased the grade of the concentrate by depressing SiO2, a major gangue. It is also observed from Figure 5b that grade dilution increases with an increase in the collector dosage at coarser fractions, which is attributed to the interactional effects between starch and amine molecules, suggesting that the clathrate effect causes quartz depression [19]. The optimal values were found with the 64% Fe grade at a D80 value of 50 µm, a 0.5 kg/t depressant dosage, and a 0.25 kg/t collector dosage.

3.5.2. Effect of Flotation Variables on Recovery (%Fe) of Concentrate

Figure 6a presents the effect of collector and depressant dosages at D80 82 µm on iron recovery in a flotation concentrate. The results observed that the increases in depressant dosage, concentration grade, and recovery rate changed when the starch dosage was 0.5–1.0 kg/t, and the concentrate recovery rate decreased. With an increase in starch dosage, the grade of concentrate increased accordingly. When the dosage was 1.5 kg/t, the concentrate recovery dropped significantly, and the concentrate grade increased (Figure 6b). The high proportion of finer size range particles in the feed increased the cationic collector dose and reduced selectivity [22]. A concentrate grade of 64.6% Fe with 90.5% Fe recovery could be achieved at a size of D80 82 µm (medium level), with a 0.5 kg/t depressant (low level) and a 0.25 kg/t collector (high level).

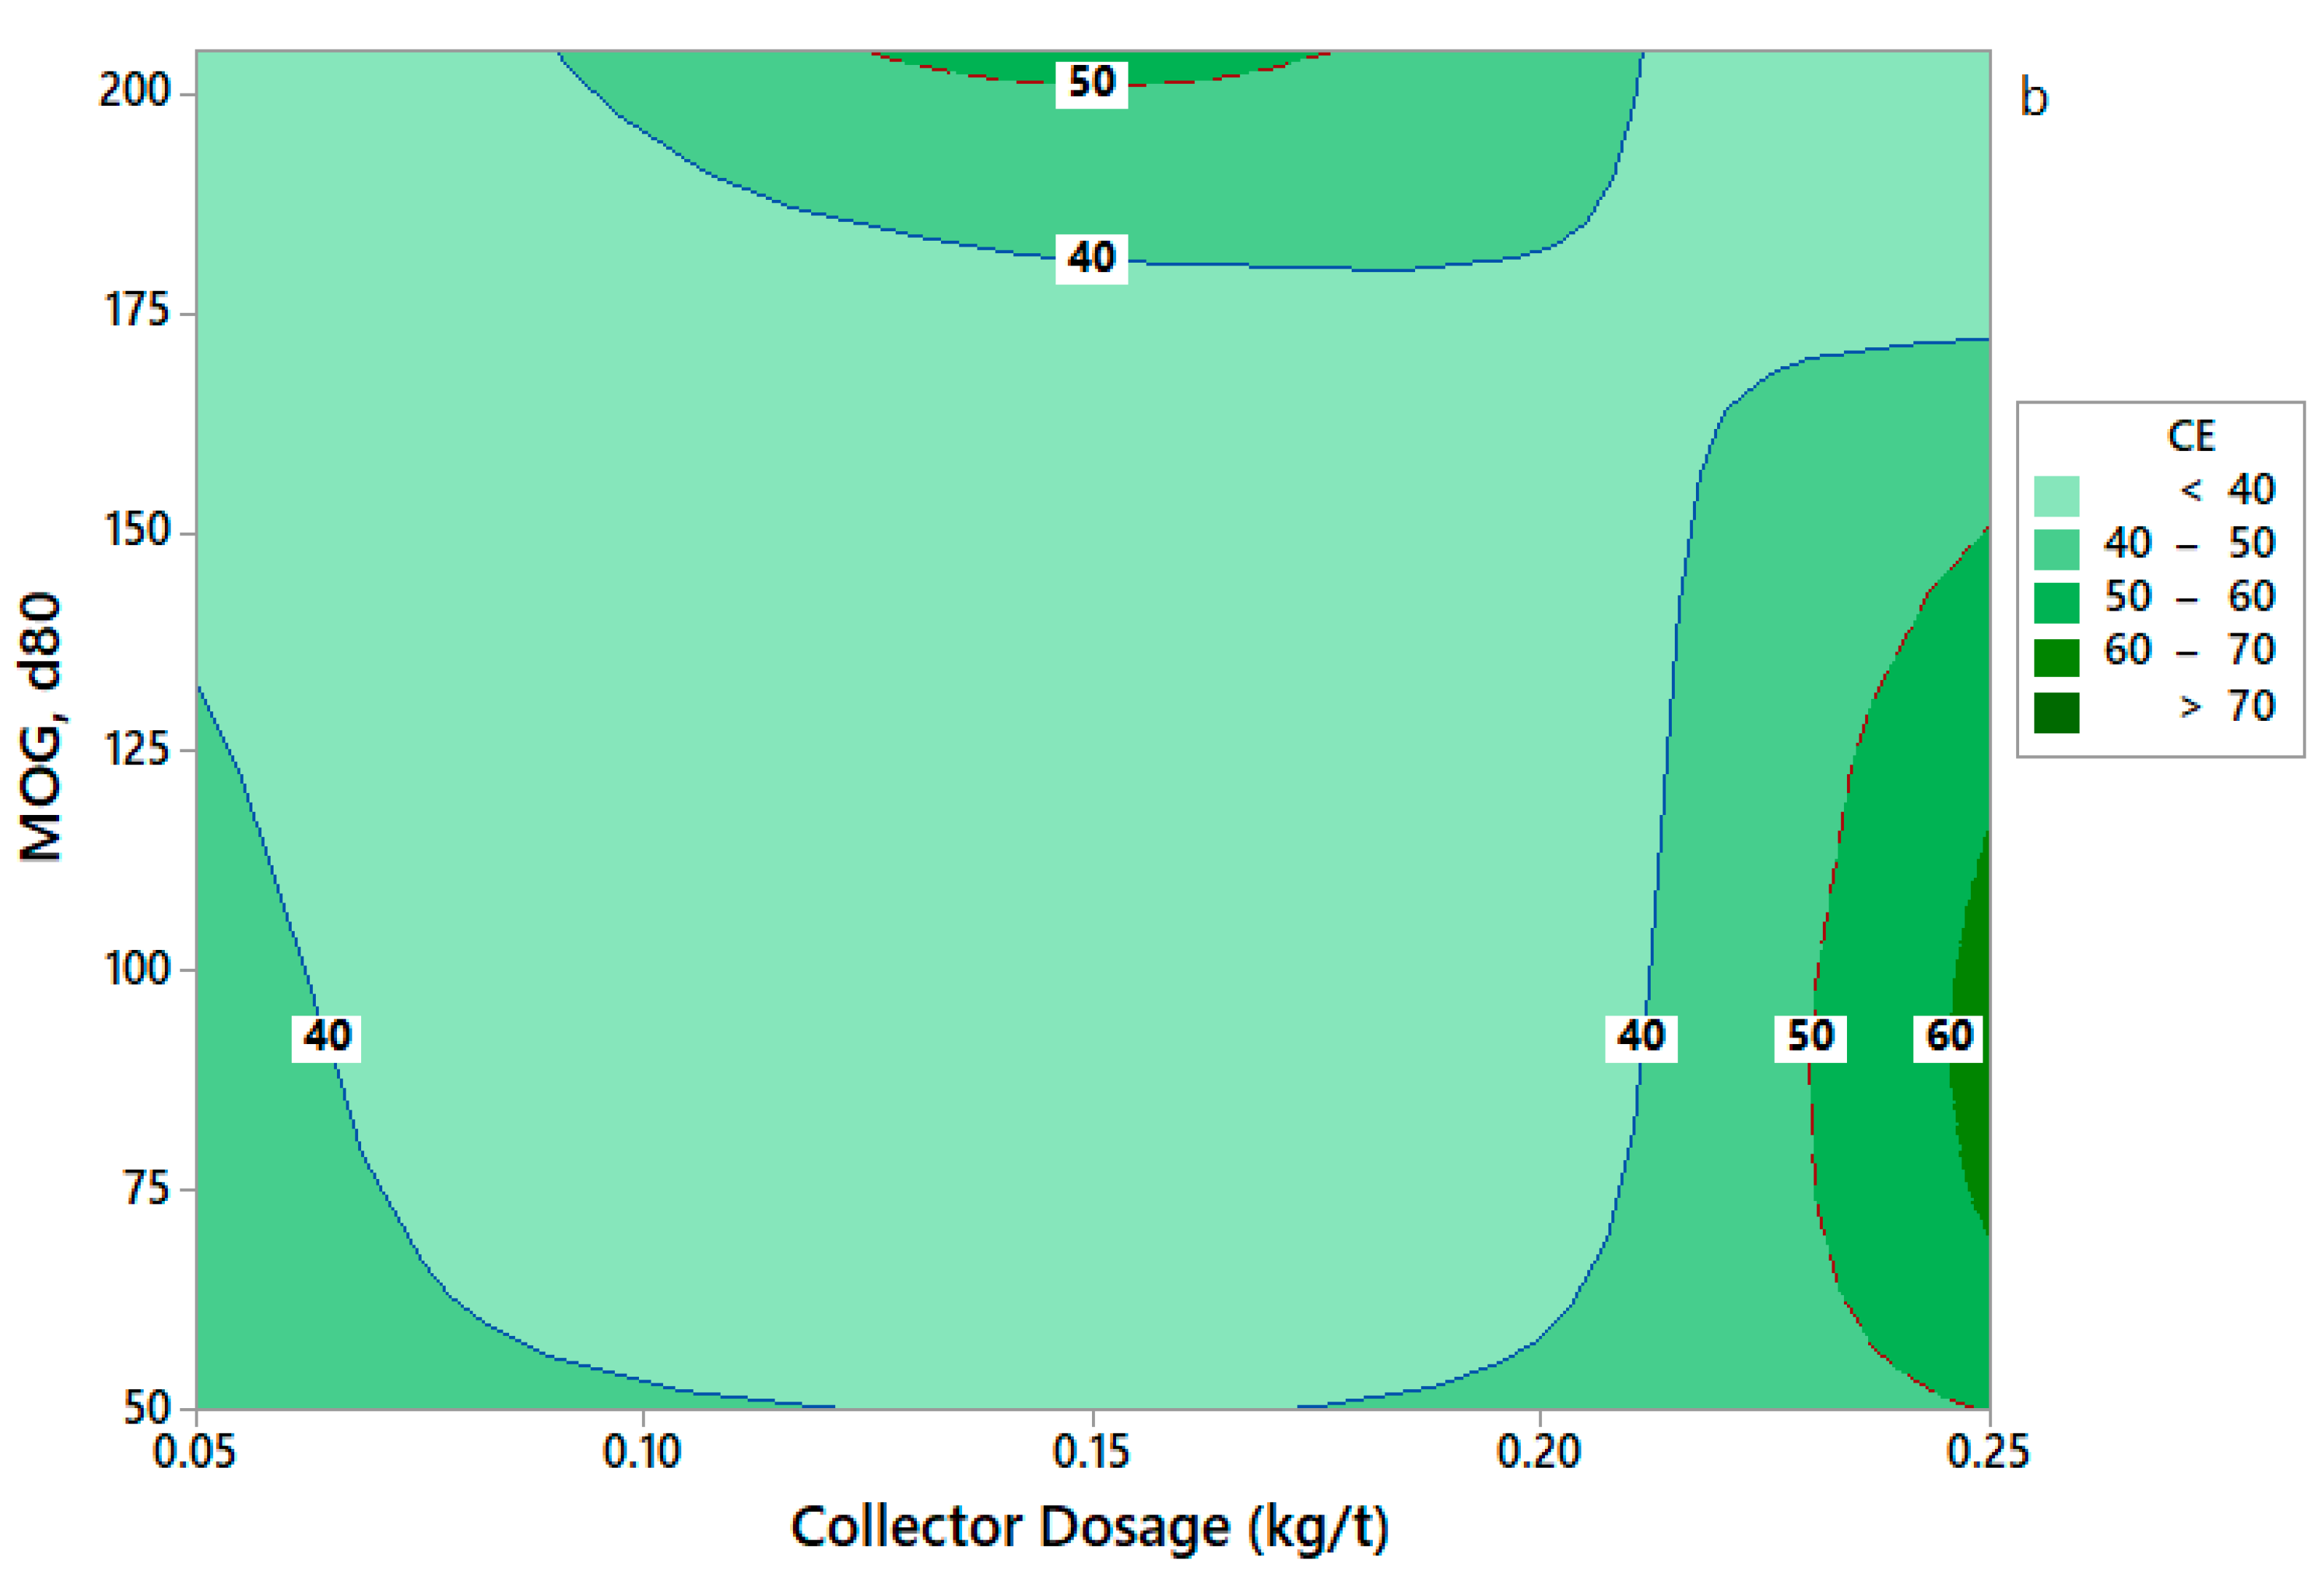
3.5.3. Effect of Flotation Variables on Concentration Efficiency (CE)

The flotation products were analyzed for %Fe and calculated for %Fe grade, %Fe recovery, and %Fe CE. The results are shown in Table 3. Figure 7a indicates the CE values of the flotation tests under designed conditions. The maximum CE was found to be 79%.
Figure 7a explains the effects of depressant dosage and D80 on the flotation system’s CE at the collector dosage’s center level. The contour graph shows that the separation efficiency of the flotation system increases as the depressant dosage and D80 decrease. This may be attributed to coarse particles in the system possessing a lower specific surface area. Therefore, they require lower depressant dosages [23,24]. It is also observed that a slight improvement in CE occurred at coarser fractions using higher depressant dosages.
Figure 7b shows the effects of feed particle size (D80) and collector dosage on the concentration efficiency of the flotation system at the central level of the depressant dosage. It is observed that CE is higher at a higher collector dosage and a lower D80 feed size. The results indicate that collector consumption for the coarse fraction is less compared with that of the fine fraction, similar to observations recorded by [24].

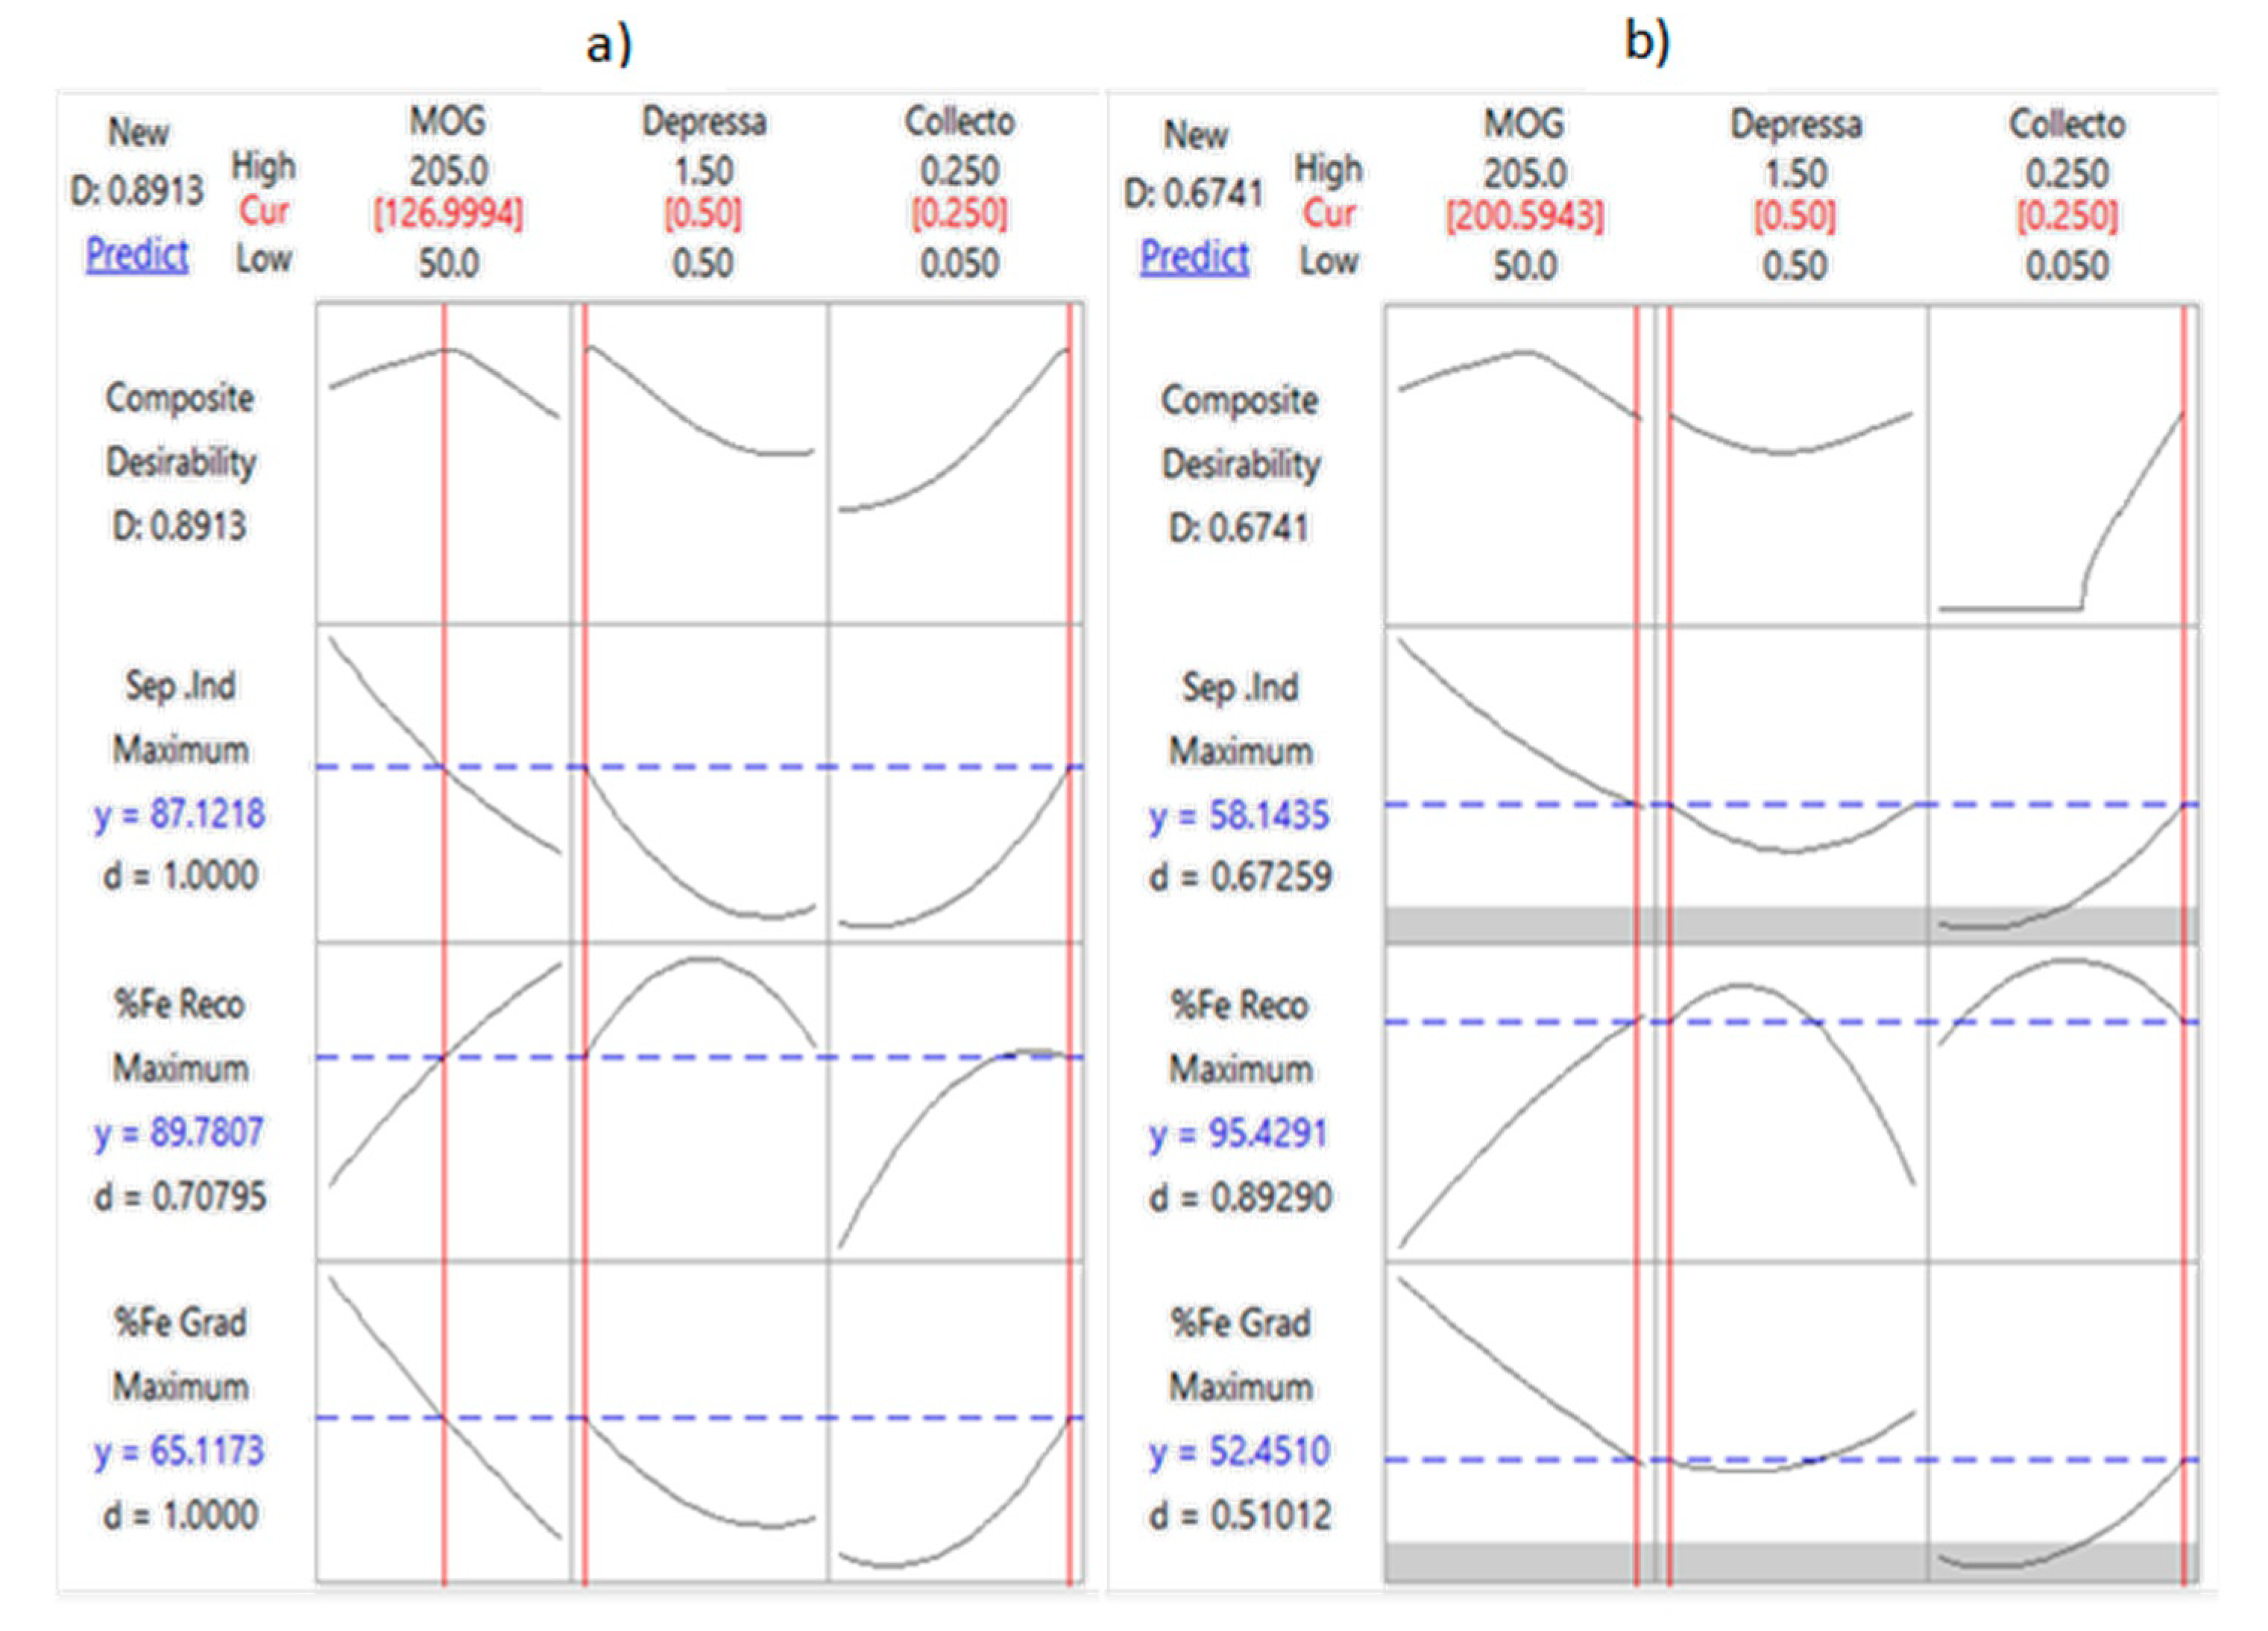
3.5.4. Optimization Studies

Optimization studies of reverse flotation using a MINITAB response optimizer are studied here. The key features of the response optimizer tool of MINITAB identify the combination of input variable settings that optimize a single response or a set of reactions by satisfying the requirements for each response in the collection. The optimization was accomplished by [25]:
a.
Obtain the individual desirability (d) for each response;
b.
Combine the individual desirability to obtain the combined or composite desirability (D);
c.
Maximize the composite desirability and identify the optimal input variable settings.
The optimization of flotation process is very critical and requires keen attention to optimize the reagent dosages based on the grade and recovery of the system [26,27,28].This study’s main objectives are the optimized combination of particle size, depressant dosage, and collector dosage variables to produce maximum responses such as grade (%Fe), recovery (%Fe), and separation efficiency. In optimization, the goal is to maximize the response obtained from the experimental results. The figure depicts the optimization value of all of the responses.
Figure 8 shows the very fine inclusions of quartz (Q) in hematite grains of flotation concentrate and chert/jasper (J) in hematite (H) grains. Similar results were obtained by [29] by magnetic separation followed by flotation, and the results with magnetic separation followed by flotation were better than that of flotation followed by magnetic separation while working on BHQ of peninsular India.
Based on the response analysis of flotation of the WHIMS concentrate, a maximum grade of 65.10% Fe of the flotation concentrate could be achieved by optimizing the process variables at a feed size of D80 of 82 µm, a depressant dosage of 0.5 kg/t, and a collector dosage of 0.25 kg/t with a recovery of 89.7% with respect to its WHIMS concentrate at 1 T intensity and a D80 of 82 µm, as shown in Figure 9a. Similarly, a maximum recovery of 95.42% Fe on the flotation concentrate could be achieved by optimizing the process variables for the WHIMS concentrate at 1 T intensity, a D80 of 200 µm, a depressant dosage of 0.5 kg/t, and a collector dosage of 0.25 kg/t with a grade of 52.5% Fe, as shown in Figure 9b. It is also observed from the optimization study that, to achieve a better grade, the process parameters should be at a middle value of D80. Optimal result by were obtained by WHIMS followed by flotation at 1 T intensity, an MOG of −106 µm, a D80 of 82 µm, a pH of 10, and 20% solids with a 0.5 kg/t caustic starch depressant and a 0.25 kg/t dodecyl amine collector, producing a concentrate with 64.60% Fe, 3.12% SiO2, 1.00% Al2O3, 4.12% SiO2 + Al2O3, a 0.32 Al2O3-to-SiO2 ratio, 1.06% LOI, 60% minus 45µm with 60.4% Fe recovery at a wt. % yield of 37.4, and a %Fe concentration efficiency of 79.0 (refer to Table 5).

4. Conclusions

The reverse cationic flotation method is a widely used flotation route in the mineral industry to recover iron values from poor-grade iron ores. Iron ore flotation essentially for silica removal has been reviewed extensively by [26,27,28,29,30,31]. Several iron ore producers in Brazil employ reverse flotation separation of silica from low-grade iron ores for producing pellet-grade concentrates. It has been reported that the presence of gibbsite and clay as the major alumina-containing minerals in iron ores dictates the choice of beneficiation flow sheet. A systematic study of the flotation process development was undertaken for a fine-grained siliceous BHQ from Kumarswamy hills, the Sandur schist belt, Ballari, Karnataka, India. The feed assaying 42.22% Fe, 34.21% SiO2, 1.98% Al2O3, and 2.06% LOI was subjected to reverse flotation to achieve the stipulated pellet grade specifications of Fe > 63%, with (SiO2 + Al2O3) < 6%, p < 0.05%, S < 0.05%, and Mn and TiO2 < 1%. The developed process showed a need for the feed’s high-intensity magnetic separation (WHIMS) at 1 T intensity followed by reverse flotation of the WHIMS concentrate. Flotation studies at a pH of 10, with 20% solids (w/w), a depressant dosage of 0.5 kg/t, and a 0.25 kg/t collector dosage have met the pellet concentrate specifications with the following quality with 60.4% Fe recovery at 37.4 wt. % as shown in Table 6.
The BHQ resource from Kumaraswamy hills, the Sandur schist belt, can be used as a raw material for steel making through flotation followed by pelletization of the concentrate, thereby fulfilling the objective.

Author Contributions

Conceptualization, S.N. and A.K.S.; methodology, A.K.S.; formal analysis, S.K.P. All authors have read and agreed to the published version of the manuscript.

Funding

This research received no external funding.

Conflicts of Interest

The authors declare no conflict of interest.

References

  1. Swamy, K.; Suresh, N.; Kumar, P.S. Resource Management and Utilization of Lean Grade Iron Ore Resources of Karnataka, India. J. Mines Met. Fuels 2022, 70, 233–241. [Google Scholar] [CrossRef]
  2. IBM. Iron and Steel Vision 2020; Indian Bureau of Mines: Nagpur, India, 2011. [Google Scholar]
  3. IBM. Monograph on Iron Ore; Indian Bureau of Mines: Nagpur, India, 1997. [Google Scholar]
  4. Raj, B. Development of a Process flow sheet for Beneficiation of Indian Banded Hematite Quartz (BHQ) Iron Ore. In Proceedings of the Iron Ore 2007 Conference Perth: AusIMM, Perth, Australia, 20–22 August 2007; pp. 375–380. [Google Scholar]
  5. Anupam, A.; Singh, G.; Raghav, P.K.; Suresh, N. Studies on beneficiation of BHQ samples by different methods. In Proceedings of the XI International Seminar on Mineral Processing Technology (MPT-2010), Jamshedpur, India, 15–17 December 2010; p. 572. [Google Scholar]
  6. Das, B.; Rath, S.S.; Reddy, P.S.; Das, S.K.; Mishra, B.K. The flotation response of Banded Iron Ore of Karnataka Region, India. In Proceedings of the 26th International Mineral Processing Congress (IMPC 2012), New Delhi, India, 24–28 September 2012; pp. 1030–1040. [Google Scholar]
  7. Mohan Rao, A.; Rudramuniyappa, M.V.; Hiremath, M.S.; Naganoor, P.C. Flotation studies on banded hematite quartzite from Sandur Schist belt, Bellary district, Karnataka. In Proceedings of the 26th International Mineral Processing Congress (IMPC 2012), New Delhi, India, 24–28 September 2012; pp. 34–52. [Google Scholar]
  8. Gurulakshmi, S.N.; Ghosh, T.K.; Mukherjee, A.K. State of Art Characterization Study of Banded Hematite Jasper for Beneficiation. In Proceedings of the XI International Seminar on Mineral Processing Technology (MPT-2010), Jamshedpur, India, 15–17 December 2010; p. 440. [Google Scholar]
  9. Gurulakshmi, S.N.; John, S.T.; Dixit, T. Flotation studies on Banded Hematite Jasper iron ores. In Proceedings of the 26th International Mineral Processing Congress (IMPC 2012), New Delhi, India, 24–28 September 2012; p. 5181. [Google Scholar]
  10. Nanda, N.K.; Gopalkrishna, S.J. Development of Process for Beneficiation of low-grade iron ore fins from Karnataka. J. Mines Met. Fuels 2015, 5–9. [Google Scholar]
  11. IBM. Chemical Analysis of Ores Samples; Indian Bureau of Mines Nagpur: Nagpur, India, 2011. [Google Scholar]
  12. Menasinakai, V.; Pujar, G.S.; Swami, M.; Asode, A.N. Mineralogy of Banded Iron Formations in and around Kammatturu, Sandur Schist Belt, Karnataka. 2014. Available online: www.semanticscholar.org (accessed on 25 March 2021).
  13. Krishna, S.J.; Patil, M.R.; Rudrappa, C.; Kumar, S.P.; Ravi, B.P. Characterization and processing of some Iron ores of Indium. J. Inst. Eng. Sec D 2013, 113–120. [Google Scholar] [CrossRef]
  14. Mishra, B.K.; Reddy, P.S.; Das, B.; Biswal, S.K.; Prakash, S.; Das, S.K. Issues Relating to Characterization and Beneficiation of Low-Grade Iron Ore Fines. December 2007. Available online: www.worldsteel.org (accessed on 15 April 2022).
  15. Somasundaran, P. Adsorption of starch and oleate and interaction between them on calcite in aqueous solutions. J. Colloid Interface Sci. 1969, 31, 557–565. [Google Scholar] [CrossRef]
  16. Filippov, L.O.; Filippov, I.V.; Severov, V.V. New technologies for producing hematite concentrate from wastes generated in the processing of iron quartzite. Metallurgist 2010, 54, 268–272. [Google Scholar] [CrossRef]
  17. Somasundaran, P.; Cleverdon, J. A study of polymer/surfactant interaction at Mineral solution interface. Colloids Surf. 1985, 13, 73–85. [Google Scholar] [CrossRef]
  18. Houot, R. Beneficiation of iron ore by flotation- review of industrial and potential applications. Int. J. Miner. Processing 1983, 10, 183–204. [Google Scholar] [CrossRef]
  19. Nummela, W.; Iwasaki, I. Iron ore Flotation. In Advances in Mineral Processing; Somasundaran, P., Ed.; AIME: Mumbai, India, 1986; pp. 308–342. [Google Scholar]
  20. Wills, B.A.; Napier Munn, T.J. Mineral Processing Technology—An Introduction to the Practical Aspects of Ore Treatment and Mineral Recovery, 7th ed.; Elsevier: Amsterdam, The Netherlands, 2006; p. 18. [Google Scholar]
  21. Pinto, C.L.L.; Araujo, A.C.; Peres, A.E.C. The effect of starch, amylose, and amylopectin on the depression of oxi-minerals. Miner. Eng. 1992, 5, 469–478. [Google Scholar] [CrossRef]
  22. Pradip. Beneficiation of alumina rich Indian iron ores limes-Scientific challenges and techno-economic considerations. Met. Mater. Processes. 1994, 6, 179–194. [Google Scholar]
  23. Su, F.; Rao, K.H.; Forssberg KS, E.; Samskog, P.O. Influence of temperature on the kinetics of apatite flotation from magnetite fines. Int. J. Miner. Processing 1998, 54, 131–145. [Google Scholar] [CrossRef]
  24. Bhaskar Raju, G.; Prabhakar, S.; Subba Rao, S. Development of indigenous column flotation technology at NML to beneficiate low-grade ores. Met. Mater. Processes 2004, 16, 143–156. [Google Scholar]
  25. Kumar, P.S.; Ravi, B.P.; Sreedhar, G.E.; Naganoor, P.C. Modeling and Optimization of Vertical Pulsating High Gradient Magnetic Separator for Iron ore Slime Processing Using Response Surface Methodology. Int. J. Miner. Processing Extr. Metallurgy. 2016, 1, 56–63. [Google Scholar] [CrossRef]
  26. Araujo, A.C.; Amarante, S.C.; Souza, C.C.; Silva, R.R.R. Ore mineralogy and its relevance for selection of concentration methods in processing of Brazilian iron ores. Trans. IMM 2003, 112, C54–C64. [Google Scholar] [CrossRef]
  27. Lima, N.P.; Valadão, G.E.; Peres, A.E. Effect of amine and starch dosages on the reverse cationic flotation of iron ore. Miner. Eng. 2013, 45, 180–184. [Google Scholar] [CrossRef]
  28. Nanda, S.K.; Pani, S.; Beura, D. Recovery of iron values through conventional beneficiation techniques fromBHJ of eastern India with reference to mineralogical and chemical characterization. Ind. J. Sci. Tech. 2020, 13, 3960–3969. [Google Scholar] [CrossRef]
  29. Ravi, B.P.; Kumar, G.S.; Ananth, B.D.; Hussain, M.I.; Kristappa, M.G. Process Characterization of some Iron ores of India. Indian Mineral. 2013, 25–134. [Google Scholar]
  30. Nayak, N.; Das, A.; Paul, B.K. Feasibility of beneficiation of BHJ of eastern India. IJERT 2012, 1, 1–11. [Google Scholar]
  31. Ravishankar, S.A.; Sankar, T.A.P.; Khosla, N.K. Beneficiation studies on alumina–rich Indian iron ore slimes using selective dispersants, flocculants and flotation collectors. In Proceedings of the XVIII International Mineral Processing Congress, Sydney, Australia, 23–28 May 1993; AusIMM: Carlton, Australia; pp. 1289–1294. [Google Scholar]
Figure 1. Sample collection point and geological site location of Kumaraswamy Range, Sandur (Source: [12]).
Minerals 12 01095 g001
Figure 2. (a) Very fine-grained hematite interlocked with very fine-grained quartz grains in BHQ (reflected light × 100) and (b) EPMA image analysis, indicating mainly hematite and quartz mostly free from each other at −0.1 mm. h: hematite; q: quartz.
Minerals 12 01095 g002
Figure 3. XRD of feed showing the presence of hematite and quartz.
Minerals 12 01095 g003
Figure 4. Particle size distribution of flotation feed at different MOG.
Minerals 12 01095 g004
Figure 5. (a) Effect of collector and depressant dosages on the grade of concentrate. (b) Effect of D80 and collector dosages on the grade of concentrate.
Minerals 12 01095 g005
Figure 6. (a) Effect of collector and depressant dosages on concentrate recovery. (b) Effect of D80 and collector dosages on recovery of concentrate.
Minerals 12 01095 g006aMinerals 12 01095 g006b
Figure 7. (a) Effect of depressant dosage and D80 on concentration efficiency. (b) Effect of D80 and collector dosages on concentration efficiency.
Minerals 12 01095 g007aMinerals 12 01095 g007b
Figure 8. Fine inclusions of quartz with hematite grains. h: hematite, q: quartz.
Minerals 12 01095 g008
Figure 9. (a) Response optimizer plot for maximizing grade. (b) Response optimizer plot for maximizing recovery.
Minerals 12 01095 g009
Table 1. Iron ore specifications for metallurgical application.
IngredientSpecification in Percentage
BF Grade DRI Grade
Fe>63.0>65.0
SiO2 + Al2O3<6.00<2.00
S and P<0.05 (each)<0.05
(Al2O3/SiO2) Ratio<0.5<0.5
Table 2. Effect of mesh of grind on WHIMS.
MOG/#
D80 µm
ProductsWt%%Fe
AssayDistribution
−50#
205 µm
Mag Conc.34.744.0736.4
Non-Mag tails65.327.1063.6
Head Cal100.042.01100.0
150#
82 µm
Mag Conc.56.045.0063.6
Non-Mag tails44.032.7936.4
Head Cal100.040.00100.0
200#
50 µm
Mag Conc.41.047.3047.3
Non-Mag tails59.036.6052.7
Head Cal100.041.05100.0
Table 3. List of variables and their levels.
Variables VariedUnitsReal Values of Coded Levels
Low (−1)Centre (0)High (+1)
D80, D100 % passing feed sizesµm50, −7482, −106205, –300
Collector dosagekg/t 0.050.150.25
Depressant dosagekg/t 0.51.01.5
Table 4. The order of experimental test runs conducted and the results obtained.
Run
Order
MOGDepressant Dosage
(kg/t)
Collector Dosage (kg/t)Wt% %Fe Grade %Fe Recovery wrt
Mag conc
% Concentration
EfficiencywrtFeed
NoABCYObservedPredictedObservedPredictedObservedPredicted
1500.50.1549.6563.665.5574.4972.363.3572.06
22050.50.1583.6849.837.1598.797.737.8624.62
3501.50.1579.2445.547.2385.482.415.5128.75
42051.50.1560.8960.657.6787.485.666.7958.09
55010.0548.6959.156.9568.1671.849.0534.47
620510.0587.7745.747.979597.418.2325.59
75010.2539.9763.359.9392.68650.2942.93
820510.2543.3949.650.9896.88919.1133.70
9820.50.0565.1150.550.3177.8880.132.1838.05
10821.50.0549.4563.663.6474.4979.263.1064.45
11820.50.2559.1564.665.4990.583.179.0177.66
12821.50.2571.5153.354.4190.2882.247.2941.41
138210.1584.5346.847.4293.791.623.1123.11
148210.1584.5346.847.4293.791.623.1123.11
158210.1584.5346.847.4293.791.623.1123.11
Table 5. Results of the final WHIMS test followed by flotation of the WHIMS concentrate.
ProductsWt%%Fe
AssayDistn.
Reverse Flotation Conc37.464.6060.4
Silica float18.66.903.2
WHIMS non-mag44.032.7936.4
Head-cal100.040.00100.0
Table 6. Specification of final concentrate.
Fe64.60%SiO2 + Al2O34.12%
SiO23.12%Al2O3 to SiO2 ratio 0.32
Al2O31.00%LOI1.06%
Size: −100% passing 100 µm 60% passing 45 µm.
Publisher’s Note: MDPI stays neutral with regard to jurisdictional claims in published maps and institutional affiliations.

