Abstract
Comminution is the most power-demanding stage, and the lack of geometallurgical testing, often for financial reasons, may result in an inefficient operation. The Geopyörä rock breakage test was developed with the objective of making mineral variability data more accessible by providing both standard comminution parameters and rock mechanical properties at low cost and with a modest sample size, allowing a larger number of samples to be tested to reduce uncertainties and assure productivity. The objective of this work is to present the results of an extensive validation of this new rock breakage method against two of the main tests currently in use, namely the SMC and Bond ball mill work index tests. More than 100 samples have been tested and the results compared, showing that the new method can accurately estimate the parameters of the traditional tests. This confirms that the new test is a reliable tool for performing comminution and geometallurgical tests.
1. Introduction
Uncertainty is a major cause of faults in mill design, and the selection of the wrong design criteria mainly occurs due to a lack of quality test work or the misinterpretation of results and orebody variability [1] resulting from limited laboratory rock breakage characterization tests. However, the high cost and the need for many relatively large samples ends up making this option unattractive. Consequently, comminution variability is often neglected in the mining project, which leads to misleading plant designs and production forecasts.
Traditional impact breakage test methods, such as the JK drop weight test (JKDWT) [2] and the SMC test [3], utilize equipment that drops a heavy weight onto particles to apply nominal amounts of energy. The obtained fragmentation is then correlated to the applied specific breakage energy to determine the impact breakage parameters such as the Axb and the drop weight index (DWI). Another commonly used comminution test is the Bond ball mill grindability test, which uses a laboratory mill to perform a locked cycle grinding test to determine the ball mill work index (BWI) in kWh/t.
However, there is room for improving the practice of comminution through fundamental changes in technology and the introduction of novel technology [2]. Mwanga et al. described an optimal test as one that should be simple, repeatable, and easy to execute, with a maximum time of execution of 1 h, as well as using less than 0.5 kg of sample and measuring both crushability and grindability parameters that could be directly used in the modeling and simulation of comminution circuits [4].
In recent years, the need to update these methods has become more pertinent due to the increase in energy consumption and phenomenon of the reduction in global average ore grades. This has inspired research and the development of new rock breakage methods, such as the Geopyörä, which uses equipment that consists of two counter-rotating wheels, powered via electric motors placed in a frame with an adjustable gap [5], that measures the energy in a breakage event, which can be used to confidently estimate traditional comminution parameters such as the Axb, DWI, and BWI.
This paper presents an extensive validation of the Geopyörä rock breakage test through numerous comparative tests carried out over the last two years on nine different ore deposits, totaling 204 samples. The samples were matched to reference values of traditional tests, such as the SMC test and the Bond ball mill work index test [6], used for validating the Geopyörä test results.
2. Experimental
2.1. Geopyörä Procedure
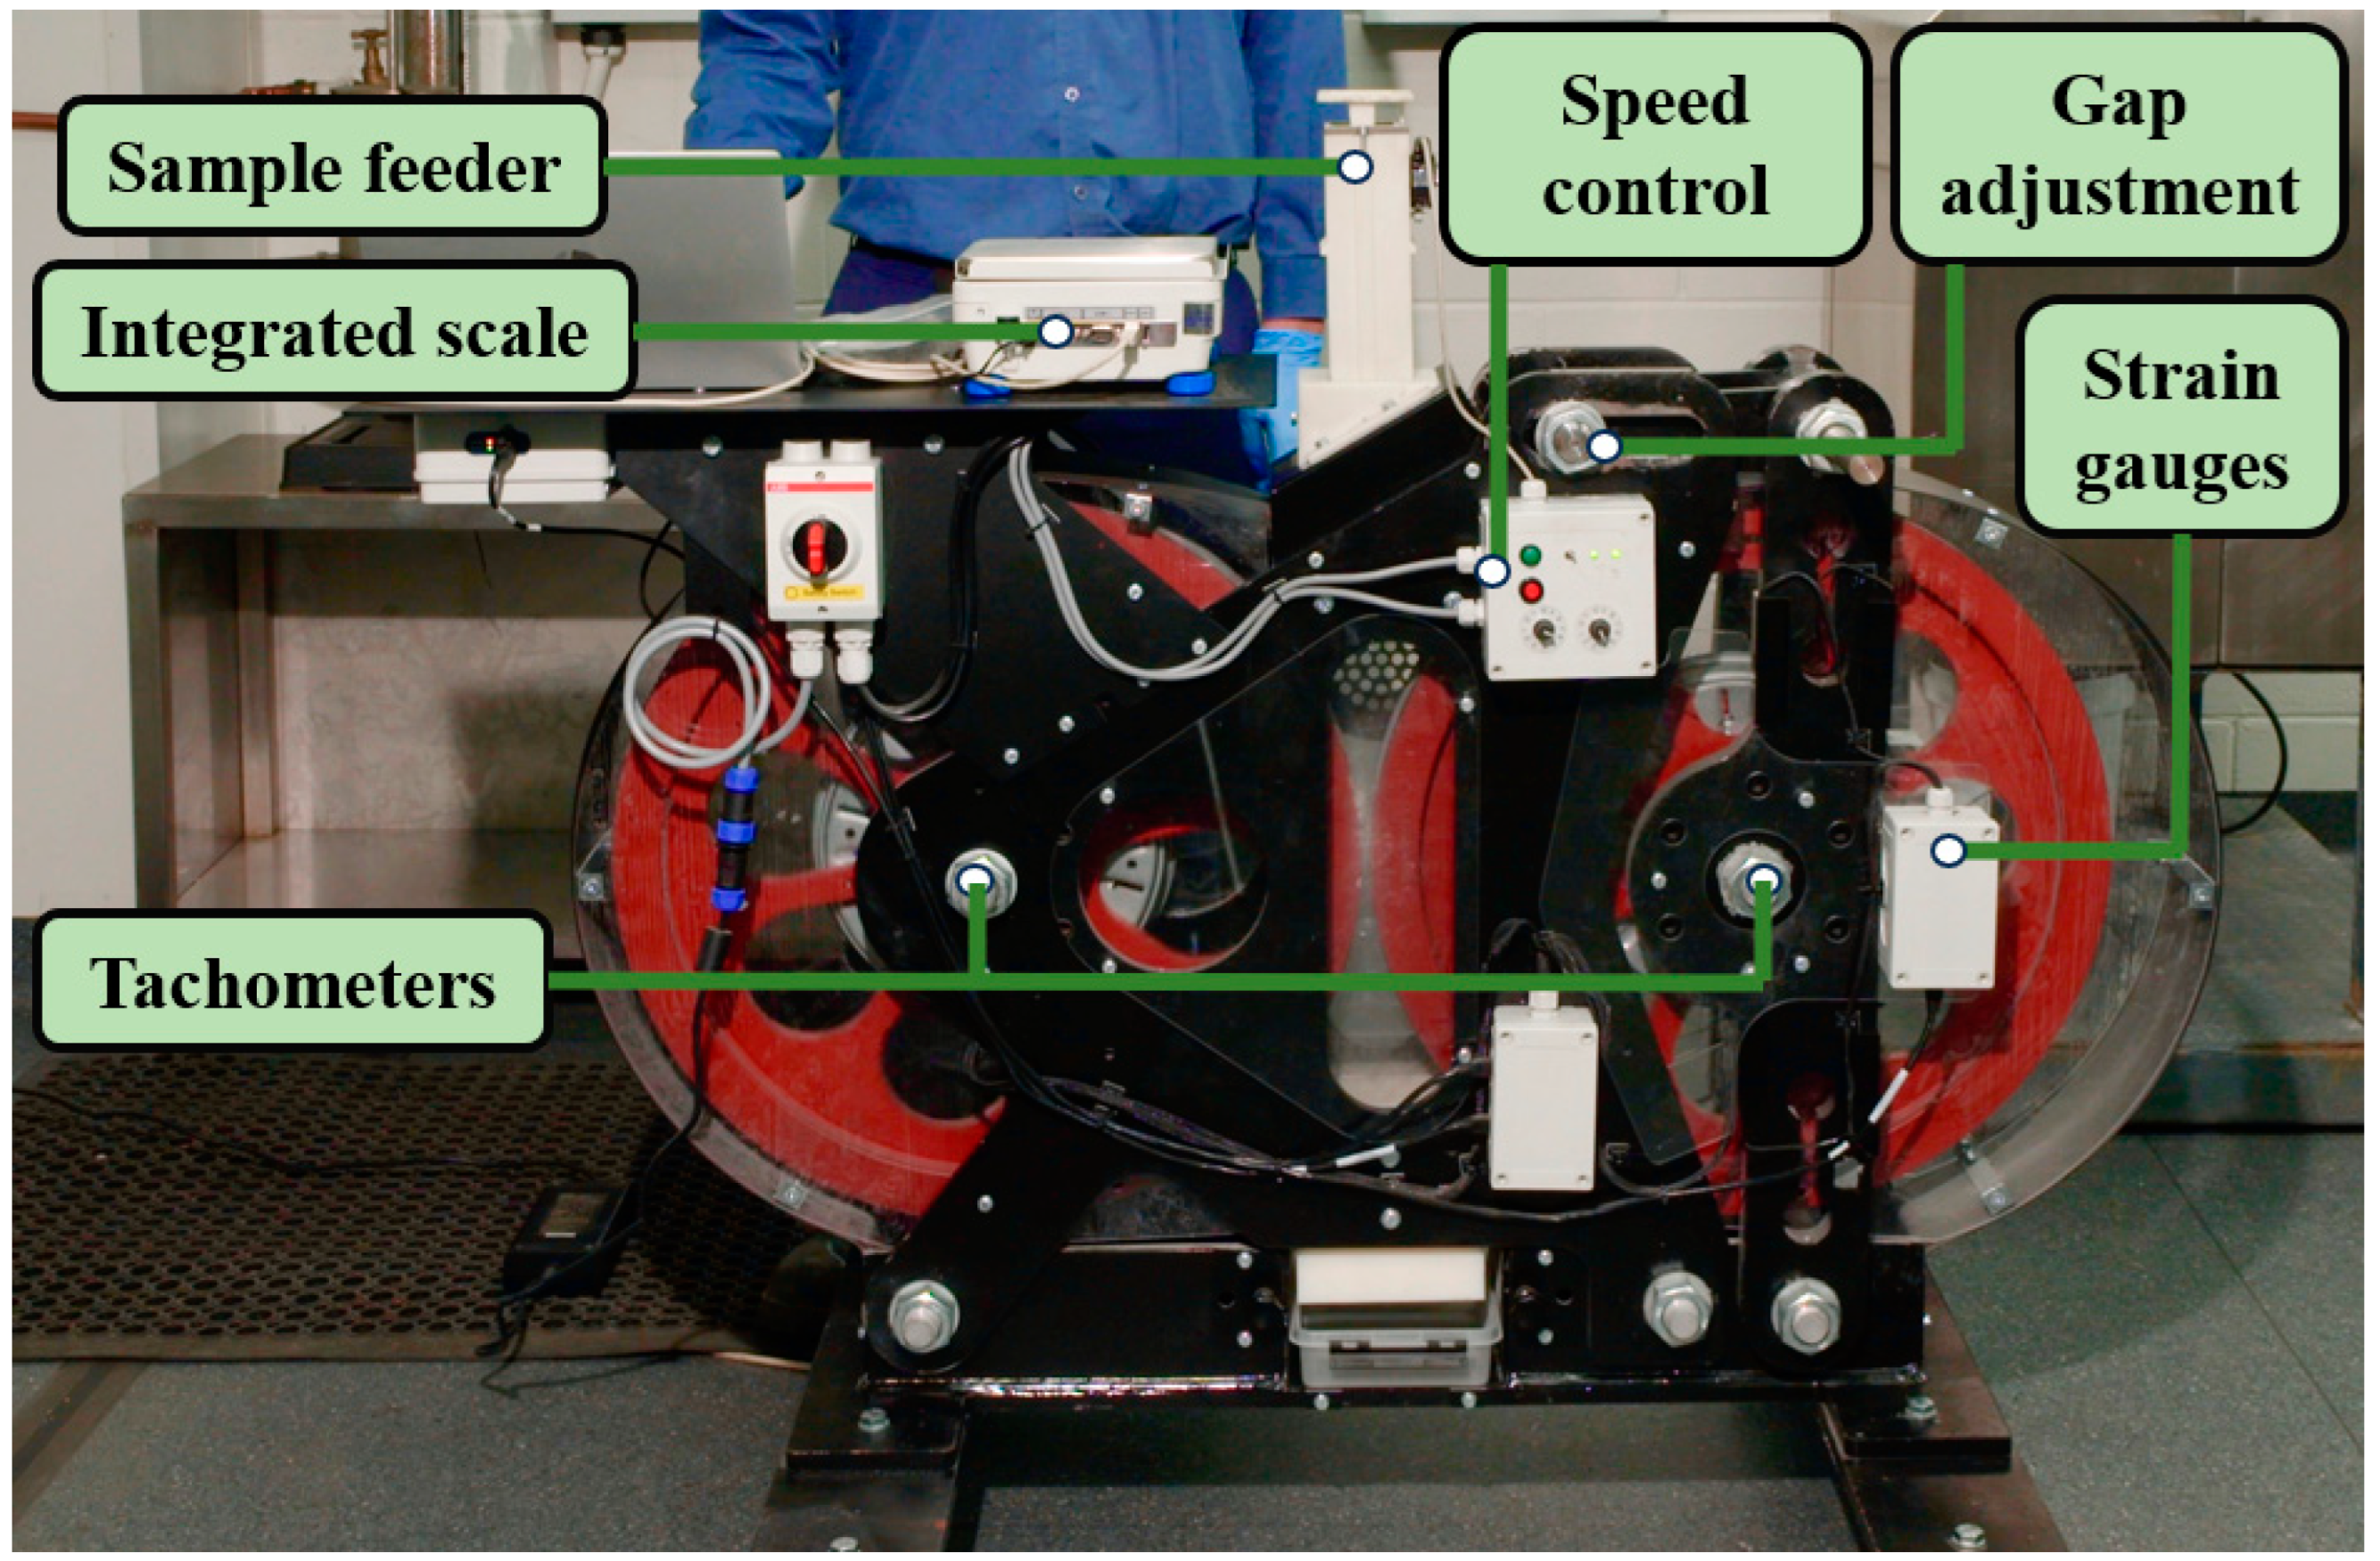
Geopyörä is an instrumented roll crusher with an adjustable gap to measure applied forces and energy consumed during breakage of individual rock particles. The prototype was developed at the University of Oulu (Oulu, Finland) and consists of two instrumented wheels, which have an adjustable gap [5]. The principle utilizes a controlled degree of crushing, with absorbed breakage energy being a response rather than an input. The steel wheels are powered via integrated electric motors placed in the frame, and the available energy ranges between 100 and 250 J [5]. The device provides data on the impact force using a pair of strain gauges on the frame and measures the loss of rotational moment to determine the energy required for each particle breakage event. Since the creation of the prototype, a new product version of Geopyörä, which is pictured in Figure 1, has been developed and entered into commercial operation in multiple laboratories around the world. Currently, there is ongoing work towards the development and design of new versions and updates.
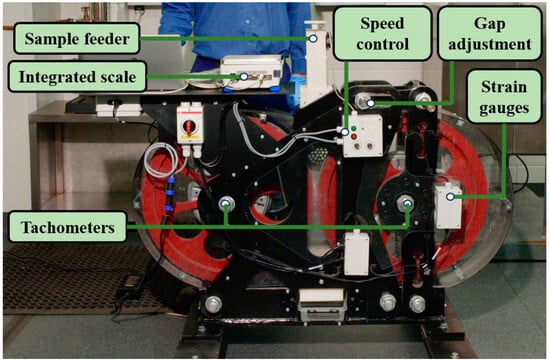
Figure 1.
Geopyörä V1. Source: Core Resources.
The testing process can use both bulk and drill core samples, with the second option making use of halved or quartered one-meter sections of drill core. This allows one half/quarter of a core to be used for the breakage test, while the other part can be kept in archive or used for other purposes such as geochemical assaying [7]. If limited sample is available, the breakage product can also be used for further testing when needed. Only one narrow particle size fraction is used, and samples are crushed and sieved to ensure that enough particles in the desired size are obtained for testing. The standard test uses two energy levels, with 20 to 30 randomly selected particles for each level, but the test can also be performed with three energy levels, which enables a more accurate test, but satisfactory results can be obtained even with just one level, albeit, in this case, using the high energy. Unlike the JKDWT or the SMC test, where nominal amounts of energy are applied by dropping a weight onto the sample, via the Geopyörä test, the energy is a measured response at the moment of breaking, and the level of this energy is adjusted through the wheel’s gap setting, which is defined as a percentage of the geometric mean of the size fraction being used, with a higher energy level requiring a tighter gap. The definitions of size range and energy levels used in the Geopyörä standard test show contrast with the complexity of other tests, which, using a larger number of intervals and energy levels, end up using a significantly larger number of samples. Table 1 summarizes a comparison of the main breakage test requirements.

Table 1.
Sample requirements comparison.
During the test, each particle is individually broken, and the software records the mass, the breaking force recorded by the load cells, and the energy loss of the wheels during the breaking event, with a correction to subtract the friction loss from the wheels. After the test, the breakage product is collected for subsequent sieving.
2.2. Samples and Methodology
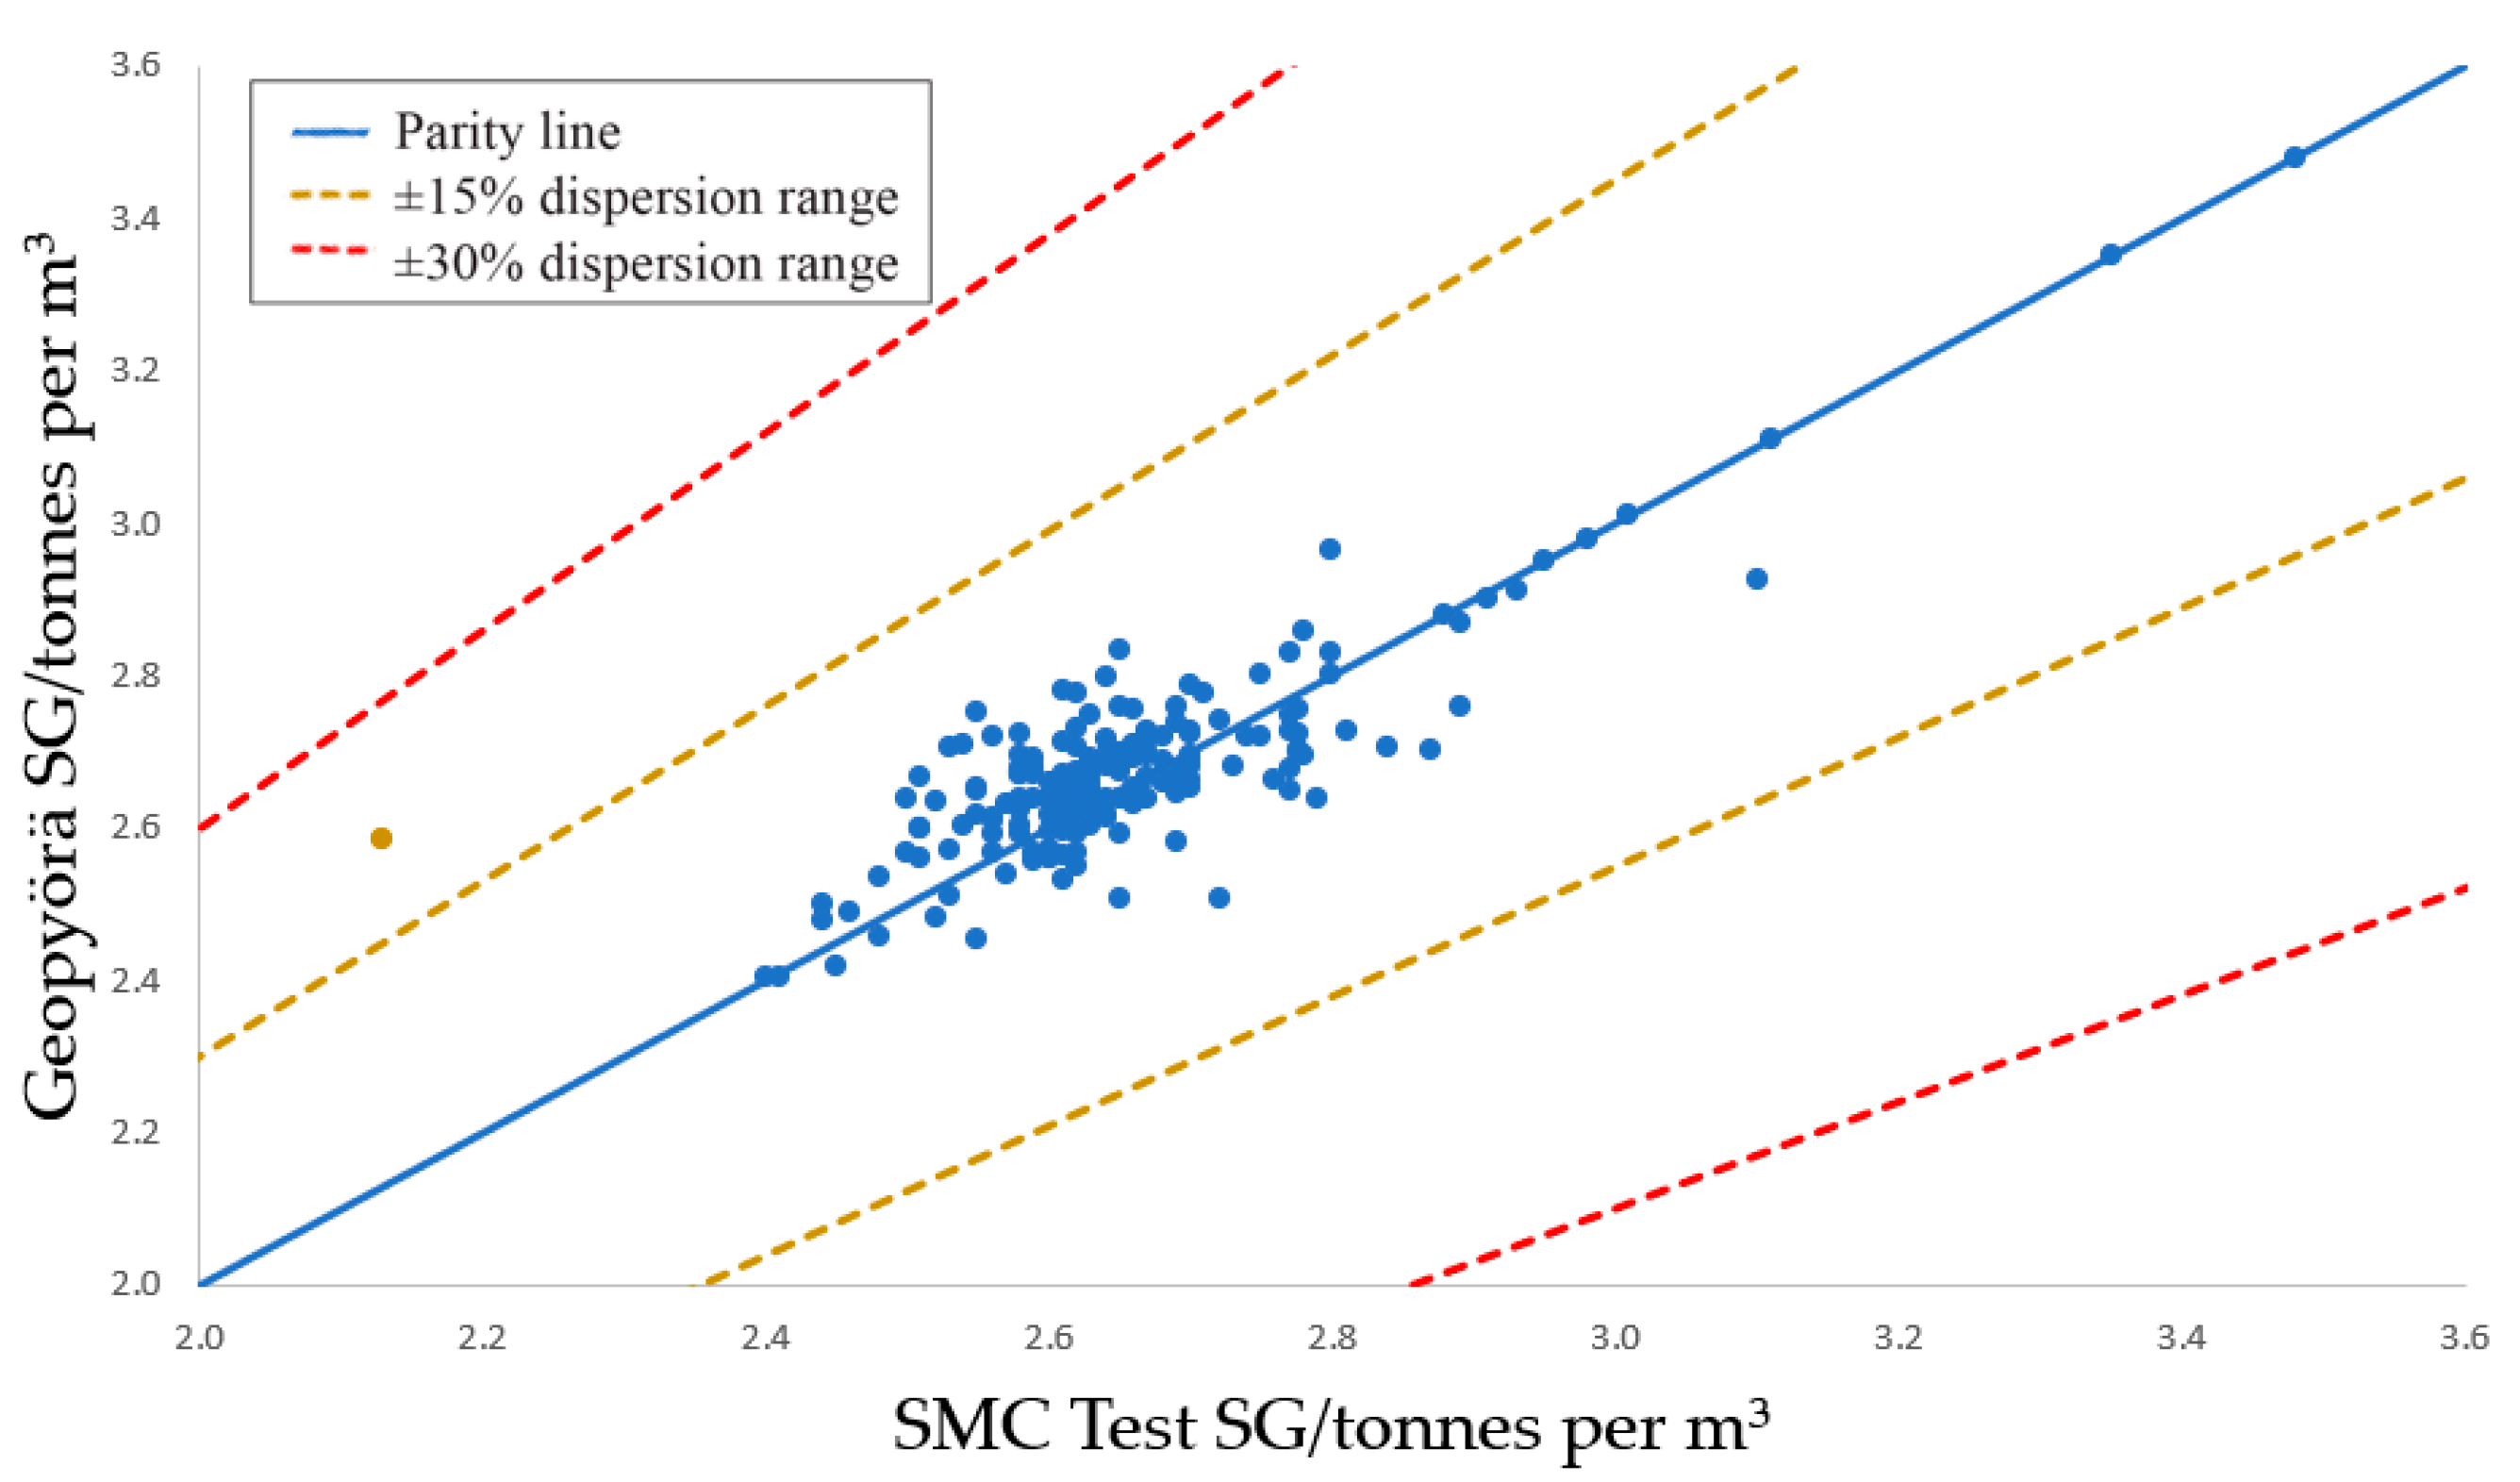
A total of 204 samples from nine different deposits around the world in varying size ranges were used to perform this extensive validation of the Geopyörä results. Samples were tested on the SMC test, as well as the standard Bond ball mill test [6], while subsamples were prepared for testing via Geopyörä devices at partner laboratories following the standard sample selection and testing procedure, so that reference results could be obtained for the comparative analysis with the Geopyörä results. To ensure that the samples selected for the Geopyörä test were representative in relation to the samples selected for the SMC test, a comparative pre-analysis was performed using the SG (Specific Gravity) values measured with the Geopyörä samples and those measured with the SMC test samples.
As shown in Figure 2, all but one sample fell within the ±15% dispersion range, which indicates a very good parity between the samples that were sent for reference testing and those tested via the Geopyörä test. It is necessary to guarantee this parity because if there is a bias in the separation of the samples that travel to each destination, it is possible that this bias will propagate to the test results, causing variability when comparing the two results. Table 2 summarizes the statistical results of the comparison, where σ is the standard deviation and µ the mean of the data set.
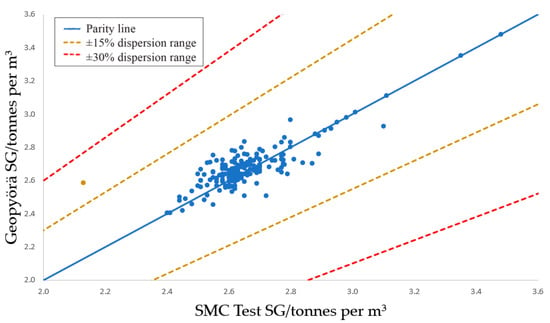
Figure 2.
Specific gravity parity plot (SMC vs. GPT samples).

Table 2.
Specific gravity comparison stats.
3. Results and Discussion
3.1. Axb Parameter
The breakage data measured via the Geopyörä test are used to calculate the Ecs (Specific Comminution Energy), and then the product of the breakage is sieved so that the calculation of the percentage passing one tenth of the initial mean particle size (t10) is performed. Equation (1) shows the mathematical relationship between the breakage index (t10) and comminution-specific energy (Ecs) that is used to fit A and b parameters to a data set [8].
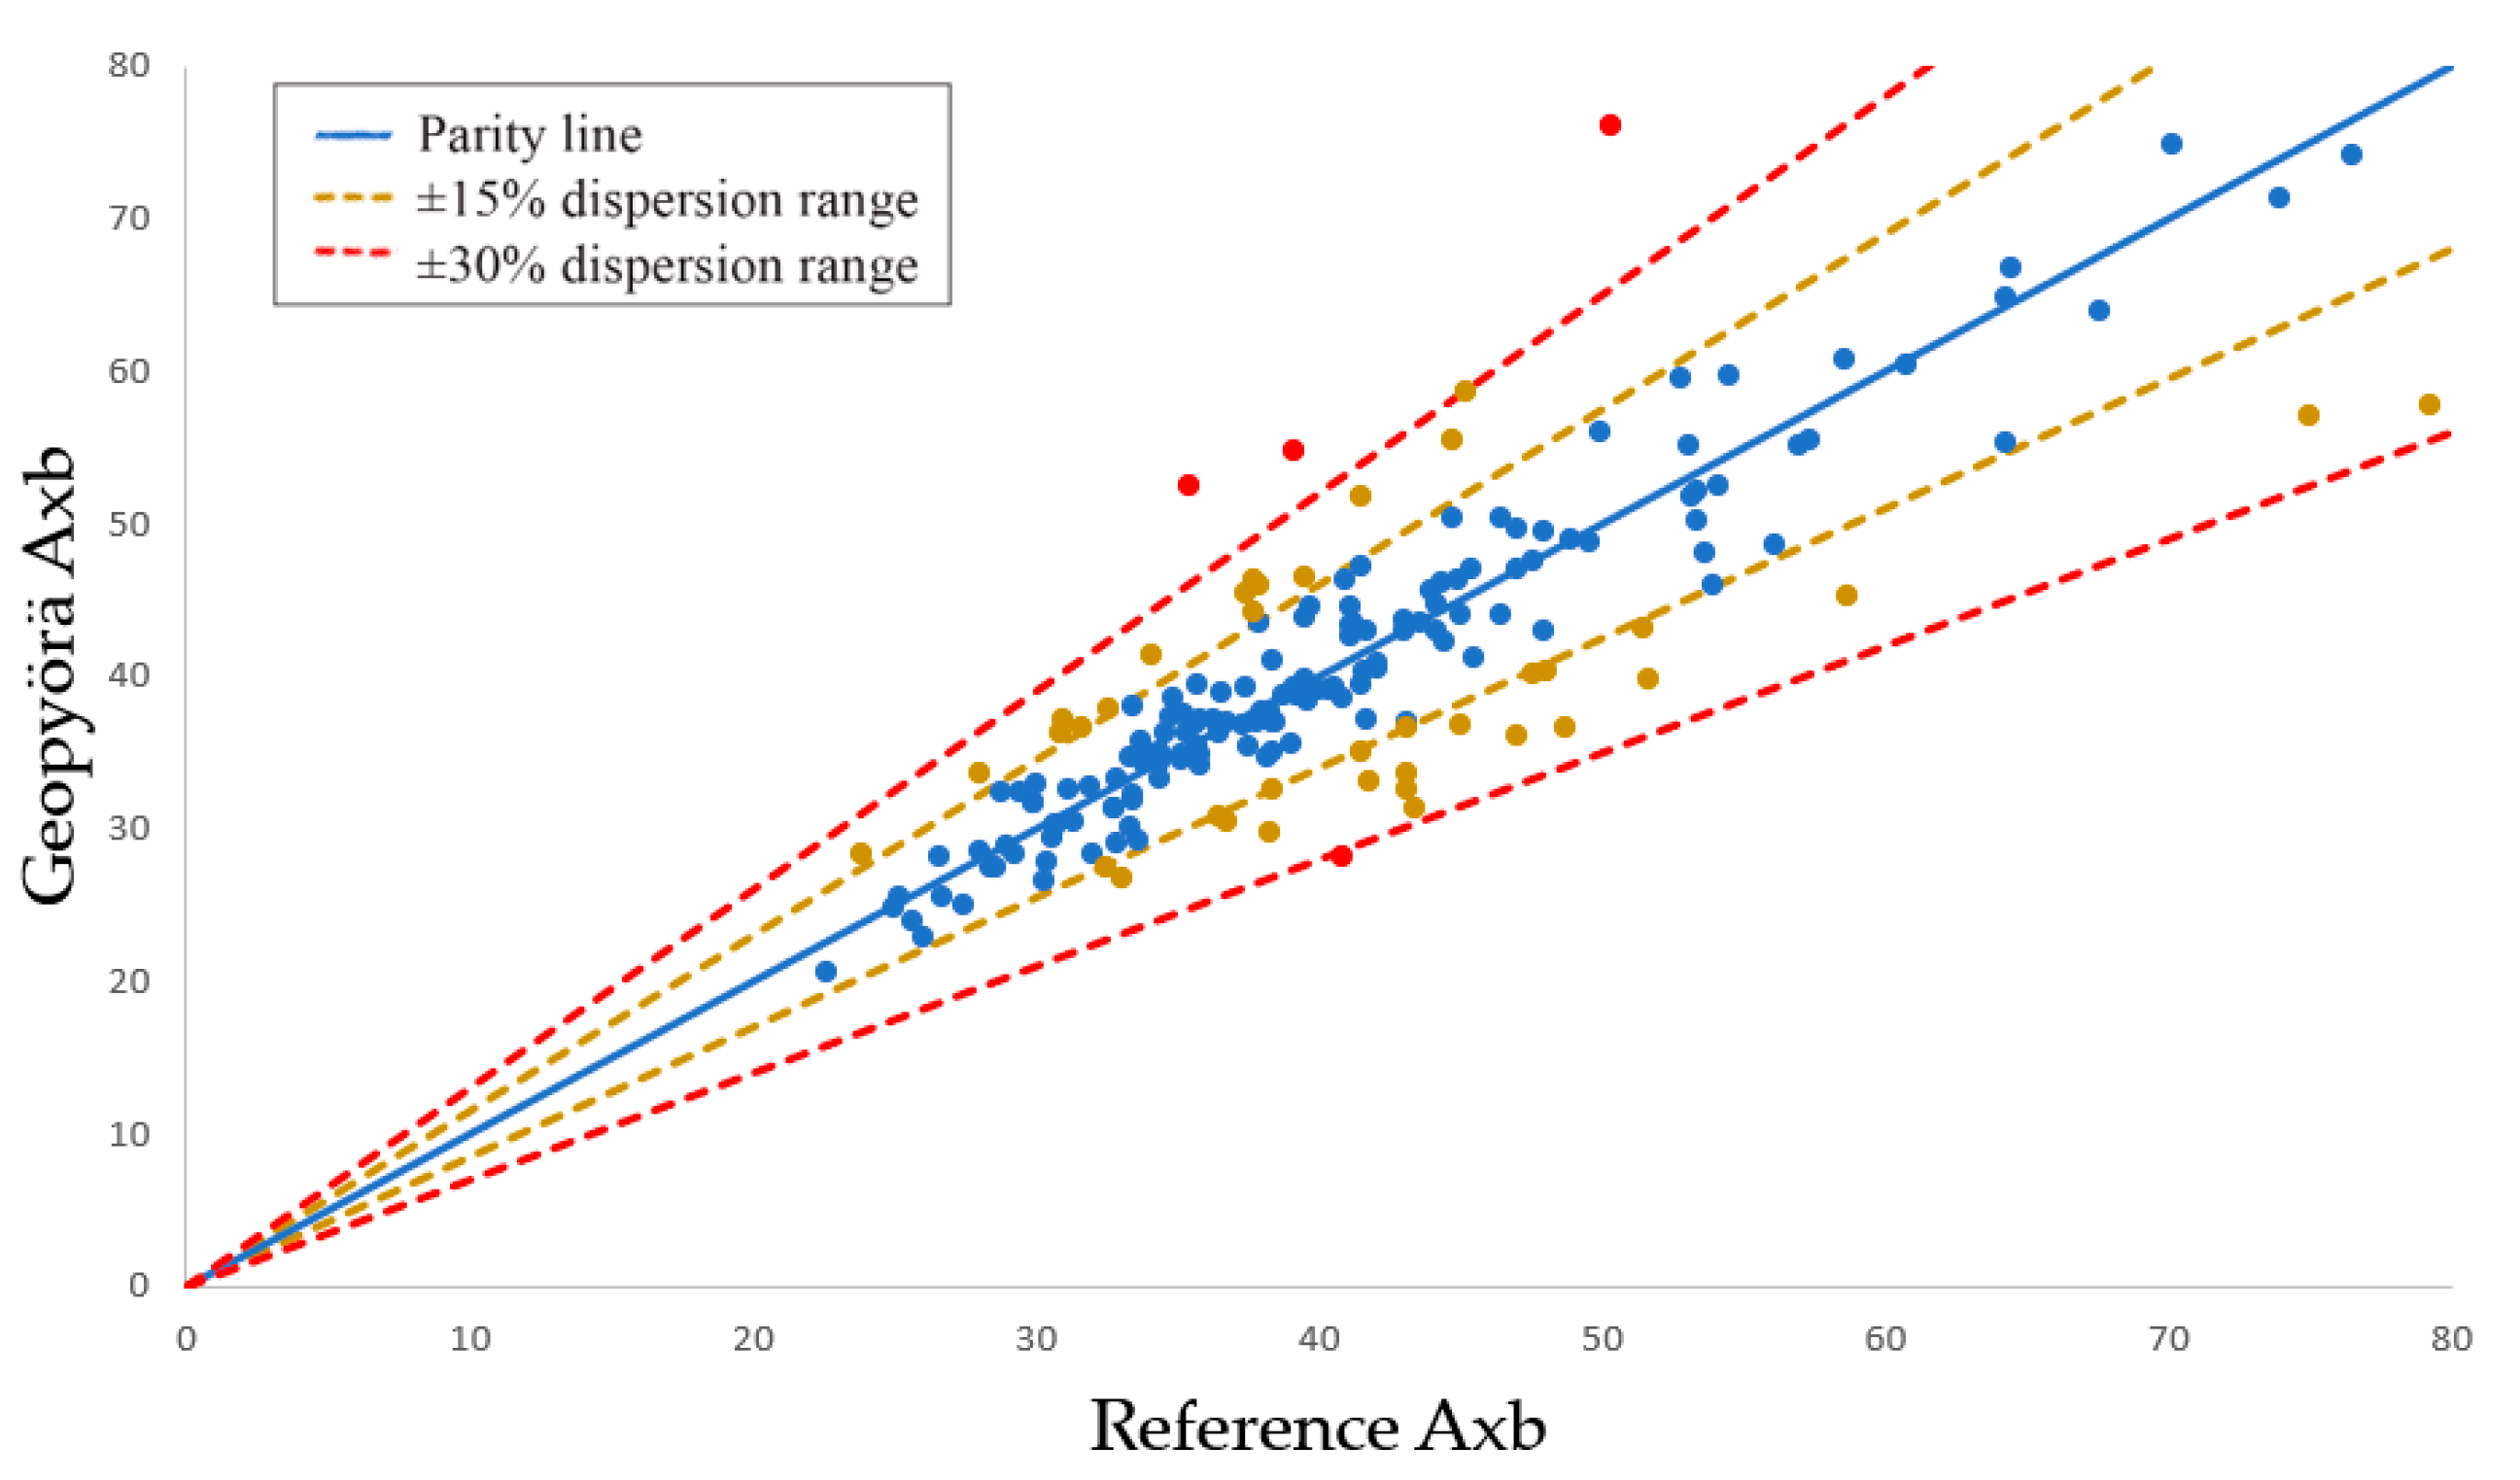
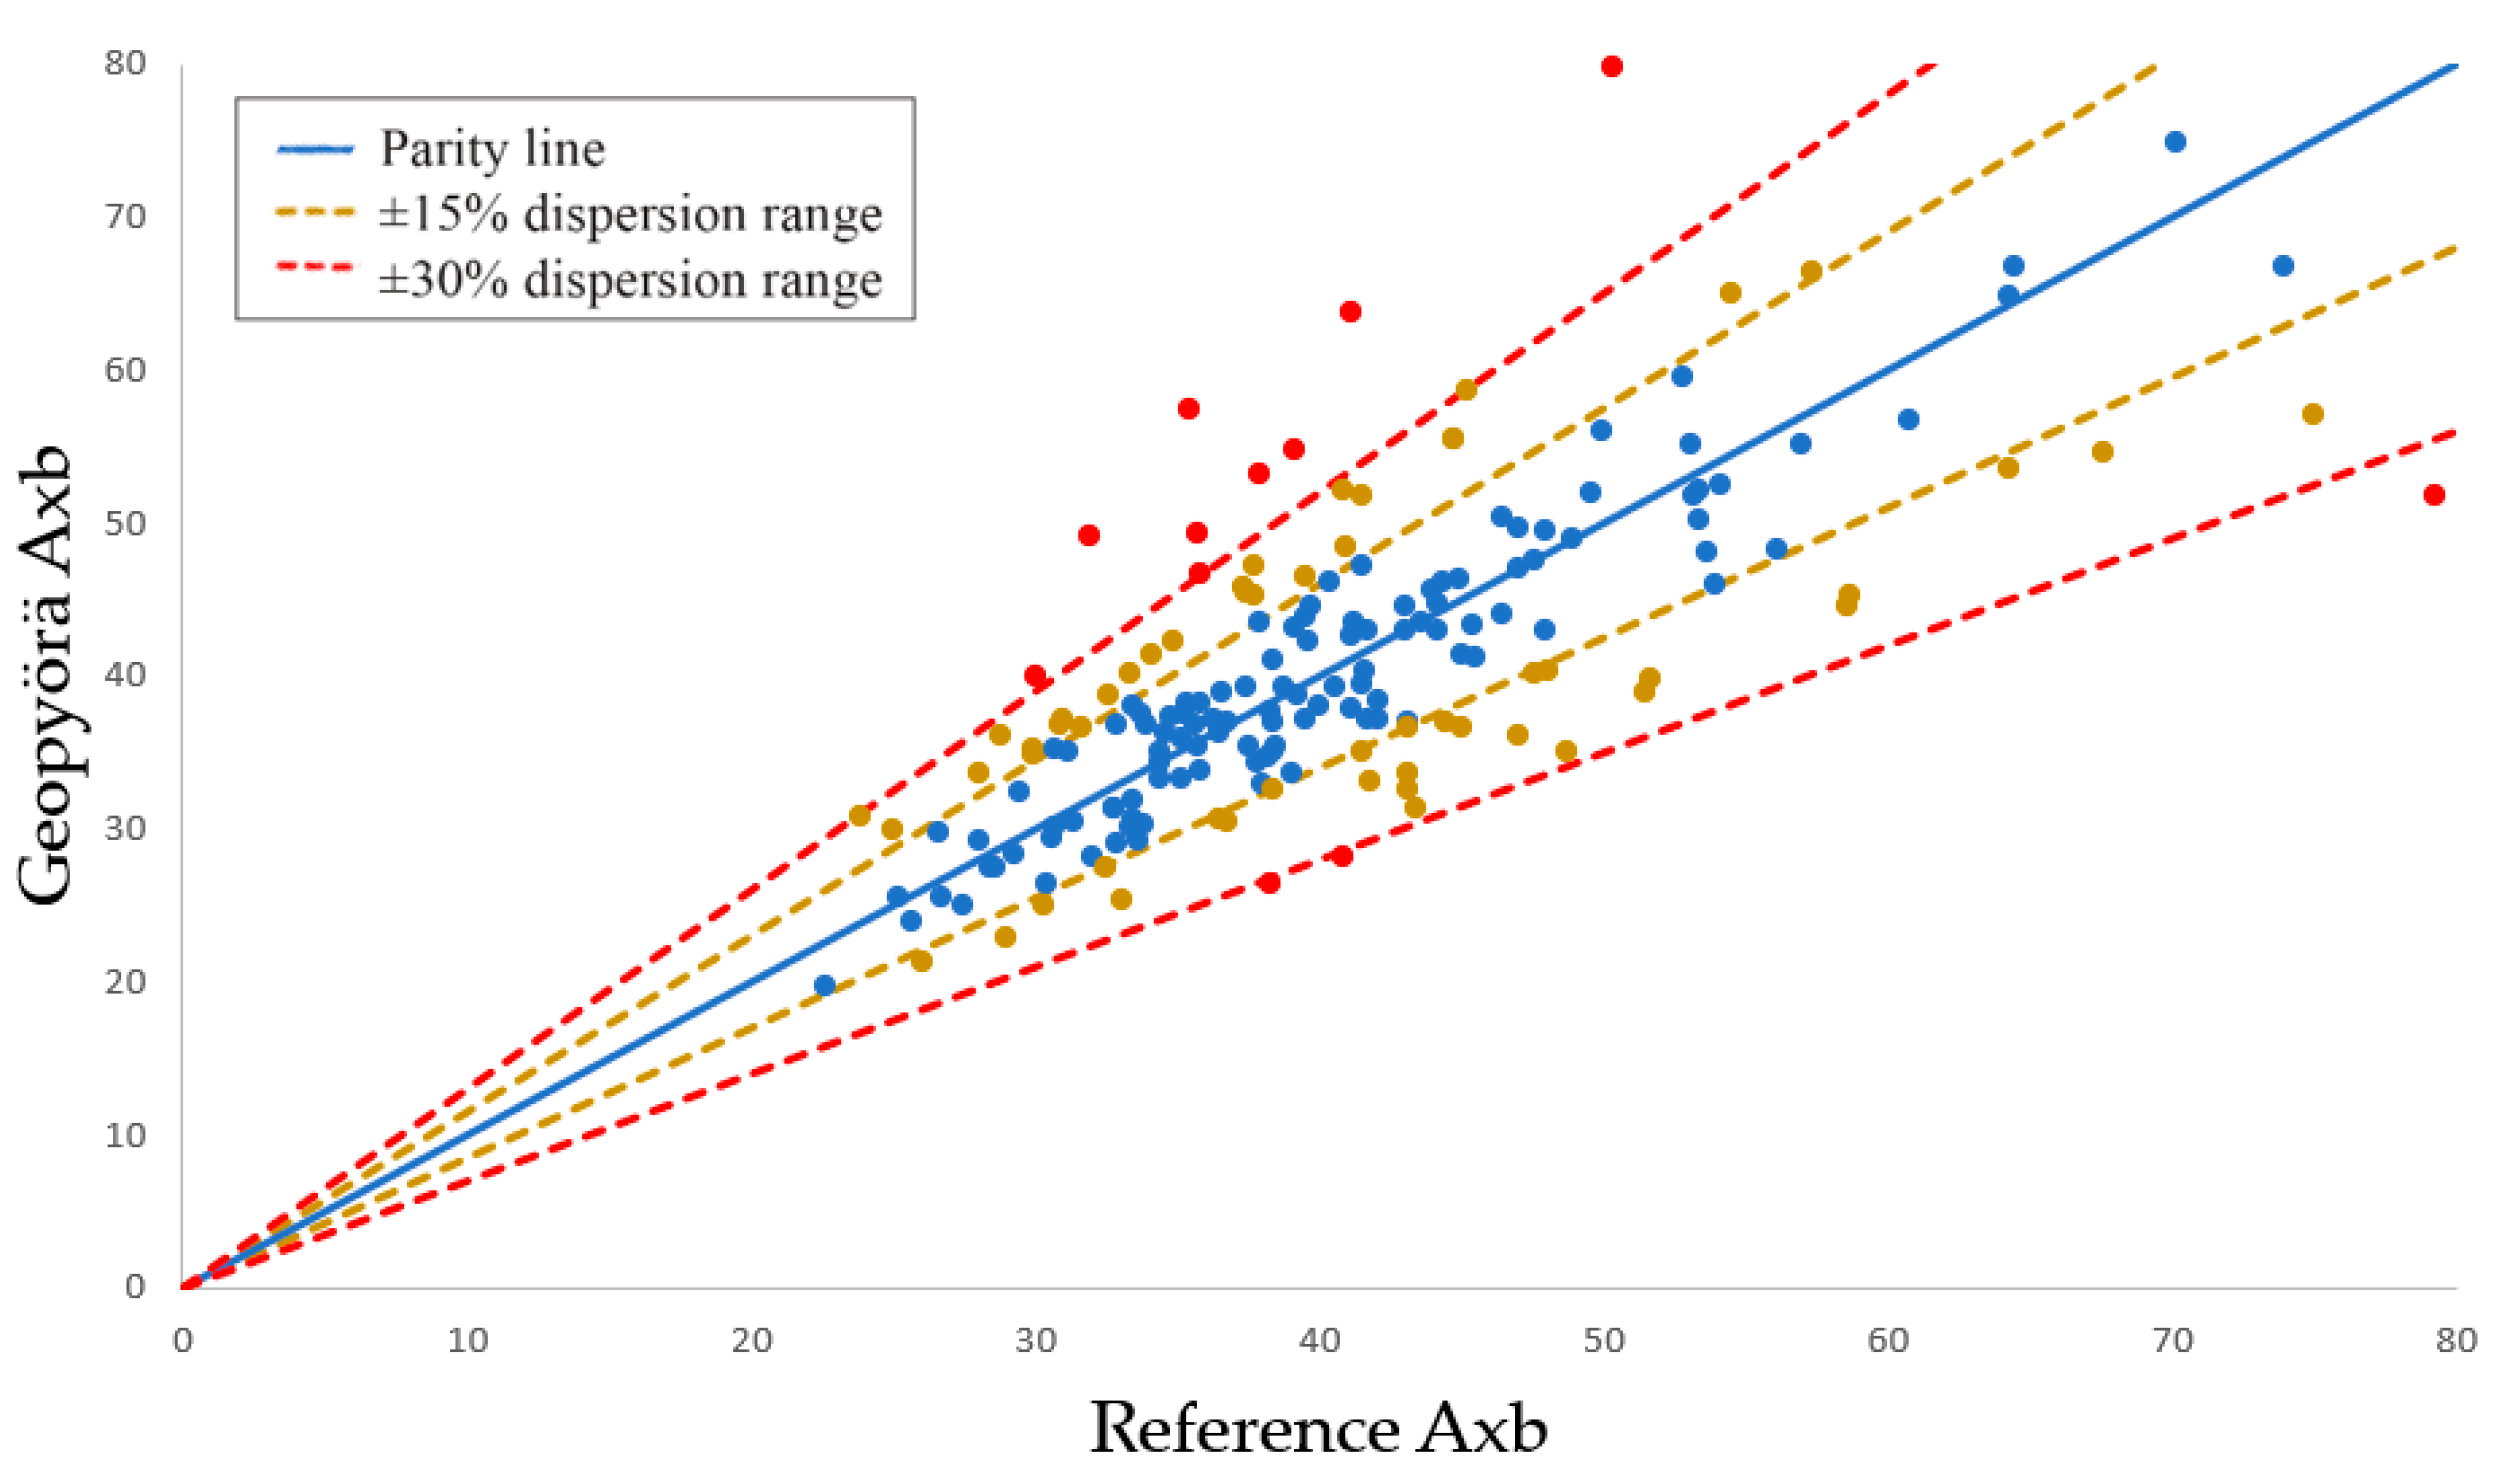
The fit of the curve is used to obtain the Axb parameter, which is related to the slope of the curve, and it is universally accepted in the mining industry as a parameter that represents an ore’s resistance to impact breakage and widely used in comminution modeling. Figure 3 presents a parity plot comparing the Axb values estimated via the Geopyörä test with the reference SMC test Axb and shows that 73% of the samples are within the ±15% dispersion range, as represented by the blue samples. Table 3 summarizes the Axb comparison stats.
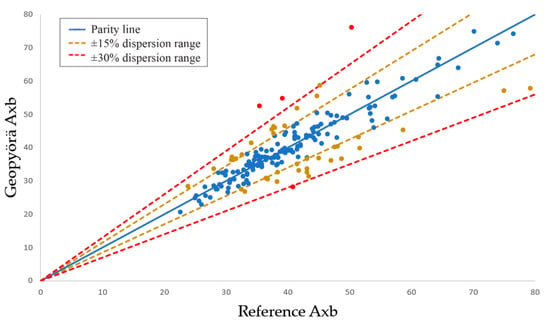
Figure 3.
Axb parity plot (DWT vs. GPT).

Table 3.
Axb comparison stats.
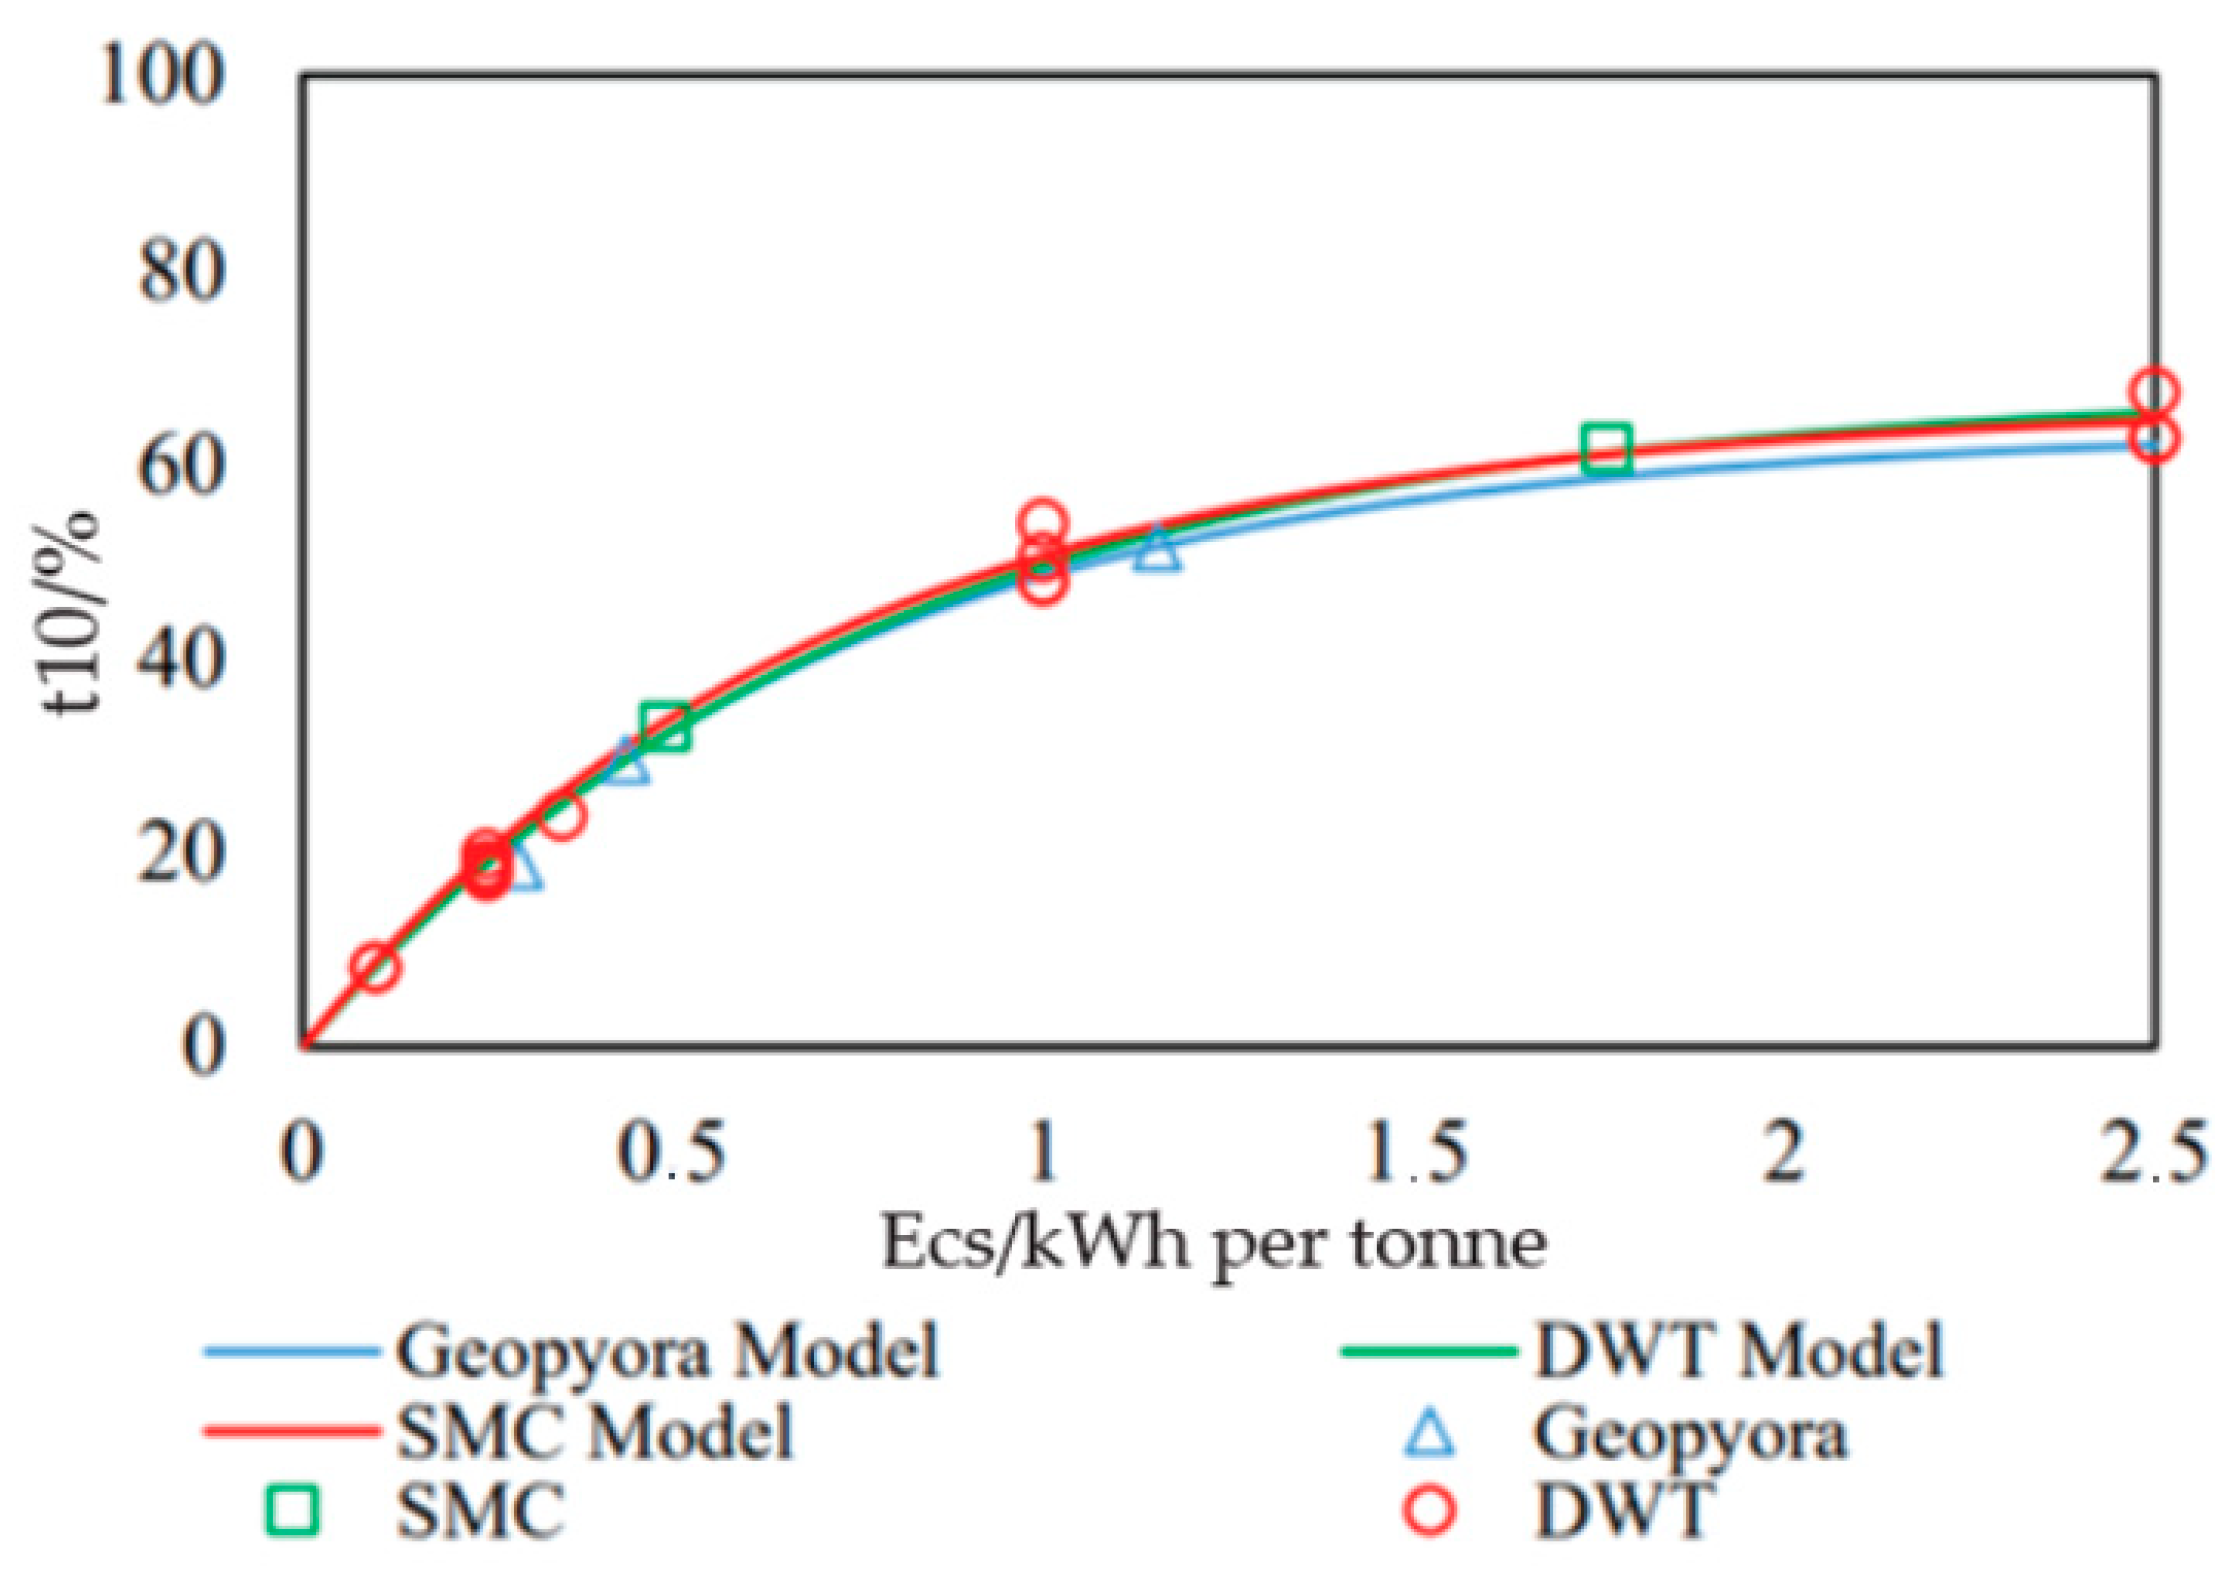
Furthermore, we can make a comparison between the t10 curves generated via each test, bearing in mind that the JKDWT used three energies for each of the five different size intervals, and the SMC test used five energy levels in one size interval, while the Geopyörä test used only three energies in one size interval. Figure 4 shows the plot of the curves from each test, as well as the measured points.
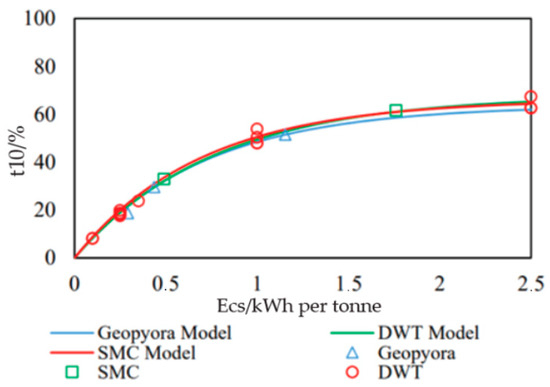
Figure 4.
Example of fitted Ecs vs. T10 curve comparison between DWT and GPT tests.
3.2. SMC Test DWi
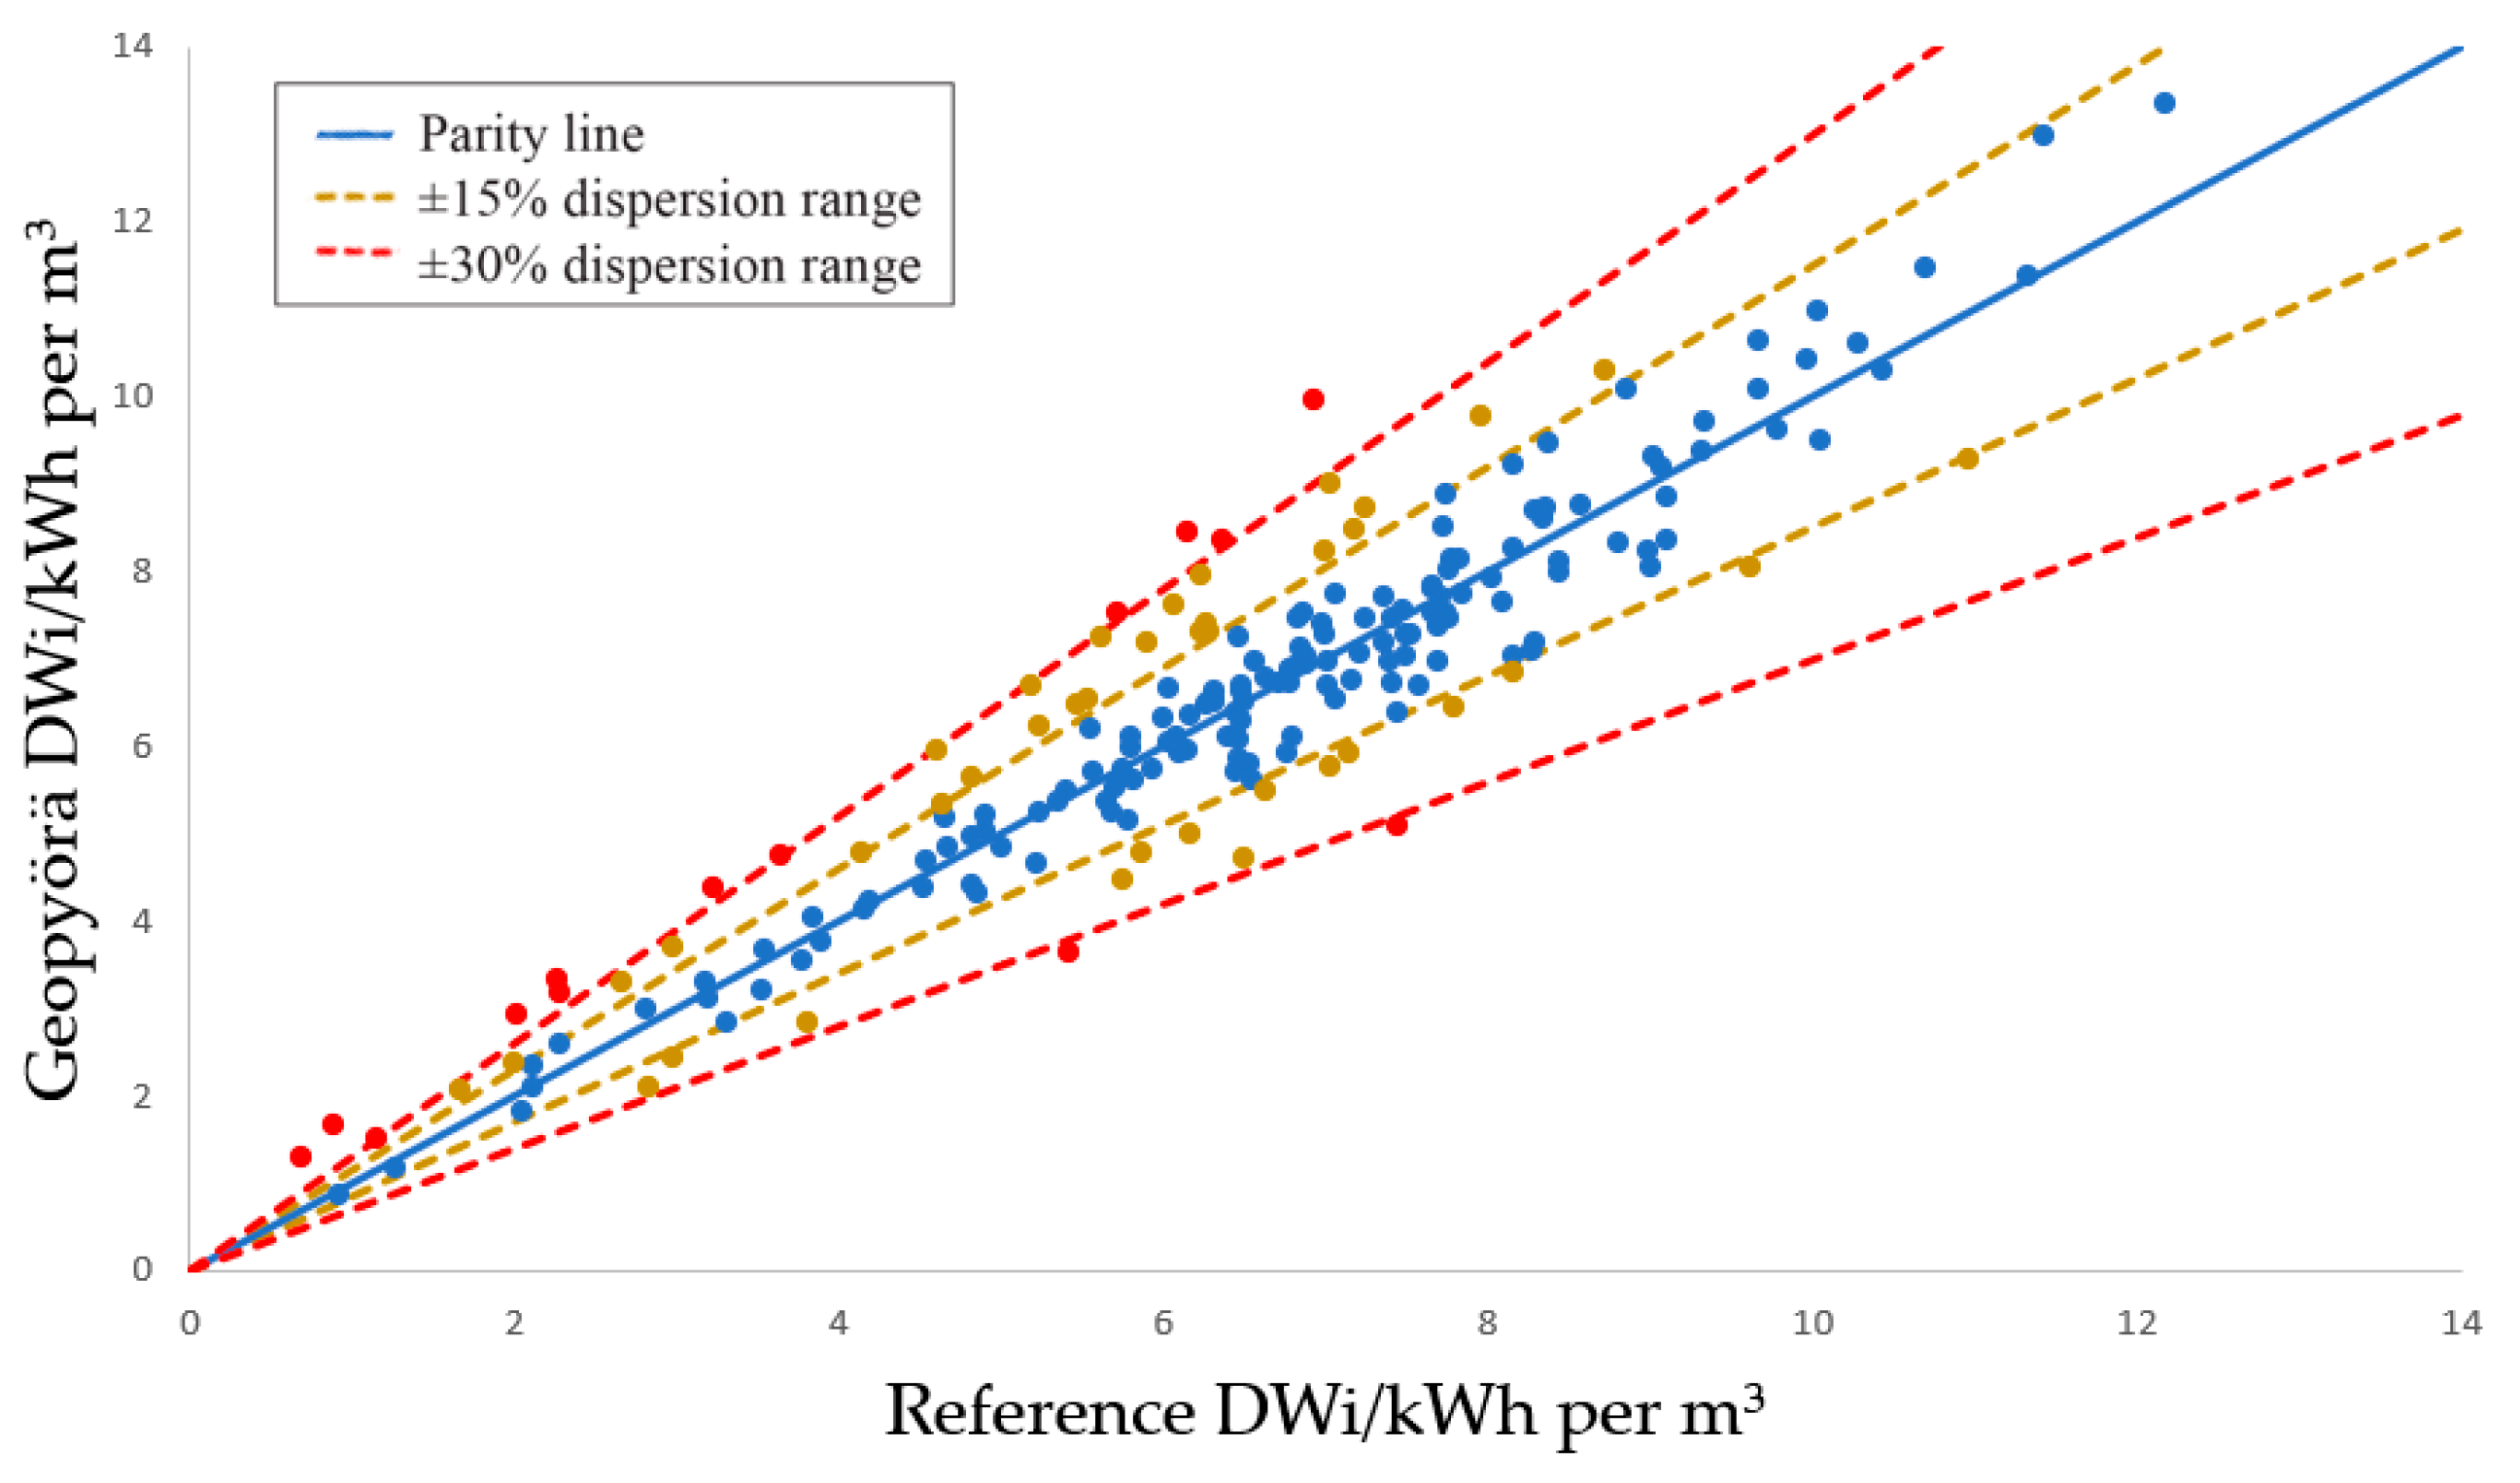
The drop weight index (DWi) is a metric derived from the SMC test and a widely used measure of the strength of the rock. This test has a database of more than 35,000 measured samples from more than 1300 ore bodies [3]. To calculate the DWi using the Geopyörä test results and perform the comparison with the SMC test reference result, Equation (2) was used [9], where SG is the specific gravity.
Figure 5 presents the drop weight index parity plot, and Table 4 summarizes the statistical comparison, showing a strong correlation between the Geopyörä test results and the SMC test reference results, with a parity R-Squared value of 0.99.
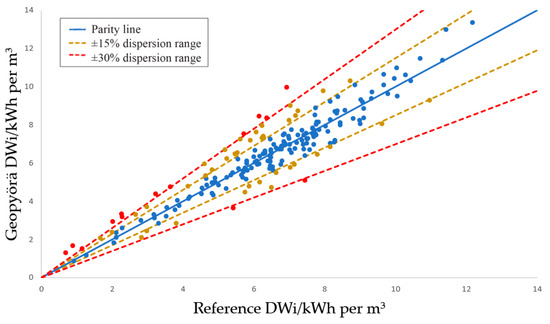
Figure 5.
Drop weight index parity plot.

Table 4.
Drop weight index comparison stats.
3.3. Bond Ball Mill Work Index
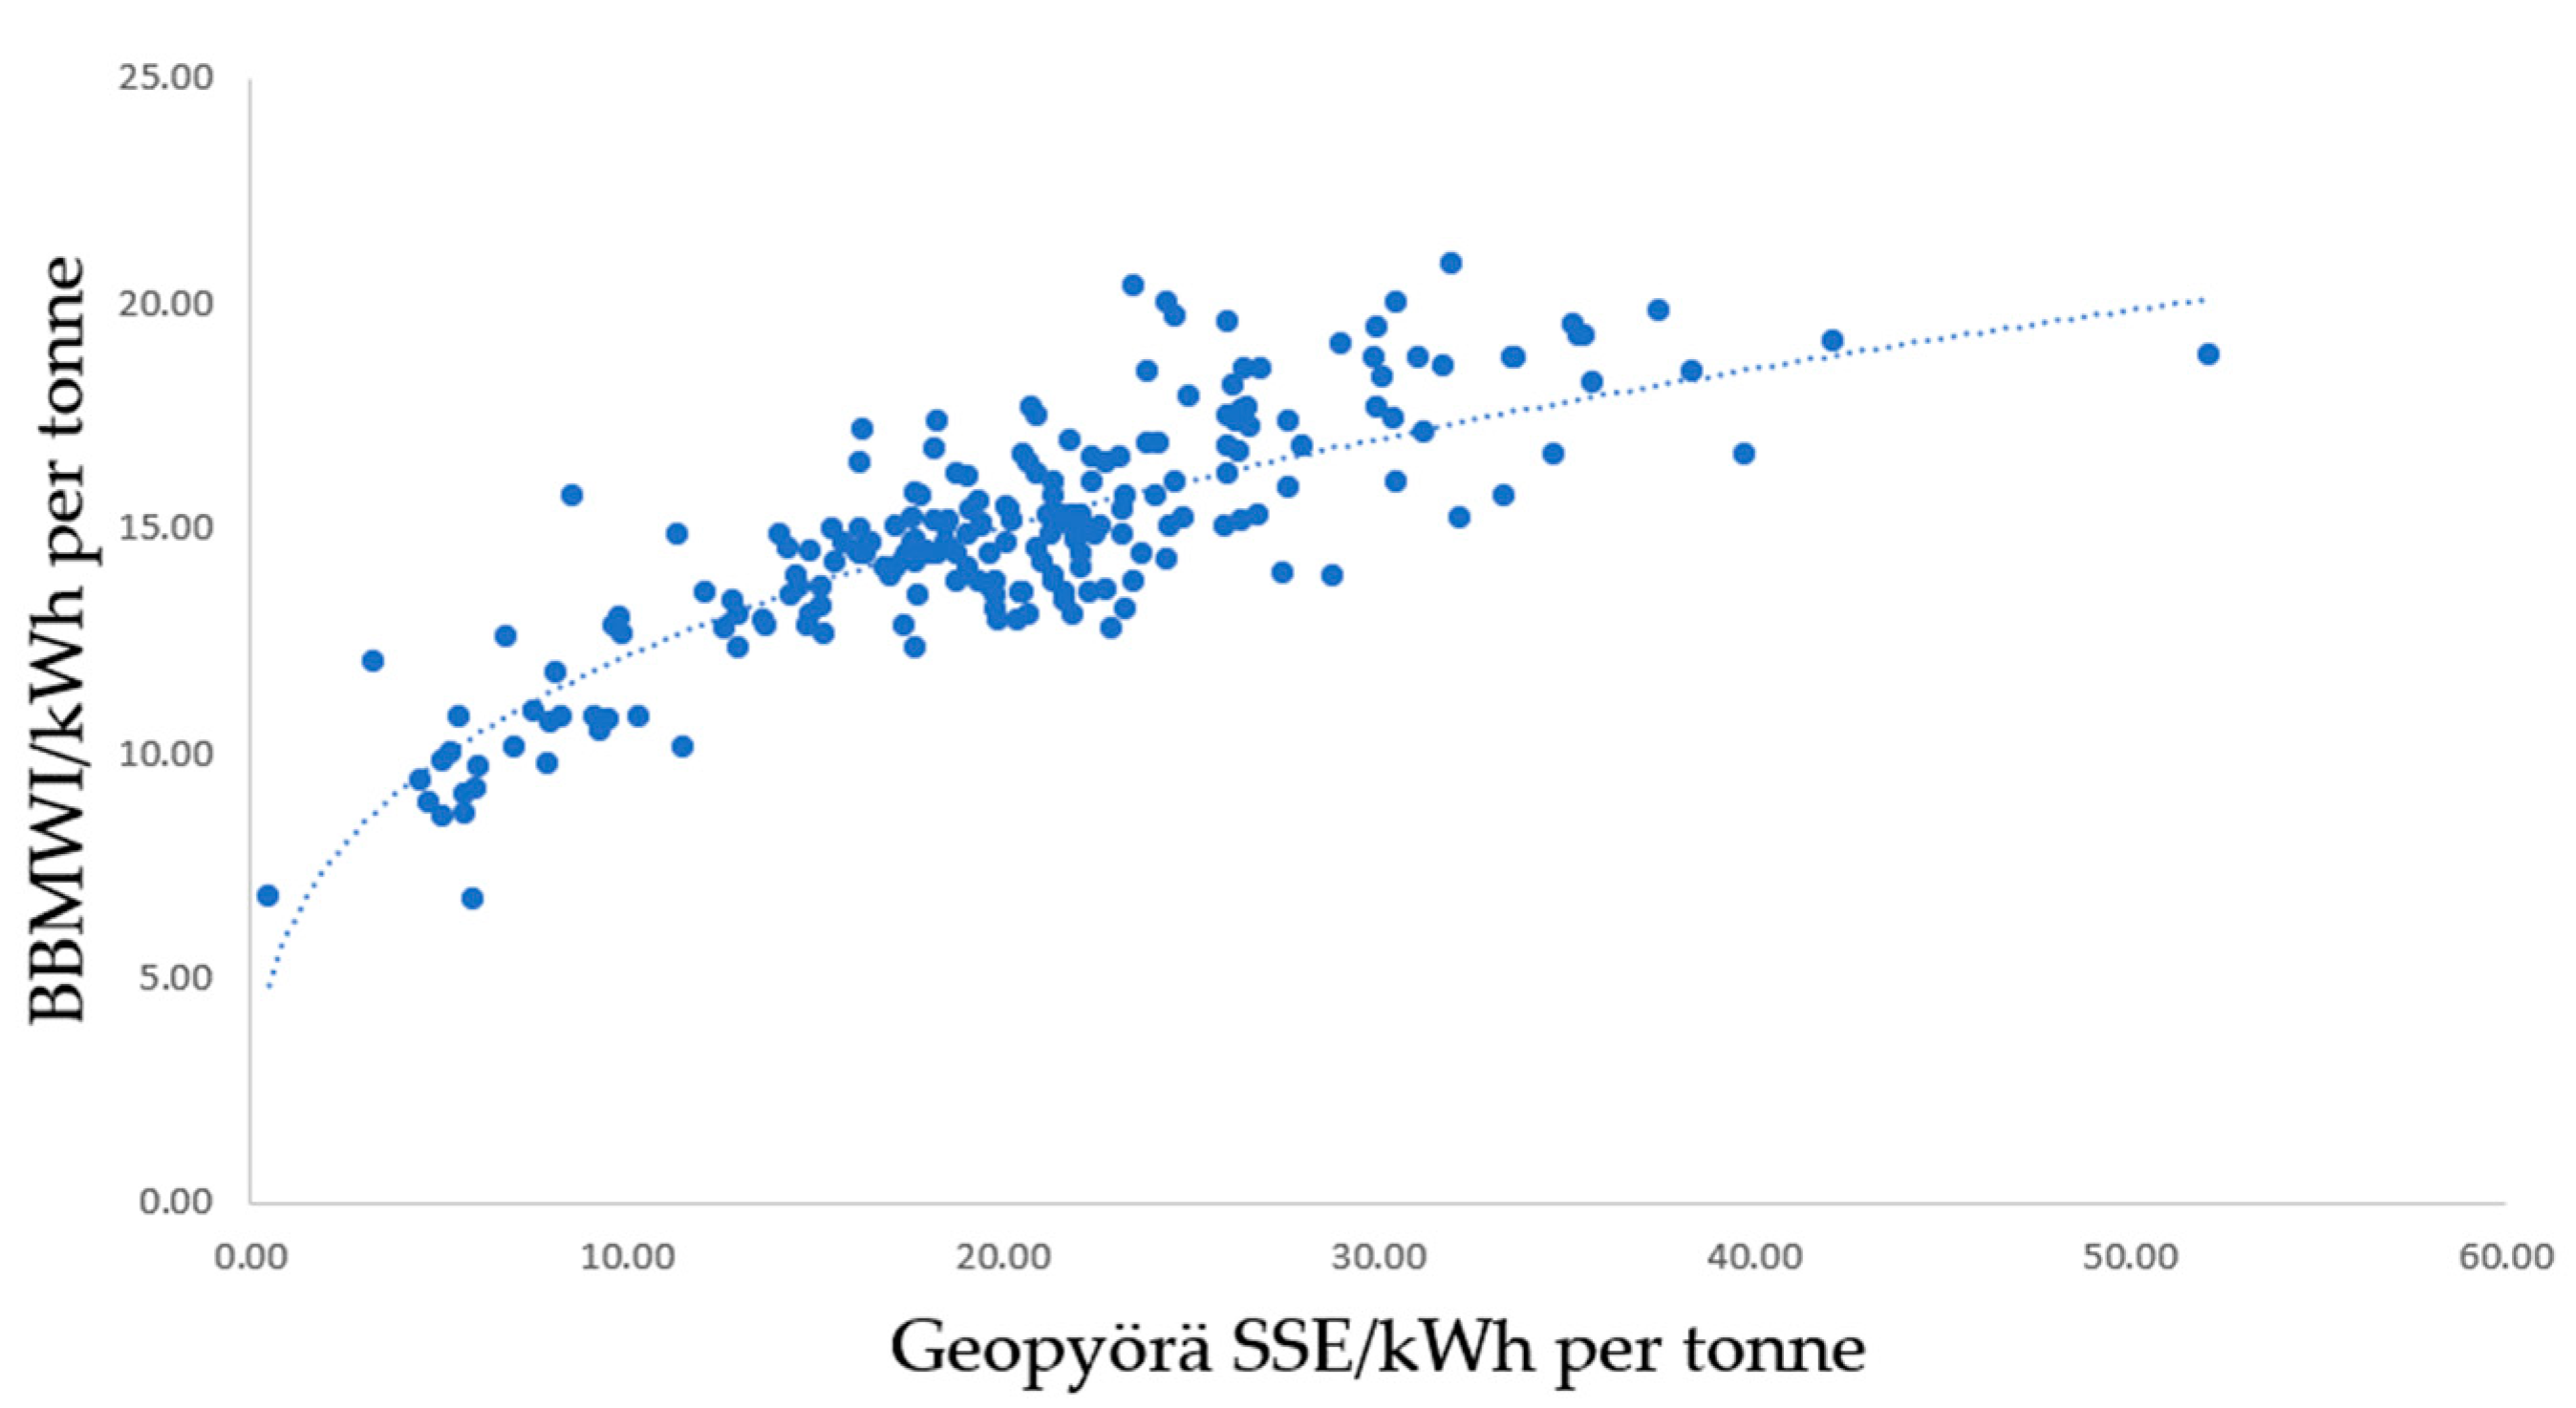
Standard Bond ball mill tests [6] were carried out with the objective of making a comparison with the data calculated via the Geopyörä test, as was carried out previously via the SMC test for the validation of Axb and the drop weight index. To make this possible, a correlation model was developed between the Size-Specific Energy (SSE) calculated via the Geopyörä test and the Bond ball mill work index (BBMWi), using the available reference data. The SSE can be calculated using Equation (3).
where P150 is the percentage of the breakage product passing 150 microns.
Most reference samples used in this validation were tested in the standard Bond ball mill with closing sieve sizes (CSS) of 150 microns, but some were tested using a different CSS. Despite this variation in the BBMWI data, the database was so robust that the developed model was capable of accurately describing the entire database without the need to split in different models for each CSS. The aim was to achieve a generic model, capable of generating accurate results for the range of closing sieve sizes used in the Bond test [10]. The power function described in Equation (4), where c and d are fitted constants, and illustrated in Figure 6 proved to be the optimal model to correlate SSE and BBMWi, having a fit R-Squared value of 0.70.
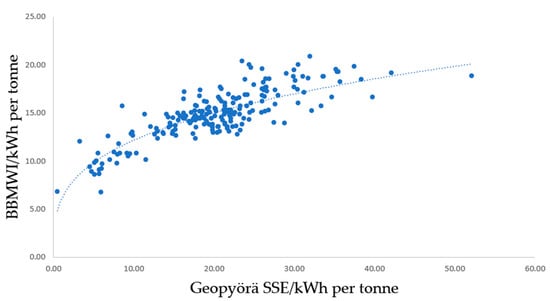
Figure 6.
BBMWi × SSE power fit.
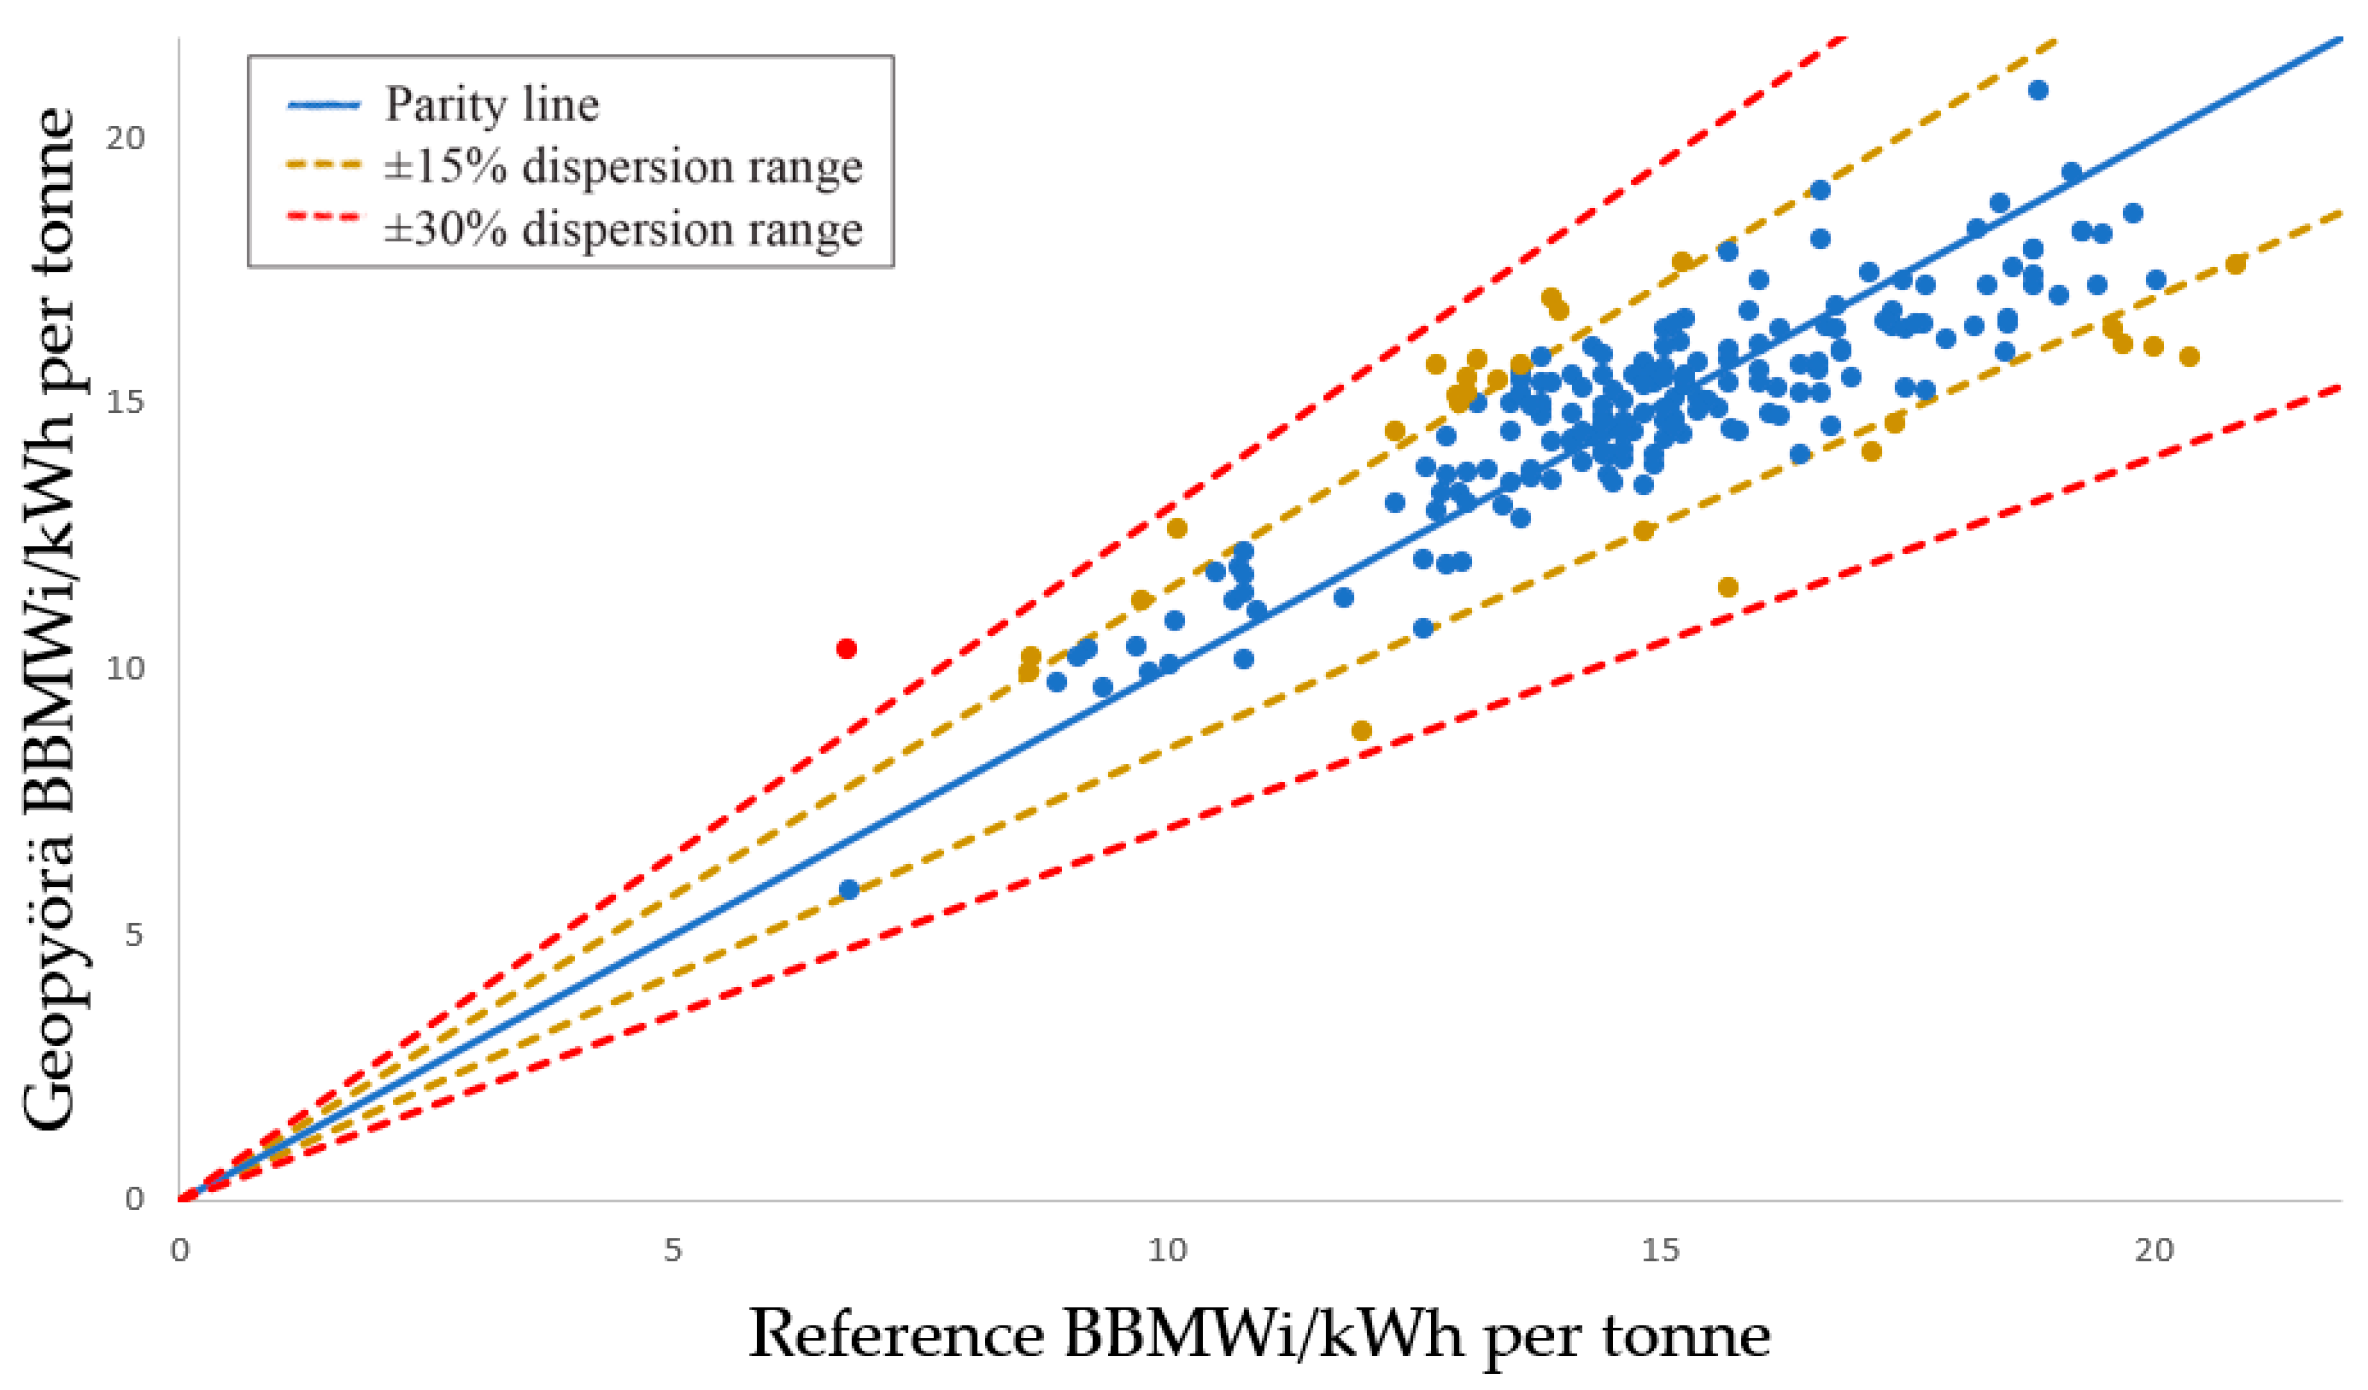
Once the model for estimating the BBMWi from the SSE calculated via the Geopyörä test data was calibrated, the model was validated by comparing its predictions to a parity chart against the reference BBMWi results, which originated from the standard Bond ball mill test. Figure 7 shows the parity plot, where 87% of the samples are within the ±15% dispersion range, as represented by the blue samples. Table 5 summarizes the comparison stats, showing a very strong correlation, with a parity R-Squared value of 0.99.
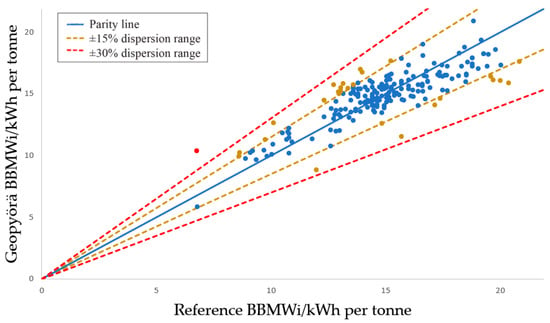
Figure 7.
Bond ball mill work index parity plot.

Table 5.
Bond ball mill work index comparison stats.
3.4. One Energy Analysis
The Geopyörä standard test uses two energy levels, as defined by the gap between the wheels, so that two points are defined for performing the fit of the t10 vs. Ecs curve. However, there is the possibility of carrying out the same process using only one energy level, greatly simplifying the testing procedure in the laboratory, albeit with the perspective of providing satisfactory accurate results. Figure 8 presents the parity plot, while Table 6 presents the comparison stats.
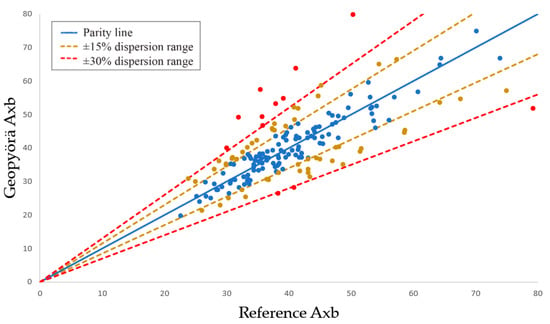
Figure 8.
One energy Axb parity plot.

Table 6.
One energy Axb comparison stats.
As expected, a decrease in parity quality is noticeable, with a slight increase in the average error compared to the results with two energy levels presented in Section 3.1, but 59% of the samples remained within the ±15% dispersion interval, with only 12% of samples being found outside of the ±30% interval.
4. Conclusions
The Geopyörä test provides a state-of-the-art method for rock breakage characterization testing. It was developed to present a viable alternative to more expensive and ore-intensive methods so that mining companies could viably build extensive breakage data sets. It presents a low-cost option, which, in contrast to a number of proxy tests, does not sacrifice precision or accuracy, thus providing reliable data upon which to build the success of comminution models and plant design.
The Geopyörä results have been extensively validated against industry standards with a robust database of 204 samples, a major advance compared to previous validation work [11]. The Axb comparison showed an average error of 10% among all samples. The comparison with the drop weight index showed a strong correlation, with an R-Squared value of 0.99. The calculation of the Bond ball mill work index (BBMWi), through a correlation model developed by the Geopyörä company, resulted in an R-Squared value of 0.99, demonstrating a very strong correlation. And, finally, the Axb results considering only one energy level, in contrast to the two energy levels of the standard test, resulted in an R-Squared value of 0.88, proving that it is a great option to simplify the testing procedure while maintaining good accuracy.
The results obtained in this extensive validation work prove the Geopyörä test’s ability to provide accurate information on comminution parameters and shows the need for the mining sector to adopt new technologies capable of providing the necessary ore characterization data more efficiently, perhaps helping to achieve a waited long-term objective of a step-change in modeling capability [12].
The Geopyörä company is feeding back income and funding from grants to continuously improve the relationships and data provided via the test, providing a development pathway for incorporating rock strength directly into process models and predictions.
Author Contributions
Conceptualization, M.d.P.B.; methodology, M.d.P.B. and M.P.; software, T.A.; validation, T.A. and M.d.P.B.; formal analysis, M.d.P.B. and T.A.; investigation, M.d.P.B. and T.A.; resources, M.d.P.B.; data curation, T.A. and M.d.P.B.; writing—original draft preparation, T.A. and M.d.P.B.; writing—review and editing, M.d.P.B. and M.P.; supervision, M.d.P.B. and M.P.; project administration, M.d.P.B. and M.P. All authors have read and agreed to the published version of the manuscript.
Funding
This research received no external funding.
Data Availability Statement
Data are contained within the article.
Acknowledgments
We would like to extend our deepest gratitude to the various mining companies who generously provided us with samples for our research. Their support has been instrumental in the advancement of this study. We also appreciate their provision of Bond and SMC test reference data. This information was invaluable for our comparisons, thereby aiding the validation and development of our research findings. Without their contributions, the completion of this study would not have been possible. We are immensely grateful for their collaboration and assistance.
Conflicts of Interest
Marcos de Paiva Bueno and Thiago Almeida were employed by the company Geopyörä Oy. The remaining authors declare that the research was conducted in the absence of any commercial or financial relationships that could be construed as a potential conflict of interest.
References
- Bueno, M.; Foggiato, B.; Lane, G. Geometallurgy applied in comminution to minimize design risks. In Proceedings of the International Conference on Autogenous and Semiautogenous Grinding Technology, Vancouver, BC, Canada, 24–28 September 2015. [Google Scholar]
- Napier-Munn, T.J.; Morrell, S.; Morrison, R.D.; Kojovic, T. Mineral Comminution Circuits: Their Operation and Optimisation, 1st ed.; Julius Kruttschnitt Mineral Research Centre: Indooroopilly, Australia, 1996. [Google Scholar]
- Morell, S. Predicting the Specific Energy of Autogenous and Semi-autogenous Mills from Small Diameter Drill Core Samples. Miner. Eng. 2004, 17, 447–451. [Google Scholar] [CrossRef]
- Mwanga, A.; Rosenkranz, J.; Lamberg, P. Testing of ore comminution behaviour in the geometallurgical context—A review. Minerals 2015, 5, 276–297. [Google Scholar] [CrossRef]
- Torvela, J. Double Wheel Crusher Prototype. Master’s Thesis, University of Oulu, Oulu, Finland, 2020. [Google Scholar]
- Bond, F.C. Crushing and grinding calculations. Br. Chem. Eng. 1961, 6, 378–385. [Google Scholar]
- Chavez, T.M. Development of a Methodology and Validation of the Geopyörä Breakage Test. Master’s Thesis, University of Oulu, Oulu, Finland, 2020. [Google Scholar]
- Narayanan, S.S.; Whiten, W.J. Determination of comminution characteristics from single-particle breakage tests and its application to ball-mill scale-up. Trans. Inst. Min. Metall. Sect. C 1988, 97, C115–C124. [Google Scholar]
- Doll, A. Calculating DWi from a Drop Weight Test Result. Available online: https://www.sagmilling.com/articles/26/view/Calculating%20DWI%20from%20Axb.pdf (accessed on 6 July 2023).
- Josefin, Y.; Doll, A. Correction of Bond Ball Mill Work Index Test for Closing Mesh Sizes. In Proceedings of the Procemin-Geomet 2018 14th International Mineral Processing Conference & 5th International Seminar on Geometallurgy, Santiago, Chile, 28–30 November 2018; Gecamin: Santiago, Chile, 2018. [Google Scholar]
- Chavez, T.M. The Geopyörä breakage test for geometallurgy. In Proceedings of the IMPC 2020: XXX International Mineral Processing Congress, Cape Town, South Africa, 18–22 October 2020. [Google Scholar]
- Powell, M.S.; Morrison, R.D. The future of comminution modelling. Int. J. Miner. Process. 2007, 84, 228–239. [Google Scholar] [CrossRef]
Disclaimer/Publisher’s Note: The statements, opinions and data contained in all publications are solely those of the individual author(s) and contributor(s) and not of MDPI and/or the editor(s). MDPI and/or the editor(s) disclaim responsibility for any injury to people or property resulting from any ideas, methods, instructions or products referred to in the content. |
© 2023 by the authors. Licensee MDPI, Basel, Switzerland. This article is an open access article distributed under the terms and conditions of the Creative Commons Attribution (CC BY) license (https://creativecommons.org/licenses/by/4.0/).

