Abstract
Mineral resource classification is an important step in mineral exploration and mining engineering. In this study, copper and molybdenum resources were classified using a combination of the Turning Bands Simulation (TBSIM) and the Concentration–Volume (C–V) fractal model based on the Conditional Coefficient of Variation (CCV) for Cu realizations in the Masjed Daghi porphyry deposit, NW Iran. In this research, 100 scenarios for the local variability of copper were correspondingly simulated using the TBSIM and the CCVs were calculated for each realization. Furthermore, various populations for these CCVs were distinguished using C–V fractal modeling. The C–V log–log plots indicate a multifractal nature that shows a ring structure for the “Measured”, “Indicated”, and “Inferred” classes in this deposit. Then, the results obtained using this hybrid method were compared with the CCV–Tonnage graphs. Finally, the results obtained using the geostatistical and fractal simulation showed that the marginal parts of this deposit constitute inferred resources and need more information from exploration boreholes.
1. Introduction
Mineral resource classification is a significant step in mineral exploration projects for feasibility studies. At this stage, geostatistical methods can be used to support the assessment of uncertainty and risk. Resource classification can be carried out based on different criteria such as the distance between drillholes, kriging variance, multiple pass kriging plans, and uncertainty models that are provided by using geostatistical simulations [1,2,3,4,5,6,7,8,9].
Alternatively, one of the most important aims of geostatistical simulations is to assess the joint uncertainty between multiple realizations allowing a more complete representation of uncertainty for each block and between multiple locations of blocks, which deterministic approaches such as kriging are not able to produce. Geostatistical simulation methods reproduce input data parameters based on their statistical characteristics including their variogram and histogram [10,11,12,13,14,15,16,17,18].
Conventional geostatistical simulation approaches for continues variables (e.g., the ore grade) consist of the Sequential Gaussian Simulation (SGS) [19,20], the turning bands simulation (TBSIM) [21], the LU decomposition [22], the direct sequential simulation [23], the direct block simulation [24], and the probability field simulation [25]. The TBSIM was introduced by Matheron (1973) [26] as an unconditional simulation and developed by Journel (1974) [27] for the simplification of the Gaussian simulation problem in multi-dimensional spaces. This method produces a variable in one dimension and spreads them into 2D and 3D spaces for different realizations [28,29,30,31].
Fractal modeling is a proper methodology for the definition of various populations in natural sciences that is established by Mandelbrot (1983) [32]. The Concentration–Volume (C–V) fractal model proposed by Afzal et al. (2011) [33] has been used for the detection of different mineralized zones in different ore deposit types [34,35]. Furthermore, this method was used for the separation of ore grades’ populations from the different realizations [36].
In this research, the combination of the TBSIM and C–V model is utilized for copper and molybdenum resource classification in the Masjed Daghi Cu–Mo porphyry deposit, NW Iran. The coefficient of variations for Cu and Mo were computed based on the TBSIM and categorized by the C–V fractal modeling. This hybrid method between TBSIM and C–V fractal model based on the Conditional Coefficient of Variation (CCV) is a proposed method for this purpose. The average values of CCVs for Cu and Mo are used for resource classification. At last, the results obtained using this methodology are compared with the CCV–Tonnage graphs for Cu and Mo that were proposed by Dimitrakopoulos et al. (2009).
2. Geological Setting
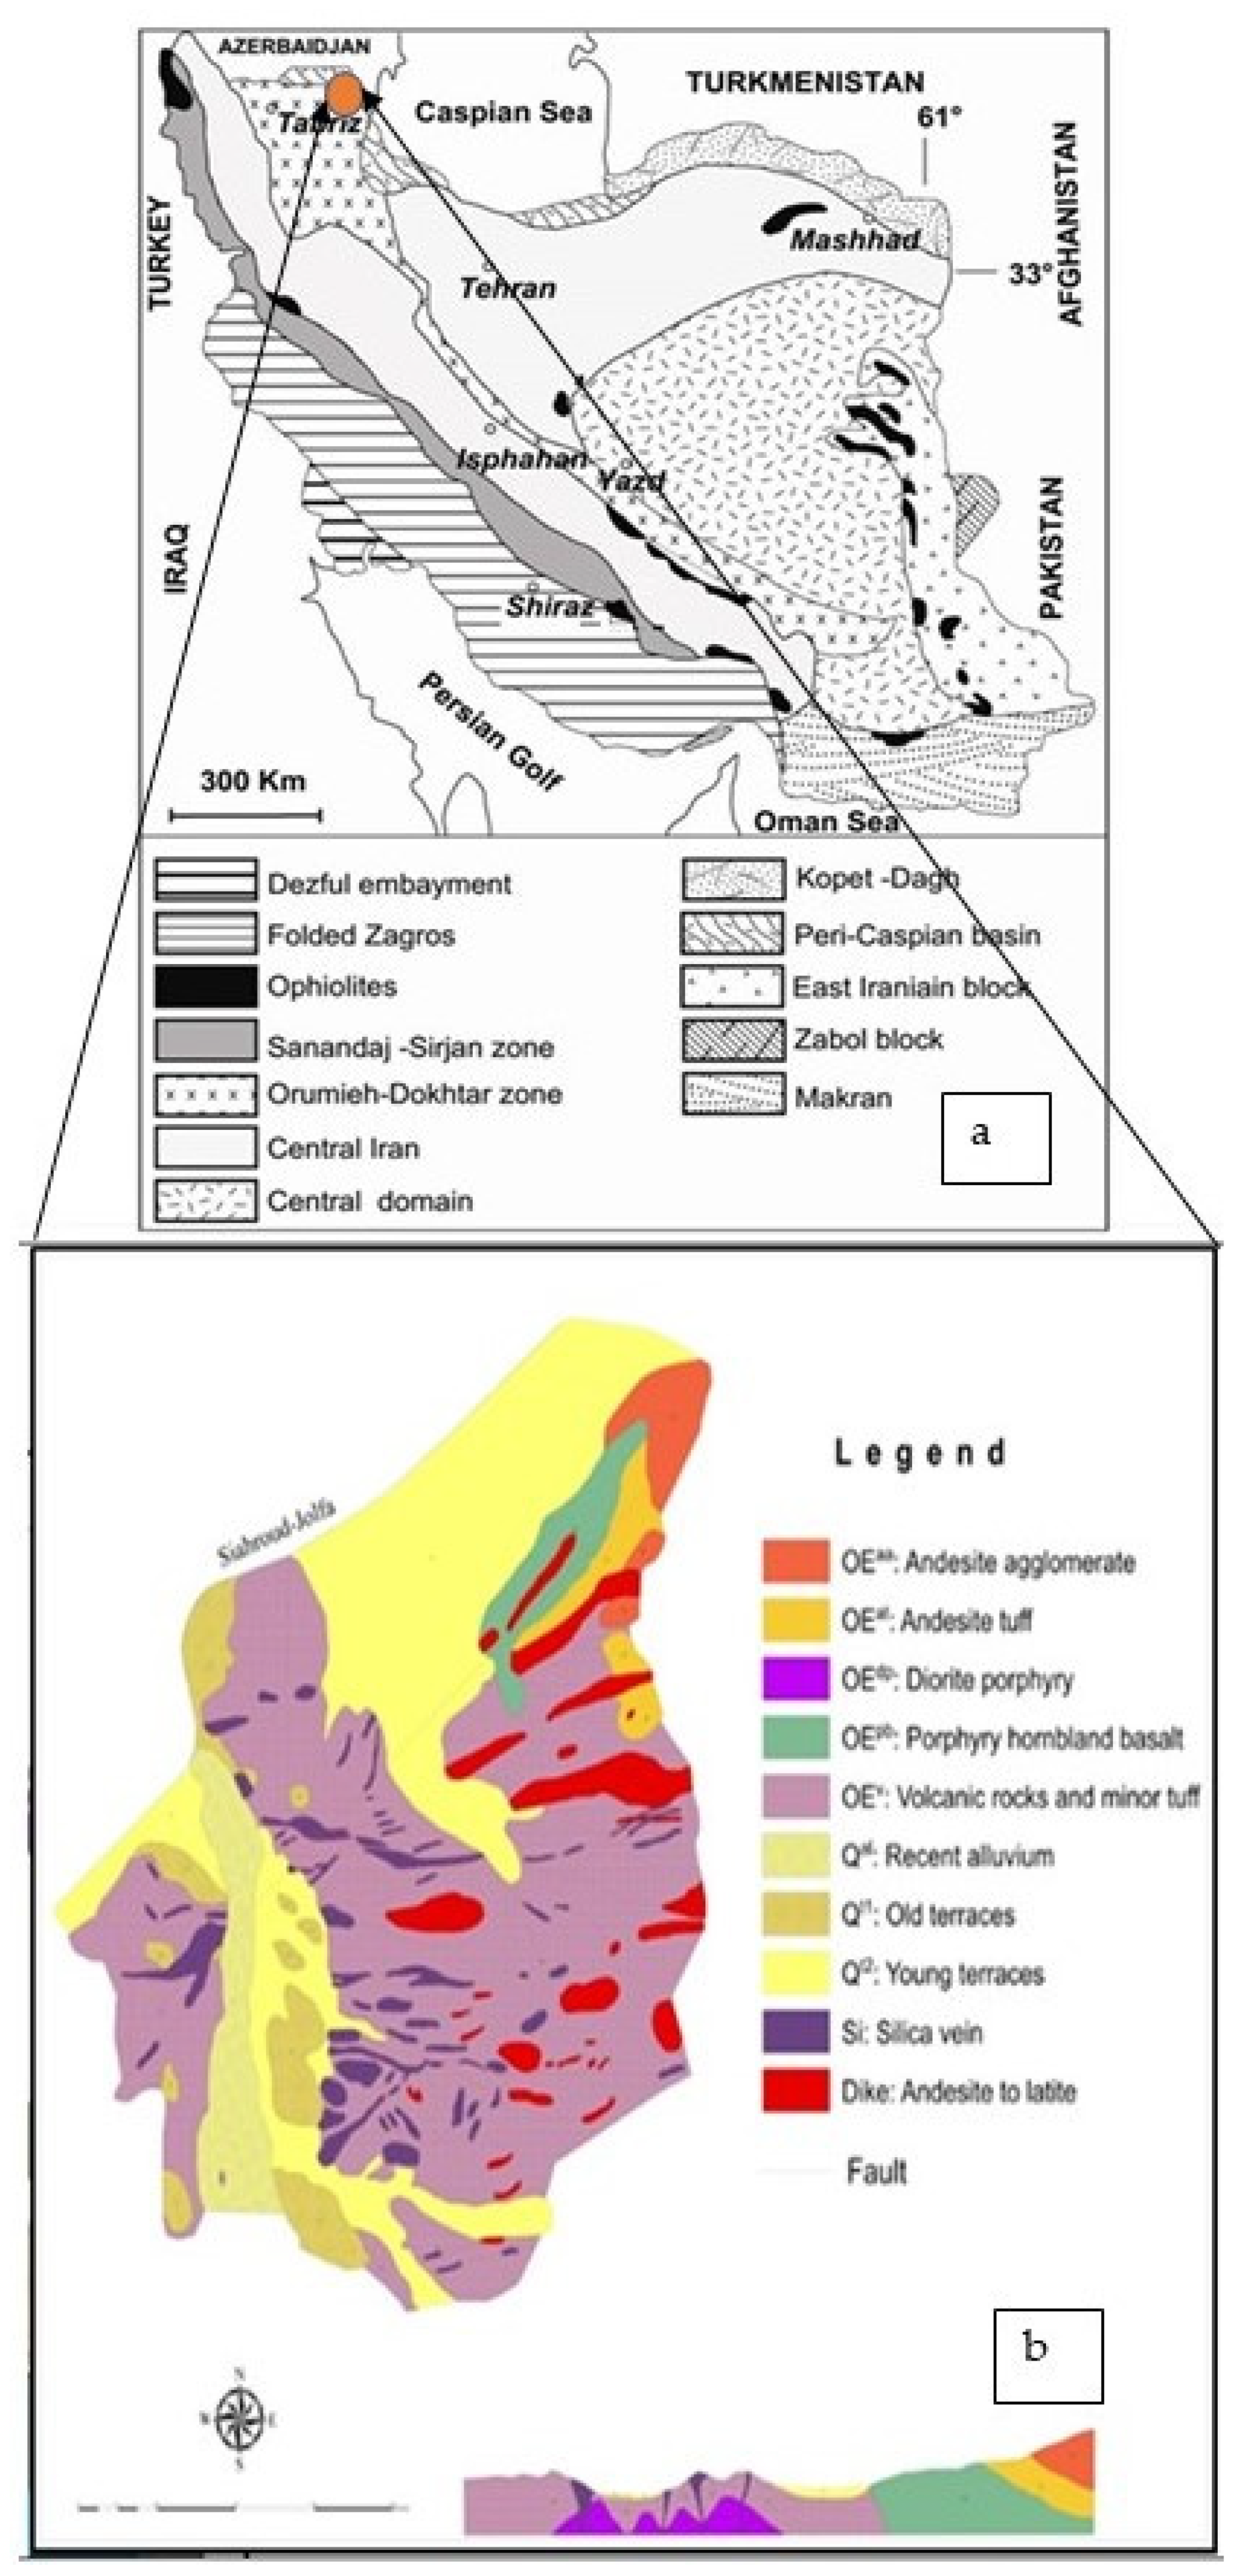
The Masjed Daghi deposit is located 35 km east of Jolfa, East Azarbaidjan (NW Iran; Figure 1). This deposit is situated in the NW part of the Urumieh–Dokhtar magmatic belt (Arasbaran). This deposit contains 340 Mt with Cu and Mo averages equal to 2700 ppm and 60 ppm, respectively [37]. The host rocks include Eocene andesite, trachyandesite, dacite, tuffs, and agglomerates, intruded by a shallow diorite porphyry intrusion. Geological and mineralogical studies show that the quartz diorite subvolcanic unit along with Oligocene volcanic rocks in the area were severely altered by hydrothermal fluids. There are porphyry copper type and high sulfidation epithermal gold mineralization [37]. Six types of alteration zones were developed within magmatic rocks including potassic, potassic–phyllic, phyllic, phyllic–argillic, intermediate argillic, and propylitic [38].
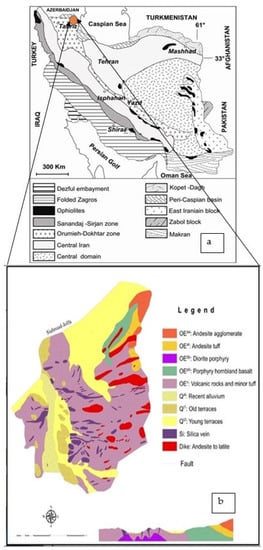
Figure 1.
Simplified geological map of Masjed Daghi deposit [39] (a) and its location in the structural map of Iran [40] (b). The orange circle refers to the study area.
Mineralization occurs in breccias and vuggy quartz and quartz–barite veins. Pyrite and chalcopyrite are the main ore minerals that associate with molybdenite, sphalerite, galena, and Fe-oxides. The gold contents vary between 0.1 and 30 ppm. The auriferous veins are surrounded by the argillic, silicic, alunite, and chlorite alteration zones. The epithermal system at the Masjed Daghi appears to be associated with a porphyry Cu–Mo system at deeper levels [38].
3. Material and Methods
3.1. Dataset
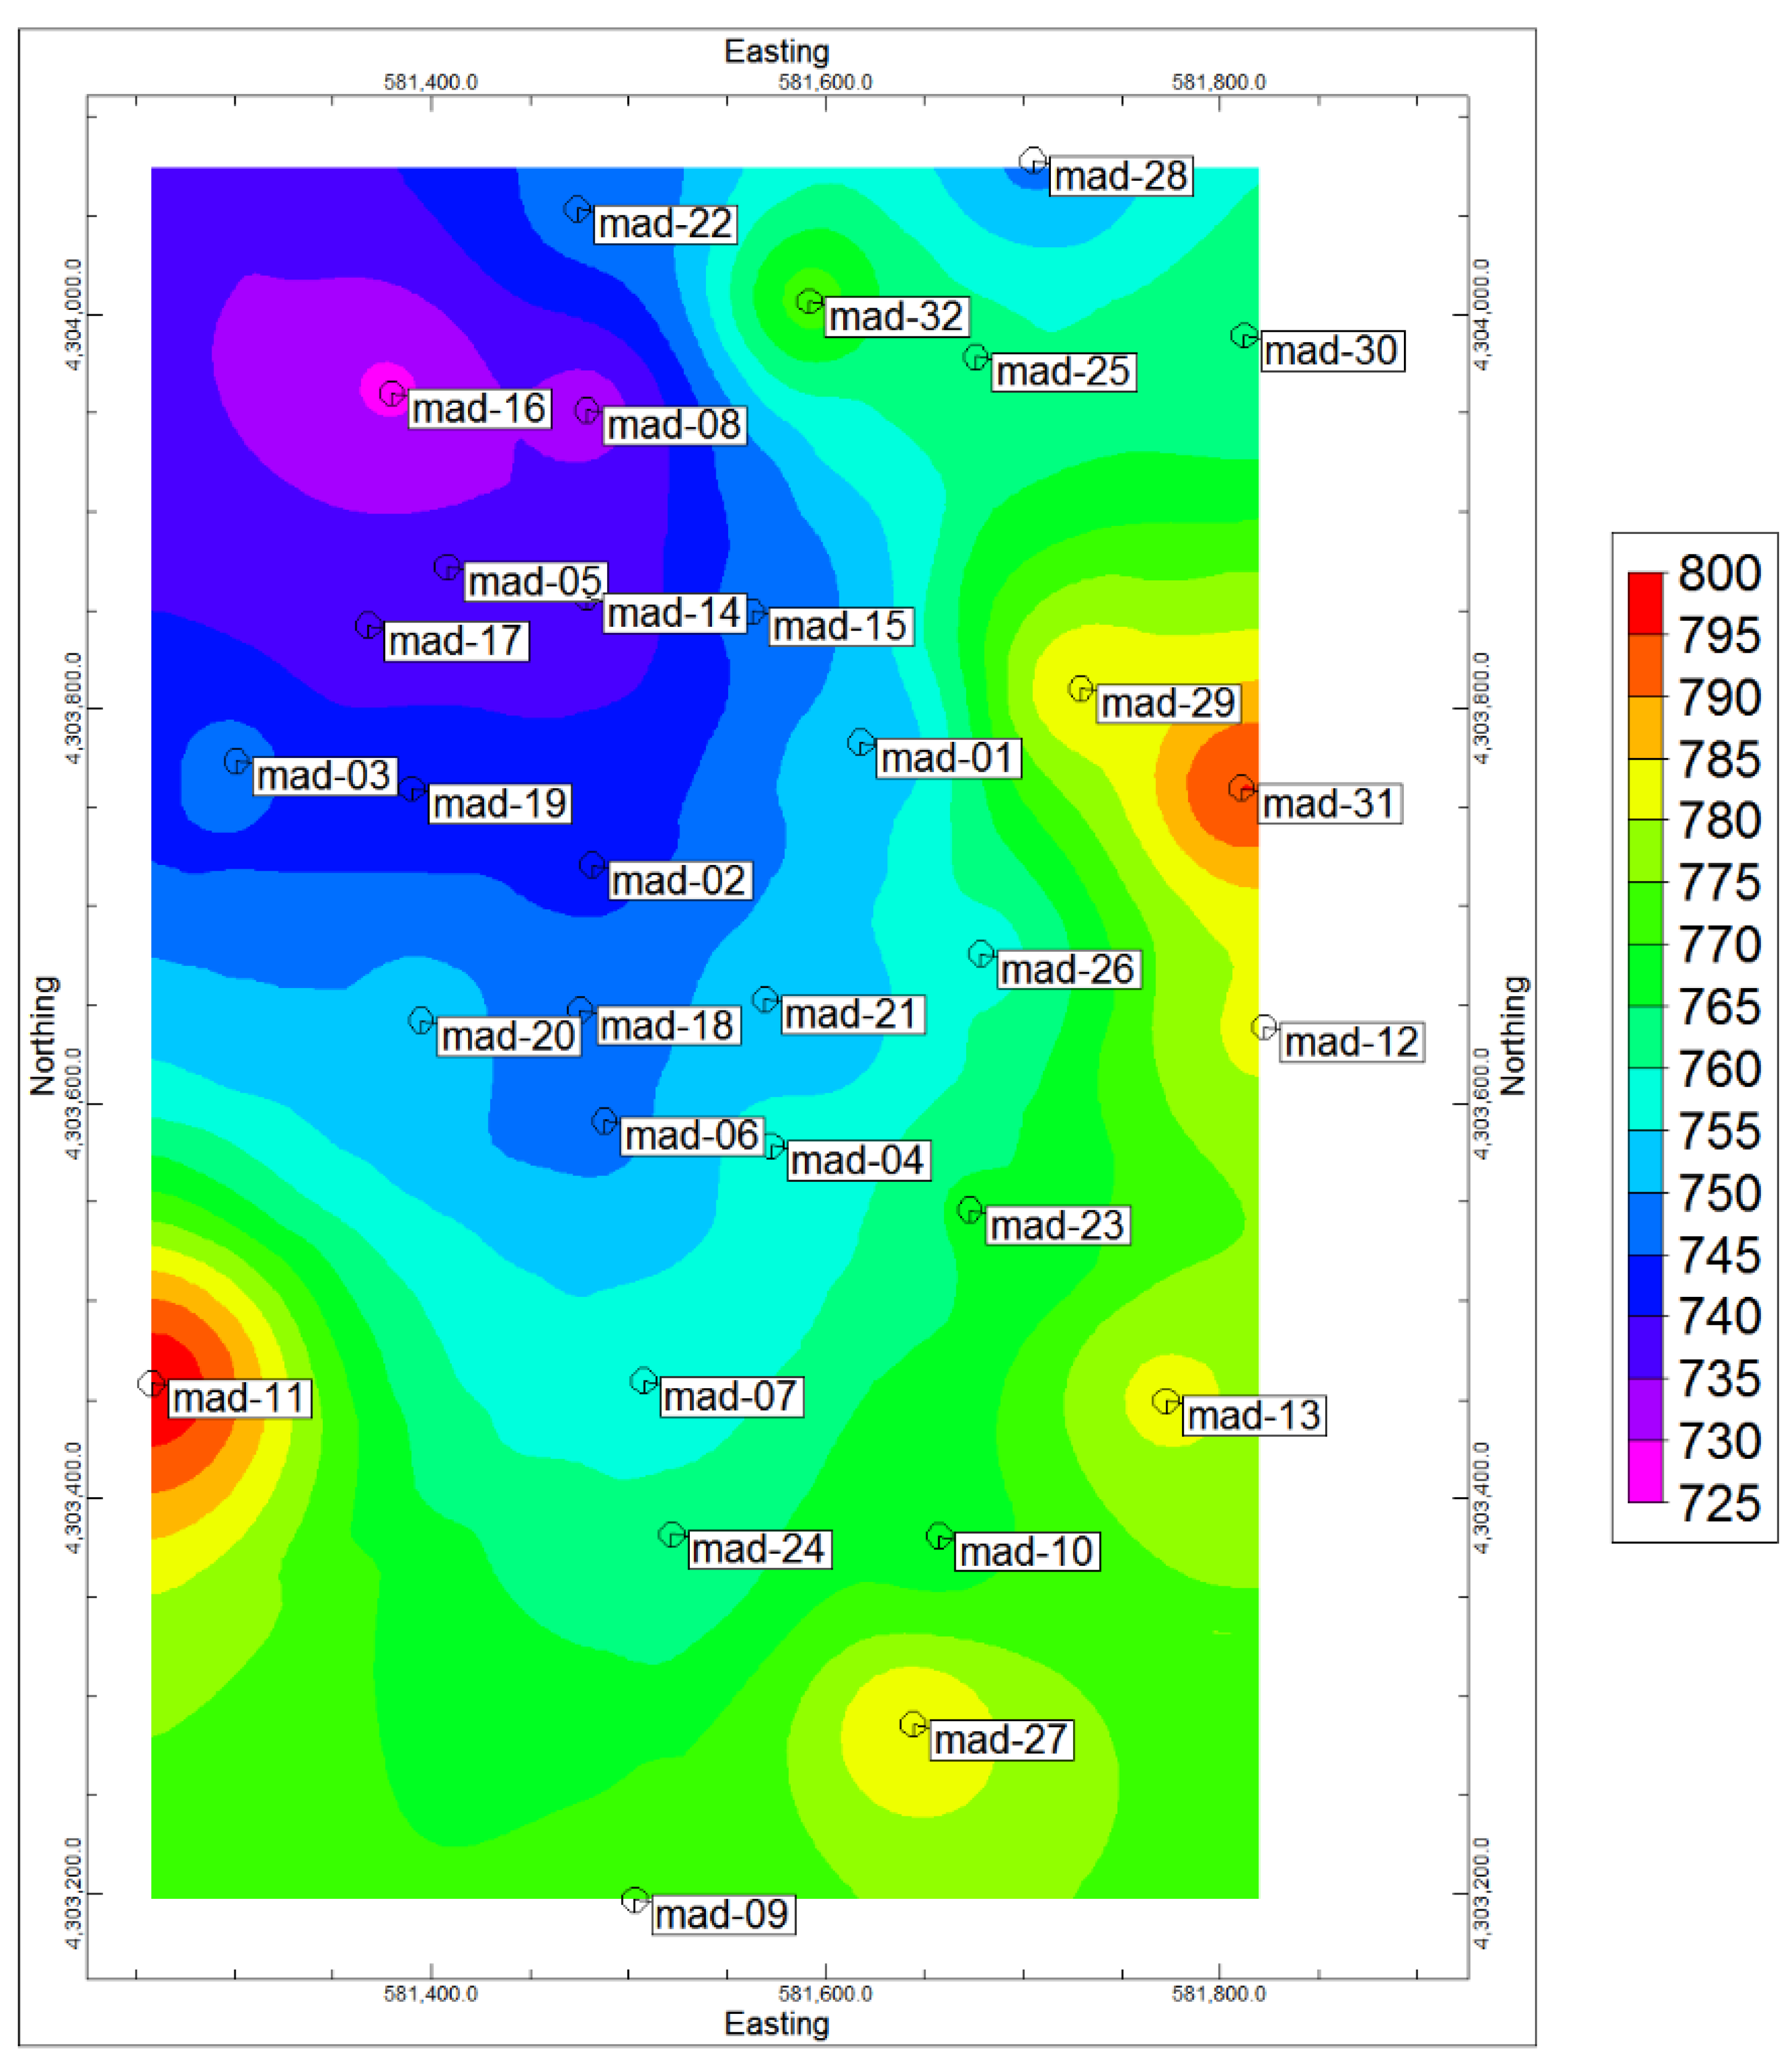
The dataset contains 18,679 core samples with 2 m length from 69 boreholes (Figure 2). These samples were analyzed using the ICP-MS method for Cu, Mo, and related elements at the ACME CHEMEX Company (Canada). The detection limits for Cu and Mo are 1 ppm and 0.5 ppm, respectively. The first step in exploratory data analysis includes the detection of all possible outliers and duplicated samples [41]. The outliers are recognized by the histograms of these data so there are no censored data and, finally, the outliers are corrected using the Durfel method [42].
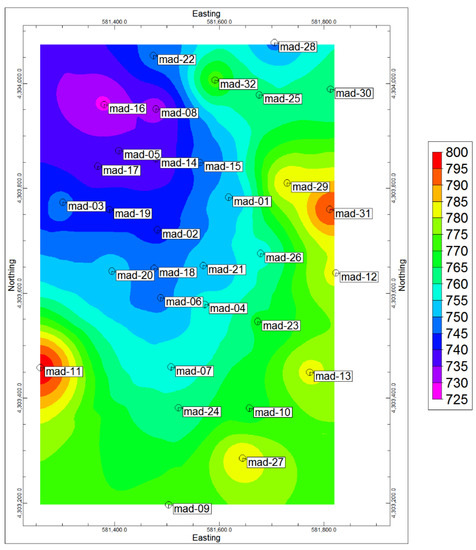
Figure 2.
Location of borehole in Masjed Daghi deposit in 2D view based on topographical differences.
3.2. TBSIM
The TBSIM was first introduced by Chentsov (1957) [43] in a special case of Brownian random functions. It has been developed to the stationary and stochastic simulation by Matheron (1973) [26]. This method aims at simplifying the simulation operation in multi-dimensional spaces according to simulation in one dimension and spreading them to the 2D/3D spaces [21]. The TBSIM is carried out based on a set of randomly distributed bands or lines. The general procedure follows [21,44]:
- -
- Raw data values should be declustered;
- -
- Declustered data are transformed to standard normal distribution;
- -
- Variograms are generated based on the transformed data;
- -
- Turning band simulation using the transformed data and variogram is performed;
- -
- Then, the simulation data must be back-transformed from normal distribution to the original scale;
- -
- Eventually, the realization maps of TBSIM are generated.
3.3. C–N Fractal Model
The concentration–number (C–N) fractal model was proposed by Hassanpour and Afzal (2013) [45] based on the number–size (N–S) fractal method [32]. The C–N fractal model is an essential fractal model used to define the geochemical anomaly or mineralized zone threshold values in an exploratory dataset. The C–N fractal model was defined as:
where N(≥ρ) indicates the sample number with concentration values greater than the ρ. The ρ is the concentration of the element and β is a fractal dimension. The main advantage of this method is the classification of geochemical populations before estimation [46,47,48,49,50,51,52].
N(≥ρ) ∞ ρ−β
3.4. C–V Fractal Model
The C–V fractal model was first introduced by Afzal et al. (2011) [33] for the delineation of mineralized zones and barren host rocks in different types of ore deposits, especially porphyry ores. It must be added here that, in the C–V model, “C” can be replaced by either “concentration” (e.g., grade or tonnage) or “probability” (e.g., uncertainty). In this paper, the researchers used “C” to refer to both uncertainty and concentration. The C–V fractal model can be expressed as:
where V(c ≤ ν) and V (c > ν) represent volumes (V) with concentration values (c) smaller and greater than contour values (ν), respectively; a1 and a2 are characteristic exponents [53,54,55]. In this paper, the Conditional Coefficient of Variation (CCV) values derived using a TBSIM are classified using the C–V fractal model.
V(c ≤ ν) ∞ c −a1; V (c > ν) ∞ c −a2
3.5. Hybrid Regression Models
Different approaches have been proposed and developed for “Mineral Resource Classification” such as the number of drillholes and samples that are used in the estimation, probability density function of the grade for each sub-cell, and its estimated variance [3]. Dimitrakopoulos et al. (2009) [3] studied the estimated variances of a block model for a diamond deposit. In this method, the Conditional Coefficient of Variation (CCV) for each sub-cell is calculated using the following equation:
where k are threshold values for discretizing the range of variation of z values. zk is the mean of the class zk−1. In the case of a within-class linear interpolation model, it corresponds to the following:
zk = (zk−1 + zk)/2
A first confidence interval based on the CCV involves fixed threshold CCVs derived using the fractal simulation that is compared to the CCV obtained using CCV versus the tonnage graph [3].
4. Results and Discussion
4.1. Pre-Processing
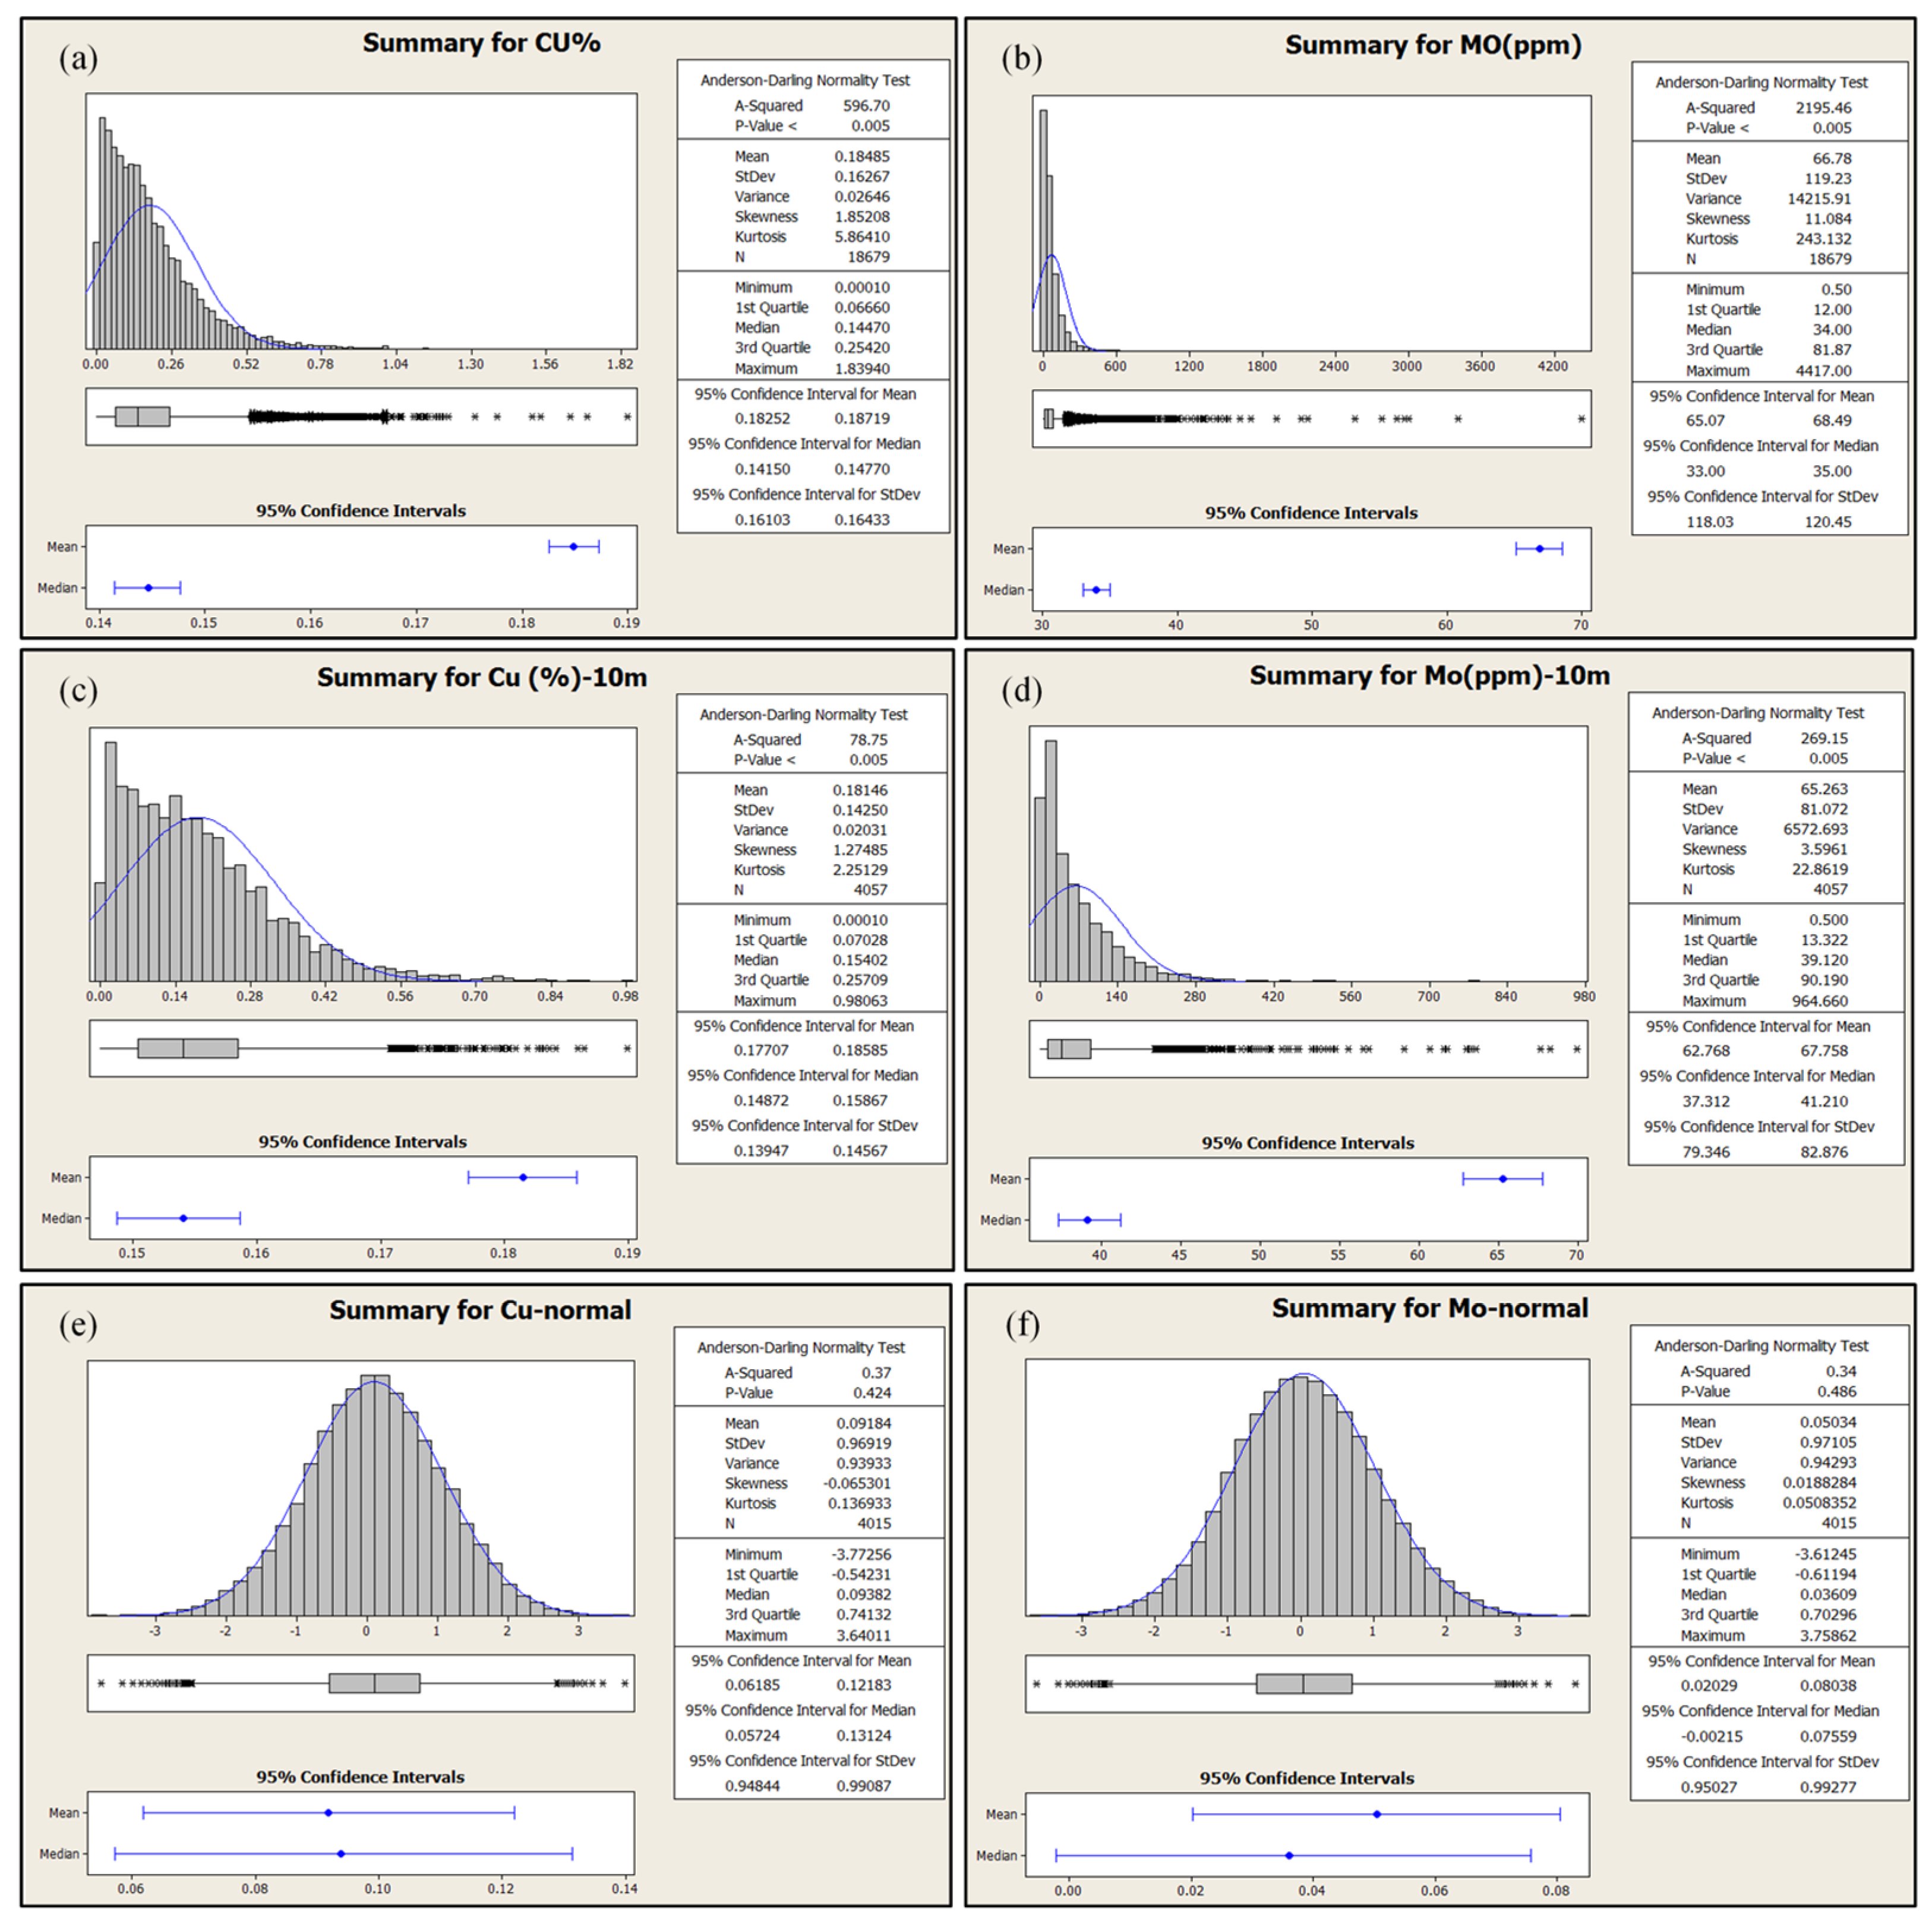
The first step of this methodology is using a dataset that is obtained using homotopic sampling patterns [56]. It is assumed that all conditions of the samples have equal length. Accordingly, the composites with lengths of 2, 5, and 10 m are created and the optimal length was selected as 10 m based on their histograms and comparison with the raw data. Based on this composition, the number of data was significantly reduced to 4057 samples.
In the next step, the data are declustered to ensure the global distribution is more representative using the cell declustering method [20,27]. The cell declustering technique is implemented in a dimension of 100 m × 100 m × 10 m based on the primary pattern of the drilling grid. The cell declustering technique [11] is applied in this study to correct the pseudo-skewness in the global distribution of Cu and Mo. The declustered data are then transformed to a standard normal distribution [20]. The histogram of raw, composited, and normal score data are depicted in Figure 3.
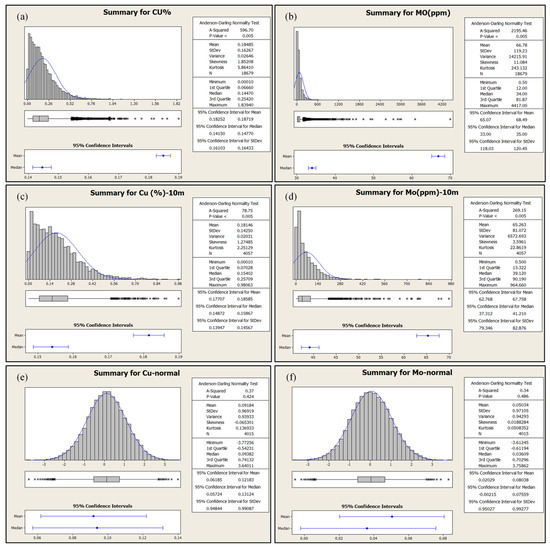
Figure 3.
Histogram of raw data for (a) Cu and (b) Mo; histogram of 10 meters’ composite data for (c) Cu and (d) Mo and also histogram of normal score transform for (e) Cu and (f) Mo.
4.2. Application of TBSIM for CCV Calculation
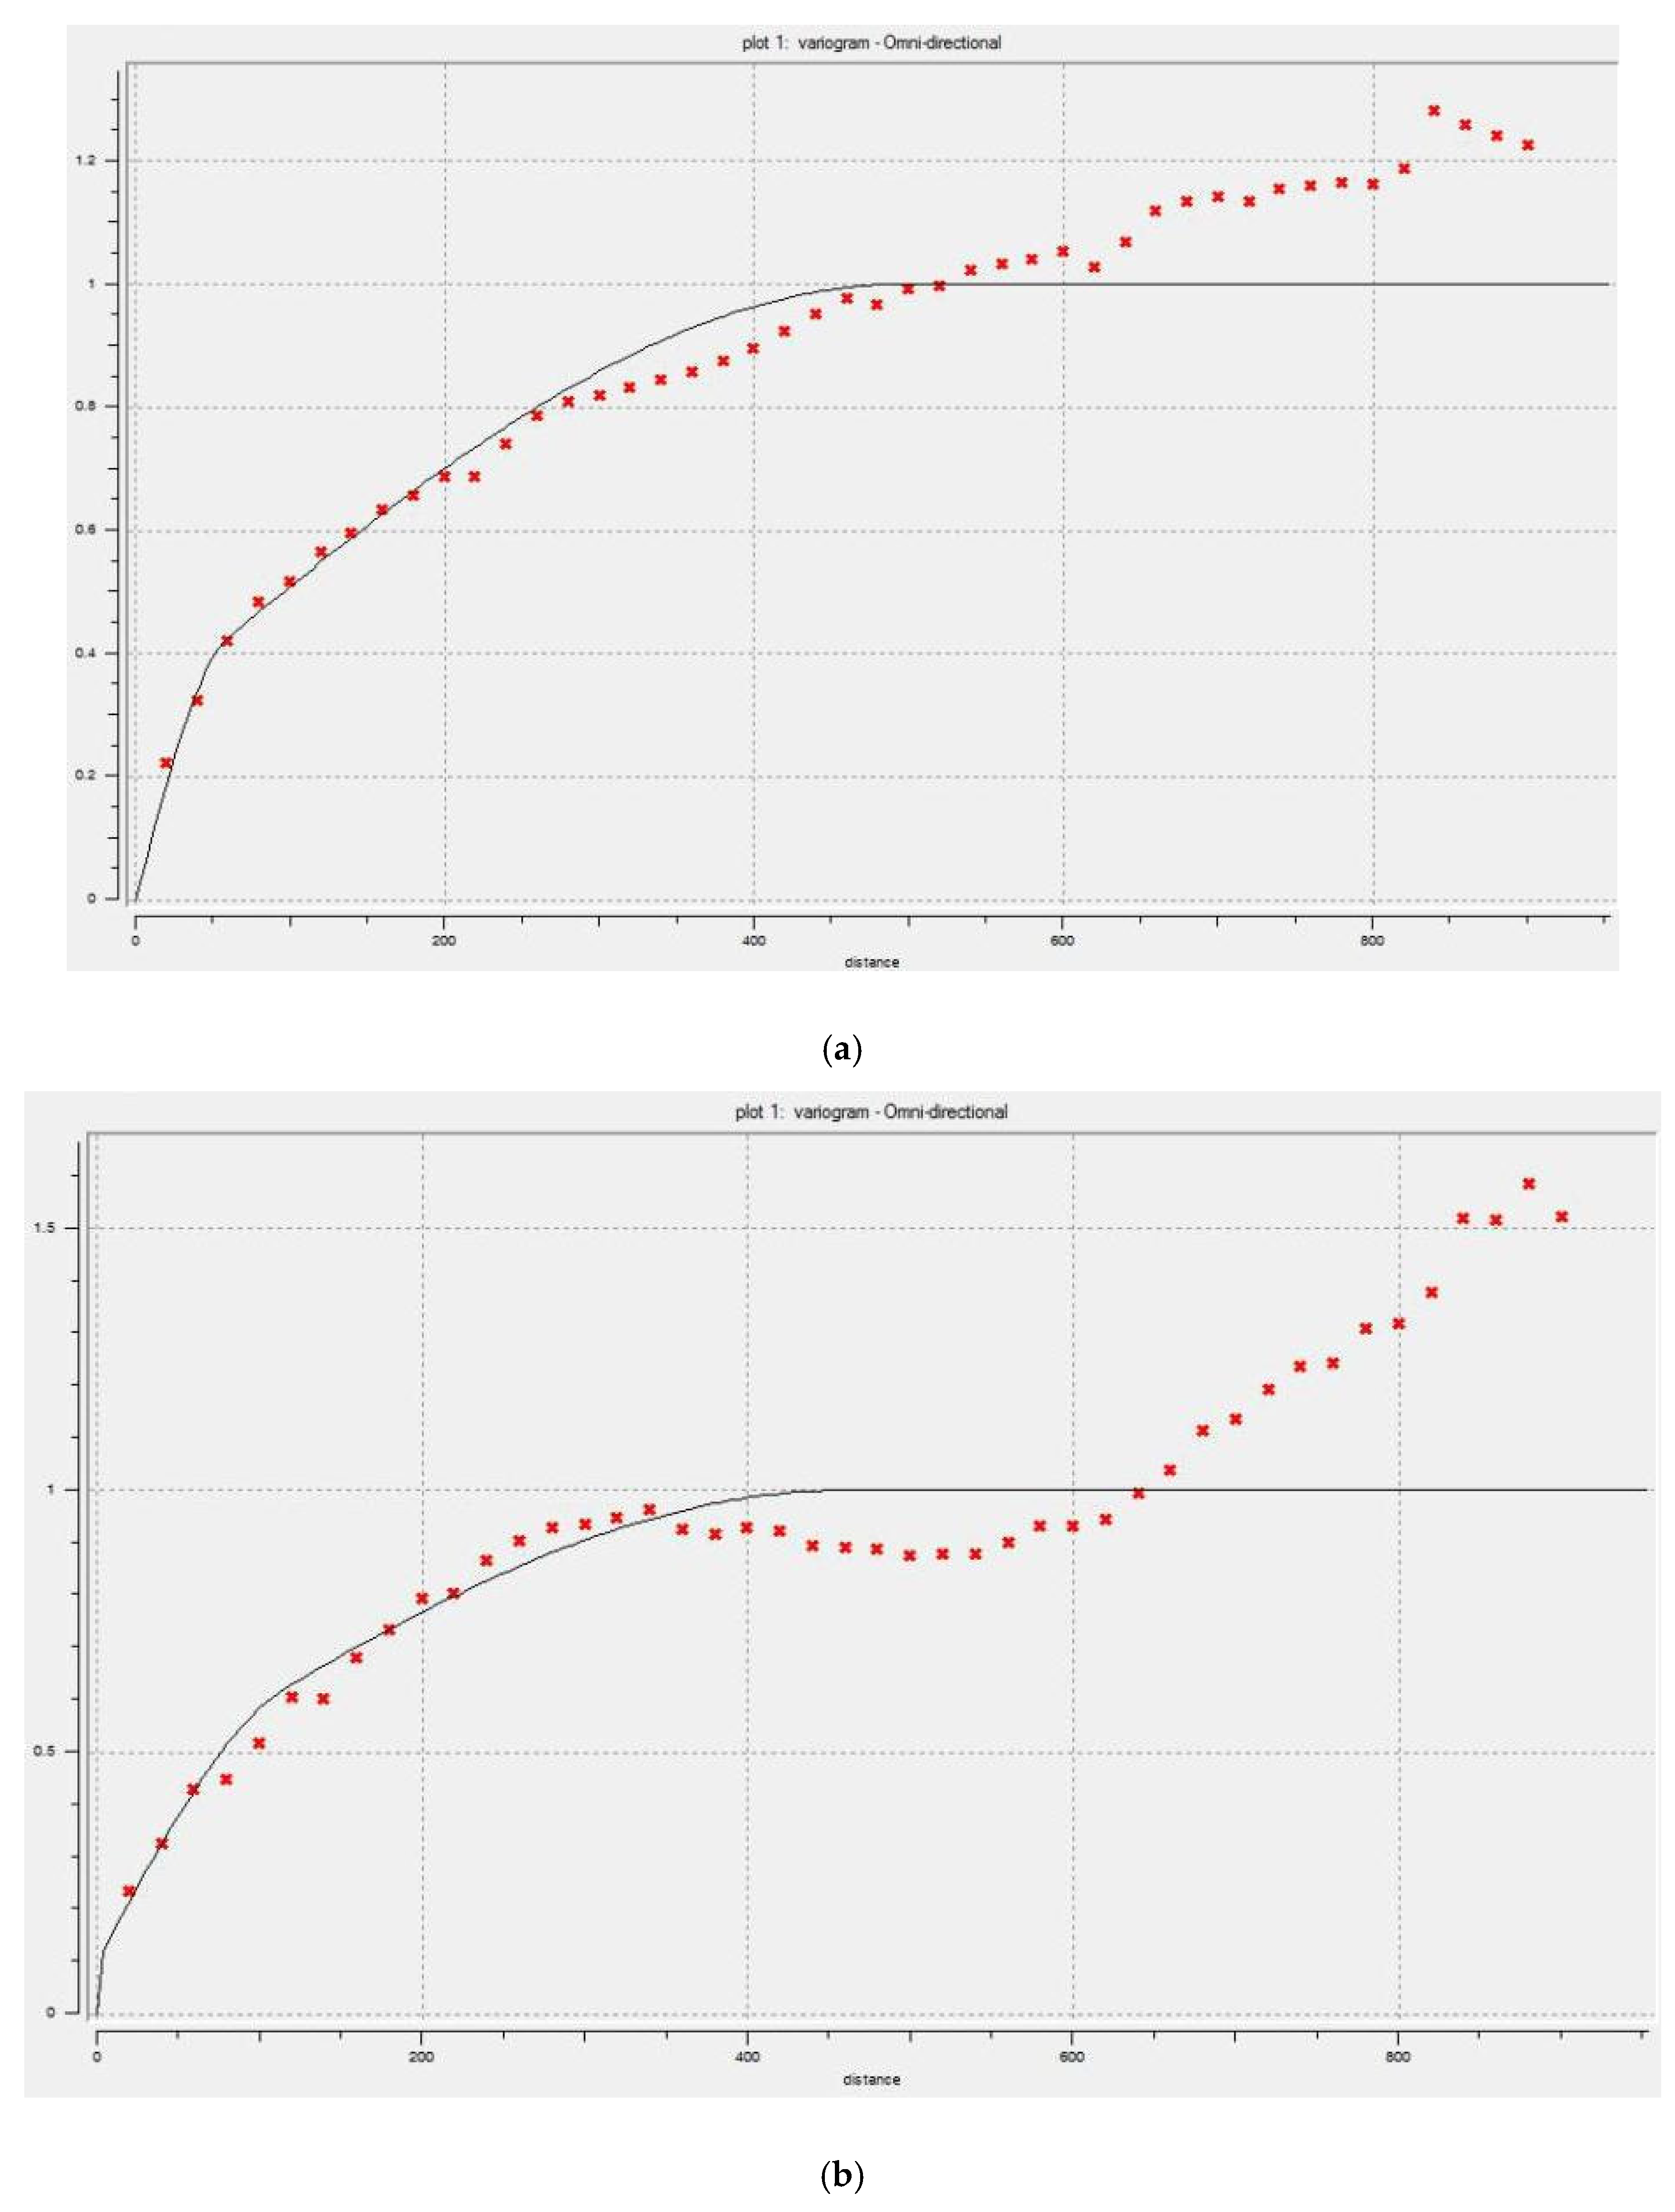
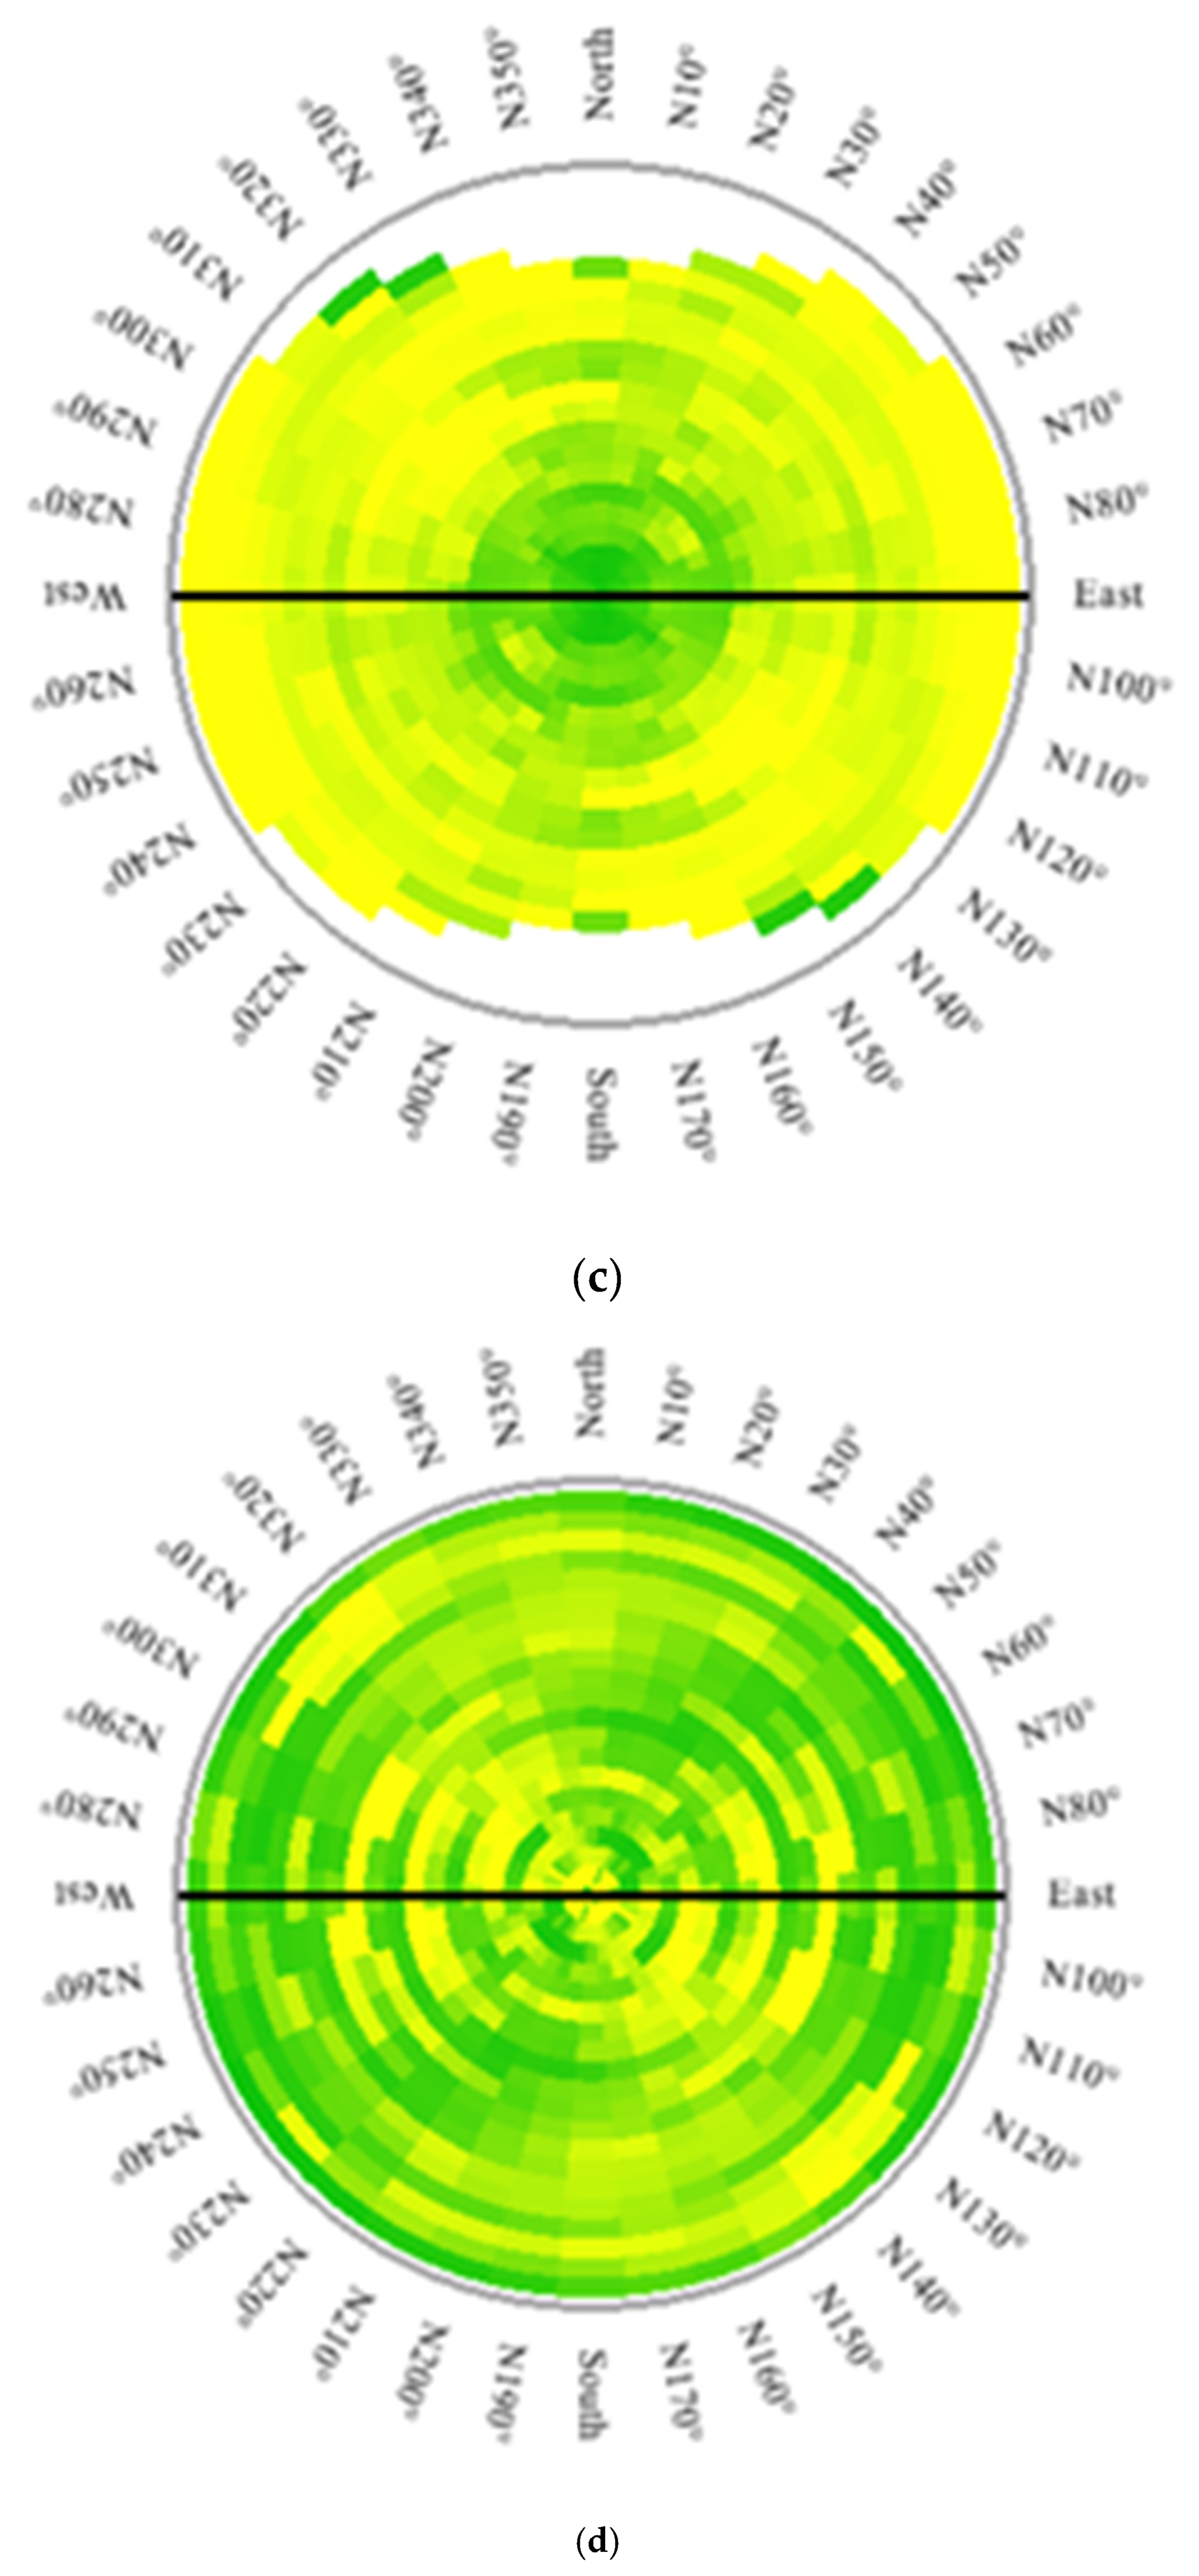
The TBSIM approach in this study was applied to the CCV simulation of Cu and Mo in the Masjed Daghi deposit. To implement the TBSIM method, the variograms of Cu and Mo must be quantified over the transformed Gaussian values. The anisotropy studied by the experimental variogram in various directions, and the results indicated that the spatial distribution is isotropic; therefore, the omnidirectional variograms are calculated, and the two-structured model is fitted into the variables as depicted in Table 1.

Table 1.
Characteristics of fitted variograms for Cu and Mo.
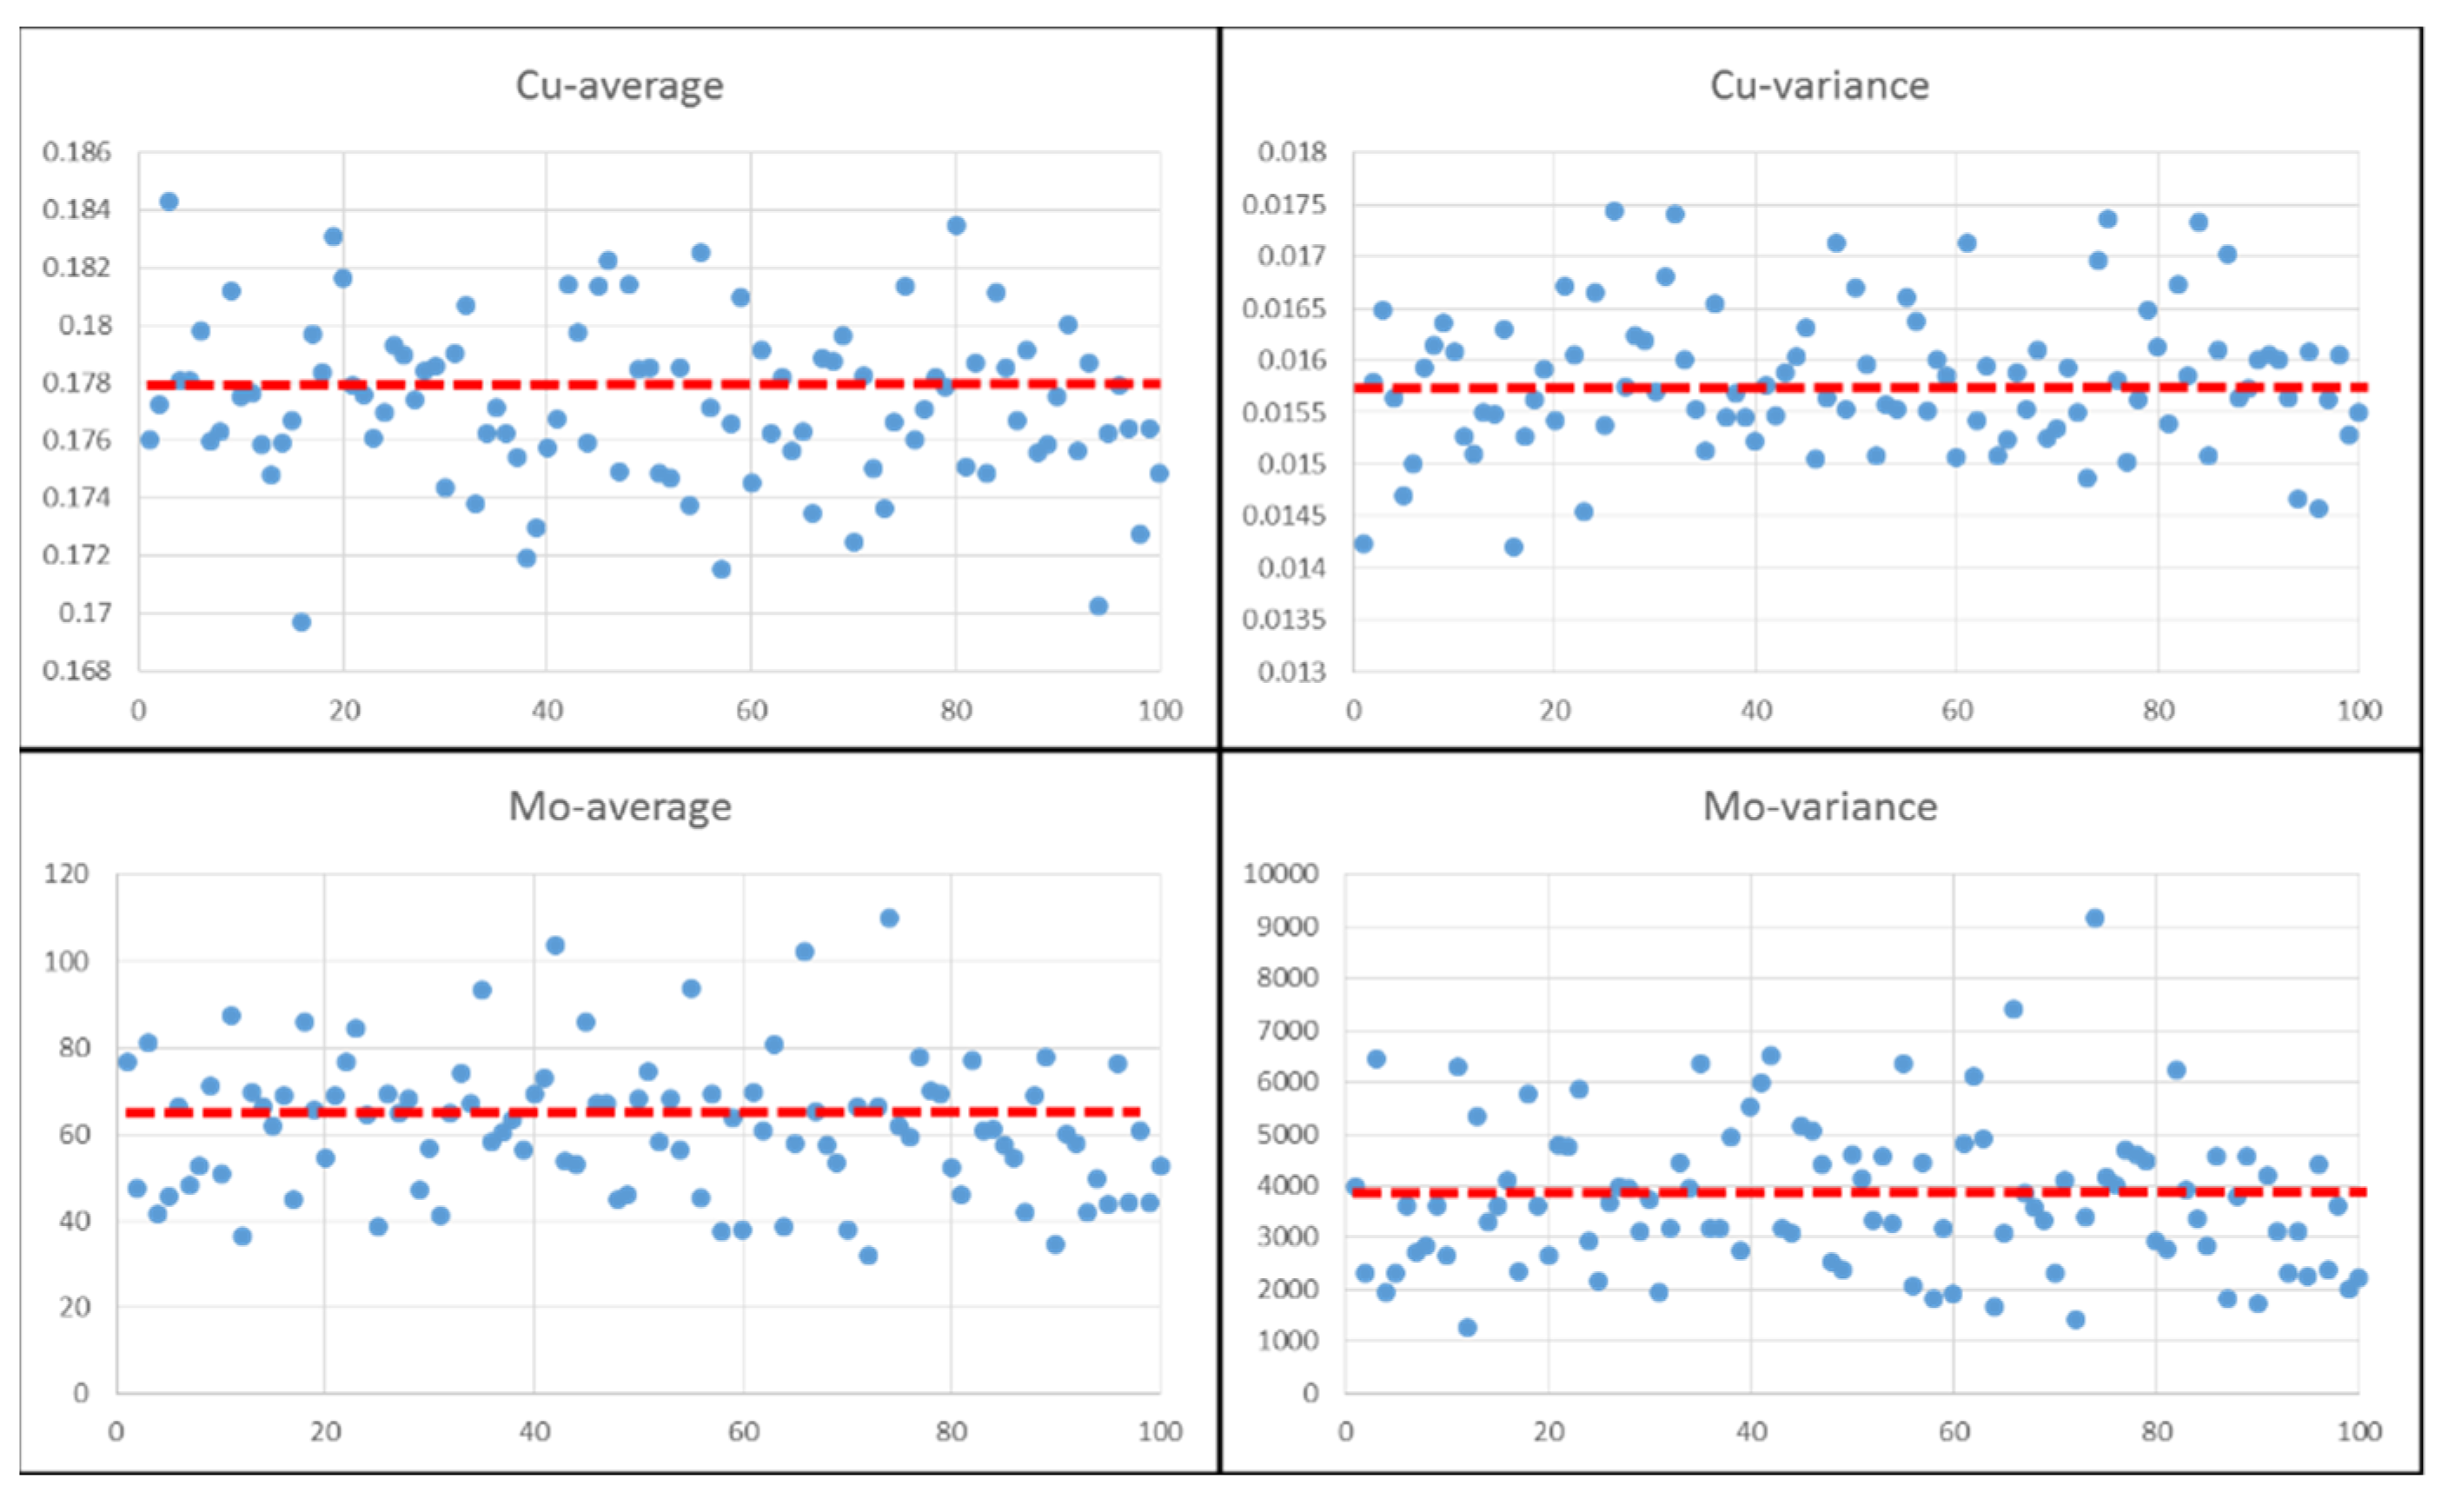
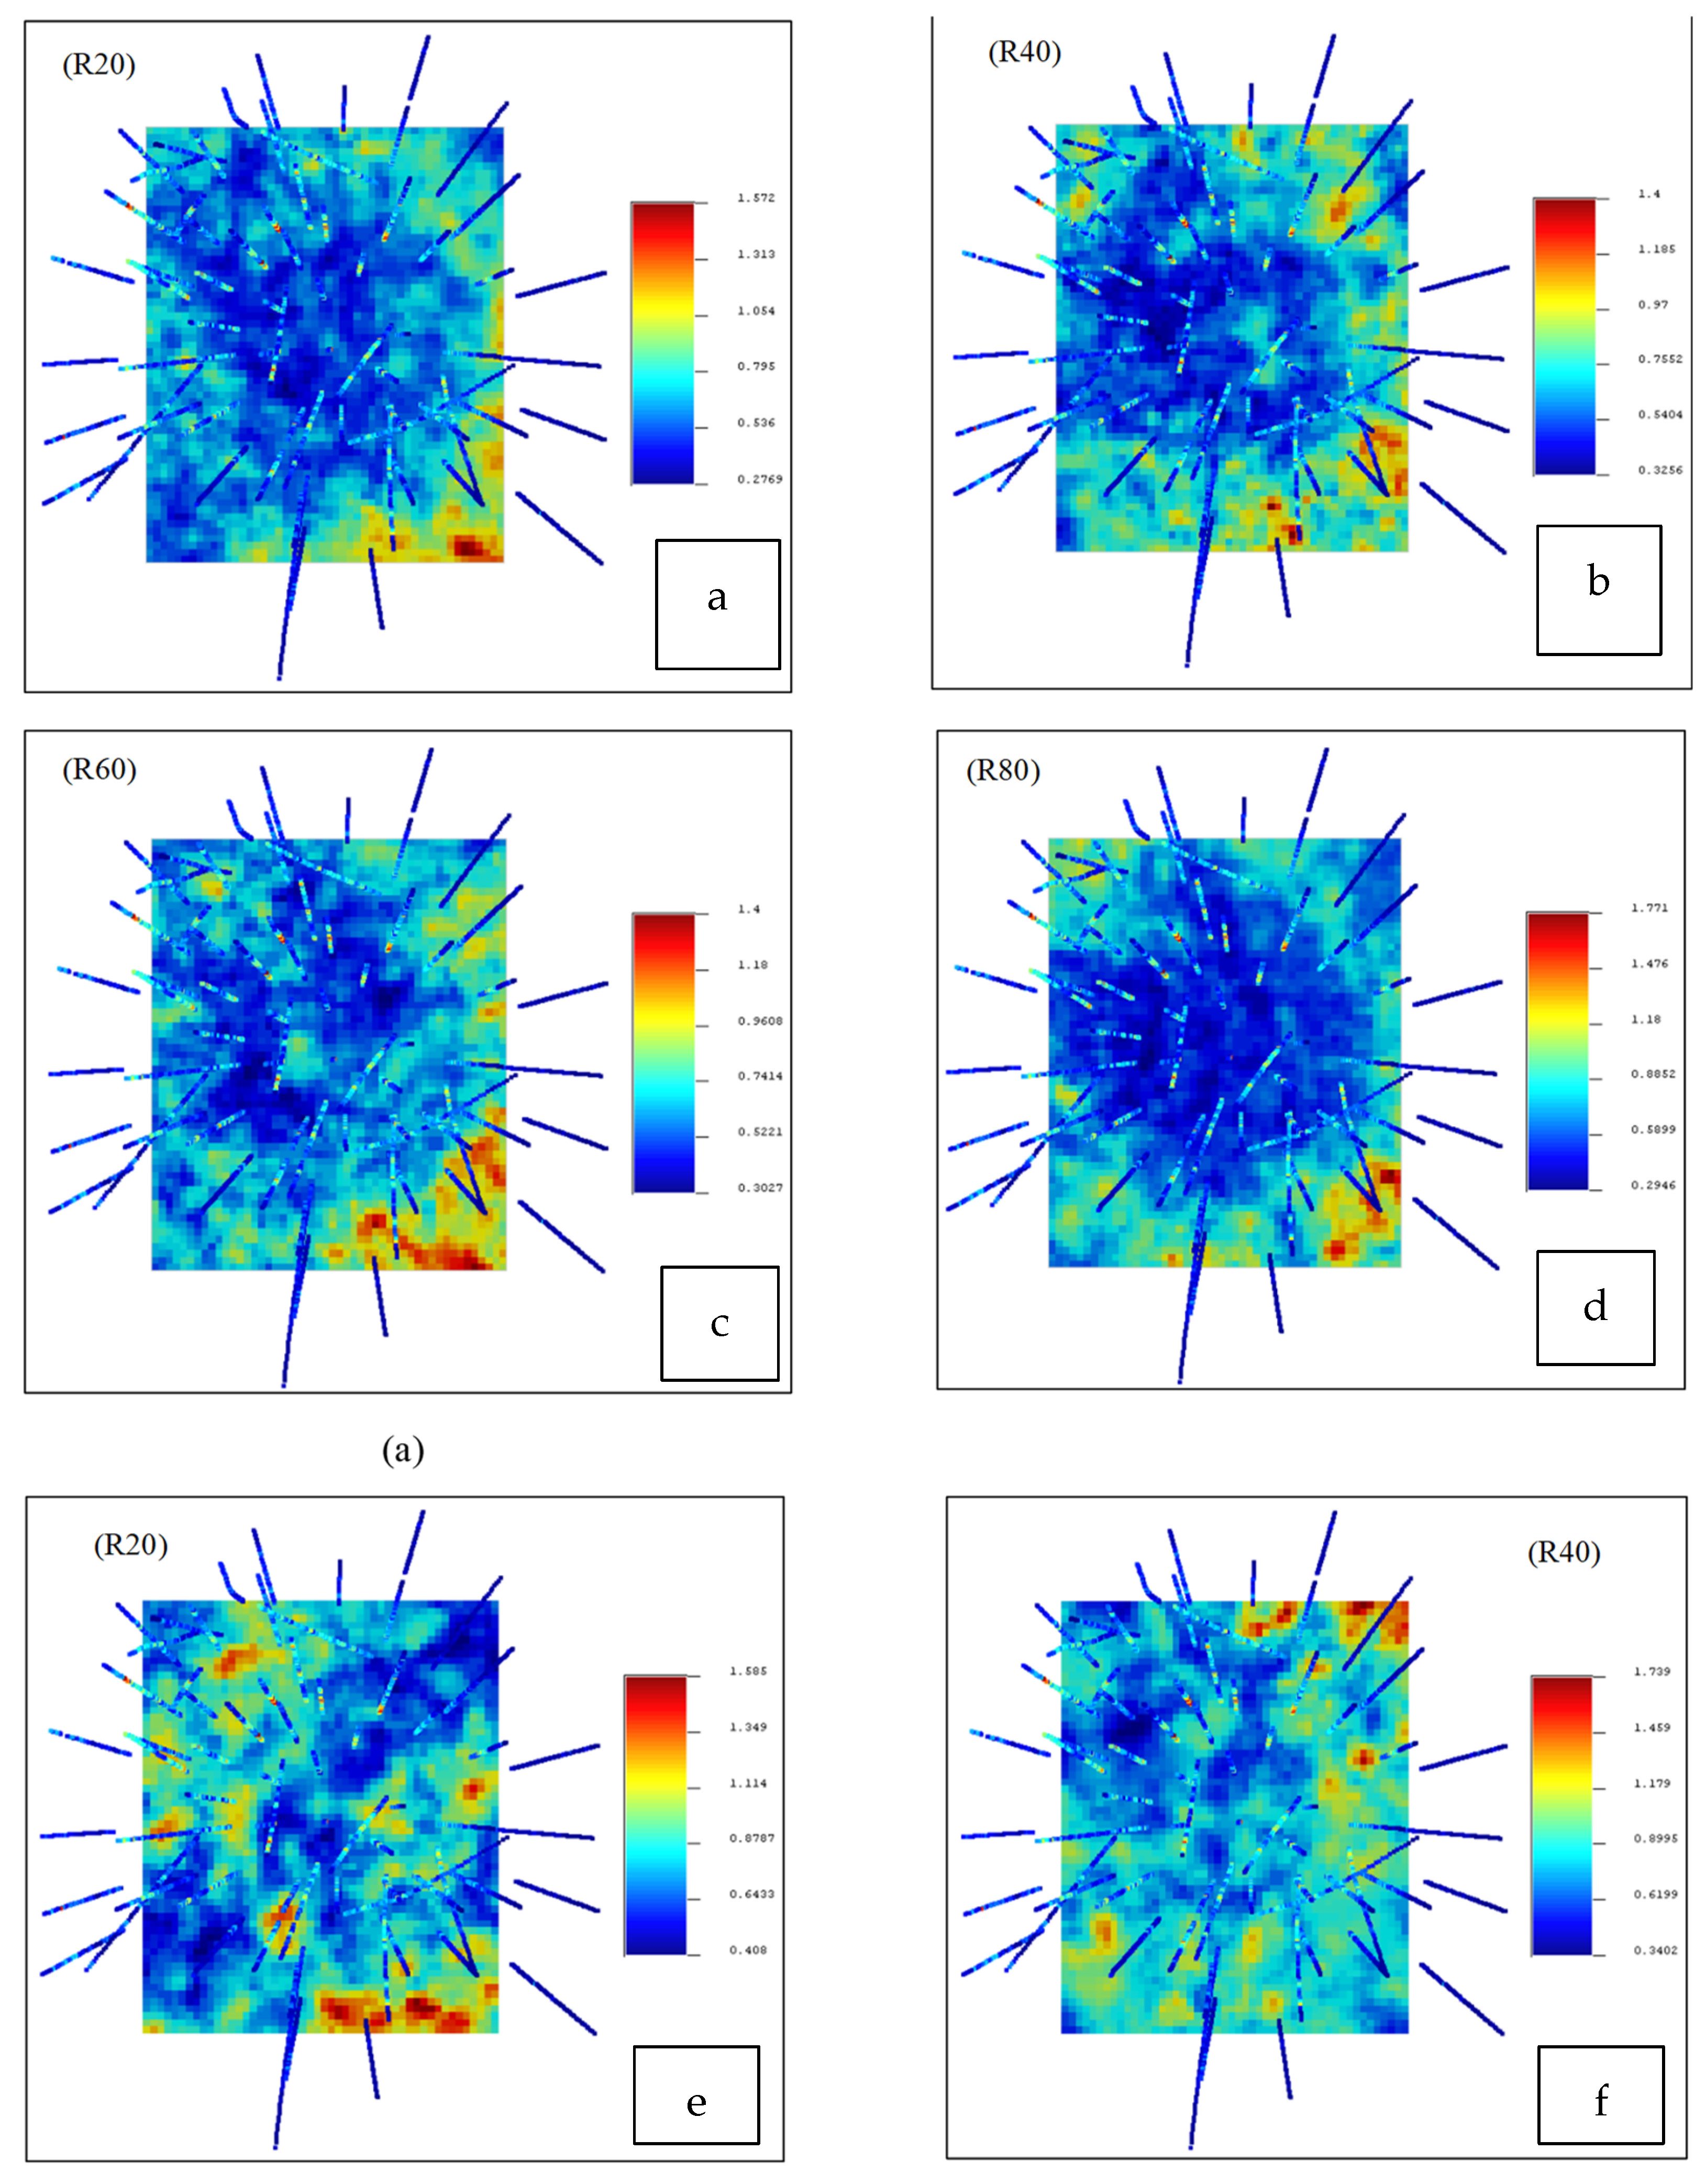
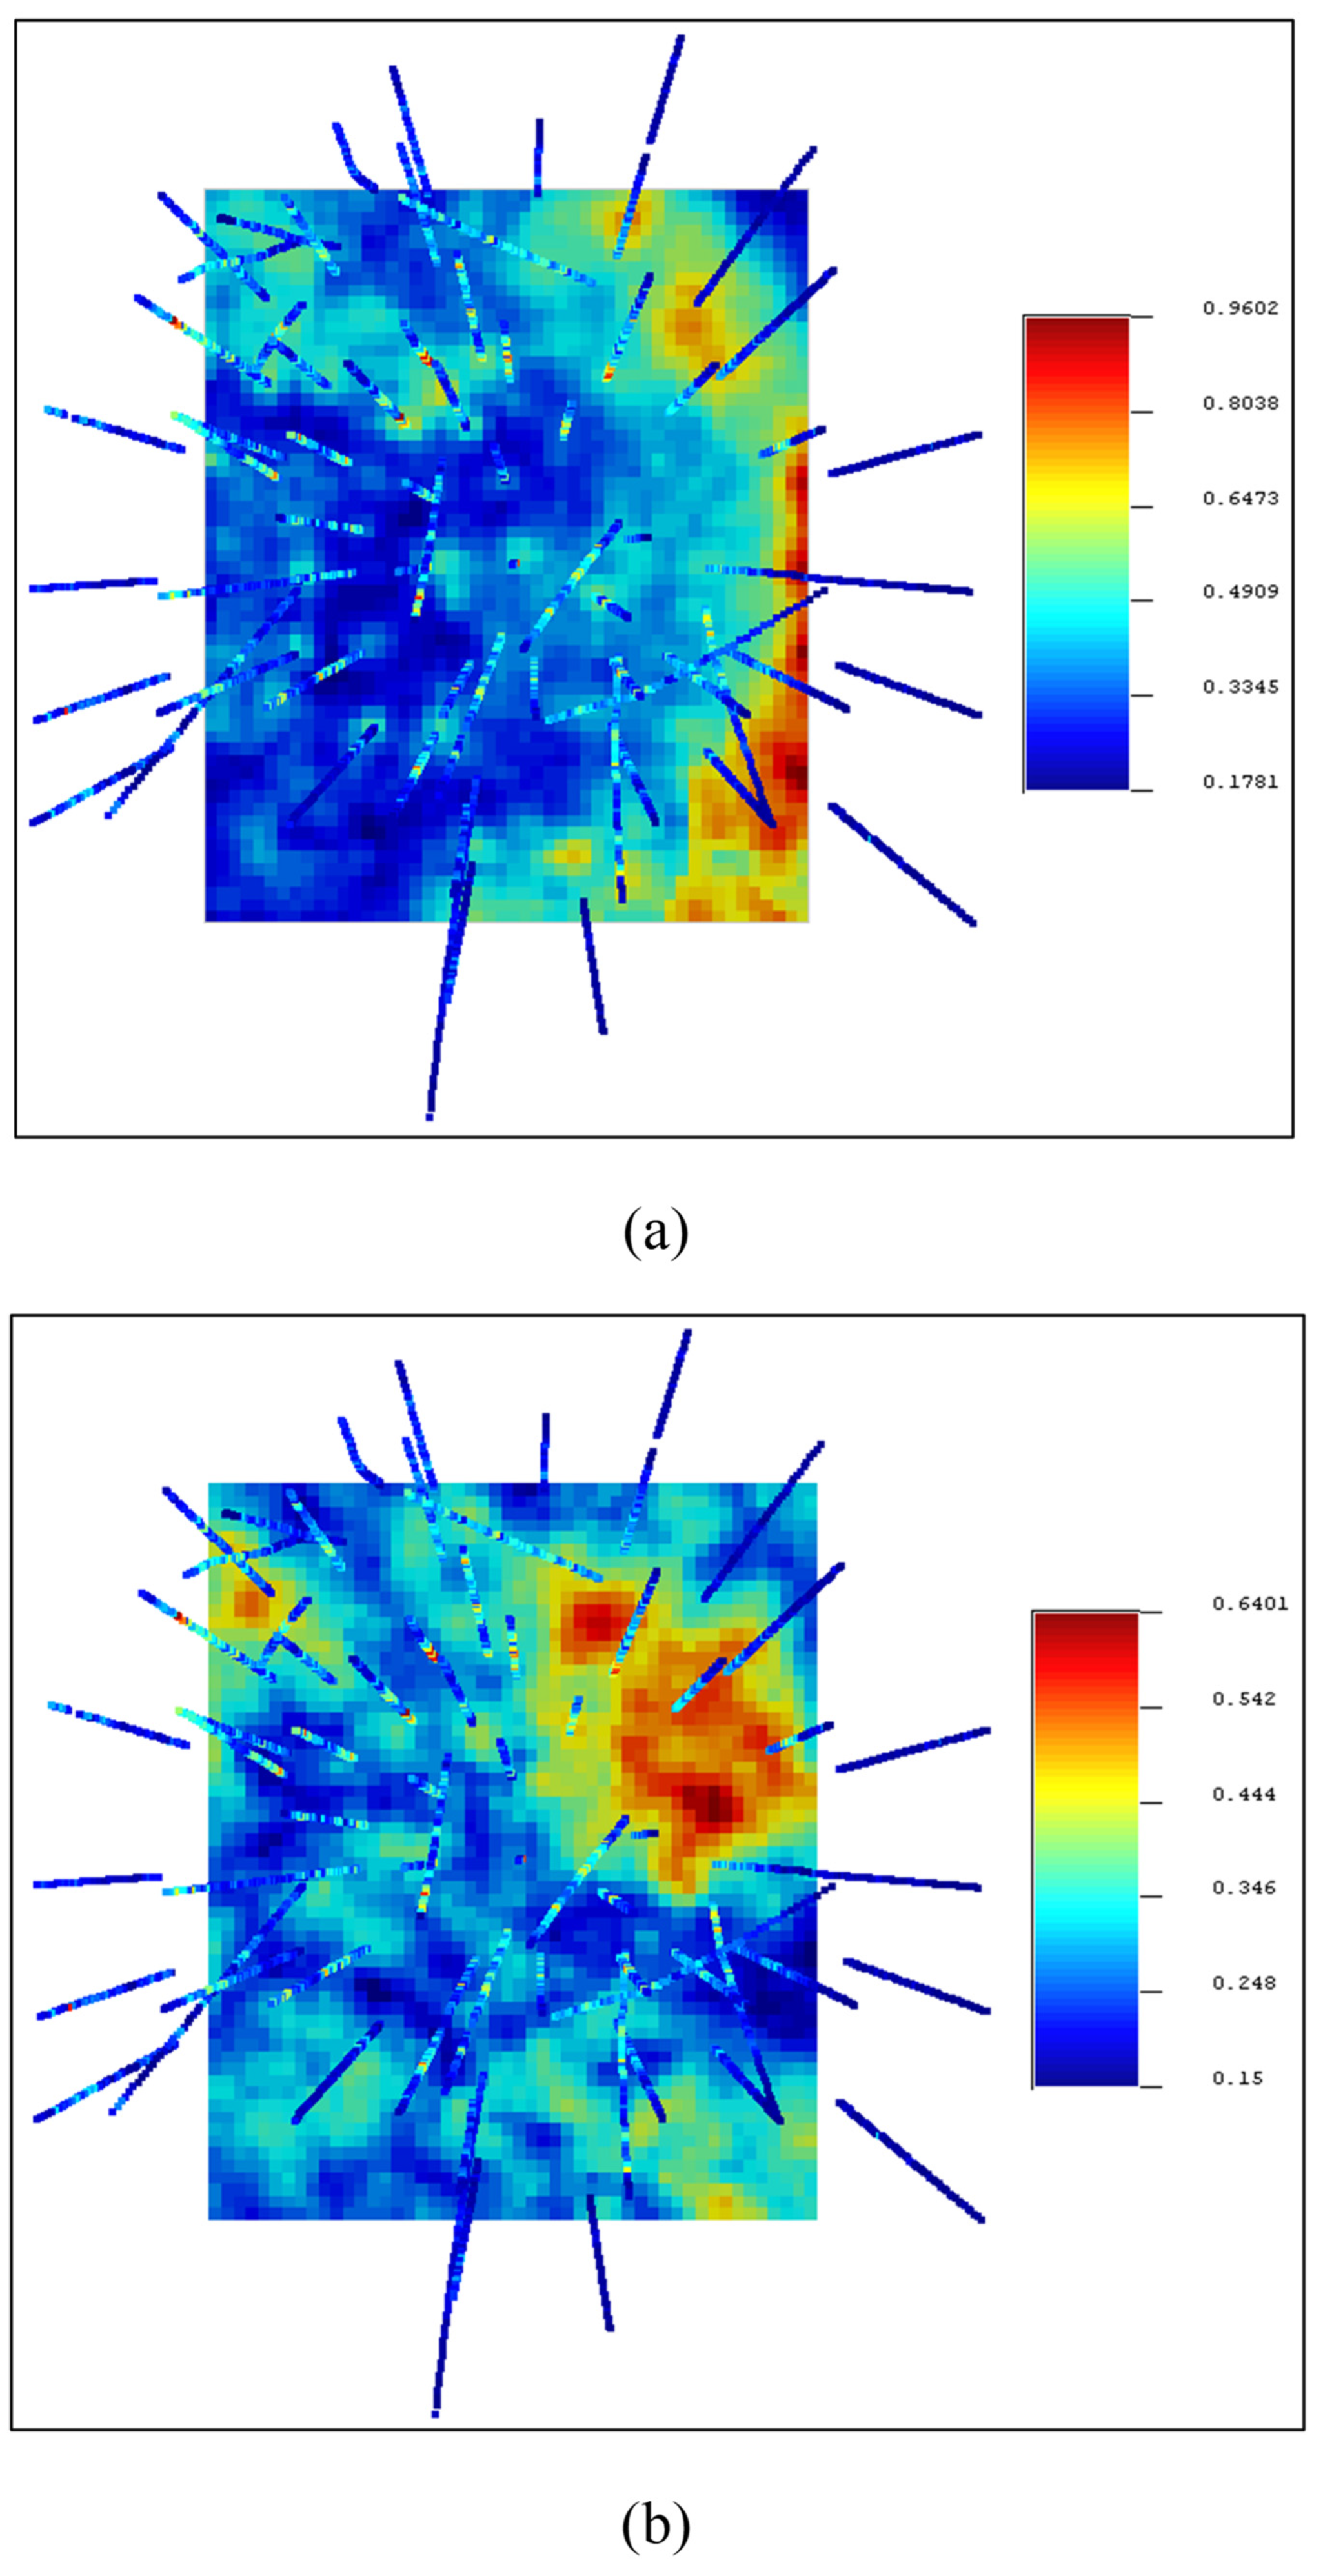
The TBSIM was carried out for 100 realizations with a MATLAB code that was provided by Emery and Lantuejoul (2006) [21] and the realizations were visualized using SGeMS software. The average (E-type) and variance of each realization for Cu and Mo indicate the proper reproduction of the mean and variance in the TBSIM as performed in Figure 4. Furthermore, the variograms of different realizations were compared with the variograms of the raw data for the validation of the TBSIM operation as depicted in Figure 5. The CCVs were calculated and visualized for each realization of Cu and Mo (Figure 6). Finally, the average of these CCVs was calculated for Cu and Mo as E-types (average realizations), which are represented in Figure 7.
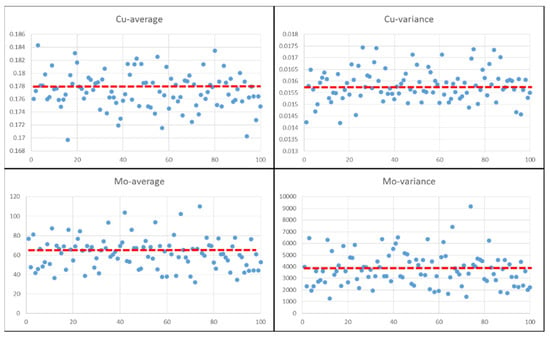
Figure 4.
Variation of means and variances for Cu and Mo in realizations. The mean and variance of each simulation are shown as a single point, and the red lines represent the overall average, which is close to the mean value and variance of Cu and Mo in the data.
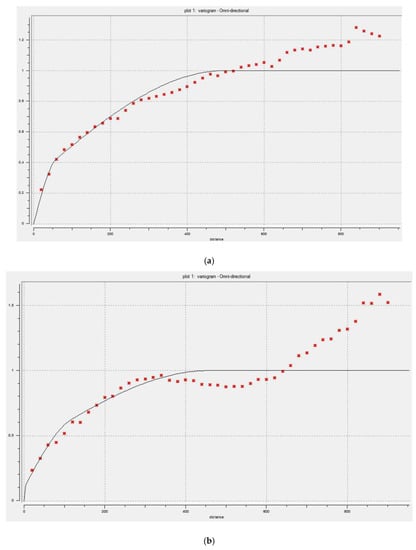
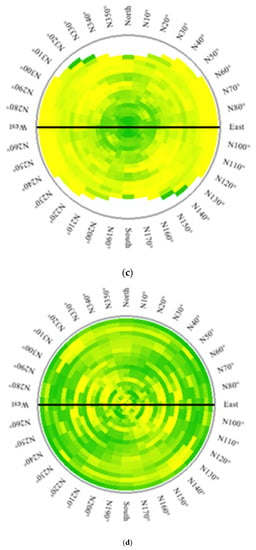
Figure 5.
Variograms of normalize data for Cu (a) and Mo (b) and variogram maps for Cu (c) and Mo (d).
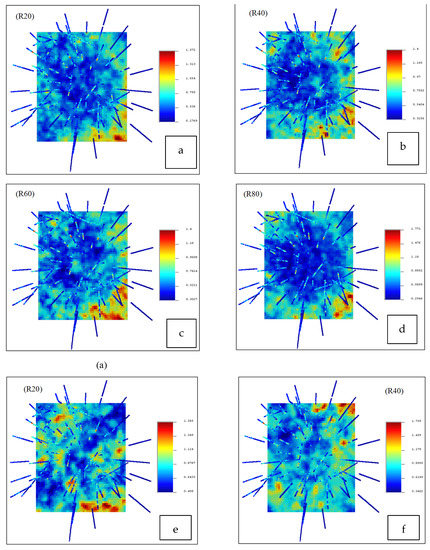
Figure 6.
Visualization of CCV values for Cu ((a): realization 20, (b): realization 40, (c): realization 60, and (d): realization 80) and Mo ((e): realization 20 and (f): realization 40); elevation of this plan equal to 900 m.
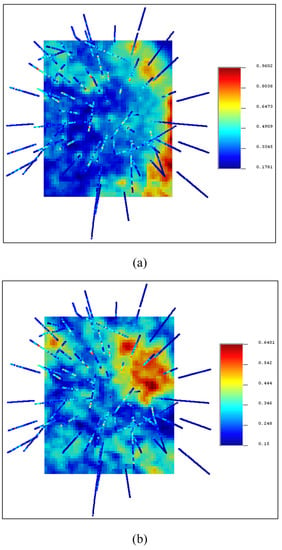
Figure 7.
Visualization of E-type for CCVs of Cu (a) and Mo (b); elevation of this plan equal to 900 m.
4.3. Mineral Resource Classification using CCV–V Fractal Modeling
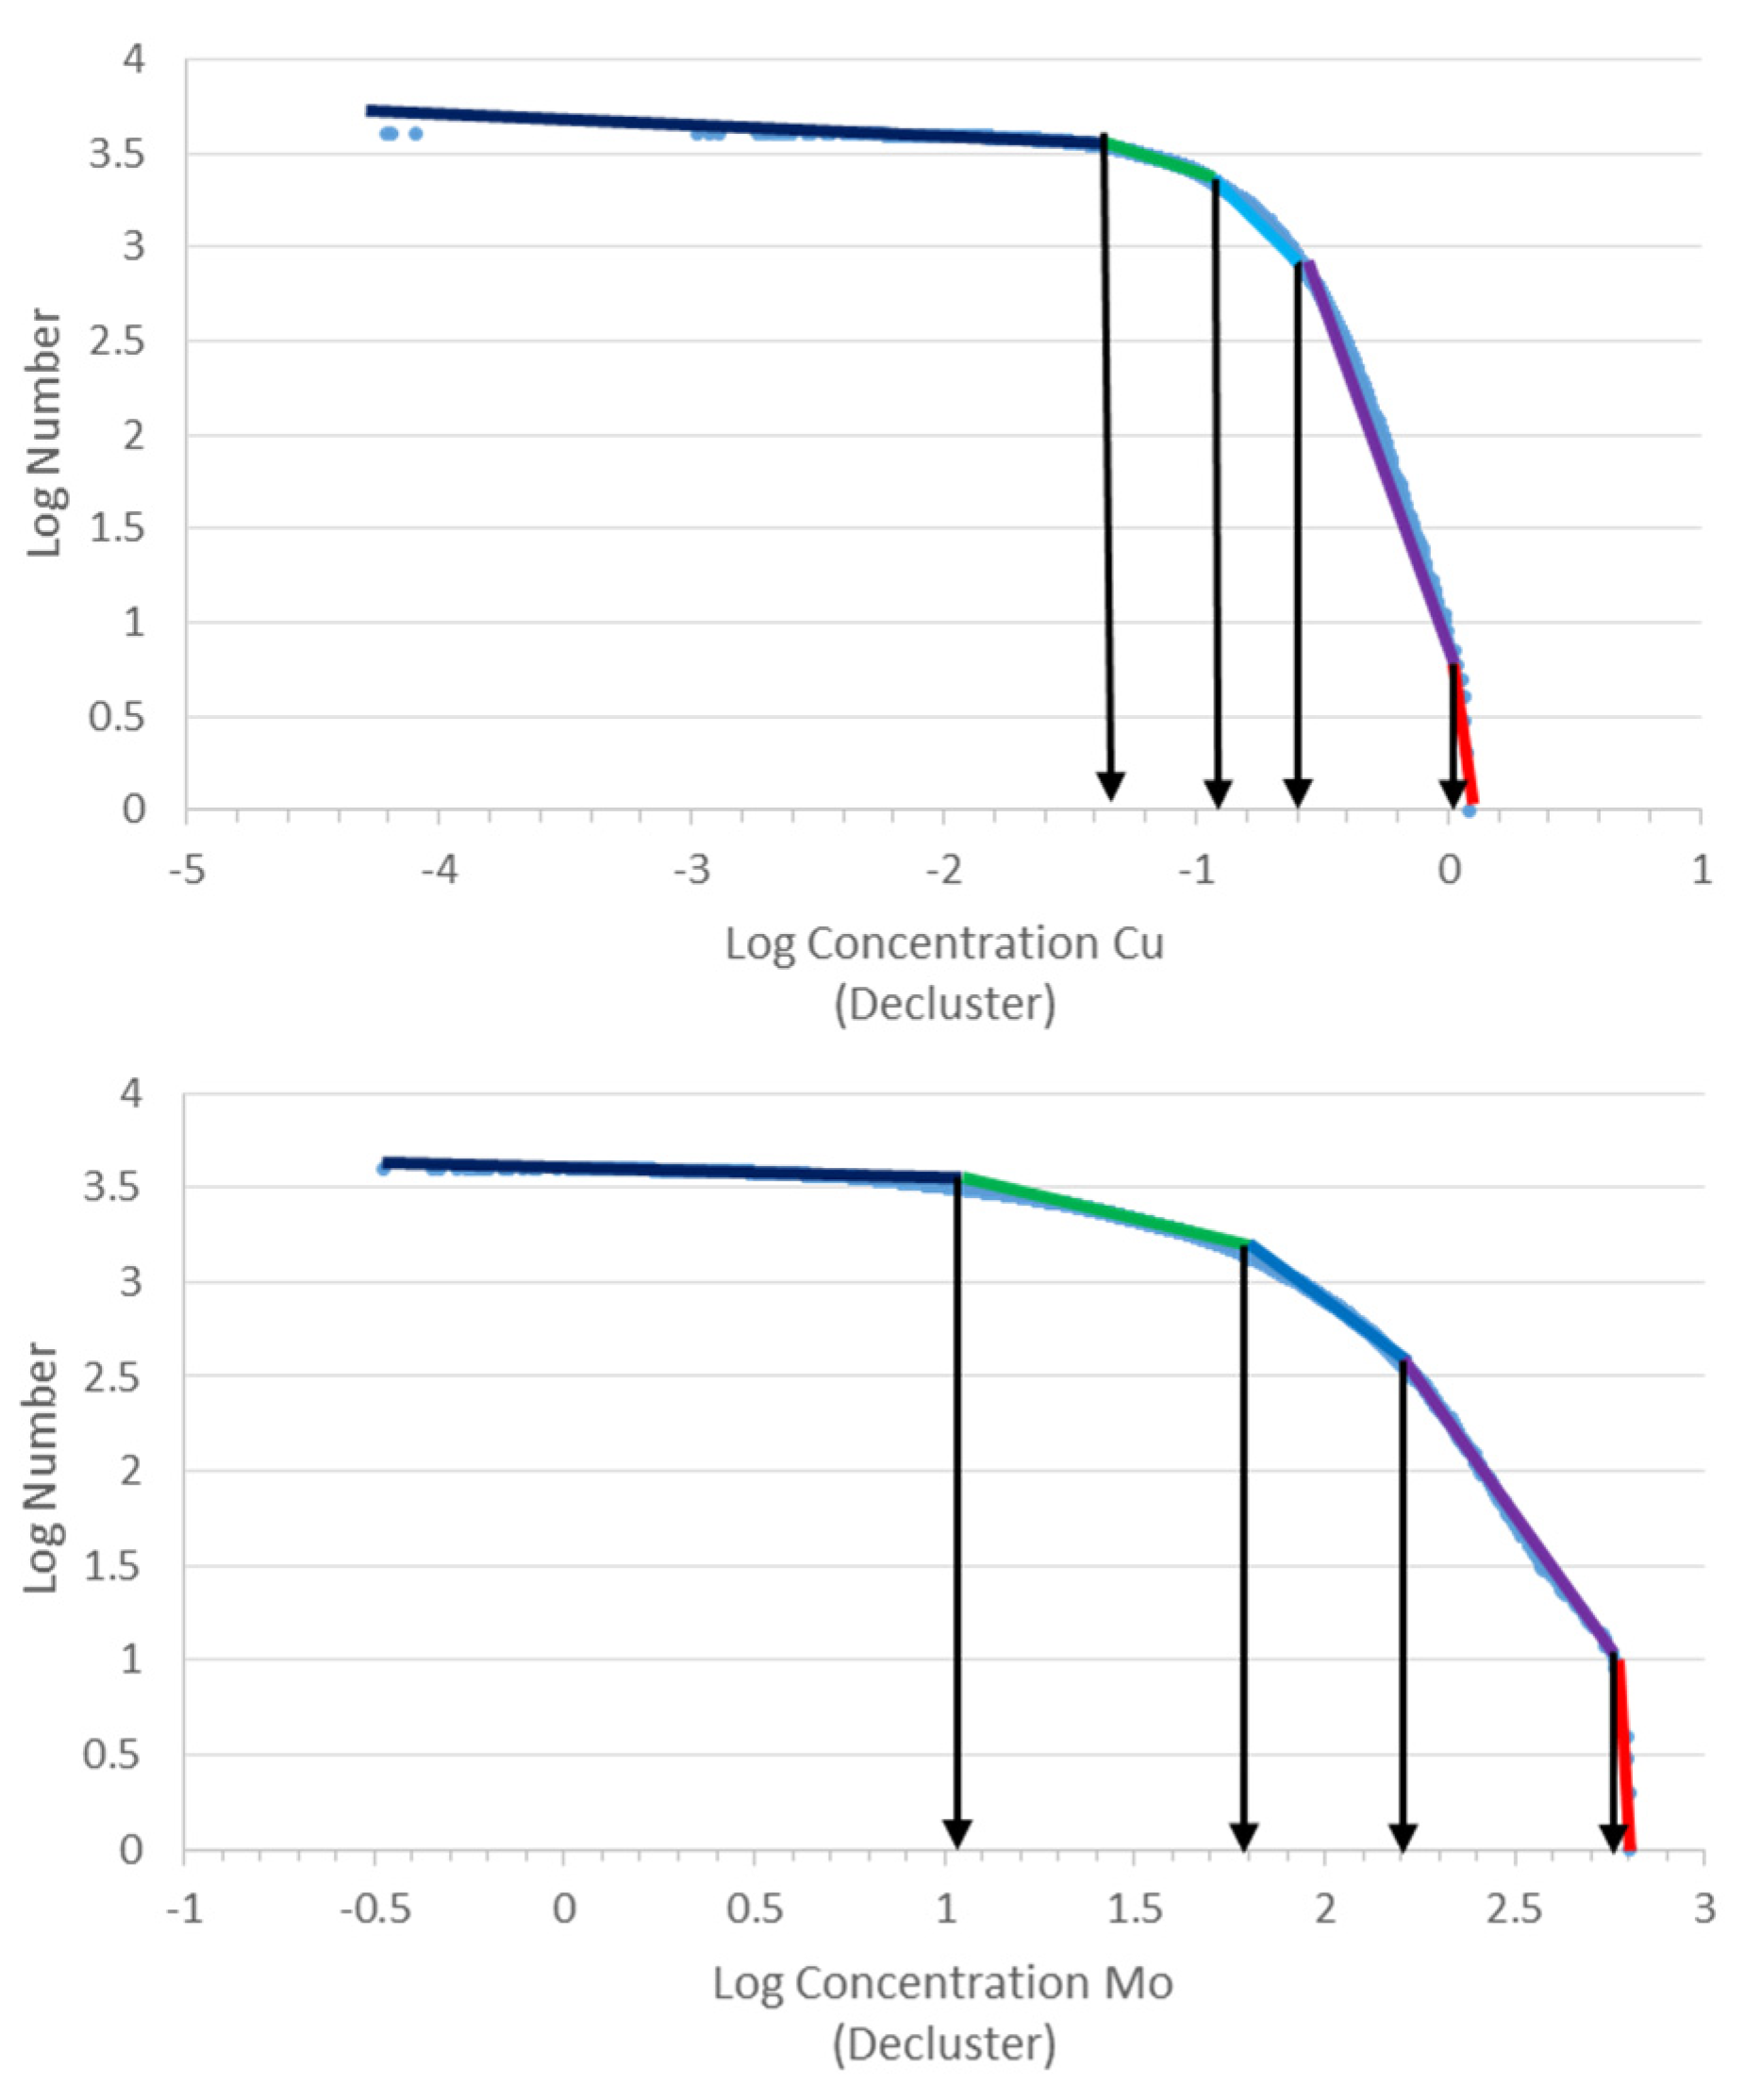
First of all, the C–N fractal modeling was carried out on Cu and Mo raw data for the detection of the main thresholds (Figure 8). These main thresholds were used for the separation of the Cu and Mo mineralized zone from barren host rocks. These thresholds were calculated 0.25% and 60 ppm for Cu and Mo, respectively. The sub-cells with Cu and Mo grades lower than these thresholds were removed from the resource classification as barren host rocks. On the other hand, the mineral resource classification was carried out for sub-cells with Cu ≥ 0.25% and Mo ≥ 60 ppm as the main mineralized zone.
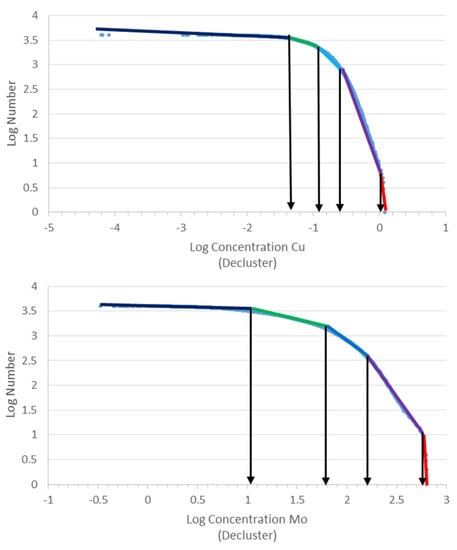
Figure 8.
C–N log–log plots for Cu and Mo.
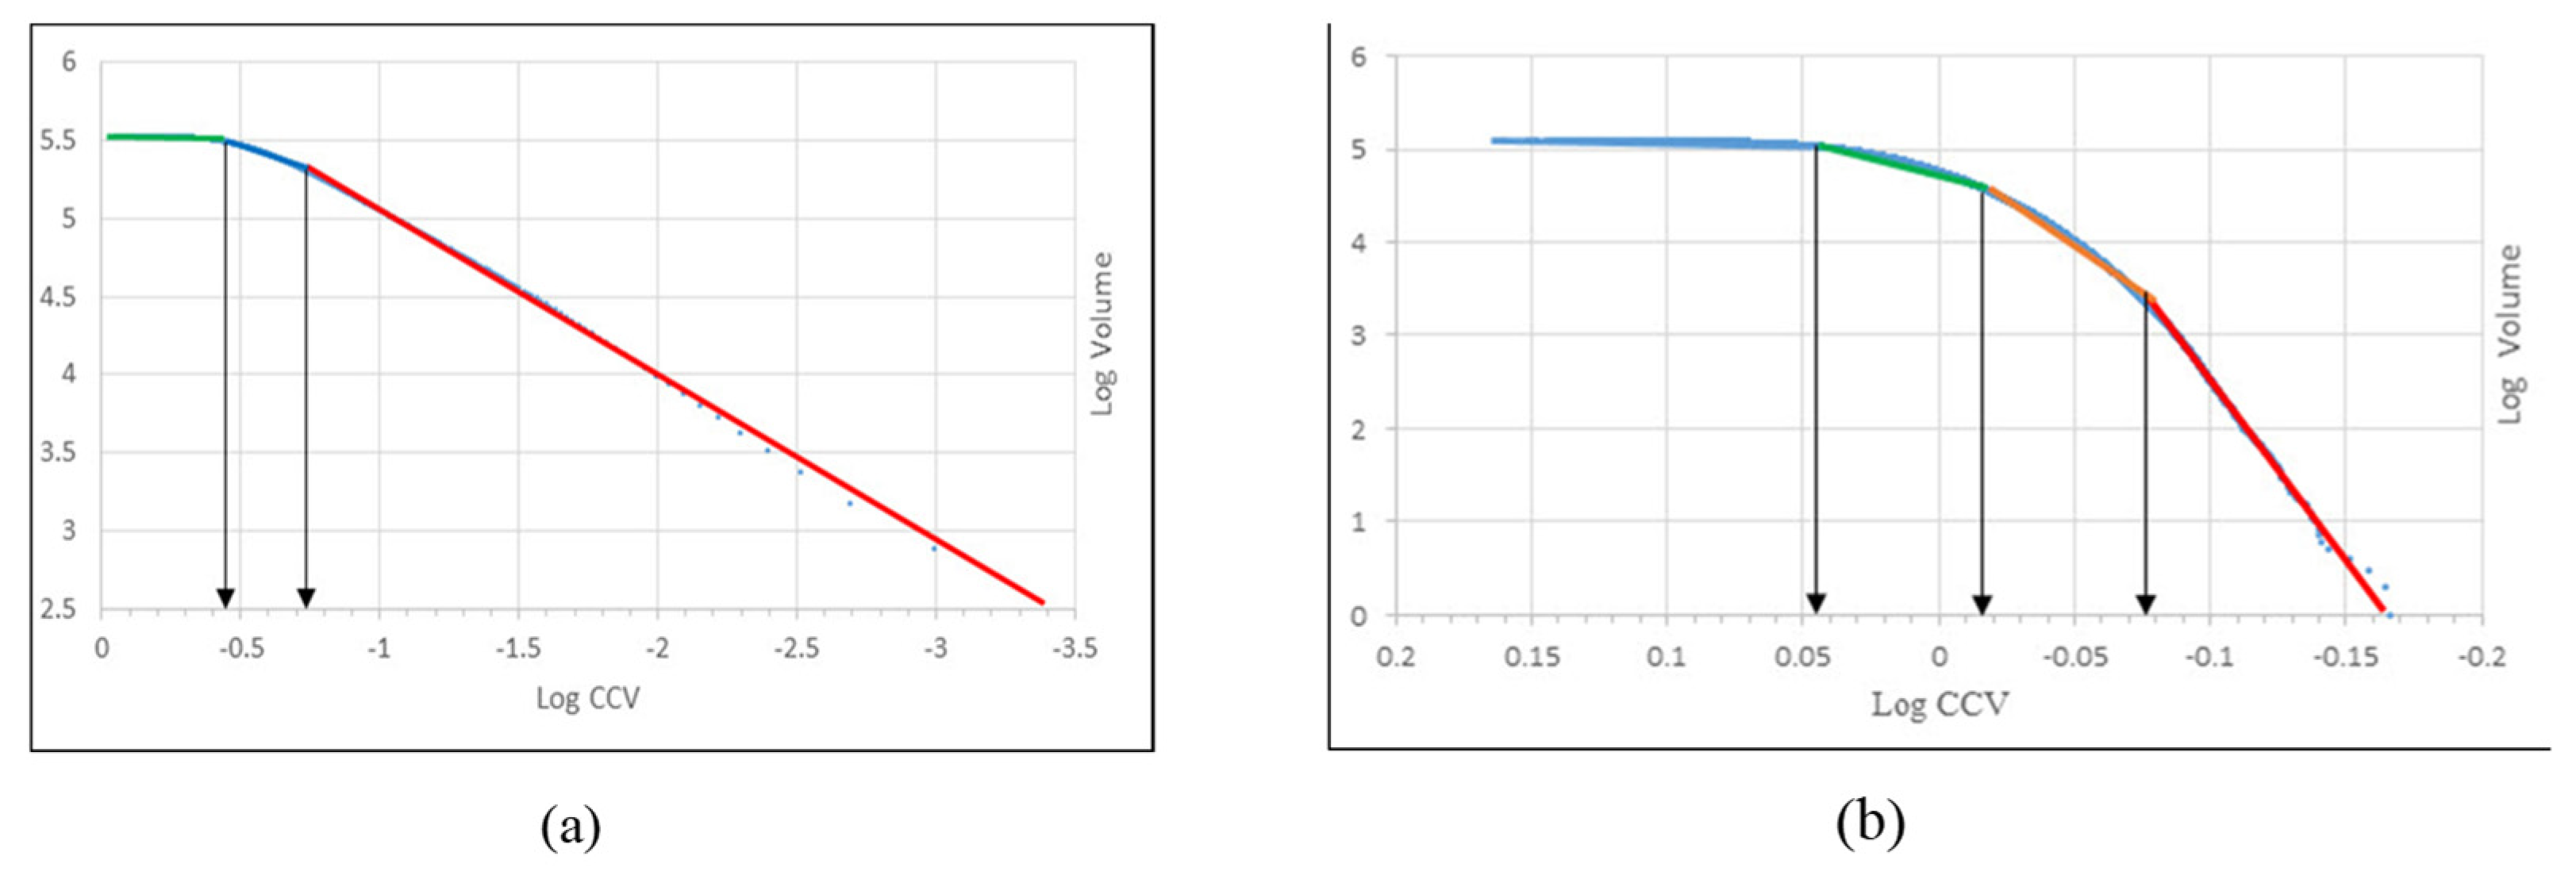
Based on the calculated CCVs in different sub-cells, the CCV–V log–log plots were generated for the Cu and Mo CCVs E-types, as depicted in Figure 9. The different populations were separated according to the changing dips of the segments [35,49]. There are three and four populations for CCVs of Cu and Mo, respectively. Based on these log–log plots, the Measured, Indicated, and Inferred copper resources have CCVs < 0.18, 0.18–0.35, and >0.35, respectively (Table 2). Moreover, there are Measured, Indicated, and Inferred Mo resources that contain CCV values equal to <0.84, 0.84–0.96. and >0.96, respectively. On the other hand, the first and second populations in these log–log plots were defined as Measured and Indicated resources (Figure 9 and Table 2).
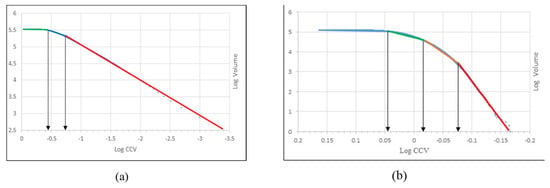
Figure 9.
The CCV–V log–log plots for Cu (a) and Mo (b).

Table 2.
Mineral resource classification by CCV–V fractal modeling for Cu and Mo.
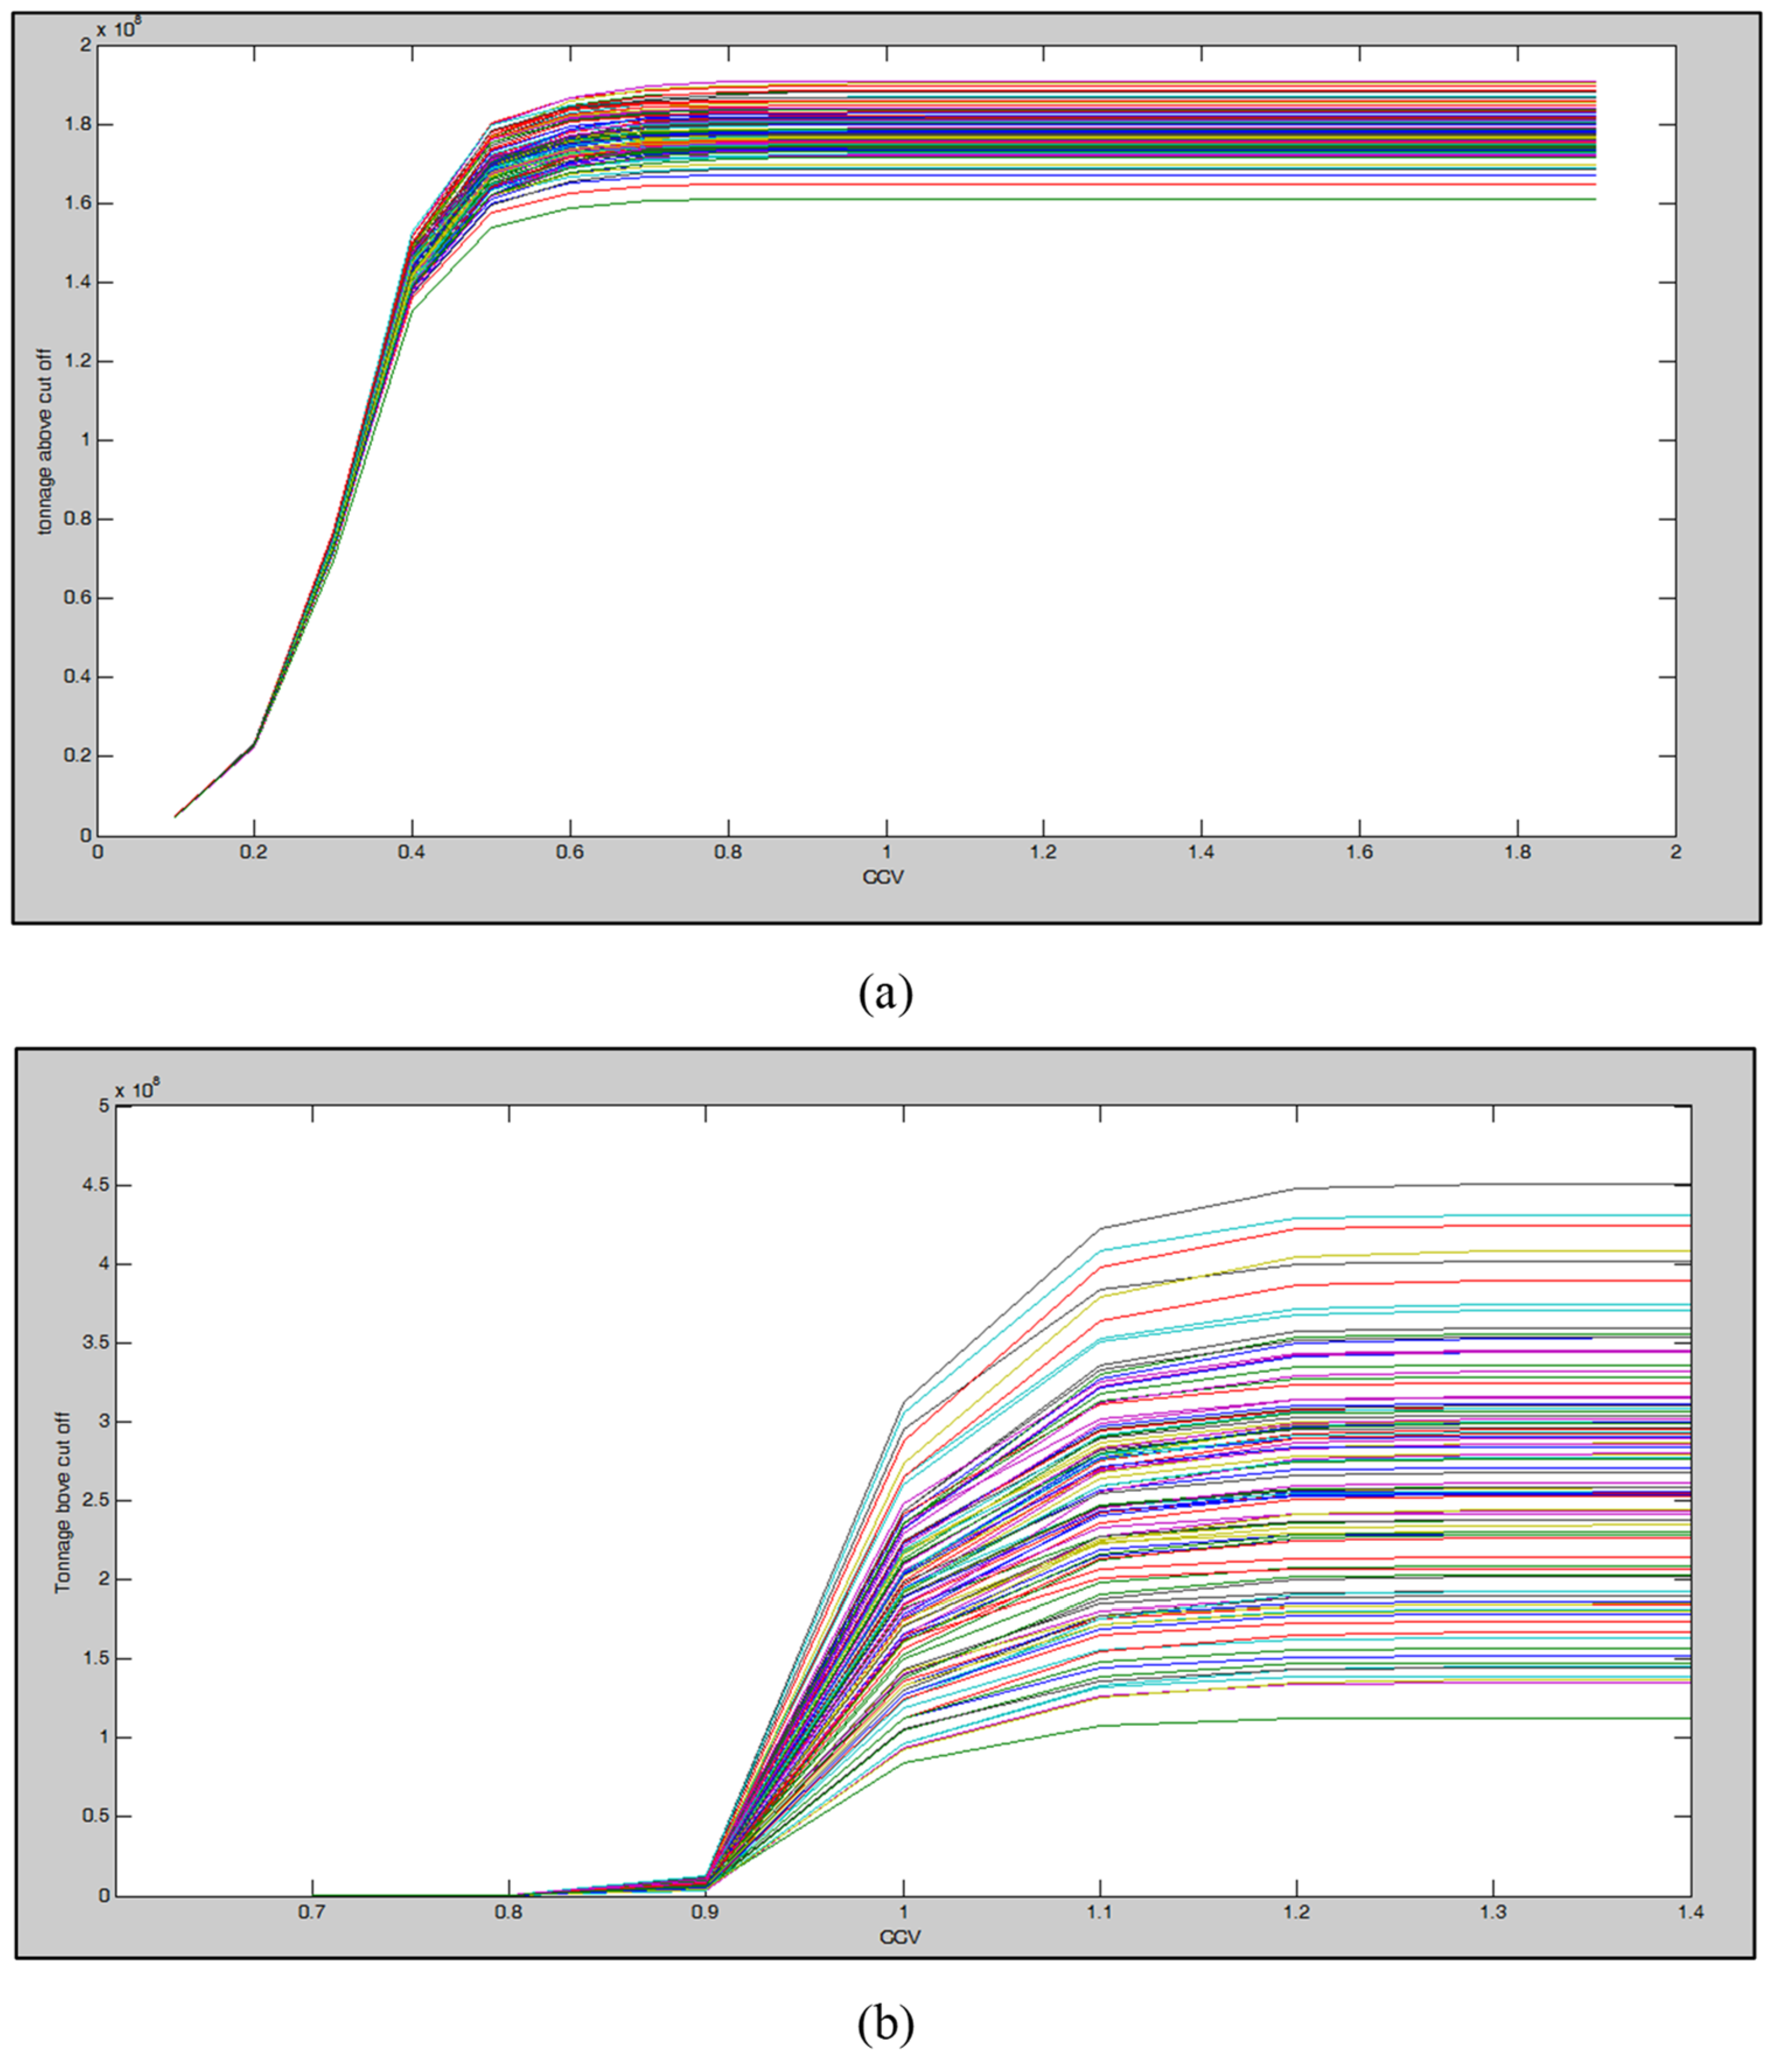
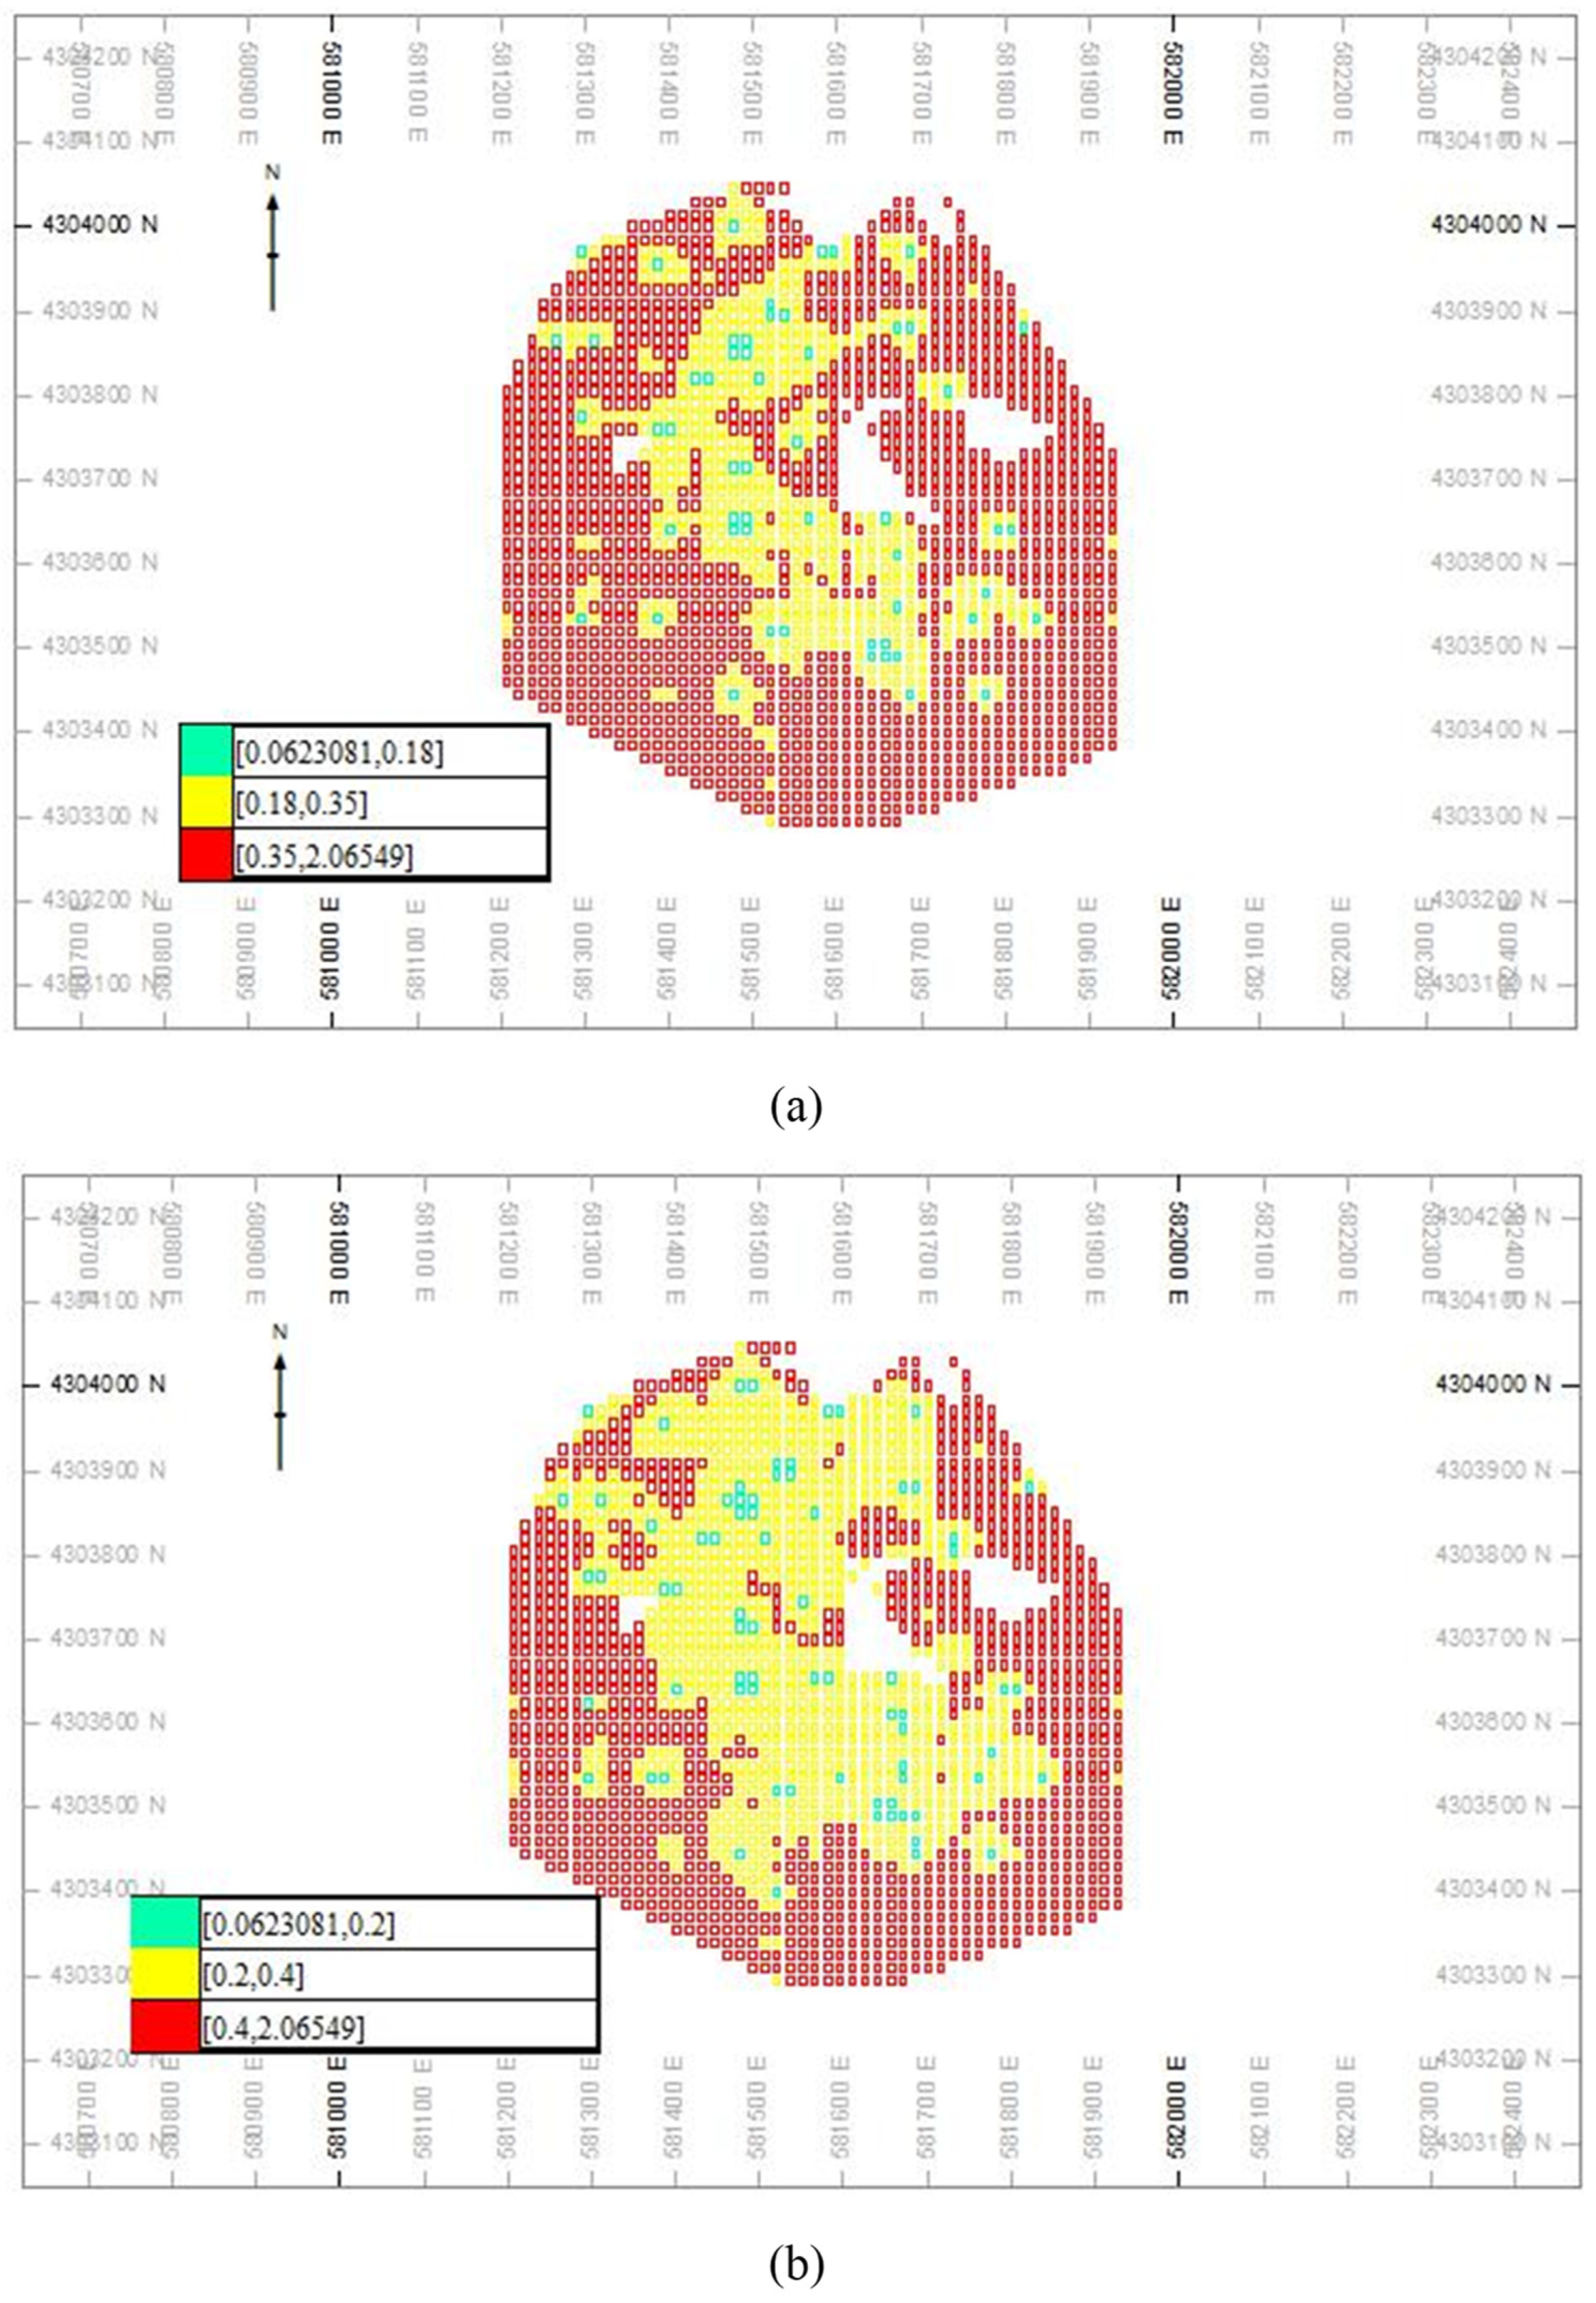
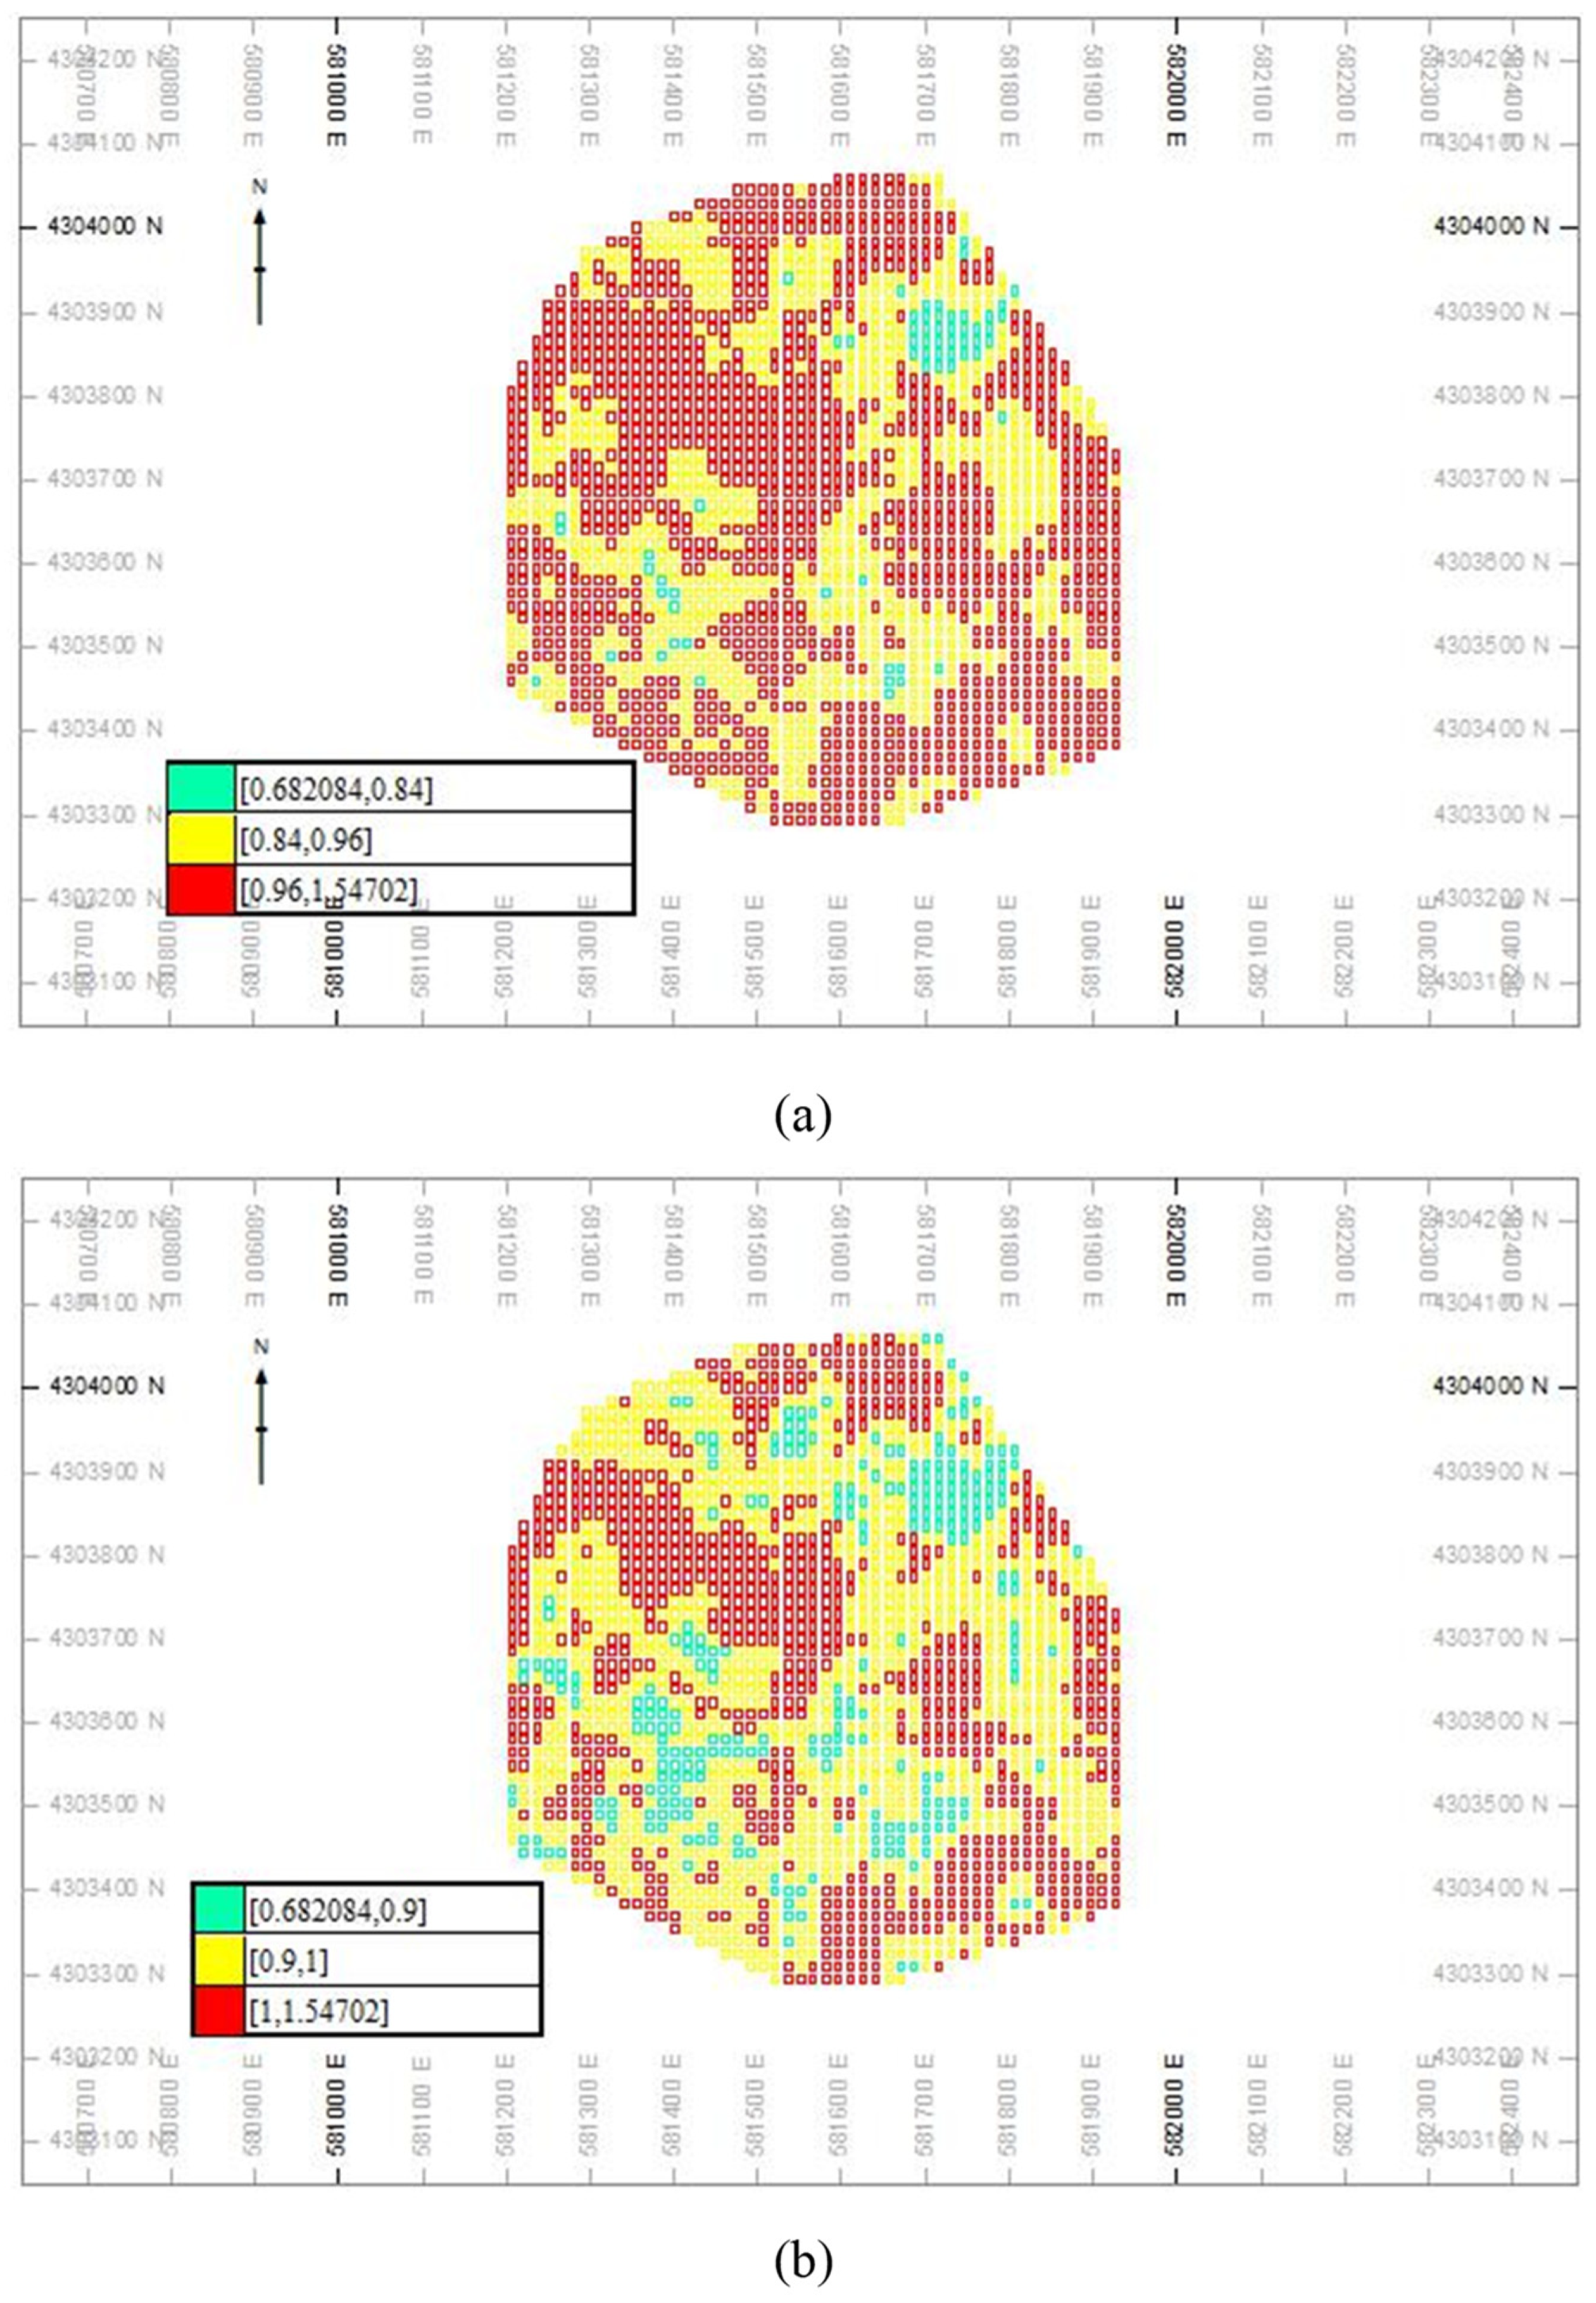
Based on study by Dimitrakopolous et al. (2009) [3], the CCV–Tonnage graphs for Cu and Mo were generated, as depicted in Figure 10 and Table 3. These graphs were generated based on different realization of Cu and Mo (Figure 10). The resource classification was carried out based on the turning points in the CCV–Tonnage plots for Cu and Mo. The Measured and Indicated resources for Cu and Mo are larger than the results derived using fractal modeling. Their CCV values for the Measured and Indicated resources are <0.2 and 0.2–0.4 for Cu, respectively (Table 3). However, the CCVs variations for Mo resources are <0.9 and 0.9–1 for Measured and Indicated classes, respectively (Table 3). The location of different classes were shown in Figure 11 and Figure 12. The classes resulting from using fractal modeling have better correlations with the density of the boreholes.
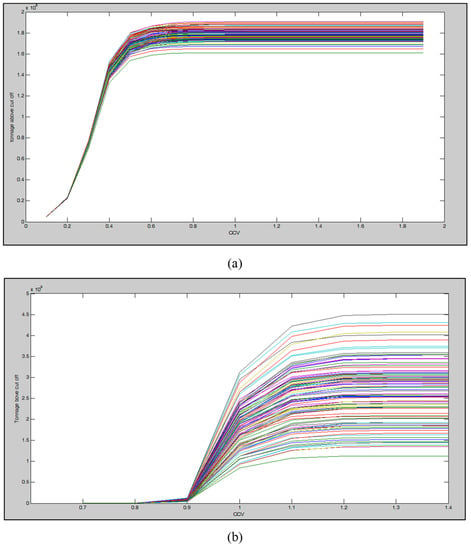
Figure 10.
The CCV–Tonnage graphs for Cu (a) and Mo (b) based on Dimitrakopoulos et al. (2009) [3].

Table 3.
Mineral resource classification using CCV–Tonnage graphs for Cu and Mo.
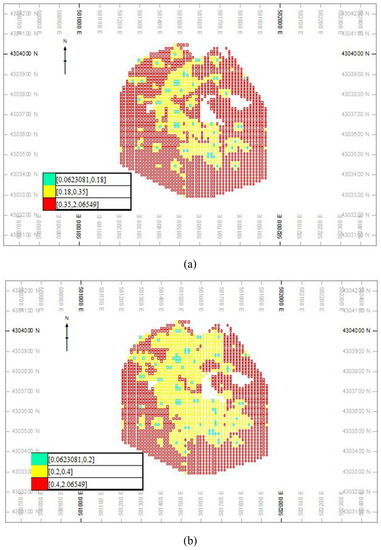
Figure 11.
Resource classification based on the CCV–V fractal modeling (a) and CCV–Tonnage graphs for copper (b).
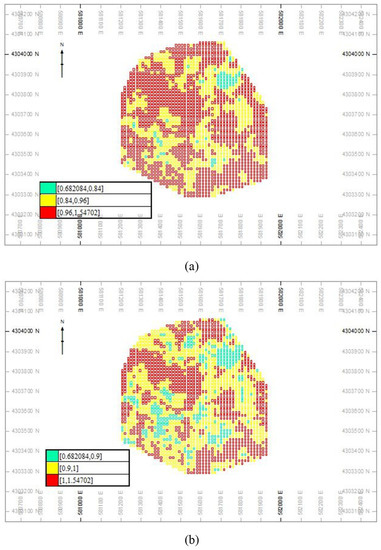
Figure 12.
Resource classification based on the CCV–V fractal modeling (a) and CCV–Tonnage graphs for molybdenum (b).
5. Conclusions
In this study, the TBSIM and CCV–V fractal model were used for the delineation of different mineral resource classes in the Masjed Daghi Cu–Mo porphyry deposit (NW Iran). The results obtained using this methodology show that there are smaller Measured and Indicated classes derived using the CCV–V fractal model in comparison with the results of the CCV–Tonnage graphs. The measured resources for Cu are <0.18 and <0.2 based on the hybrid and CCV–Tonnage graph, respectively. Furthermore, this resource class is <0.84 and 0.9 as derived using the hybrid and CCV–Tonnage graph, respectively. Consequently, many sub-cells in the marginal part of this deposit are classified in the Indicated level using the CCV–Tonnage graph but these sub-cells are categorized to the Inferred class based on the hybrid of TBSIM and CCV–V fractal model. There are low values of borehole data, which reveals the higher accuracy of the hybrid method. On the other hand, the hybrid methodology of the geostatistical simulation and CCV–V fractal modeling can be used for mineral resource classification in different types of ore deposits. The CCV–V fractal modeling can be separated into different resource classes with higher accuracy in comparison with other methods.
Author Contributions
Conceptualization, P.A.; methodology, P.A.; software, H.G.; formal analysis, H.G.; investigation, H.G.; resources, N.M.; data curation, N.M.; writing—original draft preparation, P.A.; writing—review and editing, A.B.Y.; visualization, N.M.; supervision, B.S.; project administration, P.A. All authors have read and agreed to the published version of the manuscript.
Funding
This research received no external funding.
Data Availability Statement
The data presented in this study are available on request from the corresponding author. The data are not publicly available.
Acknowledgments
The authors would like to acknowledge Reza Esfahanipour from the National Iranian Copper Industry Company (NICICO) for dataset of the Masjed Daghi deposit.
Conflicts of Interest
The authors declare no conflict of interest.
References
- Kingston, G. Reserve classification of identified nonfuel mineral resources by the bureau of mines minerals availability system. J. Int. Assoc. Math. Geol. 1977, 9, 273–279. [Google Scholar] [CrossRef]
- Guardiano, E.; Parker, H.; Isaaks, E. Prediction of Recoverable Reserves Using Conditional Simulation: A Case Study for the Fort Knox Gold Project, Alaska; Unpublished Technical Report; Mineral Resource Development Inc.: Port Moresby, Papua New Guinea, 1995. [Google Scholar]
- Dimitrakopoulos, R.; Godoy, M.; Chou, C. Resource/reserve classification with integrated geometric and local grade variability measures. In Proceedings of the Orebody Modelling and Strategic Mine Planning, Perth, WA, USA, 16–18 March 2009; pp. 207–214. [Google Scholar]
- Asghari, O.; Esfahani, N.M. A new approach for the geological risk evaluation of coal resources through a geostatistical simulation. Arab. J. Geosci. 2013, 6, 929–943. [Google Scholar] [CrossRef]
- Peattie, R.; Dimitrakopoulos, R. Forecasting Recoverable Ore Reserves and Their Uncertainty at Morila Gold Deposit, Mali: An Efficient Simulation Approach and Future Grade Control Drilling. Math. Geosci. 2013, 45, 1005–1020. [Google Scholar] [CrossRef]
- Tajvidi, E.; Monjezi, M.; Asghari, O.; Emery, X.; Foroughi, S. Application of joint conditional simulation to uncertainty quantification and resource classification. Arab. J. Geosci. 2015, 8, 455–463. [Google Scholar] [CrossRef]
- Goodfellow, R.; Dimitrakopoulos, R. Global optimization of open pit mining complexes with uncertainty. Appl. Soft Comput. 2016, 40, 292–304. [Google Scholar] [CrossRef]
- Menin, R.; Diedrich, C.; Reuwsaat, J.; De Paula, W. Drilling grid analysis for defining open-pit and underground mineral resource classification through production data. In Geostatistics Valencia 2016; Gomez-Hernandez, J., Rodrigo-Ilarri, J., Clavero, M.R., Cassiraga, E., Vargas-Guzma, J., Eds.; Quantitative Geology and Geostatistics, 19; Springer: Cham, Switzerland, 2017. [Google Scholar] [CrossRef]
- Battalgazy, N.; Madani, N. Categorization of Mineral Resources Based on Different Geostatistical Simulation Algorithms: A Case Study from an Iron Ore Deposit. Nat. Resour. Res. 2019, 28, 1329–1351. [Google Scholar] [CrossRef]
- Caers, J.; Zhang, T. Multiple-point geostatistics: A quantitative vehicle for integrating geologic analogs into multiple reservoir models. AAPG Mem. 2004, 80, 383–394. [Google Scholar] [CrossRef]
- Chile, J.P.; Delfiner, P. Geostatistics: Modeling Spatial Uncertainty, 2nd ed.; Wiley: New York, NY, USA, 2012. [Google Scholar]
- Cheng, Q.; Agterberg, F.; Bonham-Carter, G.F. A spatial analysis method for geochemical anomaly separation. J. Geochem. Explor. 1996, 56, 183–195. [Google Scholar] [CrossRef]
- Rossi, M.; Deutsch, C. Mineral Resource Estimation; Springer: Berlin/Heidelberg, Germany, 2014; 332p. [Google Scholar] [CrossRef]
- Soltani, F.; Afzal, P.; Asghari, O. Delineation of alteration zones based on Sequential Gaussian Simulation and concentration–volume fractal modeling in the hypogene zone of Sungun copper deposit, NW Iran. J. Geochem. Explor. 2014, 140, 64–76. [Google Scholar] [CrossRef]
- Hajsadeghi, S.; Asghari, O.; Mohammadi, M.; Meshkani, S. Indirect rock type modeling using geostatistical simulation of independent components in Nohkouhi volcanogenic massive sulfide deposit, Iran. J. Geochem. Explor. 2016, 168, 137–149. [Google Scholar] [CrossRef]
- Ghane, B.; Asghari, O. Modeling of mineralization using minimum/maximum autocorrelation factor: Case study Sury Gunay gold deposit NW of Iran. Geochem. Explor. Environ. Anal. 2017, 17, 186–193. [Google Scholar] [CrossRef]
- Madani, N.; Ortiz, J. Geostatistical simulation of crosscorrelated variables: A case study through Cerro Matoso Nickel-Laterite deposit. In Proceedings of the 26th International Symposium on Mine Planning and Equipment Selection, Luleå, Sweden, 29–31 August 2017. [Google Scholar]
- Hosseini, S.A.; Asghari, O. Multivariate geostatistical simulation on block-support in the presence of complex multivariate relationships: Iron ore deposit case study. Nat. Resour. Res. 2018, 28, 125–144. [Google Scholar] [CrossRef]
- Abildin, Y.; Madani, N.; Topal, E. A hybrid approach for joint simulation of geometallurgical variables with inequality constraint. Minerals 2019, 9, 24. [Google Scholar] [CrossRef]
- Hohn, M.E. An Introduction to Applied Geostatistics: By Edward H. Isaaks and R. Mohan Srivastava, 1989, Oxford University Press, New York, 561 p., ISBN 0-19-505012-6, ISBN 0-19-505013-4 (paperback), $55.00 cloth, $35.00 paper (US). Comput. Geosci. 1991, 17, 471–473. [Google Scholar] [CrossRef]
- Deutsch, C.; Journel, A. GSLIB: Geostatistical Software Library and User’s Guide; Oxford University Press: New York, NY, USA, 1992; 340p. [Google Scholar]
- Emery, X.; Lantuejoul, C. TBSIM: A computer program for conditional simulation of three-dimensional Gaussian random fields via the turning bands method. Comput. Geosci. 2006, 32, 1615–1628. [Google Scholar] [CrossRef]
- Luster, G. Raw Materials for Portland Cement: Applications of Conditional Simulation of Coregionalization. Ph.D. Thesis, Department of Applied Earth Sciences, Stanford University, Stanford, CA, USA, 1985. [Google Scholar]
- Soares, A. Direct Sequential Simulation and Cosimulation. Math. Geol. 2001, 33, 911–926. [Google Scholar] [CrossRef]
- Journel, A.; Huijbregts, C. Mining Geostatistics; Academic Press: London, UK, 1978. [Google Scholar]
- Froidevaux, R. Probability Field Simulation. In Geostatistics Tróia ’92; Quantitative Geology and Geostatistics Book Series (QGAG), 5; Springer: Dordrecht, Germany, 1993. [Google Scholar] [CrossRef]
- Matheron, G. The intrinsic random functions and their applications. Adv. Appl. Probab. 1973, 5, 439–468. [Google Scholar] [CrossRef]
- Journel, A. Geostatistics for conditional simulation of ore bodies. Econ. Geol. 1974, 69, 673–687. [Google Scholar] [CrossRef]
- Afzal, P.; Alhoseini, S.; Tokhmchi, B.; Ahangaran, D.K.; Yasrebi, A.; Madani, N.; Wetherelt, A. Outlining of high quality coking coal by concentration–volume fractal model and turning bands simulation in East-Parvadeh coal deposit, Central Iran. J. Coal Geol. 2014, 217, 88–99. [Google Scholar] [CrossRef]
- Paravarzar, S.; Emery, X.; Madani, N. Comparing sequential Gaussian simulation and turning bands algorithms for cosimulating grades in multi-element deposits. C. R. Geosci. 2015, 34, 84–93. [Google Scholar] [CrossRef]
- Eze, P.; Madani, N.; Adoko, A. Multivariate mapping of heavy metals spatial contamination in a Cu–Ni exploration field (Botswana) using turning bands co-simulation algorithm. Nat. Resour. Res. 2019, 28, 109–124. [Google Scholar] [CrossRef]
- Abulkhair, S.; Madani, N. Stochastic modeling of iron in coal seams using two-point and multiple-point geostatistics: A case study. Min. Metall. Explor. 2022, 39, 1313–1331. [Google Scholar] [CrossRef]
- Mandelbrot, B. The Fractal Geometry of Nature; Freeman: San Fransisco, CA, USA, 1983; 468p. [Google Scholar] [CrossRef]
- Afzal, P.; Alghalandis, Y.; Khakzad, A.; Moarefvand, P.; Omran, N. Delineation of mineralization zones in porphyry Cu deposits by fractal concentration–volume modeling. J. Geochem. Explor. 2011, 108, 220–232. [Google Scholar] [CrossRef]
- Daneshvar Saein, L. Delineation of enriched zones of Mo, Cu and Re by concentration-volume fractal model in Nowchun Mo-Cu porphyry deposit, SE Iran. Iran. J. Earth Sci. 2017, 9, 64–72. [Google Scholar]
- Karaman, M.; Kumral, M.; Yildirim, M.; Doner, K.; Afzal, P.; Abdelnasser, A. Delineation of the porphyry-skarn mineralized zones (NW Turkey) using concentration–volume fractal model. Geochemistry 2021, 81, 125802. [Google Scholar] [CrossRef]
- Sadeghi, B.; Madani, N.; Carranza, E.J.M. Combination of geostatistical simulation and fractal modeling for mineral resource classification. J. Geochem. Explor. 2015, 149, 59–73. [Google Scholar] [CrossRef]
- Aghazadeh, M.; Hou, Z.; Badrzadeh, Z.; Zhou, L. Temporal spatial distribution and tectonic setting of porphyry copper deposits in Iran: Constraints from zircon U-Pb and molybdenite Re–Os geochronology. Ore Geol. Rev. 2015, 70, 385–406. [Google Scholar] [CrossRef]
- Imamalipour, A.; Mousavi, R. Vertical geochemical zonation in the Masjed Daghi porphyry copper-gold deposit, northwestern Iran: Implications for exploration of blind mineral deposits. Geochem. Explor. Environ. Anal. 2017, 18, 120–131. [Google Scholar] [CrossRef]
- Mohammadi; Fard, A.; Samaee, A. Geology and drilling report of Masjed Daghi area (scale 1:1000). Geol. Surv. Iran 2005, 340, 130. [Google Scholar]
- Aghanabati, A. Geology of Iran; Geological Survey of Iran: Tehran, Iran, 2006; 586p. (In Persian) [Google Scholar]
- Rossi, M. Optimizing grade control: A detailed case study. In Proceedings of the 101st Annual Meeting of the Canadian Institute of Mining, Metallurgy, and Petroleum (CIM), Calgary, AB, Canada, 2–5 May 1999; 332p. [Google Scholar]
- Davis, J.C. Statistics and Data Analysis in Geology; Wiley: New York, NY, USA, 2002; 638p. [Google Scholar]
- Chentsov, N.N. Levy-Brownian motion for several parameters and generalized white noise. Theor. Probab. Appl. 1957, 2, 265–266. [Google Scholar] [CrossRef]
- Emery, X. A turning bands program for conditional cosimulation of cross-correlated Gaussian random fields. Comput. Geosci. 2008, 34, 1850–1862. [Google Scholar] [CrossRef]
- Hassanpour, S.; Afzal, P. Application of concentration-number (C-N) multifractal modelling for geochemical anomaly separation in Haftcheshmeh porphyry system, NW Iran. Arab. J. Geosci. 2013, 6, 957–970. [Google Scholar] [CrossRef]
- Nazarpour, A. Application of C-A fractal model and exploratory data analysis (EDA) to delineate geochemical anomalies in the: Takab 1:25,000 geochemical sheet, NW Iran. J. Earth Sci. 2018, 10, 173–180. [Google Scholar]
- Ahmadi, N.; Afzal, P.; Yasrebi, A. Delineation of gas content zones using N-S fractal model in coking coal deposits. J. Min. Environ. 2021, 12, 181–189. [Google Scholar] [CrossRef]
- Malaekeh, A.; Ghasemi, M.; Afzal, P.; Solgi, A. Fractal modeling and relationship between thrust faults and carbonate-hosted Pb-Zn mineralization in Alborz Mountains, Northern Iran. Geochemistry 2021, 81, 125803. [Google Scholar] [CrossRef]
- Shahbazi, S.; Ghaderi, M.; Afzal, P. Prognosis of gold mineralization phases by multifractal modeling in the Zehabad epithermal deposit, NW Iran. Iran. J. Earth Sci. 2021, 13, 31–40. [Google Scholar] [CrossRef]
- Saadati, H.; Afzal, P.; Torshizian, H.; Solgi, A. Geochemical exploration for lithium in NE Iran using the geochemical mapping prospectivity index, staged factor analysis, and a fractal model. Geochem. Explor. Environ. Anal. 2020, 20, 461–472. [Google Scholar] [CrossRef]
- Zuo, R.; Cheng, Q.; Xia, Q. Application of fractal models to characterization of vertical distribution of geochemical element concentration. J. Geochem. Explor. 2009, 102, 37–43. [Google Scholar] [CrossRef]
- Saein, L.D.; Afzal, P.; Shahbazi, S.; Sadeghi, B. Application of an improved zonality index model integrated with multivariate fractal analysis: Epithermal gold deposits. Geopersia 2022, 12, 379–394. [Google Scholar] [CrossRef]
- Kianoush, P.; Mohammadi, G.; Hosseini, S.; Khah, N.K.F.; Afzal, P. Compressional and shear interval velocity modeling to determine formation pressures in an oilfield of SW Iran. J. Min. Environ. 2022, 13, 851–873. [Google Scholar] [CrossRef]
- Mahdizadeh, M.; Afzal, P.; Eftekhari, M.; Ahangari, K. Geomechanical zonation using multivariate fractal modeling in Chadormalu iron mine, Central Iran. Bull. Eng. Geol. Environ. 2022, 81, 1–11. [Google Scholar] [CrossRef]
- Hajsadeghi, S.; Asghari, O.; Mirmohammadi, M.; Afzal, P.; Meshkani, S.A. Uncertainty-Volume fractal model for delineating copper mineralization controllers using geostatistical simulation in Nohkouhi volcanogenic massive sulfide deposit, Central Iran. Bull. Miner. Res. Explor. 2020, 161, 1–11. [Google Scholar] [CrossRef]
Disclaimer/Publisher’s Note: The statements, opinions and data contained in all publications are solely those of the individual author(s) and contributor(s) and not of MDPI and/or the editor(s). MDPI and/or the editor(s) disclaim responsibility for any injury to people or property resulting from any ideas, methods, instructions or products referred to in the content. |
© 2023 by the authors. Licensee MDPI, Basel, Switzerland. This article is an open access article distributed under the terms and conditions of the Creative Commons Attribution (CC BY) license (https://creativecommons.org/licenses/by/4.0/).

