Article

Numerical Study of Gas Breakthrough in Preferential Rocks for Underground Nuclear Waste Repositories

1
School of Architecture and Planning, Yunnan University, Kunming 650091, China
2
School of Information Engineering, Kunming University, Kunming 650214, China
*
Author to whom correspondence should be addressed.
Minerals 2023, 13(3), 393; https://doi.org/10.3390/min13030393
Submission received: 14 February 2023 / Revised: 6 March 2023 / Accepted: 8 March 2023 / Published: 11 March 2023
(This article belongs to the Special Issue Feature Papers in Clays and Engineered Mineral Materials)

Abstract

:
During the long-term storage of radioactive waste, the continuous generation of gas in the disposal area may influence the integrity of host rock. Thus, the investigation of gas migration and breakthrough in low-permeability rock is indispensable for the stability assessment. In this work, the pore space models of four potential host rocks (Boom clay, COx argillite, Opalinus clay, and Beishan granite) were generated via the binarization of the Gaussian random field. This method provides a randomly formed pore network that does rely on an initial definition of pore shape. The constructed models were analyzed and validated by using the mathematical morphology. A numerical calculation scenario of gas breakthrough on the basis of the Young–Laplace equation was proposed and applied. Results show that the gas breakthrough pressures are 2.62–4.11 MPa in Boom clay and 3.72–4.27 MPa in COx argillite. It enhances the idea that the capillary-induced gas breakthrough is possible at pressures lower than the fracture threshold. For Opalinus clay and Beishan granite, no connected pathway exists, and the breakthrough is more likely to occur through pathway dilation or fractures. The presented method has the advantage of experimental reproducibility and brings a new idea for the investigation of fluid migration in low-permeability rocks.

1. Introduction

The safe disposal of high-level nuclear waste is of great significance to the utilization and development of nuclear energy. At present, the internationally recognized safe disposal scheme is to bury the high-level waste deep in rock layers. Argillite and granite are the preferential surrounding rocks for underground nuclear waste repositories. The advantages of argillite include ultra-low permeability, high plasticity, and high adsorption capacity for radionuclides [1,2]. Granite is characterized by a good integrity and uniformity, low porosity and permeability, and small deformation and high strength [3]. In Belgium, the Boom clay has been chosen as a model site and in situ experiments have been conducted in the Mol underground laboratory [4]. In France, the Callovo-Oxfordian (COx) argillite in the Bure site in the eastern Paris Basin has been reported to have favorable characteristics (high compactness and low permeability) [5,6]. In Switzerland, the Mont Terri Rock Laboratory has investigated the Opalinus clay as a possible host rock for long-term geological disposal of radioactive waste [7,8]. In Finland, the pegmatoid granite has been taken into consideration for the final disposal of the spent nuclear fuel in the Onkalo research facility in Olkiluoto [9]. In China, the Beishan granite in Gansu Province has been investigated and identified as the preferential rock layer for the storage of nuclear waste [10,11].
During the long-term deep burial of nuclear waste, under the degradation of nuclear waste, the radiolysis of water, the corrosion of metal, the degassing of the rock formation, and the activities of microorganisms, a large amount of gas (mainly H2) will be generated in the disposal area and surrounding rock [12,13]. It is now generally accepted that the rate of H2 generation is greater than the rate of its dissolution and diffusion in water, and thus the gas pressure will gradually increase and the structural integrity of the surrounding rock may be influenced (creating micro/macro cracks) if the gas breakthrough pressure exceeds the bearing capacity of the surrounding rock [14,15].
Based on the microstructural conceptualization of a low-permeability rock mass, Marschall et al. [16] summarized four mechanisms of gas transport and breakthrough:
  • The gas is dissolved in molecular form in pore water and undergoes advection following Brownian motion;
  • With the accumulation of gas, the gas pressure gradually increases, and, according to the Young–Laplace equation, when the gas pressure exceeds the capillary resistance at the gas–liquid phase interface, the gas phase can push the liquid phase;
  • The continuous increase in gas pressure leads to the creation of microcracks in the rock matrix, and the gas seeps into the microcracks;
  • The rock is damaged, and the gas exits through the fractures.
The four mechanisms are illustrated in Figure 1. The first mechanism always occurs, but it can be ignored due to its low efficiency. To ensure that the surrounding rock will not be damaged, the gas breakthrough must occur before the third mechanism, that is, the gas is released from the rock following the two-phase gas–liquid flow.
Not only in underground nuclear waste storage but also in other types of rock engineering, considerable research, including experiments and numerical analysis, has been conducted to explore the gas transport and breakthrough characteristics in low-permeability porous media, and the effect of gas transport on the microstructure and the mechanical property. Wollenweber et al. [17] conducted gas breakthrough experiments on specimens under field conditions to investigate the effect of high-pressure CO2 exposure on the fluid transport properties of two pelitic caprocks. Zhao and Yu [18] conducted a series of gas mixture breakthrough experiments on saturated low-permeability sandstone core samples from the Ordos Basin using the step-by-step (SBS) method to assess the gas sealing capacity. Zhang et al. [19] performed gas breakthrough experiments on the Niutitang shale using the SBS method to investigate the flow properties of the Nuititang shale, which is a candidate for the extraction of natural gas. Cui et al. [20] obtained the gas breakthrough pressure of the saturated Gaomiaozi bentonite, which is a potential buffering material with a low permeability for use in nuclear waste repositories. Cheng et al. [21] studied the relationship between the permeability and the gas breakthrough pressure of cement-based materials. In general, conducting gas migration experiments on low-permeability media is difficult, time-consuming, and very dependent on the accuracy of the experimental equipment [22].
In regard to the numerical approach of investigating gas migration and breakthrough, a reliable pore space model of the rock at the microscopic scale is indispensable. It can be obtained via detection and analysis using direct scanning methods, such as micro-computed tomography [23], X-ray computed tomography [24,25], and scanning electron microscope [26]. Although direct imaging techniques have the advantage of presenting the true morphology of the material’s microstructure, the preparation of the sample and the manipulation of the instrument may affect the final result. In addition, obtaining representative 3D photos with a high resolution and sufficient voxel size is often expensive and time-consuming. The reconstruction of a multi-scale digital model of a rock according to the characteristic parameters of the pore space is a hot research topic at present [27]. Common methods of pore structure modeling usually use specific shapes to represent pores. Jiang et al. [28] constructed a porous media model by representing the nodes as balls and the bonds as cylinders to study the properties of single/multiphase flow in reservoir rocks. Tahmasebi and Kamrava [29] established a 3D multi-scale model of sandstone using circles and tubes to indicate the pores and throats. Hakimov et al. [30] investigated the Berea sandstone and the Estillades limestone. The pores and throats in a 2D model have regular triangular cross-sections, while those in a 3D model have circular, triangular, and square cross-sections. De Vries et al. [31] constructed several pore-scale models to study the transport process of contaminants in soil and rock by assuming that the pores were spherical and the pore throats were cylindrical capillaries. Although these methods provide new ideas and directions for studying the microstructure and related transfer properties, they are always based on the pre-setting of the pore form and thus cannot reflect the random and complex pore space morphology of porous media.
Based on the above research, it is known that, during the long-term storage of nuclear waste, the continuous gas production may lead to the generation of gas phase and consequently the local gas pressure may increase. Since host rock is the main medium for underground fluid flow and the final barrier to prevent waste leakage, the integrity of host rock may be damaged due to the increasing of local gas pressure. Therefore, it is necessary to investigate and understand the gas migration and breakthrough through host rocks for the safety assessment. Laboratory experiments are essential to obtain the gas breakthrough pressure. However, during the process of the experiment, direct measurements and visualizations of gas migration inside the rock sample are generally not possible. Meanwhile, most of the experiments are time-consuming, especially for low-permeability rocks. To overcome these drawbacks, researchers have conducted a great deal of research on the numerical simulation method. Considering that the pore structure of the real rocks is complex, most of the recent simulation works define pores as specific forms; therefore, they cannot describe the pore space morphology and the following prediction of gas migration with accuracy.
Following the above considerations, this work aims at providing a reliable numerical simulation method with advantages of simple parameter adjustment, short operation time, and strong experimental reproducibility to deeply investigate the gas migration and breakthrough in low-permeability rocks. The first objective is to generate the 3D microstructure model that matches the real rock as much as possible. Different from traditional methods which are based on the definition of specific pore shapes, the 3D rock models in this work are constructed using the biphasic transformation of the Gaussian random field. This method is able to represent the heterogeneity and randomness of natural pore space morphology, and meanwhile has a good control of pore space geometric parameters such as the porosity and the pore size distribution (PSD). The 3D models of the four investigated rocks (Boom clay from Belgium, COx argillite from France, Opalinus clay from Switzerland, and Beishan granite from China) are successfully created. The second objective is to accurately analyze the pore network, to extract the preferential gas migration pathways, to explore the geometric properties, to predict the gas breakthrough pressure, and then to validate the method after the comparison with the reported experimental data. This work completes this task using new numerical calculation scenarios composed of a set of image processing operations of mathematical morphology. The obtained results are in good accordance with the experimental values. The gas breakthrough pressures are 2.62–4.11 MPa in Boom clay and 3.72–4.27 MPa in COx argillite. It enhances the idea that the capillary-induced gas breakthrough is possible at pressures lower than the fracture threshold. For Opalinus clay and Beishan granite, no connected pathway exists, and the breakthrough is more likely to occur through pathway dilation or fractures. The presented method can not only obtain reliable simulation results, but also make the development of gas phase with increasing gas pressure at the microscopic scale become visible (difficult in experiment). It can be also applied in the pore-scale modeling and the numerical study of percolation in other porous medium.

2. Analysis of Pore Space Characteristics

2.1. Clay Rock

The data on the pore space characteristics, such as the porosity and PSD, of the investigated clay rocks were obtained from the literature. The first research object was the Boom clay. The Boom clay is considered to be a reference host formation for radioactive waste disposal in Belgium because of its expected favorable characteristics. Research has been carried out for more than 25 years in the Mol underground laboratory. Lima et al. [32] retrieved Boom clay samples from a depth of 223 m (Mol site). It mainly consists of clay minerals, predominantly illite (20%–30%), kaolinite (20%–30%), and smectite (10%). The non-clayey fraction is composed of quartz (25%) and feldspar. The second research object was the COx argillite. It is a privileged candidate material in the context of radioactive waste disposal and has been investigated in the ANDRA underground research laboratory in Bure, France. A sample obtained from a depth of around −490 m had a clay mineral content of 40%–45%, a carbonate content of 20%–30%, and a quartz and feldspar content of 20%–30% [33,34]. The third research object was the Opalinus clay. In Switzerland, the Mont Terri Rock Laboratory has investigated the Opalinus clay as a possible host rock for long-term geological disposal of radioactive waste. The shaly facies of the Opalinus clay typically contains clay minerals (66%), calcite (13%), quartz (14%), and feldspar, pyrite, and organic carbon (2%) [35].
The pore structure characteristics of the three investigated clay rocks (data from [32,34,35]) are presented in Table 1.

2.2. Granite

The granite sample was collected at a depth of around 450 m from the pre-selection area of Beishan in Gansu, China. Its density is 2.59–2.70 g/cm3. Its mineral composition is as follows: feldspar (60.59%), quartz (34.09%), and biotite (5.32%). Since the Beishan granite has a low permeability, the determination of its pore structure characteristics was relatively difficult. The method applied in this study was nuclear magnetic resonance (NMR). The sample was cut into a 40 mm × 40 mm × 40 mm cube and a low-field NMR instrument (Meso MR23-060H-I, Niumai, Suzhou, China) with a magnetic field strength of 0.5 T and a magnetic field stability ≤250 Hz/h was used (Figure 2). The open porosity was extremely low, only 1.8%. The PSD between 0.07 μm and 20 μm (mainly between 0.2 μm and 10 μm) was obtained. The PSD curves of the four investigated rocks are shown in Figure 3.

3. Generation and Validation of the Pore Space Model

3.1. Ideas for Model Generation

3.1.1. Binarization of Gaussian Random Field

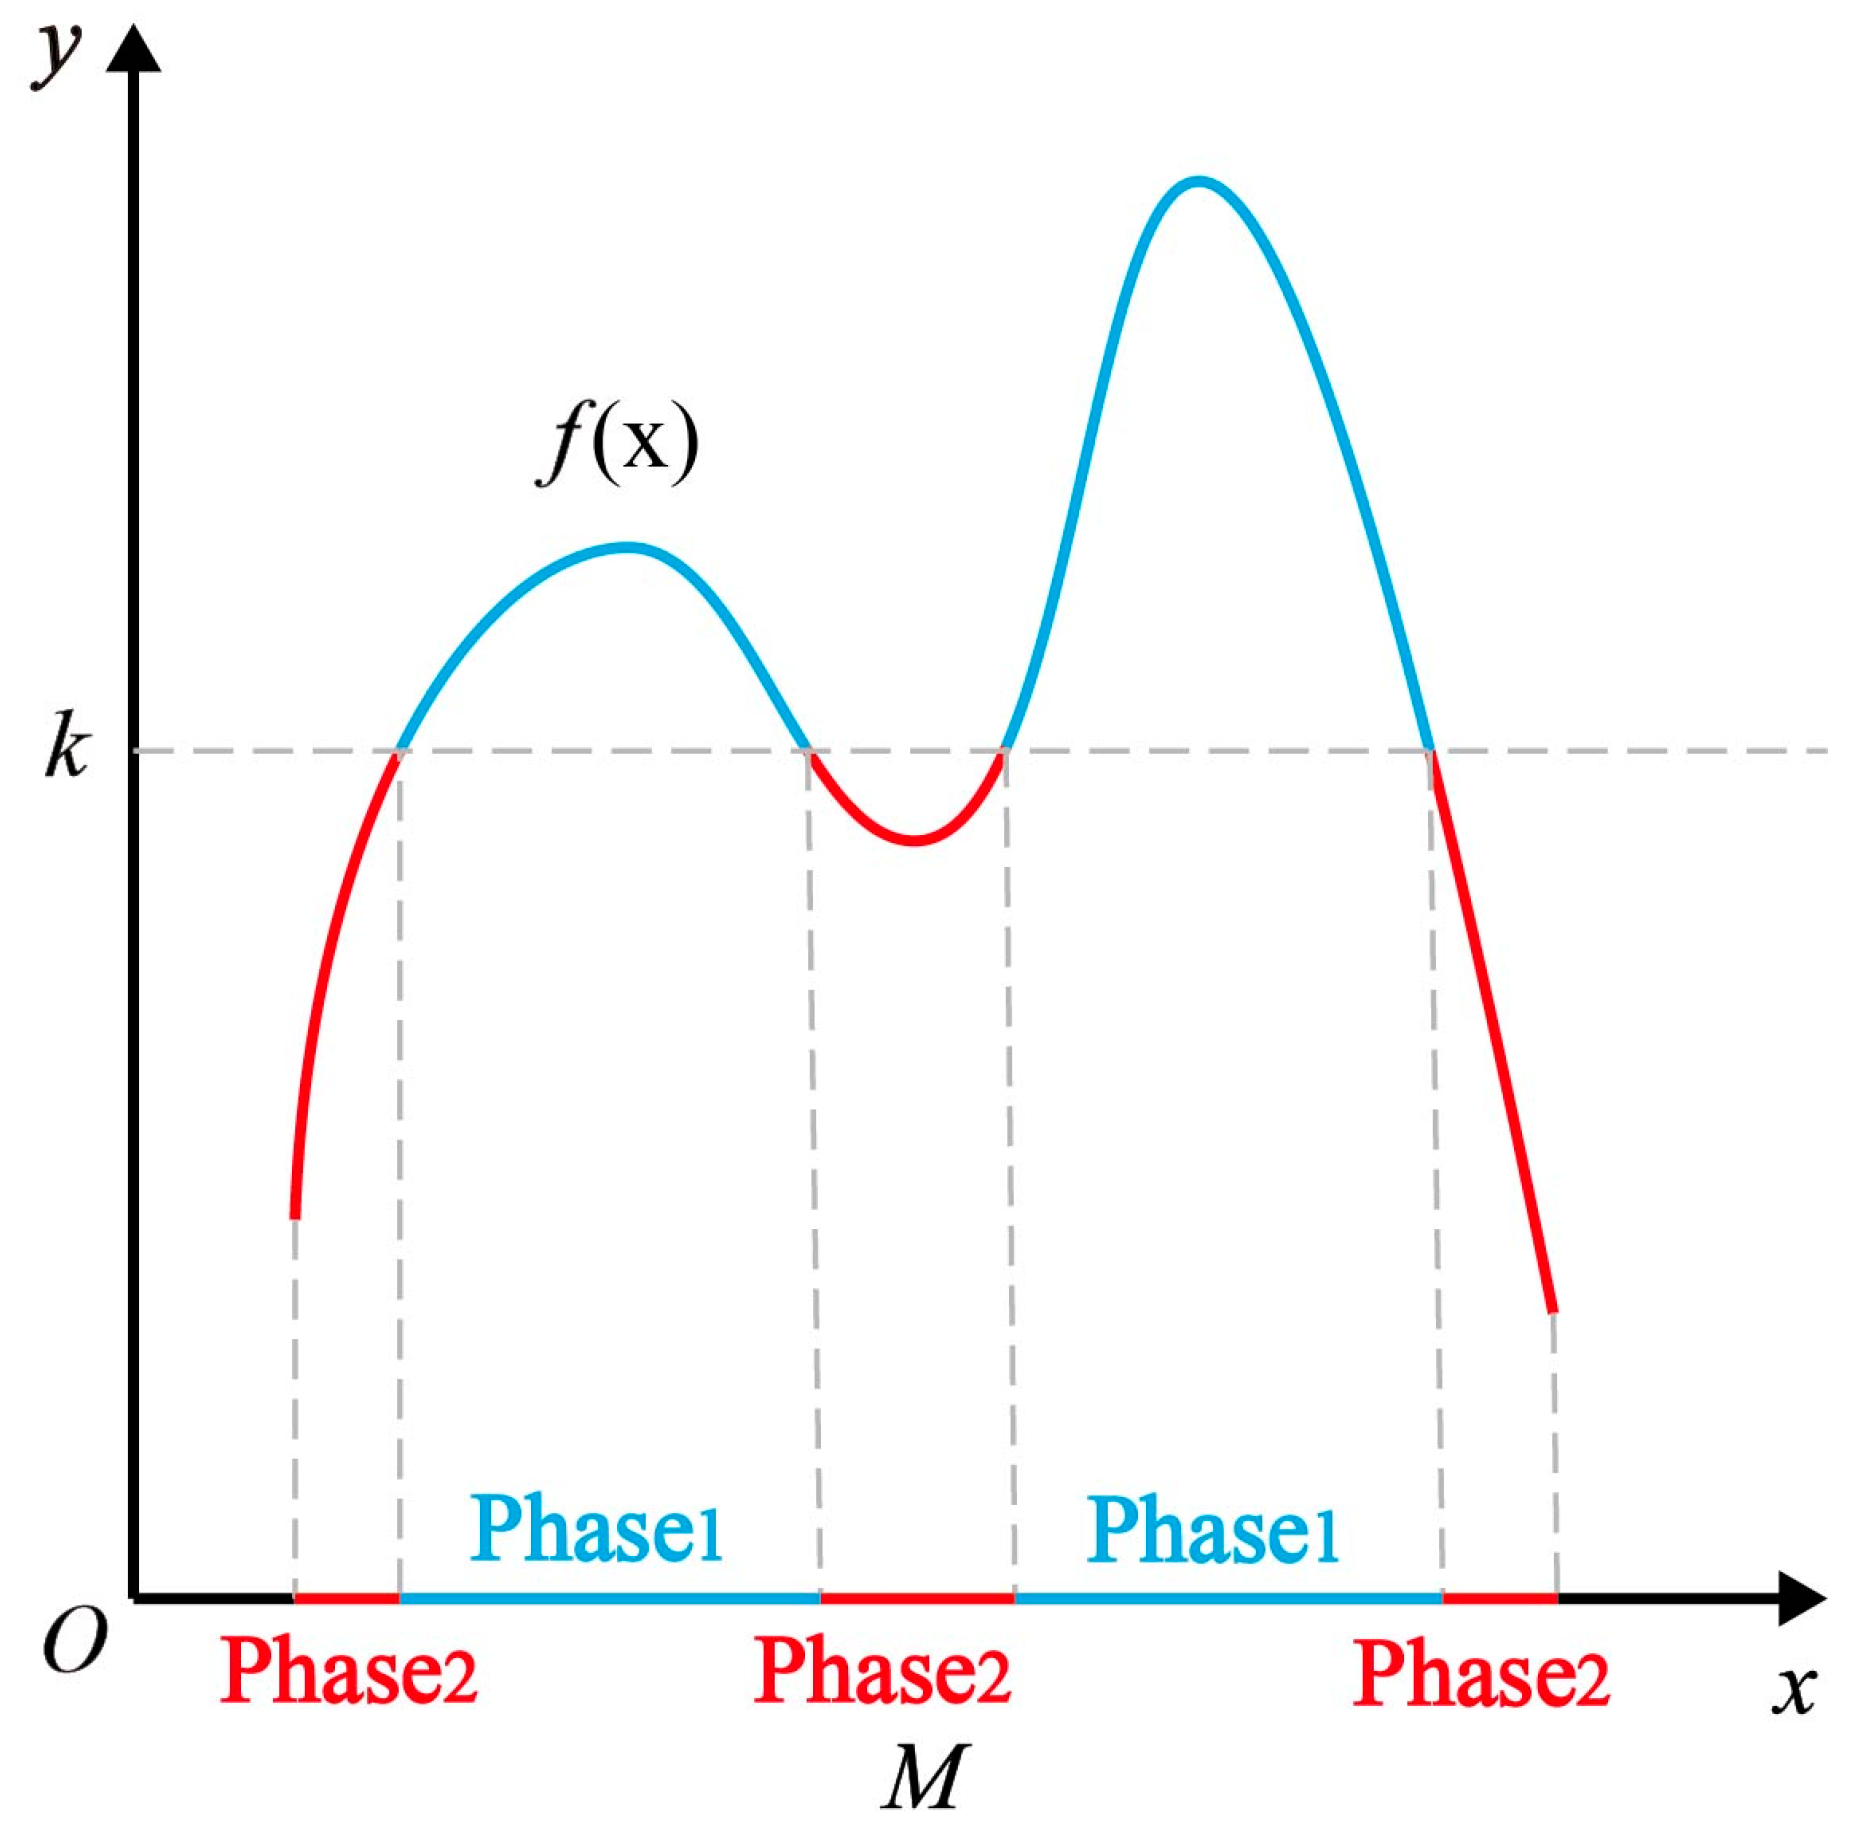
The binarization of a Gaussian random field transforms a continuous field into a two-phase field, which can represent the pore and matrix of the porous media. Specifically, by assigning a threshold k to a continuous random field f ( x ) , the field can be divided into two parts, denoted as Phase1 and Phase2:
P h a s e 1 x M f x k ,
P h a s e 2 x M f x < k .
M represents the domain of the definition of f ( x ) . This process is illustrated in Figure 4.
The degree of fluctuation of a random field can be represented by the covariance. That is, for any two spatial points p 1 and p 2 , f p 1 and f p 2 are correlated, and the level of correlation is measured by the covariance C o v p 1 , p 2 :
C o v p 1 , p 2 = E f p 1 - E f p 1 f p 2 - E f p 2 .
E denotes the mathematical expectation. Among the various types of random fields, the Gaussian field is the most commonly used. According to the study of Adler [36,37], the covariance of a Gaussian random field that conforms to a standard normal distribution (variance = 1 and mean = 0) can be defined as follows:
C o v p 1 , p 2 = exp ( p 1 p 2 2 L C 2 ) .
L C is the correlation length. When p 1 - p 2 0 , the following can be determined from Equation (4):
  • If L C 0 , C o v p 1 , p 2 0 , the random field exhibits weak correlation;
  • If L C , C o v p 1 , p 2 1 , the random field exhibits powerful correlation.
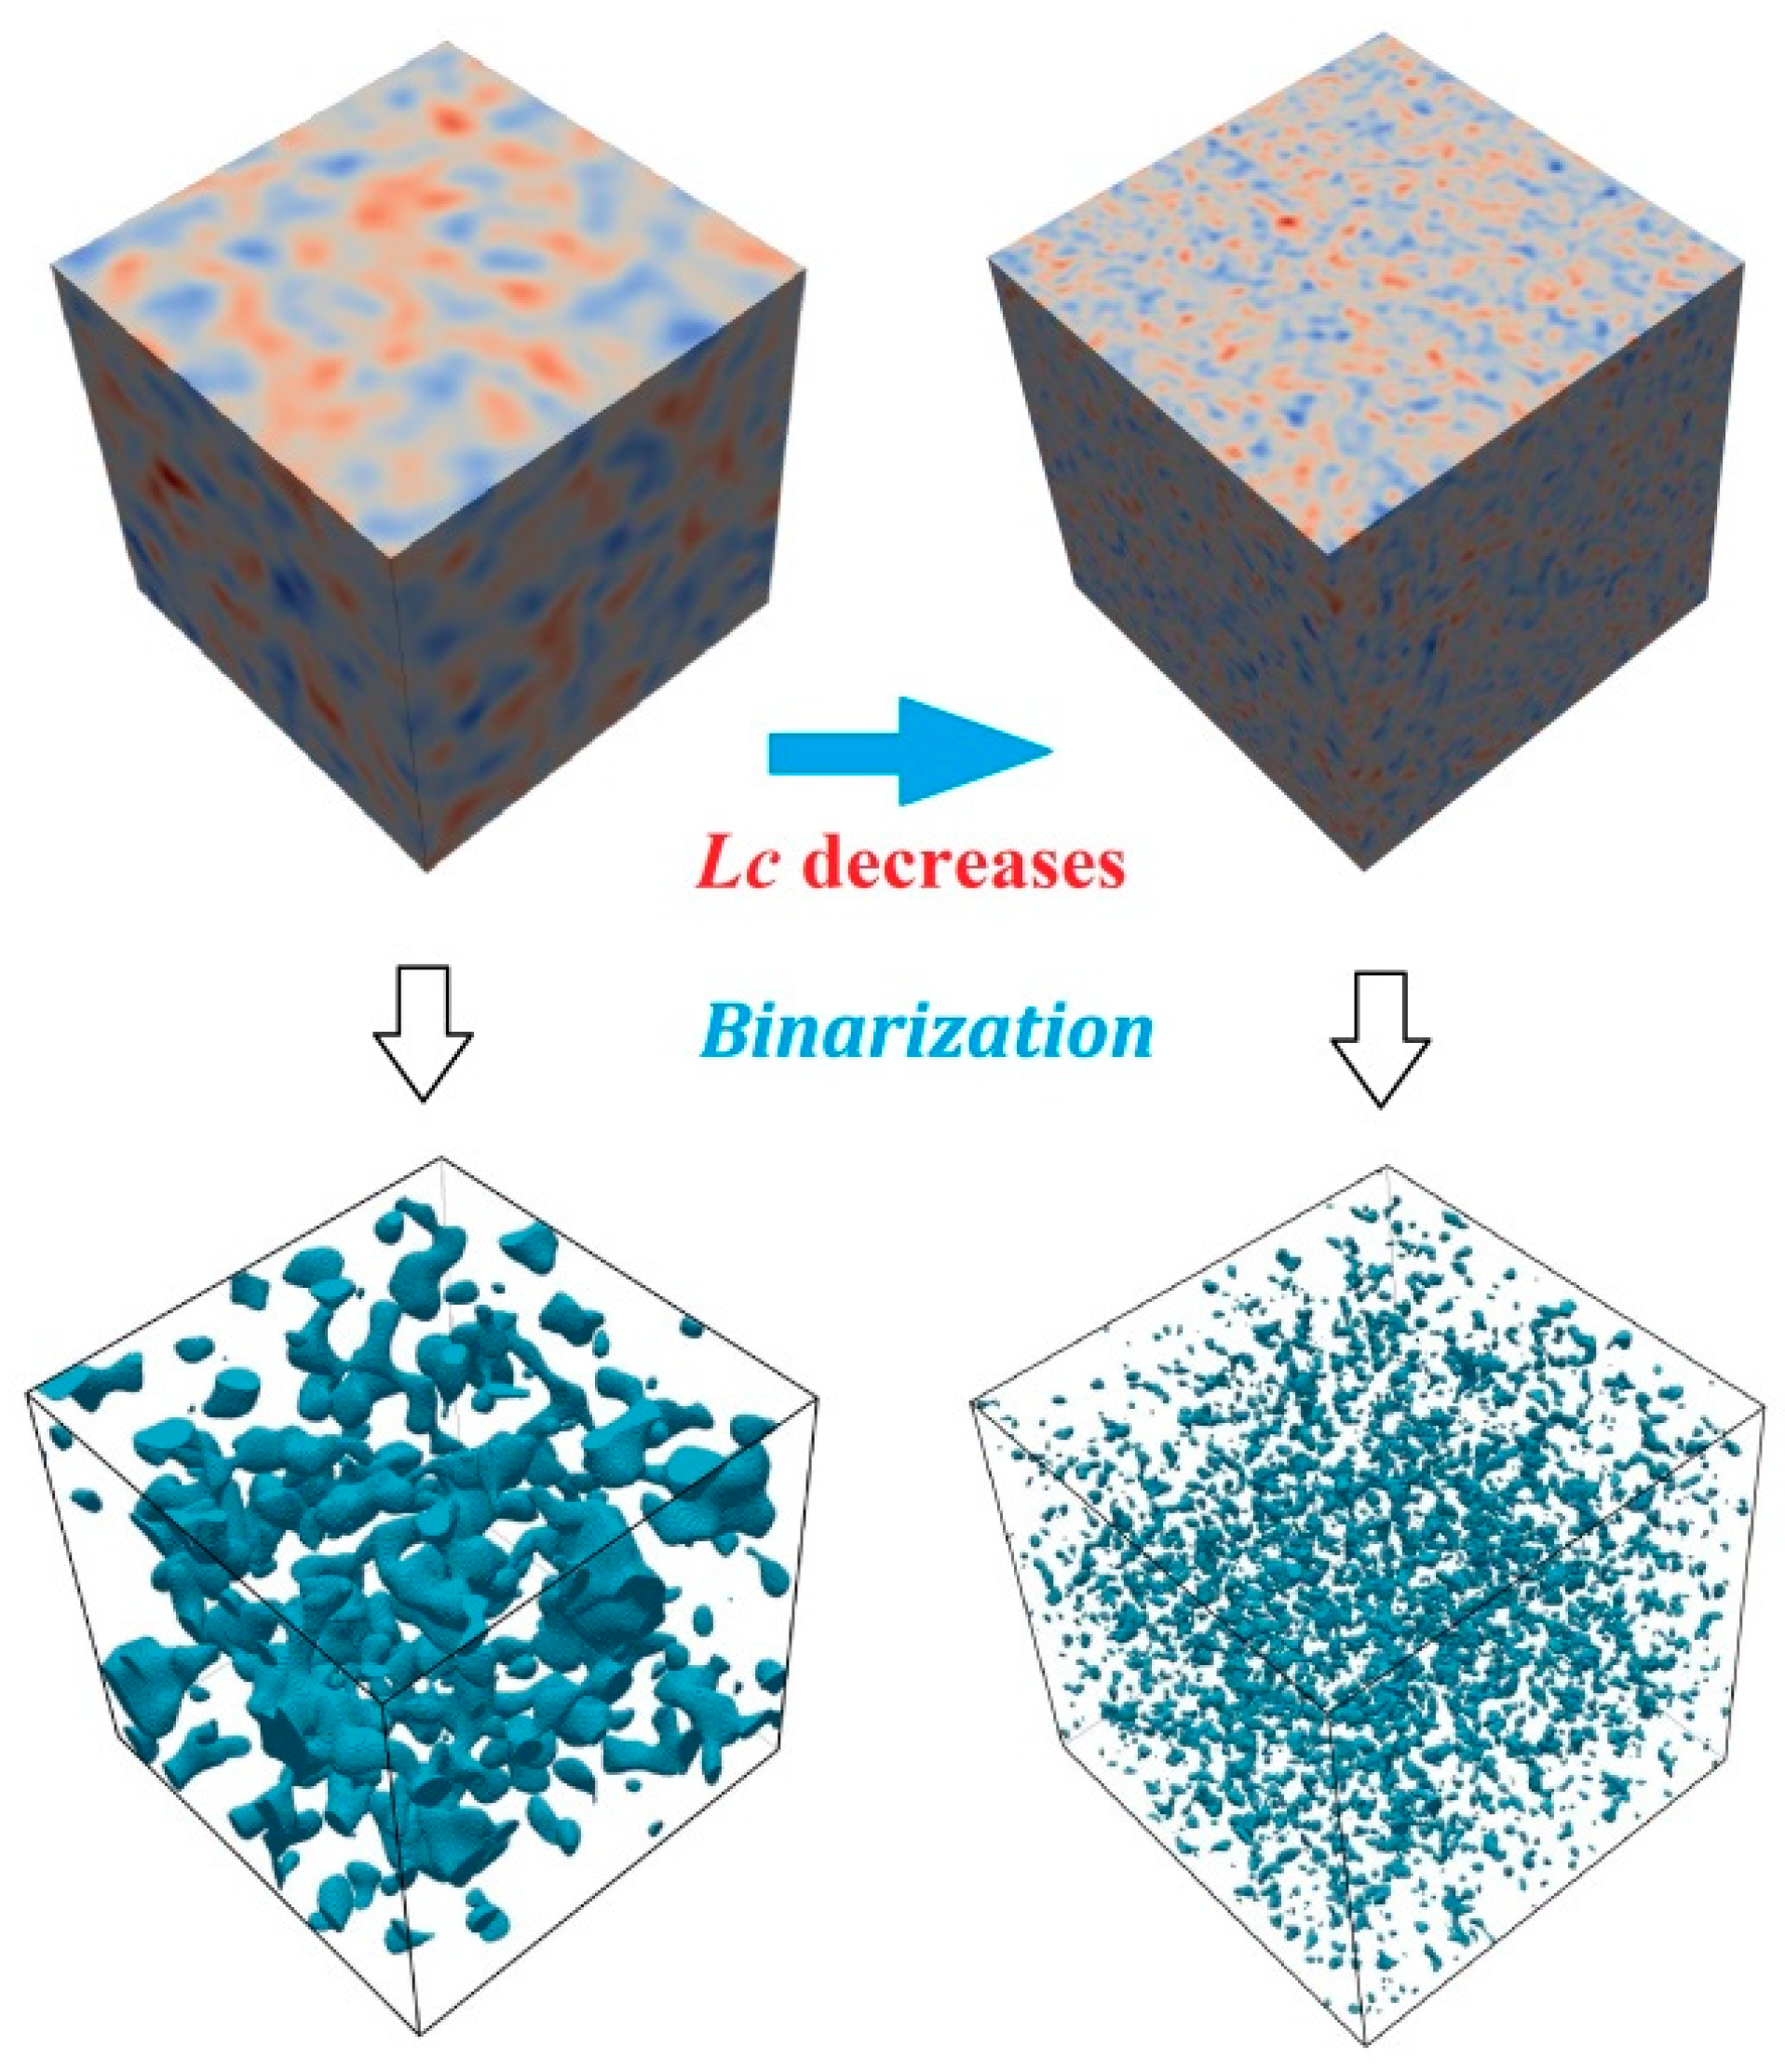
Thus, L C is the key factor in determining the fluctuations in a field. As is illustrated in Figure 5, as L C decreases, the fluctuation frequency increases, and a much wavier field is obtained. After the binarization transformation, a field with a high L C value is composed of huge blocks. Conversely, the field with a low L C value consists of small, dense blocks.
If a Gaussian random field is generated in a cubic domain with a side length of C d , the volume of Phase1 ( V P h a s e 1 ) and the volume of Phase2 ( V P h a s e 2 ) after binarization using the threshold k can be computed as follows:
V P h a s e 1 = C d 3 Ψ k ,
V P h a s e 2 = C d 3 Φ k ,
Ψ k + Φ k = 1 .
Ψ k is the tail function of Φ k . Φ k is the cumulative density function. Ψ k and Φ k can be understood as the percentages of Phase1 and Phase2. They are computed as follows:
Ψ k = 1 2 π k + e - x 2 2 d x ,
Φ k = 1 2 π - k e - x 2 2 d x .
Moreover, they can be estimated using the error function [38], that is,
Ψ k = 1 2 - 1 2 e r f k 2 ,
Φ k = 1 2 + 1 2 e r f k 2 .
Then, the relationships between k and Ψ k and between k and Φ k can be obtained as follows:
k = 2 e r f i n v 1 - 2 Ψ k = 2 e r f i n v 2 Φ k - 1 .
If Phase1 represents the pores and Phase2 represents the matrix, then Ψ k represents the value of the porosity. It should be noted that L C and k are the key parameters that control the pore size range and porosity, respectively. By varying these two parameters, different kinds of porous media can be constructed via binarization of the Gaussian random field (Figure 5).

3.1.2. Combination of Two-Phase Fields

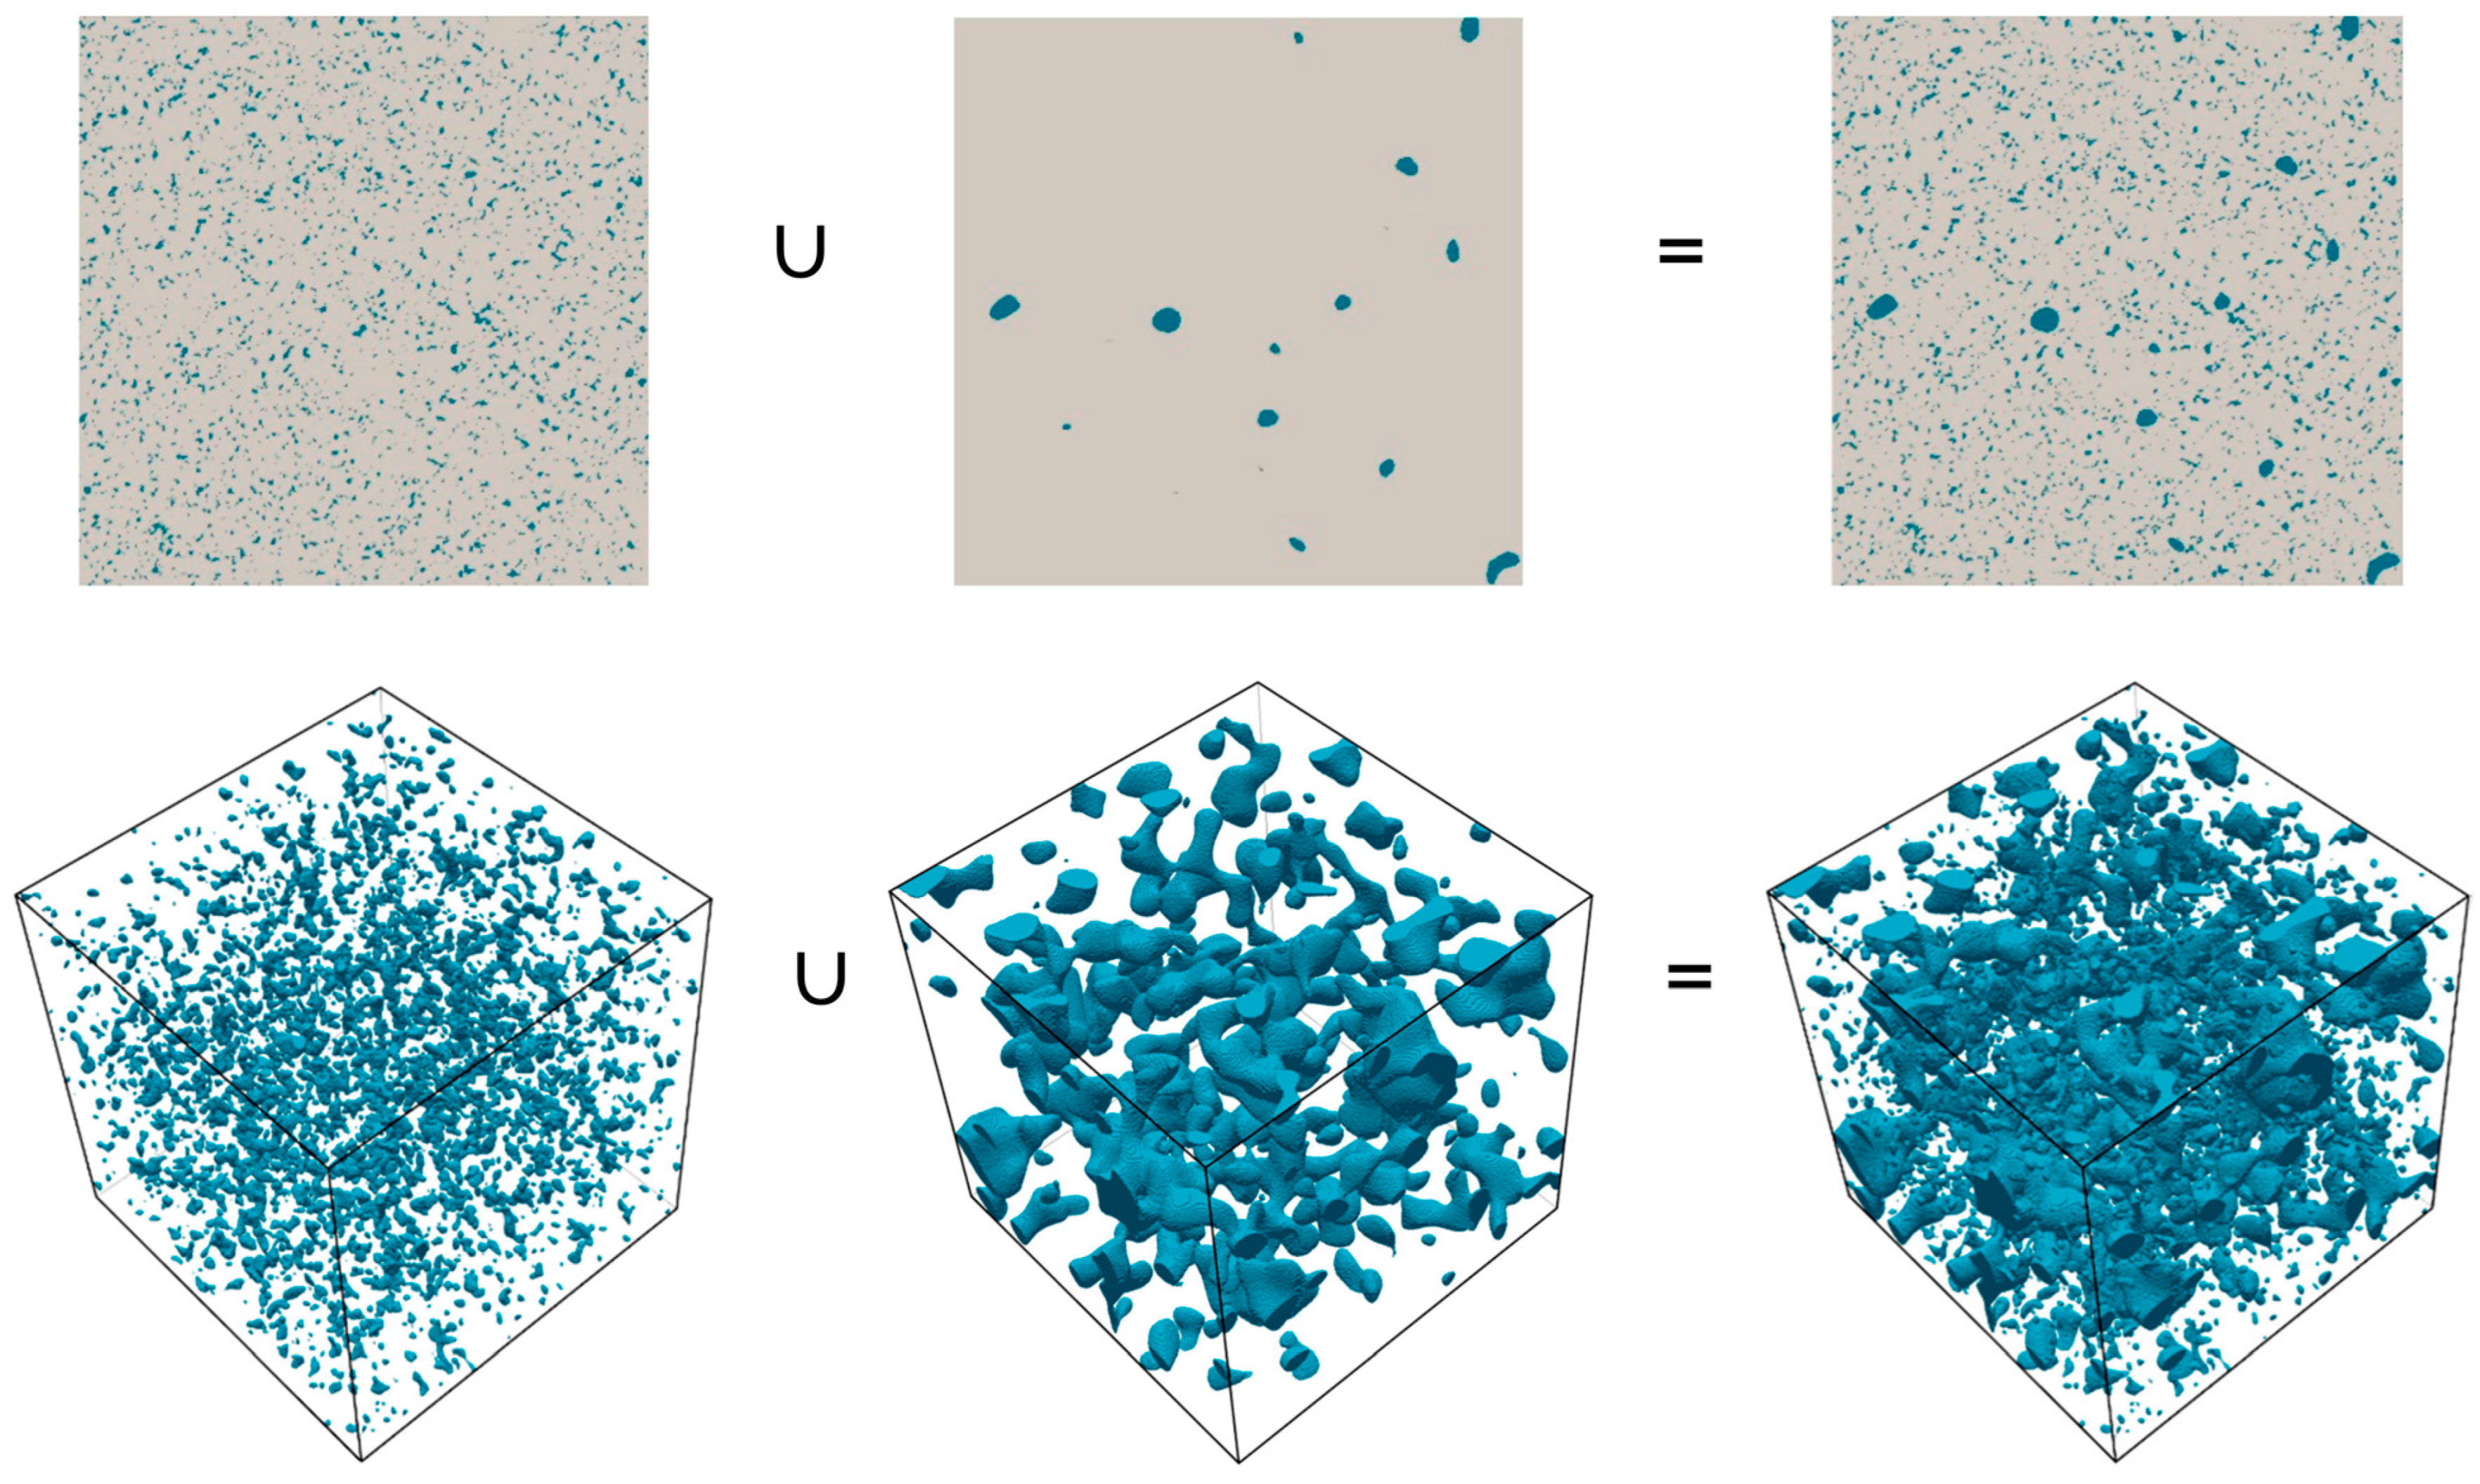
The pore sizes of clay rock and granite span a wide range from the nanoscale to the microscale (e.g., the PSD of Boom clay has a large range of 6 nm to 2 μm). A single Gaussian random field can only simulate pores with a limited size range around L C after the binarization. Therefore, to generate a pore space model that matches the true PSD of the studied rock, a number of two-phase fields with different L C values need to be combined.
Notably, during the combination process, the large pores may cover parts of the small pores (Figure 6), resulting in the total porosity being lower than the sum of the porosities of the large and small pores. For two fields A and B and L C A > L C B , the combined porosity φ f A f B is estimated as follows:
φ f A f B = φ f A + φ f B - φ f A f B .
To avoid underestimation of the total porosity, the porosities of the fields with small pores should be slightly greater than the initial values. For example, there are three fields ( f 1 , f 2 , and f 3 ) with gradually decreasing L C values. Some of the pores in f 2 may be covered by the pores in f 1 , and some of the pores in f 3 may be covered by the pores in f 1 and f 2 . Hence, φ 2 needs to be modified to φ 2 / ( 1 - φ 1 ) , and φ 3 needs to be modified to φ 3 / ( 1 - φ 1 - φ 2 ) to offset the pore overlap effect.

3.2. Model Validation

Model validation was conducted to verify the open porosity and PSD. The method applied in this study was the mathematical morphology method, which is a set of image processing operations for the geometrical analysis of a binary image [39,40,41]. The geodesic reconstruction (GR) and the morphological opening (MO) were the main operations used in this study.

3.2.1. Structural Element

The mathematical morphology method usually uses a probe, which is referred to as a structural element (SE) to read the information contained in an image. When the SE moves across each pixel of an image, the interaction provides information about the structural characteristics such as the shape and size. Figure 7 shows an SE that is commonly used in 2D and 3D cases.

3.2.2. GR Operation

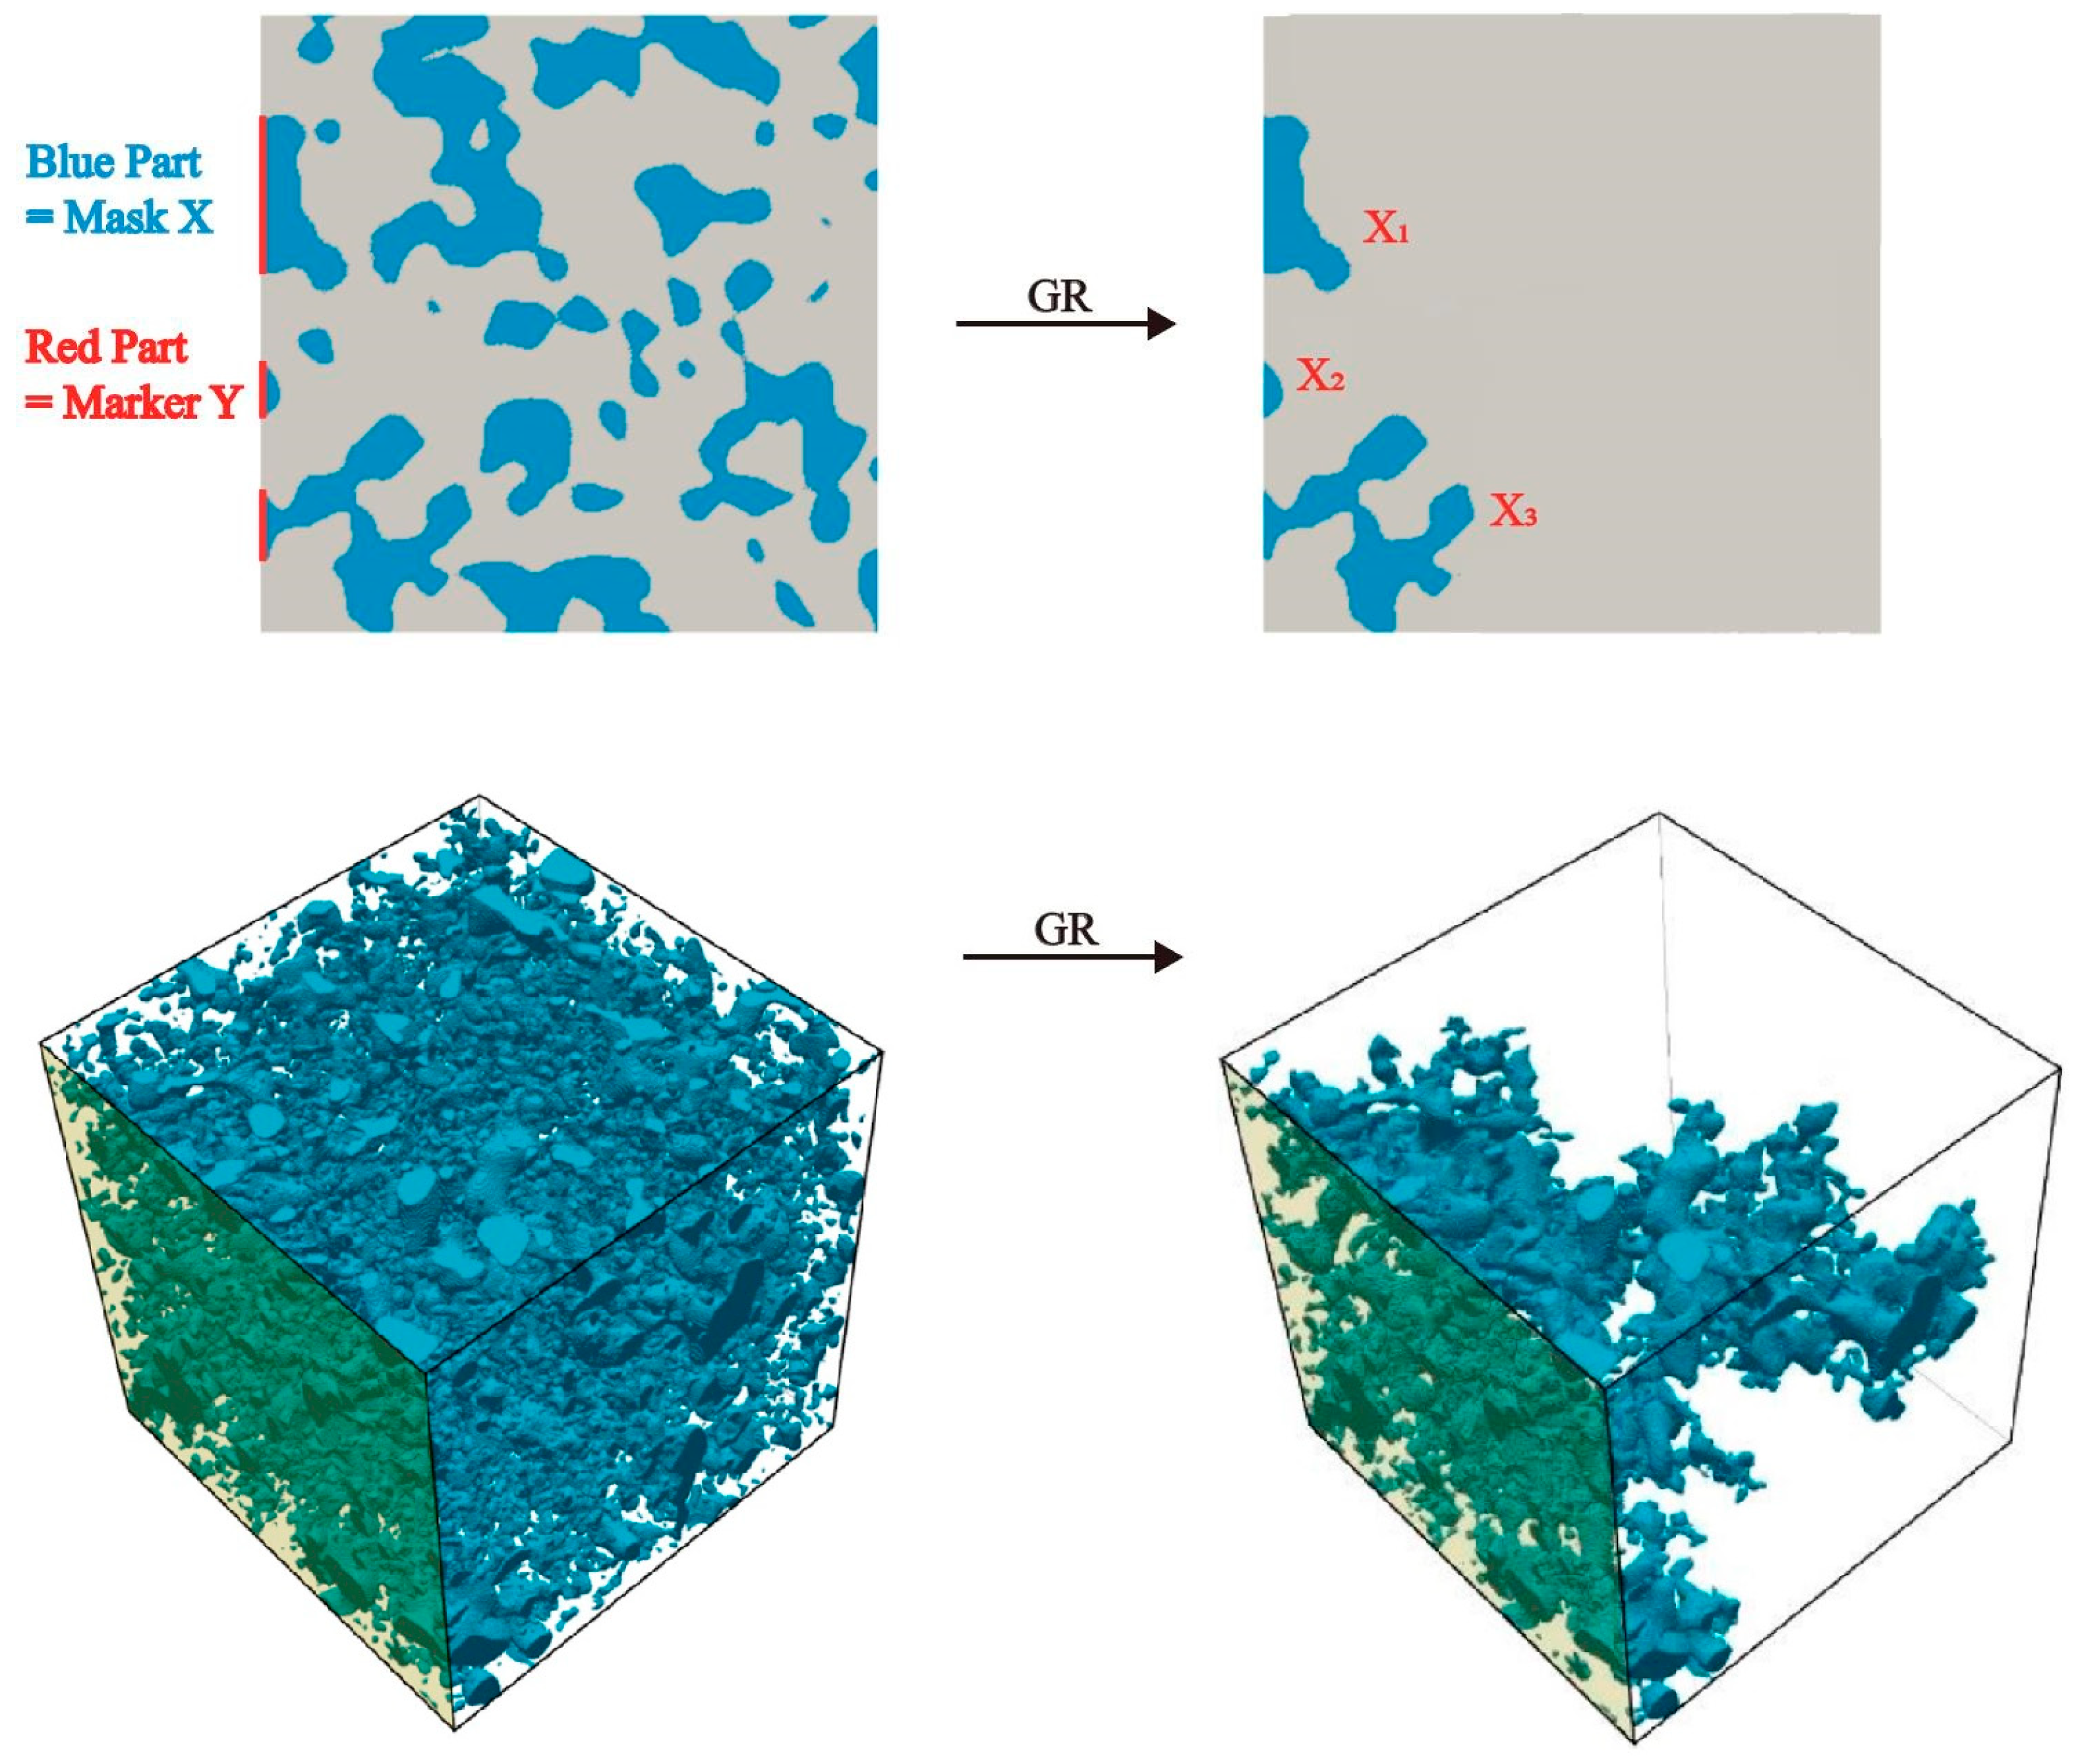
The GR operation can be used to extract the pore space that is connected to the boundary. According to Vincent [42], GR is composed of iterations of elementary geodesic dilation on marker Y in mask X, and then it extracts the connected components ( X 1 , X 2 , X 3 ) in the mask from the marker (Figure 8). This operation is expressed as follows:
G R X Y = Y X k 0 X k = n 1 δ X n ( Y ) .
G R X Y is the result of the geodesic reconstruction, and it contains connected components ( X 1 , X 2 , X 3 , …, X k ) of mask X which contains at least one pixel of marker Y. It is obtained via n iterations of an elementary geodesic dilation δ X 1 ( Y ) . δ X 1 ( Y ) is computed as follows:
δ X 1 Y = ( Y S E ) X .
It is a dilation of a marker with a given size (determined by the selected SE), which is followed by a Boolean intersection with the mask. The calculation of the GR ends when no new added part is detected after the intersection with the mask. The 3D images in Figure 8 show the results of the application of this method to a 3D pore space model. The open pore network connected to the green face is extracted. Moreover, GR starting from the six surfaces of the cube allows for the calculation of the open porosity of the model.

3.2.3. MO Operation

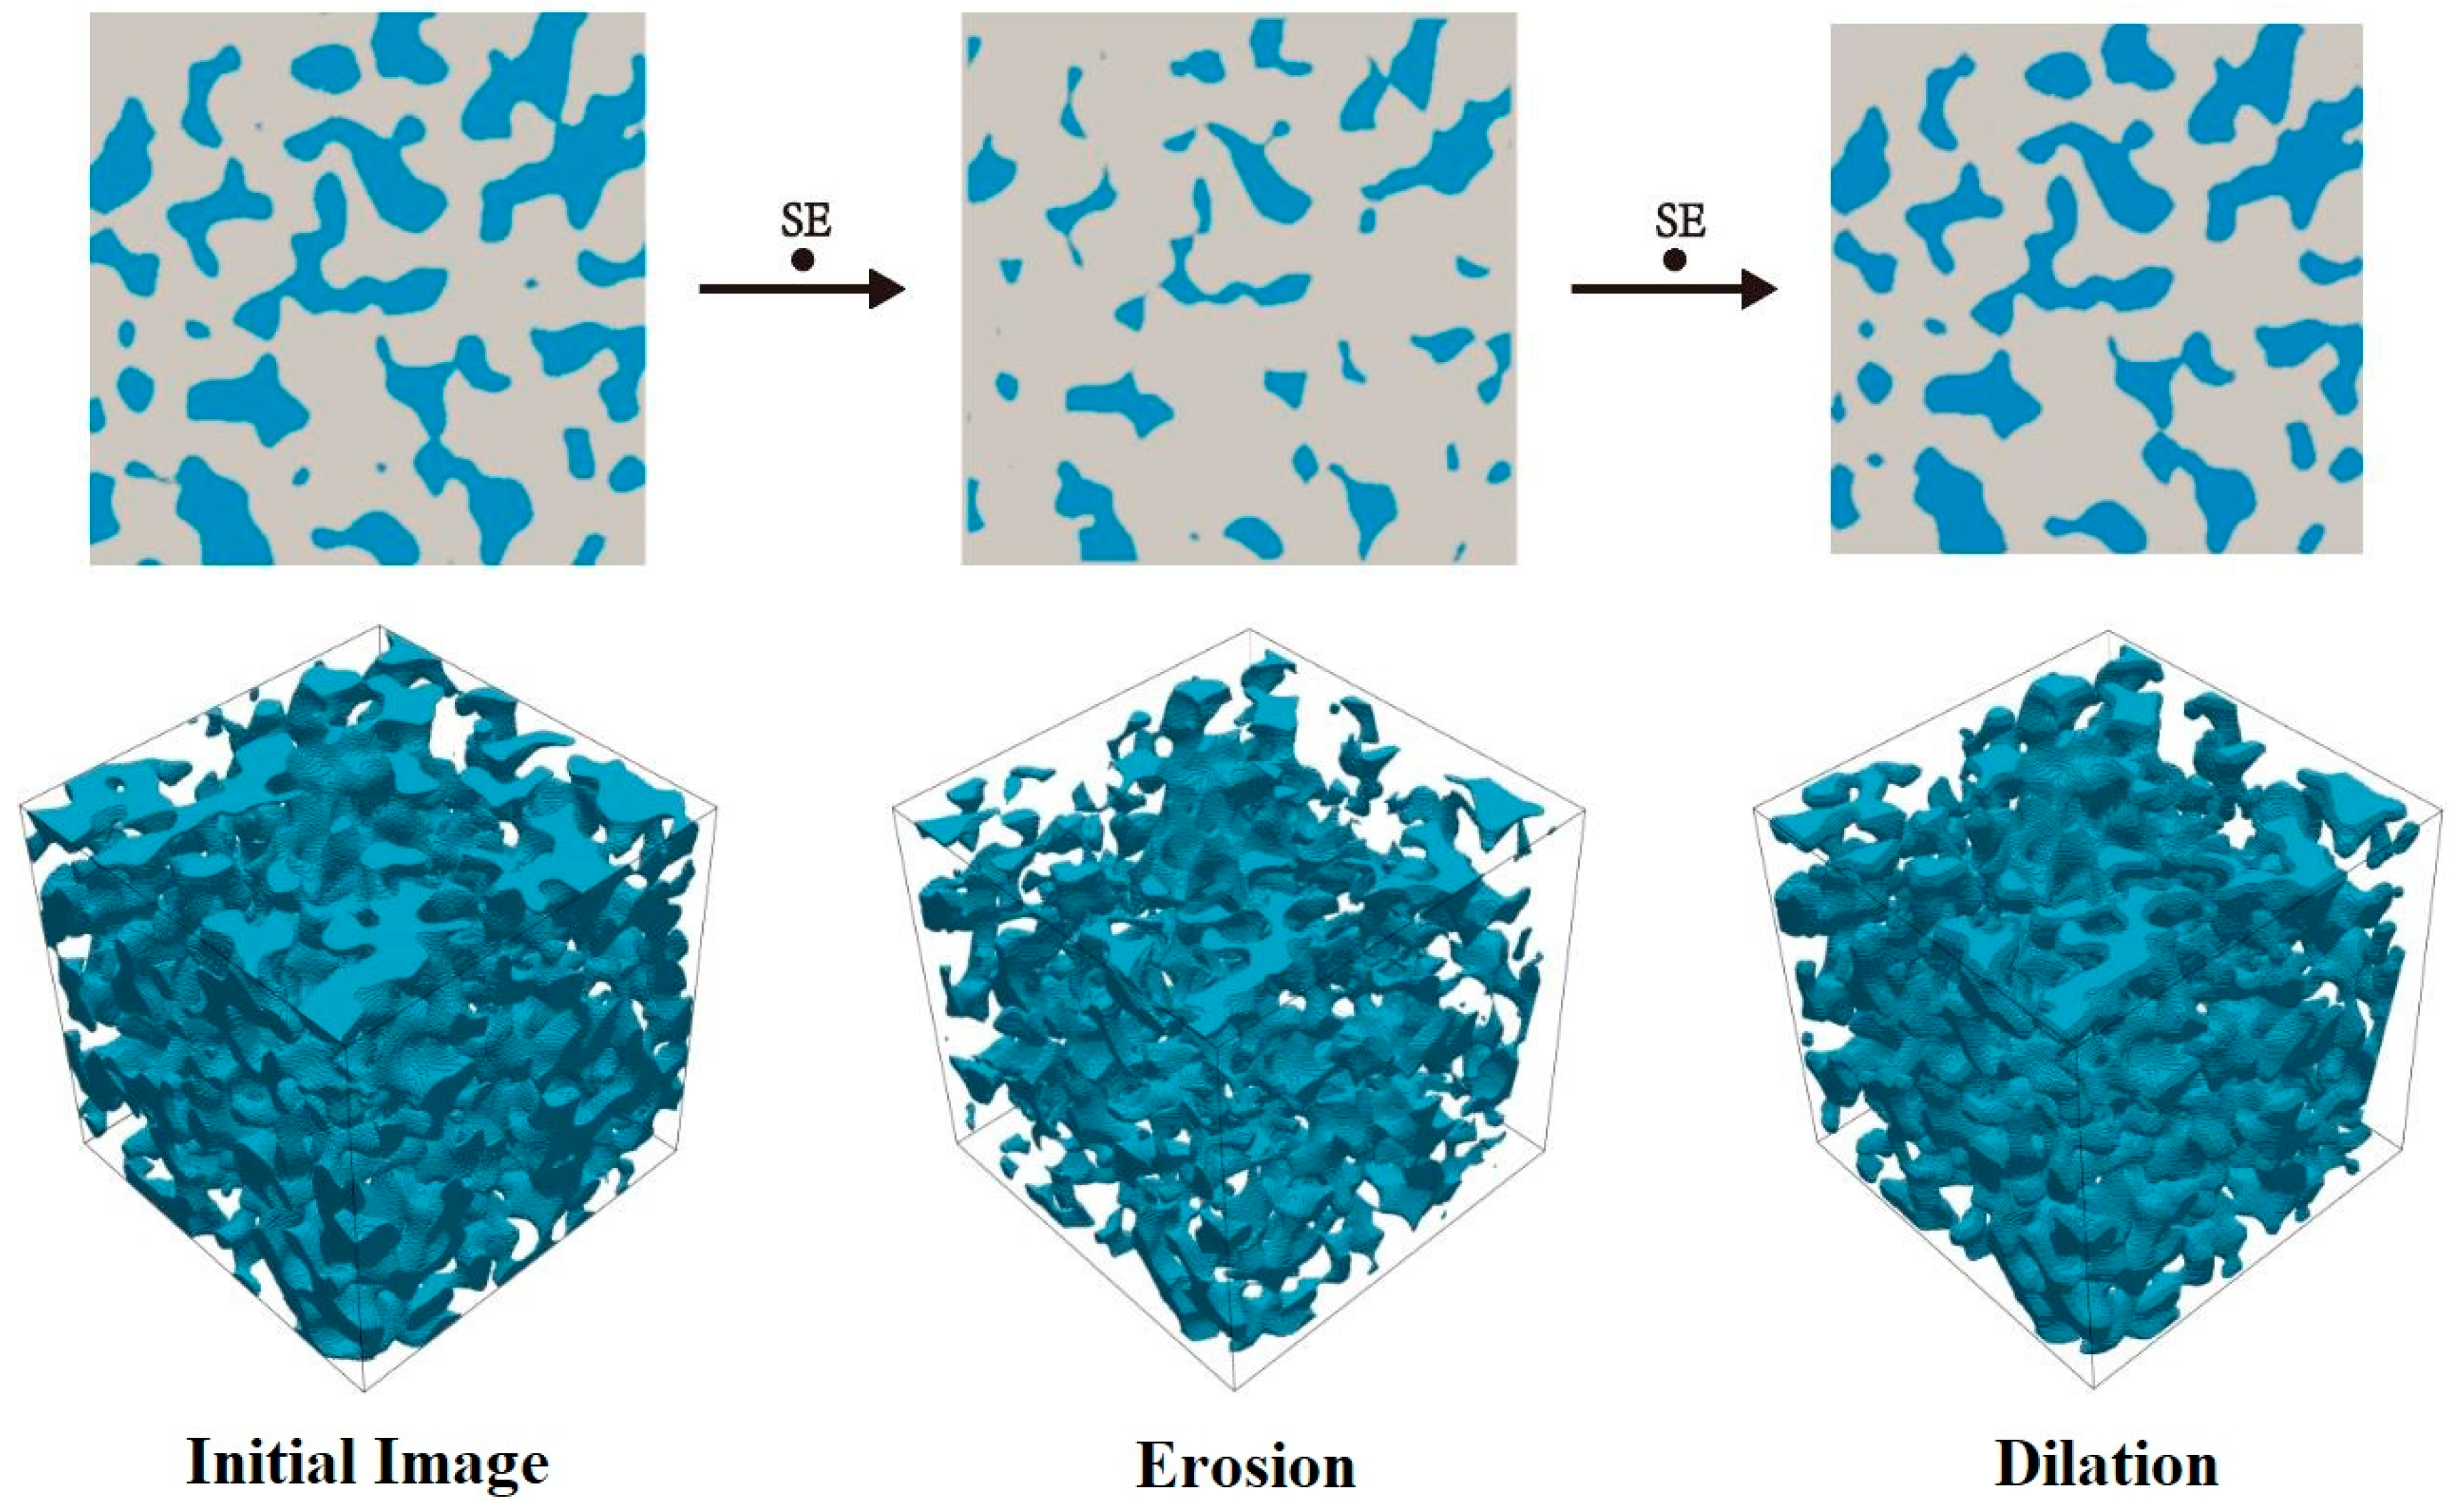
The MO operation is a combination of two basic operations of erosion ( ) and dilation ( ). Briefly, the initial image of pore space X is first subjected to an erosion process, which leads to shrinkage of an identical size (half the size of the selected SE) along the boundary. The pores smaller than the SE are directly erased. Following the erosion process, a dilation process is applied to restore the remaining pores to their former states (states in the initial pore space). In this way, the MO operation can detect and eliminate the small objects (smaller than the SE) in the initial binary image (Figure 9). It can be computed as follows:
M O = ( X S E ) S E .
Using different SEs, the pore space can be sieved, and the pore volume variation as the pore size changes can be estimated by applying the MO operation to the generated model. The obtained PSD curves can then be compared with the PSD data for rocks to validate the model generation.

3.3. Model Generation of the Four Investigated Rocks

Based on the principles introduced above, the model generation and validation steps conducted in this paper were as follows:
  • The L C values were preset within the PSD range of the investigated rock;
  • The PSD curve was analyzed, the porosity of each field was preset, and k was calculated using Equation (12);
  • Binarization of a single field was conducted and multiple fields were combined;
  • The GR operation and MO operation were used to verify the generated model. If the PSD of the model differed significantly from the initial data, the modification methods included: adding or deleting a field, modifying the value of L C , and modifying the value of k .
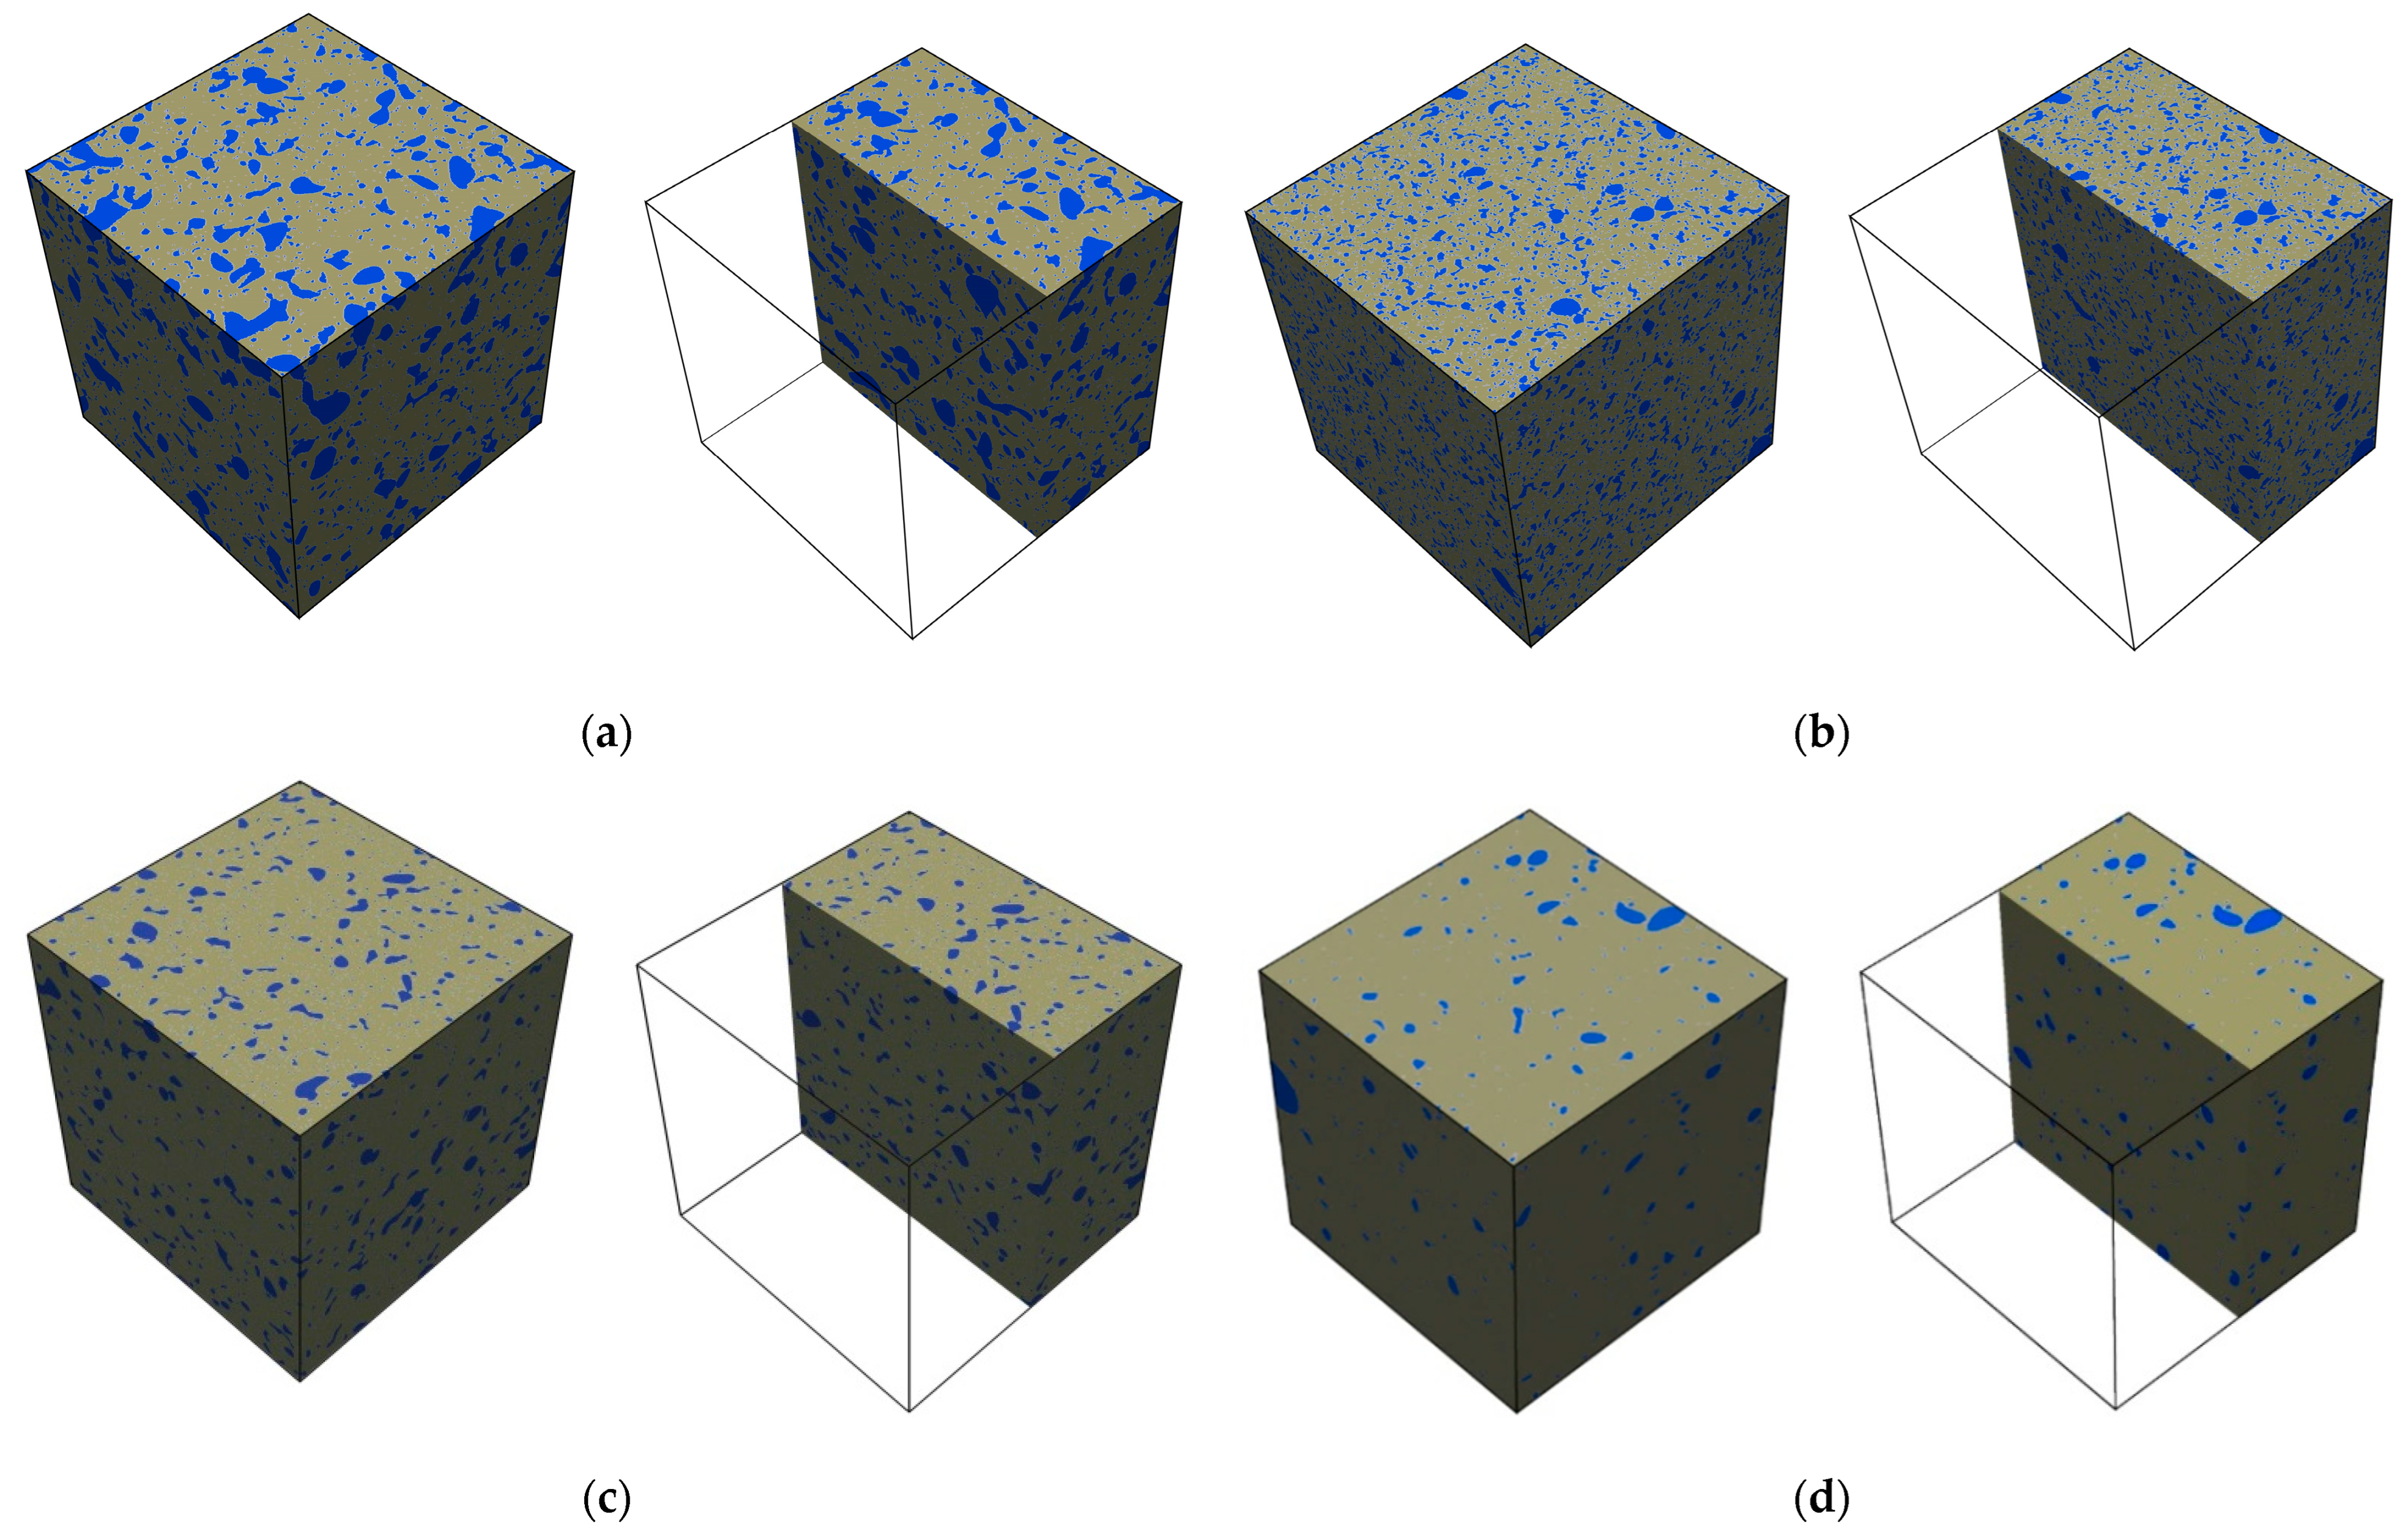
The Boom clay model was generated in a cubic domain with a side length of 8 μm and a grid density of 800 × 800 × 800; thus, the elementary cell was 0.01 μm. It was capable of containing the main pore size range of 0.05–2 μm. To simplify the model and shorten the calculation time, the pores smaller than 0.05 μm were not taken into account since they accounted for a relatively low percentage. The model was produced via the combination of nine independent fields with different L C values. In the same way, the main pore size ranges of the COx argillite, Opalinus clay, and Beishan granite were 0.003–0.1 μm, 0.001–0.02 μm, and 0.2–10 μm, respectively. The related parameters used for the model generation are presented in Table 2, and the generated models are shown in Figure 10, in which the pores are shown in blue, and the matrix is shown in grey.
The GR operation and MO operation were numerically implemented to investigate the open porosity and the PSD. A comparison of the results is shown in Figure 11. Thus, the generated models were validated and were determined to be suitable for use in the subsequent gas transport and breakthrough simulations.

4. Numerical Simulation of Gas Breakthrough

4.1. Capillary-Induced Gas Transport and Breakthrough in Porous Media

The pore space of a naturally formed porous medium is very complex. It is crucial to understand the preferential transfer pathways. In the presence of gas in a saturated porous medium, the fluid advection can be described as pore water displacement under the influence of the capillary force. The fluid transport is controlled by the difference between the gas pressure and the water pressure, which is also referred to as the gas entry pressure. According to the Young–Laplace equation, for a given cylindrical pore, the gas entry pressure is determined by the interfacial tension, the wetting angle and the radius of the pore. The drainage in a pore of radius R can begin only when the applied gas pressure overcomes the capillary resistance of the narrowest pore of radius r located in front of it [43]. The Young–Laplace equation is as follows:
P = 2 γ cos θ r .
where P is the gas entry pressure, γ is the interfacial tension (0.072 N/m for water at 25 °C [44]), θ is the fluid wetting angle (0° assuming complete wettability of the medium in the presence of gas [45]), and r is the radius of the pore.
From a macroscopic point of view, in a heterogeneous pore system, the equivalent pore radius of the system can be defined by using the Young–Laplace equation via the measurement of the gas entry pressure. Within an excess pressure range, the gas migration depends on the intrinsic permeability of the media, the relative permeability, and the relationship between the capillary pressure and the water saturation [16].
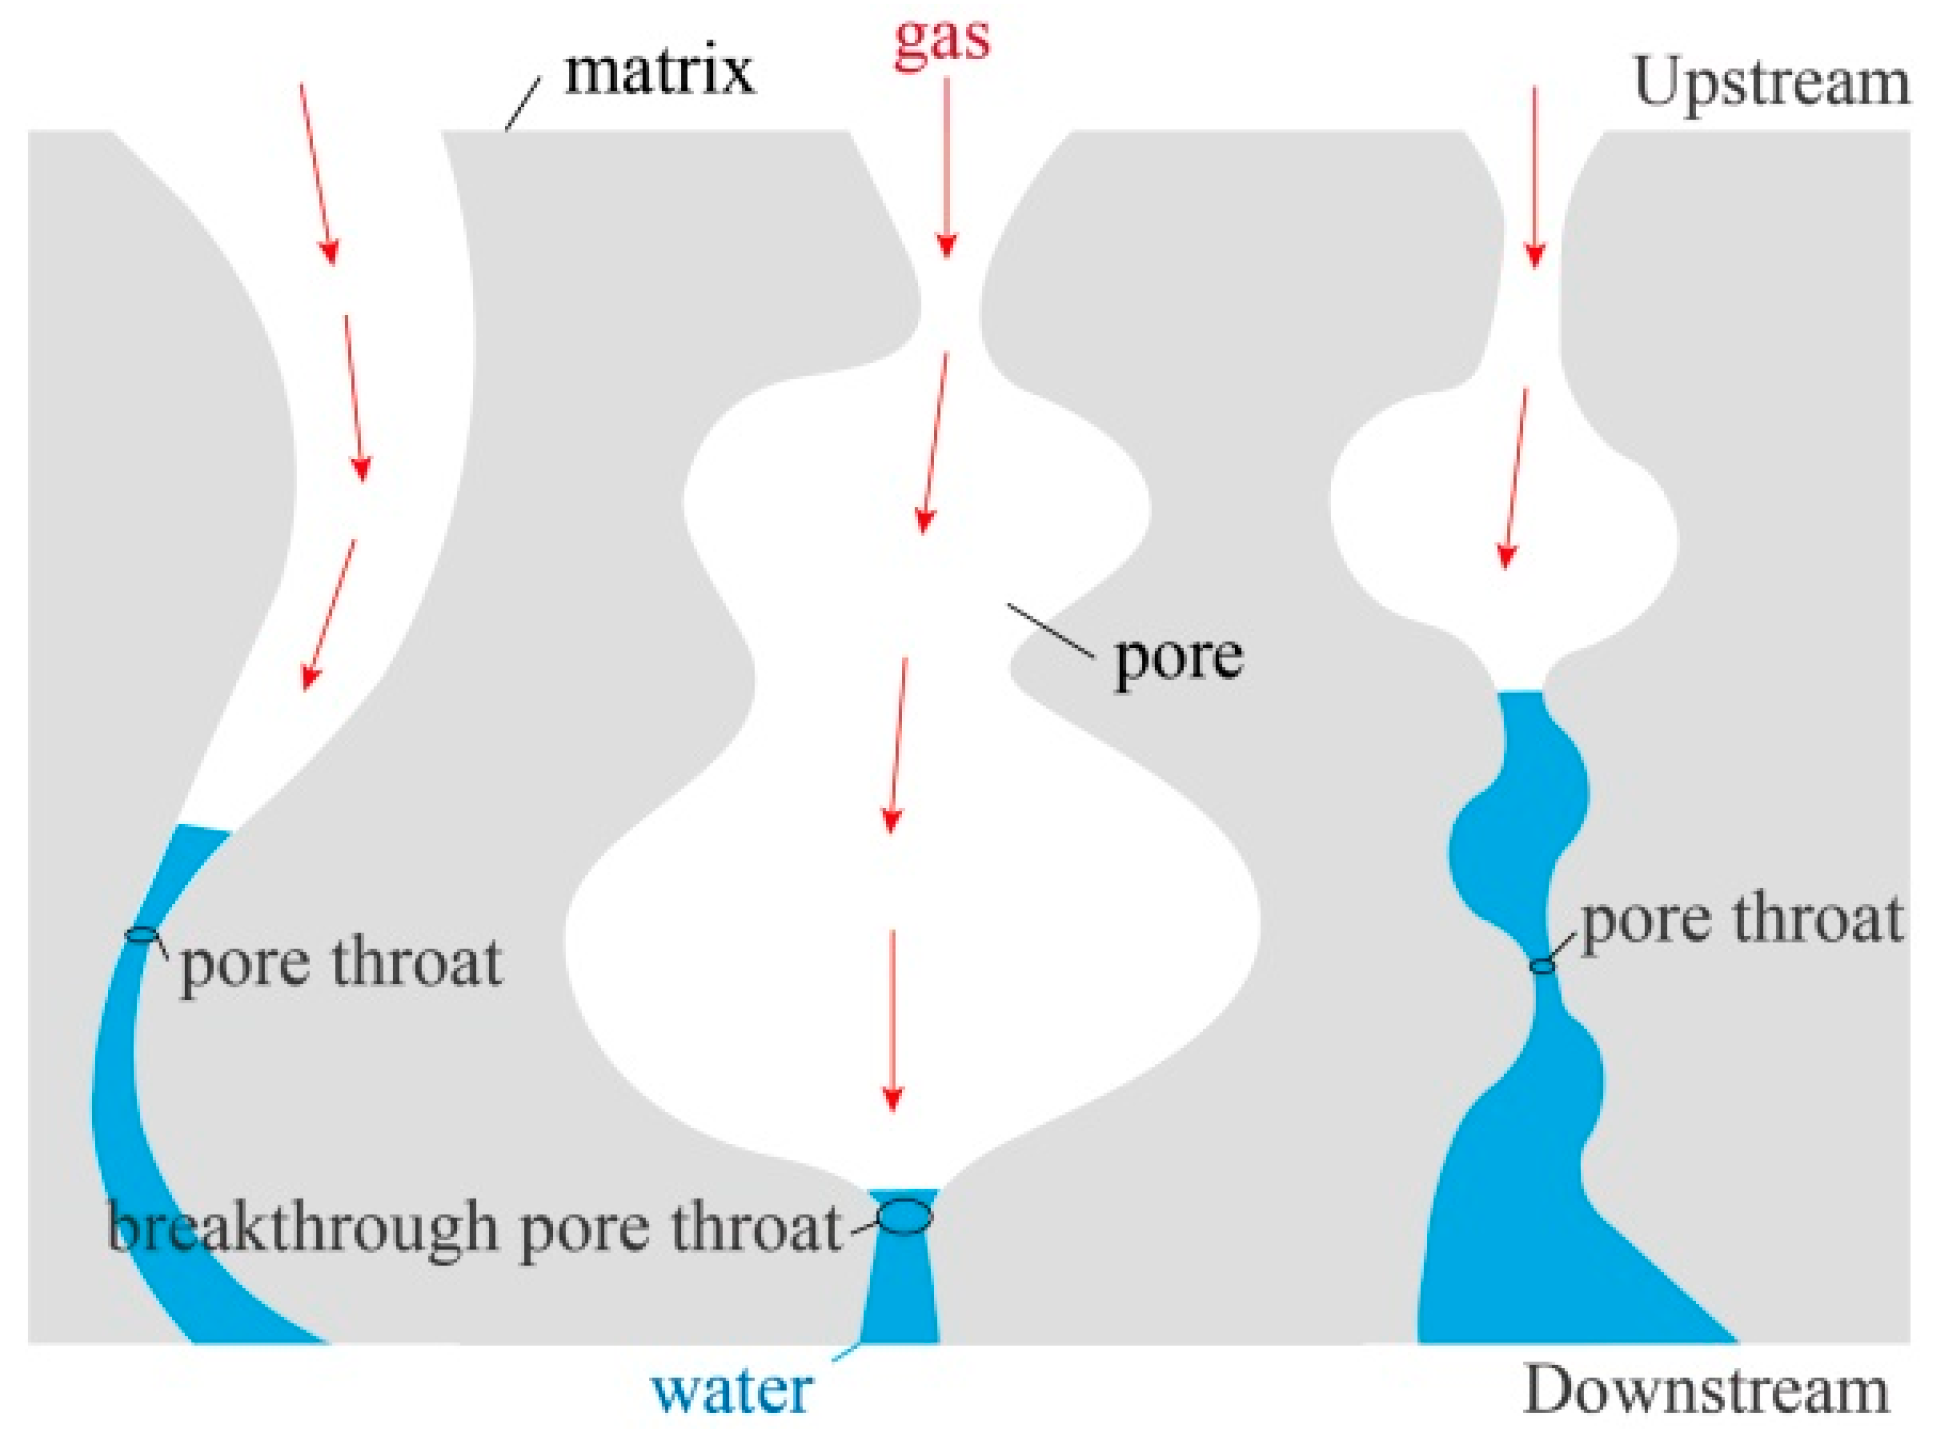
From a microscopic point of view, the gas will invade the large pores with low capillary resistances first and then the small pore as the gas pressure increases. This means that the gas migration is limited to the preferential pathways, which consist of the largest interconnected pores between the upstream side and the downstream side of the sample. In particular, these pathways offer the least capillary resistance that has to be overcome. Thus, the gas breakthrough pressure can be defined as the lowest applied gas pressure at which the pore water in the preferential pathways is completely displaced from the porous network [46]. It depends on the size of the breakthrough pore throat. As is illustrated in Figure 12, three interconnected pathways exist in the pore space, and the gas breakthrough pressure is determined by the pore throat in the middle pathway, which is the largest and possesses the minimum capillary resistance that needs to be overcome. Furthermore, if the gas pressure continues to increase after breakthrough occurs, additional connected pores will participate in the network of the pathway, and consequently, the water saturation degree of the medium will decrease.

4.2. Numerical Calculation Scenario for Simulation of the Gas Breakthrough Pressure

The first step is to extract the interconnected pathways between the upstream and downstream sides, which are the basis for fluid migration. As is shown in Figure 13, the initial image I 1 is subjected to GR operations that start from the upstream and downstream sides. Following this, the Boolean intersection is able to provide image I2, which is the extracted interconnected pathways. This process can be expressed as follows:
I 2 = G R u p s t r e a m ( I 1 ) G R d o w n s t r e a m ( I 1 ) .
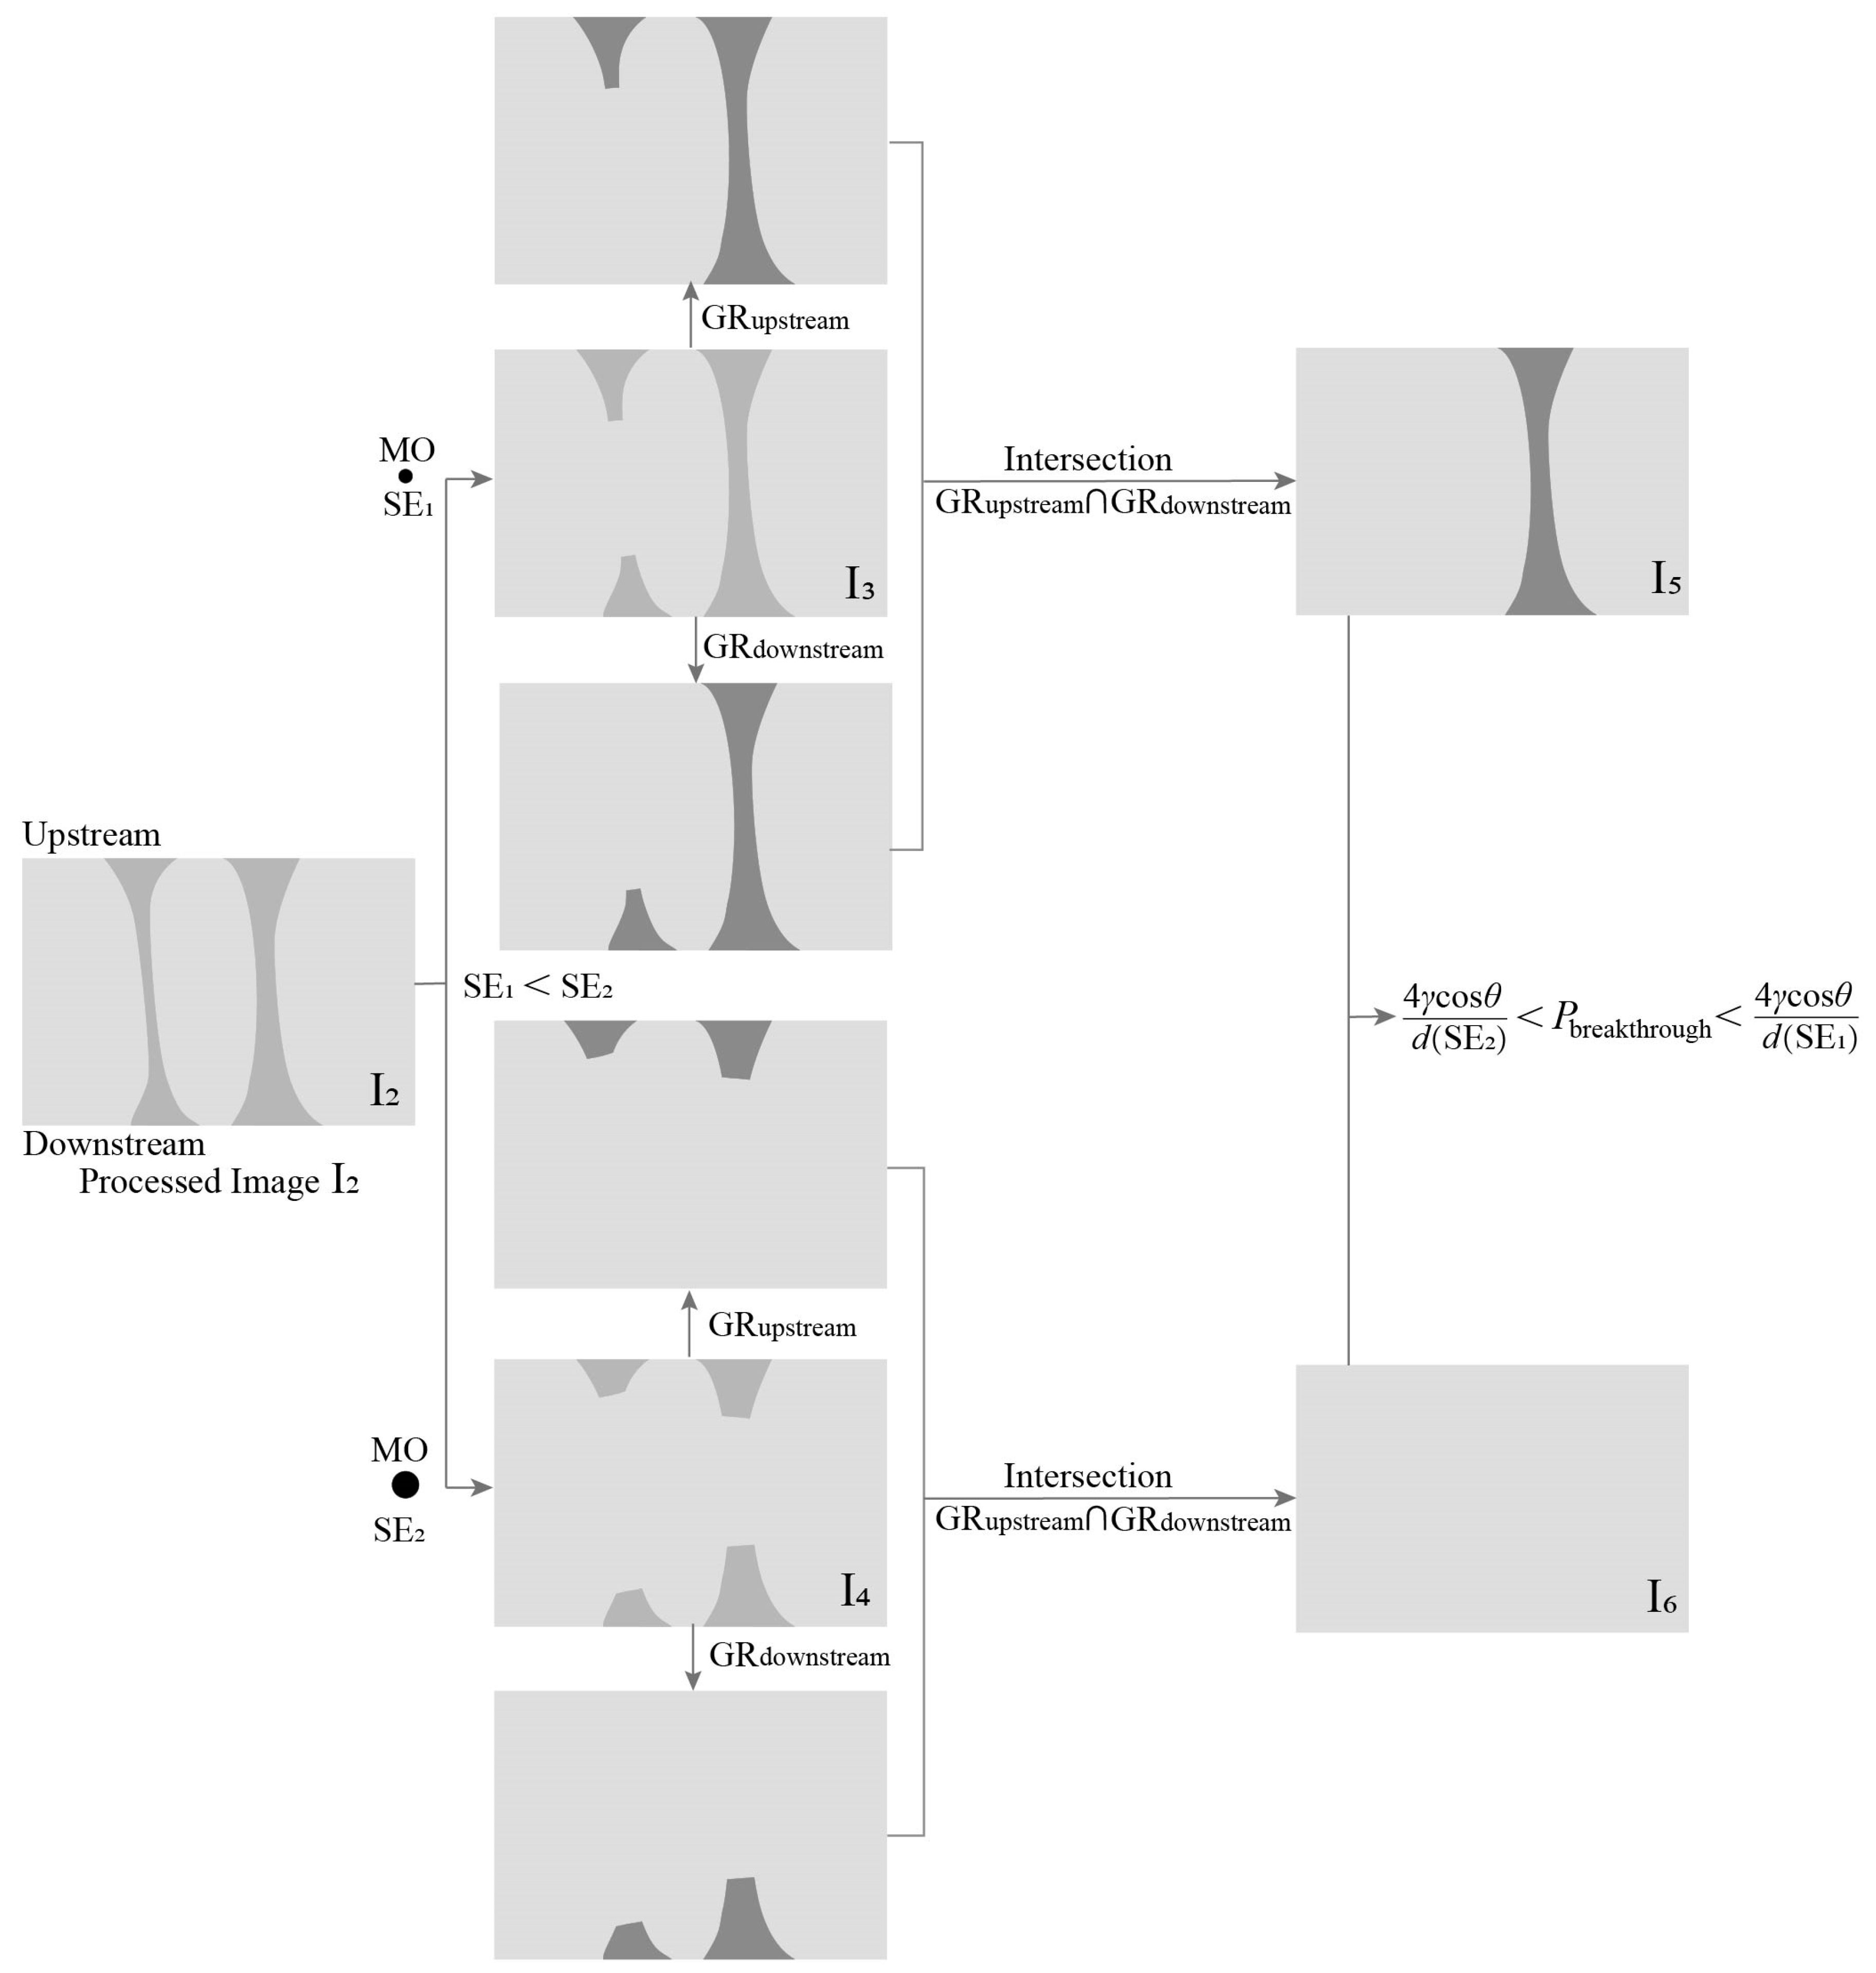
The second step is to determine the breakthrough pressure. As was previously mentioned, a simple two-phase flow hypothesis, which only takes into account the capillary effect, can be considered as a process of searching for the boundary-connected pathways within the largest pore radius and the corresponding lowest capillary resistance. As is illustrated in Figure 14, the MO operation is performed using two SEs on image I 2 , which was obtained from the step one. Since S E 1 < S E 2 , more pores are erased by the MO operation using S E 2 . Thus, less pores can be invaded under a lower gas pressure of 4 γ c o s θ / d ( S E 2 ) . Following this, the intersection of the GR operations from the upstream and downstream sides reveals that no interconnected gas transfer path exists. For S E 1 , which indicates that a higher gas pressure of 4 γ c o s θ / d ( S E 1 ) is applied, the gas invasion is more significant, and the interconnected gas transfer path is finally obtained. The simulation process is to search for the S E 1 and S E 2 that correspond to the first appearance of the interconnected gas transfer path, and the breakthrough pressure obtained is between 4 γ c o s θ / d ( S E 2 ) and 4 γ c o s θ / d ( S E 1 ) . Obviously, the denser the grid is, the closer S E 1 is to S E 2 , and a more accurate breakthrough pressure can be obtained. However, the computer performance requirements will also increase. These operations can be computed as follows:
I 3 = M O I 2 S E 1 ,
I 4 = M O I 2 S E 2 ,
I 5 = G R u p s t r e a m I 3 G R d o w n s t r e a m I 3 0 ,
I 6 = G R u p s t r e a m I 4 G R d o w n s t r e a m I 4 = 0 ,
4 γ c o s θ d ( S E 2 ) < P b r e a k t h r o u g h < 4 γ c o s θ d ( S E 1 ) .

4.3. Results and Discussion

4.3.1. Boom Clay and COx Argillite

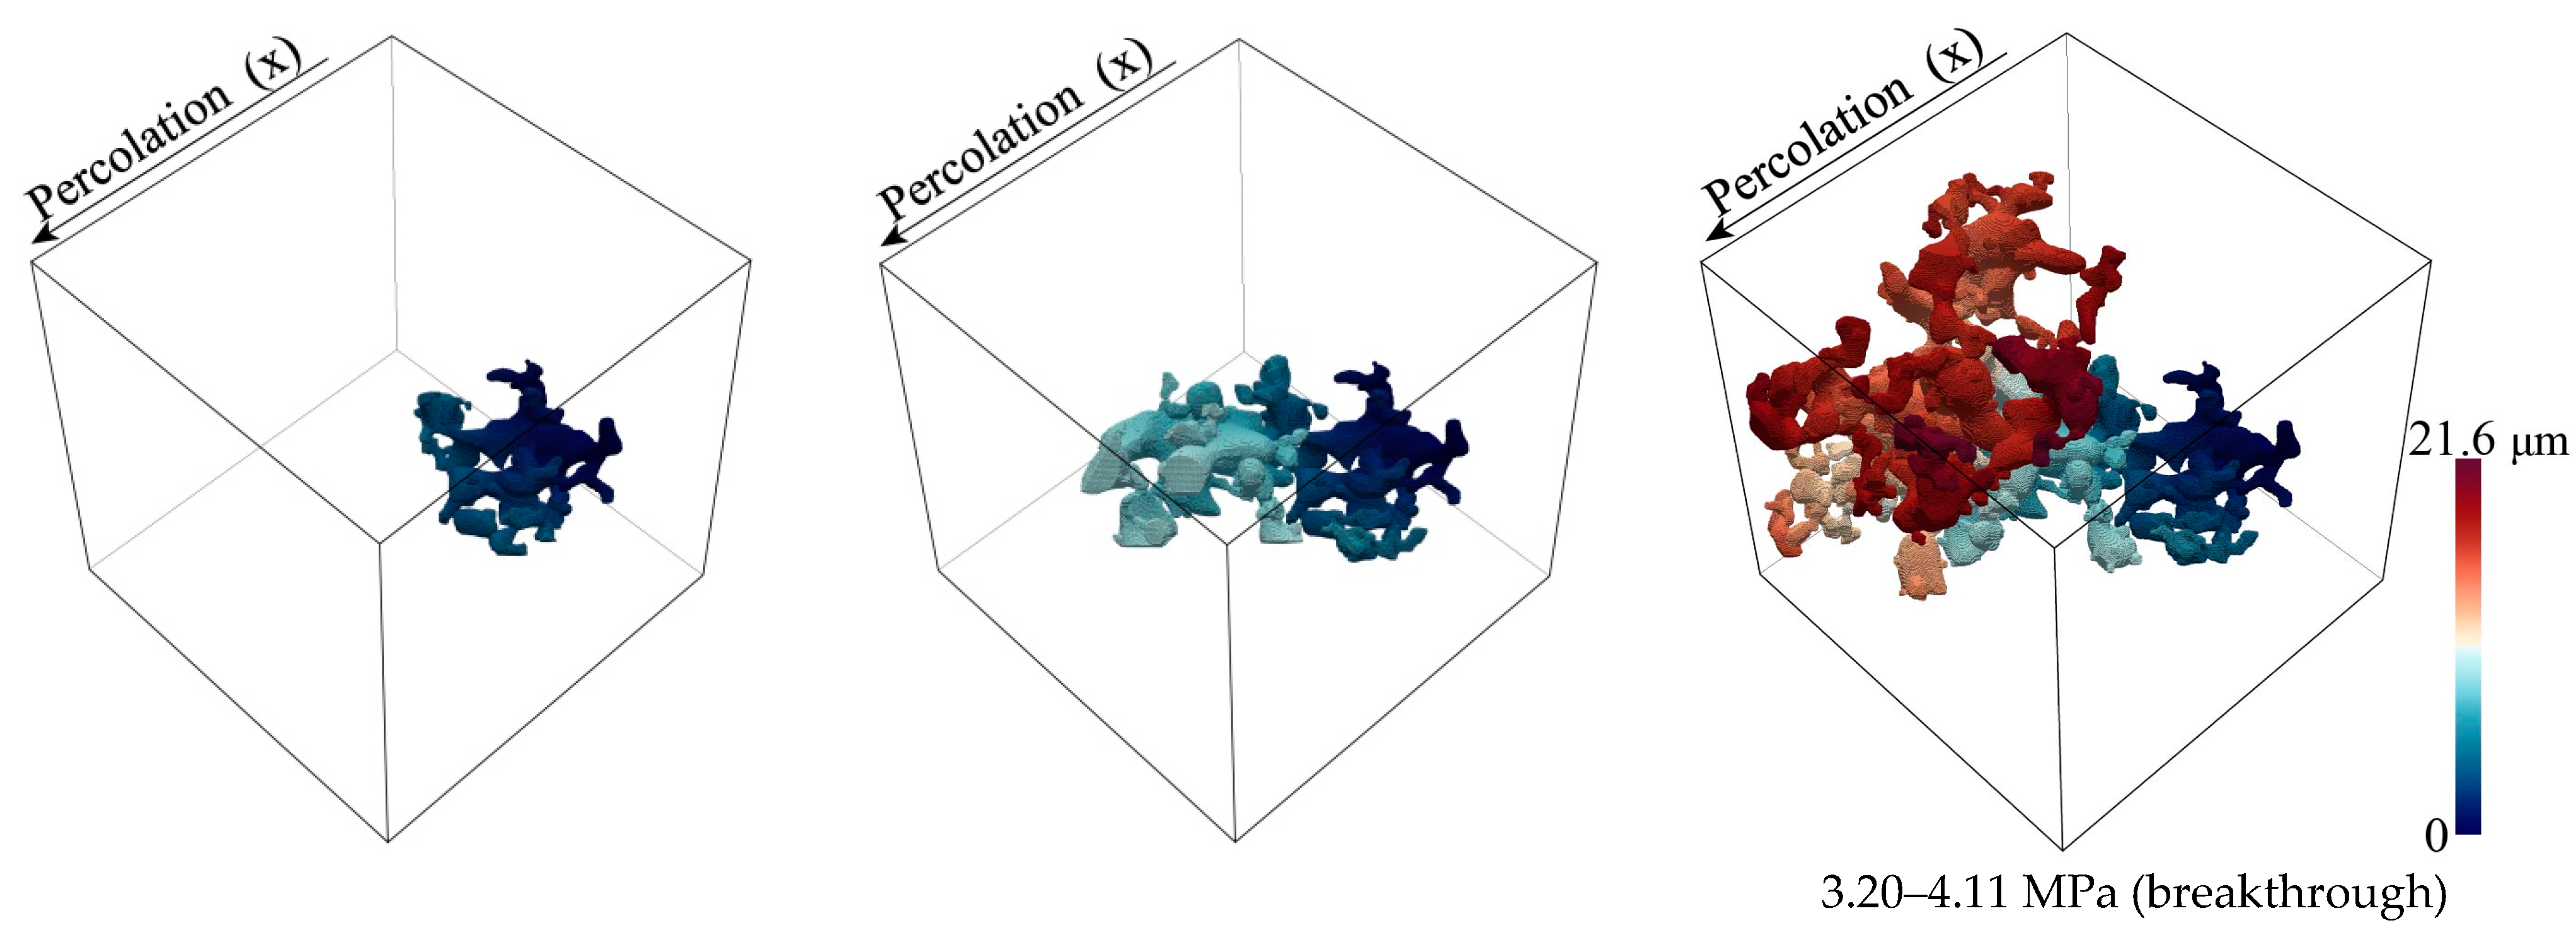
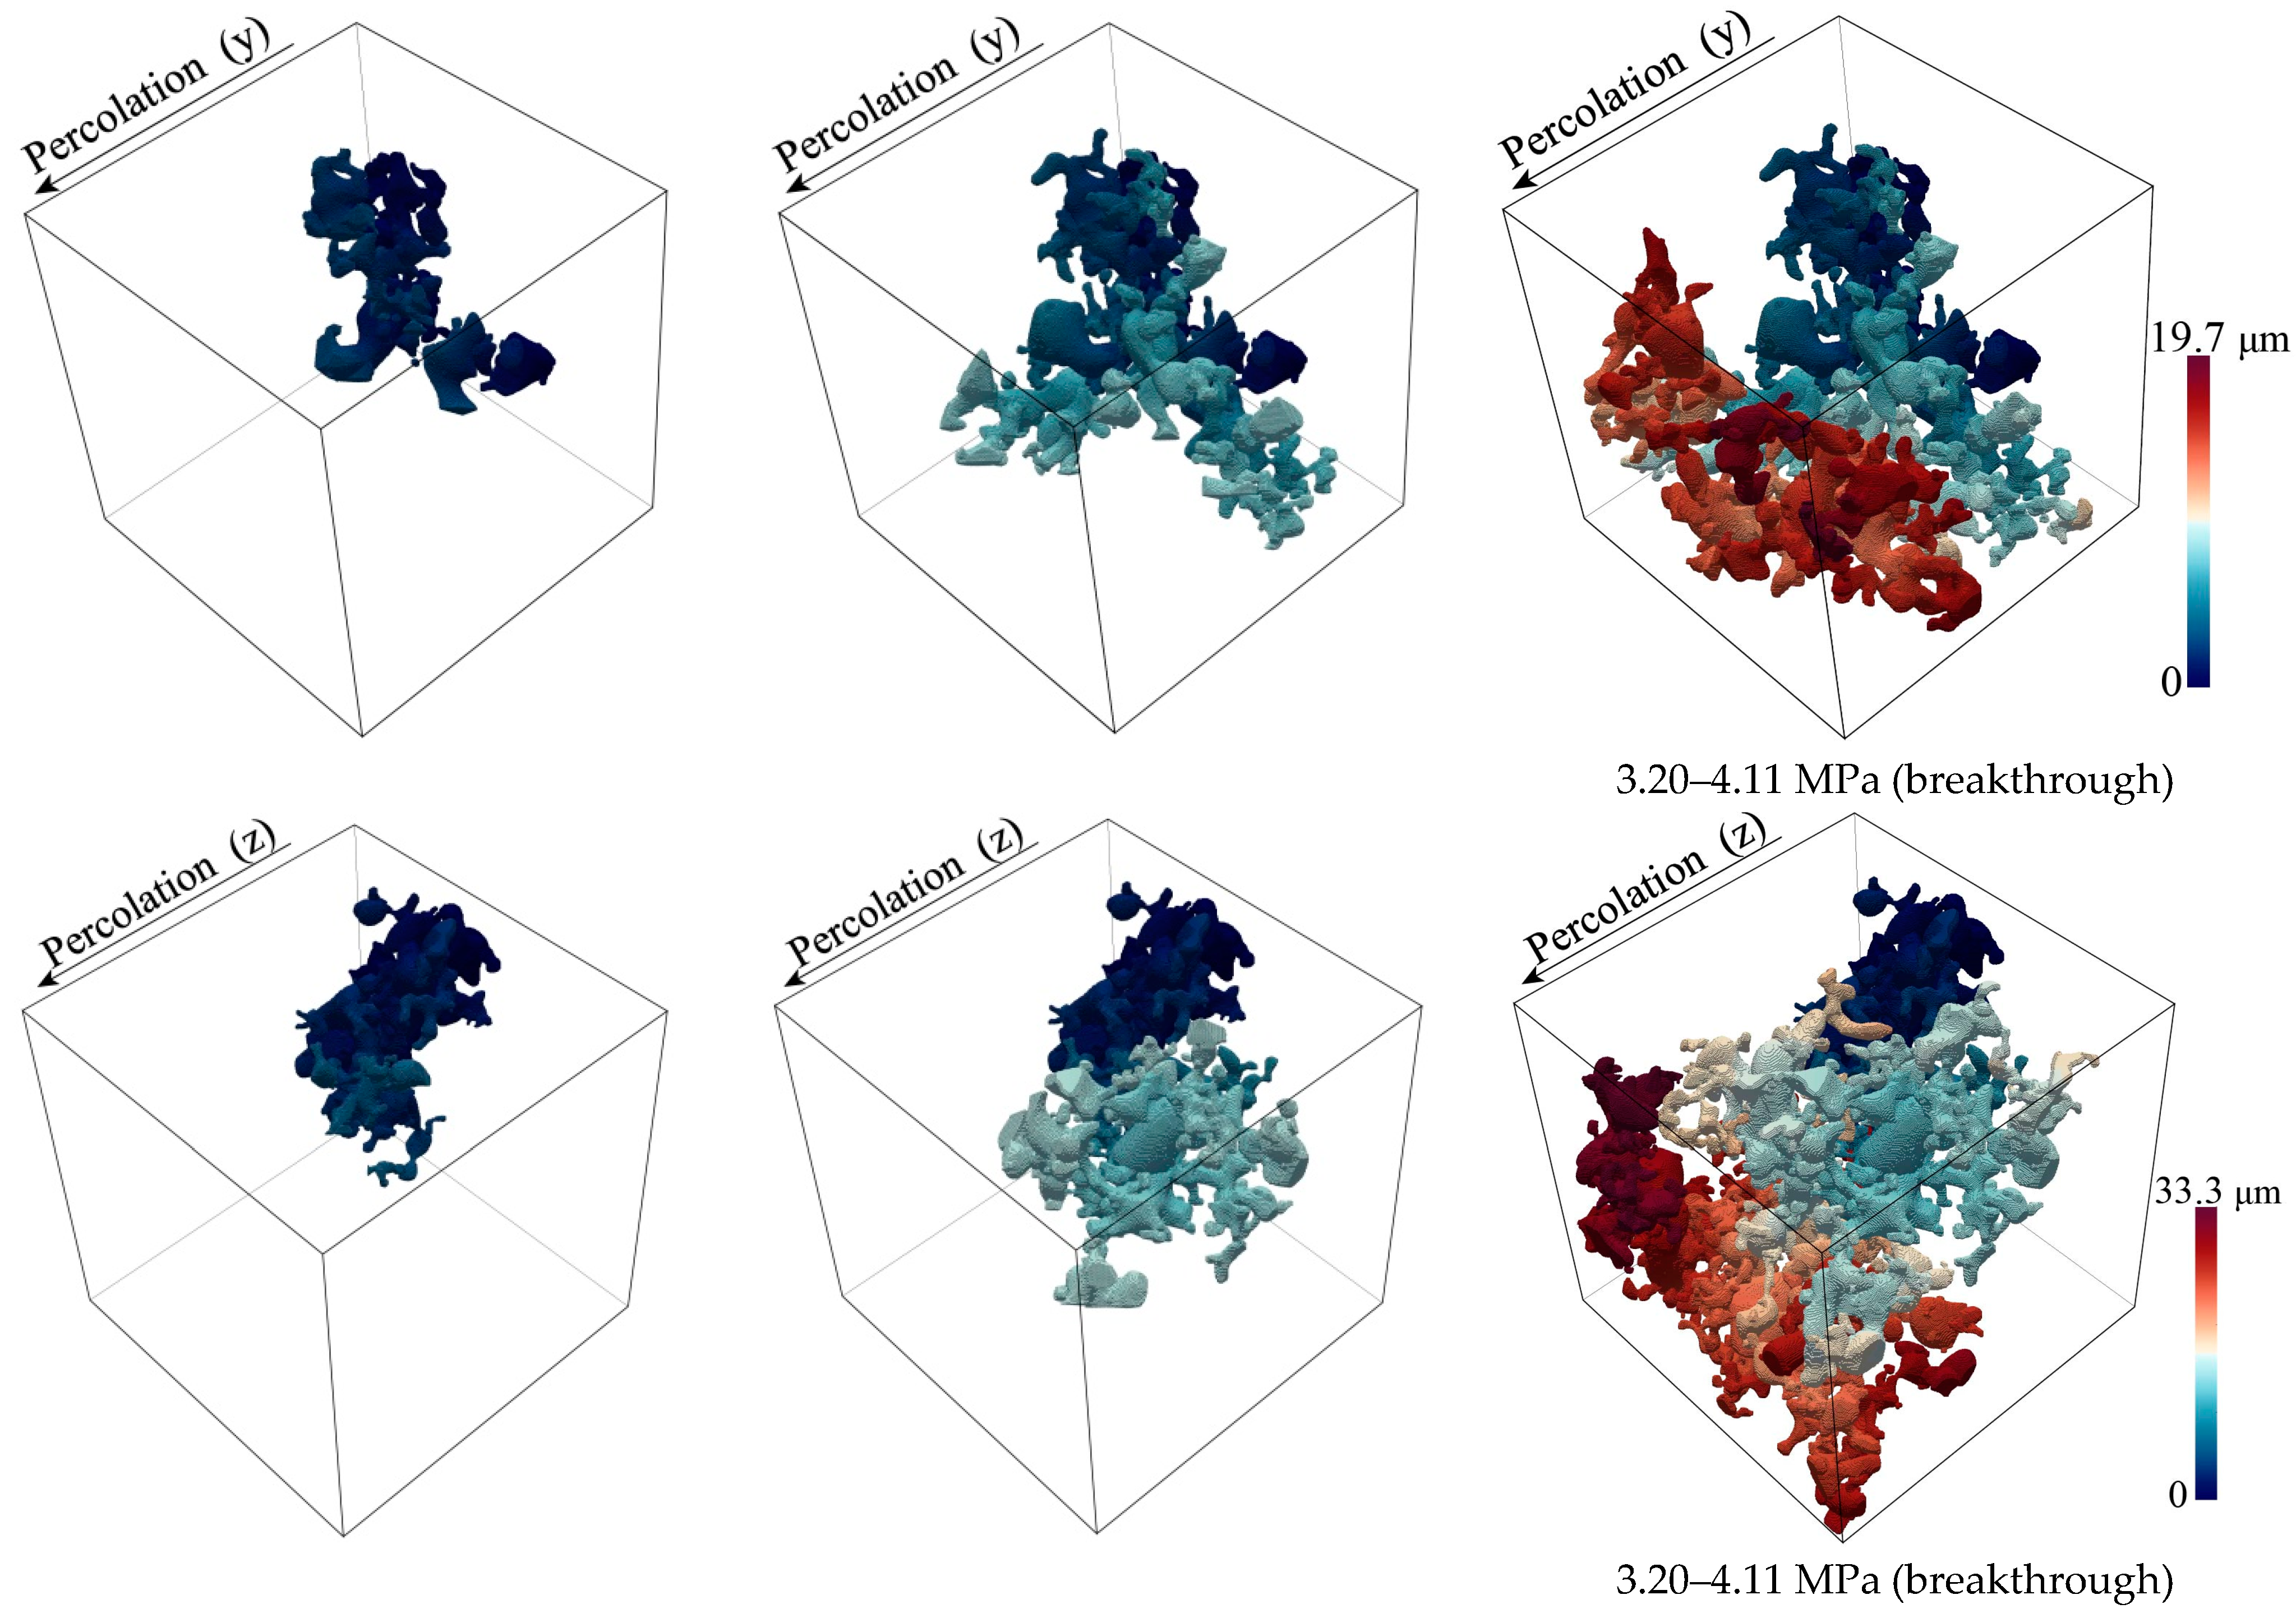
By performing the previously described numerical calculation scenario on the generated models, the S E 1 and S E 2 were determined to be 0.07 μm and 0.09 μm for the Boom clay, which lead to a breakthrough pressure of 3.20 MPa to 4.11 MPa. Lima et al. [32] and Le et al. [47] conducted gas injection tests, and they estimated that the gas entry pressure (equals to the breakthrough pressure in this study) is about 5 MPa.
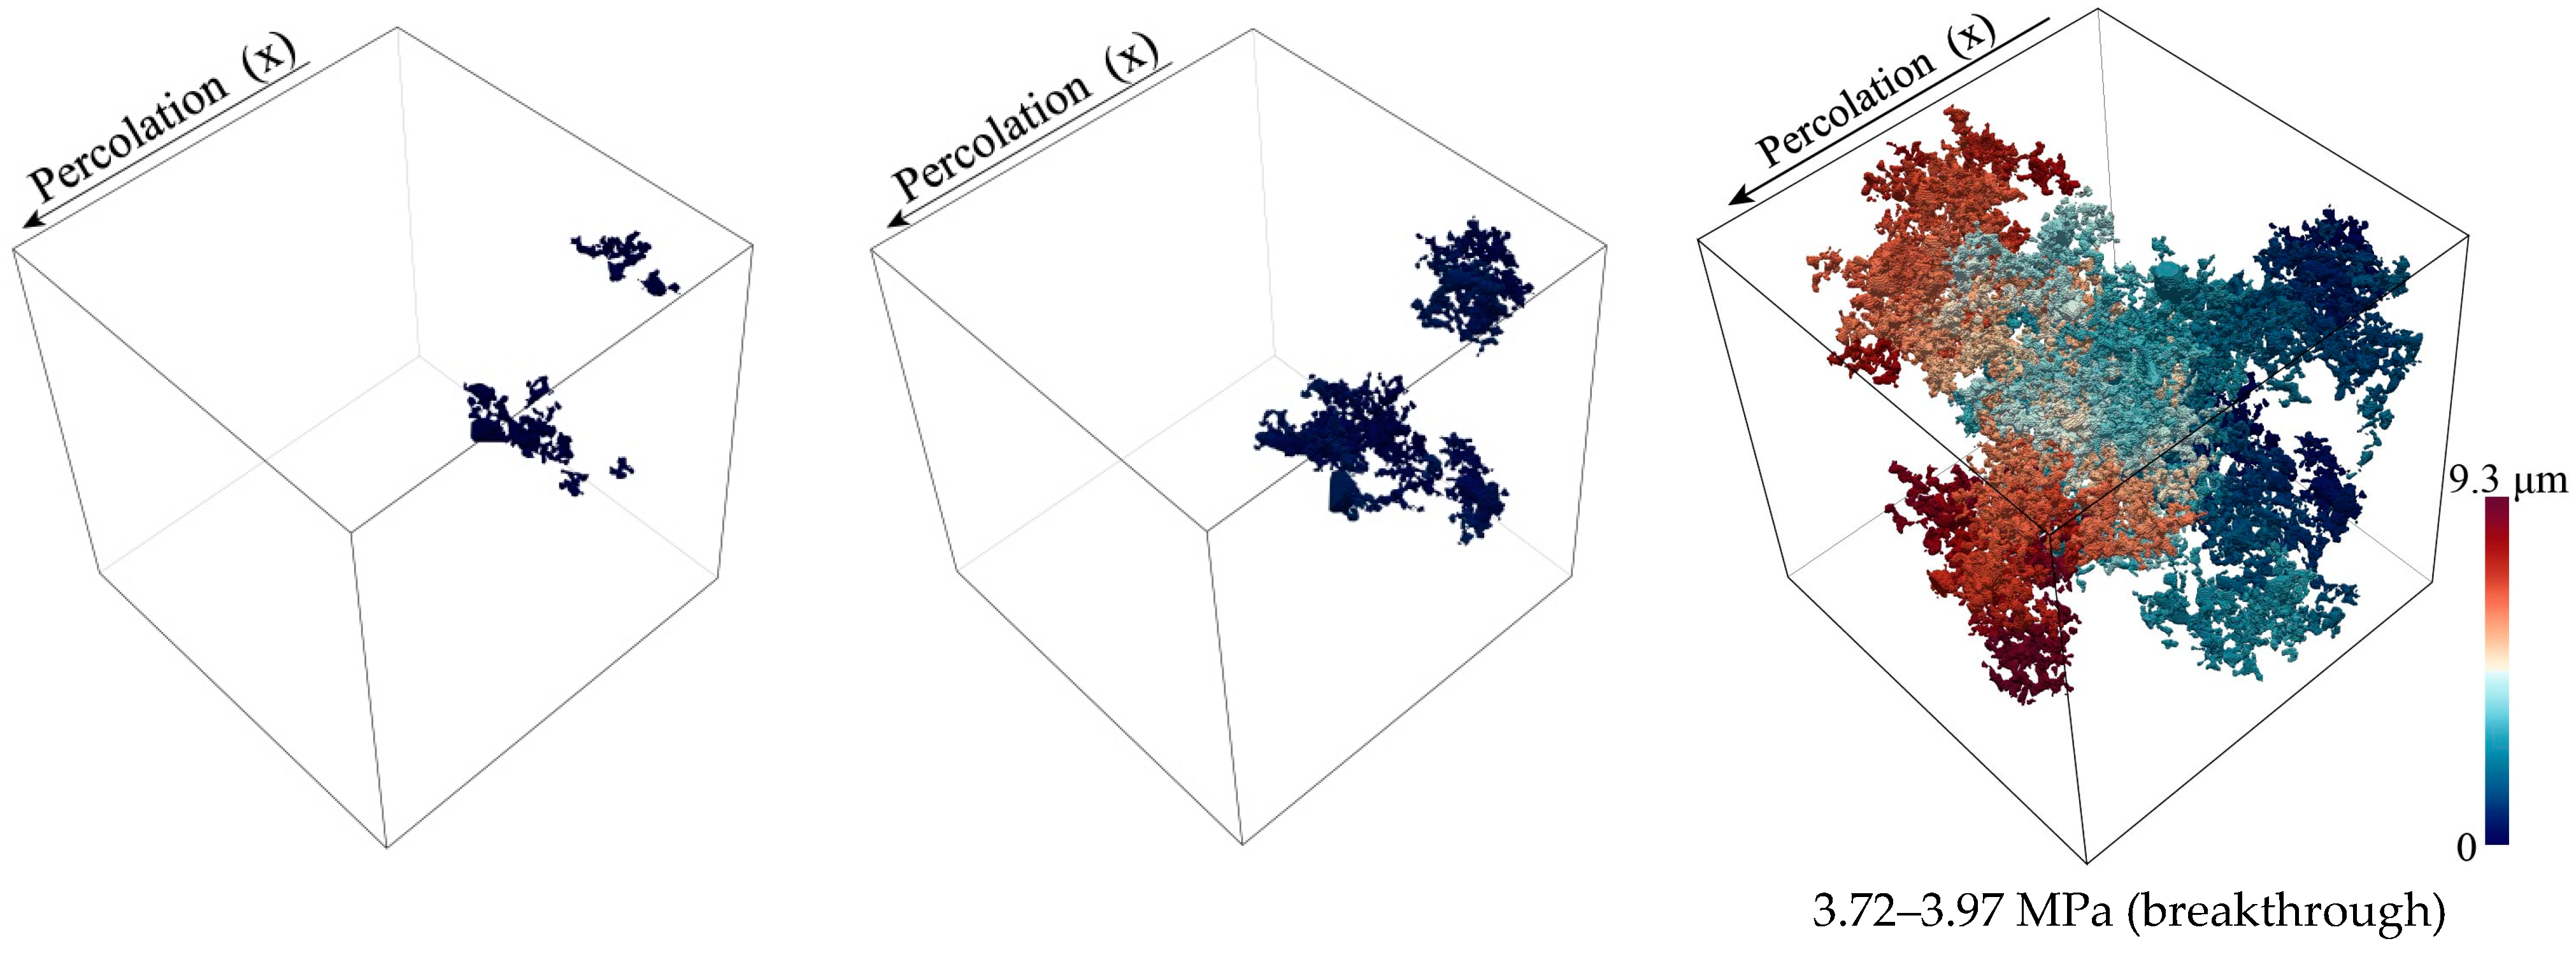
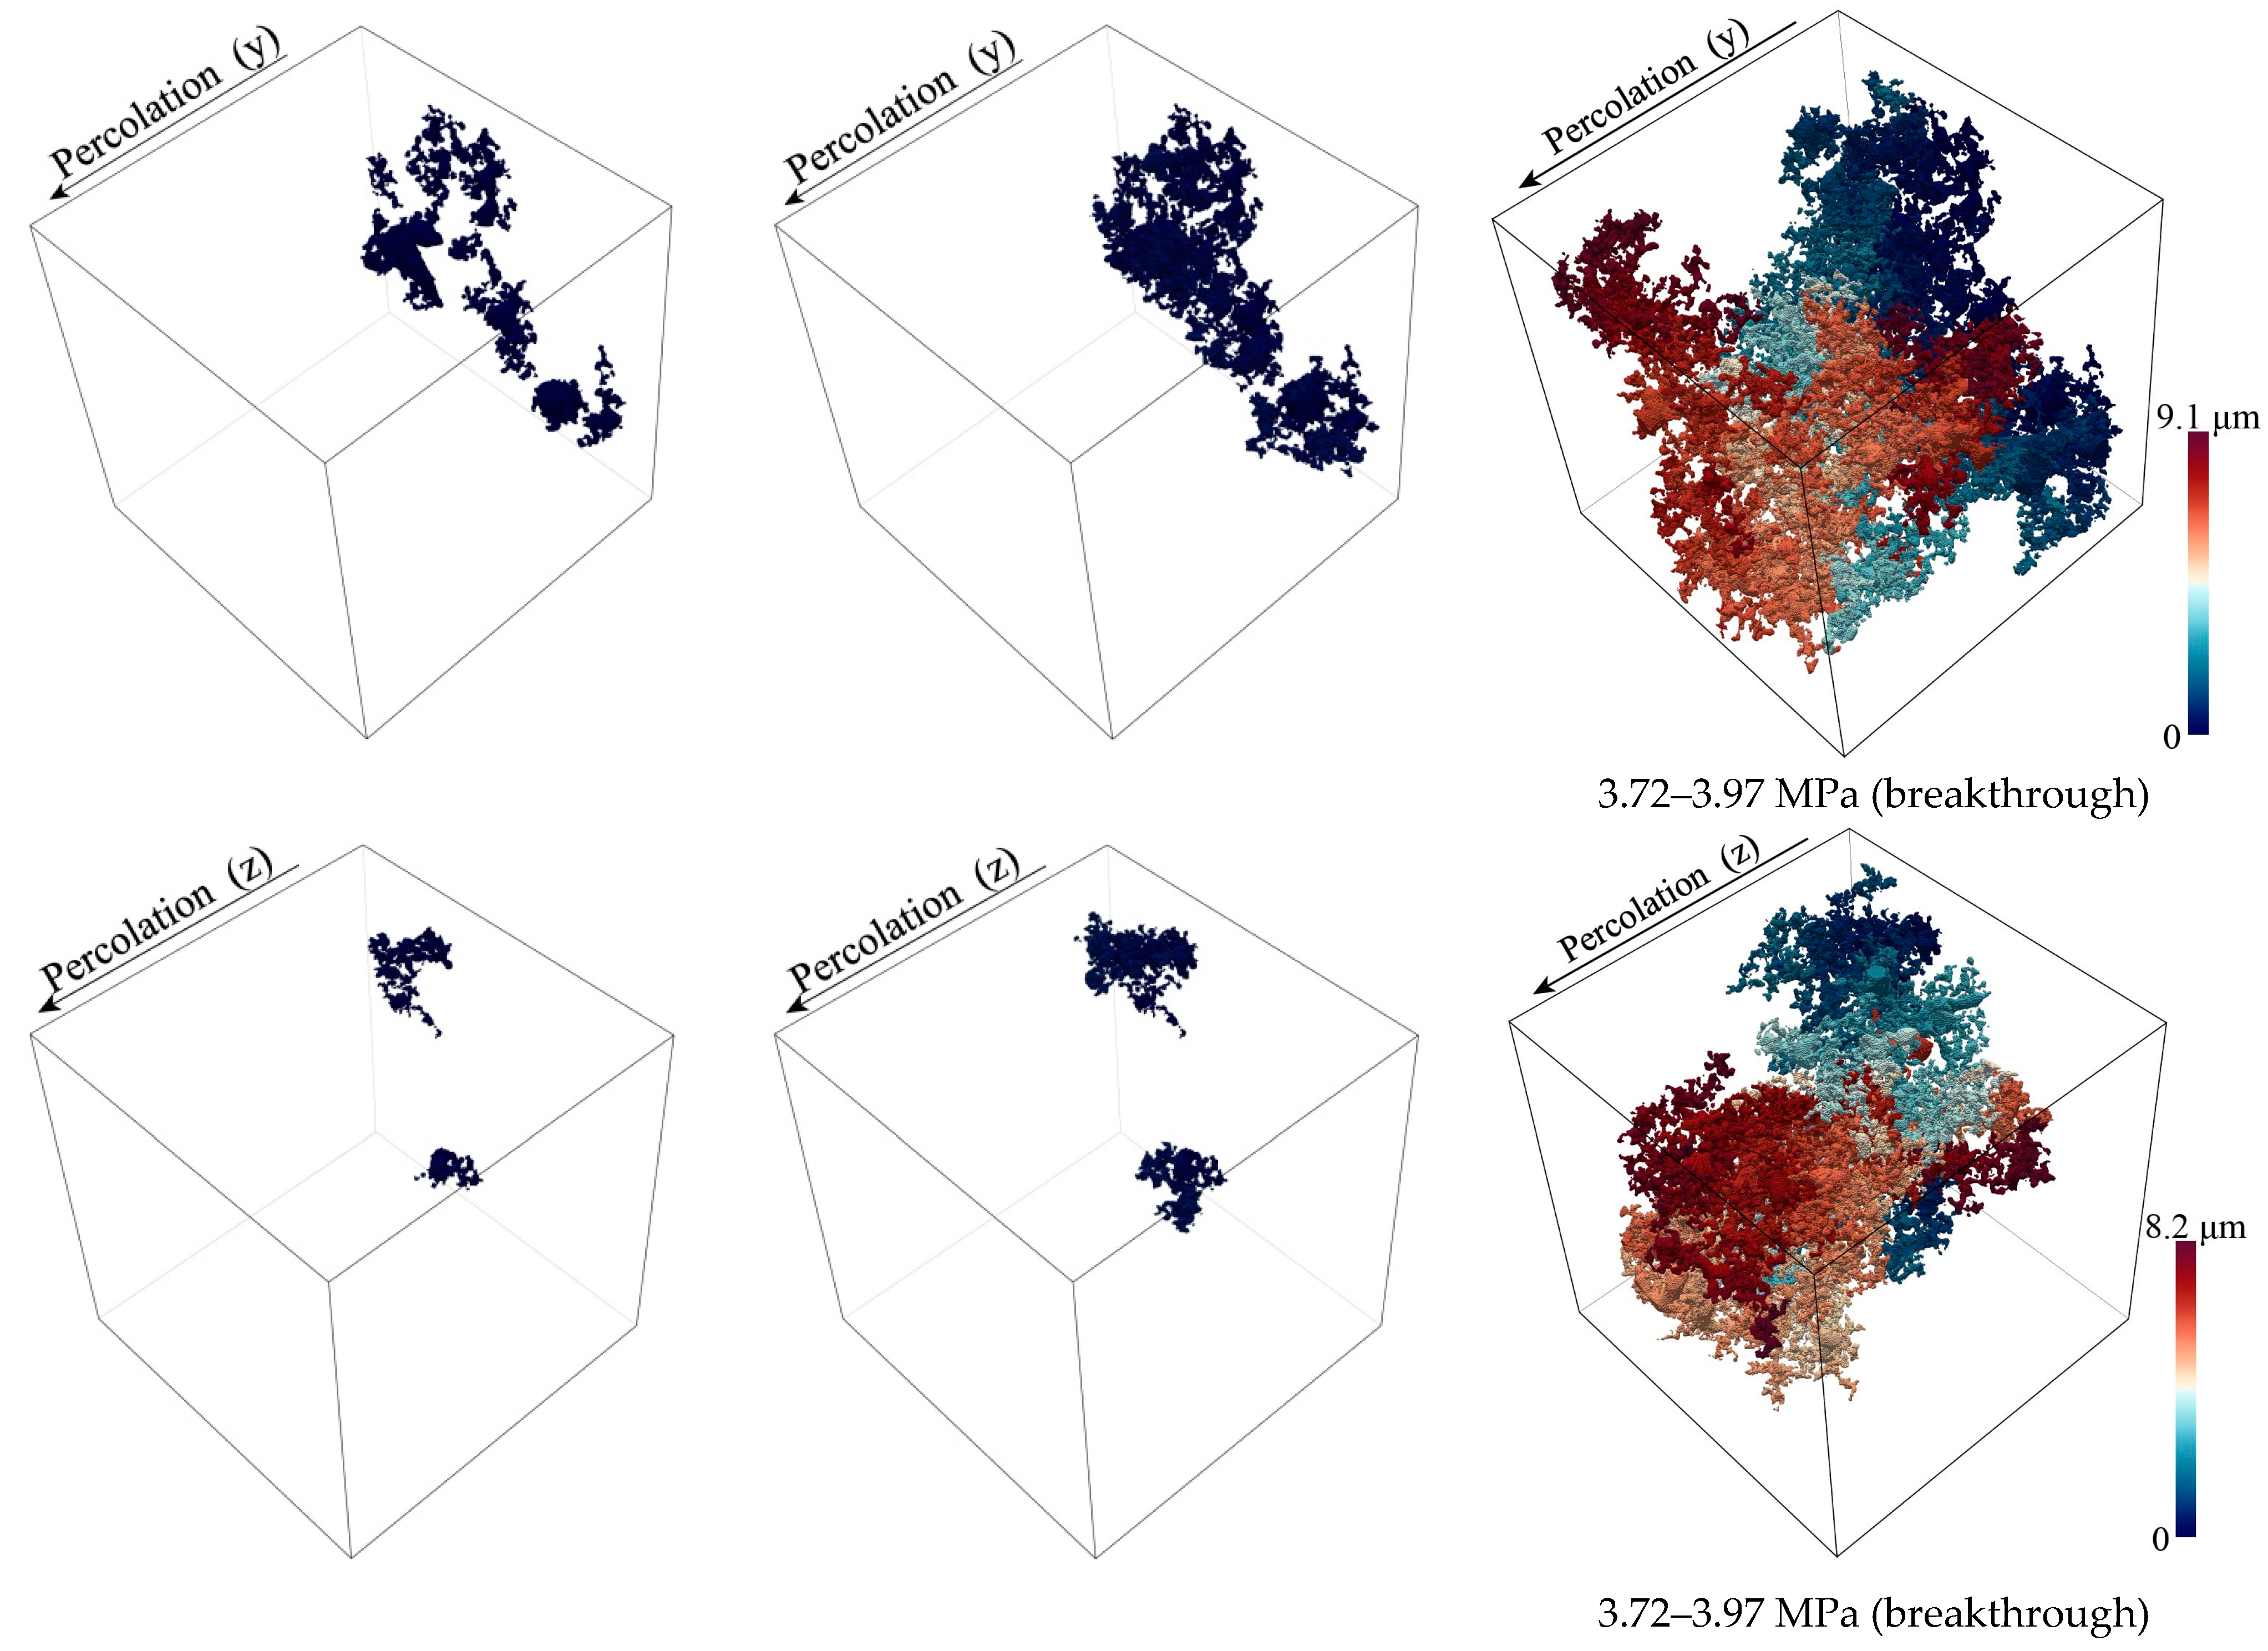
For the COx argillite, the S E 1 and S E 2 were determined to be 0.0725 μm and 0.0775 μm, respectively, and the obtained breakthrough pressure was between 3.72 MPa and 3.97 MPa. In the experiment conducted by Duveau et al. [48], an initially saturated thin plate of COx argillite was placed between two porous steel disks in a triaxial cell, and the upstream side was subjected to a slowly increasing gas pressure. The breakthrough pressure was measured by accurately detecting the “gas bubble” presence on the downstream side. However, this method of gas detection does not ensure whether the gas actually passes through the porous medium via diffusion of the dissolved gas or by capillarity. Thus, the results indicate that the gas breakthrough pressure ranges from 1.26 MPa to 3 MPa. The principal results of Andra [49] show that, for a gas pressure of less than 3 MPa, there is no massive gas invasion. When the gas pressure increases to 4–5 MPa, breakthrough occurs.
In order to better understand the characteristics of the gas breakthrough pathways, by counting the number of steps (number of “dilation + intersection”, see Equation (15)) that would be passed by carrying out the GR operation (the size of each step is determined by the size of the SE), the length of the breakthrough path, and the corresponding tortuosity were obtained. The results of the numerical calculations are presented in Table 3 and Table 4. The values of tortuosity reflect the complexity of pore space morphology and the existence of multiple gas breakthrough pathways in Boom Clay and COx argillite. Figure 15 and Figure 16 show the gas migration process with increasing gas pressure in the three axial directions of the Boom clay and COx argillite models.

4.3.2. Statistical Analysis

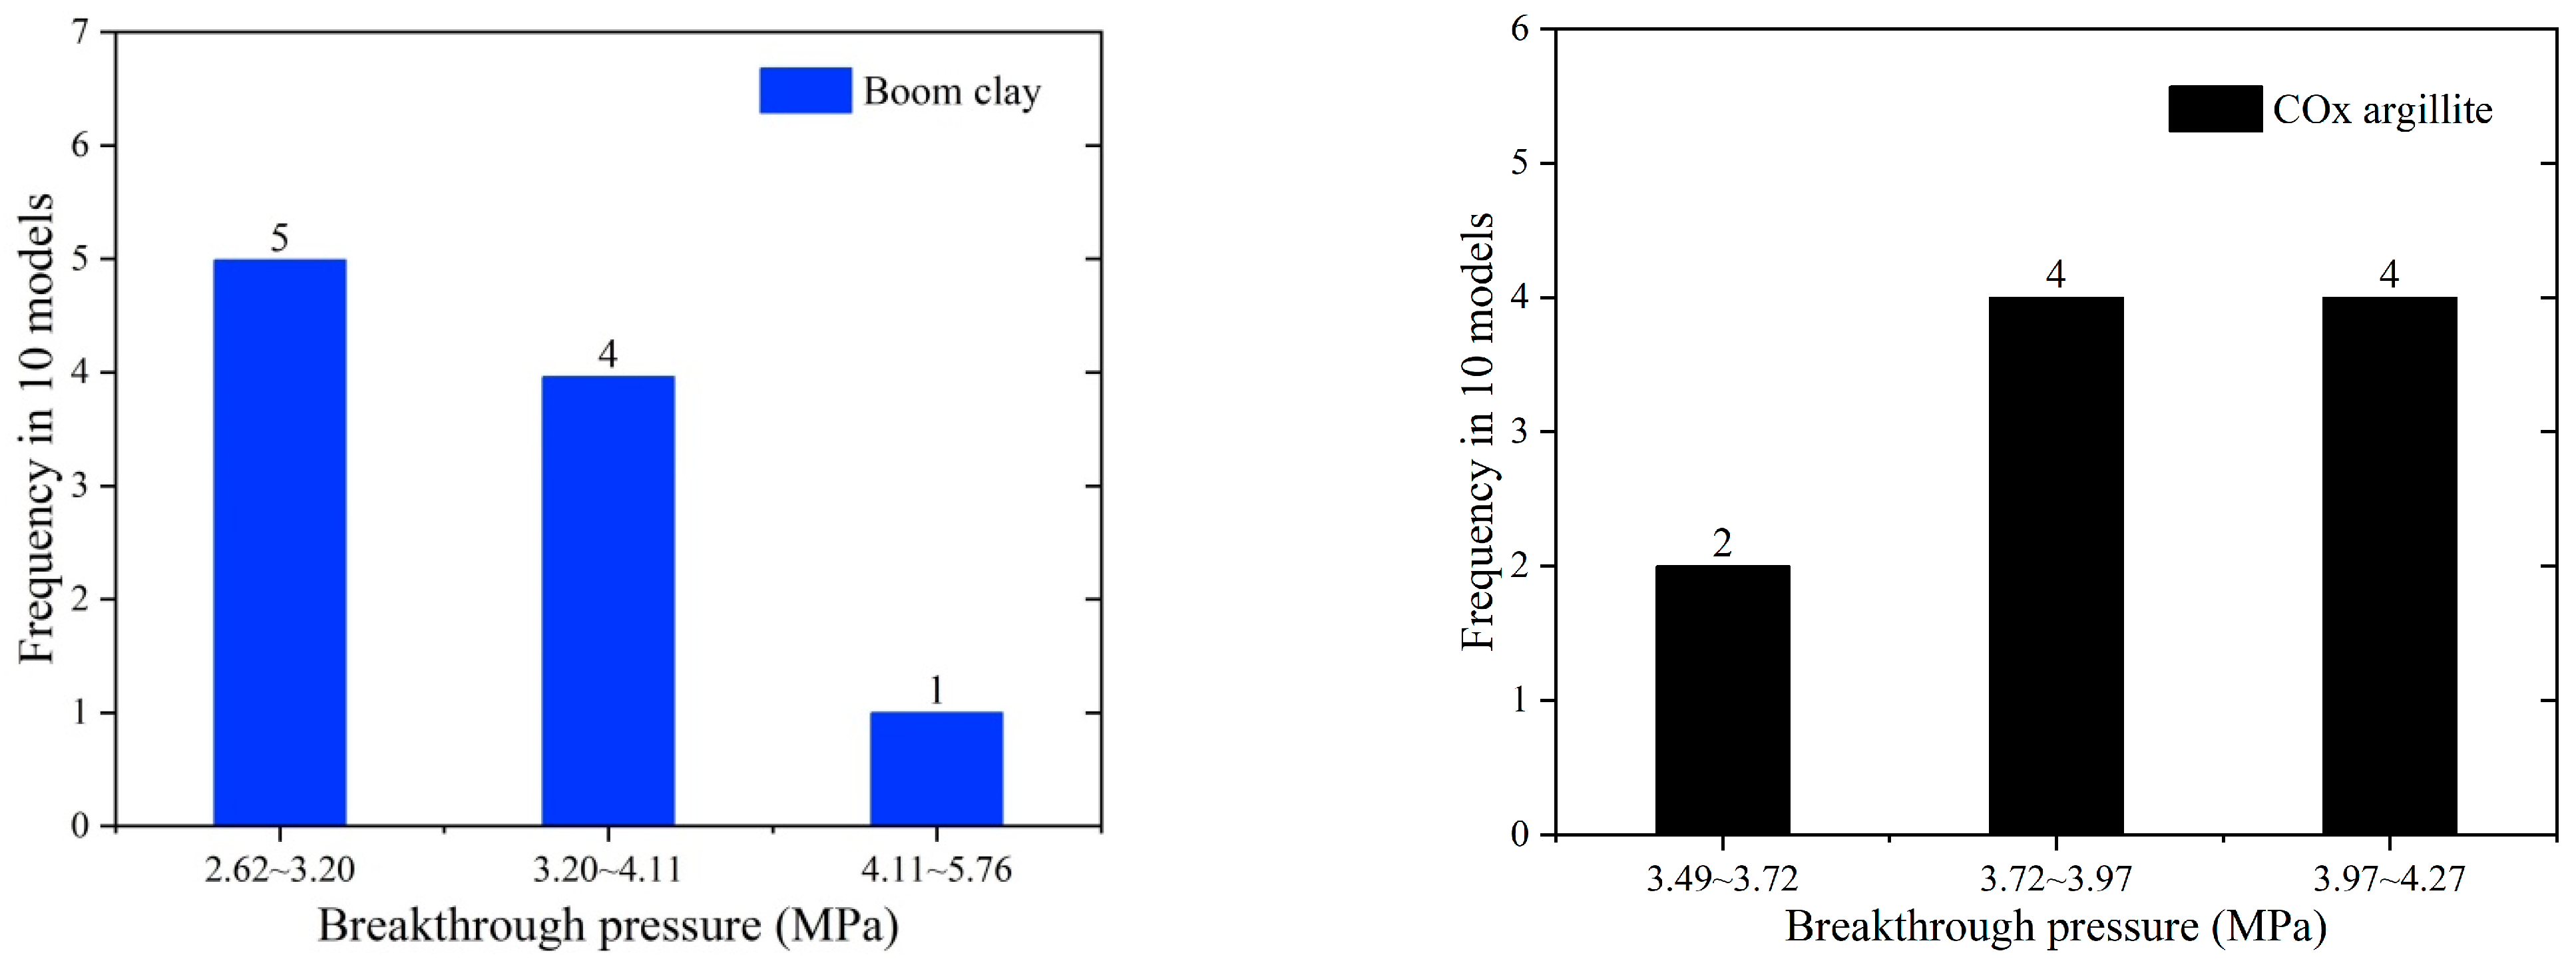
The generation of a random field is a stochastic process. The naturally spatially varying property influences the binarization, thus leading to a randomly shaped porous network. That is, binarization using the same parameters applied in different random fields with the same probabilistic properties can provide different morphological aspects. Following the combination of multiple fields, this difference increases further. In view of this, the interconnectivity and the breakthrough pathway in randomly formed pore network need be investigated, and whether the corresponding breakthrough pressures are within a limited range needs to be verified. Figure 17 shows the results of the statistical analysis of the breakthrough pressure using 10 different realizations with identical parameters for the Boom clay model and COx argillite model.
For the Boom clay model, the breakthrough pressure frequency indicates that five realizations provide results of 2.62–3.20 MPa, four provide results of 3.20–4.11 MPa, and one provides results of 4.11–5.76 MPa. Therefore, the gas breakthrough pressure of the Boom clay is more appropriately defined as 2.62–4.11 MPa.
For the COx argillite model, the breakthrough pressure frequency indicates that two realizations provide results between 3.49–3.72 MPa, four provide results of 3.72–3.97 MPa, and four provide results of 3.97–4.27 MPa. Therefore, the gas breakthrough pressure of the COx argillite is more appropriately defined as 3.72–4.27 MPa.
Moreover, it can be concluded from the statistical analysis that the gas breakthrough pressure in the Boom clay is lower than the value in the COx argillite. This is reasonable, since pores in the Boom clay are slightly larger than those in COx argillite. In addition, the accessible porosity of the COx argillite is relatively lower. Thus, the pore throat in breakthrough pathways of the Boom clay may be larger, and then a lower breakthrough pressure will be obtained.

4.3.3. Opalinus Clay and Beishan Granite

For the Opalinus argillite and Beishan granite, which have open porosities of 12% and 1.8%, the results from 10 realizations indicate that, after achieving the intersection of two GRs beginning with opposite faces in the initial porous models, the pore space interconnectivity cannot be verified. It means that the calculation ends in the first step (Figure 13). The gas phase is not able to traverse the medium without causing any changes to the pore structure. This was also observed in the experimental tests conducted by Hildenbrand et al. [46], and evaluations of measurements of the Opalinus clay yielded an effective permeability that was several orders of magnitude lower than those observed for other Tertiary mudstone and Boom clay samples. The typical capillary-induced breakthrough process did not exist. Thus, the gas cannot leak out via two-phase flow or in the dissolved state in the drained water. If the surrounding rocks are subjected to the constant generation and accumulation of gas and increasing gas pressure, the possible gas expulsion hypothesis is through pathway dilation or the macro fractures within which the porous space can be enlarged, and thus a connected flow path may finally form between the upstream and the downstream sides.
These simulation results validate the conclusion of previous practical experiments on gas breakthrough pressure. They enhance the idea: gas migration and breakthrough are feasible in low-permeability Boom clay and COx argillite following the mechanism of gas–liquid two phase flow at local gas pressure lower than the fracture threshold. For porous material with interconnected pore network for two-phase flow, the presented numerical simulation method can be used to determine the breakthrough pressure in the absence of experimental conditions, or to verify the experimental results. It has the advantages of low cost, short operation time, and experimental reproducibility, and provides a new idea for the investigation of two-phase flow in low-permeability media. Nevertheless, there are still some limitations. A reliable pore size distribution of rock is the basis of model generation. The accuracy of results highly depends on the test method and instrument. Meanwhile, Boom clay and COx argillite are sedimentary indurated clays which are composed of diagenetic bedding planes. A lower gas breakthrough pressure may be obtained when performing gas injection along the bedding plane rather than performing perpendicularly to the bedding plane. The model generation method in this study provides randomly formed pore space in good accordance with the experimental pore size distribution data but is capable of involving some aspect characteristics which are determined during the sedimentation history and diagenetic evolution. Considering this, a real pore space model of rock derived from direct imaging techniques with sufficient voxel size is always a privileged choice. In addition, micro-cracks and pore space changes in excavation damage zone influence the pore structure and will then definitely influence the gas breakthrough pressure. The stress–strain state analysis is not involved in this study; thus, the influence of the local change of pore space is not able to be considered, but it will be the principal research direction in the following work.

5. Conclusions

The gas breakthrough pressure of low-permeability rocks is a critical factor in the geological storage of nuclear waste. It determines the long-term safety and performance of host rock. In this study, the gas transport and breakthrough characteristics of the preferential surrounding rocks of underground nuclear waste repositories, including the Boom clay, the COx argillite, the Opalinus clay, and the Beishan granite, were investigated. The comparison between the model predictions and the experimental results provides in-depth understanding of gas migration and breakthrough in low-permeability rocks. The obtained results are as follows:
  • The binarization on a continuous Gaussian random field is capable of representing different types of porous media by varying the threshold and the correlation length. Based on this idea, 3D pore space models of the four investigated rocks were constructed. These models do not rely on an initial definition of the pore shape and thus possess randomly formed pore space morphologies. The pore size distribution was verified through geometrical analysis using the mathematical morphology method.
  • In order for the surrounding rock to not be damaged under a continuously increasing gas pressure, the gas breakthrough must occur following the two-phase gas–liquid flow. Considering this, a numerical calculation scenario based on the Young–Laplace equation and the mathematical morphology image processing method was proposed and applied to the four rock models generated in this study. Important factors related to gas transfer and breakthrough, such as the interconnected transfer path, the values of S E 1 and S E 2 , and the length and tortuosity of the breakthrough path, were obtained, and then the gas breakthrough pressure was calculated. The results show that the gas breakthrough pressures of the Boom clay and COx argillite are 2.62–4.11 MPa and 3.72–4.27 MPa, respectively, which are close to the experimental values reported in the literature. This supports the idea that capillary-induced gas breakthrough is possible in the Boom clay and COx argillite at gas pressures lower than the fracture threshold. Due to their low porosities, no connected pathway existed in the generated models for Opalinus clay and Beishan granite. Thus, the gas breakthrough process is more likely to occur through pathway dilation or fractures if the surrounding rocks are confronted with the constant generation and accumulation of gas and increasing gas pressure.
Further improvements to this research could be made by creating a pore space model using the direct imaging techniques, calculating the breakthrough pressure, and then comparing it with the results of this study. The pore space volumetric strain, which varies as a function of the confining pressure and pore pressure according to the effective pressure law and its influence on the breakthrough process, is a possible issue that needs to be investigated in the future.

Author Contributions

Conceptualization, X.Z. and H.Y.; methodology, X.Z., H.Y. and W.Y.; software, X.Z., H.Y. and W.Y.; validation, X.Z. and H.Y.; formal analysis, X.Z., H.Y. and Z.L.; investigation, X.Z. and H.Y.; resources, X.Z.; data curation, X.Z. and H.Y.; writing—original draft, X.Z. and H.Y.; writing—review and editing, W.Y., Z.L. and J.Q.; visualization, X.Z. and H.Y.; supervision, X.Z., H.Y., W.Y., Z.L. and J.Q.; project administration, X.Z. and H.Y.; funding acquisition, X.Z. and H.Y. All authors have read and agreed to the published version of the manuscript.

Funding

This research was funded by the Applied Basic Research Foundation of Yunnan Province, China, Grant No. 2019FD125, and the Postgraduate Research and Innovation Foundation of Yunnan University, Grant No. 2021Y287.

Data Availability Statement

The data that support the findings of this study are available from the corresponding author upon reasonable request.

Acknowledgments

The authors wish to express their appreciation to the reviewers for their helpful suggestions. The authors also are deeply thankful for the support and contribution from journal editors.

Conflicts of Interest

The authors declare no conflict of interest.

References

  1. Su, K.; Patrick, L. Andra’s feasibility study on deep geological disposal of high-level long-lived radioactive waste. Chin. J. Rock Mech. Eng. 2006, 25, 813–824. [Google Scholar]
  2. Chen, W.Z.; Lei, J.; Yu, H.D. A review of self-sealing characteristics of clay rocks under coupled thermo-hydro-mechanical conditions. Chin. J. Rock Mech. Eng. 2019, 38, 1729–1746. [Google Scholar]
  3. Wang, J.; Xu, G.Q.; Jin, Y.X. On the surrounding rock of high-level radioactive waste geological repository. World Nucl. Geosci. 2006, 23, 222–231. [Google Scholar]
  4. Frederickx, L.; Honty, M.; de Craen, M.; Dohrmann, R.; Elsen, J. Relating the Cation Exchange Properties of the Boom Clay (Belgium) to Mineralogy and Pore-Water Chemistry. Clays Clay Miner. 2018, 66, 449–465. [Google Scholar] [CrossRef]
  5. Conil, N.; Talandier, J.; Djizanne, H.; de La Vaissière, R.; Righini-Waz, C.; Auvray, C.; Morlot, C.; Armand, G. How rock samples can be representative of in situ condition: A case study of Callovo-Oxfordian claystones. J. Rock Mech. Geotech. Eng. 2018, 10, 613–623. [Google Scholar] [CrossRef]
  6. Zhang, F.; Cui, Y.-J.; Conil, N.; Talandier, J. Assessment of Swelling Pressure Determination Methods with Intact Callovo-Oxfordian Claystone. Rock Mech. Rock Eng. 2019, 53, 1879–1888. [Google Scholar] [CrossRef]
  7. Lauper, B.; Jaeggi, D.; Deplazes, G.; Foubert, A. Multi-proxy facies analysis of the Opalinus Clay and depositional implications (Mont Terri rock laboratory, Switzerland). Swiss J. Geosci. 2018, 111, 383–398. [Google Scholar] [CrossRef] [Green Version]
  8. Kneuker, T.; Furche, M. Capturing the structural and compositional variability of Opalinus Clay: Constraints from multidisciplinary investigations of Mont Terri drill cores (Switzerland). Environ. Earth Sci. 2021, 80, 421. [Google Scholar] [CrossRef]
  9. Kiuru, R.; Király, D.; Dabi, G.; Jacobsson, L. Comparison of DFN Modelled Microfracture Systems with Petrophysical Data in Excavation Damaged Zone. Appl. Sci. 2021, 11, 2899. [Google Scholar] [CrossRef]
  10. Wu, Y.; Li, X.-Z.; Huang, Z.; Xue, S. Effect of temperature on physical, mechanical and acoustic emission properties of Beishan granite, Gansu Province, China. Nat. Hazards 2021, 107, 1577–1592. [Google Scholar] [CrossRef]
  11. Wang, Z.H.; Tan, Y.L.; Li, S.M.; Wang, T.Z.; Wu, X.C. Experimental and Numerical Study on Mechanical Properties and Deformation Behavior of Beishan Granite considering Heterogeneity. Adv. Civ. Eng. 2021, 2021, 6622958. [Google Scholar] [CrossRef]
  12. Bonin, B.; Colin, M.; Dutfoy, A. Pressure building during the early stages of gas production in a radioactive waste repository. J. Nucl. Mater. 2000, 281, 1–14. [Google Scholar] [CrossRef]
  13. Davy, C.A.; Skoczylas, F.; Lebon, P.; Dubois, T. Gas migration properties through a bentonite/argillite interface. Appl. Clay Sci. 2009, 42, 639–648. [Google Scholar] [CrossRef]
  14. Gallé, C. Gas breakthrough pressure in compacted Fo–Ca clay and interfacial gas overpressure in waste disposal context. Appl. Clay Sci. 2000, 17, 85–97. [Google Scholar] [CrossRef]
  15. Ortiz, L.; Volckaert, G.; Mallants, D. Gas generation and migration in Boom Clay, a potential host rock formation for nuclear waste storage. Eng. Geol. 2002, 64, 287–296. [Google Scholar] [CrossRef]
  16. Marschall, P.; Horseman, S.; Gimmi, T. Characterisation of gas transport properties of the Opalinus Clay, a potential host rock formation for radioactive waste disposal. Oil Gas Sci. Technol. 2005, 60, 121–139. [Google Scholar] [CrossRef] [Green Version]
  17. Wollenweber, J.; Alles, S.; Busch, A.; Krooss, B.; Stanjek, H.; Littke, R. Experimental investigation of the CO2 sealing efficiency of caprocks. Int. J. Greenh. Gas Control 2010, 4, 231–241. [Google Scholar] [CrossRef]
  18. Zhao, Y.; Yu, Q. Effect of CH4 on the CO2 breakthrough pressure and permeability of partially saturated low-permeability sandstone in the Ordos Basin, China. J. Hydrol. 2018, 556, 732–748. [Google Scholar] [CrossRef]
  19. Zhang, D.; Ranjith, P.; Perera, M.; Ma, G. Laboratory evaluation of flow properties of Niutitang shale at reservoir conditions. Mar. Pet. Geol. 2020, 115, 104257. [Google Scholar] [CrossRef]
  20. Cui, L.-Y.; Ye, W.-M.; Wang, Q.; Chen, Y.-G.; Chen, B.; Cui, Y.-J. Insights into Determination of Gas Breakthrough in Saturated Compacted Gaomiaozi Bentonite. J. Mater. Civ. Eng. 2020, 32, 04020190. [Google Scholar] [CrossRef]
  21. Cheng, Z.; Ye, B.; Zhao, J. Investigation of the Gas Breakthrough Pressure of Cement Mortar with Different Experimental Techniques. KSCE J. Civ. Eng. 2021, 26, 325–335. [Google Scholar] [CrossRef]
  22. Wu, T.; Pan, Z.; Connell, L.D.; Liu, B.; Fu, X.; Xue, Z. Gas breakthrough pressure of tight rocks: A review of experimental methods and data. J. Nat. Gas Sci. Eng. 2020, 81, 103408. [Google Scholar] [CrossRef]
  23. Xia, Y.; Cai, J.; Wei, W.; Hu, X.; Wang, X.; Ge, X. A new method for calculating fractal dimensions of porous media based on pore size distribution. Fractals 2018, 26, 1850006. [Google Scholar] [CrossRef]
  24. Fan, L.; Gao, J.; Wu, Z.; Yang, S.; Ma, G. An investigation of thermal effects on micro-properties of granite by X-ray CT technique. Appl. Therm. Eng. 2018, 140, 505–519. [Google Scholar] [CrossRef]
  25. Wang, Y.; Feng, W.K.; Hu, R.L.; Li, C.H. Fracture Evolution and Energy Characteristics During Marble Failure Under Triaxial Fatigue Cyclic and Confining Pressure Unloading (FC-CPU) Conditions. Rock Mech. Rock Eng. 2020, 54, 799–818. [Google Scholar] [CrossRef]
  26. Li, Y.; Yang, J.; Pan, Z.; Tong, W. Nanoscale pore structure and mechanical property analysis of coal: An insight combining AFM and SEM images. Fuel 2019, 260, 116352. [Google Scholar] [CrossRef]
  27. Cao, D.; Hou, Z.; Liu, Q.; Fu, F. Reconstruction of three-dimension digital rock guided by prior information with a combination of InfoGAN and style-based GAN. J. Pet. Sci. Eng. 2021, 208, 109590. [Google Scholar] [CrossRef]
  28. Jiang, Z.; van Dijke, M.I.J.; Sorbie, K.S.; Couples, G.D. Representation of multiscale heterogeneity via multiscale pore networks. Water Resour. Res. 2013, 49, 5437–5449. [Google Scholar] [CrossRef]
  29. Tahmasebi, P.; Kamrava, S. Rapid multiscale modeling of flow in porous media. Phys. Rev. E 2018, 98, 052901. [Google Scholar] [CrossRef] [Green Version]
  30. Hakimov, N.; Zolfaghari, A.; Kalantari-Dahaghi, A.; Negahban, S.; Gunter, G. Pore-scale network modeling of microporosity in low-resistivity pay zones of carbonate reservoir. J. Nat. Gas Sci. Eng. 2019, 71, 103005. [Google Scholar] [CrossRef]
  31. de Vries, E.T.; Raoof, A.; van Genuchten, M.T. Multiscale modelling of dual-porosity porous media; a computational pore-scale study for flow and solute transport. Adv. Water Resour. 2017, 105, 82–95. [Google Scholar] [CrossRef]
  32. Lima, A.; Romero, E.; Piña, Y.; Gens, A.; Li, X. Water Retention Properties of Two Deep Belgian Clay Formations. Unsaturated Soils Res. Appl. 2012, 1, 179–184. [Google Scholar]
  33. Tang, C.S.; Cui, Y.J.; Tang, A.M.; Shi, B. Compression behaviors of crushed COx argillite used as backfilling material in HLW repository. Chin. J. Rock Mech. Eng. 2009, 28, 2459–2465. [Google Scholar]
  34. Robinet, J.C.; Yven, B.; Coelho, D.; Talandier, J. Les distributions de tailles de pores dans les argilites du Callovo-Oxfordien de lEst de la France. In Proceedings of the Transfert 2012 French Conference on the Transport Properties of Geomaterials, Ecole Centrale de Lille, Villeneuve-d’Ascq, France, 20–22 March 2012; pp. 263–272. [Google Scholar]
  35. Keller, L.M.; Holzer, L.; Wepf, R.; Gasser, P. 3D geometry and topology of pore pathways in Opalinus clay: Implications for mass transport. Appl. Clay Sci. 2011, 52, 85–95. [Google Scholar] [CrossRef]
  36. Adler, R.J. The Geometry of Random Fields; Society for Industrial and Applied Mathematics (SIAM): Philadelphia, PA, USA, 1981. [Google Scholar]
  37. Adler, R.J.; Taylor, J.E. Random Fields and Geometry; Springer: New York, NY, USA, 2007. [Google Scholar]
  38. Giles, M. Approximating the erfinv Function. In GPU Computing Gems Jade Edition; Morgan Kaufmann: Burlington, MA, USA, 2012; Volume 377, pp. 109–116. [Google Scholar]
  39. Matheron, G. Random sets and integral geometry. J. R. Stat. Soc. 1975, 139, 277–278. [Google Scholar]
  40. Serra, J. Image Analysis and Mathematical Morphology; Academic Press: Orlando, FL, USA, 1982. [Google Scholar]
  41. Serra, J. Image Analysis and Mathematical Morphology; Academic Press: London, UK, 1988. [Google Scholar]
  42. Vincent, L. Morphological grayscale reconstruction in image analysis: Applications and efficient algorithms. IEEE Trans. Image Process. 1993, 2, 176–201. [Google Scholar] [CrossRef] [Green Version]
  43. Coussy, O. Poromechanics; John Wiley & Sons: New York, NY, USA, 2004. [Google Scholar]
  44. Vargaftik, N.B.; Volkov, B.N.; Voljak, L.D. International Tables of the Surface Tension of Water. J. Phys. Chem. Ref. Data 1983, 12, 817–820. [Google Scholar] [CrossRef] [Green Version]
  45. Yuan, Y.; Lee, T.R. Contact Angle and Wetting Properties. Surf. Sci. Technol. 2013, 51, 3–34. [Google Scholar]
  46. Hildenbrand, A.; Schlömer, S.; Krooss, B. Gas breakthrough experiments on fine-grained sedimentary rocks. Geofluids 2002, 2, 3–23. [Google Scholar] [CrossRef]
  47. Le, T.T.; Delage, P.; Cui, Y.J.; Tang, A.M.; Lima, A.; Romero, E.; Li, X.L. Water retention properties of Boom clay: A comparison between different experimental techniques. In Unsaturated Soils: Advances in Geo-Engineering; Taylor & Francis Group: London, UK, 2008. [Google Scholar]
  48. Duveau, G.; M’Jahad, S.; Davy, C.A.; Skoczylas, F.; Shao, J.F.; Talandier, J.; Granet, S. Gas entry through water-saturated argillite: Experimental and numerical approaches. In Proceedings of the 45th US Rock Mechanics/Geomechanics Symposium, American Rock Mechanics Association, San Francisco, CA, USA, 26–29 June 2011. [Google Scholar]
  49. Andra. Référentiel du Site Meuse/Haute Marne; Technical Report C-RP-ADS-09-0007; Andra (Agence Nationale pour la Gestion des Déchets Nucléaires): Paris, France, 2009. [Google Scholar]
Figure 1. Four mechanisms of gas transport and breakthrough in low-permeability rocks.
Minerals 13 00393 g001
Figure 2. Sample and instrument. (a) Beishan granite sample; (b) NMR instrument.
Minerals 13 00393 g002
Figure 3. PSD curves of the studied rocks (Boom clay from [32], COx argillite from [34], Opalinus clay from [35]).
Minerals 13 00393 g003
Figure 4. Binarization of a continuous field f ( x ) .
Minerals 13 00393 g004
Figure 5. Influence of Lc on the appearance of the random field and the two-phase field.
Minerals 13 00393 g005
Figure 6. Combination of two fields with different L C values.
Minerals 13 00393 g006
Figure 7. Illustration of SE.
Minerals 13 00393 g007
Figure 8. Operation of GR.
Minerals 13 00393 g008
Figure 9. Operation of MO.
Minerals 13 00393 g009
Figure 10. Generated models of the four invested rocks (pores—blue, matrix—grey). (a) Boom clay model; (b) COx argillite model; (c) Opalinus clay model; (d) Beishan granite model.
Minerals 13 00393 g010
Figure 11. PSDs of the generated models. (a) Boom clay; (b) COx argillite; (c) Opalinus clay; (d) Beishan granite.
Minerals 13 00393 g011
Figure 12. Illustration of the gas breakthrough path.
Minerals 13 00393 g012
Figure 13. Step 1: extraction of the interconnected pathways.
Minerals 13 00393 g013
Figure 14. Step 2: determination of the gas breakthrough pressure.
Minerals 13 00393 g014
Figure 15. Gas migration in the Boom clay model.
Minerals 13 00393 g015aMinerals 13 00393 g015b
Figure 16. Gas migration in the COx argillite model.
Minerals 13 00393 g016aMinerals 13 00393 g016b
Figure 17. Numerical estimation of the gas breakthrough pressure for 10 models with the same generation parameters.
Minerals 13 00393 g017
Table 1. Pore structure characteristics of the investigated clay rocks.
Clay RockOpen Porosity/%Pore Size
Distribution/μm
Main Range/μm
Boom clayaround 250.006~20.05~2
COx argillitearound 200.003~100.003~0.1
Opalinus clayaround 120.001~0.050.001~0.02
Table 2. Parameter used for the model generation.
RockCube Size (μm)MeshCell Size (μm) L C Values (μm)
Boom clay88000.010.06, 0.08, 0.15, 0.3, 0.5, 0.7, 0.9, 1.2, 1.5
COx argillite28000.00250.004, 0.008, 0.015, 0.03, 0.05, 0.07, 0.09, 0.12
Opalinus clay0.28000.000250.002, 0.004, 0.007, 0.011, 0.015, 0.02
Beishan granite1008000.1250.3, 0.5, 0.8, 1.5, 2.5, 4, 6, 8.5
Table 3. Numerical calculation results for the Boom clay.
Direction S E 1   and   S E 2 (μm) P b r e a k t h r o u g h (MPa)Path Length
l m i n (μm)
Path Length
l m a x (μm)
Tortuosity
x0.07, 0.093.20~4.1115.421.61.93~2.70
y0.07, 0.093.20~4.1113.519.71.69~2.46
z0.07, 0.093.20~4.1117.233.32.15~4.16
Table 4. Numerical calculation results for the COx argillite.
Direction S E 1   and   S E 2 (μm) P b r e a k t h r o u g h (MPa)Path Length
l m i n (μm)
Path Length
l m a x (μm)
Tortuosity
x0.0725, 0.07753.72~3.977.19.33.55~4.65
y0.0725, 0.07753.72~3.973.89.11.90~4.55
z0.0725, 0.07753.72~3.975.28.22.60~4.10
Disclaimer/Publisher’s Note: The statements, opinions and data contained in all publications are solely those of the individual author(s) and contributor(s) and not of MDPI and/or the editor(s). MDPI and/or the editor(s) disclaim responsibility for any injury to people or property resulting from any ideas, methods, instructions or products referred to in the content.