Author Contributions
Conceptualization, F.D., R.R., F.G. and A.L.; methodology, F.D., R.R., F.G. and A.L.; formal analysis, F.D., R.R., F.G. and A.L.; investigation, F.D., R.R., F.G. and A.L.; resources, A.L.; data curation, F.D., R.R., F.G. and A.L.; validation, F.D., R.R., F.G. and A.L., writing—original draft preparation, F.D.; writing—review and editing, all remaining authors; visualization, F.D., R.R., F.G. and A.L.; supervision, T.M., E.R.-R. and A.L.; project administration, A.L.; funding acquisition, A.L. All authors have read and agreed to the published version of the manuscript.
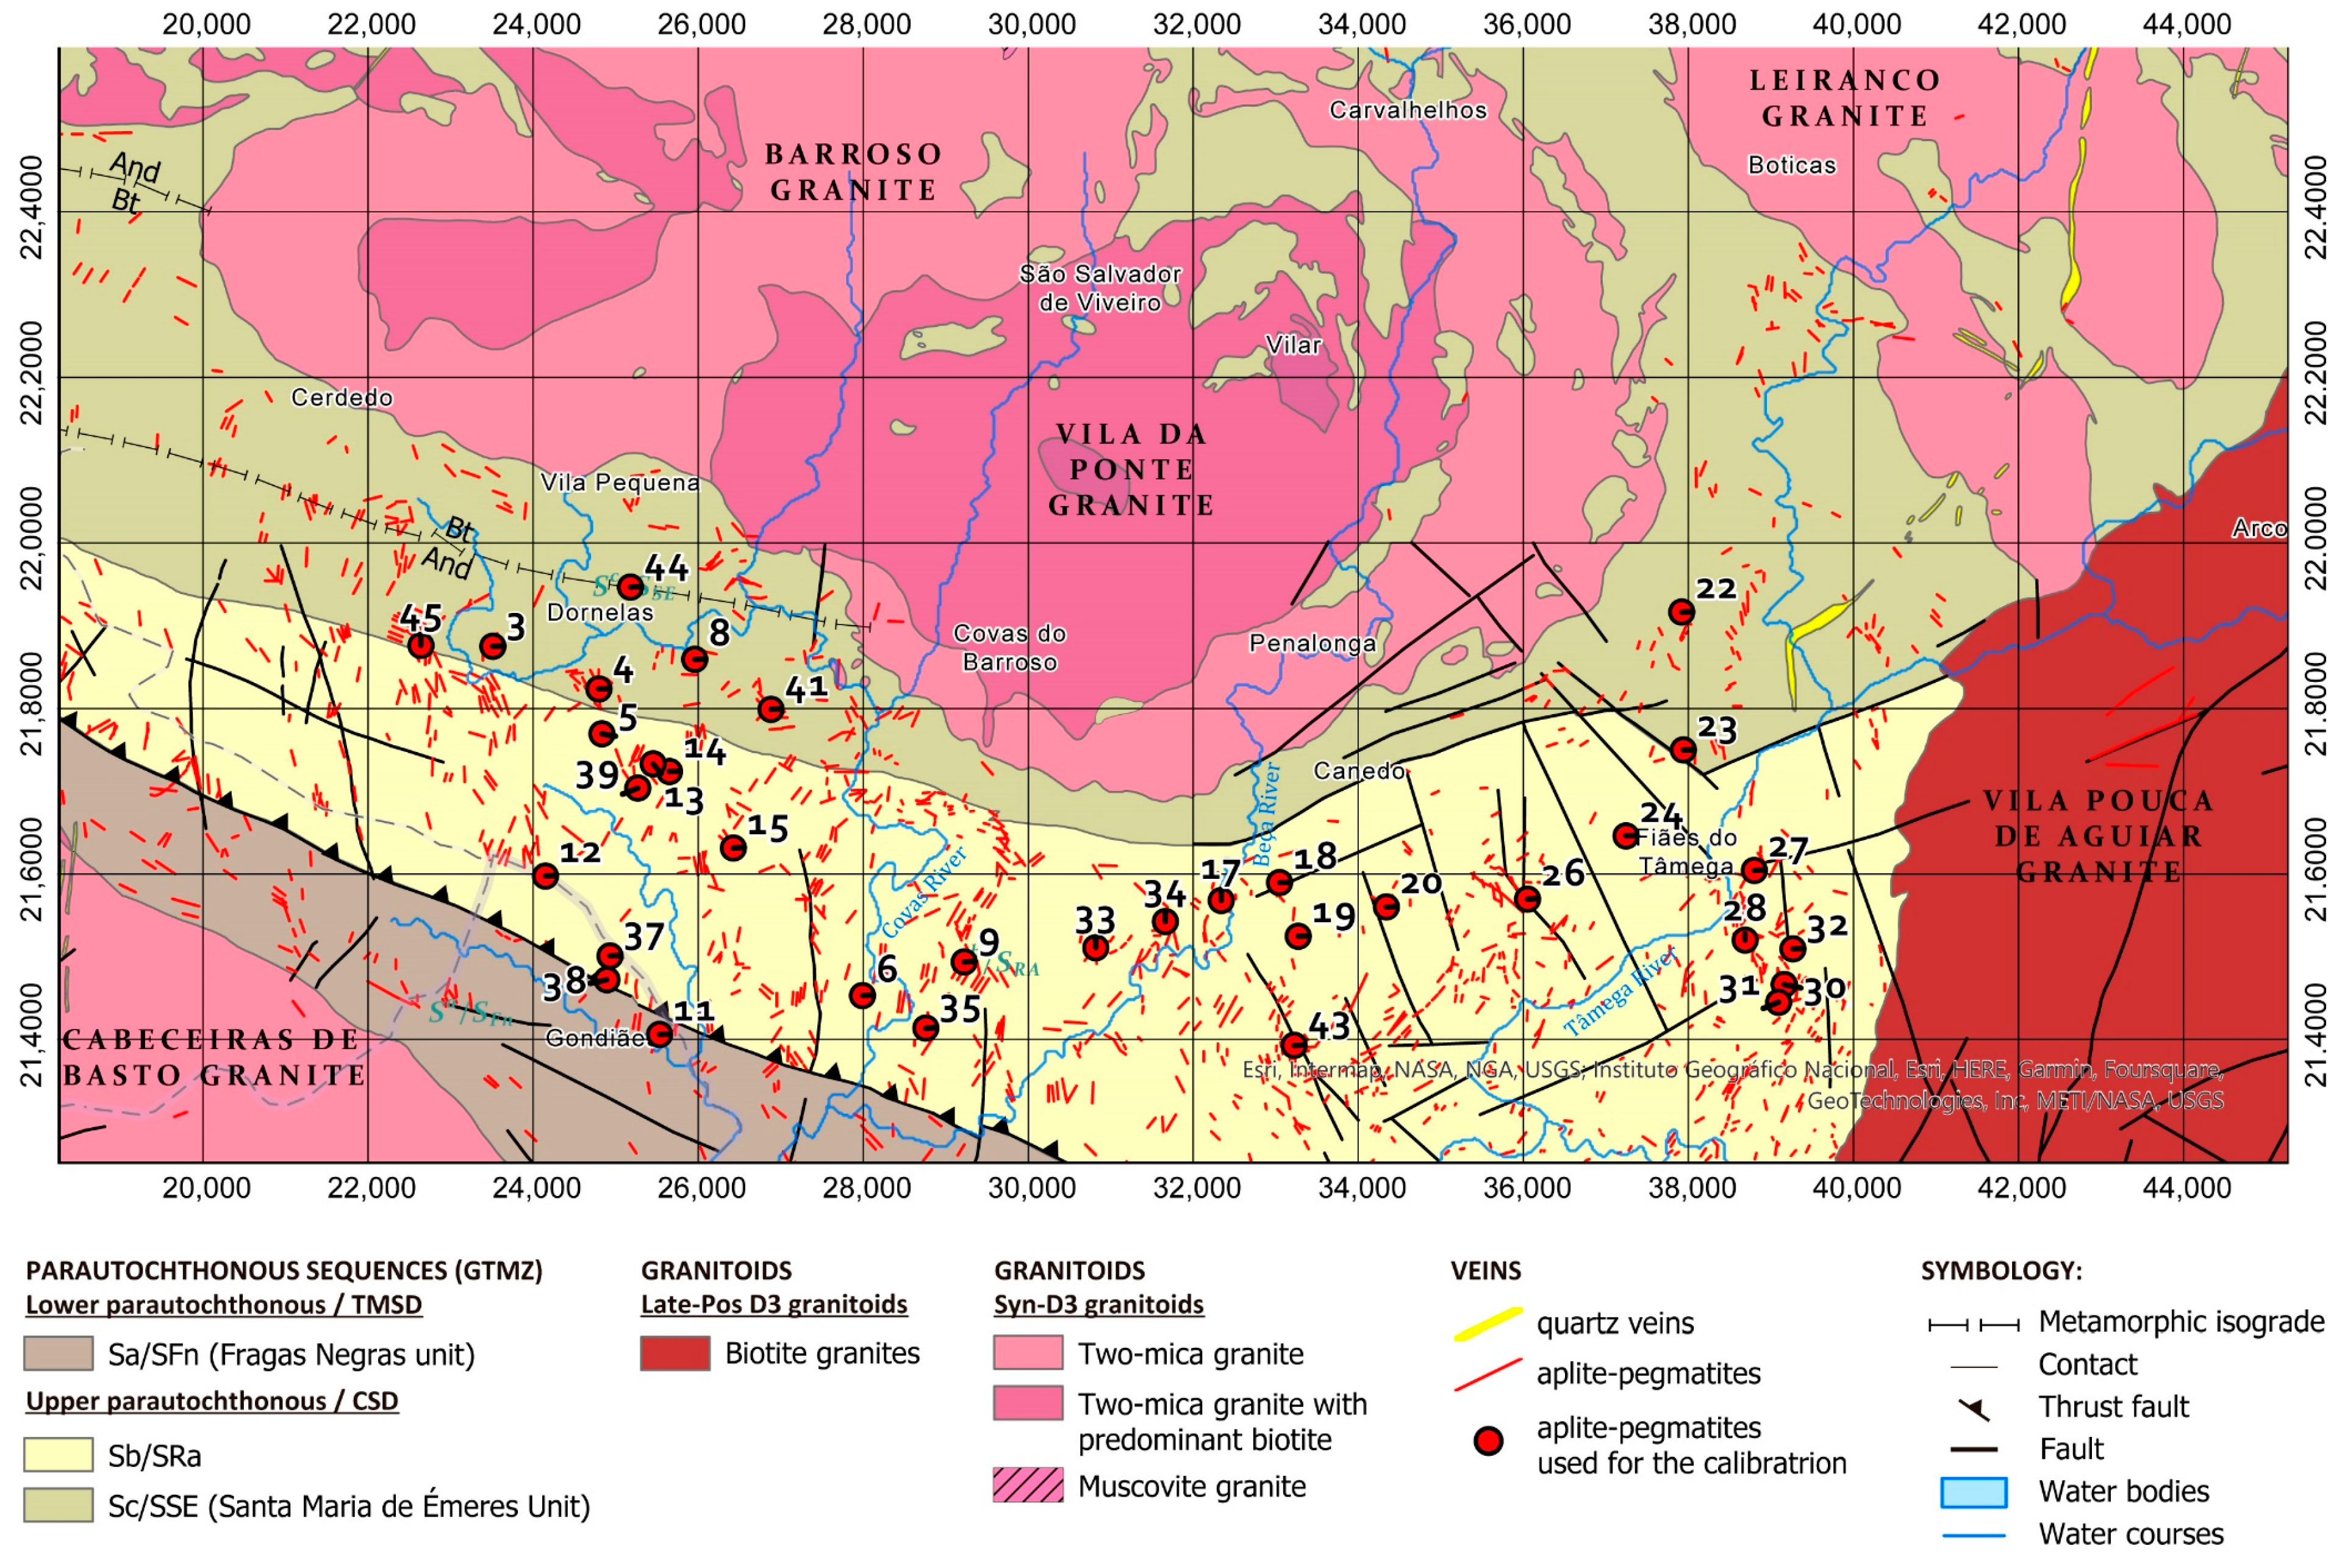
Figure 1.
Geologic map of the Barroso–Alvão aplite-pegmatite field with the location of the pegmatites used for the LIBS calibrations (red dots). Coordinates system: ETRS 1989 Portugal TM06. Adapted from Rodríguez Fernández, et al. [
4], Agência Portuguesa do Ambiente [
5,
6], Sant’Ovaia, et al. [
7] and Ribeiro, et al. [
8]. © Agência Portuguesa do Ambiente (APA). Available online:
https://sniamb.apambiente.pt/content/geo-visualizador (accessed on 19 July 2022).
Figure 2.
Examples of the distinct spodumene and petalite textures found in the aplite-pegmatites of the Barroso–Alvão pegmatite field.
Figure 2.
Examples of the distinct spodumene and petalite textures found in the aplite-pegmatites of the Barroso–Alvão pegmatite field.
Figure 3.
Spodumene crystals (after dividing them into three parts) from the aplite-pegmatites: 3, 9, 17, 18, 30, 32, 33, 41, 42 and 43 (the numbers after the dash correspond to the identification number of the crystal collected from each aplite-pegmatite, since sometimes more than one crystal was collected from the same aplite-pegmatite).
Figure 4.
Spodumene pressed pellet used for the LIBS calibration.
Figure 4.
Spodumene pressed pellet used for the LIBS calibration.
Figure 5.
Microphotographs in parallel polarized light (ppl), crossed polarized light (xpl) and cold cathodoluminescence (CL) microscopy from a petalite (pet) fragment of the crystal sample 1 of the aplite-pegmatite 38 (38-B1). Although most of the sample is petalite, there is an alignment of spodumene (spd) and quartz (qtz) crosscutting the petalite crystal from one side of the thin section to the other. (a) petalite; (b,c) spodumene and quartz mixture crosscutting the petalite crystal.
Figure 6.
Microphotographs in parallel polarized light (ppl), crossed polarized light (xpl) and cold cathodoluminescence (CL) microscopy (CL) from a petalite (pet) fragment of the crystal sample 1 of the aplite-pegmatite 38 (38-B1). (a–c) spodumene + quartz in a fracture of petalite. In CL, the color of spodumene varies from bright purple to orange, while petalite and quartz look almost black next to spodumene observed at 5–6 kV.
Figure 7.
Microphotographs in parallel polarized light (ppl) and crossed polarized light (xpl) from a petalite (pet) fragment of the crystal sample 2 of the aplite-pegmatite 41 (41-B2). This is a pure petalite crystal without any traces of other minerals.
Figure 7.
Microphotographs in parallel polarized light (ppl) and crossed polarized light (xpl) from a petalite (pet) fragment of the crystal sample 2 of the aplite-pegmatite 41 (41-B2). This is a pure petalite crystal without any traces of other minerals.
Figure 8.
Microphotographs in parallel polarized light (ppl), crossed polarized light (xpl) and cold cathodoluminescence (CL) microscopy from a petalite (pet) fragment of the crystal sample 2 of the aplite-pegmatite 44 (44-B2), also known as Antigo. This sample contains a great amount of other minerals such as: (a) plagioclases (pl), quartz (qtz), Fe-Mn phosphates (Ph) and apatites (ap); (b), white micas (mic), plagioclases (pl), quartz (qtz).
Figure 9.
Microphotographs from a fragment of a mixture of spodumene (spd) and quartz (qtz) sample 2 of the aplite-pegmatite 8 (8-D2), also known as 59-AL-52. (a) parallel polarized light (ppl) and crossed polarized light (xpl). (b) xpl and cold cathodoluminescence (CL) microscopy (CL). This sample is almost all pure spodumene and quartz, except for a small portion of alteration minerals composed of clays and micas (c). In cold-CL microscopy, at 6 kV, spodumene has three main colors: yellow, orange and purple. All three colors have a similar strong luminescence. The quartz looks black next to the strong luminescence of spodumene.
Figure 10.
Microphotographs in parallel polarized light (ppl), crossed polarized light (xpl) and cold cathodoluminescence (CL) microscopy from a fragment of a mixture of spodumene (spd) and quartz (qtz) from sample 2 of the aplite-pegmatite 4 (4-D2), also known as 59-AL-22. (a,b) Mixtures of fine spodumene and quartz. (c) aplite-pegmatite rock constituted by abundant plagioclase (pl), quartz, white mica (mic), and several crystals of apatite (ap) with sizes between 100 μm and 2 cm.
Figure 11.
Microphotographs in cold cathodoluminescence (CL) of the petalite pellets made with the different samples of the aplite-pegmatites of the BA field. The CL color of petalite is blue, spodumene has CL colors between orange and purple, and apatite goes from green to yellow. Spodumene and apatite have a very strong luminescence and petalite has a weak luminescence. All pictures were taken with the same acceleration voltage (approximately 6 kV) [
11,
13,
16,
19,
20].
Figure 12.
Summarization of the cold cathodoluminescence (CL) observations, based on visual percentage estimation of petalite, spodumene (spd) and apatite (ap). Since the strong luminescence of spd and ap usually creates a halo of light around it (making them seem larger), the results from the visual estimation are probably overestimated.
Figure 13.
Micro-photograph in cold cathodolumi-nescence (CL) of spodumene + quartz aggregates in the sample 37-B2.
Figure 13.
Micro-photograph in cold cathodolumi-nescence (CL) of spodumene + quartz aggregates in the sample 37-B2.
Figure 14.
X-ray powder diffraction (XRD) analysis performed on the NIST SRM 182 (petalite) compared to the ICP-MS analysis. ICP-MS errors of the quality control samples sent to Actlabs.
Figure 14.
X-ray powder diffraction (XRD) analysis performed on the NIST SRM 182 (petalite) compared to the ICP-MS analysis. ICP-MS errors of the quality control samples sent to Actlabs.
Figure 15.
ICP-MS analysis of Si using Al for all the spodumene and petalite samples used on the calibrations of the portable laser-induced breakdown spectroscopy (pLIBS).
Figure 15.
ICP-MS analysis of Si using Al for all the spodumene and petalite samples used on the calibrations of the portable laser-induced breakdown spectroscopy (pLIBS).
Figure 16.
Differentiating spodumene from petalite and from spodumene + quartz mixtures based on the Al and Fe content from the ICP-MS analysis (graph made in the IoGas software with Auto-Domain tool from the analysis tab, with common covariance matrix, coarse accuracy, and no limit in the cutoff M distance). The pink dots are spodumene crystal samples, the grey are mixtures of spodumene and quartz samples and the blue are petalite crystal samples.
Figure 17.
Successful separation of the pLIBS Fe intensity ratios for the spodumene and petalite samples of the Barroso–Alvão aplite-pegmatite field.
Figure 17.
Successful separation of the pLIBS Fe intensity ratios for the spodumene and petalite samples of the Barroso–Alvão aplite-pegmatite field.
Figure 18.
Overlap of the pLIBS Al intensity ratios for the spodumene and petalite samples of the Barroso–Alvão aplite-pegmatite field.
Figure 18.
Overlap of the pLIBS Al intensity ratios for the spodumene and petalite samples of the Barroso–Alvão aplite-pegmatite field.
Figure 19.
Overlap of the pLIBS Li intensity ratios for the spodumene and petalite samples of the Barroso–Alvão aplite-pegmatite field.
Figure 19.
Overlap of the pLIBS Li intensity ratios for the spodumene and petalite samples of the Barroso–Alvão aplite-pegmatite field.
Figure 20.
pLIBS analysis of the spodumene sample 32-C1 with the Spd_Barroso calibration.
Figure 20.
pLIBS analysis of the spodumene sample 32-C1 with the Spd_Barroso calibration.
Figure 21.
pLIBS analysis of the petalite sample 38-B1 with the Pet_Barroso calibration.
Figure 21.
pLIBS analysis of the petalite sample 38-B1 with the Pet_Barroso calibration.
Figure 22.
LIBS accuracy compared to the ICP-MS analysis for the spodumene and petalite samples from the Barroso–Alvão aplite-pegmatite field.
Figure 22.
LIBS accuracy compared to the ICP-MS analysis for the spodumene and petalite samples from the Barroso–Alvão aplite-pegmatite field.
Figure 23.
Percentage of the errors of the pLIBS compared to the ICP-MS results for (a) Al, (b) Si, (c) Li and (d) Fe with the Spd_Barroso calibration and Pet_Barroso calibration. LOD (Limit of Detection).
Figure 23.
Percentage of the errors of the pLIBS compared to the ICP-MS results for (a) Al, (b) Si, (c) Li and (d) Fe with the Spd_Barroso calibration and Pet_Barroso calibration. LOD (Limit of Detection).
Figure 24.
pLIBS analysis of a potassium feldspar with the Spd_Barroso calibration.
Figure 24.
pLIBS analysis of a potassium feldspar with the Spd_Barroso calibration.
Figure 25.
pLIBS analysis of a potassium feldspar with the Pet_Barroso calibration.
Figure 25.
pLIBS analysis of a potassium feldspar with the Pet_Barroso calibration.
Figure 26.
Li results from the pLIBS by analyzing three times seven distinct potassium felspars (Kfs) with the Pet_Barroso (green dots) and the Spd_Barroso (blue dots) calibrations.
Figure 26.
Li results from the pLIBS by analyzing three times seven distinct potassium felspars (Kfs) with the Pet_Barroso (green dots) and the Spd_Barroso (blue dots) calibrations.
Figure 27.
LIBS analysis of the spodumene sample 32-C1 in pellet (a) compared with the crystal sample (b) and the ICP-MS analysis (c). These LIBS analyses were performed with the Spd_Barroso calibration.
Figure 27.
LIBS analysis of the spodumene sample 32-C1 in pellet (a) compared with the crystal sample (b) and the ICP-MS analysis (c). These LIBS analyses were performed with the Spd_Barroso calibration.
Figure 28.
pLIBS analysis of the petalite sample 38-B1 in pellet (a) compared with the crystal sample (b) and the ICP-MS analysis (c). These LIBS analyses were performed with the Pet_Barroso calibration.
Figure 28.
pLIBS analysis of the petalite sample 38-B1 in pellet (a) compared with the crystal sample (b) and the ICP-MS analysis (c). These LIBS analyses were performed with the Pet_Barroso calibration.
Table 1.
Geochemical results of spodumene (spd) from the ICP-MS used on the “Spd_Barroso” and “Fe_Barroso” calibrations of the portable LIBS.
Table 1.
Geochemical results of spodumene (spd) from the ICP-MS used on the “Spd_Barroso” and “Fe_Barroso” calibrations of the portable LIBS.
| | 3 | 3 | 9 | 17 | 17 | 18 | 30 | 32 | 32 | 32 | 32 | 33 | 33 | 34 | 41 | 41 | 41 | 42 |
|---|
| | spd 1 * | spd 2 | spd 1 | spd 1 | spd 2 | spd 1 | spd 1 | spd 1 | spd 2 * | spd 3 | spd 4 * | spd 1 | spd 2 | spd 1 | spd 1 | spd 3 | spd 4 | spd 1 |
|---|
| Si % | 22.00 | 26.30 | 30.00 | 28.10 | 29.30 | 27.90 | 29.40 | 26.60 | 29.30 | 31.70 | 29.90 | 27.70 | 26.70 | 29.70 | 28.30 | 28.70 | 32.50 | 30.30 |
| Al % | 12.70 | 12.70 | 13.80 | 14.30 | 12.40 | 12.40 | 14.00 | 13.60 | 13.20 | 14.60 | 13.50 | 15.10 | 12.30 | 13.70 | 12.40 | 12.30 | 15.00 | 12.70 |
| Li % | 3.06 | 3.08 | 3.32 | 3.08 | 2.73 | 2.73 | 3.14 | 3.26 | 2.32 | 3.52 | 2.67 | 2.38 | 2.81 | 3.23 | 2.77 | 2.79 | 3.35 | 2.93 |
| K % | 0.30 | 0.30 | 0.30 | 0.70 | 0.50 | 0.30 | 0.50 | 0.30 | 1.10 | 0.40 | 1.10 | 0.70 | 0.40 | 0.40 | 0.50 | 0.60 | 0.70 | 0.30 |
| Fe % | 0.17 | 0.19 | 0.33 | 0.09 | 0.25 | 0.38 | 0.27 | 0.22 | 0.26 | 0.19 | 0.27 | 0.25 | 0.18 | 0.20 | 0.14 | 0.15 | 0.25 | 0.33 |
| Na % | 0.10 | 0.11 | 0.08 | 0.10 | 0.12 | 0.17 | 0.09 | 0.04 | 0.51 | 0.12 | 0.45 | 0.08 | 0.14 | 0.08 | 0.20 | 0.11 | 0.27 | 0.07 |
| Mn ppm | 237 | 225 | 238 | 484 | 602 | 323 | 259 | 165 | 172 | 229 | 184 | 297 | 339 | 216 | 166 | 182 | 269 | 214 |
| Sn ppm | 209 | 194 | 57 | 8 | 19 | 21 | 7 | 4 | 12 | 5 | 40 | 147 | 43 | 13 | 11 | 7 | 13 | 6 |
| P ppm | 110 | 840 | 490 | 410 | 490 | 680 | 480 | 100 | 350 | 200 | 380 | 80 | 610 | 30 | 360 | 90 | 170 | 340 |
| Be ppm | 105 | 108 | 8 | 7 | 25 | 21 | 8 | 7 | 8 | 5 | 4 | 13 | 8 | 8 | 11 | 11 | 14 | 12 |
| Ga ppm | 11 | 12 | 14 | 14 | 15 | 12 | 11 | 9 | 15 | 12 | 16 | 20 | 17 | 15 | 17 | 17 | 19 | 14 |
| Nb ppm | 9 | 9 | 18 | 2 | 3 | 6 | 1 | 1 | 6 | 2 | 7 | 3 | 14 | 12 | 6 | 5 | 6 | 5 |
| Ta ppm | 9 | 8 | 1 | 1 | 1 | 1 | 0 | 0 | 5 | 0 | 3 | 7 | 6 | 7 | 1 | 1 | 2 | 1 |
| Zn ppm | 5 | 5 | 20 | 20 | 10 | 40 | 30 | 20 | 90 | 5 | 30 | 60 | 70 | 20 | 40 | 50 | 60 | 20 |
| Rb ppm | 4 | 5 | 7 | 71 | 60 | 13 | 36 | 2 | 131 | 19 | 181 | 54 | 50 | 21 | 67 | 92 | 88 | 7 |
| Sr ppm | 3 | 3 | 24 | 12 | 34 | 37 | 1 | 0 | 6 | 0 | 1 | 2 | 106 | 1 | 3 | 2 | 8 | 2 |
| Cs ppm | 3 | 3 | 1 | 3 | 8 | 2 | 2 | 0 | 7 | 1 | 6 | 15 | 4 | 2 | 7 | 12 | 23 | 1 |
| As ppm | 1 | 0 | 4 | 1 | 2 | 6 | 3 | 1 | 2 | 2 | 1 | 5 | 1 | 0 | 1 | 0 | 1 | 5 |
| Ni ppm | 0 | 0 | 1 | 4 | 3 | 6 | 2 | 3 | 1 | 1 | 2 | 13 | 2 | 3 | 2 | 1 | 3 | 12 |
| U ppm | 0 | 1 | 1 | 0 | 1 | 1 | 5 | 1 | 3 | 1 | 3 | 3 | 2 | 5 | 2 | 2 | 4 | 0 |
Table 2.
Petalite (pet) chemical results from the ICP-MS (inductively coupled plasma mass spectrometry) used on the “Pet_Barroso” and “Fe_Barroso” calibrations of the portable LIBS (laser-induced breakdown spectroscopy).
Table 2.
Petalite (pet) chemical results from the ICP-MS (inductively coupled plasma mass spectrometry) used on the “Pet_Barroso” and “Fe_Barroso” calibrations of the portable LIBS (laser-induced breakdown spectroscopy).
| | 5 | 5 | 14 | 37 | 37 | 38 | 39 | 39 | 39 | 41 | 41 | 44 |
|---|
| | pet 1 | pet 2 * | pet 1 * | pet 1 | pet 2 * | pet 1 * | pet 1 | pet 2 * | pet 3 | pet 1 | pet 2 | pet 2 |
|---|
| Si % | 34.30 | 28.50 | 34.40 | 35.40 | 24.10 | 34.90 | 32.90 | 29.50 | 24.30 | 27.80 | 23.20 | 35.40 |
| Al % | 8.65 | 8.80 | 9.68 | 8.84 | 9.14 | 8.97 | 8.70 | 8.73 | 8.70 | 8.57 | 8.73 | 8.77 |
| Li % | 2.24 | 1.98 | 2.15 | 2.23 | 2.03 | 2.15 | 2.07 | 2.01 | 2.18 | 2.10 | 2.13 | 2.13 |
| K % | 0.10 | 0.20 | 0.30 | 0.10 | 0.20 | 0.30 | 0.20 | 0.30 | 0.20 | 0.20 | 0.20 | 0.20 |
| Fe % | 0.01 | 0.02 | 0.01 | 0.02 | 0.02 | 0.04 | 0.06 | 0.04 | 0.01 | 0.02 | 0.01 | 0.06 |
| Na % | 0.02 | 0.16 | 0.16 | 0.06 | 0.01 | 0.01 | 0.05 | 0.31 | 0.02 | 0.02 | 0.04 | 0.04 |
| Mn ppm | 9 | 72 | 23 | 76 | 314 | 25 | 68 | 65 | 32 | 12 | 151 | 17 |
| Sn ppm | 0 | 3 | 1 | 1 | 1 | 12 | 3 | 13 | 0 | 0 | 1 | 0 |
| P ppm | 100 | 1020 | 470 | 180 | 50 | 100 | 190 | 420 | 50 | 90 | 320 | 110 |
| Be ppm | 11 | 25 | 6 | 10 | 4 | 4 | 7 | 30 | 7 | 5 | 5 | 10 |
| Ga ppm | 11 | 12 | 14 | 10 | 19 | 25 | 10 | 16 | 9 | 7 | 7 | 8 |
| Nb ppm | 1 | 9 | 0 | 0 | 0 | 1 | 2 | 4 | 0 | 0 | 0 | 0 |
| Ta ppm | 0 | 5 | 0 | 0 | 0 | 1 | 1 | 2 | 0 | 0 | 0 | 0 |
| Zn ppm | 20 | 10 | 30 | 30 | 70 | 80 | 20 | 5 | 5 | 5 | 5 | 5 |
| Rb ppm | 3 | 25 | 18 | 13 | 14 | 101 | 28 | 60 | 2 | 3 | 5 | 3 |
| Sr ppm | 4 | 6 | 3 | 0 | 6 | 2 | 18 | 5 | 2 | 4 | 7 | 0 |
| Cs ppm | 1 | 3 | 1 | 2 | 3 | 9 | 5 | 67 | 1 | 1 | 4 | 0 |
| As ppm | 2 | 1 | 1 | 1 | 1 | 1 | 2 | 1 | 2 | 1 | 1 | 2 |
| Ni ppm | 1 | 1 | 1 | 1 | 1 | 1 | 1 | 0 | 2 | 4 | 1 | 1 |
| U ppm | 3 | 1 | 4 | 7 | 7 | 2 | 0 | 1 | 8 | 0 | 1 | 1 |
Table 3.
ICP-MS errors in the samples sent for quality control (QC).
Table 3.
ICP-MS errors in the samples sent for quality control (QC).
| | Spodumene | Spd + Qtz | NIST SRM 182 |
|---|
| 03-C1 | 03-C2 | 08-D2 | 08-D3 | NIST * | ICP-MS |
|---|
| Si | error: 16% | error: 18% | | |
| Si 22.00% | Si 26.30% | Si 33.70% | Si 28.50% | | |
| Al | error: 0% | error: 1% | | |
| Al 12.70% | Al 12.70% Al | Al 9.97% | Al 10.10% | | |
| Li | error: 1% | error: 3% | error: 5% |
| Li 3.06% | Li 3.08% | Li 2.01% | Li 2.07% | 1.92% Li | 2.01% Li |
| K | error: 0% | error: 14% | |
| K 0.30% | K 0.30% | K 0.60% | K 0.70% |
| Na | error: 9% | error: 0% | | |
| Na 0.10% | Na 0.11% | Na 0.21% | Na 0.21% | | |
| P | error: 87% | error: 6% | | |
| P 0.01% | P 0.08% | P 490 ppm | P 520 ppm | | |
| Rb | error: 21% | error: 1% | | |
| Rb 4.1 ppm | Rb 5.2 ppm | Rb 91.7 ppm | Rb 92.3 ppm | | |
| Ca | error: - | Error: 0% | | |
| Ca < 0.01% | Ca < 0.01% | Ca 0.02% | Ca 0.02% | | |
| Fe | error: 11% | error: 0% | |
| Fe 0.17% | Fe 0.19% | Fe 0.18% | Fe 0.18% |
| Mn | error: 5% | error: 2% | | |
| Mn 237 ppm | Mn 225 ppm | Mn 276 ppm | Mn 271 ppm | | |
| Be | error: 3% | error: 3% | | |
| Be 105 ppm | Be 108 ppm | Be 9.02 ppm | Be 8.79 ppm | | |
| Cs | error: 3% | error: 2% | | |
| Cs 2.74 ppm | Cs 2.66 ppm | Cs 2.55 ppm | Cs 2.6 ppm | | |
| Tl | error:33% | error: 0% | | |
| Tl 0.04 ppm | Tl 0.03 ppm | Tl 0.58 ppm | Tl 0.58 ppm | | |
| Sr | error: 3% | error: 3% | | |
| Sr 3.4 ppm | Sr 3.3 ppm | Sr 21.8 ppm | Sr 21.2 ppm | | |
| Ga | error: 5% | error: 2% | | |
| Ga 10.9 ppm | 11.5 ppm Ga | Ga 11.6 ppm | Ga 11.4 ppm | | |
| Zn | error: 0% | error: 50% | | |
| Zn 5 ppm | Zn 5 ppm | Zn 10 ppm | Zn 20 ppm | | |
| As | error: 133% | error: 0% | | |
| As 0.7 ppm | As 0.3 ppm | As 0.9 ppm | As 0.9 ppm | | |
| Nb | error: 2% | error: 2% | | |
| Nb 9.4 ppm | Nb 9.2 ppm | Nb 4.4 ppm | Nb 4.3 ppm | | |
| Ni | error: 25% | error: 0% | | |
| Ni 0.3 ppm | Ni 0.4 ppm | Ni 0.5 ppm | Ni 0.5 ppm | | |
| Sn | error: 8% | error: 1% | | |
| Sn 209 ppm | Sn 194 ppm | Sn 23.2 ppm | Sn 22.9 ppm | | |
| Ta | error: 7% | error: 0% | | |
| Ta 8.64 ppm | Ta 8.09 ppm | Ta 0.96 ppm | Ta 0.96 ppm | | |
| U | error: 70% | error: 13% | | |
| U 0.3 ppm | U 1 ppm | U 0.9 ppm | U 0.8 ppm | | |
Table 4.
ICP-MS errors from the duplicates made in Actlabs for the major elements of petalite, spodumene and quartz with the method FUS-Na2O2.
Table 4.
ICP-MS errors from the duplicates made in Actlabs for the major elements of petalite, spodumene and quartz with the method FUS-Na2O2.
| | Det. Lim. | Petalite | Spodumene | Spodumene + Quartz |
|---|
| | 39-B2 | 39-B2 | 09-C1 | 09-C1 | 32-C4 | 32-C4 | 32-D1 | 32-D1 | 41-D3 | 41-D3 |
|---|
| | Orig | Dup | Orig | Dup | Orig | Dup | Orig | Dup | Orig | Dup |
|---|
| Si | 0.01 | error: 26% | error: 2% | error: 1% | error: 13% | error: 22% |
| Si 25% | Si 34% | Si 30% | Si 30% | Si 30% | Si 30% | Si 34% | Si 30% | Si 32% | Si 26% |
| Al | 0.01 | error: 1% | error: 0% | error: 1% | error: 0% | error: 2% |
| Al 8.8% | Al 8.7% | Al 14% | Al 14% | Al 13% | Al 14% | Al 9.6% | Al 9.6% | Al 9.4% | Al 9.2% |
| K | 0.1 | error: 0% | error: 0% | error: 0% | error: 0% | error: 0% |
| K 0.3% | K 0.3% | K 0.3% | K 0.3% | K 1.1% | K 1.1% | K 1.6% | K 1.6% | K 0.7% | K 0.7% |
| Li | 0.01 | error: 5% | error: 1% | error: 2% | error: 0% | error: 1% |
| Li 2.1% | Li 2% | Li 3.3% | Li 3.3% | Li 2.7% | Li 2.7% | Li 1.2% | Li 1.2% | Li 1.8% | Li 1.8% |
Table 5.
ICP-MS errors from the duplicates made in Actlabs for the trace-elements of K-feldspar, petalite, spodumene and quartz with the method 4 Acid “Near Total” digestion.
Table 5.
ICP-MS errors from the duplicates made in Actlabs for the trace-elements of K-feldspar, petalite, spodumene and quartz with the method 4 Acid “Near Total” digestion.
| | | NIST Petalite | Spodumene | Spodumene + Quartz |
|---|
| | Det. | SRM 182 | SRM 182 | 32-C1 | 32-C1 | 11-1D | 11-D1 | 08-D2 | 08-D2 |
|---|
| | Limit | Orig | Dup | Orig | Dup | Orig | Dup | Orig | Dup |
|---|
| Na % | 0.01 | | error: 0% | error: 0% | error: 0% |
| Na 0.04 | Na 0.04 | Na 0.26 | Na 0.26 | Na 0.21 | Na 0.21 |
| Fe % | 0.01 | | error: 10% | error: 0% | error: 0% |
| Fe 0.23 | Fe 0.21 | Fe 0.13 | Fe 0.13 | Fe 0.18 | Fe 0.18 |
| Ca % | 0.01 | | error: - | error: 0% | error: 0% |
| Ca <0.01 | Ca <0.01 | Ca 0.02 | Ca 0.02 | Ca 0.02 | Ca 0.02 |
| P ppm | 10 | | error: 50% | error: 0% | error: 0% |
| P 120 | P 80 | P 4210 | P 4230 | P 490 | P 490 |
| Rb ppm | 0.1 | error: 2% | error: 29% | error: 5% | error: 3% |
| Rb 258 | Rb 262 | Rb 2.2 | Rb 1.7 | Rb 96 | Rb 91.7 | Rb 90.5 | Rb 92.9 |
| Mn ppm | 5 | | error: 1% | error: 0% | error: 1% |
| Mn 165 | Mn 166 | Mn 161 | Mn 161 | Mn 274 | Mn 277 |
| Sr ppm | 0.2 | error: 6% | error: 0% | error: 2% | error: 0% |
| Sr 5.2 | Sr 4.9 | Sr 0.4 | Sr 0.4 | Sr 59.5 | Sr 60.7 | Sr 21.8 | Sr 21.8 |
| Cs ppm | 0.05 | error: 5% | error: 3% | error: 5% | error: 1% |
| Cs 24.6 | Cs 26 | Cs 0.38 | Cs 0.37 | Cs 4.75 | Cs 4.52 | Cs 2.56 | Cs 2.54 |
| Pb ppm | 0.5 | error: 50% | error: 14% | error: 12% | error: - |
| Pb 2.1 | 1.4 | Pb 0.8 | 0.7 | Pb 2.8 | Pb 2.5 | Pb <0.5 | Pb <0.5 |
| Zn ppm | 2 | | error: 20% | error: 0% | error: 5% |
| Zn 8 | Zn 10 | Zn 41 | Zn 41 | Zn 23 | Zn 22 |
| Ga ppm | 0.05 | error: 0% | error: 9% | error: 7% | error: 2% |
| Ga 17.5 | Ga 17.5 | Ga 9.48 | Ga 8.7 | Ga 7.9 | Ga 7.41 | Ga 11.7 | Ga 11.5 |
| Be ppm | 0.05 | error: 5% | error: 0% | error: 3% | error: 1% |
| Be 10.6 | Be 11.2 | Be 6.58 | Be 6.55 | Be 3.48 | Be 3.38 | Be 9.07 | Be 8.98 |
| Sn ppm | 0.2 | error: 8% | error: 8% | error: 3% | error: 4% |
| Sn 3.4 | 3.7 | Sn 4.2 | 3.9 | Sn 11.2 | Sn 10.9 | Sn 22.8 | Sn 23.7 |
| Tl ppm | 0.02 | error: 1% | error: - | error: 2% | error: 2% |
| Tl 1.56 | Tl 1.58 | Tl <0.02 | Tl <0.02 | Tl 0.44 | Tl 0.43 | Tl 0.57 | Tl 0.58 |
| Cr ppm | 1 | | error: 40% | error: 67% | error: 33% |
| Cr 7 | Cr 5 | Cr 5 | Cr 3 | Cr 4 | Cr 3 |
| Nb ppm | 0.1 | error: 10% | error: 25% | error: 9% | error: 7% |
| Nb 3.5 | Nb 3.9 | Nb 0.5 | Nb 0.4 | Nb 3.7 | Nb 3.4 | Nb 4.3 | Nb 4.6 |
| As ppm | 0.2 | error: 26% | error: 150% | error: 44% | error: 20% |
| As 3.1 | As 4.2 | As 1 | As 0.4 | As 1.3 | As 0.9 | As 0.8 | As 1 |
| Ta ppm | 0.05 | error: 13% | error: 28% | error: 15% | error: 4% |
| Ta 4.74 | Ta 5.47 | Ta 0.32 | Ta 0.25 | Ta 0.68 | Ta 0.59 | Ta 0.94 | Ta 0.98 |
| U ppm | 0.1 | error: 25% | error: 43% | error: 0% | error: 9% |
| U 0.3 | U 0.4 | U 1 | U 0.7 | U 2.7 | U 2.7 | U 1 | U 1.1 |
| Ni ppm | 0.2 | error: 13% | error: 16% | error: 10% | error: 0% |
| Ni 0.7 | Ni 0.8 | Ni 3.6 | Ni 3.1 | Ni 1.1 | Ni 1 | Ni 0.5 | Ni 0.5 |
| Y ppm | 0.1 | error: 0% | error: 122% | error: 0% | error: - |
| Y 0.2 | Y 0.2 | Y 4 | Y 1.8 | Y 0.1 | Y 0.1 | Y <0.1 | Y <0.1 |
Table 6.
Breakdown of petalite into spodumene and quartz intergrowth (SQI).
Table 6.
Breakdown of petalite into spodumene and quartz intergrowth (SQI).
| LiAlSi4O10 (Petalite) → | LiAlSi2O6 (Spodumene) + 2SiO2 (Quartz) |
|---|
| 2.09% Li | 3.73% Li | 0% Li |
| 8.75% Al | 14.50% Al | 0% Al |
| 36.72% Si | 30.18% Si | 46.74% Si |
| 52.43% O | 51.59% O | 53.26% O |
| 100 vol% | → | 56.3 vol% | + | 43.7 vol% |


 ,
, 


