

Raw Smectite from the Guarapuava–Parana–Brasil Saturated with Copper Ions and Its Properties
 , , ,
, , , 
Abstract
:
1. Introduction
2. Materials and Methods
2.1. Materials
2.2. Mineralogical Analysis
2.3. Saturation of Raw Smectite with Copper Ions
2.4. Dye Adsorption
2.5. Isotherms Models
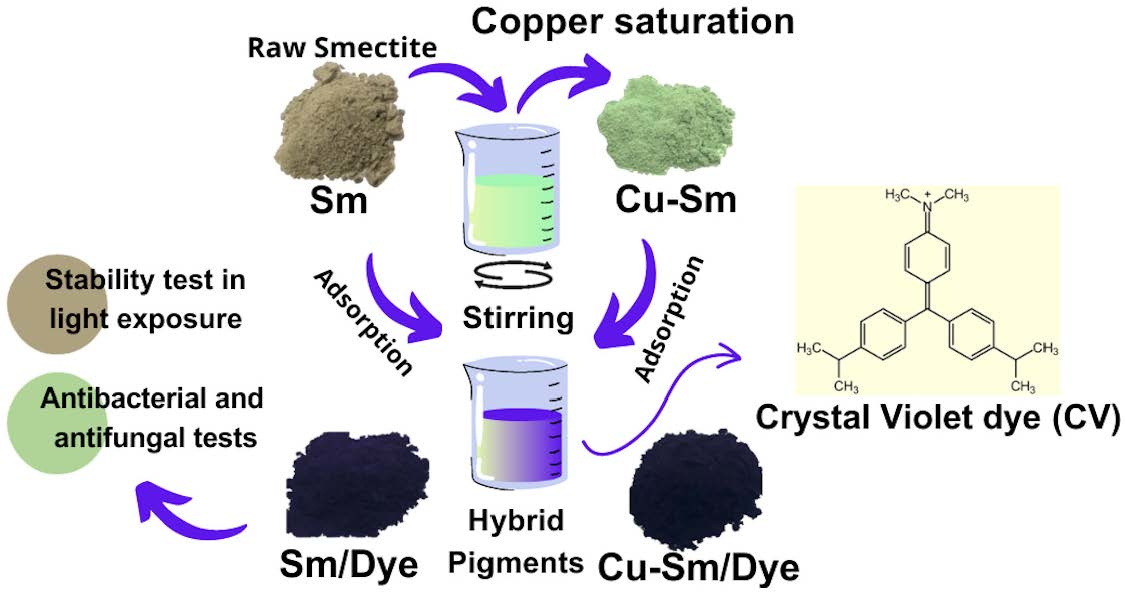
2.6. Synthesis of the Hybrid Pigments
2.7. Characterization
2.8. Dispersion in White Paint and Colorimetric Measurements
2.9. Photoaging Stability Test
2.10. Antimicrobial Activity Test
3. Results
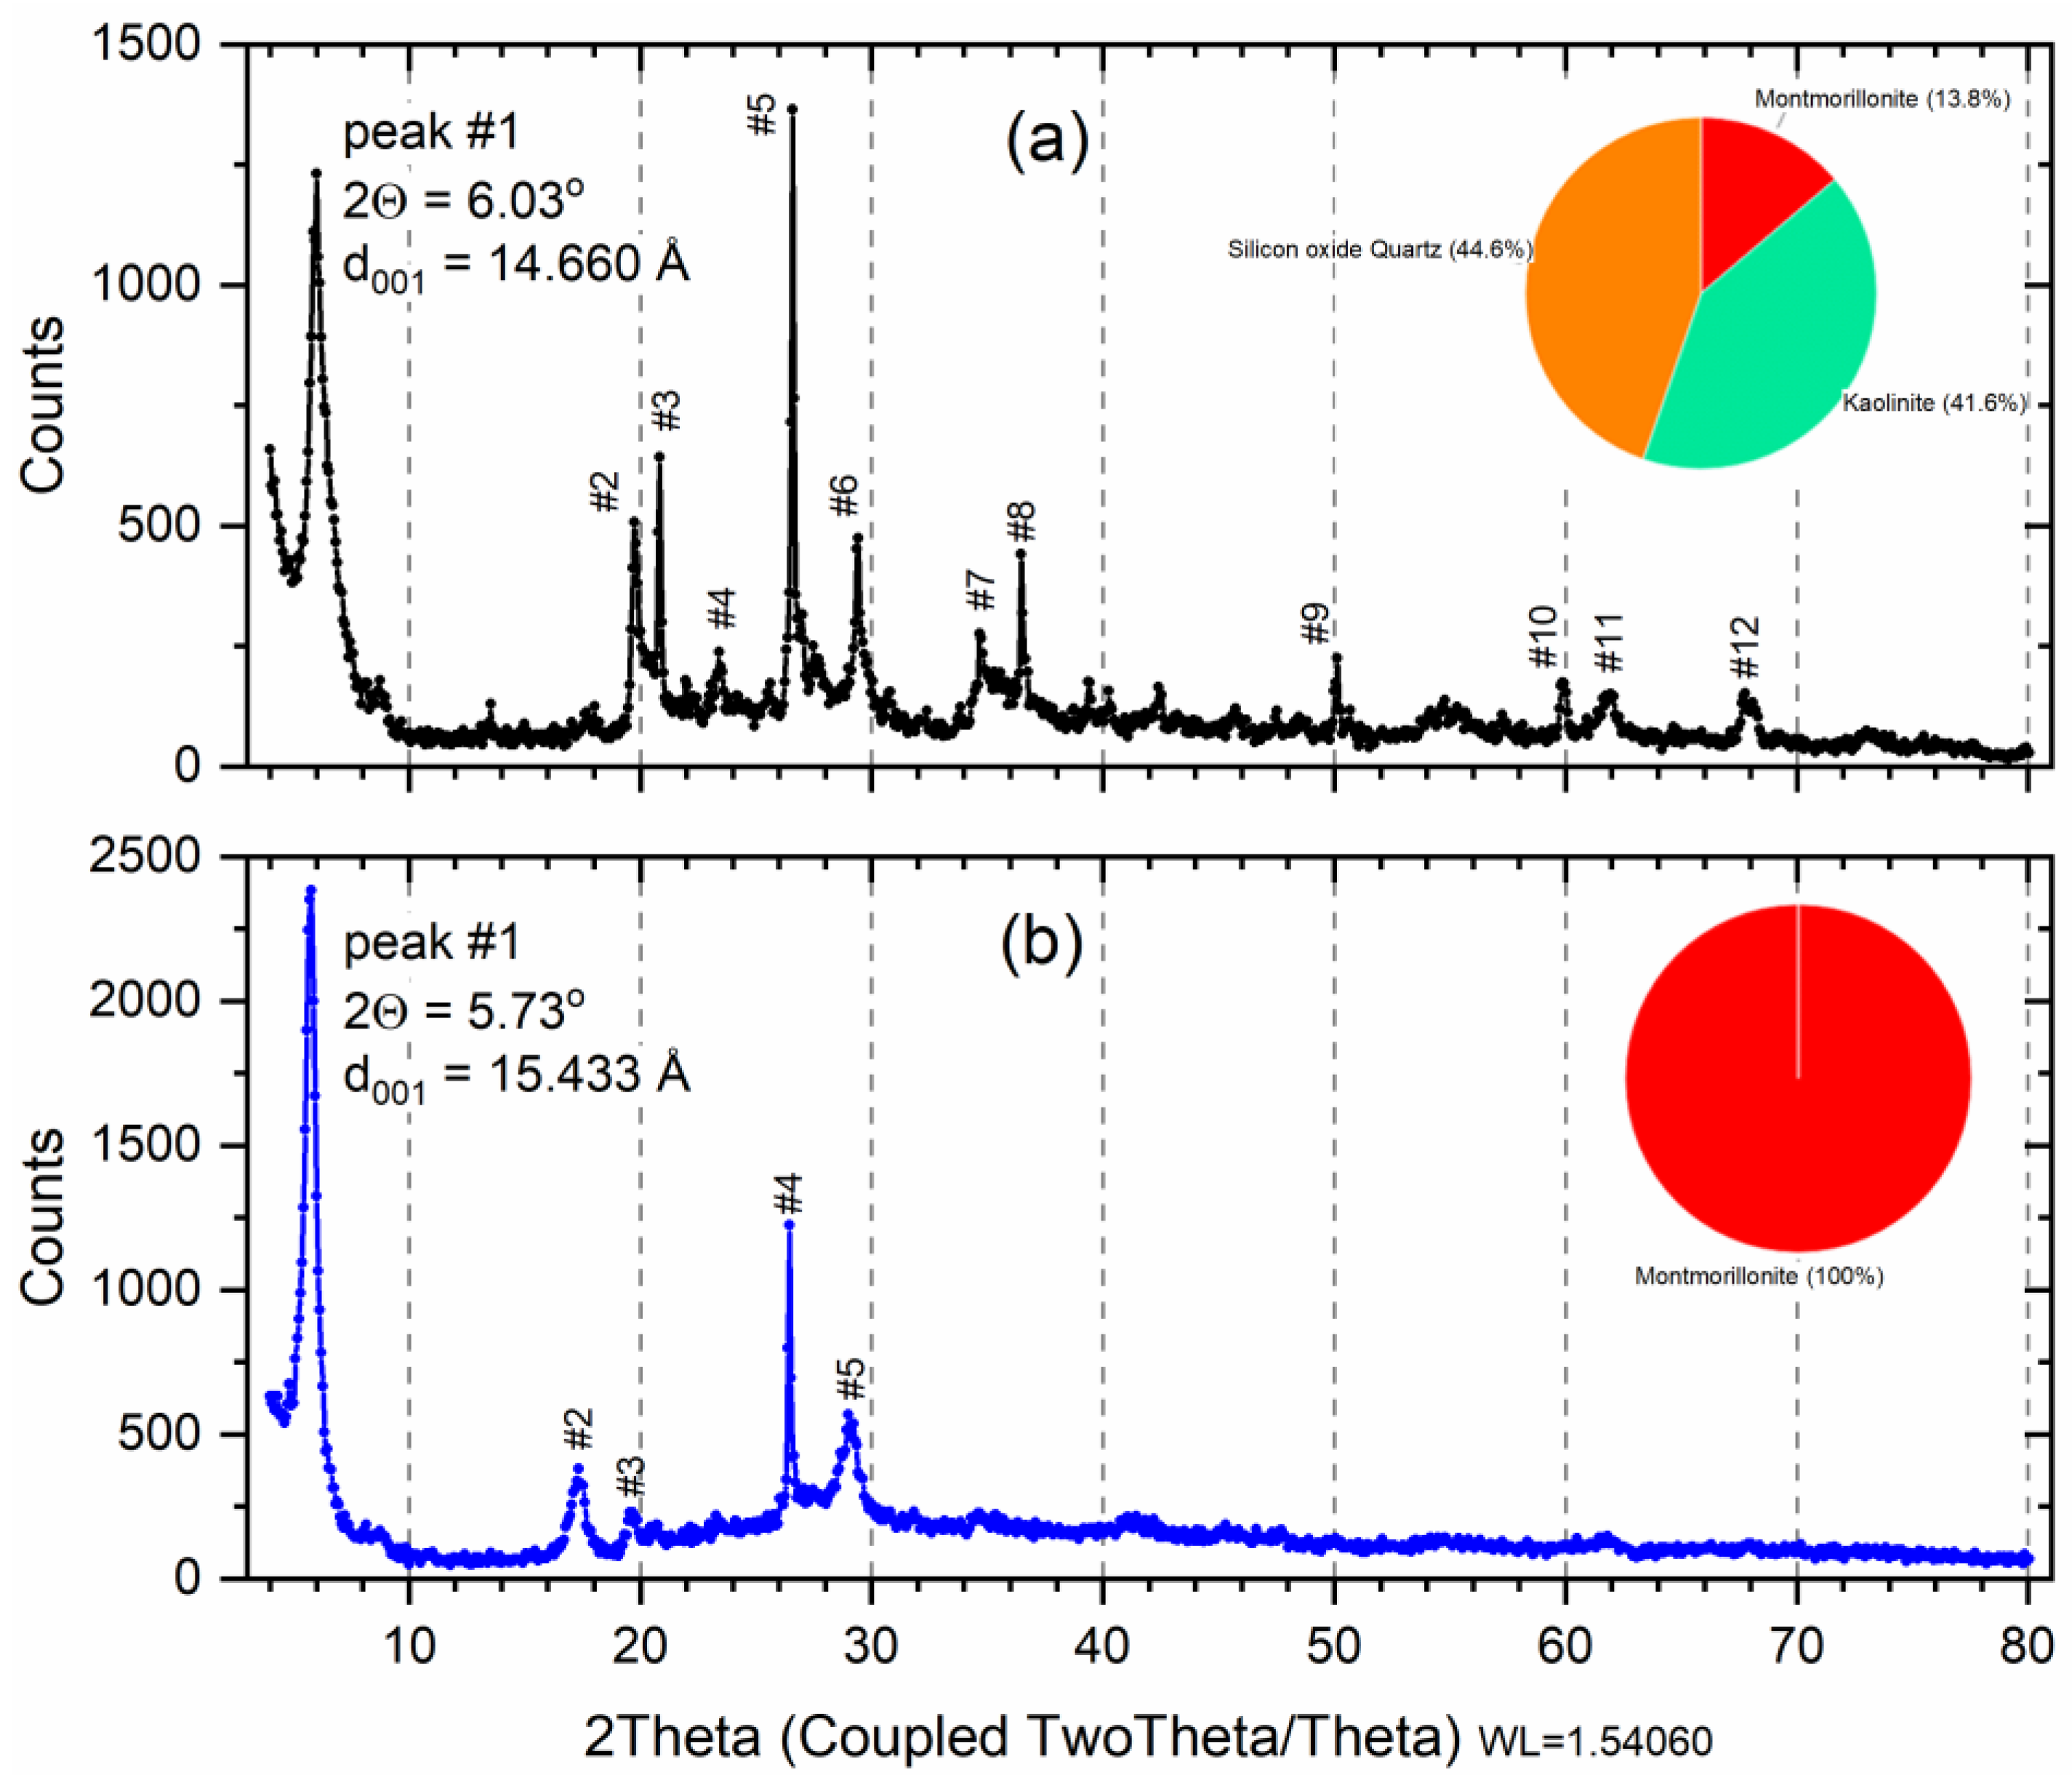
3.1. Mineralogical Analysis by X-ray Diffraction
3.2. Energy Dispersive X-ray Fluorescence (EDXRF)
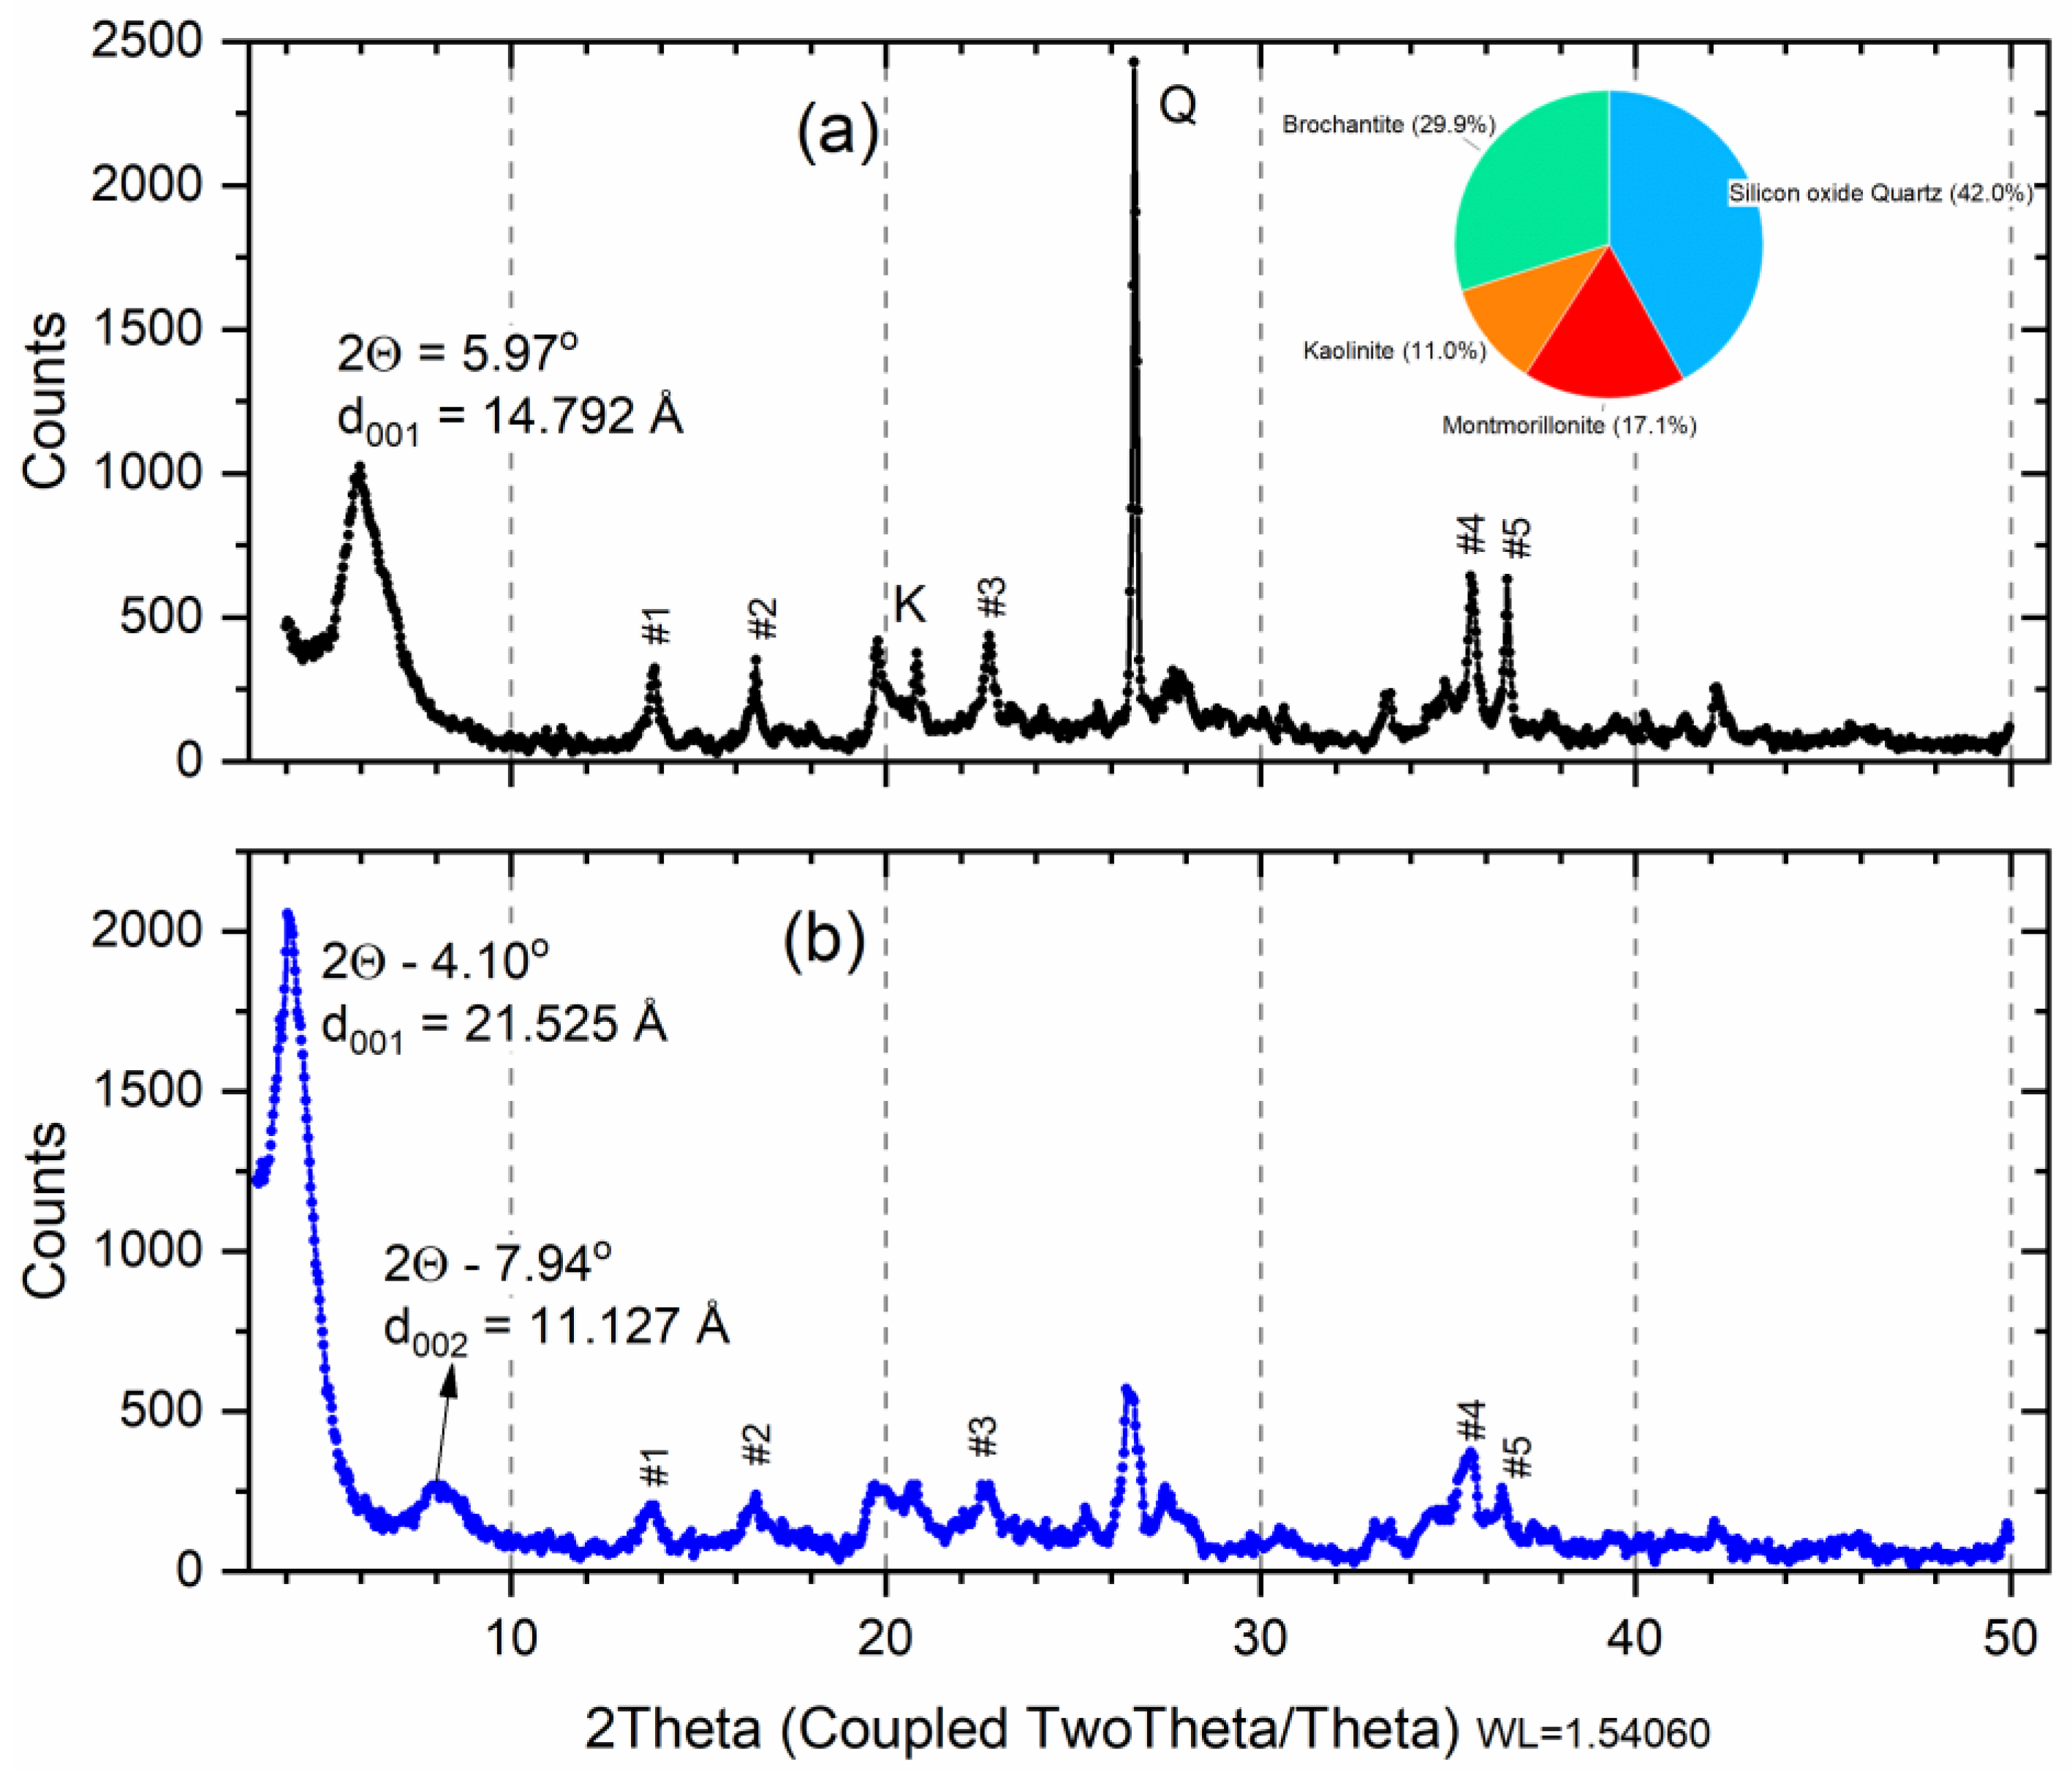
3.3. X-ray Diffractometry (XRD): Cu-Sm Sample
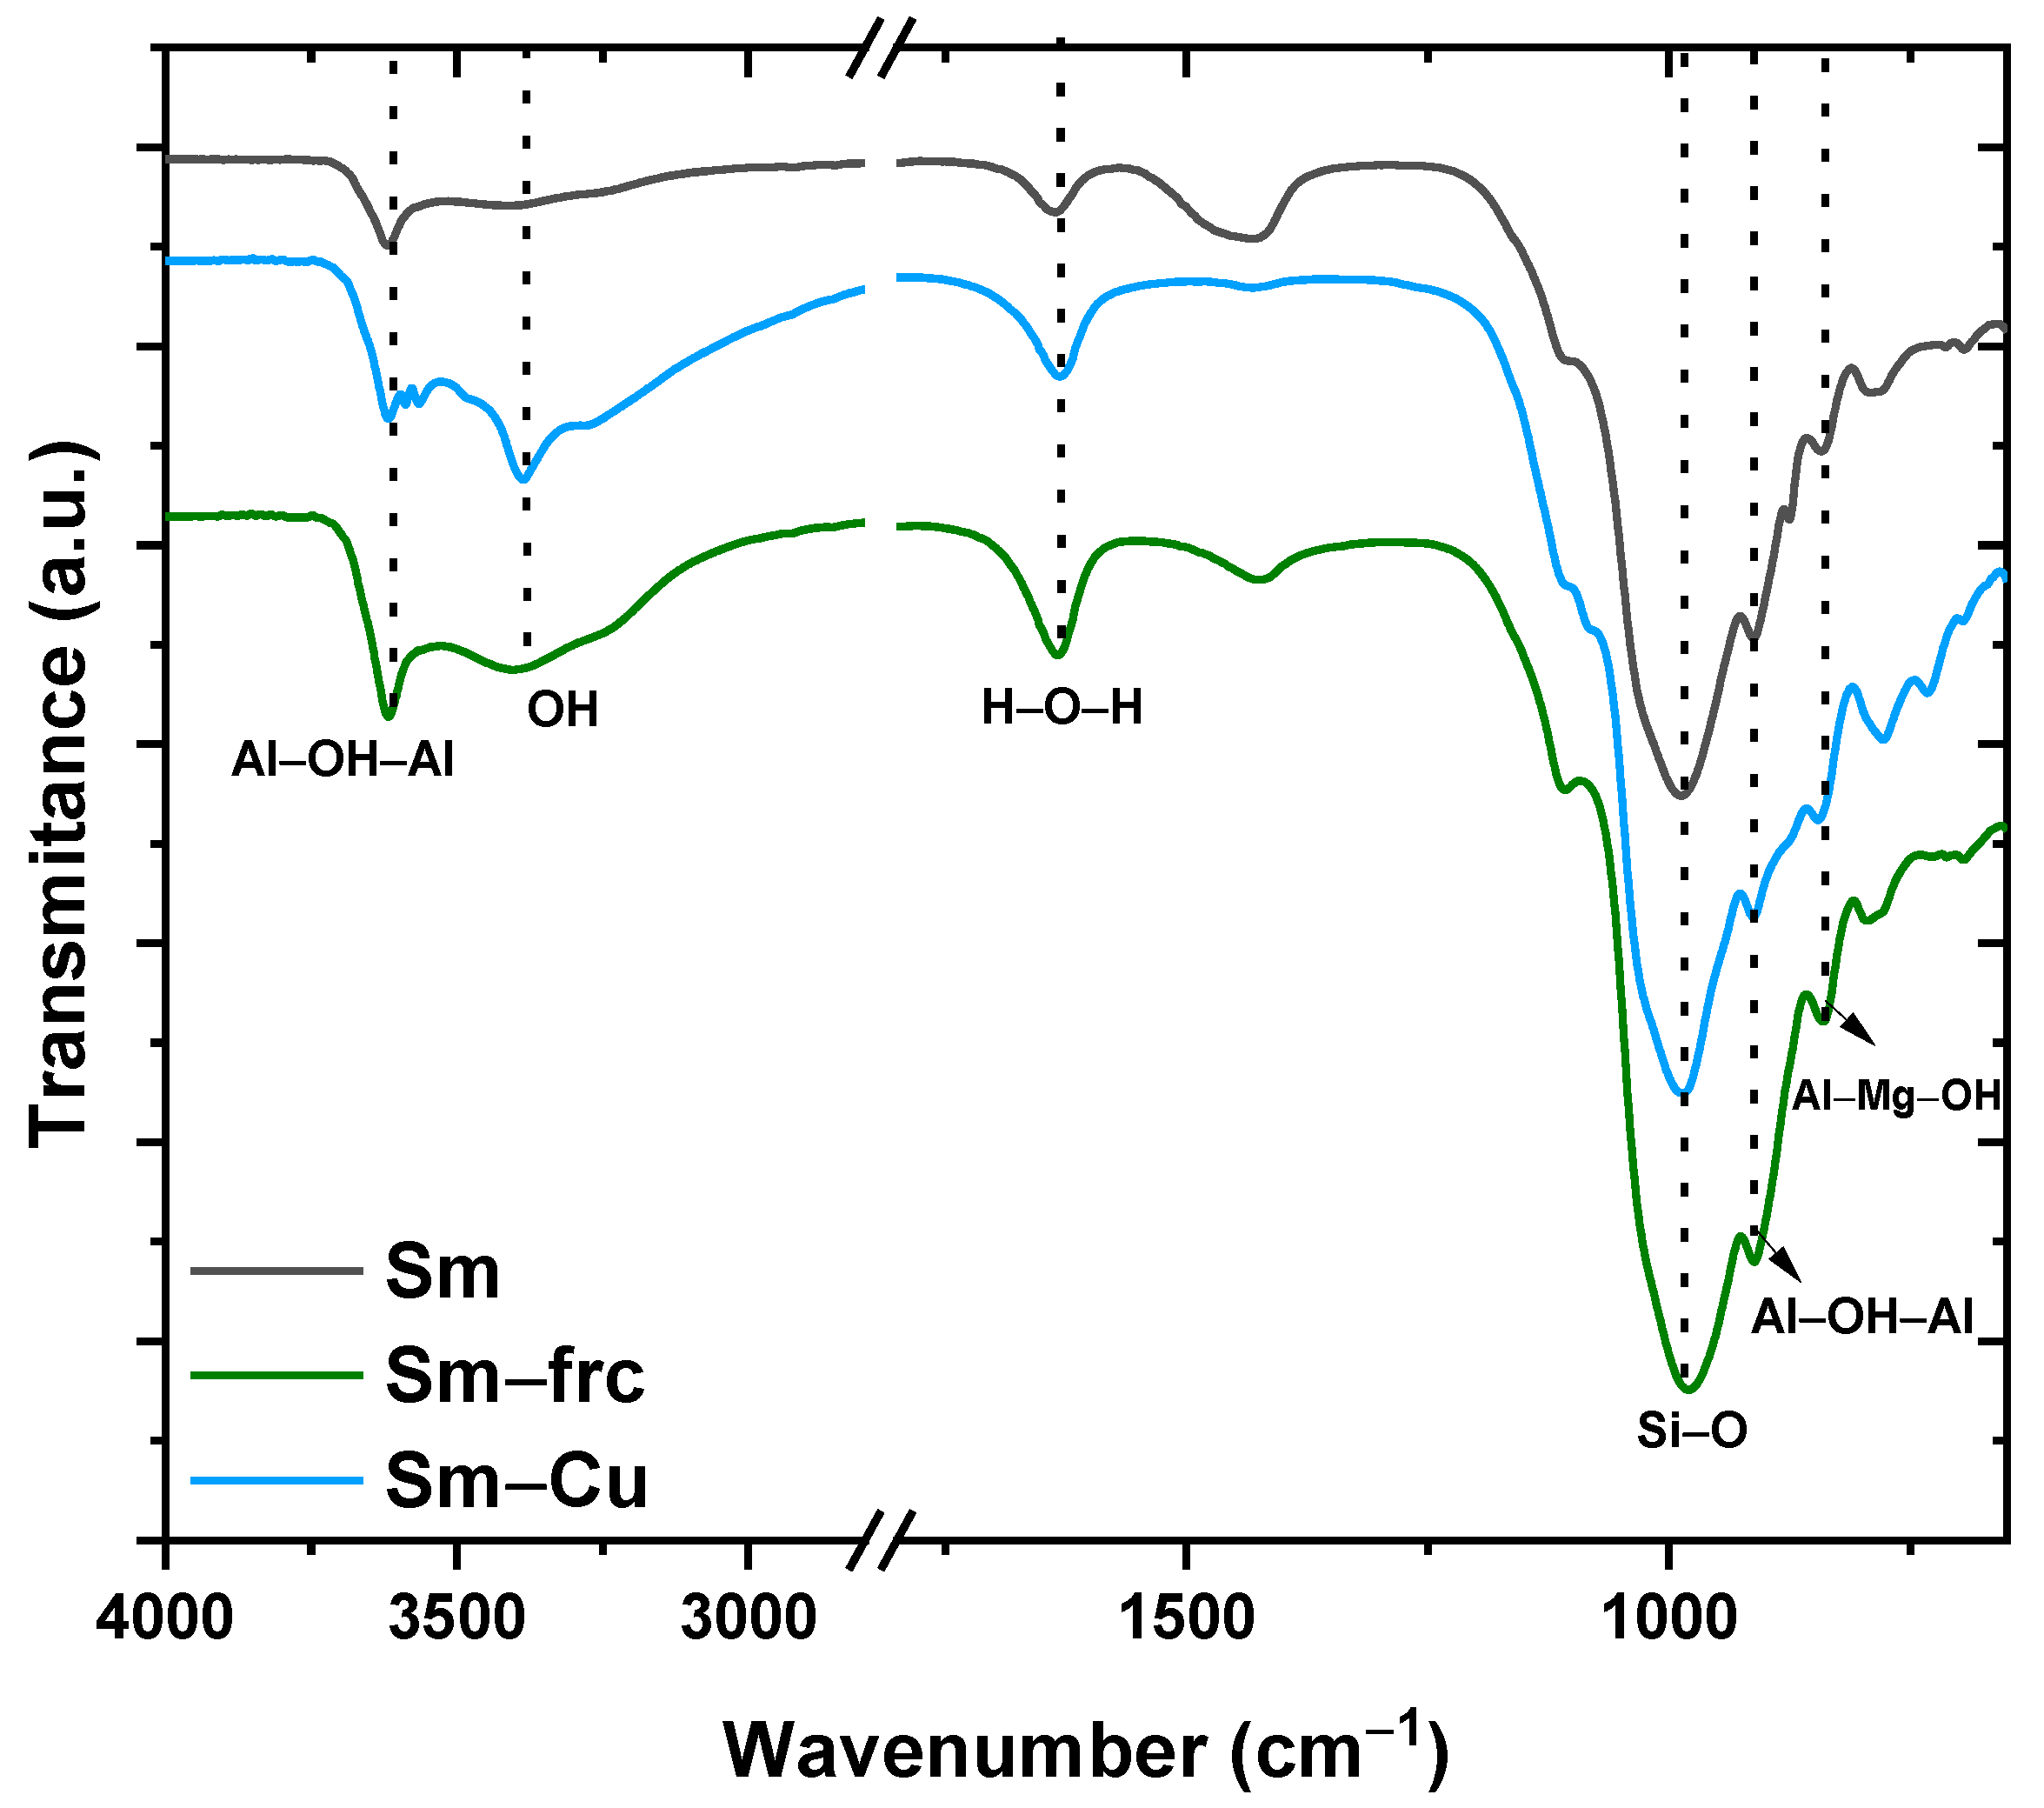
3.4. Fourier Transform Infrared Spectroscopy (FTIR)
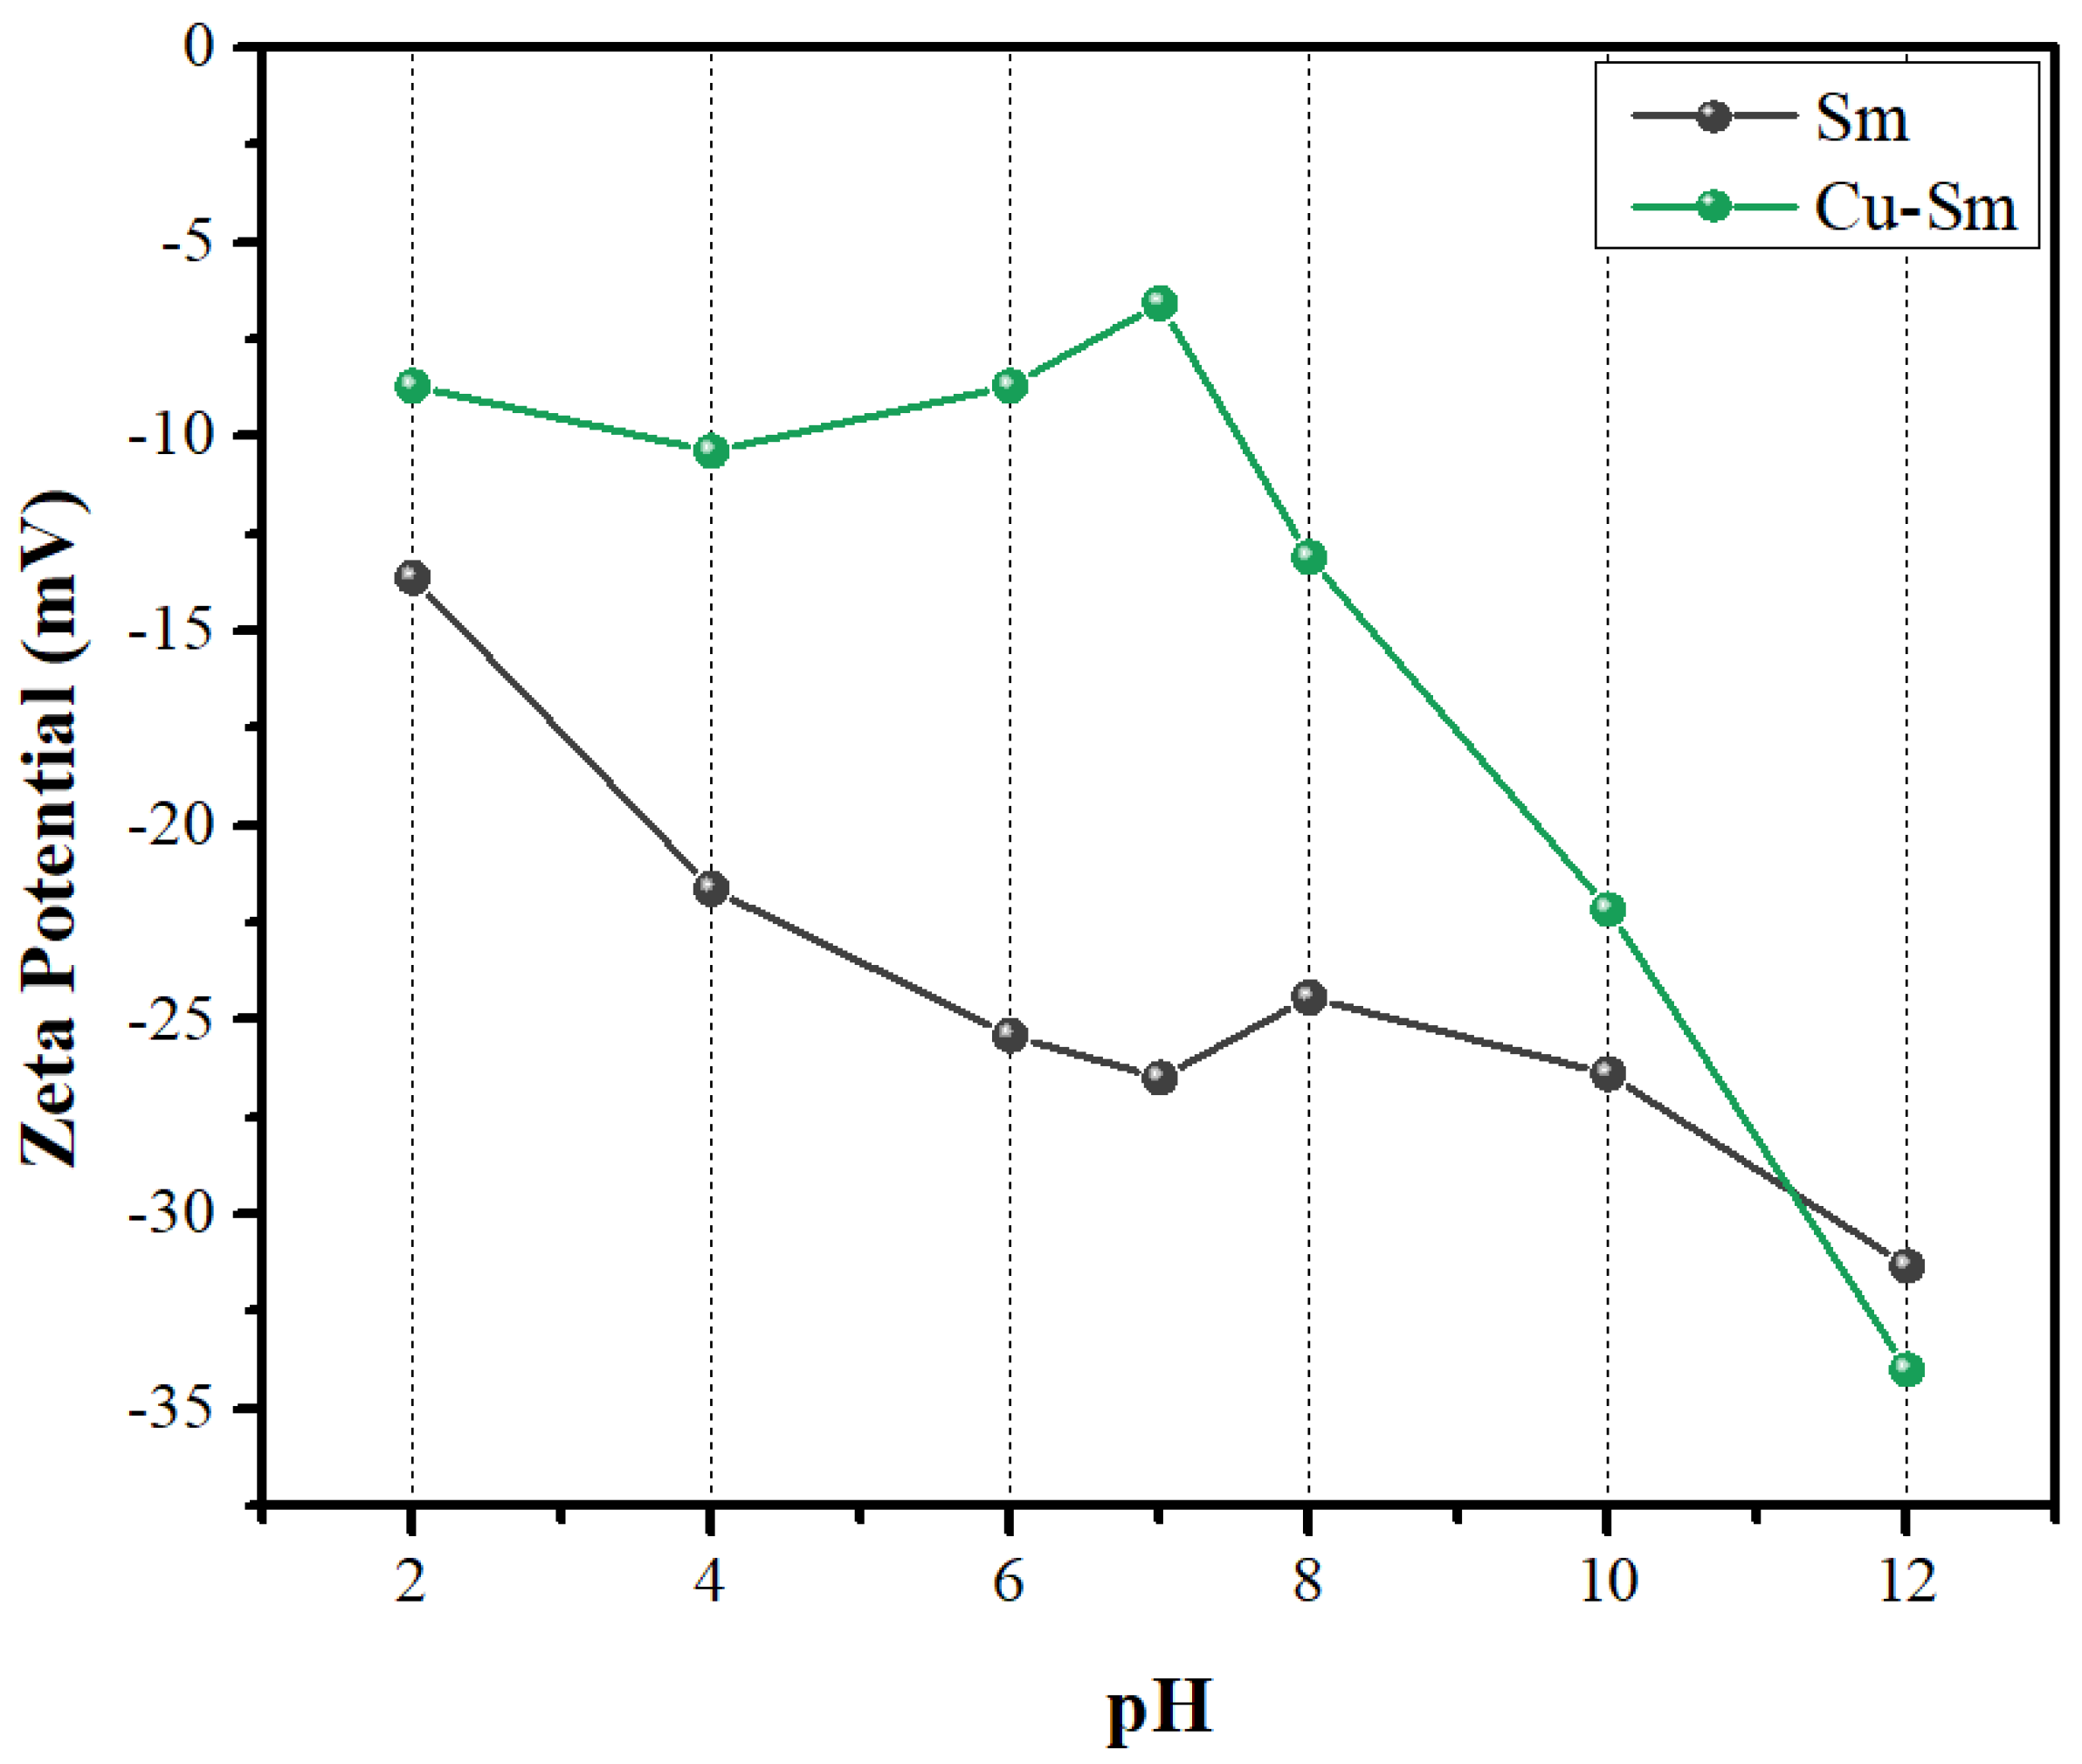
3.5. Zeta Potential (ζ)
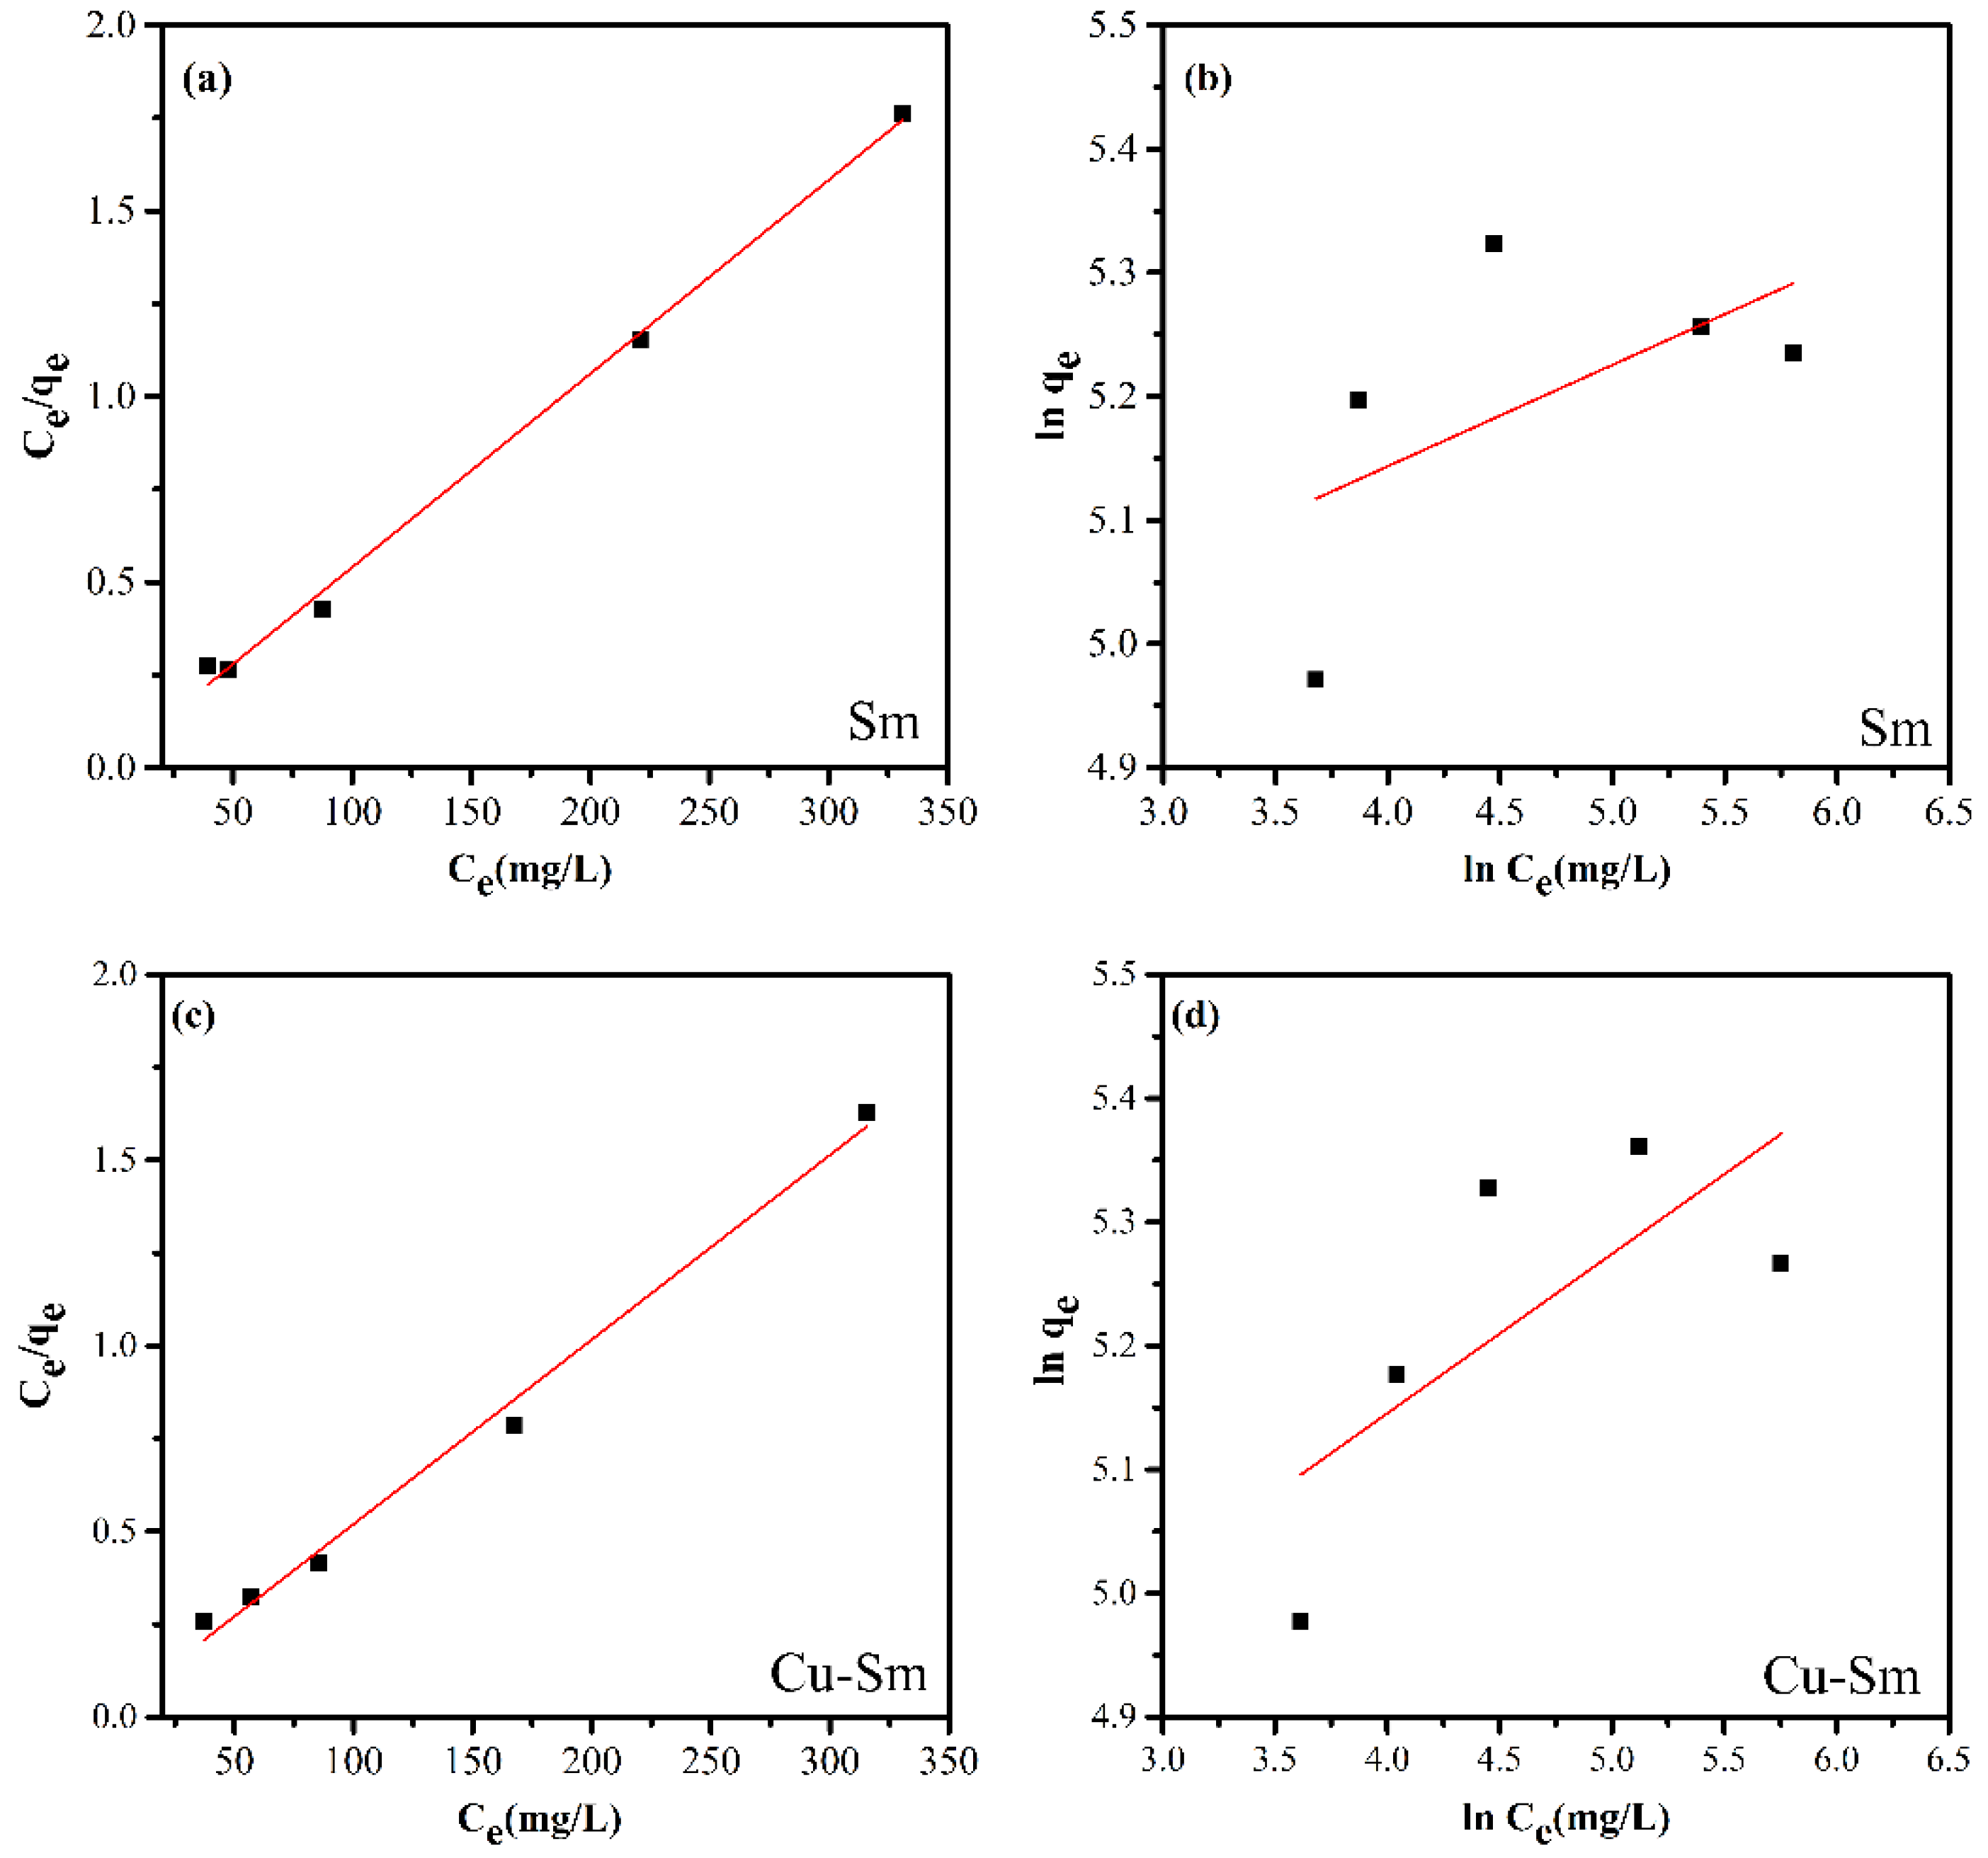
3.6. Adsorption Isotherms
3.7. Adsorption Mechanism
3.8. Hybrid Pigments—Color Properties
3.9. Hybrid Pigments—Stability Test
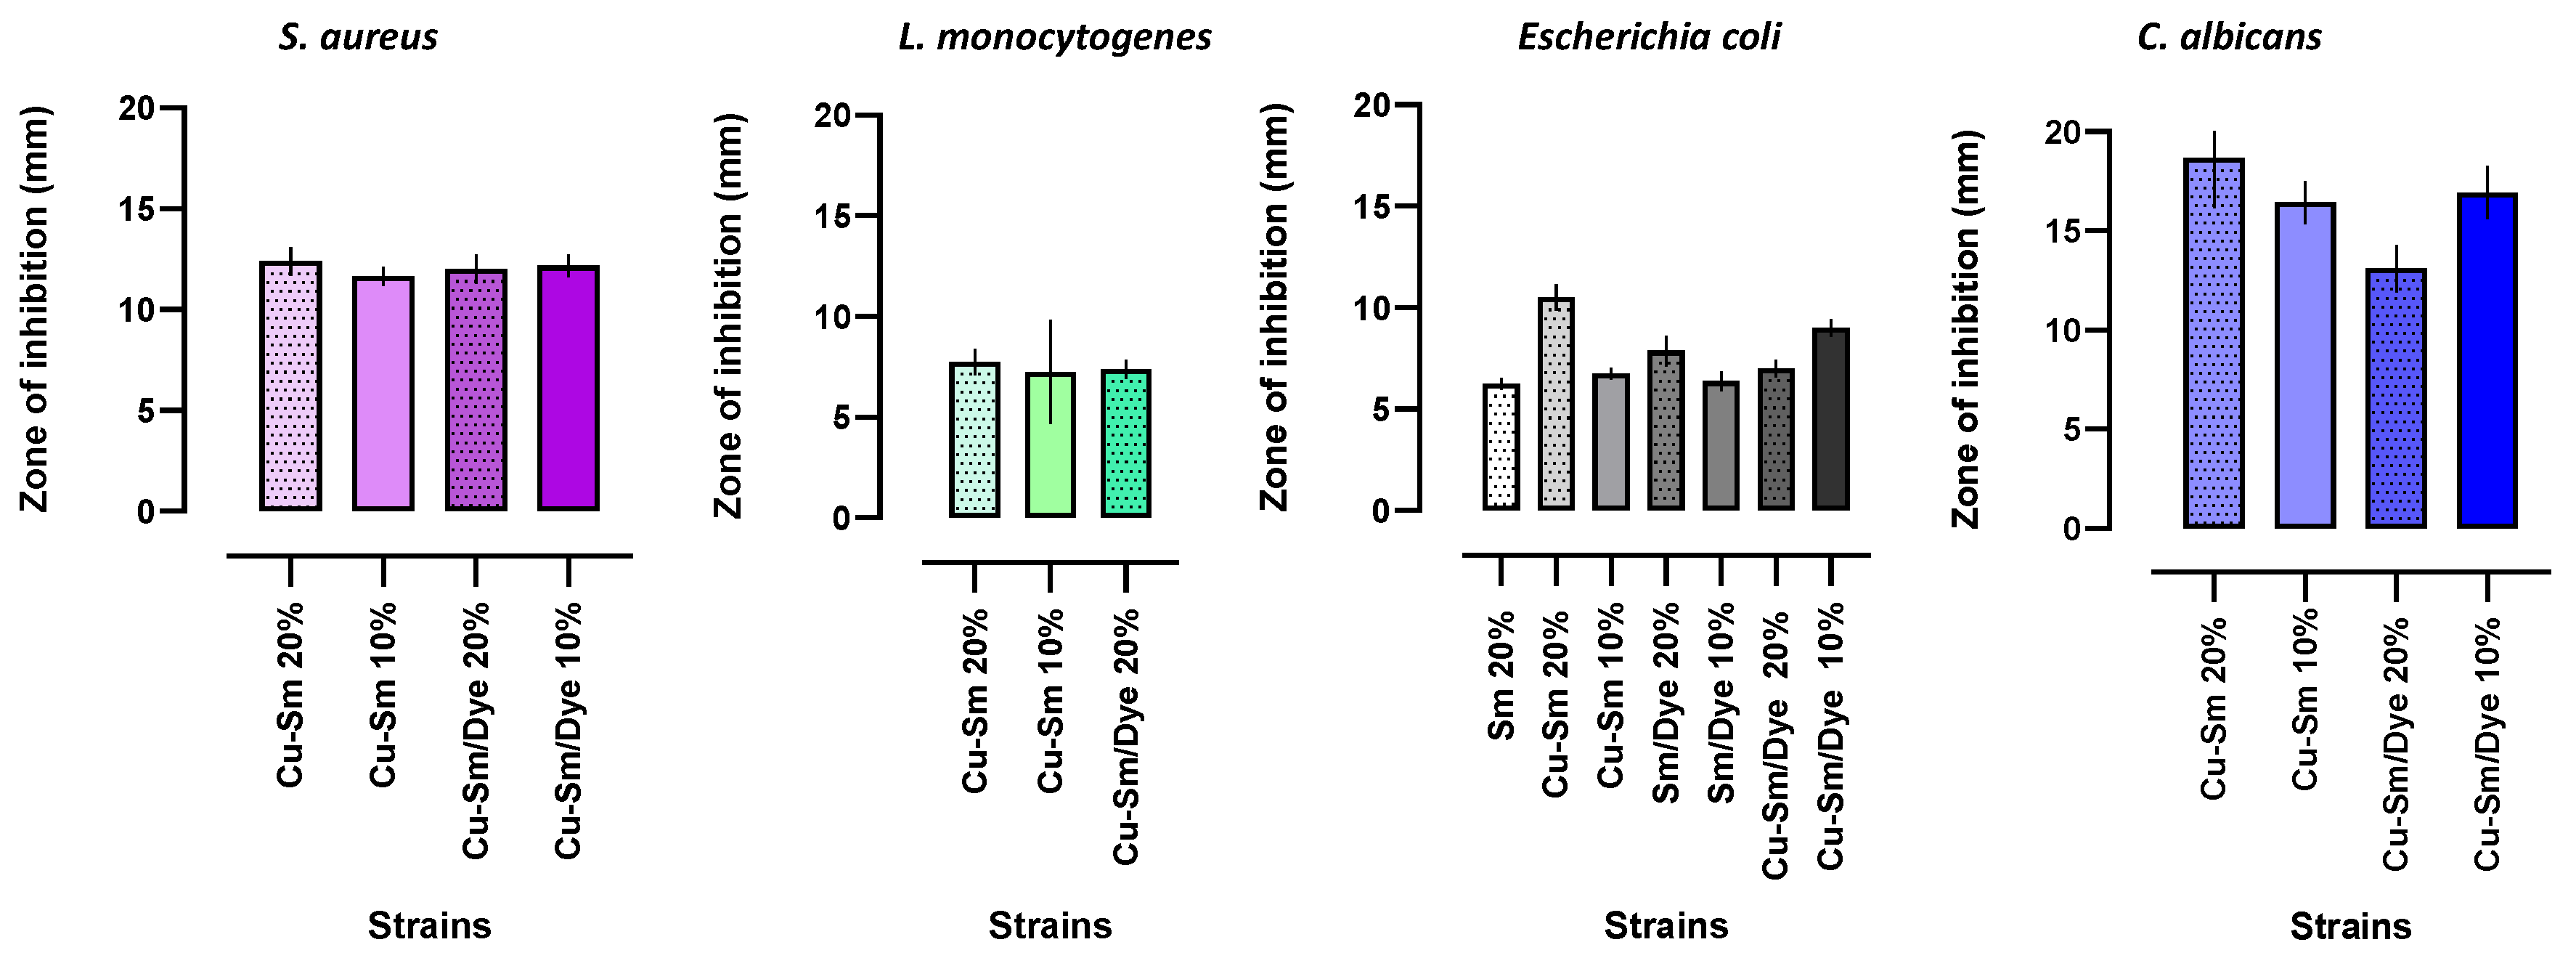
3.10. Hybrid Pigments—Antibacterial Properties
4. Conclusions
Author Contributions
Funding
Data Availability Statement
Acknowledgments
Conflicts of Interest
References
- Noreen, S.; Bhatti, H.N.; Zuber, M.; Zahid, M.; Asgher, M. Removal of Actacid Orange-RL Dye Biocomposites: Modeling Studies. Pol. J. Environ. Stud. 2017, 26, 2125–2134. [Google Scholar] [CrossRef] [PubMed]
- Saini, B.; Dey, A. Synthesis and Characterization of Copolymer Adsorbent for Crystal Violet Dye Removal from Water. Mater. Today Proc. 2022, 61, 342–350. [Google Scholar] [CrossRef]
- Bhatti, H.N.; Safa, Y.; Yakout, S.M.; Shair, O.H.; Iqbal, M.; Nazir, A. Efficient Removal of Dyes Using Carboxymethyl Cellulose/Alginate/Polyvinyl Alcohol/Rice Husk Composite: Adsorption/Desorption, Kinetics, and Recycling Studies. Int. J. Biol. Macromol. 2020, 150, 861–870. [Google Scholar] [CrossRef] [PubMed]
- Mittal, A.; Mittal, J.; Malviya, A.; Kaur, D.; Gupta, V.K. Adsorption of Hazardous Dye Crystal Violet from Wastewater by Waste Materials. J. Colloid Interface Sci. 2010, 343, 463–473. [Google Scholar] [CrossRef] [PubMed]
- Cheruiyot, G.K.; Wanyonyi, W.C.; Kiplimo, J.J.; Maina, E.N. Adsorption of Toxic Crystal Violet Dye Using Coffee Husks: Equilibrium, Kinetics, and Thermodynamics Study. Sci. Afr. 2019, 5, e00116. [Google Scholar] [CrossRef]
- Ahmad, R. Studies on adsorption of crystal violet dye from aqueous solution onto coniferous pinus bark powder (CPBP). J. Hazard. Mater. 2009, 171, 763–773. [Google Scholar] [CrossRef] [PubMed]
- Rafatullah, M.; Sulaiman, O.; Hashim, R.; Ahmad, A. Adsorption of Methylene Blue on Low-Cost Adsorbents: A Review. J. Hazard. Mater. 2010, 177, 70–80. [Google Scholar] [CrossRef] [PubMed]
- Peixoto, F.P.; Marinho, G.; Rodrigues, K. Corantes Têxteis: Uma Revisão. Holos 2013, 5, 98. [Google Scholar] [CrossRef] [Green Version]
- Klein, C.; Dutrow, B. Manual de Ciências Dos Minerais, 23rd ed.; weber Nowaczyk, D., Ed.; Bookman Editora: São Paulo, Brasil, 2012; ISBN 978-85-7780-963-9. [Google Scholar]
- De Freitas Melo, V.; Alleoni, L.R.F. Química e Mineralogia Do Solo: Conceitos Básicos e Aplicações; de Freitas Melo, V., Alleoni, L.R.F., Eds.; Sociedade Brasileira de Ciência do Solo: Viçosa, Brasil, 2019; ISBN 9788586504266. [Google Scholar]
- Santos, S.S.G.; Franca, D.B.; Castellano, L.R.C.; Tigueiro, P.; Filho, E.C.S.; Santos, I.M.; Fonseca, M.G. Novel modified bentonites applied to the removal of an anionic azo-dye from aqueous solution. Colloids Surf. A Physicochem. Eng. Asp. 2020, 5845, 124152. [Google Scholar] [CrossRef]
- Da Silva, J.C.S.; Franca, D.B.; Rodrigues, F.; Oliveira, D.M.; Trigueiro, P.; Filho, E.C.S.; Fonseca, M.G. What happens when chitosan meets bentonite under microwave-assisted conditions? Clay-based hybrid nanocomposites for dye adsorption. Colloids Surf. A Physicochem. Eng. Asp. 2021, 609, 125584. [Google Scholar] [CrossRef]
- Çelik, M.S. Electrokinetic Behavior of Clay Surfaces. Interface Sci. Technol. 2004, 1, 57–89. [Google Scholar] [CrossRef]
- Duarte-Neto, J.F.; Cartaxo, J.M.; Neves, G.A.; Menezes, R.R. Processos de Adsorção de Corantes Em Argilas Esmectíticas: Uma Revisão. Rev. Eletrônica Mater. Process. 2014, 9, 51–59. [Google Scholar]
- Zhou, C.; Tong, D.; Yu, W. Smectite Nanomaterials: Preparation, Properties, and Functional Applications; Elsevier Inc.: Amsterdam, The Netherlands, 2019; ISBN 9780128145333. [Google Scholar]
- Silva, A.R.V.; Ferreira, H.C. Argilas Bentoníticas: Conceitos, Estruturas, Propriedades, Usos Industriais, Reservas, Produção e Produtores/Fornecedores Nacionais e Internacionais|PDF|Cerâmica|Adsorção. Available online: https://pt.scribd.com/document/361933187/Argilas-bentoniticas-conceitos-estruturas-propriedades-usos-industriais-reservas-producao-e-produtores-fornecedores-nacionais-e-internacionais (accessed on 8 August 2022).
- Allahbakhsh, A.; Jarrahi, Z.; Farzi, G.; Shavandi, A. Three-Dimensional Nanoporous Cu-BTC/Graphene Oxide Nanocomposites with Engineered Antibacterial Properties Synthesized via a One-Pot Solvosonication Process. Mater. Chem. Phys. 2022, 277, 125502. [Google Scholar] [CrossRef]
- Calvacanti, G.R.S.; Rodrigues, F.; Zhuang, G.; Balme, S.; Janot, J.M.; Fonseca, M.G.; Jaber, M. Inorganic-organic hybrid pigments based on carminic acid and clay minerals. Dye. Pigm. 2021, 190, 109306. [Google Scholar] [CrossRef]
- Silva, G.T.M.; Silva, K.M.; Silva, C.P.; Gonçalves, J.M.; Quina, F.H. Hybrid Pigments from Anthocyanin Analogues and Synthetic Clay Minerals. ACS Omega 2020, 5, 26592–26600. [Google Scholar] [CrossRef] [PubMed]
- Alorabi, A.Q.; Hassan, M.S.; Alam, M.M.; Zabin, S.A.; Alsenani, N.I.; Baghdadi, E. Natural Clay as a Low-Cost Adsorbent for Crystal Violet Dye Removal and Antimicrobial Activity. Nanomaterials 2021, 11, 2789. [Google Scholar] [CrossRef]
- Chwastowski, J.; Satoń, P.; Pięta, E.; Paluszkiewicz, C. Bioremediation of Crystal Violet by Organic Matter and Assessment of Antimicrobial Properties of the Obtained Product. Sustainability 2023, 15, 67. [Google Scholar] [CrossRef]
- Shams, S.; Ahmad, W.; Memon, A.H.; Shams, S.; Wei, Y.; Yuan, Q.; Liang, H. Cu/H3BTC MOF as a Potential Antibacterial Therapeutic Agent against Staphylococcus Aureus and Escherichia Coli. New J. Chem. 2020, 44, 17671–17678. [Google Scholar] [CrossRef]
- Trigueiro, P.; Rodrigues, F.; Rigaud, B.; Balme, S.; Janot, J.M.; dos Santos, I.M.G.; Fonseca, M.G.; Osajima, J.; Walter, P.; Jaber, M. When Anthraquinone Dyes Meet Pillared Montmorillonite: Stability or Fading upon Exposure to Light? Dye. Pigment. 2018, 159, 384–394. [Google Scholar] [CrossRef]
- Feng, N.C.; Guo, X.Y. Characterization of adsorptive capacity and mechanisms on adsorption of copper, lead, and zinc by modified orange peel. Trans. Nonferrous Met. Soc. China 2012, 22, 1224–1231. [Google Scholar] [CrossRef]
- Match! Demonstration, version 3.10.1; Crystal Impact GbR: Bonn, Germany, 2022.
- Quindici, M. O Segredodas Cores; All Print: São Paulo, Brasil, 2013; ISBN 13-08586. [Google Scholar]
- Farbmetrische Bestimmung von Farbabständen Bei Körperfarben Nach Der CIELAB-Formel. Colorimetric Evaluation of Colour Differences of Surface Colours According to the CIELAB Formula. Available online: https://www.beuth.de/de/norm/din-6174/541403DIN6174:1979-01 (accessed on 5 June 2023).
- Zhuang, G.; Rodrigues, F.; Zhang, Z.; Fonseca, M.G.; Walter, P.; Jaber, M. Dressing Protective Clothing: Stabilizing Alizarin/Halloysite Hybrid Pigment and Beyond. Dye. Pigment. 2019, 166, 32–41. [Google Scholar] [CrossRef]
- Lima, L.C.B.; Silva, F.C.; Silva-Filho, E.C.; Fonseca, M.G.; Zhuang, G.; Jaber, M. Saponite-Anthocyanin Derivatives: The Role of Organoclays in Pigment Photostability. Appl. Clay Sci. 2020, 191, 105604. [Google Scholar] [CrossRef]
- Clinical and Laboratory Standards Institute. Performance Standards for Antimicrobial Disk Susceptibility Tests. Approved Standard, 11th ed.; Clinical and Laboratory Standards Institute: Wayne, PA, USA, 2012. [Google Scholar]
- Balaba, N.; Jaerger, S.; Horsth, D.F.L.; Primo, J.D.O.; Correa, J.D.S.; Bittencourt, C.; Zanette, C.M.; Anaissi, F.J. Polysaccharides as Green Fuels for the Synthesis of MgO: Characterization and Evaluation of Antimicrobial Activities. Molecules 2023, 28, 142. [Google Scholar] [CrossRef] [PubMed]
- Schons AB Appelt, P.; Correa, J.S.; Cunha, M.A.A.; Rodrigues, M.G.; Anaissi, F.J. Green Synthesis of Na abietate Obtained from the Salification of Pinus elliottii Resin with Promising Antimicrobial Action. Antibiotics 2023, 12, 514. [Google Scholar] [CrossRef] [PubMed]
- Porras, D.E.V.; Angélica, R.S.; da Paz, S.P.A. Practical Mineralogical Quantification of Bentonites Supported for a PXRD Calibrated Hkl Model. Braz. J. Geol. 2021, 51, 1. [Google Scholar] [CrossRef]
- Fontaine, F.; Christidis, G.E.; Yans, J.; Hollanders, S.; Hoffman, A.; Fagel, N. Characterization and Origin of Two Fe-Rich Bentonites from Westerwald (Germany). Appl. Clay Sci. 2020, 187, 105444. [Google Scholar] [CrossRef]
- Cullity, B.D.; Stock, S.R. Elements of X Ray Diffraction, 3rd ed.; Hall, P., Ed.; Addison-Wesley Publishing: Boston, MA, USA, 2001; ISBN 0201610914, 9780201610918. [Google Scholar]
- Dos Santos, C.P.F.; Melo, D.M.A.; Melo, M.A.F.; VSobrinho, E.V. Caracterização e Usos de Argilas Bentonitas e Vermiculitas Para Adsorção de Cobre (II) Em Solução. Cerâmica 2002, 48, 178–182. [Google Scholar] [CrossRef] [Green Version]
- Chen, J.; Lu, J.; Su, L.; Ruan, H.; Zhao, Y.; Lee, C.; Cai, Z.; Wu, Z.; Jiang, Y. Enhanced Adsorption of Methyl Orange by Mongolian Montmorillonite after Aluminum Pillaring. Appl. Sci. 2022, 12, 3182. [Google Scholar] [CrossRef]
- Madejová, J. FTIR Techniques in Clay Mineral Studies. Vib. Spectrosc. 2003, 31, 1–10. [Google Scholar] [CrossRef]
- Kaufhold, S.; Hein, M.; Dohrmann, R.; Ufer, K. Quantification of the Mineralogical Composition of Clays Using FTIR Spectroscopy. Vib. Spectrosc. 2012, 59, 29–39. [Google Scholar] [CrossRef]
- Şans, B.E.; Güven, O.; Esenli, F.; Çelik, M.S. Contribution of Cations and Layer Charges in the Smectite Structure on Zeta Potential of Ca-Bentonites. Appl. Clay Sci. 2017, 143, 415–421. [Google Scholar] [CrossRef]
- Darrow, M.M.; Guo, R.; Trainor, T.P. Zeta Potential of Cation-Treated Soils and Its Implication on Unfrozen Water Mobility. Cold Reg. Sci. Technol. 2020, 173, 103029. [Google Scholar] [CrossRef]
- Guida, I.I.S.; Falcão, S.S. Removal of Crystal Violet Textile Using Clay Maranhese of High Mounts as Adsorvent. Rev. Virtual De Quim. 2018, 10, 1087–1099. [Google Scholar] [CrossRef]
- Kumari, H.J.; Krishnamoorthy, P.; Arumigam, T.K.; Radhakrishnan, S.; Vasudevan, D. An efficient removal of crystal violet dye from wastewater byadsorption onto TLAC/Chitosan composite: A novel low cost adsorbent. Int. J. Biol. Macromol. 2017, 96, 324–333. [Google Scholar] [CrossRef]
- McLAREN, K. XIII—The Development of the CIE 1976 (L* a* b*) Uniform Colour Space and Colour-difference Formula. J. Soc. Dye. Colour. 2008, 92, 338–341. [Google Scholar] [CrossRef]
- Elsherif, K.M.; El-Dali, A.; Alkarewi, A.A.; Ewlad-Ahmed, A.M.; Treban, A. Adsorption of Crystal Violet Dye onto Olive Leaves Powder: Equilibrium and Kinetic Studies. Chem. Int. 2021, 7, 79–89. [Google Scholar] [CrossRef]
- Foroutan, R.; Peighambardoust, S.J.; Peighambardoust, S.H.; Pateiro, M.; Lorenzo, J.M. Adsorption of Crystal Violet Dye Using Activated Carbon of Lemon Wood and Activated Carbon/Fe3O4 Magnetic Nanocomposite from Aqueous Solutions: A Kinetic, Equilibrium and Thermodynamic Study. Molecules 2021, 26, 2241. [Google Scholar] [CrossRef]
- Azmi, N.N.; Mahyudin, N.A.; Wan Omar, W.H.; Mahmud Ab Rashid, N.-K.; Ishak, C.F.; Abdullah, A.H.; Sharples, G.J. Antibacterial Activity of Clay Soils against Food-Borne Salmonella typhimurium and Staphylococcus aureus. Molecules 2022, 27, 170. [Google Scholar] [CrossRef]
- Abdullah; Hussain, T.; Faisal, S.; Rizwan, M.; Zaman, S.N.; Iqbal, M.; Iqbal, A.; Ali, Z. Green synthesis and characterization of copper and nickel hybrid nanomaterials: Investigation of their biological and photocatalytic potential for the removal of organic crystal violet dye. J. Saudi Chem. Soc. 2022, 26, 101486. [Google Scholar] [CrossRef]
- Ozkan, E.; Ozkan, F.T.; Allan, E.; Parkin, I.P. The use of zinc oxide nanoparticles to enhance the antibacterial properties of light-activated polydimethylsiloxane containing crystal violet. RSC Adv. 2015, 5, 8806–8813. [Google Scholar] [CrossRef]
- Chebout, O.; Trifa, C.; Bouacida, S.; Boudraa, M.; Imane, H.; Merzougui, M.; Mazouz, W.; Ouari, K.; Boudaren, C.; Merazig, H. Two new copper (II) complexes with sulfanilamide as ligand: Synthesis, structural, thermal analysis, electrochemical studies and antibacterial activity. J. Mol. Struct. 2022, 1248, 131446. [Google Scholar] [CrossRef]
- Mutalik, C.; Okoro, G.; Krisnawati, D.I.; Jazidie, A.; Rahmawati, E.Q.; Rahayu, D.; Hsu, W.T.; Kuo, T.R. Copper sulfide with morphology-dependent photodynamic and photothermal antibacterial activities. J. Colloid Interf. Sci. 2022, 607, 1825–1835. [Google Scholar] [CrossRef] [PubMed]
- Medina-Ramírez, I.E.; Arzate-Cardenas, M.A.; Mojarro-Olmos, A.; Romo-López, M.A. Synthesis, characterization, toxicological and antibacterial activity evaluation of Cu@ZnO nanocomposites. Ceram. Int. 2019, 45, 17476–17488. [Google Scholar] [CrossRef]
- Dong, W.; Lu, Y.; Wang, W.; Zhang, M.; Jing, Y.; Wang, A. A sustainable approach to fabricate new 1D and 2D nanomaterials from natural abundant palygorskite clay for antibacterial and adsorption. J. Chem. Eng. 2020, 382, 122984. [Google Scholar] [CrossRef]
- Bagchi, B.; Kar, S.; Dey, S.K.; Bhandary, S.; Roy, D.; Mukhopadhyay, T.K.; Das, S.; Nandy, P. In situ synthesis and antibacterial activity of copper nanoparticle loaded natural montmorillonite clay based on contact inhibition and ion release. Colloids Surf. 2022, 108, 358–365. [Google Scholar] [CrossRef] [PubMed]
- Salah, I.; Parkin, I.P.; Allan, E. Copper as an Antimicrobial Agent: Recent Advances. RSC Adv. 2021, 11, 18179–18186. [Google Scholar] [CrossRef] [PubMed]


| Peak | Angle (2Θ) | d Value (Å) | Intensity (%) | Sm Sample * | M Sample |
|---|---|---|---|---|---|
| #1 | 5.97 | 14.808 | 100.0 | M | --- |
| 5.73 | 15.425 | 100.0 | --- | M | |
| #2 | 17.64 | 5.027 | 14.2 | M | -- |
| 19.89 | 4.458 | 32.5 | M or K | --- | |
| #3 | 19.78 | 4.487 | 5.4 | --- | M |
| 22.05 | 4.028 | 6.3 | M or K | M | |
| #4 | 23.39 | 3.800 | 13.4 | M or K | --- |
| 26.50 | 3.360 | 31.7 | --- | M | |
| #5 | 26.65 | 3.342 | 83.7 | K or Q | --- |
| 29.03 | 3.073 | 16.1 | --- | M | |
| #6 | 29.44 | 3.032 | 37.2 | M or K | --- |
| #7 | 34.87 | 2.570 | 12.4 | M or K | --- |
| #8 | 36.48 | 2.461 | 37.3 | K or Q | --- |
| #9 | 50.22 | 1.815 | 6.3 | K or Q | --- |
| #10 | 59.90 | 1.542 | 12.2 | K or Q | --- |
| #11 | 61.84 | 1.499 | 7.4 | M or K | --- |
| #12 | 67.92 | 1.378 | 7.4 | K or Q | --- |
| Sample | Chemical Contents (%) | ||||||
|---|---|---|---|---|---|---|---|
| Al2O3 | CaO | CuO | Fe2O3 | K2O | SiO2 | Others | |
| Sm | 10.385 | 18.213 | --- | 13.116 | 8.104 | 47.236 | 2.946 |
| M | 7.370 | 13.670 | --- | 14.346 | 8.075 | 46.727 | 9.812 |
| Sm-Cu | 9.187 | 0.560 | 34.697 | 2.143 | 2.989 | 42.641 | 7.783 |
| Sample | Langmuir | Freundlich | ||||
|---|---|---|---|---|---|---|
| KL (L mg−1) | qmax (mg g−1) | R2 | KF (mg g−1) | n | R2 | |
| Sm | 0.2851 | 191.571 | 0.997 | 123.480 | 12.2714 | 0.323 |
| Cu-Sm | 0.2195 | 201.207 | 0.992 | 102.551 | 7.7658 | 0.511 |
| Concentration (mg L−1) | Removal Efficiency (%) | |
|---|---|---|
| Sm | Cu-Sm | |
| 400 | 90.09 (360.36 mg) | 90.71 (362.84 mg) |
| 500 | 90.38 (451.90 mg) | 88.59 (442.95 mg) |
| 600 | 85.45 (512.70 mg)) | 85.78 (514.68 mg) |
| 700 | 68.45 (479.15 mg) | 76.09 (532.63 mg) |
| 800 | 58.64 (469.12 mg) | 60.58 (484.64 mg) |
| Sample | Pseudo-First Order | Pseudo-Second Order | ||||
|---|---|---|---|---|---|---|
| qe (mg g−1) | K1 (min−1) | R12 | qe (mg g−1) | K2 (g mg−1 min−1) | R22 | |
| Sm | 31.191 | 0.0209 | 0.916 | 140.252 | 0.00282 | 0.998 |
| Cu-Sm | 17.992 | 0.0031 | 0.692 | 144.927 | 0.00155 | 0.999 |
| Adsorbent | qmax (mg g−1) | References |
|---|---|---|
| Magnetic biochar | 111.48 | Yi et al. (2021) [44] |
| Olive leaves powder | 133.33 | Elsherif et al. (2021) [45] |
| Activated carbon prepared from lemon wood | 23.64 | Foroutan et al. (2021) [46] |
| ACL/Fe3O4 magnetic nanocomposite | 35.31 | Foroutan et al. (2021) [46] |
| Smectite (Sm) | 191.57 | This study |
| Smectite dopped with copper (Cu-Sm) | 201.21 | This study |
| Sample | Images | Colorimetric Parameter | ||||
|---|---|---|---|---|---|---|
| L* | a* | b* | C* | ∆E | ||
| Sm powder |  | 68.44 | 1.94 | 13.44 | 13.58 | 13.44 |
| Sm in paint |  | 78.51 | 0.51 | 4.65 | 4.68 | |
| Cu-Sm powder |  | 74.51 | −13.64 | 9.79 | 16.79 | 17.57 |
| Cu-Sm in paint |  | 88.07 | −4.57 | 3.26 | 5.61 | |
| Sm/Dye powder |  | 14.34 | 8.07 | −7.95 | 11.33 | 44.48 |
| Sm/Dye in paint | 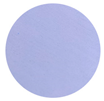 | 56.56 | 8.26 | −21.95 | 23.45 | |
| Cu-Sm/Dye powder | 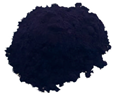 | 8.77 | 8.76 | −7.22 | 11.35 | 49.78 |
| Cu-Sm/Dye in paint | 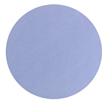 | 56.55 | 7.22 | −21.12 | 22.32 | |
Disclaimer/Publisher’s Note: The statements, opinions and data contained in all publications are solely those of the individual author(s) and contributor(s) and not of MDPI and/or the editor(s). MDPI and/or the editor(s) disclaim responsibility for any injury to people or property resulting from any ideas, methods, instructions or products referred to in the content. |
© 2023 by the authors. Licensee MDPI, Basel, Switzerland. This article is an open access article distributed under the terms and conditions of the Creative Commons Attribution (CC BY) license (https://creativecommons.org/licenses/by/4.0/).
Share and Cite
Rocha, M.L.M.; Balaba, N.; Jaerger, S.; Primo, J.O.; Horsth, D.F.L.; Appelt, P.; Meneguzzi, D.; Cunha, M.A.A.; Anaissi, F.J. Raw Smectite from the Guarapuava–Parana–Brasil Saturated with Copper Ions and Its Properties. Minerals 2023, 13, 785. https://doi.org/10.3390/min13060785
Rocha MLM, Balaba N, Jaerger S, Primo JO, Horsth DFL, Appelt P, Meneguzzi D, Cunha MAA, Anaissi FJ. Raw Smectite from the Guarapuava–Parana–Brasil Saturated with Copper Ions and Its Properties. Minerals. 2023; 13(6):785. https://doi.org/10.3390/min13060785
Chicago/Turabian StyleRocha, Maria Lidia M., Nayara Balaba, Silvia Jaerger, Julia O. Primo, Dienifer F. L. Horsth, Patrícia Appelt, Daiane Meneguzzi, Mário A. A. Cunha, and Fauze J. Anaissi. 2023. "Raw Smectite from the Guarapuava–Parana–Brasil Saturated with Copper Ions and Its Properties" Minerals 13, no. 6: 785. https://doi.org/10.3390/min13060785