Abstract
The Yarkand Basin, located in the southwest of the Tarim Basin, is a northeastern part of the eastern Paratethys ocean in the Paleocene, and a significant amount of evaporites, with gypsum, anhydrite, and halite as the main types, were developed in this area. These evaporites record the sedimentary environment at that time. A study was conducted on the sulfur isotopic composition of gypsum in the Paleocene of the Yarkand Basin to explore the origin of the evaporites and interpret the sedimentary environment. The experimentally measured sulfur isotope δ34SCDT values of 187 gypsum samples ranged from 6.69‰ to 25.92‰ with an average value of 18.64‰. The overall trend of the Paleocene gypsum sulfur isotopic curve is consistent with the global seawater sulfur isotopic curve, which shows a decreasing trend. In the early and middle Paleocene, the curve shows four stages of sulfur isotope increase, indicating that the sedimentary environment during that time was mainly influenced by bacterial reduction and a relatively open sedimentary environment, while the late period shows a decreasing trend, suggesting that the late period may be primarily influenced by terrigenous freshwater. In addition, the sulfur isotope value has the characteristics of decreasing from northwest to southeast of the basin, which may indicate that the sedimentary environment of Paleocene evaporites in the Yarkand Basin may also be related to paleotopography and distance from the estuary, resulting in differences in sedimentary environments. The mainly original sulfur isotope values of the Paleocene evaporites in the Yarkand Basin should be in the range of 18‰–20‰, which is a supplement to the Paleocene global paleoseawater and is of great significance for the reconstruction of the marine transgressive–regressive cycle and sulfur isotopic composition of the eastern Paratethys ocean during this period.
1. Introduction
Evaporite, a type of chemical sedimentary rock, serves as a valuable archive for paleoenvironmental information in basins. It not only contains significant records of paleoseawater and paleoclimate, but also acts as a sensitive indicator of sedimentary environments and climate conditions [1,2,3,4]. Sulfur isotopic techniques have been widely used to study evaporites in saline lakes in recent years [5], as they allow for regional and even global comparison of marine sedimentary layers due to their highly regular distribution in sulfate. Especially under complex conditions, analyzing the distribution of sulfur isotopes provides substantial evidence for reconstructing paleogeographic sedimentary environments and understanding the genesis of evaporites [6,7,8,9]. The sulfur isotope composition of marine evaporites records the evolutionary history of seawater sulfates in different geological periods. By studying sulfates in evaporites, deep-sea barites, and carbonate minerals, it becomes possible to reconstruct a time record curve of δ34S values [10,11,12,13,14,15].
Evaporites are closely related to geotectonic activities and marine transgression–regression cycles [16]. Massive evaporite sequences generally occur at the end of global geotectonic cycles, often associated with global marine regression [17]. The Yarkand Basin, located in the northeastern region of the eastern Paratethys ocean, was intermittently intruded by the Paratethys seawater during the Paleocene, so providing abundant provenance for the evaporite sequences. Evaporitic deposits are controlled by seawater during marine transgression–regression cycles, leading to continuous shifts in the depositional scale and concentrated centers of the evaporite formation [18]. The minerals found in the Yarkand Basin evaporites primarily include halite, gypsum, anhydrite, polyhalite, glauberite, and syngenite. The Yarkand Basin underwent at least five stages of transgression–regression cycles during the Paleocene, resulting in the gradual evaporation and concentration of seawater in the basin [19]. This process led to the formation of a thick sequence of evaporites, known as the Aertashen Formation, which consists of thick gypsum layers interbedded with limestone and shale [20]. This evaporite sedimentary sequence is controlled by the transgressive–regressive cycle caused by the Tethys tectonic event and, thus, records the evolutionary history of Tethys seawater, especially the changes in sulfur isotopic composition.
Many studies have been made on evaporite distribution, horizon, mineral assemblage, potassium-forming prospect, tectonic activity, range of marine transgression, and evolution of ancient bay in the Yarkand Basin [21,22,23,24,25,26,27,28,29,30]. However, the sedimentary environment of evaporites has been less studied. Cao (2021, 2022) used gypsum sulfur isotopes to mainly explain the Paleocene marine environment of the Yarkand Basin [19,20]. Some gypsum samples from the Aertashen and Dashankou profiles in the Yarkand Basin were selected for sulfur isotope analysis, and the δ34S in gypsum ranged from 16‰ to 21‰ (essentially a marine depositional environment) and 14‰ to 21‰ (an interactive marine depositional environment), reflecting the difference in the source of evaporite material [31]. Wang and Cao (2022) reconstruct and complement changes in the sulfur isotopic composition of the Paleocene seawater sulfates [32]. However, the samples in the above study are not sufficient and most of them are from outcrop profiles, which are easy to be weathered, so it is insufficient to discuss the sulfur isotopic composition and evolution rule of the Paleocene seawater systematically and entirely in the Yarkand Basin. The general trend difference of gypsum sulfur isotope in the Yarkand Basin and its causes are not clear; accordingly, the global data of sulfur isotopic composition in the Paleocene are relatively rare, which cannot limit the stratigraphic evolution of marine sulfur isotopic composition well. This paper aims to study the sulfur isotope of evaporative gypsum to explore the evolution of the Paleocene sedimentary environment in the Yarkand Basin and establish the Paleocene sulfur isotopic variational curve. It is important for revealing the evolution of seawater in the eastern Paratethys ocean and can provide a valuable addition to the global sulfur isotopic record.
2. Geological Setting
The Yarkand Basin, located in the southwestern area of the Tarim Basin, was a foreland basin that has undergone late tectonic activities after being formed on a prehistoric crystalline basement [33,34]. The area consists of a piedmont thrust belt that runs from the West Kunlun piedmont to the basin’s interior, a central sag (divided into the Kashgar and Yecheng-Hotan sags), the Markit slope belt, and the Bachu frontal uplift zone [35,36] (Figure 1). The basin was an inherited strike-slip graben basin during the early Cretaceous. The palaeolandscapes of this basin during the Late Cretaceous–Palaeocene period were consistent with their Early Cretaceous counterparts, and the basin entered a stage of foreland basin development during this time. The subsidence and deposition of the basin were distributed along the West Kunlun and South Tianshan piedmont [37]. Since the Cenozoic, the basin has been influenced by the far-field effect of the collision between the Indian and Eurasian plates, resulting in the development of several sedimentation centers and a vast sedimentary cover [38]. The sedimentation centers have gradually migrated from the West Kunlun front to the Yecheng–Kashgar line [39].
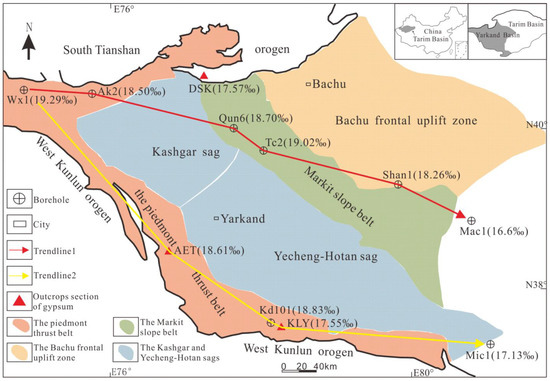
Figure 1.
The location of drilling holes, evaporite outcrops, secondary tectonic units, and variation of sulfur isotope means in Yarkand Basin. The yellow trendline represents the average value of sulfur isotopes decreasing southeastward along the West Kunlun Mountains. This red trendline indicates that the average value of sulfur isotopes decreases from the junction of the West Kunlun Mountains and the South Tianshan Mountains towards the Markit slope belt.
During the Early Cretaceous, seawater intruded into the Yarkand Basin from the southwestern Tarim Basin in a west-to-east direction. The transgression continued to increase during the Paleocene era [40]. The sediment sources in front of the South Tianshan Mountains and the West Kunlun Mountains controlled the deposition in the Yarkand Basin during the Early Cretaceous. The extent of deposition distributed along the western Kunlun front showed a long strip in the NW-SE direction, and the sedimentary thickness gradually decreased from west to east [41]. In the Late Cretaceous, the basin experienced successive development of sedimentary facies, including a braided river delta, a supratidal evaporative sand–mud flat, a carbonate platform, and a salt–gypsum flat [42]. During the early Paleocene–Eocene, the basin was a semi-closed estuarine and lagoon environment, with terrestrial clastic deposition playing a significant role in the development of clastic rocks, gypsum rocks, and carbonate rocks [30]. These developments were influenced by subtropical arid climate conditions [43]. Multiple large-scale marine transgressive–regressive cycles occurred in the basin during the Late Cretaceous–Paleocene [19]. The Paleocene Aertashen Formation was deposited in a lacustrine sedimentary environment. It primarily consists of thick to massive gypsum, anhydrite layers interbedded with mudstone (or sandstone), and limestone (or argillaceous limestone). The contact between the Aertashen Formation and the underlying Late Cretaceous Tuyiluoke Formation is characterized as conformity [44]. As the extent of marine transgression increased, the bay waters deepened, and the salinity of the water body normalized. This led to the development of thick deposits of shallow marine platform facies, including limestone, mudstone, and marly limestone [20].
3. Methods
A total of 187 gypsum samples were selected from six boreholes (Wx1, Ak2, Kd101, Qun6, Tc2, and Shan1) (Figure 1) of the Paleocene Aertashen Formation in the Yarkand Basin (see Figure 2 for hand specimens of some samples). Then, all samples were ground to 200 mesh, and the analysis was carried out at the Analysis and Testing Center of the Institute of Nuclear Industry Geology in Beijing. A suitable amount of sulfate sample containing about 15 mg of sulfur was taken, and barium sulfate was extracted by the semi-melting method using a mixture of sodium carbonate and zinc oxide solvent. Barium sulfate, vanadium pentoxide, and quartz sand were mixed in the weight ratio of 1:3:3.5. The sulfur dioxide gas was oxidized by heating at 980 °C under near vacuum (2.0 × 10⁻² Pa) to generate sulfur dioxide gas, which was collected by freezing method and analyzed for sulfur isotopic composition by Delta V Plus gas isotope mass spectrometry. CDT is used as the standard, and the calculated results are recorded by δ34SV-CDT; the analytical accuracy is better than ±0.2‰. The sulfide reference standards are GBW-04414 and GBW-04415 silver sulfide, with δ34S of −0.07 ± 0.13‰ and 22.15 ± 0.14‰, respectively.
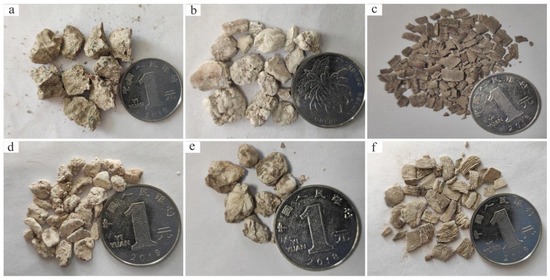
Figure 2.
Pictures of partial gypsum samples: (a) gypsum of Ak2-1 at the 3902 m; (b) gypsum of Kd101-5 at the 2775 m; (c) gypsum of Qun6-5 at the 4594 m; (d) gypsum of S1-1 at the 664 m; (e) gypsum of Tc2-3 at the 4399 m; (f) gypsum of Wx1-21 at the 3630 m.
4. Results
The test results show that the distribution range of gypsum δ34S values in different depth segments is large, with a range of 6.69‰–25.92‰, and an average of 18.64‰. The sample with a maximum of 25.92% was found at a depth of 2775 m (Figure 2b), and the sample with a minimum of 6.69% was found at a depth of 664 m (Figure 2d). The difference value between the maximum and minimum is 19.23%. However, the distribution range is relatively concentrated, with 84.49% of them in the range of 18‰~20‰. All data are shown in Table 1, and distribution characteristics are shown in Figure 3.

Table 1.
Gypsum sulfur isotope values of six boreholes in the Paleocene.
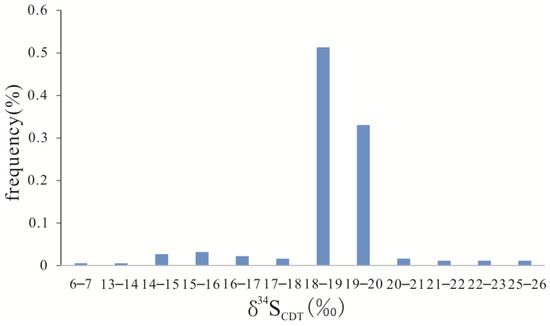
Figure 3.
Distribution characteristics of gypsum sulfur isotopic values in Yarkand Basin.
5. Discussion
5.1. Characteristics of Sulfur Isotopic Composition
The δ34S composition of marine sulfate is a crucial indicator of the global sulfur cycle throughout geological history. In contemporary seawater sulfate and evaporites of marine origin, the sulfur isotopic δ34S values typically range from 19.0‰ to 24.3‰, with the majority clustering around 21‰ [45]. In addition, during the Paleocene period, seawater precipitation had δ34S values ranging from 16‰ to 20‰ [15]. Most of the samples analyzed in this study exhibit δ34S values within this range, indicating a similarity to the isotopic composition of Paleocene marine sulfates. This suggests that the formation of gypsum in the Yarkand Basin resulted from cycles of marine evaporation.
Table 2 lists the maximum, minimum, and average values of the measured sulfur isotopic δ34S values of Paleocene gypsum and the statistics of samples in the Yarkand Basin. The δ34S values of sulfur isotopes varied considerably, ranging from 6.69‰ to 25.92‰. The magnitude of variation varies among borehole sections; for example, the gypsum δ34S value in the Shan1 borehole has the largest variation of 15.48‰, while the Tc2 borehole has the smallest variation of 0.42‰. Nonetheless, despite variations in gypsum δ34S values among different drill holes, the average values generally fall within the range of 18.26‰ to 19.29‰, suggesting that relative stability in the Paleocene depositional environment of the Yarkand Basin as a whole.
Table 2.
Maximum value, mean value, range of variation, and count of samples of gypsum sulfur isotope.
5.2. Sulfur Isotopic Curve of the Paleocene
The sulfur isotopes present in seawater sulfate can serve as an important tool for stratigraphic correlation. Raw data on seawater sulfur isotopes preserved in evaporites, carbonate-associated sulfates, and marine barite from around the world are commonly used to reconstruct seawater sulfate's continuous sulfur isotopic curves for the Phanerozoic [8,10,15,46,47,48,49]. In particular, the Yarkand Basin, located in the northeast of the eastern Paratethys ocean, experienced numerous large-scale marine transgression–regression cycles during the Late Cretaceous–Paleocene period, particularly in the western Tarim Basin [25]. These cycles led to the recurrent formation of evaporite deposits, with the well-known Paleocene Aertashen Formation being a notable example. Consequently, the region presents a unique opportunity to study the evolutionary history of sulfur isotopes due to the nearly continuous deposition of evaporites [50].
However, the strata where the boreholes are located may have undergone superimposed thickening or tip extinction due to the influence of multiple periods of transgressive–regressive events and later tectonic evolution in the Yarkand Basin during the Paleocene, which may destroy the complete sedimentary sequence of evaporite. It is impossible to reconstruct the Paleocene sulfur isotopic curve simply according to the depth of borehole samples. Therefore, it is necessary to reorder these boreholes according to the sequence of rocks formed by transgression and regression. For evaporite basins affected by the ocean, Cao (2022) identified five stages of transgressive–regression events through the evaporite–limestone sedimentary cycles in different areas of the basin and reconstructed the stages of marine transgressive–regression and the scope of each stage of the Yarkand Basin [19]. The stages and scopes of them are shown in Figure 4.
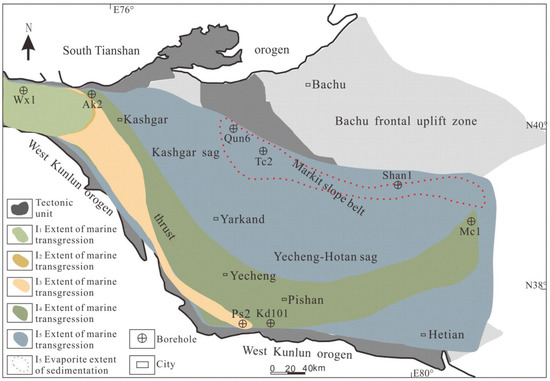
Figure 4.
Characteristics of the extent of five Palaeocene transgressions in Yarkand Basin [19].
The first transgressive–regressive cycle (I1) only affected the western Kunlun Mountains and the southern Tianshan Mountains in the northwest of Yarkand Basin. The extent of I2 transgression is roughly the same as that of the I1 cycle. The I3 transgression extended southeast along the narrow riverway at the west Kunlun foothills to the area around the Ps2 borehole. The transgression degree of I4 is greater than that of I3, covering the whole South Tianshan and West Kunlun Mountains, extending from the southeast of the West Kunlun Mountains to the southeast Markit slope belt, and reaching the vicinity of the Mc1 borehole. The I5 transgression covered the whole Yarkand Basin. The evaporite deposition ranges of the four marine intrusions (I1, I2, I3, and I4) are all roughly the same as the corresponding marine intrusion ranges, but the evaporite deposition range of the I5 marine transgression is concentrated in and around the Markit slope belt. Therefore, by combining the evaporite stratigraphic histograms of these six boreholes (Figure 5), it is possible to establish the temporal sequence of evaporite deposition in each borehole.
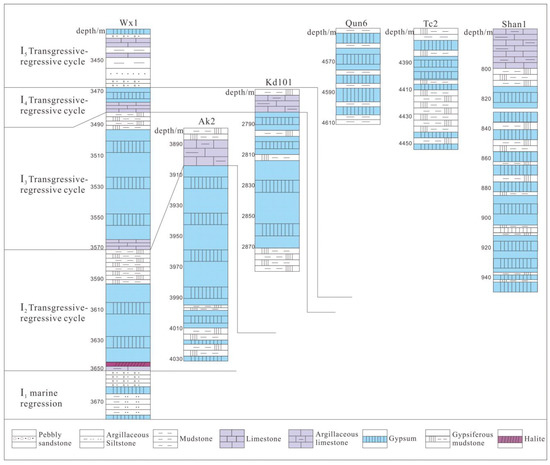
Figure 5.
Comparison of transgression–regressive cycles of six boreholes in the Paleocene of the Yarkand Basin.
As a result, a Paleocene evaporite sulfur isotopic curve in the Yarkand Basin is established (Figure 6). This curve fluctuates frequently, and five increasing (decreasing) fluctuation trends can be clearly seen in the figure. These trends are 19.40‰–20.33‰, 18.83‰–20.14‰, 19.11‰–25.92‰, 13.41‰–22.17‰, and 22.17‰–6.69‰ from right to left, respectively. In the realm of geological research, it is widely accepted that the sulfur isotope values found in marine evaporite gypsum typically fall within the range of 15‰ to 23‰, whereas the sulfur isotope values discovered in marine–terrestrial gypsum range from 10‰ to 15‰. Furthermore, the sulfur isotope values present in terrestrial gypsum are less than 10‰ [15,51,52,53]. During the early stages of development, the two fluctuation trends displayed a small variation range of 18‰–20‰, which likely indicates that the sedimentary environment during this time was relatively stable, primarily consisting of a marine sedimentary environment. In the middle period, the two rising fluctuation trends showed an increase from 19.11‰ to 25.92‰, followed by a decrease to 13.41‰, and then an increase to 22.17‰. This shift could suggest a transition from a marine sedimentary environment to a marine continental sedimentary environment and then back to a marine-sedimentary environment. In the later period, a decreasing trend emerged, ranging from 22.17‰ to 6.69‰, which may suggest a shift from a marine sedimentary environment to a marine–continental sedimentary environment, eventually transitioning to a continental sedimentary environment.
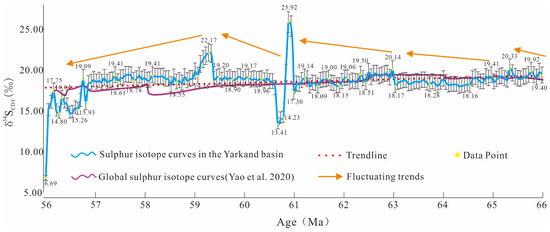
Figure 6.
Paleocene sulfur isotope curves in the Yarkand Basin and the global Paleocene sulfur isotope curves. The purple LOWESS curve is constructed by utilizing the latest sulfur isotope data from 56 Ma to 66 Ma [15]. The blue curve is from the data of WX1, AK2, Kd101, Qun6, Tc2, and Shan1 boreholes of the Yarkand Basin during the Paleocene.
The Paleocene global sulfur isotopic curve is constructed by utilizing the latest sulfur isotope data from 56 Ma to 66 Ma [15] (Figure 6). Upon comparing this curve with the sulfur isotopic curve of the Yarkand Basin, it is evident that the latter also displays a general trend of decreasing δ34S values over the Paleocene period. However, the evolution curve of Paleocene δ34S values in the Yarkand Basin demonstrates a significant difference from the global curve. Specifically, the overall Paleocene δ34S values in the Yarkand Basin are notably higher. Paytan et al. (2020) indicated that the global Paleocene sulfur isotope δ34S ranged from 16‰ to 20‰, with an average value of 18.36‰ [15]. Consequently, it is reasonable to assume that the original sulfur isotope value of Paleocene evaporites in the Yarkand Basin was primarily within the range of 18‰ to 20‰, with an average value of 18.64‰.
5.3. Paleocene Evaporite Sedimentary Environment in the Yarkand Basin
During the Paleocene, the Paratethys seawater was introduced into the Yarkand Basin from the Alay graben located in the northwest of the Tarim Basin. The seawater was subsequently blocked by the middle-low hills of West Kunlun Mountain, finally leading to the formation of a lagoon [32]. The basin was influenced by land-derived clastic sedimentation and characterized by a semi-closed estuarine and lagoon environment during the early Paleocene–Eocene period [30]. Under the control of a subtropical arid climate, clastic rocks, gypsum rocks, and carbonate rocks were formed [43], and the Aertashen Formation underwent lagoonal and very shallow water evaporitic terrace phase sedimentation [54]. It is worth noting that evaporite rocks, such as gypsum and halite, are usually formed in closed or semi-closed basins and arid climates or strongly evaporated environments [55].
The process of evaporative precipitation of sulfate generally causes relatively tiny sulfur isotope fractionation, which can generally be ignored. As a result, the evaporatively precipitated sulfate is considered representative of the δ34S values of seawater during the same period [56]. The fluctuations in δ34S values are frequently caused by bacterial sulfate reduction or insufficient seawater replenishment in closed evaporite basins [1,44,57,58]. The δ34S values of Paleocene gypsum sulfur isotopes in the Yarkand Basin exhibit frequent fluctuations, with four major upward trends identified. Especially in the Kd101 borehole, where unusually high sulfur isotope δ34S values (25.40‰ and 25.92‰) were observed. The increase in sulfur isotope values reflects the enrichment of δ34S in seawater sulfate, maybe indicating the presence of bacterial reduction (BSR) of Paleocene seawater sulfate in the Yarkand Basin. Because BSR preferentially removes 32S from dissolved sulfate, leading to the enrichment of 34S in the residual brine [59,60].
In addition, the degree of isotopic fractionation during the bacterial sulfate reduction process is significantly influenced by whether the system is open or closed. In an open system, sulfate is continuously replenished, and the sulfate concentration does not decrease with the reaction. At the same time, the reduced H2S combines with metal ions to form sulfides, which are continuously removed from the system. As a result, the concentration of H2S in the system does not increase with the reaction. In this scenario, provided environmental conditions remain relatively constant, the isotopic fractionation will remain within a certain range, and the isotopic fractionation coefficient is often a constant value [61]. The nearly semi-enclosed basin is continuously replenished with seawater, and the sulfur isotope composition remains stable. The rhythmical changes of lithology (gypsum interspersed with limestone and mudstone) and the periodic changes of gypsum sulfur isotope value in the Paleocene Aertashen Formation of the Yarkand Basin indicated that the Yarkand Basin was poorly sealed and often replenished by seawater or fresh water. Consequently, the evaporite sedimentary environment at this time was relatively open.
The depositional extent of Aertashen Formation evaporite spreads over almost the entire Yarkand Basin, but its thickness varies across the basin in the Paleocene. In general, the gypsum in this Formation is more developed in the West Kunlun Mountain Front, particularly in the area surrounding the Wb1/Wx1 borehole, which is a prominent depositional center. The depositional thickness and scale of gypsum gradually decrease from the West Kunlun Mountain Front to the north to the South Tianshan Mountain Frontal Zone and the east to the Markit slope belt [23]. The Paleocene gypsum sulfur isotopic δ34S values in the Yarkand Basin decrease from the junction of the West Kunlun Mountains and the South Tianshan Mountains to the southeast, with a greater decrease observed at the Markit slope belt than at the front of the West Kunlun Mountains. This trend can be observed by combining the mean gypsum sulfur isotopic δ34S values from various field outcrop profiles and boreholes [20,32], as depicted in Figure 1. Therefore, it can be inferred that the ancient seawater started from the junction of the West Kunlun and South Tianshan Mountains, first invaded the southeast along the West Kunlun Mountains, and then spread toward the Markit slope. This is consistent with the change in the extent of marine transgression predicted by Cao [19].
The topography of the ancient salt lake in Yarkand Basin exhibited a high eastern region and a low western region. In the early stage of evaporite sedimentation, the depositional center was concentrated in the drilled area west of the basin, distributed along the southern Tianshan and the western Kunlun Mountains in an elongated form. In the late stage of the Aertashen Formation, the transgression scope expanded to the Markit slope belt. Due to the relatively far extension of seawater, a shallow evaporation platform environment was formed, represented by substantial, thick gypsum–salt deposits. With the seawater extension, the influence of seawater on sedimentary basins gradually weakens. The ancient salt lake was more susceptible to other factors, as seen from the variation of gypsum sulfur isotope δ34S in the Shan1 and Kd101 boreholes. Both the thickness of gypsum strata and the δ34S value of the sulfur isotope of gypsum show such a similar rule, indicating that the sedimentary environment of Paleocene evaporite in Yarkand Basin may also be related to the paleotopography and distance from the estuary, resulting in the difference of sedimentary environment.
The late Paleocene gypsum sulfur isotope δ34S values in the Yarkand Basin gradually decreased from 22.17‰ to 6.69‰ (Figure 6), probably reflecting the increasing influence of exogenous sulfur. The late sedimentary environment may have been mainly influenced by terrigenous freshwater. The low δ34S value can be attributed to two possible reasons:
- Low δ34S value of sulfate from the provenance: The source material itself may have had a low δ34S value, resulting in low δ34S values in the sedimentary sulfate;
- Constant supply of source material and high oxidation degree of water: The constant supply of source material, combined with high oxidation conditions in the water, can make it difficult for anaerobic bacteria to survive. As a result, there is almost no biological fractionation, and the δ34S value of sulfate remains low.
When marine sedimentary sulfate is injected with fresh water from the perimeter, it can result in low δ34S values relative to the δ34S values of normal seawater sulfate during the same period. When the basin is affected by continental freshwater and seawater, the sulfur isotopic composition of sedimentary sulfate (mainly gypsum) often has these characteristics of them, with δ34S values usually ranging from 10‰ to 15‰ [62]. The fluctuation trend from 22.17‰ to 6.69‰ in the late period likely reflects a transition from a marine sedimentary environment to a marine–continental sedimentary environment and eventually to a continental sedimentary environment. The presence of mud and gravel associated with evaporite provides strong evidence of a terrigenous freshwater supply. Sulfates in terrigenous fresh water feeding the evaporation basin should have lighter sulfur isotopes. Therefore, the light sulfur isotopic characteristics of evaporite gypsum in the Yarkand Basin are likely affected primarily by terrigenous freshwater recharge.
6. Conclusions
Analysis of the sulfur isotopes of 187 gypsum samples showed that δ34S values ranged from 6.69‰ to 25.92‰, with an average value of 18.64‰. The overall trend of the Paleocene gypsum sulfur isotopic curve in the Yarkand Basin is consistent with the global seawater sulfur isotopic curve, which exhibits a decreasing trend.
A trend of increasing sulfur isotopes is observed in the four early and middle phases, suggesting that the early and middle phases may have been mainly influenced by bacterial reduction and a relatively open sedimentary environment. In contrast, the late stage shows a decreasing trend, indicating that the late phase may have been mainly influenced by freshwater of terrestrial origin. Additionally, the sulfur isotope values in the basin have the characteristic of decreasing from northwest to southeast, which indicates that the depositional environment of the Paleocene evaporites in the Yarkand Basin may also be related to the paleotopography and the distance from the estuary, resulting in the difference in the depositional environment.
The original Paleocene evaporites in the Yarkand Basin should have a main body range of sulfur isotope values from 18‰ to 20‰, which is a supplement to the sulfur isotope of the Paleocene Tethys global paleo-seawater.
Author Contributions
Y.L. performed the data analyses and wrote the manuscript; Y.C. helped perform the analysis with constructive discussions. A.Z. and W.C. helped perform the experiment. All authors have read and agreed to the published version of the manuscript.
Funding
The study was supported by Major Projects of Xinjiang Uyghur Autonomous Region of China (No. 2020A03005-2), the National Natural Science Foundation of China (No. 41972082).
Data Availability Statement
The experimental data used to support the findings of this study are included in the manuscript.
Acknowledgments
We appreciate the anonymous reviewers for their constructive comments and suggestions.
Conflicts of Interest
The author declares no conflict of interest.
References
- Boschetti, T.; Cortecci, G.; Toscani, L.; Iacumin, P. Sulfur and Oxygen Isotope Compositions of Upper Triassic Sulfates from Northerm Apennines (Italy): Palaeogeographic and Hidrogeochemical Implications. Geol. Acta Int. Earth Sci. J. 2011, 9, 129–147. [Google Scholar] [CrossRef]
- Zhong, Y.; Wang, L.; Dong, H. Evaporite Sedimentary Characteristics and Environment: A review. Acta Sedimentol. Sin. 2022, 40, 1188–1214. [Google Scholar] [CrossRef]
- Meng, F.; Zhang, Z.; Zhuo, Q.; Ni, P. Direct Geolocal Records of Ancient Environments in the Evaporite Basin: Evidences from Fluid Inclusions in Halite. Bull. Mineral. Petrol. Geochem. 2018, 37, 451–460. [Google Scholar] [CrossRef]
- Liu, Z.; Meng, F.; Zhou, S.; Li, X. Paleoenvironment during Paleocene in Hongze Depression, North Jiangsu Basin: Evidence from Evaporites. J. Salt Lake Res. 2021, 29, 22–29. [Google Scholar]
- Newton, R.; Bottrell, S. Stable Isotopes of Carbon and Sulphur as Indicators of Environmental Change: Past and Present. J. Geol. Soc. 2007, 164, 691–708. [Google Scholar] [CrossRef]
- Fei, J.; Shen, L.; Guan, X.; Sun, Z. S and Sr Isotope Compositions and Trace Element Compositions of the Middle Jurassic Evaporites in Eastern Tibet: Provenance and Palaeogeographic Implications. Minerals 2022, 12, 1039. [Google Scholar] [CrossRef]
- Güngör Yeşilova, P.; Baran, O. Origin and Paleoenvironmental Conditions of the Köprüağzı Evaporites (Eastern Anatolia, Turkey): Sedimentological, Mineralogical and Geochemical Constraints. Minerals 2023, 13, 282. [Google Scholar] [CrossRef]
- Karakaya, M.Ç.; Bozdağ, A.; Ercan, H.Ü.; Karakaya, N. The Origin of Miocene Evaporites in the Tuz Gölü Basin (Central Anatolia, Turkey): Implications from Strontium, Sulfur and Oxygen Isotopic Compositions of the Ca-Sulfate Minerals. Appl. Geochem. 2020, 120, 104682. [Google Scholar] [CrossRef]
- Shen, L.; Wang, L.; Liu, C.; Zhao, Y. Sr, S, and O Isotope Compositions of Evaporites in the Lanping–Simao Basin, China. Minerals 2021, 11, 96. [Google Scholar] [CrossRef]
- Claypool, G.E.; Holser, W.T.; Kaplan, I.R.; Sakai, H.; Zak, I. The Age Curves of Sulfur and Oxygen Isotopes in Marine Sulfate and Their Mutual Interpretation. Chem. Geol. 1980, 28, 199–260. [Google Scholar] [CrossRef]
- Strauss, H. The Isotopic Composition of Sedimentary Sulfur through Time. Palaeogeogr. Palaeoclimatol. Palaeoecol. 1997, 132, 97–118. [Google Scholar] [CrossRef]
- Kampschulte, A.; Strauss, H. The Sulfur Isotopic Evolution of Phanerozoic Seawater Based on the Analysis of Structurally Substituted Sulfate in Carbonates. Chem. Geol. 2004, 204, 255–286. [Google Scholar] [CrossRef]
- Paytan, A.; Kastner, M.; Campbell, D.; Thiemens, M.H. Sulfur Isotopic Composition of Cenozoic Seawater Sulfate. Science 1998, 282, 1459–1462. [Google Scholar] [CrossRef] [PubMed]
- Yao, W.; Paytan, A.; Wortmann, U.G. Large-Scale Ocean Deoxygenation during the Paleocene-Eocene Thermal Maximum. Science 2018, 361, 804–806. [Google Scholar] [CrossRef] [PubMed]
- Paytan, A.; Yao, W.; Faul, K.L.; Gray, E.T. Sulfur Isotope Stratigraphy. In Geologic Time Scale 2020; Elsevier: Amsterdam, The Netherlands, 2020; pp. 259–278. [Google Scholar]
- Yuan, J.; Huo, C.; Cai, K. The high mountain-deep basin saline environment-a new genetic model of salt deposits. Geol. Rev. 1983, 29, 159–165. [Google Scholar]
- Warren, J.K. Evaporites through Time: Tectonic, Climatic and Eustatic Controls in Marine and Nonmarine Deposits. Earth-Sci. Rev. 2010, 98, 217–268. [Google Scholar] [CrossRef]
- Cao, Y.; Liu, C.; Yang, H.; Gu, Q.; Jiao, P.; Lu, Y. Identification and correlation of the Paleogene and Neogene evaporite sedimentary cycle in the Kuqa Basin. J. Palaeogeogr. 2010, 12, 31–41. [Google Scholar]
- Cao, Y. Marine Transgressive–Regressive Cycles and Evolution on Ancient Salt Lake in the Northwestern Tarim Basin in the Paleocene, Xinjiang Province, China. Carbonates Evaporites 2022, 37, 21. [Google Scholar] [CrossRef]
- Cao, Y.; Zeng, C.; Zhang, L.; Zhu, L. A rapid marine regression in the southwestern Tarim Basin in the latest Cretaceous: Comparison of two different evaporitic sequences in the Yarkand Basin, Xinjiang Province, China. Acta Geol. Sin.-Engl. 2021, 95, 1714–1724. [Google Scholar] [CrossRef]
- Cao, Z.; Li, Y.; Liu, X.; He, X. Report on Potassium Deposits Exploration and Field Survey in the Yarkand Basin. No8 Geol. Team Xinjiang Geol. Bur. 1977, 1–105. [Google Scholar]
- Liu, C.; Wang, L.; Yan, M.; Zhao, Y.; Cao, Y.; Fang, X.; Shen, L.; Wu, C.; Lv, F.; Ding, T. The Mesozoic-Cenozoic Tectonic Settings, Paleogeography and Evaporitic Sedimentation of Tethyan Blocks within China: Implications for Potash Formation. Ore Geol. Rev. 2018, 102, 406–425. [Google Scholar] [CrossRef]
- Zhang, L.; Han, E.; Zhu, L.; Zeng, C.; Fan, Q.; Wu, K.; Cao, Y.; Jiao, P. Characteristics of evaporites sedimentary cycles and its controlling factors of Paleocene Aertashi formation in the southwestern Tarim depression. Acta Geol. Sina 2015, 89, 2161–2170, (In Chinese with English abstract). [Google Scholar]
- Cao, Y.; Liu, C.; Jiao, P.; Bo, Y.; Zhang, H.; Yao, F. Discovery of abnormal value of potassium enrichment and prediction of favorable areas for potassium exploration in the Yarkand basin, Xingjiang. Acta Geol. Sina 2021, 95, 2099–2108. [Google Scholar]
- Cao, Y.; Liu, C.; Jiao, P.; Zhang, H.; Wu, K.; Sun, H.; Lu, F.; Su, Y. Evaporite deposition and potassium enrichment prospect from Upper Cretaceous to Paleogene in Yarkand Basin, Xinjiang. Miner. Depos. 2016, 35, 300–314. [Google Scholar] [CrossRef]
- Sang, H.; Cao, Y.; Zhu, L.; Zhang, H.; Zhang, L.; Yao, F. Preliminary study on Mesozoic Cenozoic evaporite deposition in southwest depression of Tarim Basin. J. Palaeogeogr. 2014, 16, 473–482. [Google Scholar]
- Chen, L. Geological characteristics of the tertiary salt-bearing sequences in Tarim basin. Geol. Chem. Miner. 1996, 18, 276–283. [Google Scholar]
- Yong, T. Lithofacies and paleogeography of the late Cretaceous-Paleogene of the Tarim platform. Exp. Explor. Petrol. Geol. 1984, 6, 9–17. [Google Scholar]
- Yong, T.; Shan, J. The development and formation in the Tarim Basin in Cretaceous-Paleogene ages. Acta Sedimentol. Sin. 1896, 4, 67–75. [Google Scholar]
- Ma, H.; Yang, Z. Evolution of the Cenozoic in southwestern Tarim Basin. Xinjiang Geol. 2003, 21, 92–95. [Google Scholar]
- Cao, Y.; Zeng, C.; Li, Q.; Zhu, L.C.; Fu, J.; Zhang, L.; Xiong, Z.; Zhang, H. Preliminary study on evolution of sedimentary environment in Early Paleocene in the Yarkand basin, Xinjiang. Acta Geol. Sina 2021, 96, 1369–1379. [Google Scholar]
- Wang, J.; Cao, Y. Sulfur Isotopic Composition of Gypsum from Paleocene, Northwest China: Implications for the Evolution of Eastern Paratethys Seawater. Minerals 2022, 12, 1031. [Google Scholar] [CrossRef]
- Zhang, Y. Uplift of Tibet Plateau and formation and evolution of the southwestern in Tarim Basin. Xinjiang Petrol. Geol. 1999, 20, 6–10. [Google Scholar]
- Hu, W.; Chen, Y.; Xiao, A. Tectonic evolution and the petroleum-bearing system in southwestern Tarim Basin. Pet. Explor. Dev. 1997, 24, 14–17, (In Chinese with English abstract). [Google Scholar]
- Zhang, D.; Hu, J.; Meng, Y.; Zheng, M.; Fu, M. Characteristics of Qimugen thrust nappe structure in the southwestern Tarim Basin Xinjiang, China, and its relationship with hydrocarbon. Geol. Bull. China 2007, 26, 266–274. [Google Scholar]
- Fang, A.; Ma, J.; Wang, S.; Zhao, Y.; Hu, J. Sedimentary tectonic evolution of the southwestern of Tarim Basin and west Kunlun orogen since Late Paleozoic. Acta Petrol. Sina 2009, 25, 3396–3406. [Google Scholar]
- Wang, Y.; Fu, D. The sedimentary-tectonic evolution of the southwest Tarim Basin from Cretaceous to Paleogene. Acta Geol. Sina 1996, 17, 32–40. [Google Scholar]
- Qu, G.; Li, Y.; Li, Y. Structural segmentation and its factor in the southwestern Tarim Basin. Sci. China Ser. D 2005, 35, 193–202. [Google Scholar]
- Ding, D.; Luo, Y. Collision structures in Pamir region and reformation of Tarim Basin. Oil Gas Geol. 2005, 26, 57–63, 77. [Google Scholar]
- Xu, Y.; Cao, Y.; Liu, C.; Zhang, H.; Nie, X. The History of Transgressions during the Late Paleocene-Early Eocene in the Kuqa Depression, Tarim Basin: Constraints from C-O-S-Sr Isotopic Geochemistry. Minerals 2020, 10, 834. [Google Scholar] [CrossRef]
- Jia, J. Sedimentary characteristics and palaeogeography of the early Cretaceous in Tarim Basin. J. Palaeogeogr. 2009, 11, 167–176. [Google Scholar]
- Zhuang, H.; Guo, F.; Zhou, X. Evolution of sedimentary environment in late Cretaceous, Kunlun Mountain front, Tarim Basin. J. Xi’an Univ. Sci. Technol. 2013, 33, 39–45. [Google Scholar]
- Shao, L.; He, Z.; Gu, J.; Luo, W.; Jia, J.; Liu, Y.; Zhang, L. Lithofacies Palaeogeography of the Paleogene in Tarim Basin. J. Palaeogeogr. 2006, 8, 353–364. [Google Scholar]
- Zhang, H.; Liu, C.; Jiao, P.; Cao, Y.; Han, E. Sedimentary Condition and Genetic Mode of Paleocene Evaporites in the Southwestern Depression of the Tarim Basin. Acta Geol. Sina 2015, 89, 2028–2035. [Google Scholar]
- Holser, W.T.; Kaplan, I.R. Isotope Geochemistry of Sedimentary Sulfates. Chem. Geol. 1966, 1, 93–135. [Google Scholar] [CrossRef]
- Goldberg, T.; Poulton, S.W.; Strauss, H. Sulphur and Oxygen Isotope Signatures of Late Neoproterozoic to Early Cambrian Sulphate, Yangtze Platform, China: Diagenetic Constraints and Seawater Evolution. Precambrian Res. 2005, 137, 223–241. [Google Scholar] [CrossRef]
- Guo, H.; Du, Y.; Kah, L.C.; Hu, C.; Huang, J.; Huang, H.; Yu, W.; Song, H. Sulfur Isotope Composition of Carbonate-Associated Sulfate from the Mesoproterozoic Jixian Group, North China: Implications for the Marine Sulfur Cycle. Precambrian Res. 2015, 266, 319–336. [Google Scholar] [CrossRef]
- Bottrell, S.H.; Newton, R.J. Reconstruction of Changes in Global Sulfur Cycling from Marine Sulfate Isotopes. Earth-Sci. Rev. 2006, 75, 59–83. [Google Scholar] [CrossRef]
- Crockford, P.W.; Kunzmann, M.; Bekker, A.; Hayles, J.; Bao, H.; Halverson, G.P.; Peng, Y.; Bui, T.H.; Cox, G.M.; Gibson, T.M.; et al. Claypool Continued: Extending the Isotopic Record of Sedimentary Sulfate. Chem. Geol. 2019, 513, 200–225. [Google Scholar] [CrossRef]
- Cao, Y.; Liu, C.; Yan, H.; Jiao, C.; Zhang, H.; Lv, F.; Ding, T. Preliminary study on the Mesozoic and Cenozoic evaporite deposits in Tarim and Central Asia Salt Lake chains and their controlling factor. Miner. Depos. 2016, 35, 591–604. [Google Scholar] [CrossRef]
- Liu, C.; Cao, Y.; Yang, H.; Jiao, P.; Gu, Q. Discussion on Paleogene-Neogene environmental change of salt lakes in Kuqa foreland basin and its potash-forming effect. Acta Geol. Sina 2013, 34, 547–558. [Google Scholar]
- Zhang, H.; Liu, C.; Cao, Y.; Sun, H.; Wang, L. A Tentative Discussion on the Time and the Way of Marine Regression from Tarim Bay during the Cenozoic. Acta Geosci. Sina 2013, 34, 577–584. [Google Scholar]
- Wang, L.; Liu, C.; Fei, M.; Shen, L.; Zhang, H. Sulfur isotopic composition of sulfate and its geological significance of the Yunlong formation in the Lanping Basin, Yunnan Province. China Min. Mag. 2014, 23, 57–65. [Google Scholar]
- Wang, F.; Song, Z.; Wu, S. Atlas on Paleogeography and Zoology of Xinjiang Uygur Autonomous Region; China Cartographic Publishing House: Beijing, China, 2006; Volume 186. [Google Scholar]
- Warren, J.K. Evaporite Deposits. In Encyclopedia of Geology; Elsevier: Amsterdam, The Netherlands, 2021; pp. 945–977. [Google Scholar]
- Sakai, H. Isotopic Properties of Sulfur Compounds in Hydrothermal Processes. Geochem. J. 1968, 2, 29–49. [Google Scholar] [CrossRef]
- Boschetti, T.; Toscani, L.; Shouakar-Stash, O.; Iacumin, P.; Venturelli, G.; Mucchino, C.; Frape, S.K. Salt Waters of the Northern Apennine Foredeep Basin (Italy): Origin and Evolution. Aquat. Geochem. 2011, 17, 71–108. [Google Scholar] [CrossRef]
- Van Driessche, A.E.S.; Canals, A.; Ossorio, M.; Reyes, R.C.; García-Ruiz, J.M. Unraveling the Sulfate Sources of (Giant) Gypsum Crystals Using Gypsum Isotope Fractionation Factors. J. Geol. 2016, 124, 235–245. [Google Scholar] [CrossRef]
- Taberner, C.; Marshall, J.D.; Hendry, J.P.; Pierre, C.; Thirlwall, M.F. Celestite Formation, Bacterial Sulphate Reduction and Carbonate Cementation of Eocene Reefs and Basinal Sediments (Igualada, NE Spain). Sedimentology 2002, 49, 171–190. [Google Scholar] [CrossRef]
- Zhang, H.; Liu, C.; Wang, L.; Fang, X. Characteristics of Evaporites Sulfur Isotope from Potash Deposit in Thakhek Basin, Laos, and Its Implication for Potash Formation. Geol. Rev. 2014, 60, 851–857. [Google Scholar] [CrossRef]
- Li, Q.; Fan, Q.; Shan, F.; Qin, Z.; Li, J.; Yuan, Q. Changes of sulfur isotope values and geochemical applications in Marine and continental evaporites. J. Salt Lake Res. 2018, 26, 73–80. [Google Scholar]
- El Tabakh, M.; Utha-Aroon, C.; Schreiber, B.C. Sedimentology of the Cretaceous Maha Sarakham Evaporites in the Khorat Plateau of Northeastern Thailand. Sediment. Geol. 1999, 123, 31–62. [Google Scholar] [CrossRef]


Disclaimer/Publisher’s Note: The statements, opinions and data contained in all publications are solely those of the individual author(s) and contributor(s) and not of MDPI and/or the editor(s). MDPI and/or the editor(s) disclaim responsibility for any injury to people or property resulting from any ideas, methods, instructions or products referred to in the content. |
© 2023 by the authors. Licensee MDPI, Basel, Switzerland. This article is an open access article distributed under the terms and conditions of the Creative Commons Attribution (CC BY) license (https://creativecommons.org/licenses/by/4.0/).