Article

Trace Element Composition of Pyrite from Selected Black Shale and Chert Exposures in the Central Belt of Peninsular Malaysia: Implications for Mineral Exploration

1
Centre for Ore Deposit and Earth Science, University of Tasmania, Private Bag 126, Hobart, TAS 7001, Australia
2
School of Materials and Mineral Resources Engineering, Universiti Sains Malaysia, Nibong Tebal 14300, Penang, Malaysia
*
Author to whom correspondence should be addressed.
Minerals 2023, 13(6), 829; https://doi.org/10.3390/min13060829
Submission received: 15 April 2023 / Revised: 16 May 2023 / Accepted: 14 June 2023 / Published: 20 June 2023
(This article belongs to the Section Mineral Geochemistry and Geochronology)

Abstract

:
Sedimentary and hydrothermal pyrites contained in selected Malaysian black shale and cherts have been analysed using laser ablation inductively coupled plasma (LA ICP-MS) and electron probe microanalysis (EPMA) at the University of Tasmania, Australia. This study shows that gold is concentrated in sedimentary and hydrothermal pyrite in the Middle Permian to Late Triassic black shales and Devonian cherts. According to LA ICP-MS analysis, gold contents in pyrite varied from 0.5 to 0.8 ppm Au in the Permo-Triassic black shale and between 0.2 and 0.8 ppm Au in the Devonian cherts. The lowest level of gold (0.3 ppm Au) was observed in the Permo-Triassic black shale that crops out at the Selinsing gold mine. In the Permo-Triassic period, the selenium contents display one peak (average range: 63.4–103.4 ppm Se) that is far from any gold deposit and one lowest point (average: 5.3 ppm Se) at the Selinsing gold deposit. In the Devonian period, the selenium content in sedimentary pyrite shows a peak (72.6–243.8 ppm Se) in the cherts. EPMA and LA ICP-MS data show consistent Se content variation in the Devonian and Permo-Triassic periods. Using selenium as a proxy for atmospheric oxygenation, the lowest level of Se content in the Permo-Triassic period is believed to decrease atmospheric oxygenation, as recorded in sedimentary pyrite found in black shale from the Selinsing gold deposit. The two peaks of selenium contents are interpreted as periods of increased atmospheric oxygenation. From an exploration perspective, the concentration of gold in sedimentary pyrites makes them sources for gold in the central sedimentary basin of Peninsular Malaysia. Therefore, the two maximum levels of Se and gold content during Permo-Triassic and Devonian times correspond to two stratigraphic levels of potential for orogenic gold mineralisation in the district. The EPMA data show significant values of Co over Ni in pyrite from the Gua Musang, Semantan, and Karak formation black shales, indicating a volcanic contribution of Co during the formation of sedimentary pyrite. Based on the current study’s findings, gold exploration should not be restricted to areas in and around the Selinsing gold mine, Buffalo Reef, Penjom mine, Tersang mine, and Bukit Koman mine but can be extended to BRSZ Units 1 and 2, Gua Musang, and Karak formations in the central belt of Peninsular Malaysia.

Graphical Abstract

1. Introduction

Peninsular Malaysia is home to several orogenic gold deposits that were formed by metamorphic processes and tectonic activities. In the central sedimentary basin of Peninsular Malaysia, little is known about the trace element composition of sedimentary pyrite (diagenetic or syngenetic), which formed on the sea floor during the formation of black shales and cherts in Permo-Triassic and Devonian times. In Malaysia, much of the interest in the geochemistry of black shale has been directed towards research on its hydrocarbon potential rather than its metallogenic significance [1]. The bio-mediated interaction of saltwater sulphate with reactive iron results in the creation of a non-sulphide precursor and, later, pyrite, either in euxinic water columns or shortly after deposition [2]. During sedimentation and the early stages of diagenesis, significant trace metals such as Ni, Co, Mo, Zn, As, Se, Cu, Pb, and Sb are integrated into sedimentary pyrite [3,4,5].
The trace element content of sedimentary pyrite can potentially serve as an archive of first order variations in trace metal concentration during its deposition because it incorporates several redox-sensitive trace metals during its growth [5,6,7,8,9].
Ref. [10] determined trace element concentrations of pyrite samples from Sukhoi Log (Eastern Siberia, Russia), Bendigo (Australia), Spanish Mountain (British Columbia, B.C., Canada), and Northern Carlin Trend (Nevada, NV, USA). These authors found an early enrichment of gold in sedimentary (diagenetic and syngenetic) pyrite within black shale facies, which is an essential requirement for the formation of Carlin-type and orogenic gold deposits in sedimentary basins.
Later, some ore deposit models supported the view that the formation of orogenic ore deposits is a two-stage process. The first stage is characterised by the early concentration of gold in sedimentary pyrite together with a suite of other trace elements (As, Ni, Pb, Zn, Mo, Te, V, and Se), followed by a later stage that is characterised by the remobilisation of gold and other metals, with gold finding its resting place in structural traps such as saddle reefs and jogs [10,11].
Therefore, it is important to know the trace element composition of sedimentary pyrite, as it may have significant implications for ore formation. Prior research has shown that diagenetic pyrite acts as a host for a variety of important trace metals in black shale. [12,13].
Black shales, which contain sedimentary and hydrothermal pyrites, are important source rocks for orogenic-style mineralisation [7] and represent key prospects due to their substantial metal endowments [14,15,16]. Many sub-greenschist settings have the potential for large tonnage low-grade gold deposits because the breakdown of pyrite during the metamorphism of black shales has been proposed as the source of many orogenic gold deposits and because the loss of Au is one of the first stages of the pyrite reduction process. Some examples of deposits formed by this process are the Chuniespoort Group of the Late Archean-Early Proterozoic Transvaal Sequence (South Africa), the Selinsing gold mine (Malaysia), the Sepon Mineral District (Laos), the Mathinna Turbidite deformed sequence in North-east Tasmania (Australia), and the Upper Devonian black shale series of the Xikuangshan Sb deposit in Hunan (China).
The central gold belt of Peninsular Malaysia offers an opportunity to analyse sedimentary pyrites, as they are found in black shales and cherts outcropping in many locations.
The purpose of this study is to determine the trace element composition of pyrite during the Devonian and Permo-Triassic times to see if there was an early concentration of gold in black shale and chert. Furthermore, this study answers the question of whether the gold concentration in black shale and cherts ensures the district’s potential for gold exploration. The choice of sedimentary pyrite is important as it grows in the water column and the first few centimetres of seafloor muds [3,7,17], incorporating trace elements from seawater. This research also answers the question of whether there are temporal trends of trace elements (Au, Se, Co, Ni, As, Cd, Cu, Zn, Sb, and Tl) within black shale and cherts and presents some implications for ore deposit formation.

2. Geological Setting

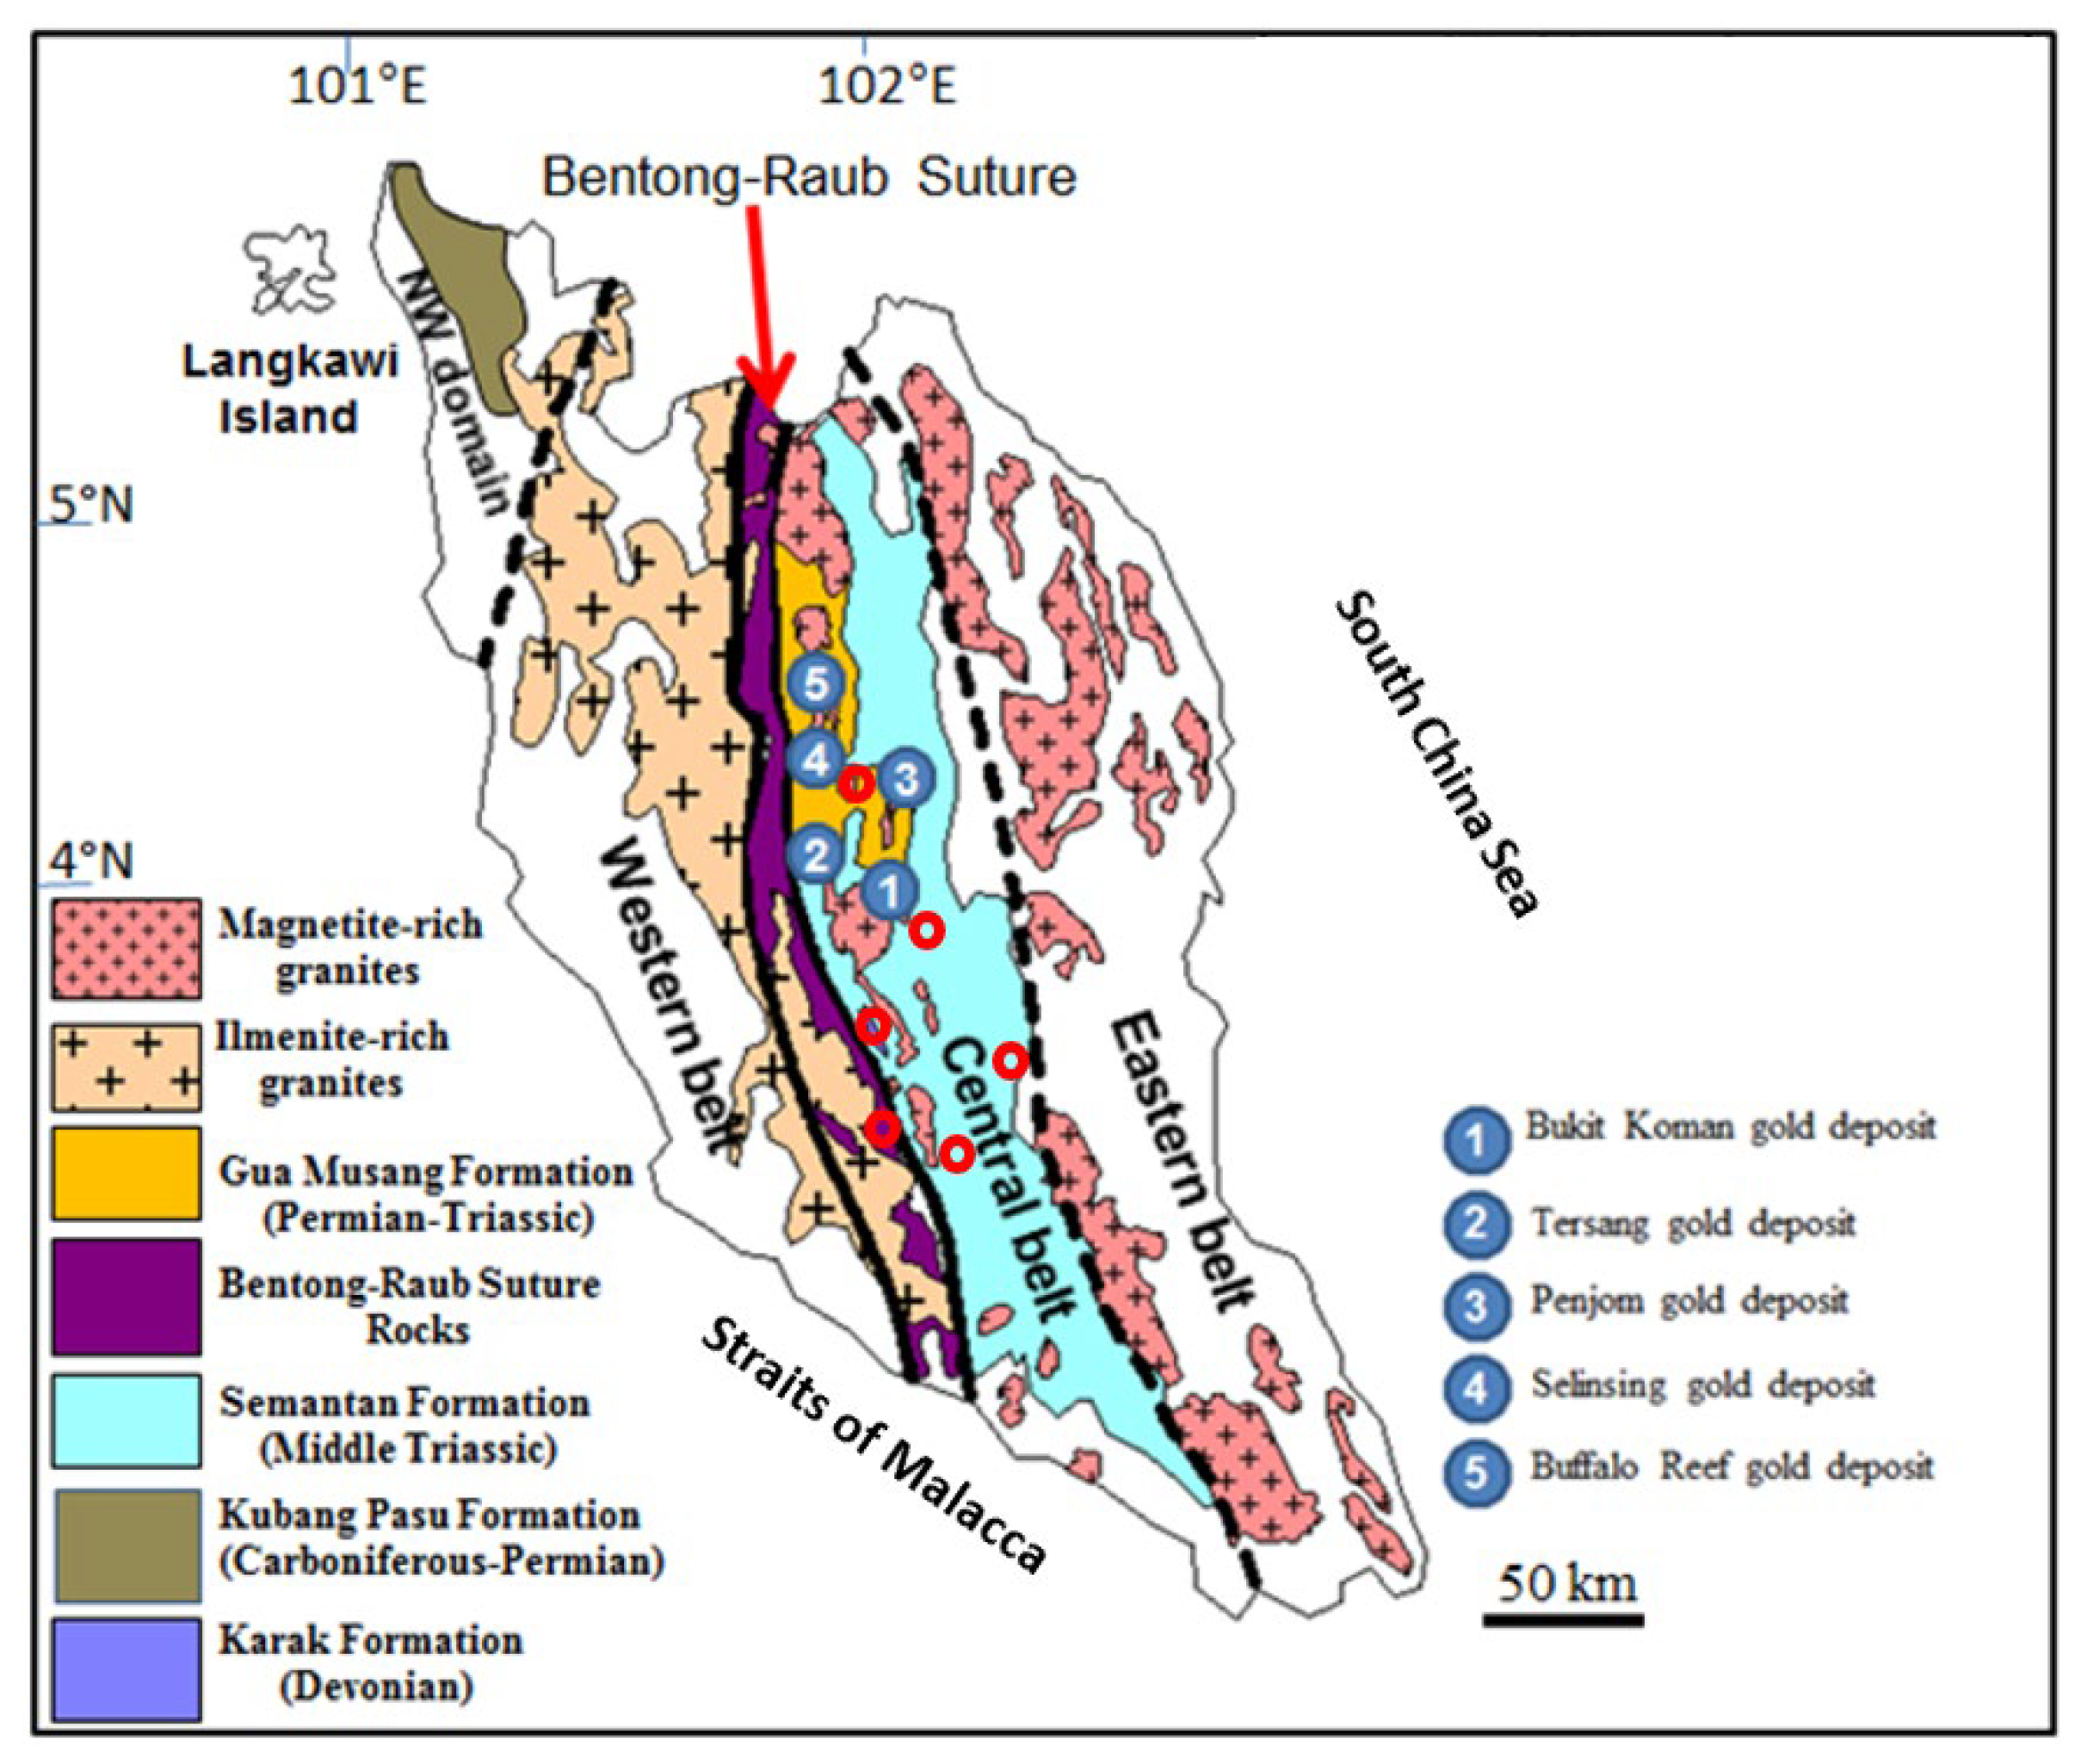
In the central belt of Peninsular Malaysia, black shale exposures are known to occur in the Selinsing gold mine, in a few places in the Bentong Raub Suture Zone (BRSZ) Units 1 and 2, and in the Karak, Semantan, and Gua Musang formations. These formations are shown in Figure 1. The rocks of the Selinsing gold mine are black and purple shales, siltstones, cataclasite, mylonite, which are fault-related rocks, including purplish to yellowish grey phyllite. Mylonite and cataclasite are interbedded with phyllite units. The phyllite units can be anywhere between 2 and 10 m thick. The majority of the phyllite layers dip 60–78° to the east and trend N160°. The siltstone unit, which can be up to 20 m thick, is found in the western portion of the Selinsing gold deposit.
Within the siltstone unit, there are many cataclasite units. They typically appear in fault zones, where they exhibit erratic bands and become thinner along the strike. The phyllite, siltstone, and argillite units contain mylonite units. The mylonite units show foliations that dip 64° east and trend 160°. The eastern half of the deposit is where much of the purple and black shale that comprise the argillite unit is exposed [18]. The purple colour of the shale may be related to the presence of hematite and limonite with a very low content of organic matter, whereas the black shales have an elevated organic carbon content.
According to [19], the BRSZ Unit 1 was deposited in an open deep-water basin between the Sibumasu and Indochina Terranes and was thought to be a component of the Bentong Group [20]. In this study, the BRSZ Unit 1 black shales are interbedded with sandstone. The grey-to-brown sandstone beds range in thickness from 2 to 10 cm. Black shale beds range in thickness from 1 to 8 mm. The Black shales display parallel laminations (up to 1 cm thick) and convolute laminations with small quartz lenses (1–2 cm long). These black shales have a total organic carbon content varying between 0.2 and 2.6 wt % and total sulfur ranging from 0.3 to 1.4 wt % [21].
Figure 1. Geological map of the selected formations and orogenic gold deposits, Peninsular Malaysia. Please note locations of some sediment-hosted orogenic gold deposits are shown in blue dots. The red circles represent sampling locations (Modified from [22]).
Minerals 13 00829 g001
Chert exposure, known as the BRSZ Unit 2, occurs in the Bentong-Raub Suture Zone and can be up to 100 m wide. The Central Gold Belt of Malaysia’s gold mineralisation is assumed to be genetically related to the suture [23]. The unit consists of cherts interspersed with a few sandstone layers and cut by quartz veins. The radiolarian occurrences in the black bedded cherts date back to the Late Devonian period [24].
North of the BRSZ Unit 2 is the Karak Formation. This formation is made up of interbedded black shales, siltstone, and sandstone. The black shales show wavy and flaser laminations (up to 7 cm). The siltstones have parallel laminations and range in thickness from 2 to 8 cm. It is believed that this formation was deposited in a marine deep-water environment [25]. The Karak black shales are organically poor, with total organic carbon ranging from 0.3 to 0.5 wt % and total sulfur varying between 0.3 and 0.8 wt %.
Tuffaceous siltstone and tuffaceous black shales are interbedded in the Semantan Formation and range in thickness from 1 to 3 cm (up to 2 cm thick layers). Some of the black shale layers are rich in organic material and contain clusters of pyrite microcrystals [21]. In the field, it is not possible to see the geologic contact between the tuffs and black shales. Tuff beds in the Semantan Formation have cross or parallel laminations. Fine tuffs and layers of mud pellets are found in association with laminated shale strata in the Semantan Formation.
The Gua Musang Formation crops out in the Central Belt and belongs to the Raub Group. Most sediment-hosted orogenic gold deposits such as Selinsing, Buffalo Reef, Tersang, and Penjom gold deposits are in this formation. The Gua Musang Formation is characterised by two facies: the Middle Permian to Triassic carbonate facies and the Triassic argillaceous facies. In and around the town of Kuala Lipis in the Central Belt, black shale units of the Triassic age that are a part of the Gua Musang Formation have been discovered [26]. Moreover, in the eastern portion of the Bentong-Raub Suture Zone, several gold occurrences that are hosted by sediment also have these black shales in their host strata [11,18]. Some images of black shale exposures are shown in Figure 2 below.

3. Materials and Methods

Six locations were chosen to carry out sampling for this study. The exact locations were as follows: BRSZ Unit 1 (Latitude: 03.605° N; Longitude: 101.902° E), BRSZ Unit 2 (Latitude: 03.520° N; Longitude: 101.921° E), Selinsing gold deposit (Latitude: 04.538° N; Longitude: 101.732° E), Semantan Formation (Latitude: 03.546° N; Longitude: 102.518° E), Gua Musang Formation (Latitude: 04.839° N; Longitude: 101.961° E), and Karak Formation (Latitude: 03.588° N; Longitude: 102.349° E).
Optical microscopy, laser ablation-inductively coupled mass spectrometry (LA ICP-MS) and electron probe microanalysis (EPMA) were carried out at the Central Science Laboratory and CODES, University of Tasmania, Australia. The optical microscope was used to characterise the textural features of pyrite crystals.

3.1. LA ICP-MS Method

The Laser ablation-inductively coupled mass spectrometry (LA-ICP-MS) was utilised to analyse the trace element composition of pyrite crystals. Analyses were performed using a Newwave UP213 laser ablation microprobe coupled with an Agilent 7500 or 7700 ICP-MS. Samples were ablated in He and mixed with Ar before reaching the ICP-MS. Calibration was carried out with the in-house standard (STDGL2b2), which is a lithium borate fused glass disk, with known concentrations of trace elements [27]. The standard was analysed at regular intervals to correct for drift and mass bias. To minimise surface contamination, sulphides were pre-ablated with laser pulses.
The background gas levels were monitored for 30 s before analysis. The laser shutter was then opened, and the sulphides were ablated for about 60–70 s at a firing rate of 5 Hz with laser energy of 3.5 J/cm2. The spot sizes used were 10, 15, 20, and 50 µm depending on the size of the pyrite clusters or individual micro crystals. The grains that were analysed were mostly cemented pyrite framboids forming aggregates of pyrite, as well as micro crystals of pyrite. The laser beams were placed on the material for analysis.
The backgrounds were recorded before each image and subtracted from each analysis line [28]. Three standards—STGDL2b2, GSD-1G, and PERU Pyrite—were set up at the beginning and the end of each set of analysis [27]. Iron was used as the internal standard (465 × 103 ppm). The elements that were analysed by spot analyses included the following: Na, C, Mg, Al, Si, S, K, Ca, Ti, V, Cr, Mn, Fe, Co, Ni, Cu, Zn, As, Se, Rb, Sr, Zr, Mo, Ag, Cd, Sn, Sb, Te, Ba, Gd, Hf, Ta, W, Pt, Au, Hg, Tl, Pb, Th, Bi, and U. A trace element map was made comprising the following elements: Ti, V, Cr, Mn, Fe, Co, Ni, Cu, Zn, As, Mo, Ag, Sb, Au, Tl, Pb, and Bi. Statistical analysis of sedimentary and hydrothermal pyrite to determine correlation matrix was performed using ioGAS, which is a geochemical exploratory data analysis software. The processing of data was mainly completed by using both Microsoft Excel and ioGAS.

3.2. EPMA Method

Compositional analyses were performed at the Central Science Laboratory, University of Tasmania (UTAS), on a JEOL JXA-8530F Plus field emission electron microprobe equipped with 5 wavelength dispersive spectrometers, a Thermo Pathfinder energy-dispersive x-ray spectrometry (EDS) system with UltraDry Extreme 30 mm2 silicon drift detector, and the Probe For EPMA software package (Probe Software, Eugene, OR, USA) at an accelerating voltage of 17 keV, beam current of 200 nA, and beam diameter of 0.2–0.5 µm.
X-ray intensities were acquired using EDS for S Kα, Fe Kα, and wavelength dispersive x-ray spectrometry (WDS) with the following analysing crystals: LiFL for Co Kα; Ni Kα, Cu Kα, Zn Kα, and TAP and TAPL for As Lα; and Se Lα and TAPL for As Lα. As and Se were measured on 2 spectrometers in parallel, and the intensities were aggregated. The standards were gallium arsenide for As, sphalerite for Zn, zinc selenide for Se (all synthetic, P&H Developments, North Yorkshire, UK), pentlandite (natural, Astimex Standards Ltd., Toronto, Ontario, Canada) for Ni, cobalt metal for Co, chalcocite (natural, Geller Micro, Topsfield, Massachusetts, USA) for Cu, and pyrite (natural, UTAS in-house) for Fe and S.
The counting times were 30 s for all elements and 2 × 15 s for the WDS backgrounds. The shared background technique was used for all WDS elements [29]. Interference corrections were applied to Co for interference by Fe, to Ni for interference by Co, to Zn for interference by Cu, and to Se for interference by As [30]. The matrix correction method used was the Armstrong/Love Scott methods and the mass absorption coefficients dataset LINEMU Henke (LBL, 1985) < 10 keV and CITZMU > 10 keV was also used [31].

4. Texture of Pyrite

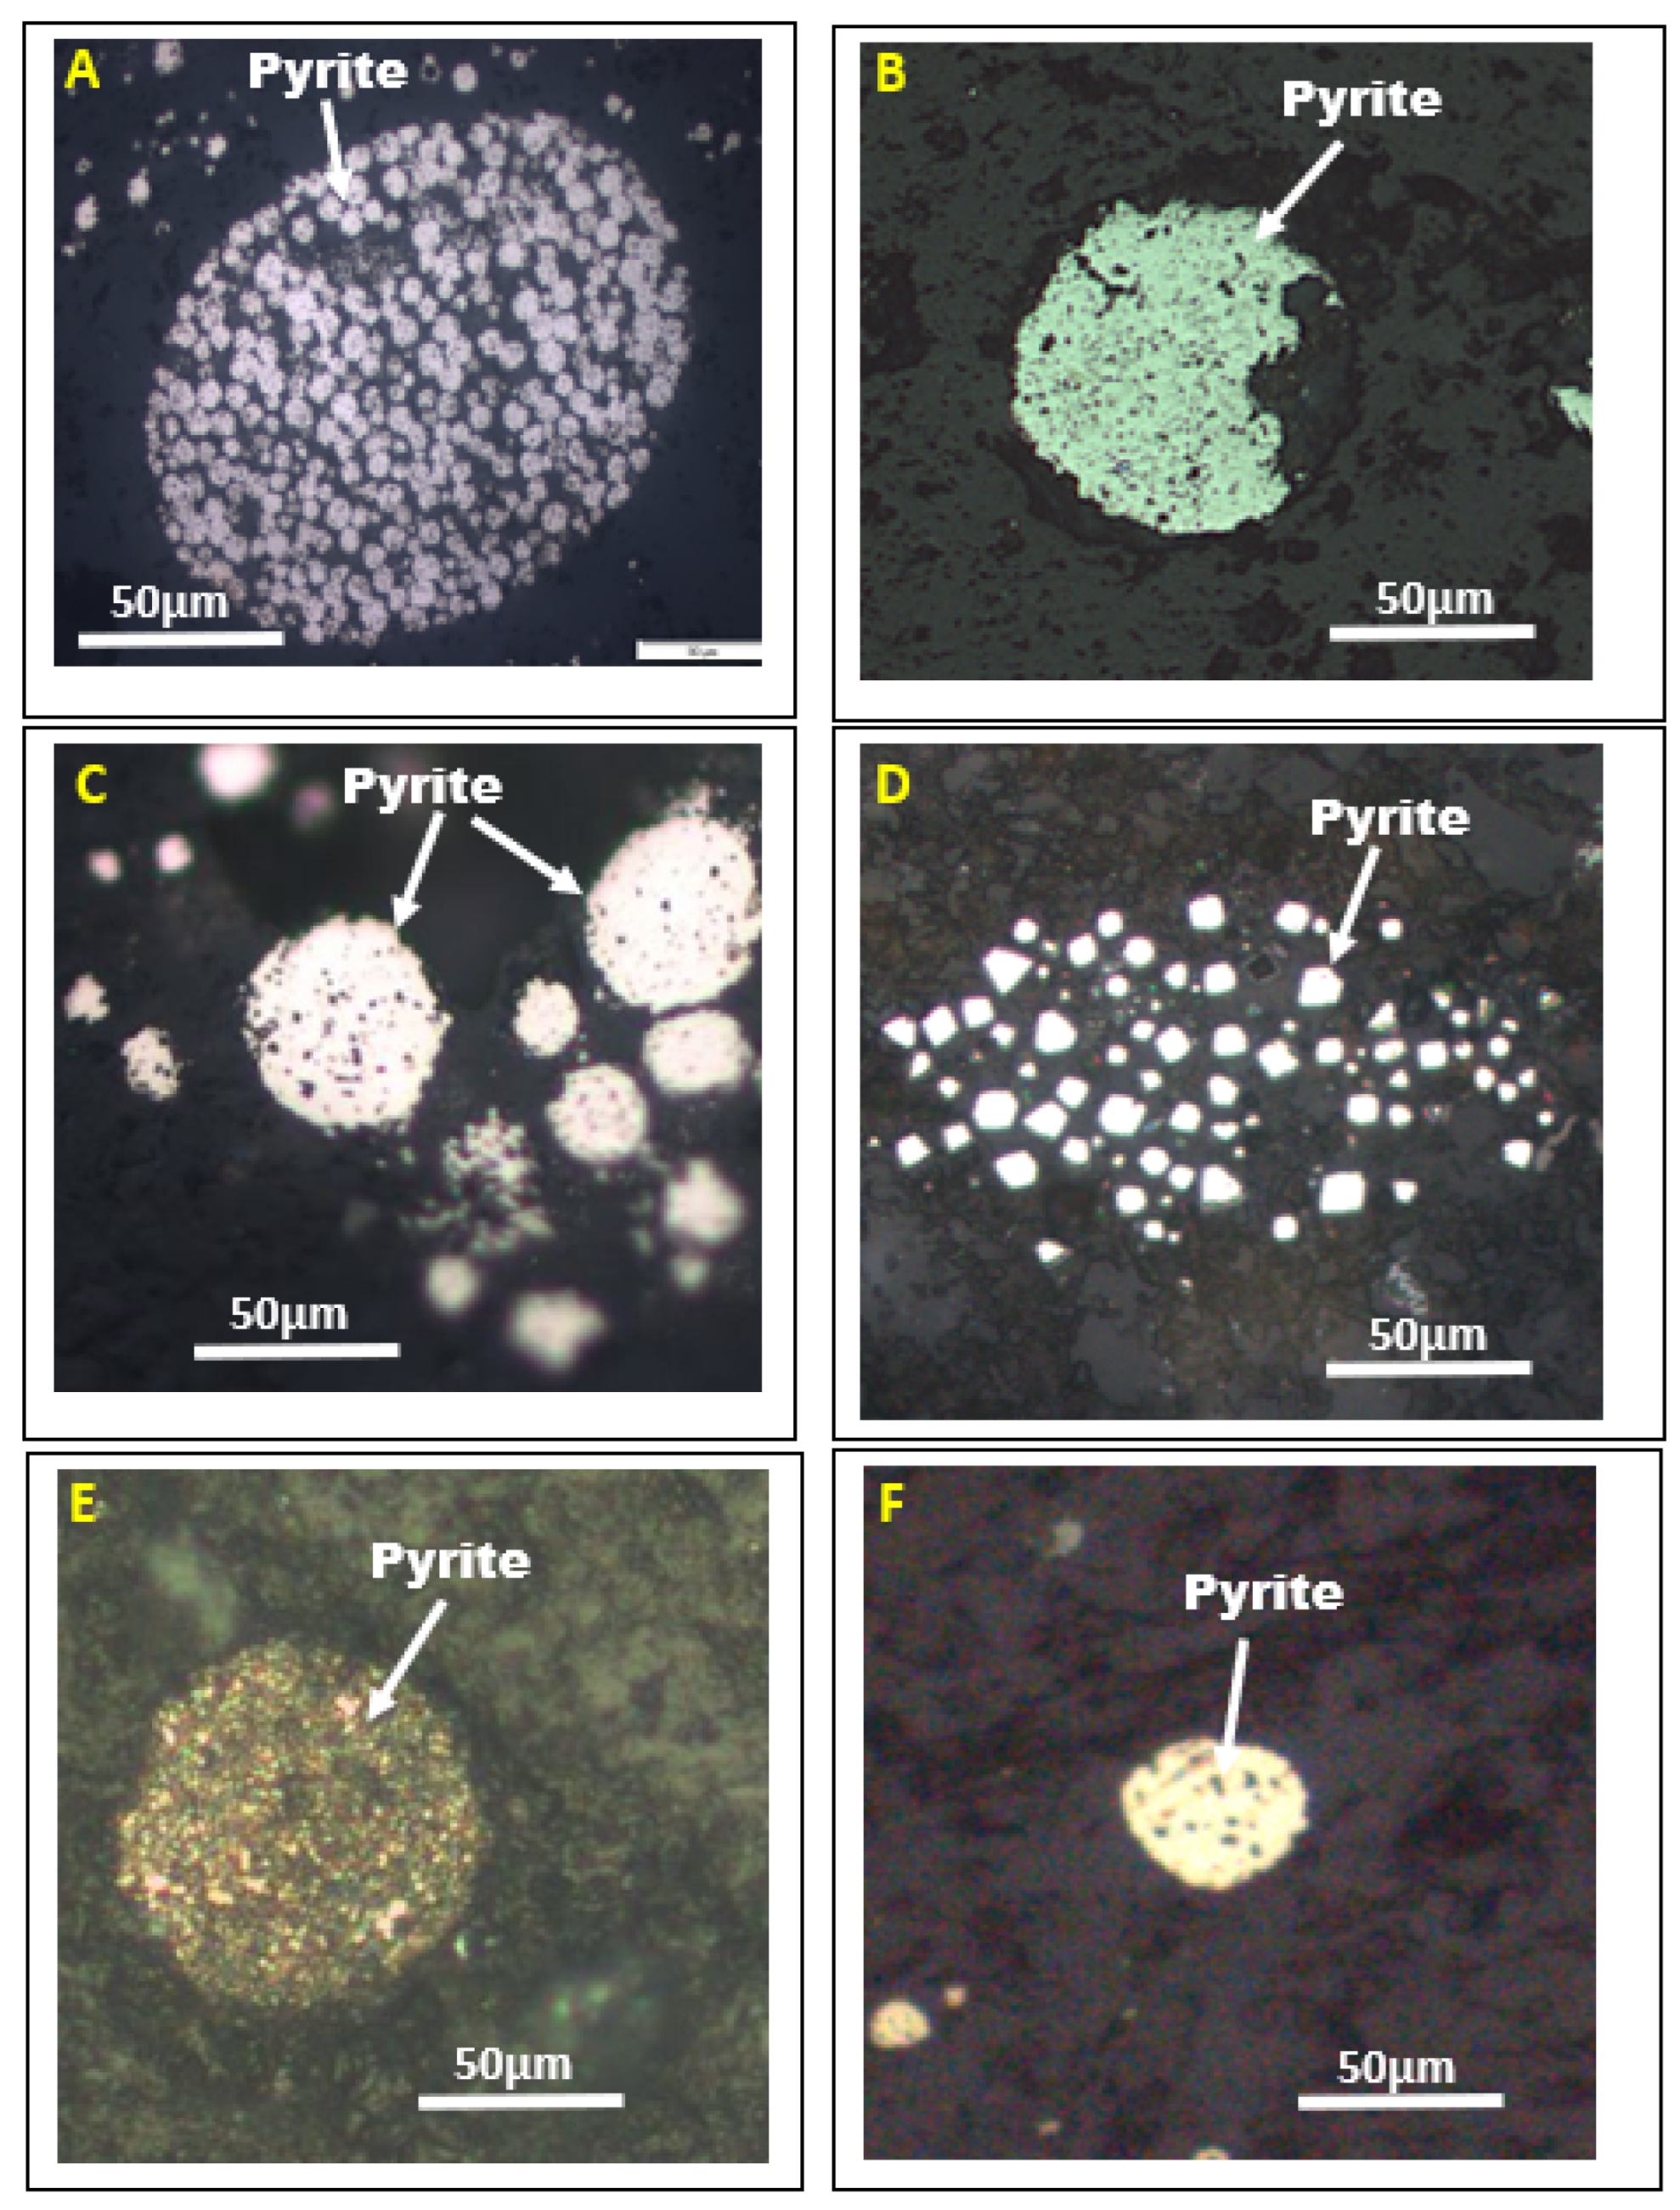
In this study, most sedimentary pyrites were found in the form of aggregates of framboids or disseminated euhedral-shaped microcrystals. BRSZ Unit 2 has sedimentary pyrites that are mostly framboidal, mainly consisting of rounded or half-broken crystals. The size of pyrite framboid aggregates varies from 5 to 50 µm (Figure 3A). The BRSZ Unit 1 black shales contain framboidal and euhedral pyrites. Most pyrite framboids are clustered or cemented (up to 100 µm across) and associated with minute coarse-grained framboids (up to 30 µm across). The euhedral to subhedral microcrystals of pyrite are up to 60 µm across (Figure 3B).
In the Karak Formation, the framboidal pyrites have sizes varying from 10 to 50 µm (Figure 3C). In the Semantan Formation, hydrothermal pyrite occurs in the form of elongated clusters of euhedral, while clean pyrite micro crystals measuring 20–80 µm can be found in the black shale (Figure 3D). Some of the pyrite clusters appear as oxidised pyrite framboids with few unoxidised remains of euhedral pyrite (less than 10 µm across) in their structure. Some euhedral crystals are arranged in a formation that means they appear as “pyrite rings”. Pyrite framboids are also common (less than 20 µm across). Other clusters are tiny pyrite crystals of less than 1–2 µm in size.
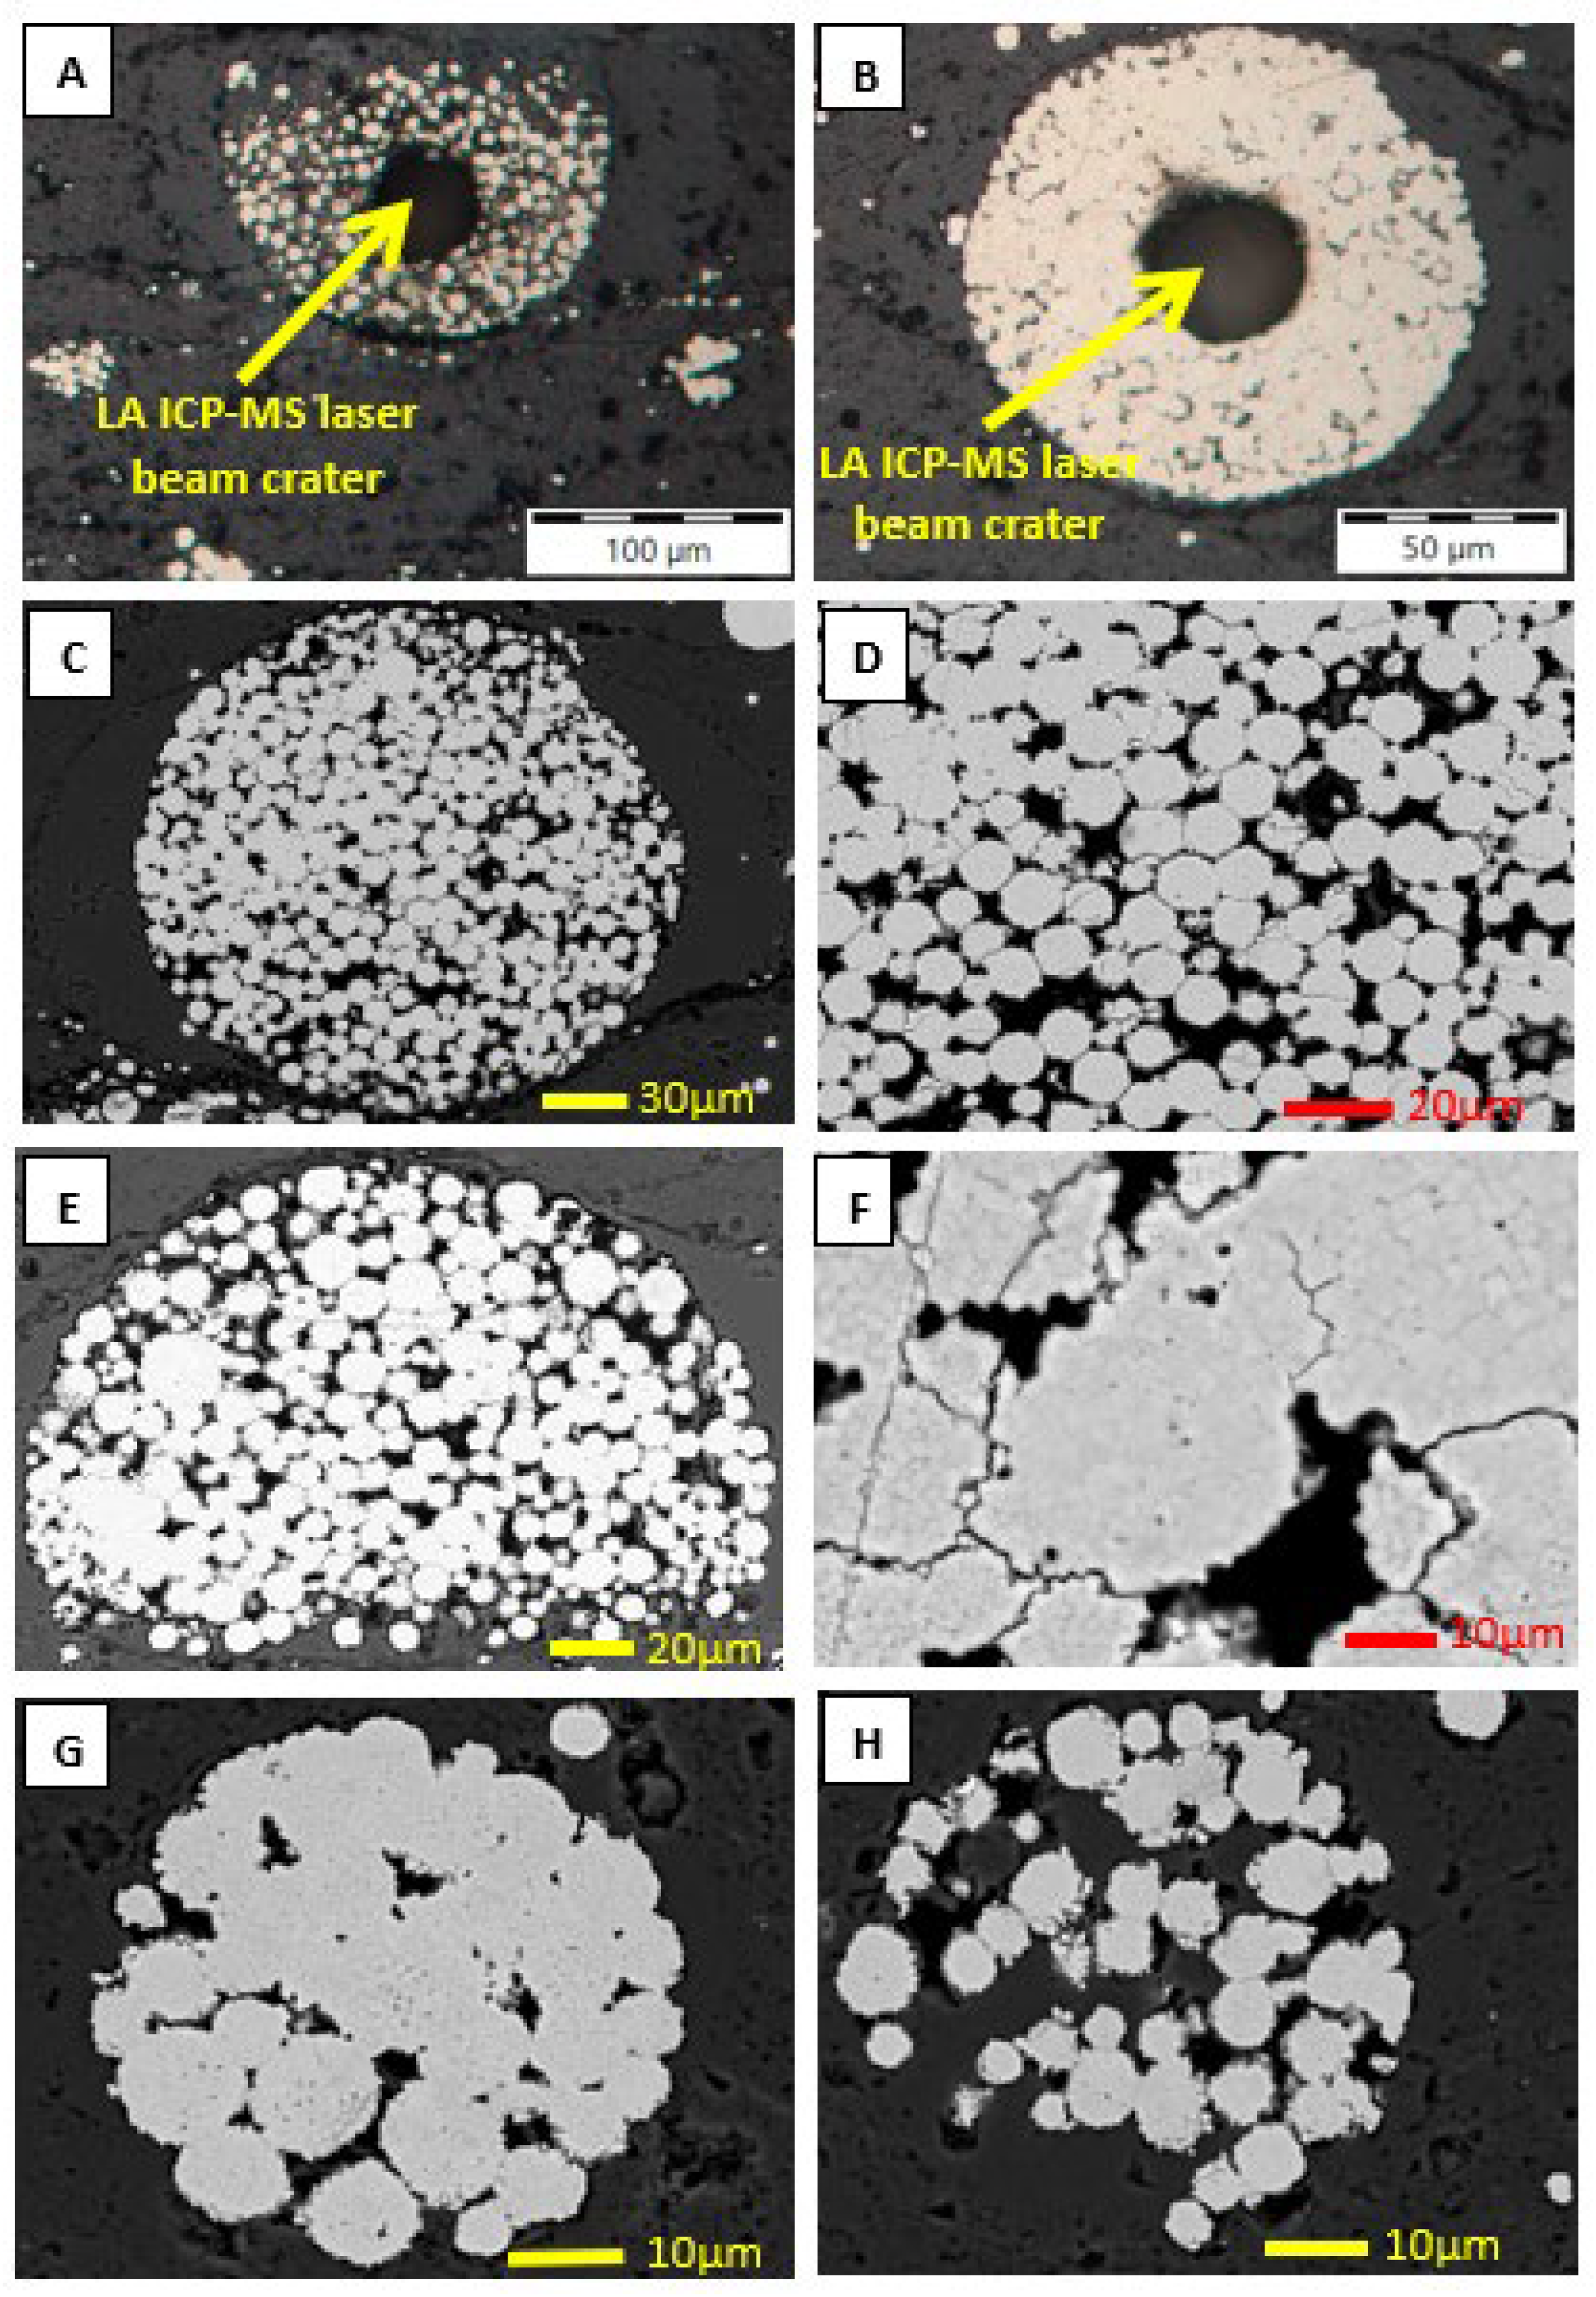
In Gua Musang Formation, the pyrite framboids were collected after crushing and milling up to 500 g of black shale rock samples. The framboidal pyrites were then separated, mounted, and polished prior to laser ablation. Framboidal pyrites are rounded to sub-rounded and range in size r from 20 to 50 µm (Figure 3E). At the Selinsing gold mine, pyrite framboids were found along the bedding plane in the black shales. They are disseminated and have sizes ranging up to 100 µm across (Figure 3F). Backscattered electron (BSE) images that show various shapes of pyrite analysed by EPMA are shown in Figure 4 and Figure 5. The laser LA ICP-MS beam diameters that were recorded during the LA ICP-MS analysis of pyrite are shown in Figure 4A,B. For the LA ICP-MS, the beam diameter was much larger than that of the EPMA instrument.

5. Results

A combination of LA ICP-MS and EPMA methods have shown some differences in trace element concentrations. A total of 281 analyses were performed both with the use of LA ICP-MS and EPMA. A run of 191 LA ICP-MS analyses was undertaken on sedimentary and hydrothermal pyrite contained in black shale and bedded chert. The results of all analyses are presented in Table S1 (see the supplementary materials). Descriptions of trace element compositions for each unit or formation are detailed below.
BRSZ Unit 1: the gold content in sedimentary pyrites varies from 0.07 to 2 ppm (mean 0.75 ppm). The base metal mean contents are Cu (483.5 ppm) and Zn (97.7 ppm). Other metal mean contents are As (339.9 ppm), Ag (13.4 ppm), Te (23.2 ppm), Se (243.8 ppm), Co (12.8 ppm), and Sb (26.5 ppm). Minor mean contents are U (0.1 ppm), Cd (2.4 ppm), and Tl (3.8 ppm), V (8.36 ppm), and Mo (9.9 ppm).
BRSZ Unit 2: the gold content in sedimentary pyrites from BRSZ Unit 2 cherts varies from 0.09 to 0.43 ppm (mean 0.2 ppm). The base metal mean contents are Cu (288.3 ppm) and Zn (169.3 ppm). Other metal mean concentrations are As (345.6 ppm), Ag (7.6 ppm), Te (1.3 ppm), Mo (48.9 ppm), Se (72.6 ppm), Co (10.4 ppm), Cd (3.8 ppm), Sb (122.8 ppm), and Tl (3 ppm). Low mean concentrations include U (0.1 ppm) and V (9.7 ppm).
Karak Formation: the gold content in sedimentary pyrite ranges from 0.4 to 0.6 ppm (mean 0.5 ppm). The base metal mean contents are Cu (455.4 ppm) and Zn (183.3 ppm). Other metal mean concentrations include As (3517.1 ppm), Ag (19.5 ppm), Te (9.5 ppm), Mo (52.8 ppm), Se (63.4 ppm), Co (1467.7 ppm), Cd (1.8 ppm), Sb (73 ppm), Tl (4.3 ppm), U (1.5 ppm), and V (21.2 ppm).
Semantan Formation: the gold content in hydrothermal pyrite varies between 0.01 and 4.6 ppm (mean 0.8 ppm). The base metal mean contents are Cu (1122.2 ppm) and Zn (2198.6 ppm). Other metal mean concentrations are As (2257.7 ppm), Ag (24.4 ppm), Te (13.5 ppm), Mo (5.5 ppm), Se (103.4 ppm), Co (256 ppm), Cd (4.6 ppm), Sb (29.7 ppm), Tl (4.2 ppm), U (2.9 ppm), and V (268.9 ppm).
The Gua Musang: The gold content in framboidal pyrite varies from 0.2 to 1.8 ppm (mean 0.8 ppm). The base metal contents are Cu (486.1 ppm), and Zn (76.8 ppm). Other metal concentrations are As (412.1 ppm), Ag (13 ppm), Te (14.9 ppm), Mo (13.9 ppm), Se (66.4 ppm), Co (13.7 ppm), Cd (3.1 ppm), Sb (32.1 ppm), Tl (5.7 ppm), and V (1.4 ppm). The U content plummeted with a mean of 0.01 ppm. Micro-crystals of pyrite have the following trace element contents: 0 < Mo < 3.5 ppm; 32 < Ni < 1905 ppm; 0.03 < V < 16 ppm; 0.04 < Ag < 113 ppm; 285 < As < 2258 ppm; and 0 < Au < 0.12 ppm.
Selinsing gold deposit: The Selinsing framboidal pyrite gold content ranges from 0.03 to 0.84 (mean 0.29 ppm). The framboidal pyrites have the following elemental contents: As (mean 233 ppm), Co (mean 327 ppm), Cu (mean 277 ppm), Ni (mean 364 ppm), Zn (mean 203 ppm), and Sb (mean 37 ppm). Gold shows a positive correlation with Ag (cc = 0.61). The gold content in framboidal pyrite varies positively with Mn, Ag, and Sb. Correlation coefficients are shown in Table S4.
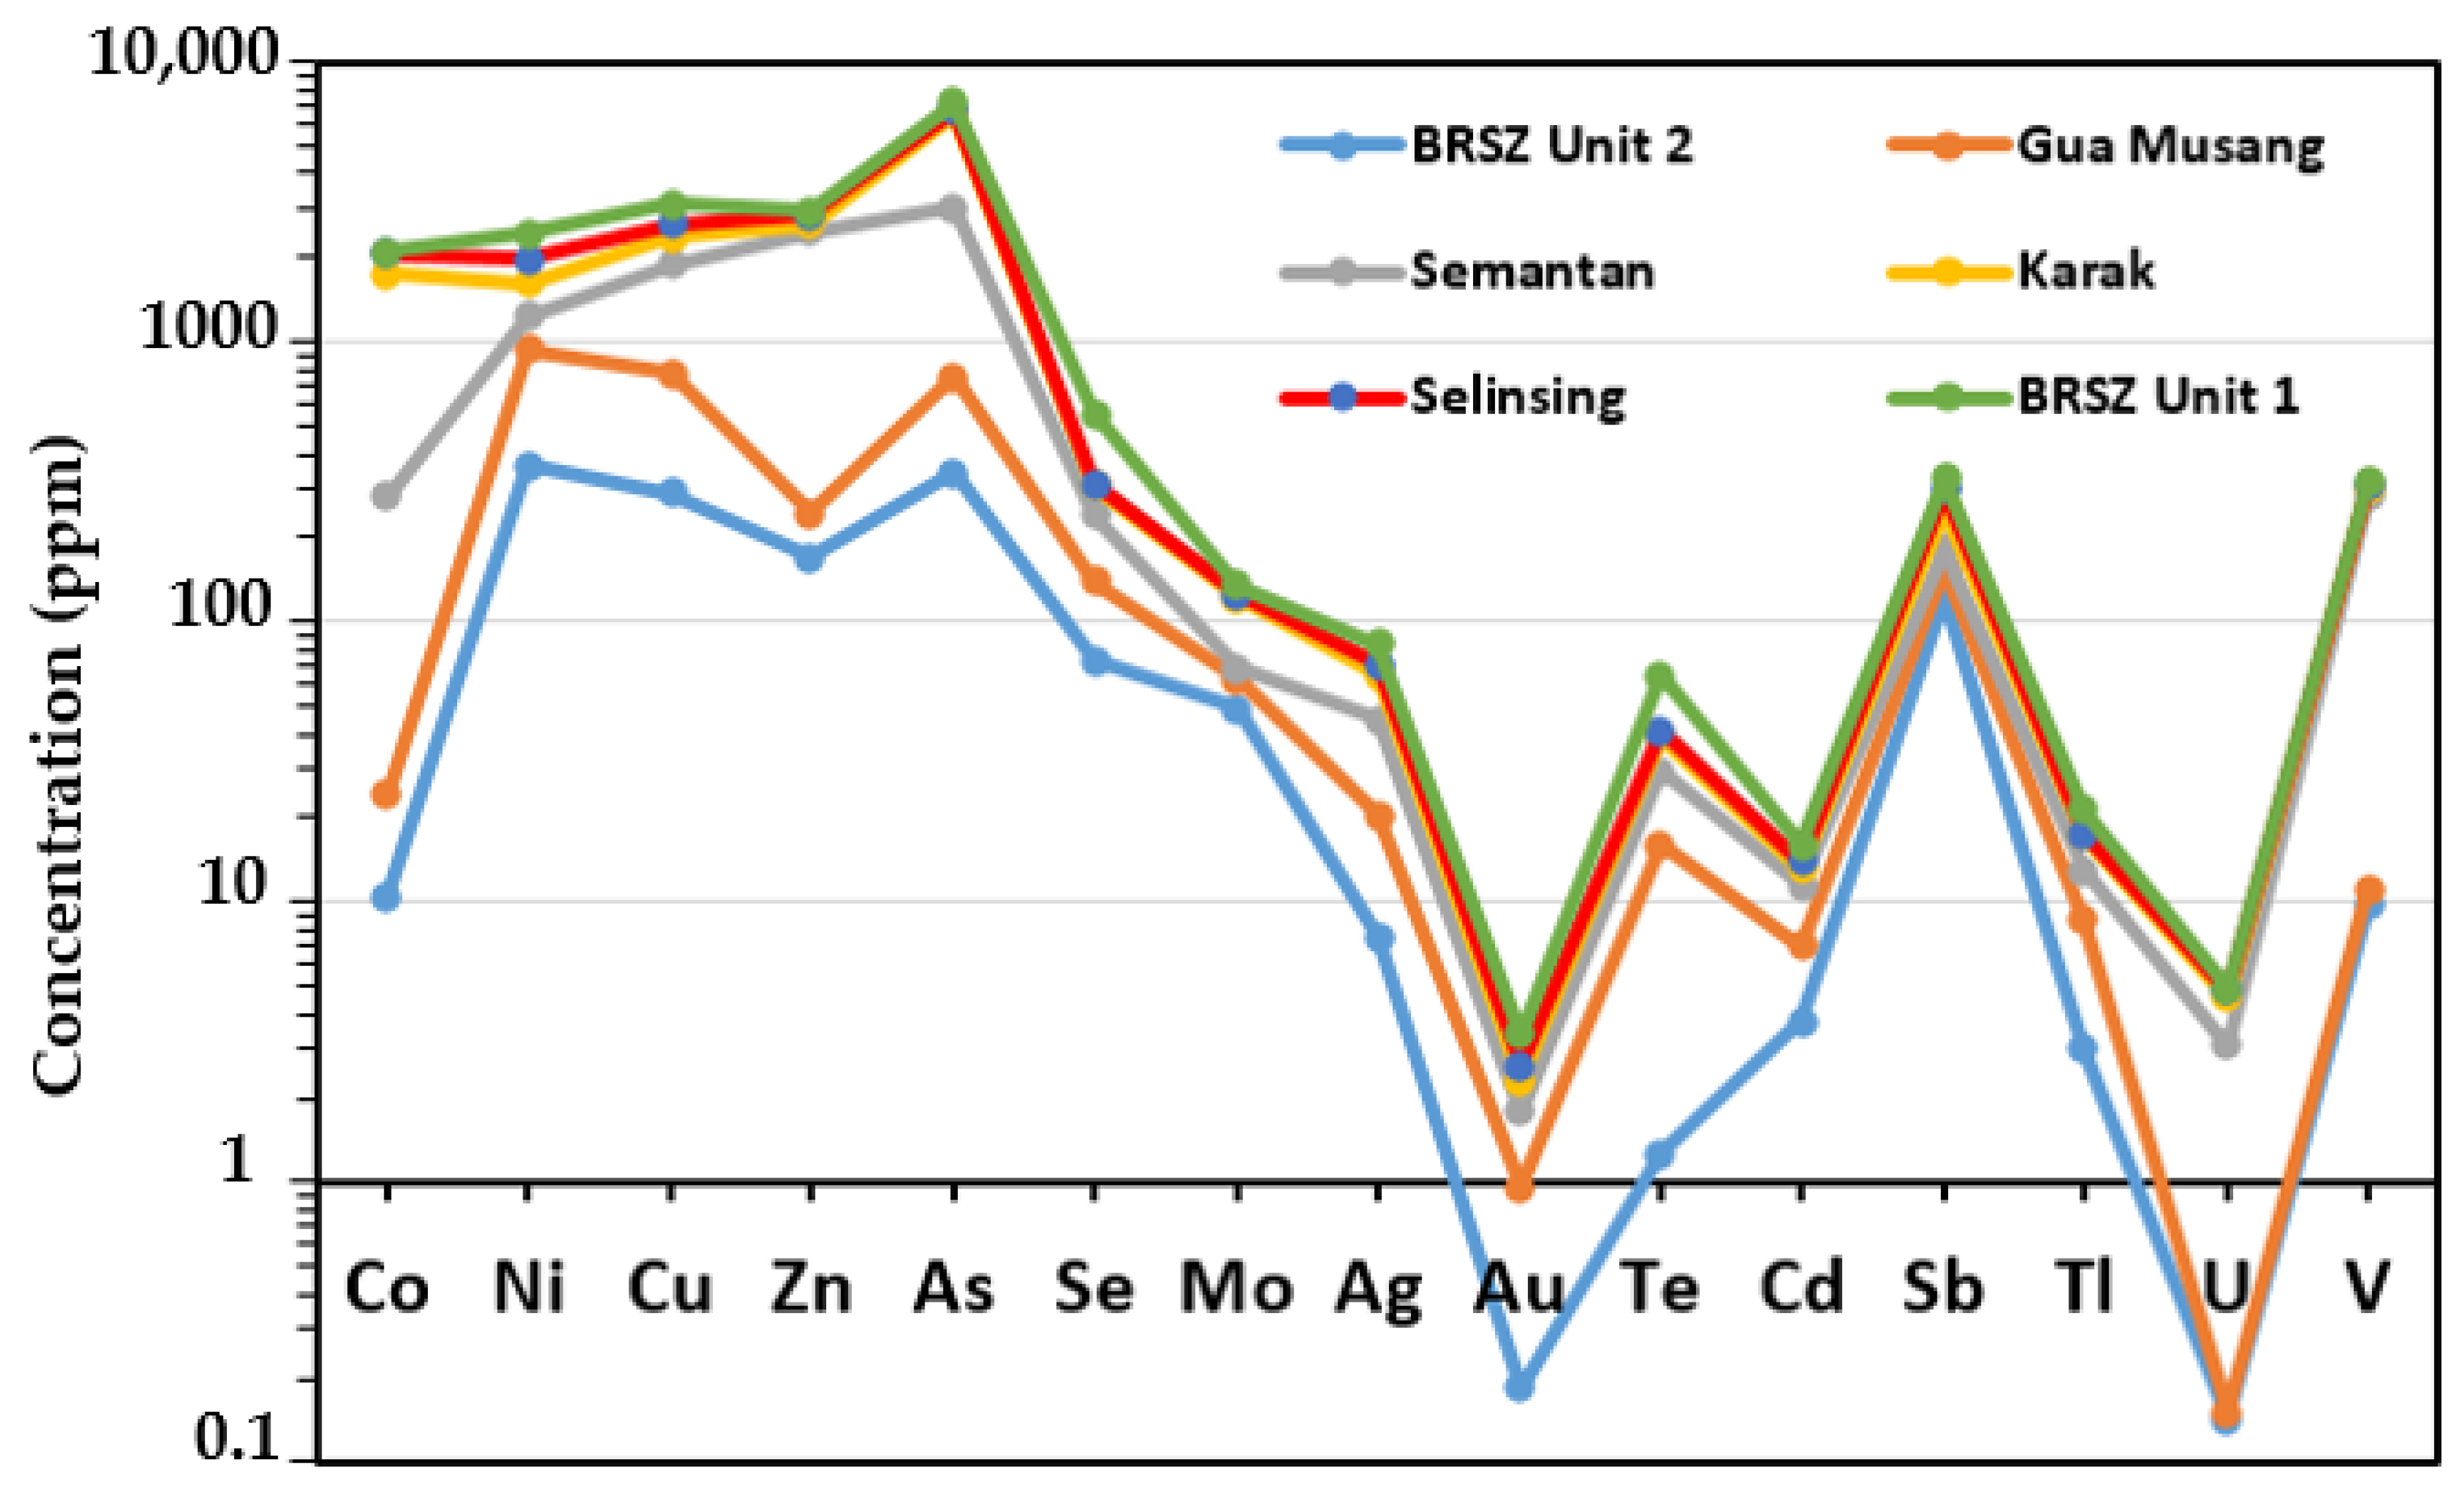
Trace element composition shows some incremental variation in metal concentration among all of the pyrite samples analysed. For example, Gua Musang Formation has the second lowest Au concentration. Furthermore, BRSZ Unit 2 has the lowest Au concentration relative to other formations. Moreover, BRSZ Unit 1 has the highest concentration out of all the elements in the plot (Figure 6).
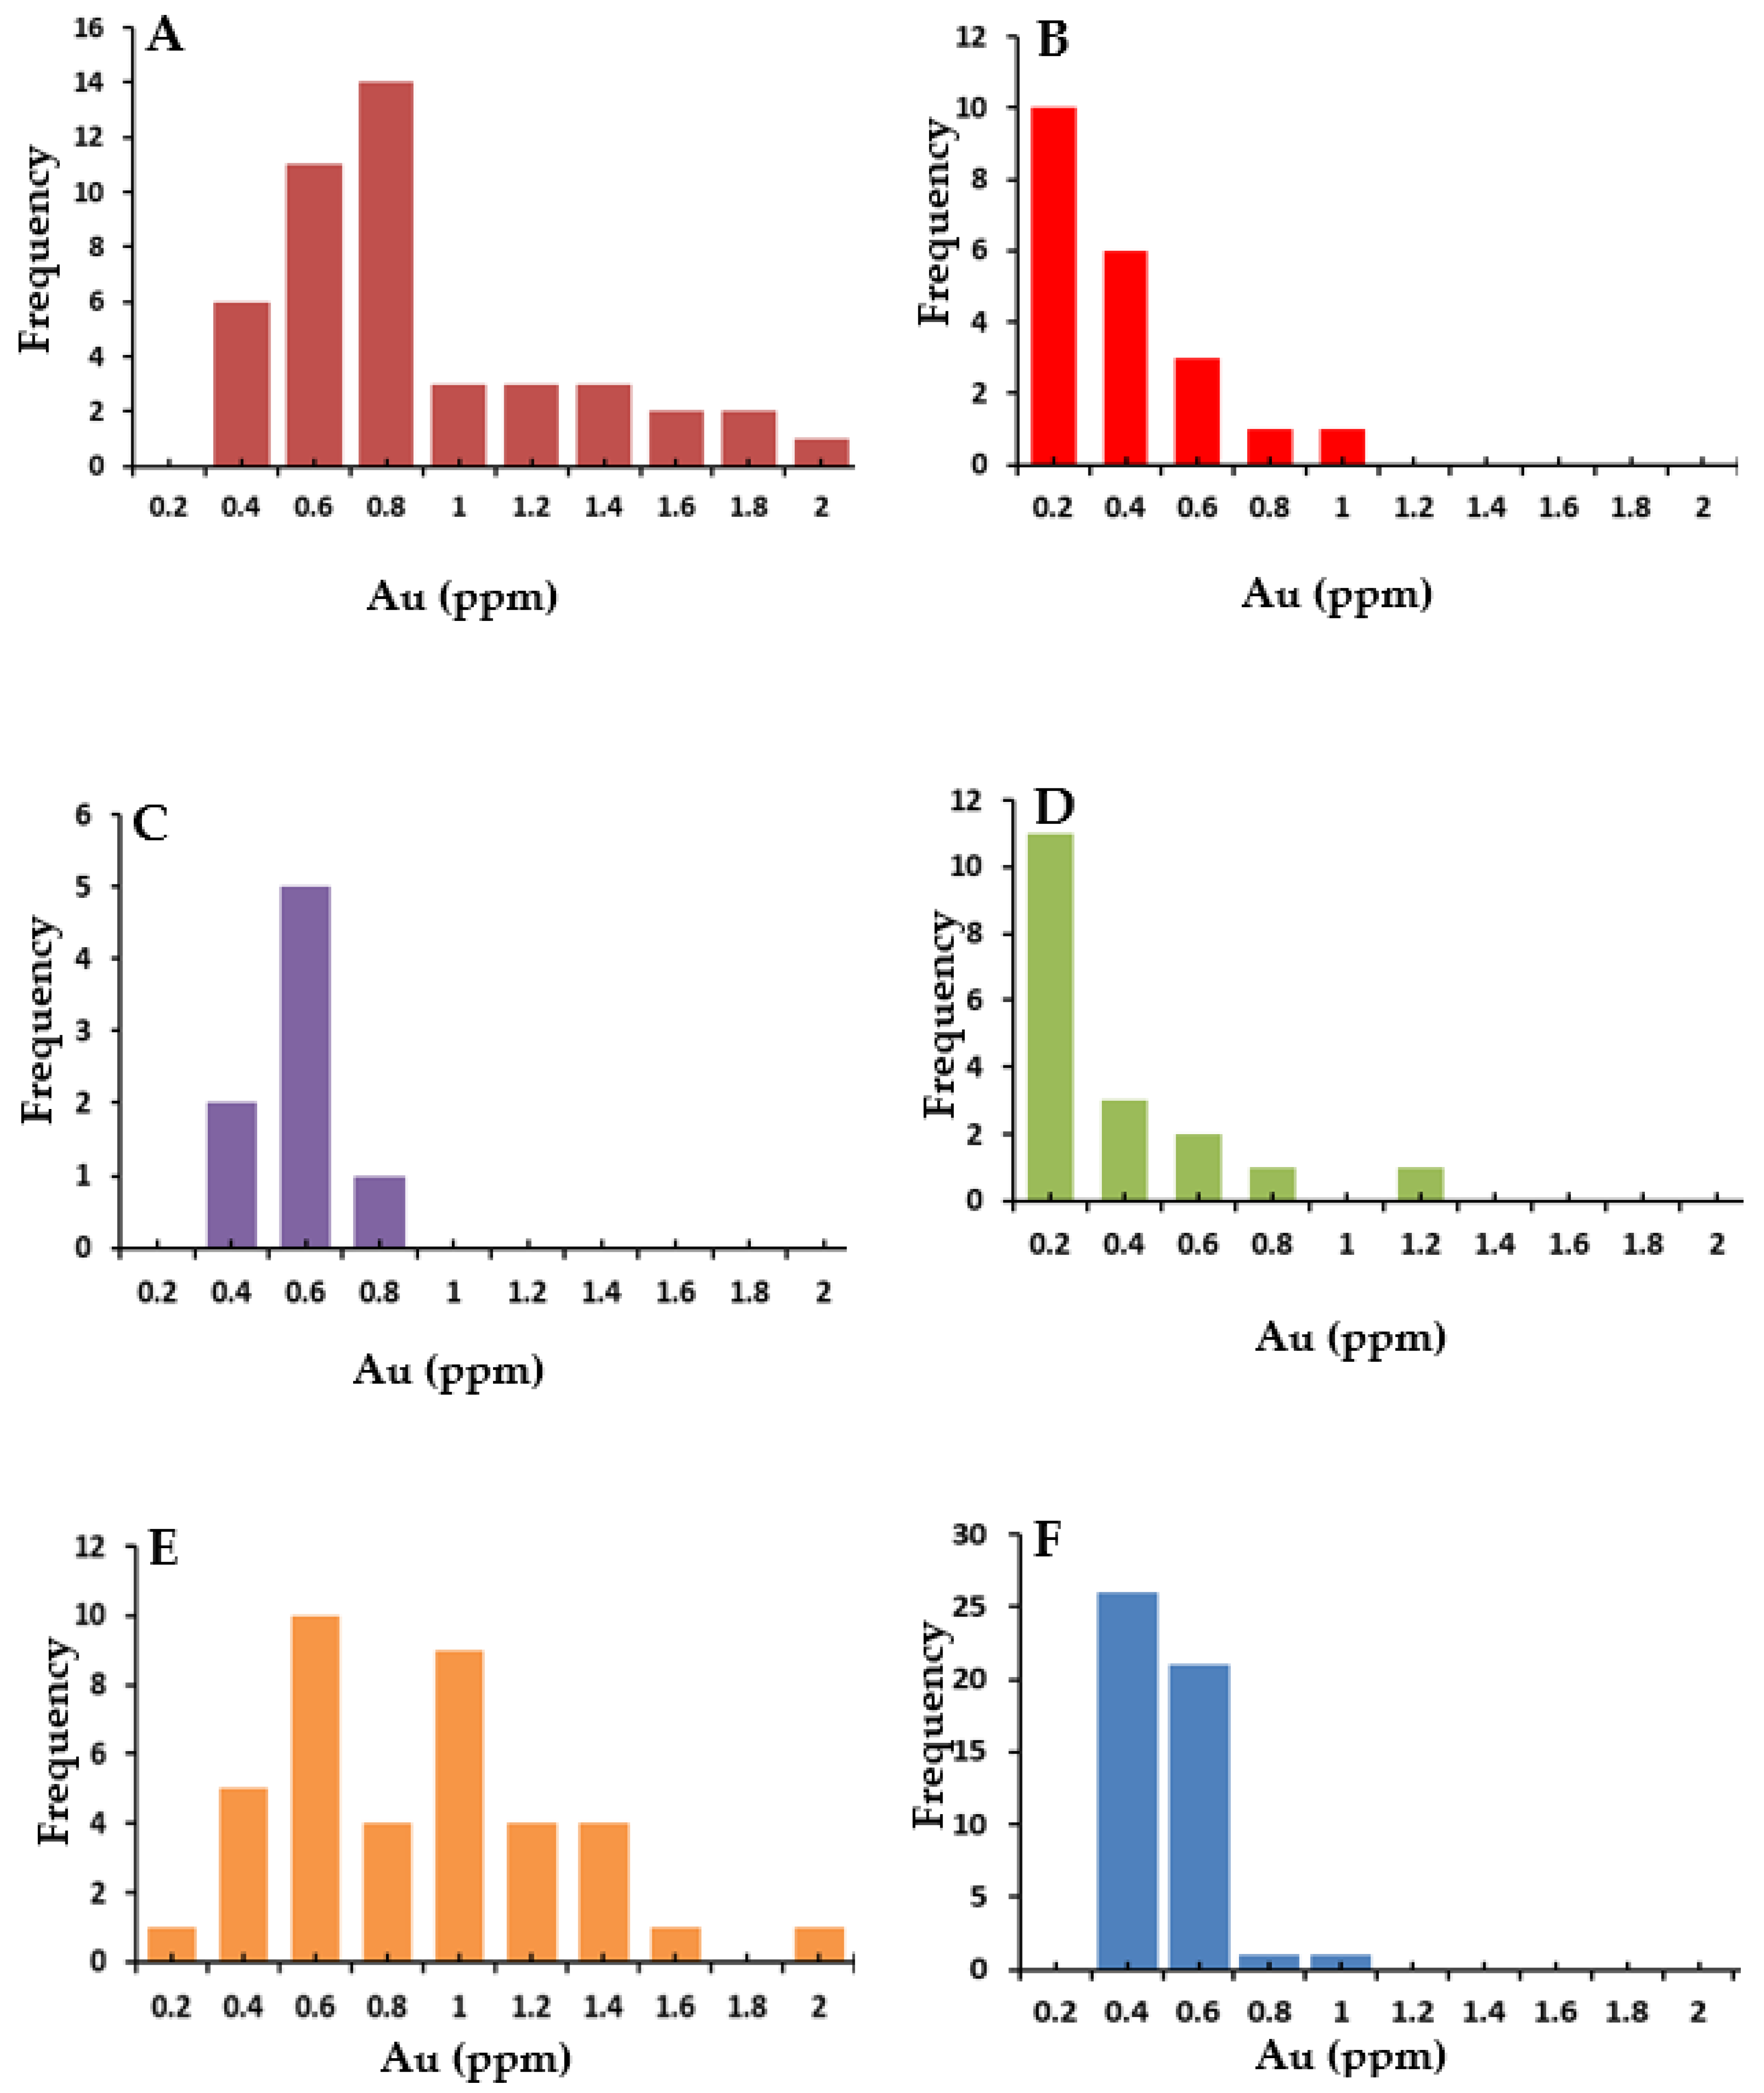
Histograms of gold content in sedimentary pyrite depicting results derived from analyses using the LA ICP-MS method are shown in Figure 7. BRSZ Unit 1 shows a bimodal distribution of Au concentration.
With the EPMA method, 90 analyses were undertaken on framboidal pyrites and micro-crystals of pyrite. EPMA results are shown in Tables S2 and S3. Only elements with LA ICP-MS concentrations above 100 ppm were re-analysed via EPMA. Trace element concentrations for each formation or unit are detailed below. Data are presented in ppm values as they were converted from wt % to better compare them with the LA ICP-MS results (Table S3).
BRSZ Unit 1: The metal mean contents are Co (16.7 ppm), Ni (387.7 ppm), Cu (500.5 ppm), Zn (19 ppm), As (89.2 ppm), and Se (173.3 ppm).
For the BRSZ Unit 2, the metal mean contents are Co (0.8 ppm), Ni (284.6 ppm), Cu (403.5 ppm), Zn (29.5 ppm), As (144 ppm), and Se (44.6 ppm).
In the Semantan Formation, the metal mean concentrations are Co (262.7 ppm), Ni (97.4 ppm), Cu (67.3 ppm), Zn (27.9 ppm), and As (595.9 ppm).
Karak Formation has the following metal mean values: Co (3716.6 ppm), Ni (735.9 ppm), Cu (562.5 ppm), Zn (169.7 ppm), As (288.7 ppm), and Se (91.9 ppm).
The Gua Musang Formation metal mean contents are Co (771.2 ppm), Ni (98 ppm), Cu (259.3 ppm), Zn (62.6 ppm), and As (422.9 ppm).
At the Selinsing gold mine, the metal mean contents are Co (271.3 ppm), Ni (310.9 ppm), Cu (299 ppm), Zn (73.6 ppm), As (182.5 ppm), and Se (0.4 ppm).

6. Discussion

6.1. Origin of Pyrite

The origin of pyrite can be assessed based on its morphology and some geochemical proxies. Pyrite framboids are diagenetic (forming in the mud on the sea floor), whereas euhedral micro crystals are commonly syngenetic (forming in the water column). Diagenetic small euhedral crystals have been reported from the Mesoarchean Witwatersrand Supergroup in South Africa [32]. Aggregates of micron-size crystals of pyrite have also been interpreted as being of diagenetic origin [33]. However, the euhedral shape of the pyrite and its clean appearance resembles hydrothermal pyrite [11].
Makoundi (2016) [21] reported that sedimentary pyrites are mostly framboidal and microcrystalline in shape based on their shape and the ratio of Ag/Au. The disseminated small framboidal pyrites with sizes ranging from 20 to 40 µm from the Selinsing gold deposit are believed to have formed during diagenesis due to the ratio of Ag/Au > 1 [11,28]. Most aggregates of pyrite framboids that were laser-ablated have a size greater than 20 µm. It is widely believed that pyrite framboids larger than 10 µm form diagenetically [34].
Ref. [8] documented some chemical proxies for pyrites of diagenetic origin. They proposed the following proxies: Ag/Au > 2; Co/Ni = 0.01–2; Zn/Ni = 0.01–10; Cu/Ni = 0.01–10; As/Ni = 0.01–10; Te/Au = 1–1000; As/Au > 200; and Sb/Au > 100. Upon comparing the data from [7] against the findings of [21], it turns out that the following ratios are the best geochemical proxies to infer the diagenetic origin of pyrite: Ag/Au > 2, Te/Au = 1–1000. In this study, Ag/Au varies from 0.9 to 2475.2 and Te/Au mostly ranges between 1.37 and 417.11, with just three values that are less than 1 (i.e., 0.44; 0.07; 0.07) and one value greater than 1000, which is 5847.7 (Table S1). Most of the pyrite samples analysed in the present study are of diagenetic origin, apart from the Semantan Formation pyrite, which appears to be of hydrothermal origin.

6.2. Relationship among Metals and Control on Depositional Processes

The tuffaceous black shales in the Karak Formation contain elevated amounts of gold in diagenetic pyrites, which suggests they are the potential for Au source rocks. However, in the Karak Formation, LA ICP-MS data of diagenetic pyrites shows an unusual geochemical signature of a high Co content (2580 ppm) relative to Ni (557.2 ppm), which suggests a volcanic contribution of cobalt and nickel in the structure of pyrite during diagenesis. This is unusual because sedimentary pyrites are known to commonly have a high Ni content relative to their Co content [10,11,21,35]. Lower Co/Ni ratios are often preserved in diagenetic pyrites, whereas a higher Co is connected to mafic/magmatic and/or hydrothermal sources [36,37]. In the Karak Formation, the Co/Ni ratio varies between 2.61 and 5.27 and is indicative of a greater proportion of Co over Ni, likely pointing to a magmatic and/or hydrothermal source of the cobalt in the Karak Formation. The EPMA data also indicate significant values of Co over Ni in pyrite from the Gua Musang and Semantan Formation black shales, probably pointing to a volcanic contribution of Co during the formation of sedimentary pyrite.
In terms of correlation (Table S4), Au has a positive correlation with Co (r = 0.53), Cu (r = 0.56), Ag (r = 0.90), Te (r = 0.74), Sb (0.81), and V (0.70) in the Karak Formation. The good correlation of V with Au (r = 0.70), Zn (r = 0.60), Cd (r = 0.65), Sb (r = 0.70), and U (r = 0.59) in sedimentary pyrite suggests that they were all concentrated by organic processes [28,38]. Previous research shows that vanadium is commonly introduced to sediments by organometallic ligands in organic matter [39,40]. Elements such as Ag, V, and Te are typically adsorbed onto organic matter and concentrated into framboidal pyrite during diagenesis [28].
Hydrothermal pyrite from the Semantan Formation has Au that correlates positively with Zn (r = 0.87), Se (r = 0.97), and Cd (r = 0.98). The alternative relationships between Au and other trace elements are as follows: (1) Au correlates positively with Zn and Se; (2) Au correlates negatively with As; (3) Au exhibits a weak-positive correlation with Ag, Ni, and Mo; and (4) Au has no correlation with Te and Sb. The fact that Au does not correlate positively with As (r = −0.5) can be explained by the mechanistic process of Au-As decoupling due to fluid immiscibility during the rapid crystallization of pyrite [41]. Recent research on pyrite from the renowned Daqiao Au deposit in the North China Craton (NCC) shows that the Au-As correlation is not always positive [42]. They argued that fast dynamic processes such as fluid mixing and immiscibility might be responsible for unexpected Au-As decoupling.
Sedimentary pyrite from the Gua Musang Formation has an Au content that varies positively with Ag (r = 0.48), Te (r = 0.47), Ni (r = 0.56), Sb (r = 0.53), Se (r = 0.64), Cd (r = 0.51); however, Au has no correlation with As. Vanadium shows a positive correlation with Mo (r = 0.54) and Sb (r = 0.65), indicating that these two elements were absorbed onto organic matter during the formation of pyrite.
The sedimentary pyrite in the bedded cherts of BRSZ Unit 2 shows an increase in the order of magnitude of Mo across the dataset, which may be explained by the release of Mo from matrix organics and its incorporation in pyrite associated with maturation during late diagenesis.
At Selinsing, there is a weak-to-strong correlation between Au and redox-sensitive trace elements such as Ni (r = 0.34), As (r = 0.35), V (r = 0.43), Ag (r = 0.61), and Sb (r = 0.62). These trace elements can form organometallic complexes with humic substances and reduce in abundance to ensure their incorporation into the sedimented organic matter [4,43,44]. Current models for the formation of sediment-hosted gold deposits [7,11] stipulate that gold may be adsorbed onto organic matter, transported, and deposited into a basin and then introduced into pyrite through organic processes. Earlier on in the present study, a two-stage model of the formation of the giant Sukhoi Log deposit in eastern Siberia hosted in organic-bearing and pyritic black shales was proposed [14]. Ref. [45] has also proposed a two-stage model of gold mineralisation for the Dalma, volcano-sedimentary belt, North Singhbhum in eastern India. The authors of this study suggested that gold was primarily introduced in black shale-hosted sedimentary pyrite and later released and deposited in quartz veins [45].
In the BRSZ Unit 1 sedimentary pyrite, there is a positive correlation between Au and Zn (r = 0.58), Co (r = 0.61), Sb (r = 0.63), Ag (r = 0.65), and Se (r = 0.76). Correlation coefficients for sedimentary pyrites and pyrite micro crystals using LA ICP-MS are presented in Table S4.

6.3. Exploration Implications

Most of the gold in the shales occurs in sedimentary pyrite [28,46] and is regarded as an early sedimentary stage of the pre-concentrated gold to form source rocks favourable for subsequent orogenic gold formation [47]. Recent research [7,9] suggests that the periods of elevated Se contents in sedimentary pyrites coincide with the periods of increased atmospheric oxygenation in the Earth’s history. Therefore, Se content can be used as a proxy for atmospheric oxygenation [9,48].
It has been shown that the peak times of gold deposition coincide with those of high gold and selenium contents in sedimentary pyrite. Therefore, the periods of elevated Se contents in sedimentary pyrite were coeval with the occurrence of gold deposits throughout Earth’s history [9,49]. Following the same rationale, the elevated concentration of gold in sedimentary pyrite makes these formations good source rocks for sediment-hosted gold deposits in Malaysia. This approach also defines horizons that are fertile as opposed to those that are not.
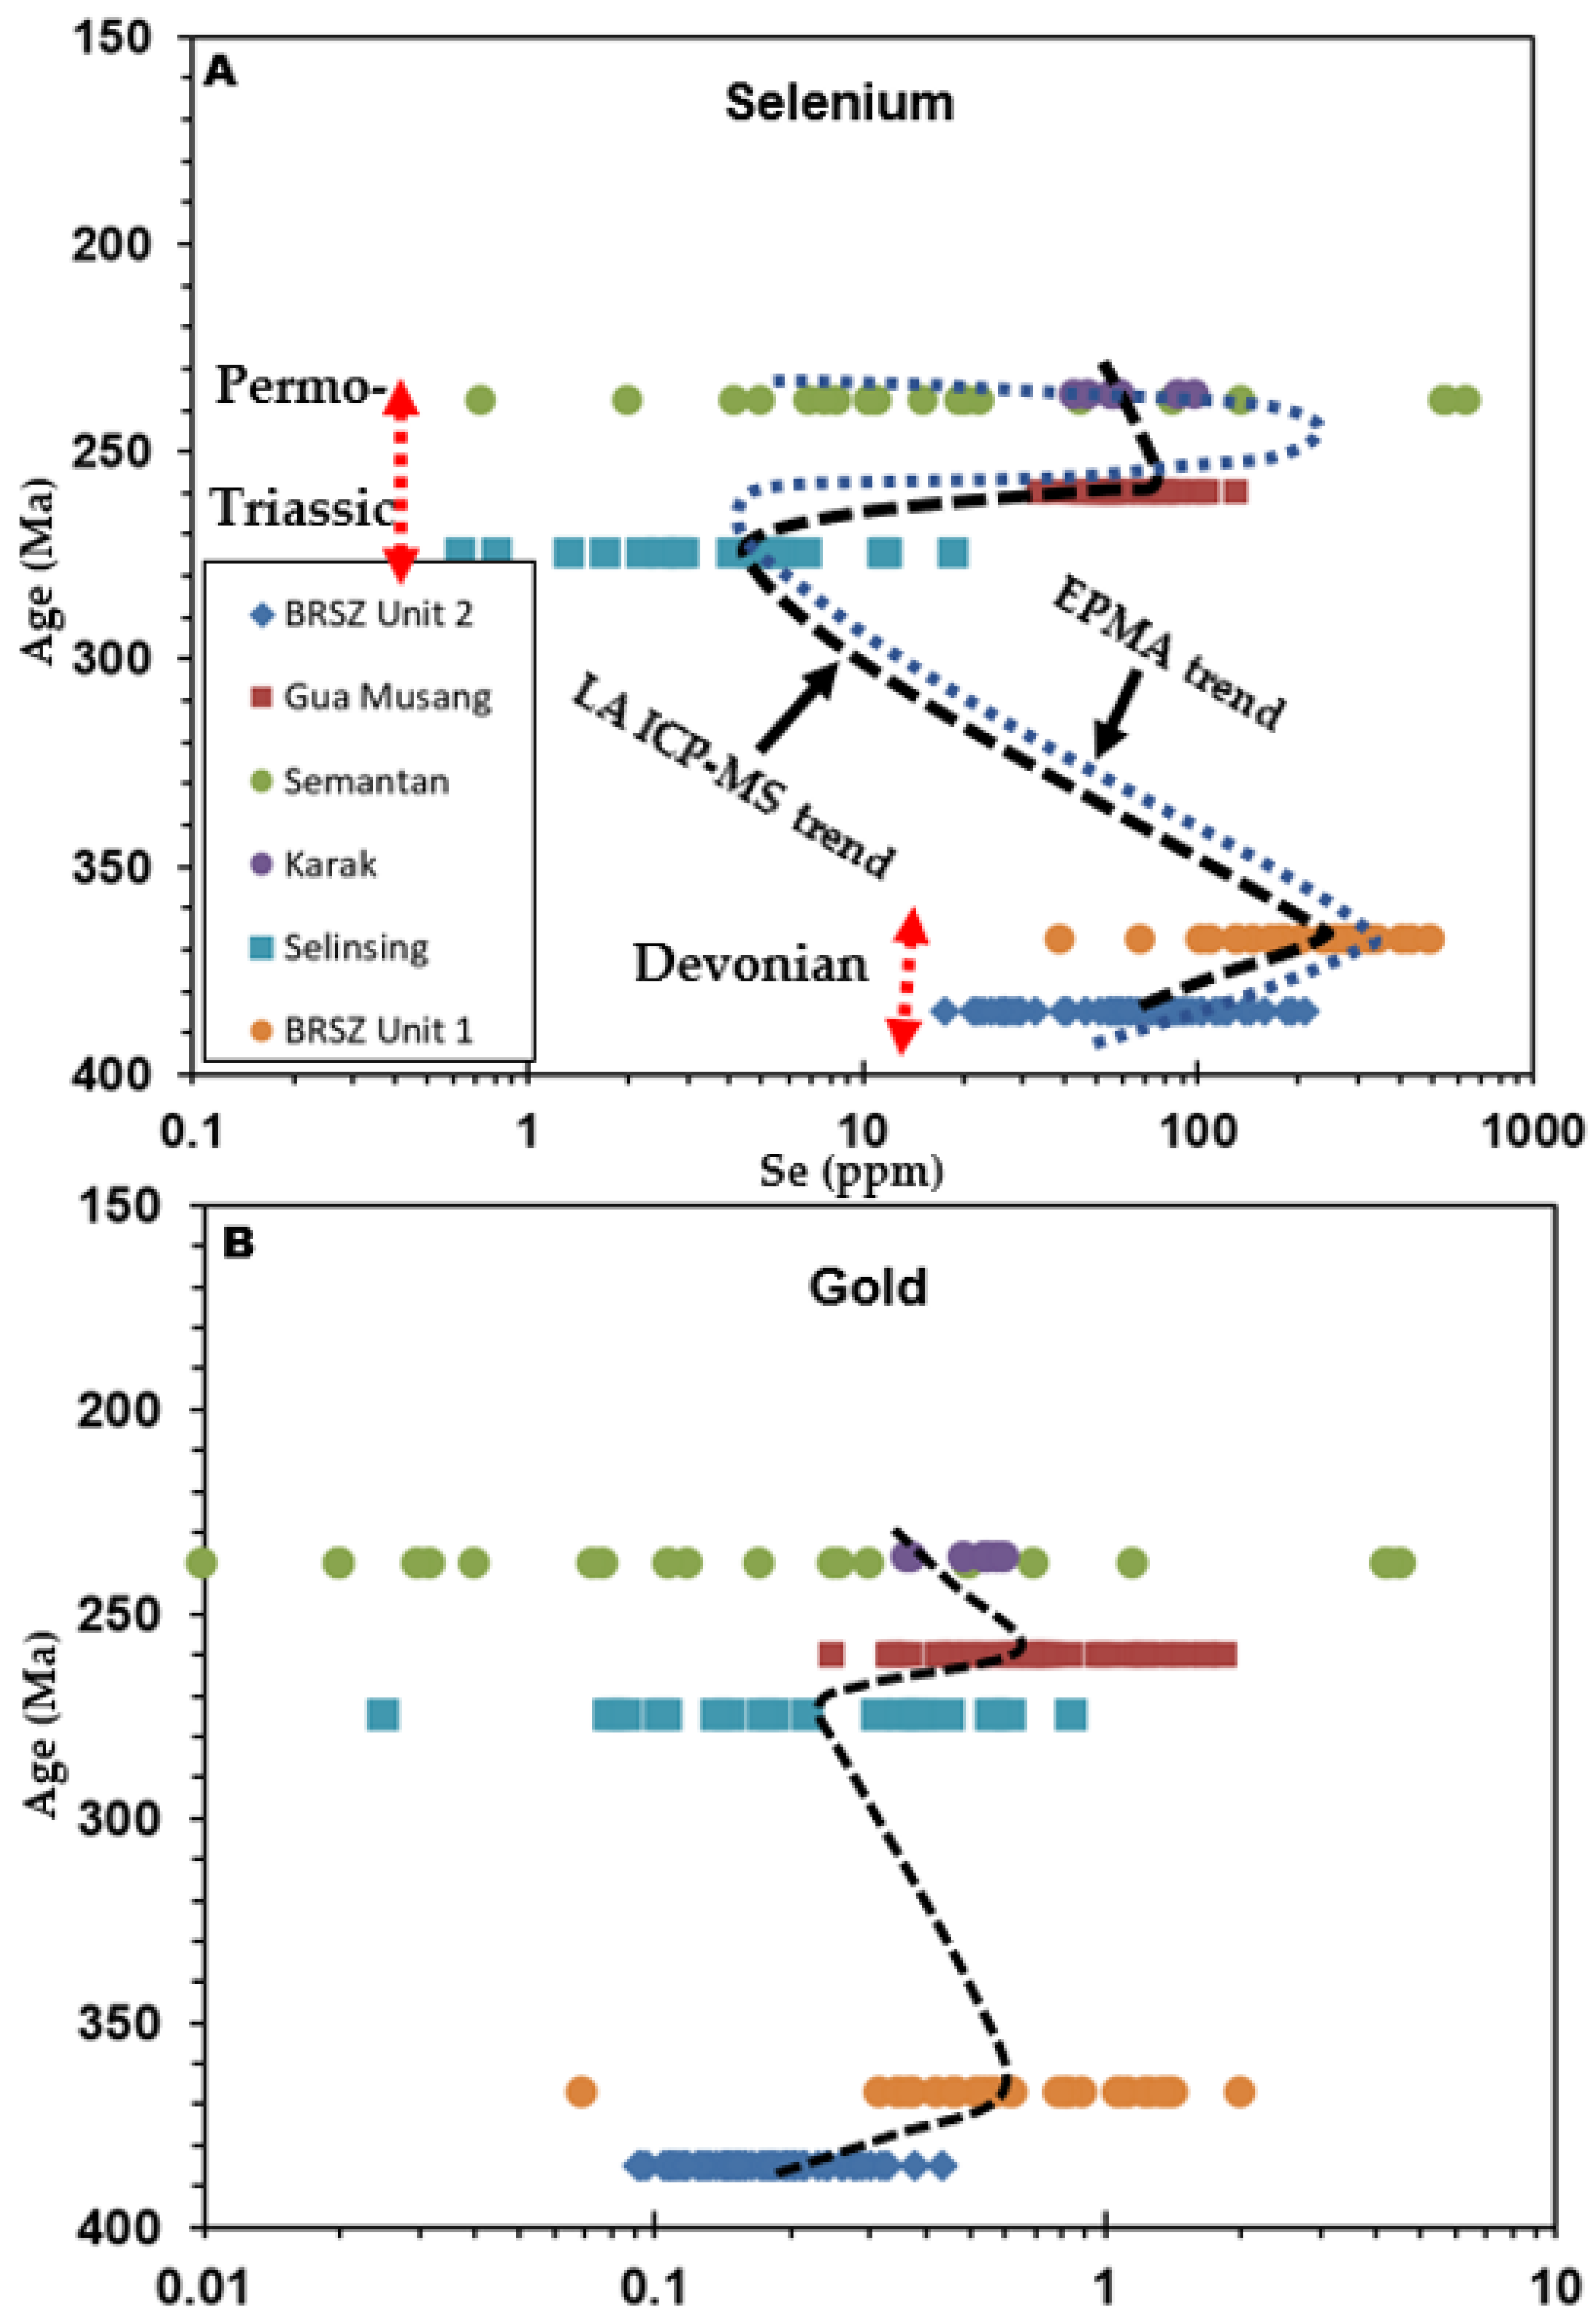
In relation to the present study, LA ICP-MS data show that the Se contents are elevated in the BRSZ Unit 1 (up to 502 ppm), Gua Musang Formation (up to 131 ppm), Semantan Formation (up to 637 ppm), Karak Formation (up to 99 ppm), and BRSZ Unit 2 (up to 210 ppm) compared to Selinsing (up to 19 ppm), which suggests that elevated oxygenation levels correspond to the times of black shale and chert depositions recorded for the Gua Musang, Semantan, Karak, and BRSZ Unit 2 formations (Figure 8). It also shows that the periods of elevated Se contents occur at the times of elevated gold contents. Comparatively, the EPMA data indicate two significant Se contents (Table S3): one in the Karak Formation with a mean Se value of 144.1 ppm and another one in the BRSZ Unit 1 with a mean value of 252 ppm. Both LA ICP-MS and EPMA analyses of the Karak Formation pyrites indicate significant cobalt concentrations (mean: 1467.7 ppm for LA ICP-MS; mean: 3716.6 ppm for EPMA), which may warrant further research in the search for economic cobalt mineralisation in the district.
Pyrite chemistry indicates that both the selenium and gold contents display two peaks: one in Devonian times and another in Permo-Triassic times (Figure 8). The lowest levels of Au and Se contents (Average: 5.3 ppm Se, 0.3 ppm Au) are found in Permo-Triassic times, which is likely related to a decline in atmospheric oxygenation, as recorded in sedimentary pyrite found in black shales from the Selinsing gold deposit. The two peaks that represent the maximum values of Se and Au concentrations typically fall within the following ranges (Figure 8): Permo-Triassic (63.4–103.4 ppm Se; 0.5–0.8 ppm Au) and Devonian (72.6–243.8 ppm Se; 0.2–0.8 ppm Au), that are likely to be periods of elevated atmospheric oxygenation that were detected in the Gua Musang, Semantan, Karak, and BRSZ Units 1 and 2.
The areas of interest in gold exploration are those where the BRSZ Units 1, Gua Musang, and Karak formations crop out. In the suture zone, the BRSZ Unit 1 represents carbonaceous black shales interbedded with sandstones of the Devonian age that crop out in the Bentong-Raub Suture Zone. This formation was intensely deformed, and the shales are crosscut by quartz veins. Likewise, the BRSZ Unit 2 is a good zone to explore for gold, especially in the metamorphosed and sheared parts of the district. The likelihood of discovering orogenic gold deposits is higher in zones that are folded and faulted, which implies the circulation of metamorphic or magmatic fluids that cool down in structural traps.
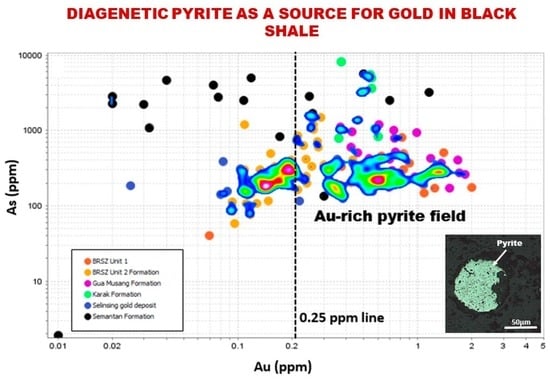
Ref. [10] determined the relationship between As and Au contents in sedimentary pyrite from Sukhoi Log (Siberia), Bendigo (Australia), Spanish Mountain (British Columbia, Canada), and Northern Carlin Trend (Nevada, USA). These authors found that the productive carbonaceous black shales have gold levels above 0.25 ppm in diagenetic pyrites, whereas the barren carbonaceous black shales have gold levels below 0.25 ppm.
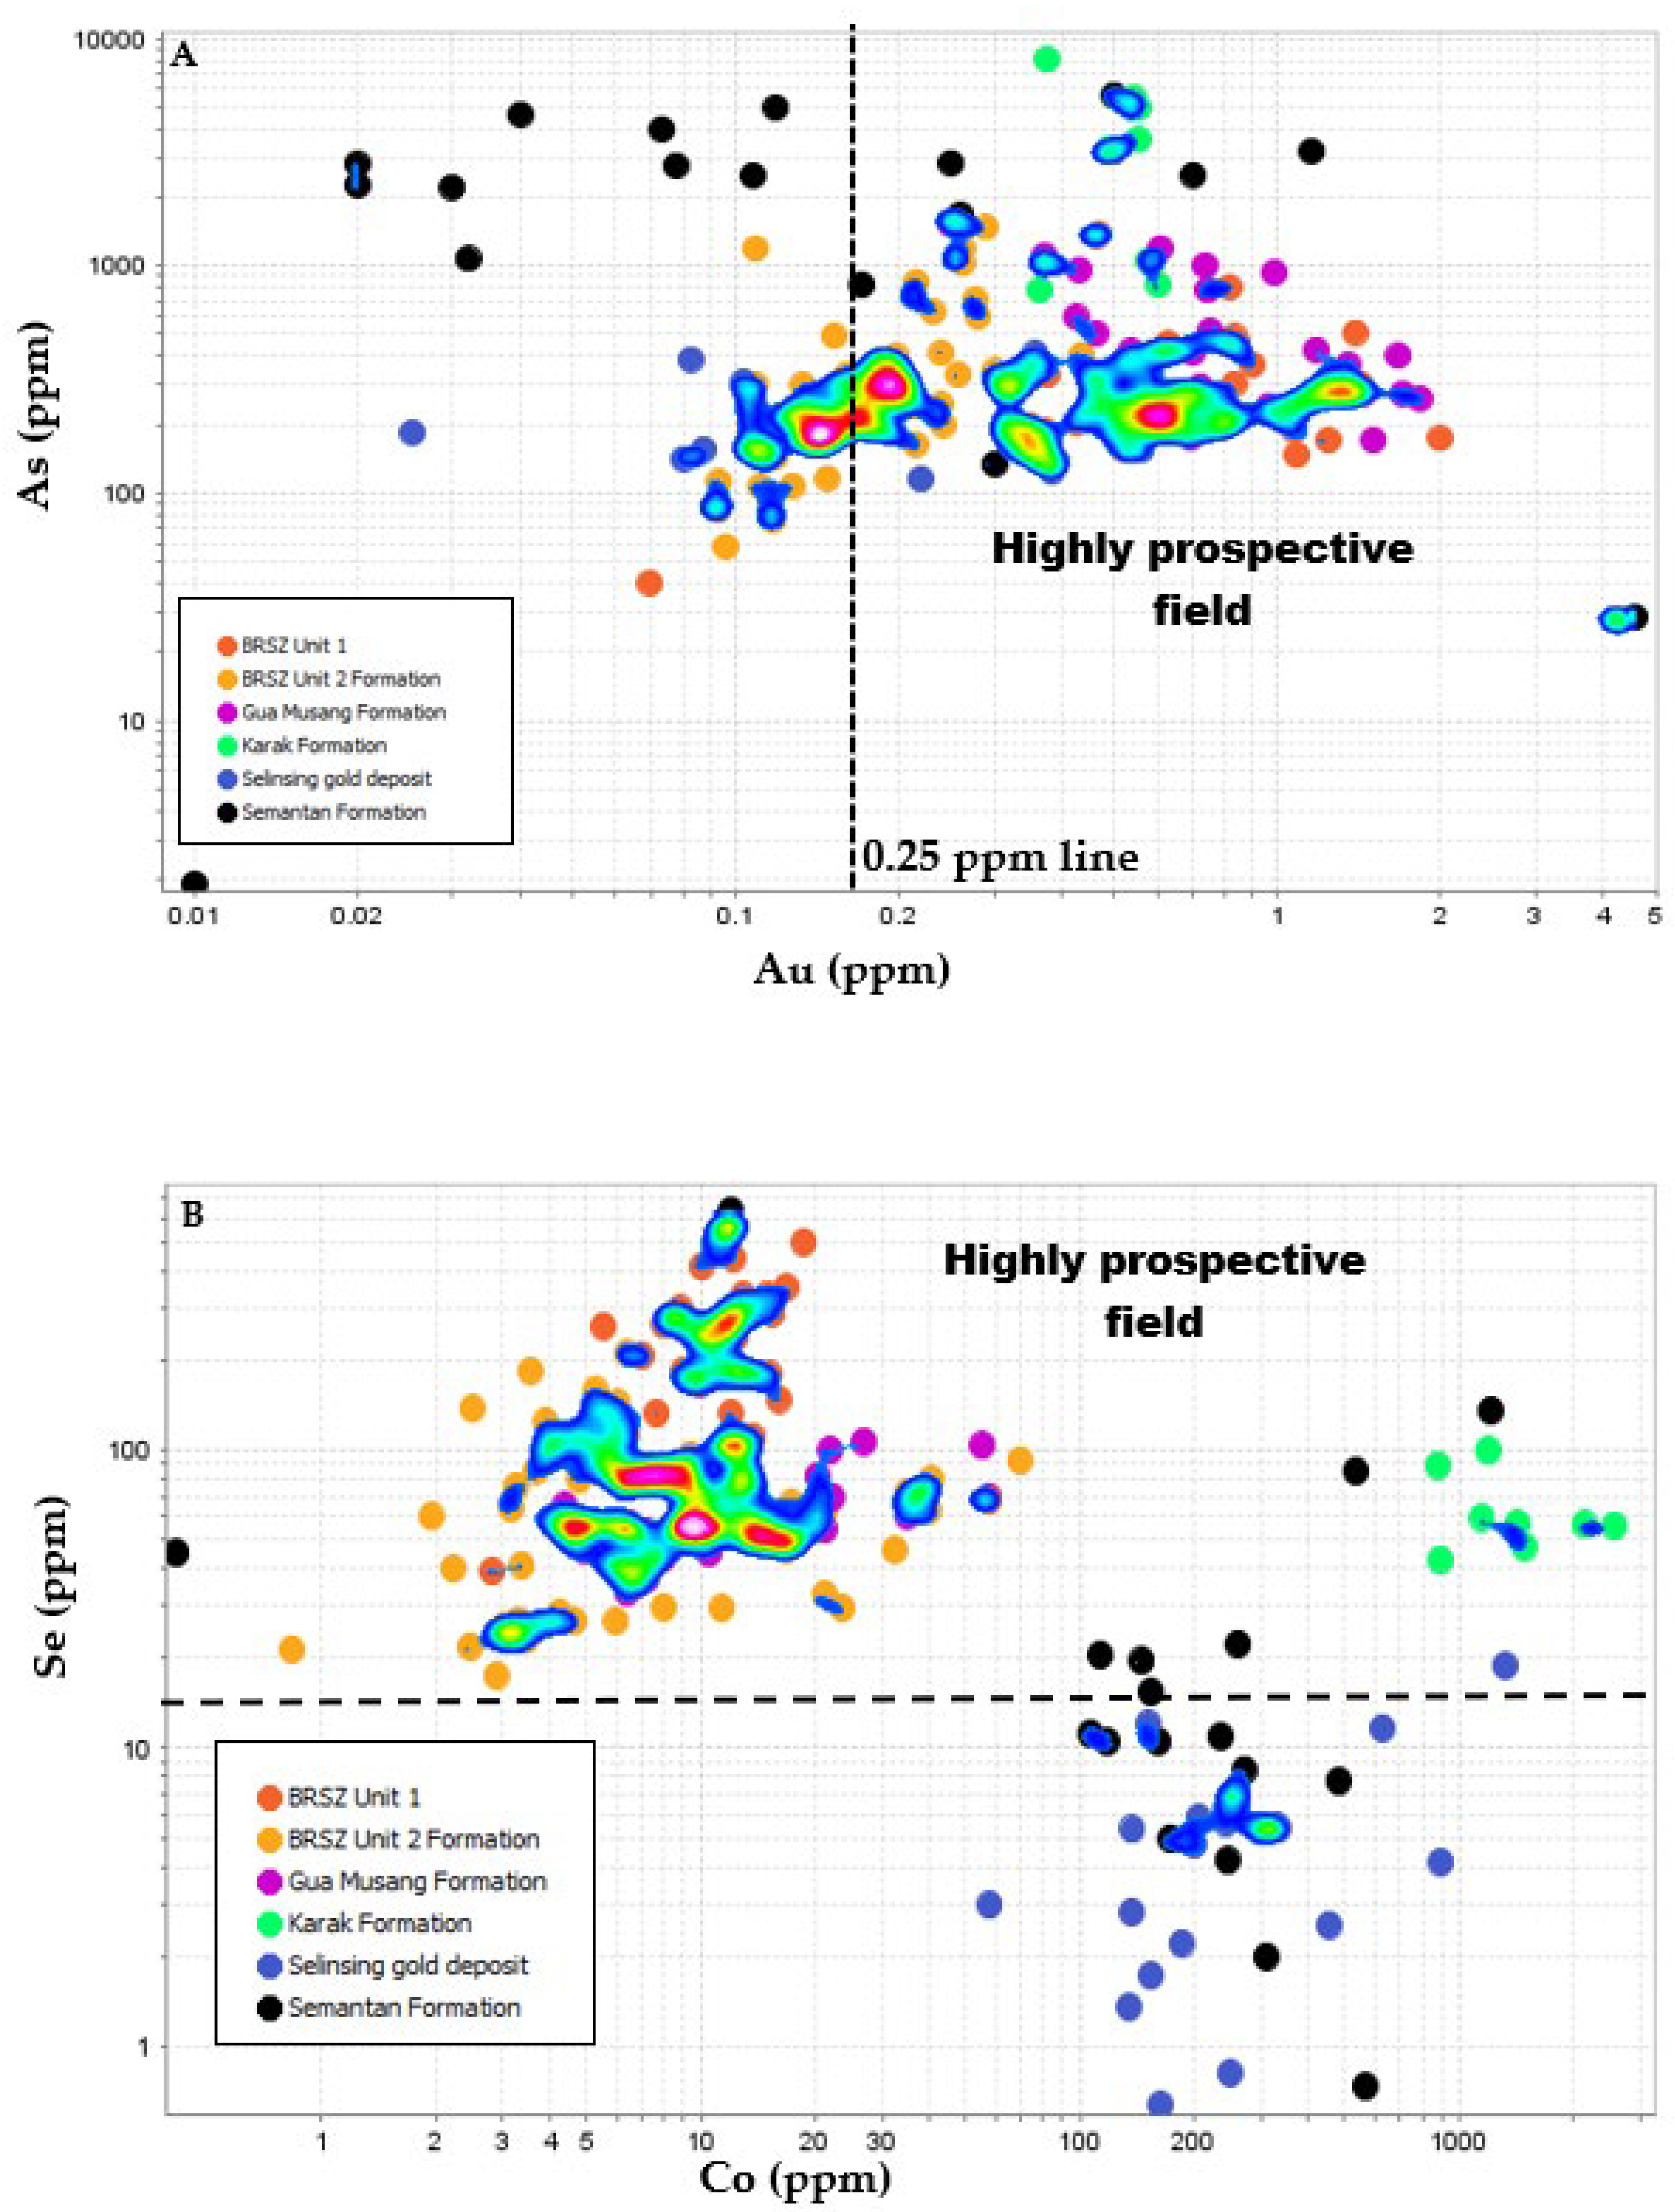
We have used the 0.25 ppm Au cut-off value to compare the findings reported in the present study. The investigation shows that the Gua Musang has diagenetic pyrites with gold content values above 0.25 ppm (Figure 9). Similarly, the BRSZ Unit 1 and Karak Formation also have pyrites with Au content values that are above 0.25 ppm.
The Karak Formation is located farther south, away from the Bentong-Raub Suture Zone, whereas the BRSZ Unit 1 is within the suture zone. The gold concentration in diagenetic pyrite in the black shales leads to the conclusion that the Gua Musang Formation is still a suitable candidate for additional gold potential. The same line of reasoning applies to the Karak Formation and BRSZ Unit 1, where diagenetic pyrites have gold levels above 0.25 ppm. These formations have the potential to host gold resources that are sediment-hosted.
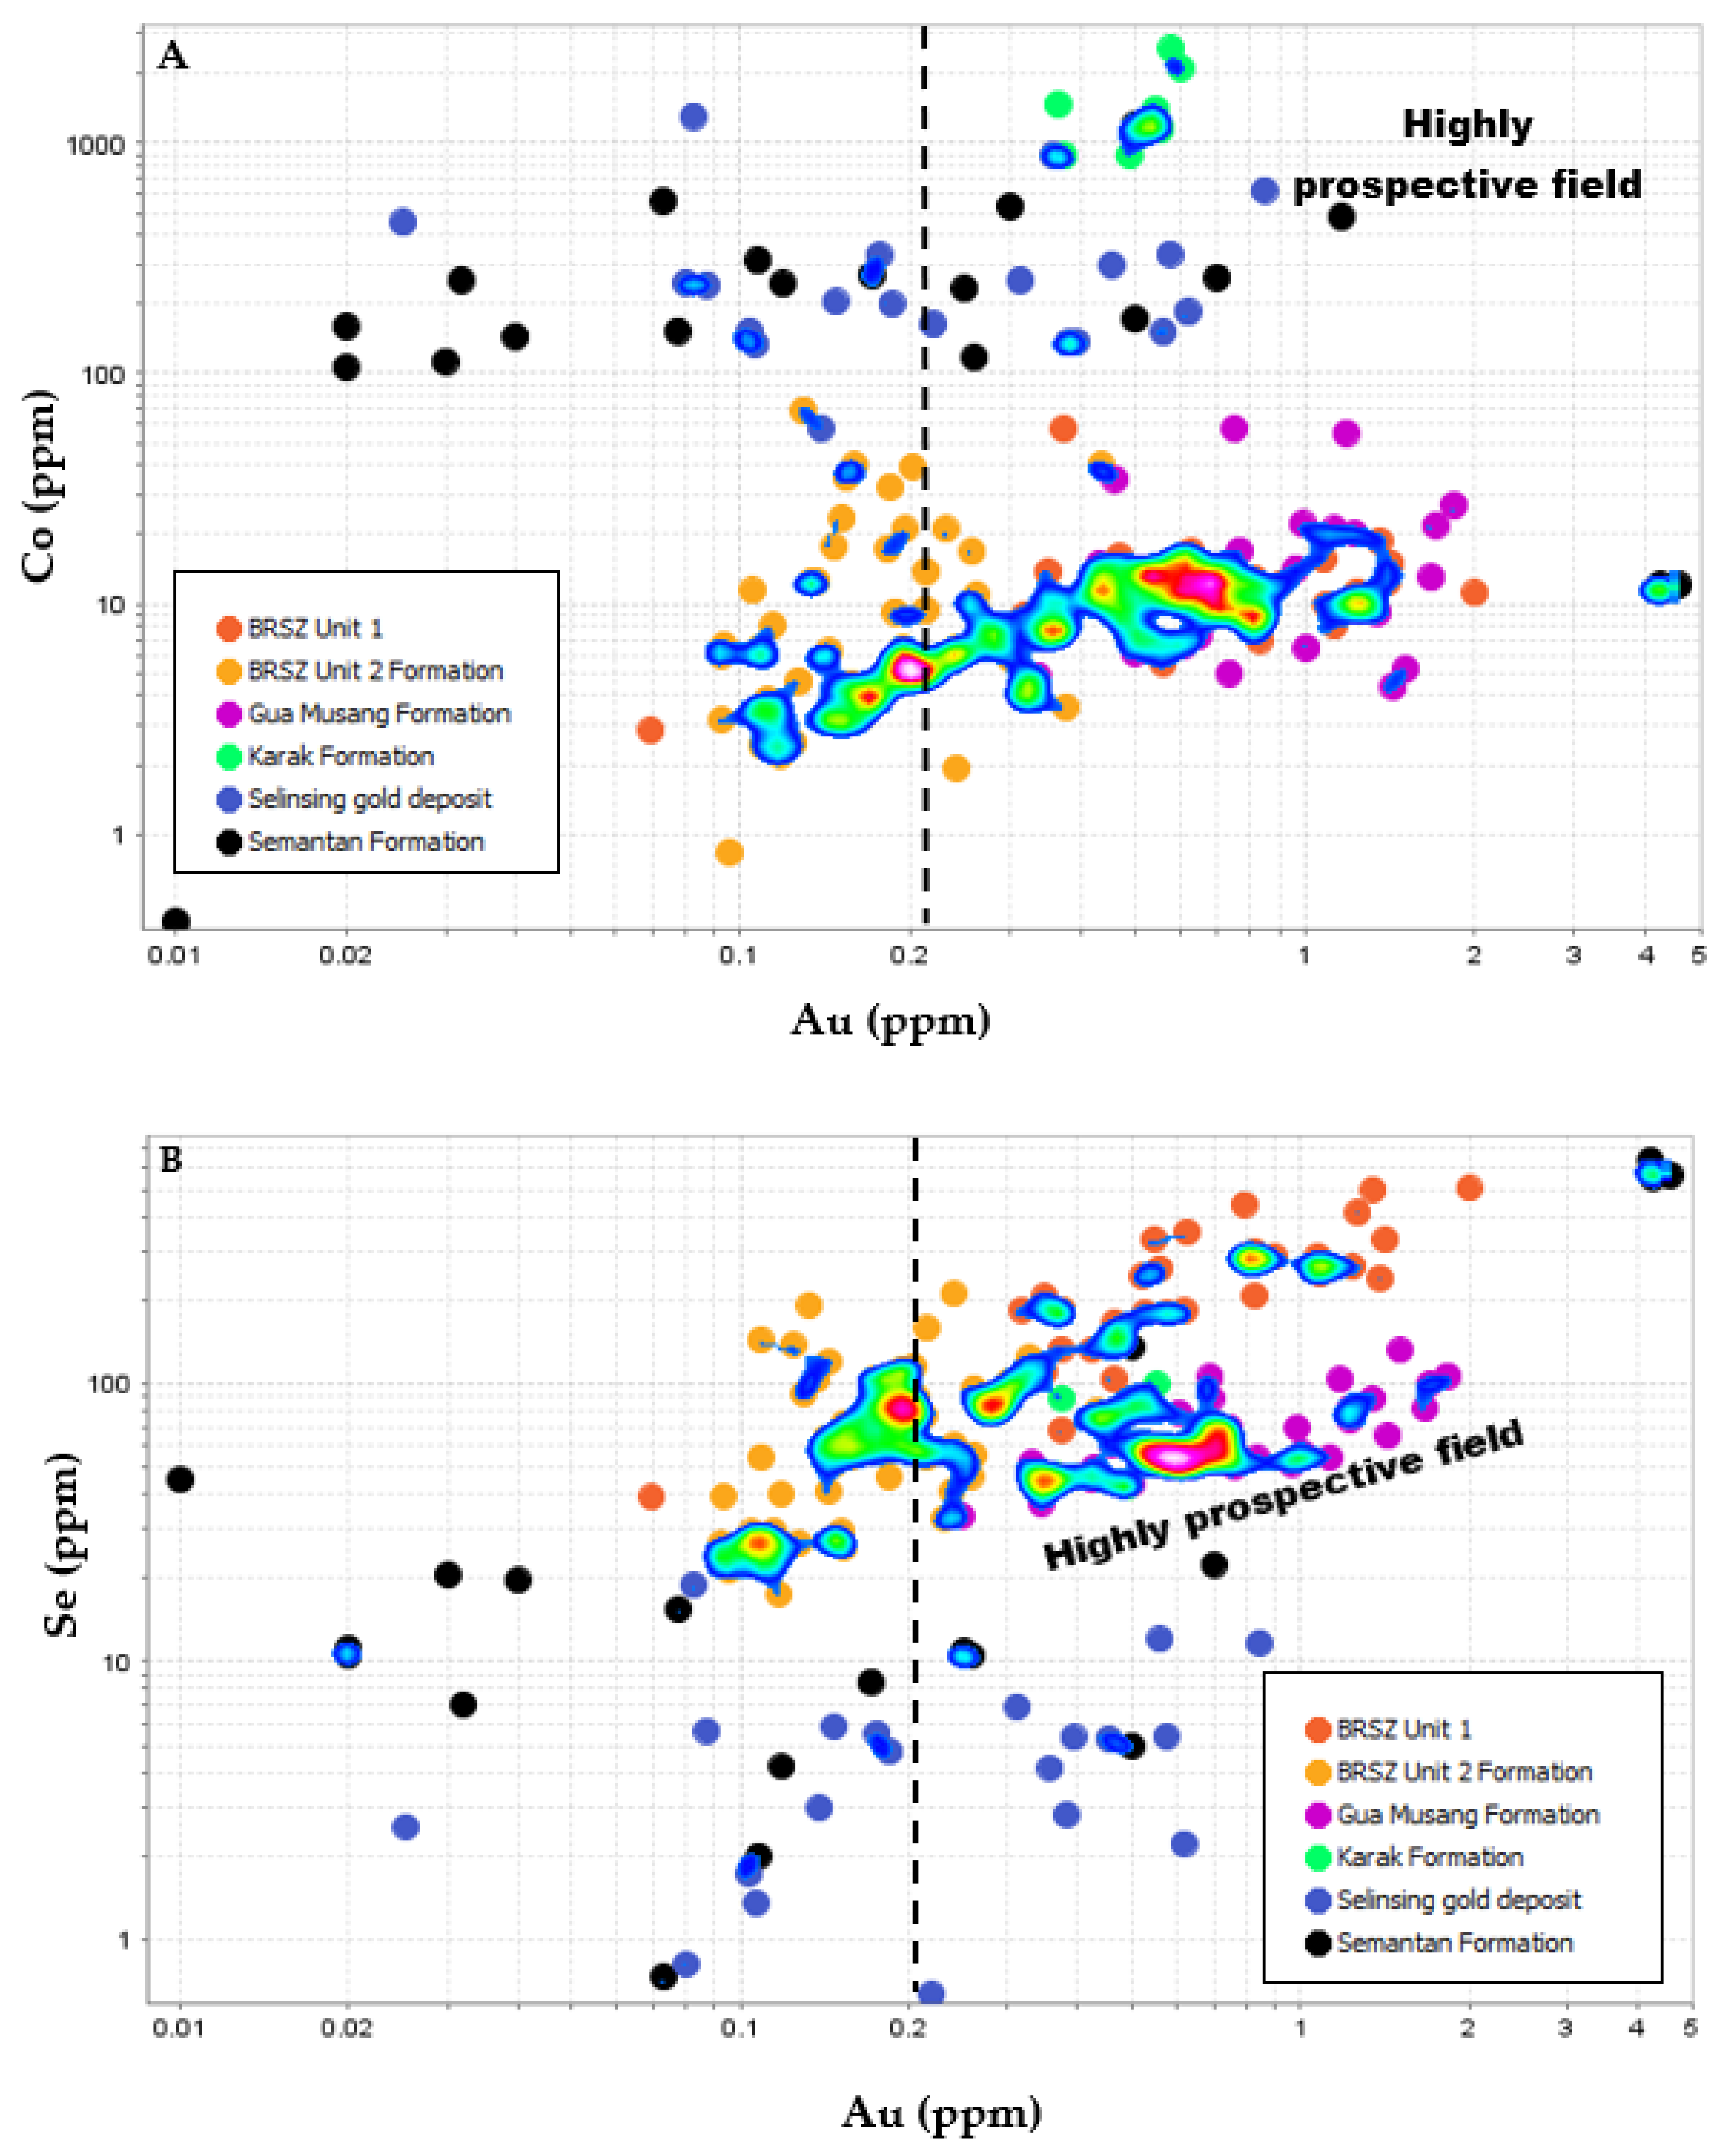
Using the point density binary plots, the data in this study show that Au source rocks are represented by the population with gold content levels above 0.25 ppm, cobalt levels > 100 ppm, and Se levels > 10 ppm in sedimentary pyrite (Figure 9 and Figure 10).

7. Conclusions

Pyrite chemistry indicates that the selenium and gold concentrations peaked twice: once in the Devonian period and again in the Permo-Triassic period. The Permo-Triassic period shows minimal Au and Se contents (average: 5.3 ppm Se, 0.3 ppm Au), most likely corresponding to a decline in atmospheric oxygenation, as documented by sedimentary pyrite in black shale from the Selinsing gold deposit. The average values of the two maximums of elevated Se and Au content are as follows: Devonian (72.6–243.8 ppm Se; 0.2–0.8 ppm Au); Permo-Triassic (63.4–103.4 ppm Se; 0.5–0.8 ppm Au)—both recorded in the Gua Musang and Karak formations, including the BRSZ Units 1 and 2.
When the oxygen levels in the atmosphere increase, a large amount of trace metals is deposited into the ocean via the weathering process. Gold concentration in diagenetic pyrites during the Permo-Triassic and Devonian periods make these pyrites one of the sources of gold in Peninsular Malaysia’s central region. As a result, the two maxima of elevated Se and gold contents during the Permo-Triassic and Devonian periods indicate the potential of discovering orogenic gold mineralisation. Current findings indicate that gold exploration can be extended to BRSZ Units 1 and 2 and to the Gua Musang and Karak formations rather than just focusing on areas in and around the Selinsing gold mine, Buffalo Reef, Penjom, Tersang, and Bukit Koman.

Supplementary Materials

The following supporting information can be downloaded at https://www.mdpi.com/article/10.3390/min13060829/s1, Table S1: LA ICP-MS trace element composition; Table S2: EPMA trace element composition; Table S3: EPMA results in ppm; Table S4: Correlation coefficients.

Author Contributions

Conceptualization, C.M., K.Z. and Z.E.; methodology, C.M. and Z.E.; software, C.M.; validation, C.M. and Z.E.; formal analysis, C.M.; investigation, C.M.; resources, Z.E.; data curation, C.M.; writing-initial manuscript, C.M.; writing—review and editing, C.M., K.Z., Z.E. and H.Z.; visualization, C.M. and Z.E.; supervision, C.M.; project administration, K.Z. and C.M.; funding acquisition, C.M. All authors have read and agreed to the published version of the manuscript.

Funding

This research was funded by the University of Tasmania-APA PhD Scholarship and the Southeast Asia Ore Deposit Research Projects.

Data Availability Statement

The data is contained within the article or Supplementary Material.

Acknowledgments

The authors are grateful for the financial support provided by the “Ore Deposits of SE Asia Project” and the University of Tasmania-APA (Australian Postgraduate Award) Ph.D. Scholarship. Many thanks to Leonid Danyushevsky and his team for their assistance with LA ICP-MS pyrite chemistry at the CODES laboratory facility, University of Tasmania, Australia. The authors are grateful to Karsten Goemann for his help in analysing pyrite using the EPMA method.

Conflicts of Interest

The authors declare no conflict of interest.

References

  1. Shoieb, M.A.; Gebretsadik, H.T.; Rahmani, O.; Ismail, M.S.; Ibad, S.M. Geochemical characteristics of the Silurian-Devonian Kroh black shales, Peninsular Malaysia: An implication for hydrocarbon exploration. J. Geochem. Explor. 2022, 232, 106891. [Google Scholar] [CrossRef]
  2. Rickard, D. Sulfidic sediments and sedimentary rocks: Developments in Sedimentology. Sulfidic Sediments Sediment. Rocks 2012, 65, 801. [Google Scholar]
  3. Huerta-diaz, M.A.; Morse, J.W. Pyritization of trace-metals in anoxic marine sediments. Geochim. Cosmochim. Acta 1992, 56, 2681–2702. [Google Scholar] [CrossRef]
  4. Tribovillard, N.; Algeo, T.J.; Lyons, T.; Riboulleau, A. Trace metals as paleoredox and paleoproductivity proxies: An update. Chem. Geol. 2006, 232, 12–32. [Google Scholar] [CrossRef]
  5. Gregory, D.; Meffre, S.; Large, R.R. Comparison of metal enrichment in pyrite framboids from a metal-enriched and metal-poor estuary. Am. Mineral. 2014, 99, 633–644. [Google Scholar] [CrossRef]
  6. Berner, Z.A.; Puchelt, H.; Nöltner, T.; Kramar, U. Pyrite geochemistry in the Toarcian Posidonia Shale of southwest Germany: Evidence for contrasting trace-element patterns of diagenetic and syngenetic pyrites. Sedimentology 2013, 60, 548–573. [Google Scholar] [CrossRef]
  7. Gregory, D.; Large, R.R.; Halpin, J.A.; Baturina, E.L.; Lyons, T.W.; Wu, S.; Sack, P.J.; Chappaz, A.; Maslennikov, V.V.; Bull, S.W. Trace element content of background sedimentary pyrite in black shales. Econ. Geol. 2015, 110, 1389–1410. [Google Scholar] [CrossRef]
  8. Large, R.R.; Halpin, J.A.; Danyushevsky, L.V.; Maslennikov, V.V.; Bull, S.W.; Long, J.A.; Gregory, D.D.; Elena Lounejeva Lyons, T.W.; Sack, P.J.; McGoldrick, P.J.; et al. Trace element content of sedimentary pyrite as a new proxy for deep-time ocean–atmosphere evolution. Earth Planet. Sci. Lett. 2014, 389, 209–220. [Google Scholar] [CrossRef]
  9. Large, R.R.; Gregory, D.D.; Steadman, J.A.; Tomkins, A.G.; Lounejeva, E.; Danyushevsky, L.V.; Halpin, J.A.; Maslennikov, V.; Sack, P.J.; Mukherjee, I.; et al. Gold in the oceans through time. Earth Planet. Sci. Lett. 2015, 428, 139–150. [Google Scholar] [CrossRef]
  10. Large, R.R.; Bull, S.W.; Maslennikov, V.V. A carbonaceous sedimentary source-rock model for Carlin-type and orogenic gold deposits. Soc. Econ. Geol. 2011, 106, 331–358. [Google Scholar] [CrossRef] [Green Version]
  11. Makoundi, C.; Zaw, K.; Large, R.R.; Meffre, S.; Lai, C.K.; Hoe, T.G. Geology, geochemistry and metallogenesis of the Selinsing gold deposit, Central Malaysia. Gondwana Res. 2014, 26, 241–261. [Google Scholar] [CrossRef]
  12. Ivanov, K.S.; Maslennikov, V.V.; Artemyev, D.A.; Tseluiko, A.S. Highly Metalliferous Potential of Framboidal and Nodular Pyrite Varieties from the Oil-Bearing Jurassic Bazhenov Formation, Western Siberia. Minerals 2020, 10, 449. [Google Scholar] [CrossRef]
  13. Pašava, J.; Ackerman, L.; Žák, J. Multi-stage metal enrichment and formation of gold mineralization in black shales: The role of high heat flow in a rift setting. Min. Depos. 2023. [Google Scholar] [CrossRef]
  14. Large, R.R.; Maslennikov, V.V.; Robert, F.; Danyushevsky, L.V.; Chang, Z. Multistage sedimentary and metamorphic origin of pyrite and gold in the Giant Sukhoi log deposit, Lena Gold Province, Russia. Econ. Geol. 2007, 102, 1233–1267. [Google Scholar] [CrossRef]
  15. Pitcairn, I.K.; Olivo, G.R.; Teagle, D.A.H.; Craw, D. Sulfide evolution during prograde metamorphism of the Otago and Alpine Schists, New Zealand. Can. Mineral. 2010, 48, 1267–1295. [Google Scholar] [CrossRef]
  16. Cave, B.J.; Stepanov, A.S.; Craw, D.; Large, R.R.; Halpin JA Thompson, J. Release of trace elements through the sub-greenschist facies breakdown of detrital rutile to metamorphic titanite in the Otago Schist, New Zealand. Can. Mineral. 2015, 53, 379–400. [Google Scholar] [CrossRef]
  17. Gregory, D. The Pyrite Trace Element Paleo-Ocean Chemistry Proxy (Elements in Geochemical Tracers in Earth System Science); Cambridge University Press: Cambridge, UK, 2020. [Google Scholar] [CrossRef]
  18. Makoundi, C. Geology, Geochemistry and Metallogenesis of Selected Sediment-Hosted Gold Deposits in the Central Gold Belt, Peninsular Malaysia. Master’s Thesis, University of Tasmania, Tasmania, Australia, 2012; 212p. [Google Scholar]
  19. Jaafar, B.A. Geology and mineral resources of the Karak and Temerloh areas, Pahang. Geol. Soc. Malays. Mem. 1976, 15, 138. [Google Scholar]
  20. Metcalfe, I. The Bentong-Raub Suture Zone. J. Asian Earth Sci. 2000, 18, 691–712. [Google Scholar] [CrossRef]
  21. Makoundi, C. Geochemistry of Black Shales, Sandstones; Chert in Malaysia: Insights into Gold Source Rocks. Ph.D. Thesis, University of Tasmania, Hobart, Australia, 2016. [Google Scholar]
  22. Makoundi, C.; Zaw, K.; Endut, Z. U-Pb Dating, Lead Isotopes, and Trace Element Composition of Pyrite Hosted in Black Shale and Magmatic Rocks, Malaysia: Implications for Orogenic Gold Mineralization and Exploration. Minerals 2023, 13, 221. [Google Scholar] [CrossRef]
  23. Wan, F.; Wan, H.; Heru Sigit, P. Type deposits of Primary Gold Mineralisation in the Central Belt, Peninsular Malaysia. Bul. Persat. Geol. Malays. 2002, 45, 111–116. [Google Scholar]
  24. Basir, J. Chert blocks in Bentong-Raub Suture Zone: A heritage of Palaeo-Tethys. Bull. Geol. Soc. Malays. 2013, 59, 85–91. [Google Scholar]
  25. Mustaffa, K.; Hadi, A.; Rahman, A. A fivefold stratigraphic and tectonic subdivision of Peninsular Malaysia. In Dynamic Stratigraphy and Tectonics of Peninsular Malaysia—Problems and Issues; a thematic publication; Geological Society of Malaysia: Kuala Lumpur, Malaysia, 1999; pp. 38–63. [Google Scholar]
  26. Makoundi, C. Facies analysis of the Triassic Jelai Formation in the Central Basin of Peninsular Malaysia: Implications on Paleogeography and Tectonics. Master’s Thesis, University of Malaya, Kuala Lumpur, Malaysia, 2004; 140p. [Google Scholar]
  27. Danyushevsky, L.V.; Robinson, P.; Gilbert, S.; Norman, M.; Large, R.R.; McGoldrick, P.; Shelley, J.M.G. Routine quantitative multi-element analysis of sulfide minerals by laser ablation ICP-MS: Standard development and consideration of matrix effects. Geochem. Explor. Environ. Anal. 2011, 11, 51–60. [Google Scholar] [CrossRef]
  28. Large, R.R.; Danyushevsky, L.; Hollit, C.; Maslennikov, V.; Meffre, S.; Gilbert, S.; Bull, S.; Bull, S.; Scott, R.; Emsbo, P.; et al. Gold and Trace element zonation in pyrite using a laser imaging technique: Implications for the timing of gold in orogenic and Carlin-style sediment-hosted deposits. Econ. Geol. 2009, 104, 635–668. [Google Scholar] [CrossRef]
  29. Allaz, J.M.; Williams, M.L.; Jercinovic, M.J.; Goemann, K.; Donovan, J. Multipoint Background Analysis: Gaining Precision and Accuracy in Microprobe Trace Element Analysis. Microsc. Microanal. 2019, 25, 30. [Google Scholar] [CrossRef] [PubMed]
  30. Donovan, J.J.; Snyder, D.A.; Rivers, M.L. An Improved Interference Correction for Trace Element Analysis. Microbeam Anal. 1993, 2, 223. [Google Scholar] [CrossRef]
  31. Armstrong, J.T. Quantitative analysis of silicates and oxide minerals: Comparison of Monte-Carlo, ZAF and Phi-Rho-Z procedures. Microbeam Anal. 1988, 1988, 239. [Google Scholar]
  32. Guy, B.M.; Beukes, N.J.; Gutzmer, J. Paleoenvironmental controls on the texture and chemical composition of pyrite from non-conglomeratic sedimentary rocks of the Mesoarchean Witwatersrand Supergroup, South Africa. S. Afr. J. Geol. 2010, 113, 195–228. [Google Scholar] [CrossRef]
  33. Vysotskiy, S.V.; Velivetskaya, T.A.; Ignatiev, A.V.; Slabunov, A.I.; Aseeva, A.V. Multiple Sulfur Isotope Evidence for Bacterial Sulfate Reduction and Sulfate Disproportionation Operated in Mesoarchaean Rocks of the Karelian Craton. Minerals 2022, 12, 1143. [Google Scholar] [CrossRef]
  34. Wilkin, R.T.; Barnes, H.L.; Brantley, S.L. The size distribution of framboidal pyrite in modern sediments: An indicator of redox conditions. Geochim. Et Cosmochim. Acta 1996, 60, 3897–3912. [Google Scholar] [CrossRef]
  35. Makoundi, C.; Endut, Z.; Large, R.R.; Zaw, K.; Lounejeva, E.; Leman, M.S.; Mohamed, K.R.; Basori, M.B.I. Geochemistry of Pyritic Mudstones from the Singa Formation, Malaysia: Insights into Gold Potential, Source of Sulfur and Organic Matter. Geosciences 2021, 11, 279. [Google Scholar] [CrossRef]
  36. Bajwah, Z.U.; Seccombe, P.K.; Offler, R. Trace element distribution Co:Ni ratios and Genesis of the big cadia iron-copper deposit, new south wales, Australia. Min. Depos. 1987, 22, 292–300. [Google Scholar] [CrossRef]
  37. Rieger, P.; Magnall, J.M.; Gleeson, S.A.; Oelze, M. Pyrite chemistry records a multistage ore forming system at the Proterozoic George Fisher massive sulfide Zn-Pb-Ag deposit, Mount Isa, Australia. Front. Earth Sci. 2023, 11, 892759. [Google Scholar] [CrossRef]
  38. Rimmer, S.M. Geochemical paleoredox indicators in Devonian-Mississippian black shales, Central Appalachian Basin, USA. Chem. Geol. 2004, 206, 373–391. [Google Scholar] [CrossRef]
  39. Arthur, M.A.; Sageman, B.B. Marine black shales: A review of depositional mechanisms and environments of ancient deposits. Ann. Rev. Earth Planet. Sci. 1994, 22, 499–551. [Google Scholar] [CrossRef]
  40. Morford, J.L.; Emerson, S. The geochemistry of redox sensitive trace metals in sediments. Geochim. Cosmochim. Acta 1999, 63, 1735–1750. [Google Scholar] [CrossRef]
  41. Liu, Z.; Ni, P.; Wang, G.-G.; Zhang, Y.-Q.; Sheng, Z.-L.; Zhang, S.-L.; Fan, M.-S.; Zhao, Z.-H. Hydrothermal evolution and gold precipitation mechanism of the Hekou gold deposit, North China Craton: Insights from pyrite texture, composition and in situ S isotope. Ore Geol. Rev. 2023, 156, 105387. [Google Scholar] [CrossRef]
  42. Wu, Y.F.; Evans, K.; Hu, S.Y.; Fougerouse, D.; Zhou, M.F.; Fisher, L.A.; Guagliardo, P.; Li, J.W. Decoupling of Au and As during rapid pyrite crystallization. Geology 2021, 49, 827–831. [Google Scholar] [CrossRef]
  43. Calvert, S.E.; Pedersen, T.F. Geochemistry of recent oxic and anoxic sediments: Implications for the geological record. Mar. Geol. 1993, 113, 67–88. [Google Scholar] [CrossRef]
  44. Wood, S.A. The role of humic substances in the transport and fixation of metals of economic interest (Au, Pt, Pd, U, V). Ore Geol. Rev. 1996, 11, 1–33. [Google Scholar] [CrossRef]
  45. Khatun, M.; Singh, S.; Chakravarti, R.; Venkatesh, A.S. Genetic constraints and possible mechanism of gold mineralization within the carbonaceous metasedimentary units of the Dalma volcano-sedimentary belt, North Singhbhum Mobile Belt, eastern India: Implications from pyrite geochemistry and carbon and sulfur isotope studies. Geol. J. 2020, 55, 5233–5250. [Google Scholar]
  46. Pitcairn, I.K.; Teagle, D.A.H.; Craw, D.; Olivo, G.K.; Kerrich, R.; Brewer, T.S. Sources of metals and fluids in orogenic gold deposits; Insights from the Otago and Alpine schists, New Zealand. Econ. Geol. 2006, 101, 1525–1546. [Google Scholar] [CrossRef]
  47. Large, R.R. Evidence for a Two-Stage Process in the Genesis of Sediment-Hosted Gold, Arsenic Deposits; Deb, M., Goldfarb, R., Eds.; Gold Metallogeny India and Beyond; Alpha Science International Ltd.: Oxford, UK, 2010; pp. 30–47. [Google Scholar]
  48. Cannell, A.; Blamey, N.; Brand, U.; Escapa, I.; Large, R.R. A revised sedimentary pyrite proxy for atmospheric oxygen in the Paleozoic: Evaluation for the Silurian-Devonian-Carboniferous period and the relationship of the results to the observed biosphere record. Earth-Sci. Rev. 2022, 231, 104062. [Google Scholar] [CrossRef]
  49. Frimmel, H.E. Episodic concentration of gold to ore grade through Earth’s history. Earth-Sci. Rev. 2018, 180, 148–158. [Google Scholar] [CrossRef]
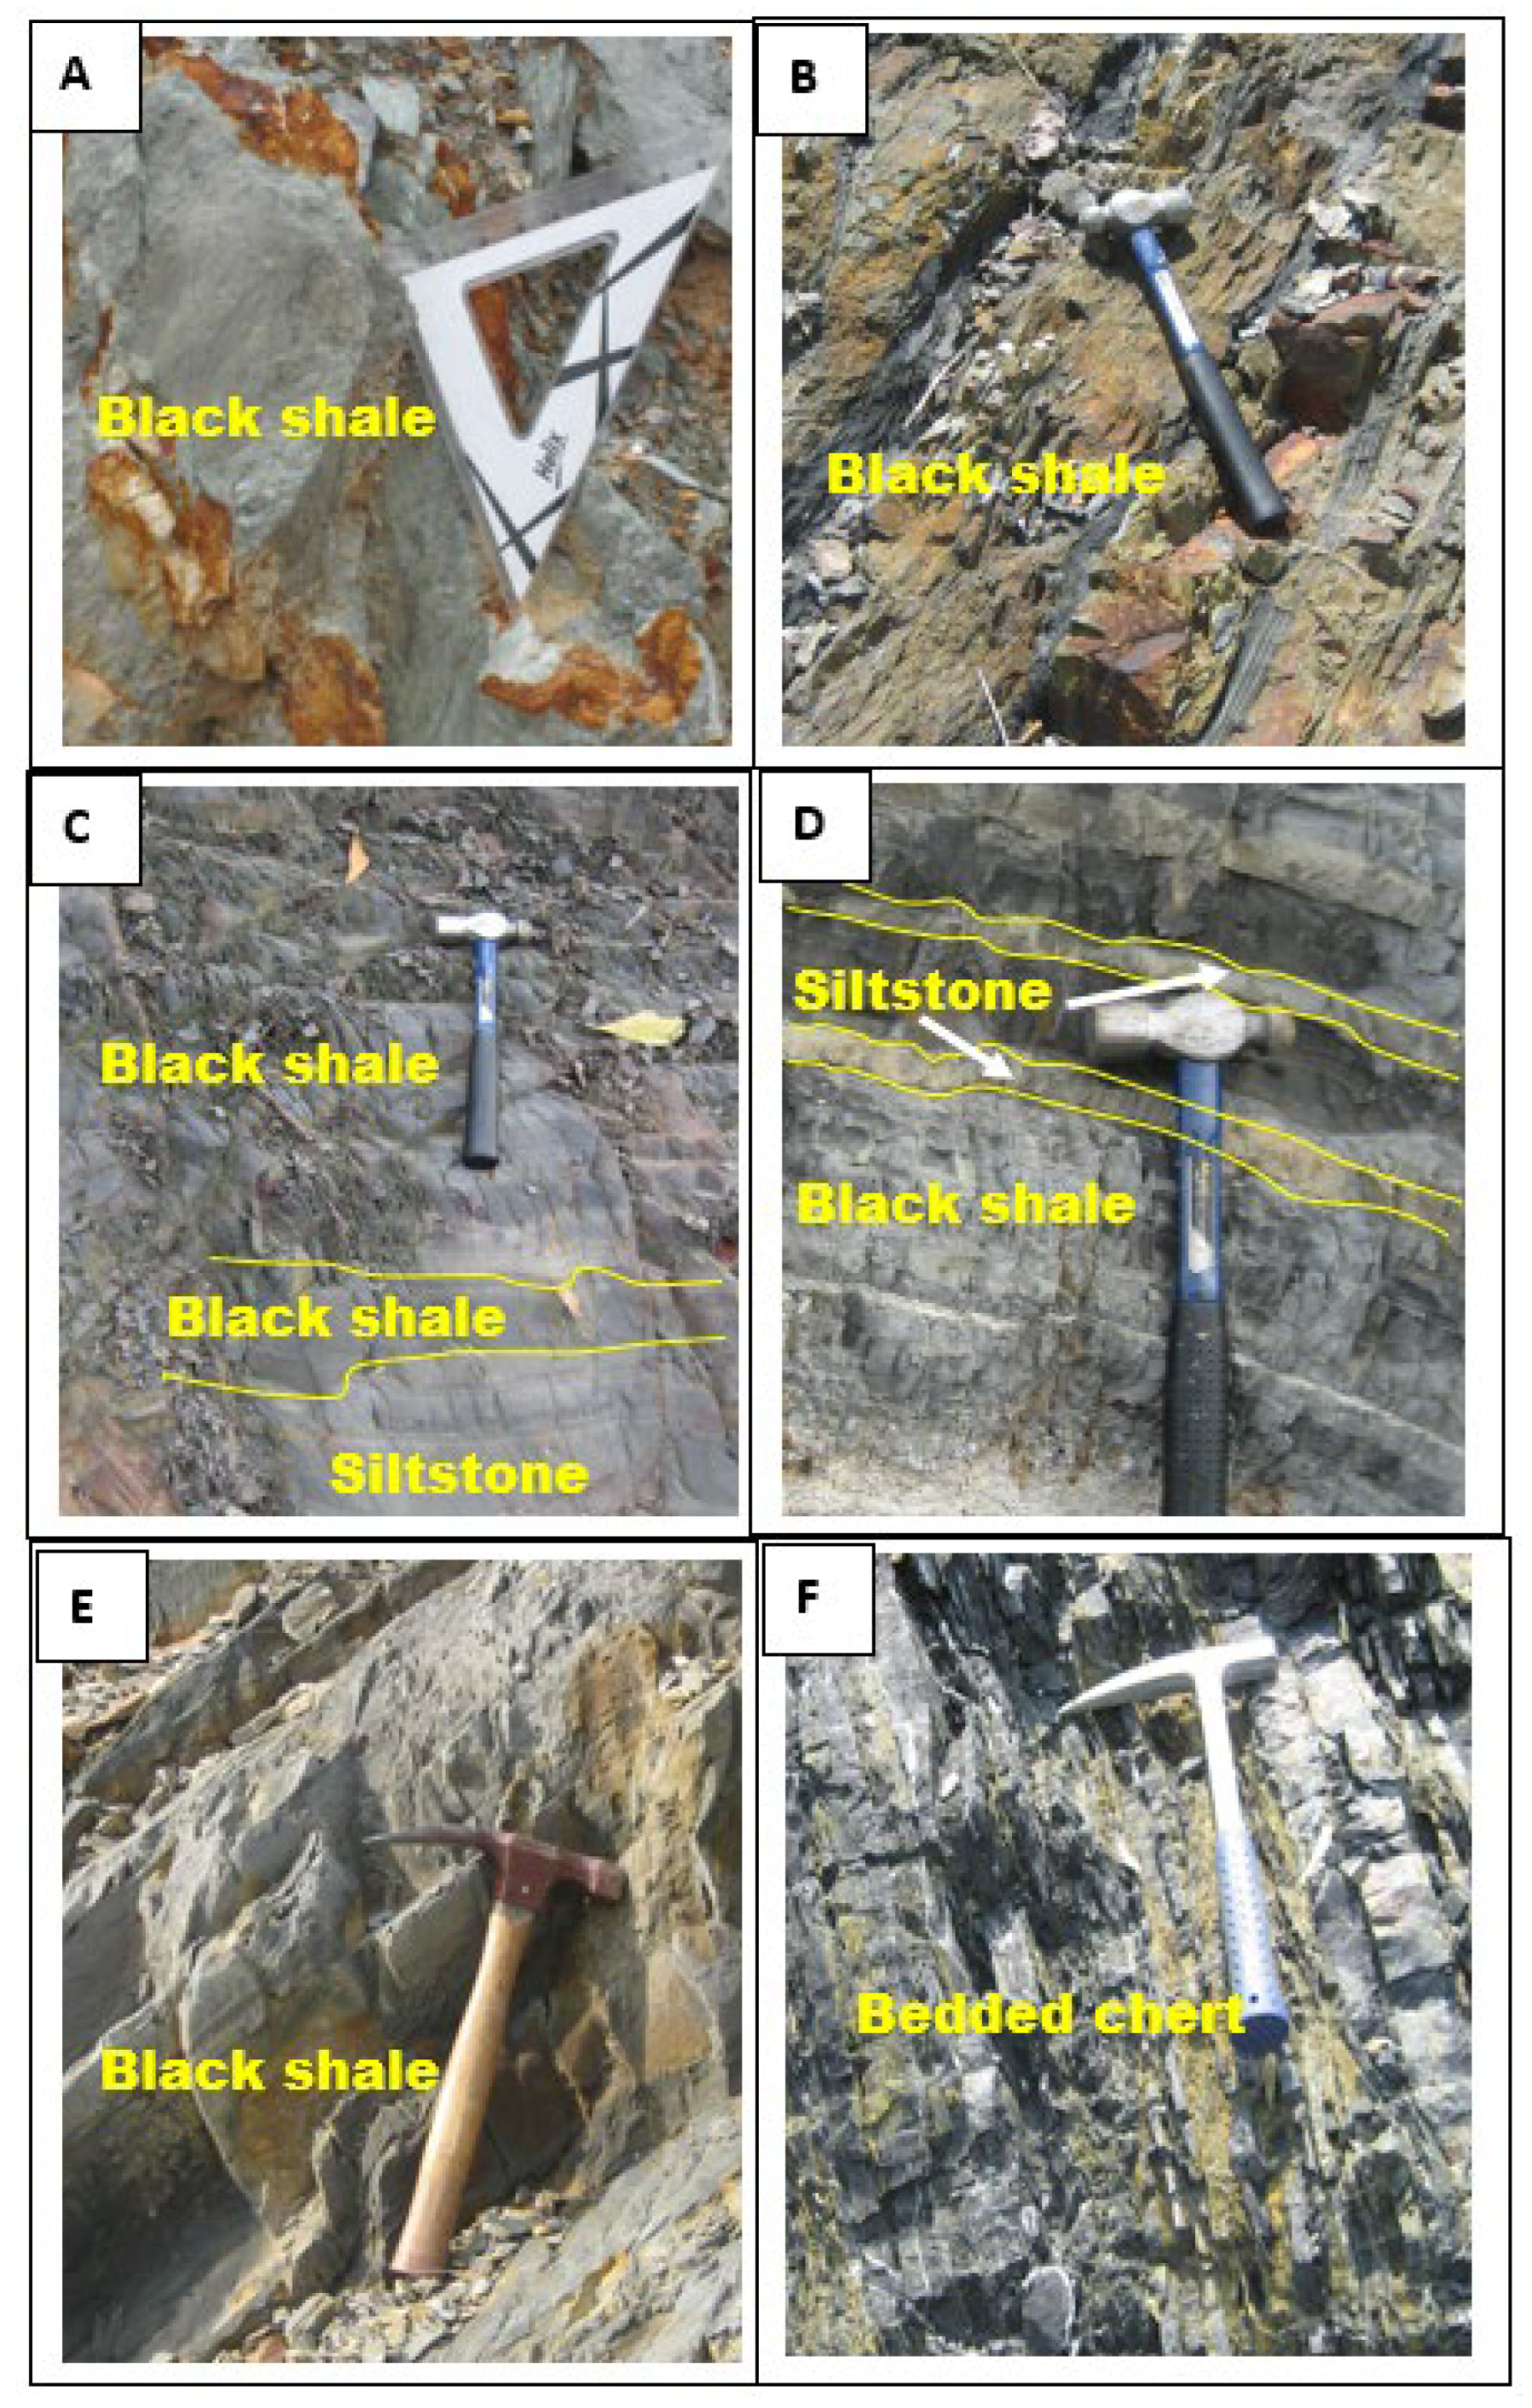
Figure 2. Outcrop images of black shale exposures for the six selected locations. (A) Black shales from the Selinsing gold mine. (B) Black shale and some laminations of siltstones in the BRSZ Unit 1. (C) Interbedded black shale and siltstones in the Karak Formation. (D) Interbedded black shale and siltstones in the Semantan Formation. (E) Bedded black shale in the Gua Musang Formation. (F) Bedded cherts in the BRSZ Unit 2.
Minerals 13 00829 g002
Figure 3. Pyrite textures from selected locations (Peninsular Malaysia). (A) Loosely and irregularly arranged pyrite framboids in the BRSZ Unit 2 cherts. (B) Spherical and cemented pyrite framboids in the BRSZ Unit 1 in black shale. (C) Pyrite framboids in the Karak Formation in black shale. (D) Micro crystals of hydrothermal pyrite in the Semantan Formation in black shale. (E) Pyrite framboid in the Gua Musang Formation in black shale. (F) Pyrite framboids in the Selinsing gold mine in black shale.
Minerals 13 00829 g003
Figure 4. Backscattered electron (BSE) images of pyrite morphology. (A) Cluster of pyrite framboids from the BRSZ Unit 2 black shales showing randomly arranged framboids forming a spherical form (sample BE-5413). (B) Spherical cluster of cemented pyrite framboids from the BRSZ Unit 2 black shales with a dark round zone, which represents the LA ICP-MS beam spot (sample BE BE-5413). (C) Cluster of polygonal pyrite framboids from the BRSZ Unit 2. (D) Close-up view of polygonal pyrite framboids from the BRSZ Unit 2. (E) A mix of nano- and micron-size pyrite crystals forming a half spherical shape from the BRSZ Unit 2. (F) Regularly arranged, euhedral pyrite showing multiple cluster shapes with spaces between them filled with matrix from the BRSZ Unit 2. (G) Multiple clusters of nano-size crystals of pyrite framboids showing clusters that are connected to the BRSZ Unit 1 black shales (sample BE-2712). (H) Irregular aggregates of pyrite framboids with some grown particles from the BRSZ Unit 1 black shales.
Minerals 13 00829 g004
Figure 5. Backscattered electron (BSE) images of various shapes of pyrite. (A) Individual pyrite framboids from the Karak Formation (sample ME-8513). (B) Densely cemented pyrite framboid from the Karak Formation. (C) Euhedral to subhedral nano- and micron-size of pyrite crystals from the Semantan black shales (sample ME-10113). (D) Isolated micron-size euhedral pyrite crystals from the Semantan Formation (sample ME 10113). (E) Irregularly arranged pyrite micron-size crystals from the Gua Musang black shales (sample PJ-1812B). (F) Regularly arranged micron-size pyrite crystals from the Gua Musang black shales (sample PJ 10113). (G) Pyrite clusters composed of polygonal framboids from the Selinsing gold mine (sample SEL-R076A). (H) Randomly arranged euhedral micron-size crystals of pyrite (sample SEL-R076A).
Minerals 13 00829 g005
Figure 6. LA ICP-MS trace element composition of sedimentary and hydrothermal pyrite from Permo-Triassic (Gua Musang, Semantan, Karak, Selinsing) and Devonian (BRSZ Units 1 and 2) formations.
Minerals 13 00829 g006
Figure 7. Histograms of gold content in sedimentary pyrite from the selected units and formations, Central Gold Belt, Peninsular Malaysia. (A) Gua Musang Formation. (B) Semantan Formation. (C) Karak Formation. (D) Selinsing gold deposit. (E) BRSZ Unit 1 with a bimodal distribution of Au concentration. (F) BRSZ Unit 2.
Minerals 13 00829 g007
Figure 8. Chemostratigraphy of Se and Au in sedimentary and hydrothermal pyrite from black shale and chert in Central gold belt, Peninsular Malaysia. (A) Selenium chemostratigraphy showing both LA ICP-MS and EPMA trends. (B) Gold chemostratigraphy using LA ICP-MS data. X axis is in logarithmic scale. Square dot line represents the average line. Variation of Se contents through time for both LA ICP-MS and EPMA data show consistent patterns of two peaks and one trough (Figure 8A). Variation of Au contents through time shows a similar trend (Figure 8B).
Minerals 13 00829 g008
Figure 9. Point density binary plots of (A) Au versus As and (B) Co versus Se of sedimentary and hydrothermal pyrite. Highly prospective field comprises points of high Se and Co contents.
Minerals 13 00829 g009
Figure 10. Point density binary plots of (A) Co versus Au and (B) Se versus Au of sedimentary and hydrothermal pyrite. The dotted line at about 20ppm Se separates two fields: the highly prospective field has high levels of selenium in sedimentary pyrite, whereas less prospective field corresponds to low levels of selenium in sedimentary and hydrothermal pyrite. Pyrite samples from the Selinsing, Semantan, and BRSZ Unit 2 fall in contrasting fields separated by the 0.25 ppm Au. This suggests that the population below 0.25 ppm Au is less prospective, whereas the population comprising the BRSZ Unit 1 and Gua Musang pyrites points to a highly prospective field.
Minerals 13 00829 g010
Disclaimer/Publisher’s Note: The statements, opinions and data contained in all publications are solely those of the individual author(s) and contributor(s) and not of MDPI and/or the editor(s). MDPI and/or the editor(s) disclaim responsibility for any injury to people or property resulting from any ideas, methods, instructions or products referred to in the content.