Abstract
Nowadays, research on promoting the dissolution of chalcopyrite is important. As a natural symbiotic mineral of chalcopyrite, arsenopyrite will have an impact on the dissolution of chalcopyrite. This paper shows the influence of arsenopyrite on the dissolution of chalcopyrite in an acidic culture medium. The leaching results showed that adding arsenopyrite increased the leaching concentration of copper by 332 mg/L. The residues showed a decrease in sulfur through X-ray diffraction analysis (XRD) and an increase in dissolution degree through scanning electron microscope (SEM). Electrochemical experiments have shown that the rest potential of arsenopyrite is higher than that of chalcopyrite, so there is a galvanic interaction, and the impact on chalcopyrite is greater than that of arsenopyrite. The polarization curve also proves this. Under the interaction of galvanic couples, the reduction of S0 production and the enhancement of Cu2+ release can promote the dissolution of chalcopyrite. In addition, X-ray photoelectron spectrometer (XPS) analysis under the action of galvanic coupling indicates that more SO42− is generated on the surface of chalcopyrite, replacing Sn2−/S0, and SEM shows a stronger corrosion morphology. All results confirm that the electrochemical effect between arsenopyrite and chalcopyrite promotes the dissolution of chalcopyrite in the acidic culture medium.
1. Introduction
Copper resources are one of the fundamental resources in the development process of human society, and the most abundant primary copper ore in the world is chalcopyrite (CuFeS2), which accounts for about 70% of known copper reserves [,,,,]. The traditional method of extracting copper from copper ore is through pyrometallurgical smelting, but this pyrometallurgical process not only requires high energy and cost, but also leads to environmental pollution problems [,,,]. With increasingly strict requirements for environmental protection, biological leaching technology has attracted widespread attention. Due to its advantages of low cost and environmental friendliness, it is considered a promising alternative method [,,]. However, a key factor currently hindering its large-scale application is its slow dissolution kinetics [,,].
The main reason for the slow dissolution rate of chalcopyrite is the formation of a passivation layer on the mineral surface. The current research on passivation mechanisms is still controversial, but most of it focuses on polysulfides, metal-deficient sulfides, jarosite, elemental sulfur, and iron-oxyhydroxide as the main candidates [,,,,,]. At present, there have been many reports on promoting the leaching of chalcopyrite. Some studies use thermophilic microorganisms or mixed strains [,,], or add metal ions for catalysis, such as Ag+ [,,,], Fe2+ [,], Cd2+ [], etc., or add another ore to form a galvanic cell [,,,].
In order to explore methods to improve the dissolution kinetics of chalcopyrite, some researchers have chosen to study the addition of minerals that have a galvanic interaction with chalcopyrite. These minerals usually have an associated/symbiotic relationship with chalcopyrite, such as pyrite [,,], bornite [,], magnetite [], etc. When two minerals exist simultaneously, owing to the difference in potential, a galvanic effect occurs, and the mineral with lower potential becomes the anode part, enhancing its oxidation ability and improving the kinetics of leaching [,,]. In nature, pyrite is usually associated with chalcopyrite and exists in natural sulfide copper ores or flotation copper concentrates [,]. Therefore, one of the most studied galvanic interactions with chalcopyrite is the pyrite−chalcopyrite interaction. Research has shown that pyrite promotes the dissolution of chalcopyrite, as the rest potential (open circuit potential, OCP) of pyrite is usually higher than that of chalcopyrite, and chalcopyrite acts as the anode [,,]. Although there have been many studies on mineral additives that can promote the dissolution of chalcopyrite, there are still many types of minerals related to chalcopyrite that have not been studied.
Arsenopyrite (FeAsS) is a monoclinic crystal with a spatial group of P21/c that evolved from marcasite (orthorhombic FeS2) and is a diamagnetic semiconductor [,,]. Arsenopyrite usually has a symbiotic relationship with chalcopyrite []. Studies have shown that its rest potential is generally 550 mV (vs. SHE) [], which is higher than the rest potential of chalcopyrite (400-500 mV vs. SHE) [,,]. Therefore, when it comes into contact with chalcopyrite minerals, it can form a galvanic cell, theoretically promoting the dissolution of chalcopyrite. However, according to previous reports, because of the toxicity of As, typical studies use physicochemical processes to directly reduce the arsenic content in copper ore, forming high-quality copper concentrates [,,]. Therefore, there is currently a lack of research on the behavior of arsenopyrite in the leaching system of chalcopyrite, as well as a lack of exploration on whether arsenopyrite can promote the dissolution of chalcopyrite. It should be considered that these two types of ores naturally coexist, and the lack of research on their interaction is inconvenient for the utilization of chalcopyrite resources.
In order to propose a new mineral additive to promote the dissolution of chalcopyrite, it is necessary to explore the interaction of chalcopyrite and arsenopyrite in acidic culture media. This study focused on chalcopyrite and arsenopyrite, and systematically investigated the effect of arsenopyrite on the dissolution of chalcopyrite in an acidic culture medium through leaching experiments, X-ray diffraction analysis (XRD), scanning electron microscopy (SEM), electrochemical experiments, and X-ray photoelectron spectroscopy (XPS). The purpose of this study is to demonstrate that the presence of arsenopyrite can enhance chalcopyrite dissolution in acidic culture media, and to confirm the galvanic interaction between arsenopyrite and chalcopyrite.
2. Experimental
2.1. Minerals
The chalcopyrite and arsenopyrite samples used in this study were obtained from Qibaoshan in Liuyang, Hunan, China. Before utilizing the obtained minerals, photographs were taken to observe the basic surface characteristics of the minerals used. Samples were prepared by crushing, manual sorting to remove gangue minerals, grinding, and sieving to 0.037–0.074 mm. The two types of mineral samples were subjected to X-ray fluorescence (XRF) (Axios mAX, PANalytical, Almoro, the Netherlands) spectrometric analysis and X-ray diffraction (XRD) (RIGAKU, Smartlab SE, Tokyo, Japan) analysis, respectively. The samples were stored in air-tight plastic bags to minimize oxidation.
2.2. Leaching Experiments
The sterile leaching experiment was performed in a 250 mL flask using 100 mL of iron-free 9K culture medium, which is a commonly used acidic culture medium for studying minerals leaching/bioleaching [,]. The formula of iron-free 9K culture medium is 3 g/L (NH4)2SO4, 0.5 g/L K2HPO4, 0.5 g/L MgSO4·7H2O, 0.01 g/L Ca(NO3)2, and 0.1 g/L KCl. The initial pH was adjusted to 2.0 with 20% sulfuric acid. To investigate the influence of arsenopyrite on the dissolution of chalcopyrite, a controlled experiment with and without arsenopyrite was designed, with 4 g of chalcopyrite or 4 g of chalcopyrite and 2 g of arsenopyrite added to each flask. The speed and temperature of the incubator were set to 170 r/min and 30 °C, respectively. Each experiment was repeated three times. A volume of 1 mL of leaching solution was taken daily as a sample to analyze the concentration of copper and iron. A volume of 1 mL of iron-free medium was used to compensate for sampling losses, and distilled water with pH = 2.0 was promptly used to compensate for evaporation losses. Redox potential was monitored periodically through a pH meter (PHSJ-4A, Shanghai, China) with a Pt electrode with reference to a Ag/AgCl electrode (3.0 M KCl) (BPP-922). The concentrations of the copper ions, total iron, and ferrous ions in the leaching solution were measured by a SPECTRO BLUE inductively coupled plasma atomic emission spectroscope (ICP-AES) (SPECTRO BLUE, Kleve, Germany). All other chemical reagents were of analytical grade in the tests.
The leached residues were detected using XRD and SEM techniques. Before testing, the residues were filtered, separated, and vacuum dried. The instrument model for XRD was the same as that for detecting mineral raw materials. The SEM instrument model used was TESCAN Bmo, s.r.o. (TESCAN MIRA, Brno, Czech Republic).
2.3. Electrochemical Studies
2.3.1. Working Electrodes Preparation
The working electrodes used in this work were Carbon Paste Electroactive Electrodes (CPEE). A total of 0.8 g of minerals and 0.1 g of graphite were mixed with 0.1 g of paraffin, and the mixture was heated in a 50 mL beaker using an alcohol lamp. The paste was then compacted in a cylindrical chromium steel mold with a diameter of 15 mm under a pressure of 35 MPa for 10 min. The compressed cylinder was loaded into a PTFE sample holder, exposing an area of 1 cm2 to the electrolyte. The chalcopyrite–arsenopyrite pair was prepared by uniformly mixing equal amounts of chalcopyrite and arsenopyrite. Before each electrochemical test, the working electrode needed to be polished with 500 grit, 1000 grit, and 2000 grit sandpaper sequentially, and rinsed several times with distilled water and ethanol to form a fresh working surface.
2.3.2. Electrochemical Measurements
This study applied a conventional three electrode electrochemical system, and all electrochemical experiments were carried out on the CHI760e electrochemical station (CH Instruments Ins., Shanghai, China) equipped with a computer. The electrolytic cell was a glass reactor with an effective volume of 200 mL. The auxiliary electrode was a graphite electrode, while the reference electrode used a saturated Ag/AgCl electrode (199.9 mV vs. SHE, 25 °C). The pH = 2.0 iron-free 9K medium was used as the electrolyte solution.
The rest potential (open circuit potential, OCP) of the newly prepared working electrodes were measured in open circuit mode for 20 min. The Tafel polarization curves were measured within the potential range of −200 mV to 1000 mV, with a scanning rate of 2 mV/s. The Tafel slope, corrosion current density, and polarization resistance were calculated using CHI760e 18.04 software (CH Instruments Ins., Austin, TX, USA) within the corrosion potential range of 50–100 mV. The cyclic voltammetry (CV) measurements were scanned from OCP in the negative direction to −800 mV, then reversed in the positive direction to 800 mV, then returned to OCP in the reverse direction, forming a complete cycle. Each cyclic voltammetry experiment was repeated three times with a scanning rate of 50 mV/s. All potentials reported in this study were relative to the saturated Ag/AgCl reference electrode (vs. Ag/AgCl), and they were conducted under constant conditions without deoxygenation, repeated three times.
2.4. Analytical Methods
Exploring the mineral electrode after electrochemical measurement helps see how chalcopyrite–arsenopyrite galvanic coupling affects chalcopyrite. After 30 cycles of cyclic voltammetry scanning, chalcopyrite electrodes generally achieved a certain degree of corrosion effect. Corrosion of chalcopyrite electrodes without arsenopyrite was called self-corrosion, while corrosion with arsenopyrite was called galvanic coupling corrosion. The reason for requiring 30 cyclic voltammetry scans was to amplify the differences in surface properties of chalcopyrite after self-corrosion and galvanic coupling corrosion [].
X-ray photoelectron spectroscopy (XPS) test was carried out with the model Thermo Scientific K-Alpha (Thermo Scientific, Waltham, Massachusetts, USA). Using an Al Kα X-ray (1486.6 eV) source, comprehensive spectra were recorded at the constant pass energy of 100 eV and 1 eV/step, while spectra of Cu 2p, Fe 2p, and S 2p were recorded at the constant pass energy of 50 eV and 0.1 eV/step. The data were processed using Avantage 5.9931 (Thermo Scientific, Waltham, MA, USA) software. After aligning the C 1s peak with 284.8 eV, all spectra were fitted and calculated based on existing research results. The differences in surface morphology were studied using SEM under two different conditions, and the SEM instrument model used was the same as the previous one.
3. Results
3.1. Minerals Analysis
Figure 1a,b shows the basic surface morphology of the obtained chalcopyrite and arsenopyrite before their utilization. The surface of the obtained chalcopyrite had a metallic luster and a yellow color similar to gold, which is consistent with its nickname of Fool’s Gold. Arsenopyrite was white gray with gray black streaks and overall presented a metallic luster. Chemical analysis (XRF) showed that the chalcopyrite sample contained 36.92% Cu, 30.16% Fe, and 30.79% S (wt.%), while the arsenopyrite sample contained 39.02% As, 31.44% Fe, and 15.57% S (wt.%). The XRD of chalcopyrite and arsenopyrite sample is shown in Figure 1c,d. Quantitative XRD analysis indicated that the purity of chalcopyrite was higher than 95%, and the purity of arsenopyrite was higher than 85%. The secondary phases observed in the arsenopyrite sample, namely ZnS and amphibolite, have a minor composition of less than 4%. However, previous research has not revealed any significant effect of these substances on the dissolution of chalcopyrite. Therefore, the influence of impurities in the arsenopyrite sample can be disregarded, allowing us to consider the arsenopyrite with its predominant content of up to 85% as the main active phase.
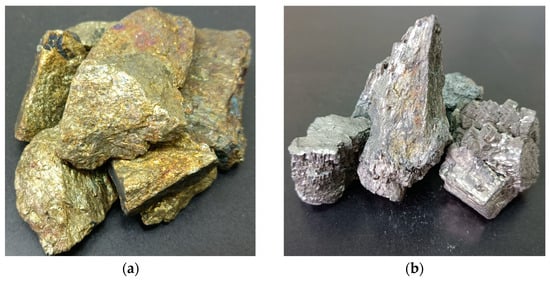
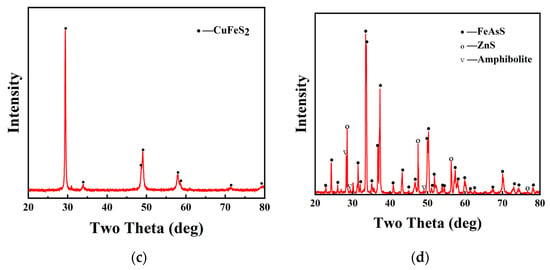
Figure 1.
Photograph of the obtained chalcopyrite (a) and arsenopyrite (b); XRD of chalcopyrite (c) and arsenopyrite (d) samples.
3.2. Leaching Results
To study how chalcopyrite dissolves differently when arsenopyrite is also present, an experiment was set up to compare the dissolving (leaching) of chalcopyrite alone to when it is mixed with arsenopyrite. The copper concentration in the solution during the leaching process is shown in Figure 2a. After 29 days of leaching, approximately 937 mg/L of copper was extracted from pure chalcopyrite. However, in the presence of arsenopyrite, a copper concentration of nearly 1269 mg/L was obtained, which was 332 mg/L higher than that of pure chalcopyrite leaching. Figure 2b,c show the changes in the solution redox potential and iron (Fe2+ and Fe3+) concentration during the leaching process of chalcopyrite under two different conditions. From Figure 2b, it can be seen that in both the presence and absence of arsenopyrite, the solution redox potential during the leaching process of chalcopyrite remained within a certain range. The solution redox potential for pure chalcopyrite leaching ranged from 320 mV to 340 mV, while the addition of arsenopyrite increased the leaching redox potential of the solution, ranging from 340 mV to 360 mV. For the iron concentration during the leaching process (Figure 2c), the Fe2+ concentrations (c(Fe2+)) were relatively low, within the range of 0–200 mg/L, while the Fe3+ concentrations (c(Fe3+)) increased with time. The maximum c(Fe3+) that could be achieved without and with the addition of arsenopyrite was 714 mg/L and 960 mg/L, respectively. From the trend of iron concentration changes, the system with the addition of arsenopyrite had a higher Fe2+ content in the early stages and decreased with time. The rate of increase in Fe3+ in the early stage was faster, and the overall concentration was higher.
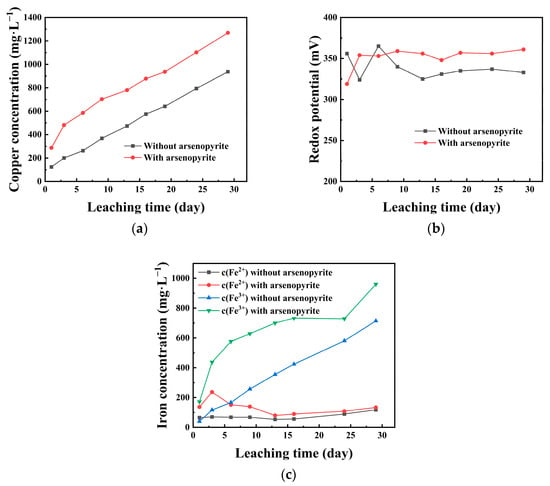
Figure 2.
Influence of arsenopyrite on copper concentration (a), redox potential (b), and iron concentration (c) during chalcopyrite leaching in acidic culture medium (pH = 2).
3.3. Leached Residues Analysis
To better observe leaching changes, we analyzed chalcopyrite residues using XRD and SEM under two conditions. Figure 3a shows the XRD results of the leached residues of chalcopyrite with and without arsenopyrite after 29 days of leaching. In Figure 3a, the residue after leaching chalcopyrite alone showed chalcopyrite and sulfur as main phases, with sulfur peaks more noticeable. On the other hand, co-leaching with arsenopyrite resulted in a residue detecting chalcopyrite, arsenopyrite, and sulfur, but with weakened sulfur peaks.
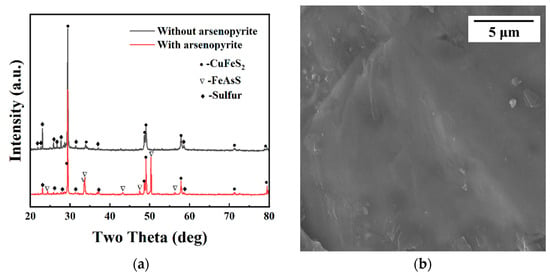
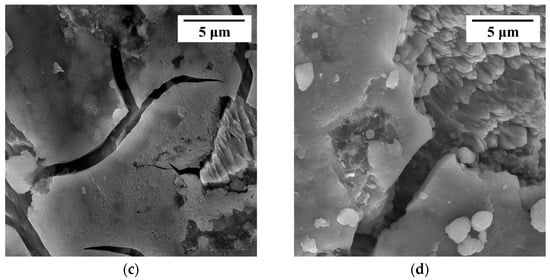
Figure 3.
(a) XRD of leached residues from chalcopyrite with and without arsenopyrite; (b) SEM of un leached chalcopyrite; (c) SEM of leached chalcopyrite; (d) SEM of co-leached chalcopyrite with arsenopyrite.
SEM characterization allows for a more direct observation of the morphology of leaching residues. The surface morphology of different systems at different stages is shown in Figure 3b–d at a scale of 5 μm. Figure 3b shows the morphology of chalcopyrite that had not been leached, and it can be seen that it had a flat surface without any parts in the form of grooves. The surface of pure chalcopyrite after leaching in an acidic culture medium (pH = 2) for 29 days is shown in Figure 3c. The morphology shown in Figure 3c had the characteristics of surface cracking and uneven surface pits, which could be clearly distinguished as the morphology after undergoing the corrosion process. For the residual surface after co-leaching of arsenopyrite and chalcopyrite shown in Figure 3d, the same corrosion surface as Figure 3c can also be observed, with a higher corrosion degree, greater surface undulation, and deep depressions.
3.4. Galvanic Potential and Tafel Polarization Plots
The rest potentials of different mineral electrodes were tested, and Figure 4a shows the rest potentials of three electrodes, namely chalcopyrite, arsenopyrite, and chalcopyrite–arsenopyrite galvanic couple, with a 20 min immersion time in an iron-free 9K medium (pH = 2). The rest potentials of chalcopyrite and arsenopyrite were 226 and 331 mV, respectively, with a difference of 105 mV between them. The galvanic potential between chalcopyrite and arsenopyrite was stable at 325 mV, located between the rest potential of chalcopyrite and arsenopyrite. It could also be noticed from the graph that the rest potential of the galvanic couple was only 6 mV lower than the rest potential of the arsenopyrite.
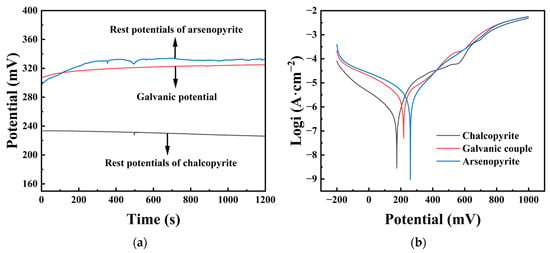
Figure 4.
(a) Rest potentials of chalcopyrite and arsenopyrite and the galvanic potential of the chalcopyrite–arsenopyrite couple. (b) Tafel polarization curves of chalcopyrite, arsenopyrite, and chalcopyrite–arsenopyrite galvanic couple.
Figure 4b displays Tafel polarization curves for chalcopyrite, arsenopyrite, and the chalcopyrite–arsenopyrite galvanic couple in an acidic culture medium (pH = 2). Table 1 contains the analyzed data. The corrosion potential (φcorr) for arsenopyrite was 260 mV, higher than chalcopyrite at 175 mV. The galvanic couple had a φcorr of 218 mV, positioned between chalcopyrite and arsenopyrite. For the galvanic couple, a higher Jcorr (5.39 μA/cm2) was obtained compared to the Jcorr (0.46 μA/cm2) of chalcopyrite, and the polarization resistance (Rp) was the opposite, with the galvanic couple (10.26 kΩ) smaller than chalcopyrite (43.06 kΩ). The cathodic curves of chalcopyrite and chalcopyrite–arsenopyrite galvanic couple were in the range of −200 mV to ~200 mV. The trends of the two curves were similar, but the cathodic current density of this couple was much higher than that of chalcopyrite. For the anode curve of the galvanic couple, within the range of ~200 mV to 1000 mV, the trend of the curve was similar to that of chalcopyrite, with changes around ~600 mV. However, in terms of current density, it was similar to that of arsenopyrite, with a high degree of overlap.

Table 1.
Electrochemical kinetics parameters calculated from polarization curves.
3.5. Cyclic Voltammograms
In order to further investigate the effect of the galvanic interaction with arsenopyrite on the surface properties of chalcopyrite, the cyclic voltammograms of the pure chalcopyrite electrode and chalcopyrite arsenopyrite galvanic electrode were measured, and the results are shown in Figure 5.
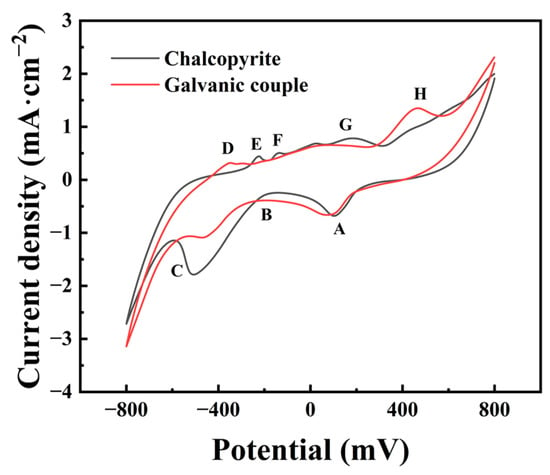
Figure 5.
Cyclic voltammograms of chalcopyrite and galvanic coupling with arsenopyrite. (The peaks were related to the main reactions as followed: A, the reduction of some species; B, the reduction of S0 and the transformation of CuFeS2 to Cu2S; C, the generation of Cu2S and Cu0; D, the oxidation of metal copper to chalcocite; E and F, the generation of S0; G, the oxidation of chalcocite; H, the Cu2+ release).
We can analyze the reactions for each peak in the cyclic voltammogram of chalcopyrite alongside existing research conclusions. For peak A located within 0–200 mV, the main reaction was related to the reduction of some species produced like Cu2+ in different states and Fe3+, which could be described by reaction Equations (1)–(8) [,,,]. There was a peak B mainly attributed to the reactions in Equations (9) and (10) [,,], which were related to the reduction of S0 and the transformation of CuFeS2 to Cu2S. However, in Figure 5, there was no obvious peak pattern around −200 mV, which might be due to the weak reaction not being shown. The corresponding potential of peak C was below −400 mV. Based on existing research, it mainly represents the generation of Cu2S and Cu0, and the related reactions are shown in Equations (11)–(14) [,,,,].
Cu2+ + S0 + 2e− → CuS
Cu2+ + CuS + 2e− → Cu2S
Cu2+ + 2e− → Cu0
CuFeS2 + 3Cu2+ + 4e− → Cu5FeS4 + Fe2+
CuFeS2 + 3Cu2+ + 4e− → 2Cu2S + Fe2+
9CuFeS2 + 4H+ + 2e− → Cu9Fe8S16 + 2H2S + Fe2+
5CuFeS2 + 12H+ + 4e− → Cu5FeS4 + 6H2S + 4Fe2+
Fe3+ + e− → Fe2+
2CuFeS2 + 6H+ + 2e− → Cu2S + 2Fe2+ + 3H2S
S0 + 2H+ + 2e− → H2S
2CuS + 2H+ + 2e− → Cu2S + H2S
2CuFeS2 + 6H+ + 2e− → Cu2S + 2Fe2+ + 3H2S
Cu2S + H2O + 2e− → 2Cu0 + HS− + OH−
2CuFeS2 + 4H+ + 2e− → Cu0 + 2H2S + Fe2+
For the cyclic voltammetry curve of the chalcopyrite electrode, the three main peaks A, B, and C generated constitute the cathodic scanning process, and in the anode scan from −800 mV to 800 mV, five anode peaks can usually be detected. The peak D between −500 mV and −400 mV represented the oxidation reaction of metal copper to chalcocite (Cu2S) according to Equation (15) [,,]. Peaks E and F were continuous anode peaks with potential positions around −200 mV. The possible reactions can be summarized in Equations (16) and (17) [,,], which were mainly related to the generation of S0. Peak G was commonly believed to be formed by varying degrees of oxidation of chalcocite (Cu2S), forming a series of sulfides, including djurleite (Cu1.92S), digenite (Cu1.60S), and covellite (CuS), as shown in Equations (18)–(21) [,,]. Peak H was in the potential range of about 300 mV to 800 mV, where the main oxidation reaction of Cu2+ release occurred. The oxidation reaction of peak H can be shown in Equations (22)–(25) [,,,,].
2Cu0 + H2S → Cu2S + 2H+ + 2e−
H2S → S0 + 2H+ + 2e−
CuFeS2 → CuS + S0 + Fe2+ + 2e−
Cu2S → CuxS + (2−x)Cu2+ + (4−2x)e−
Cu2S → Cu1.92S + 0.08Cu2+ + 0.16e−
Cu1.92S → Cu1.6S + 0.32Cu2+ + 0.64e−
Cu1.6S → CuS + 0.6Cu2+ + 1.2e−
CuFeS2 → Cu1−xFe1-yS2−z + xCu2+ + yFe2+ + zS0 + + 2(x + y)e−
CuS → Cu2+ +S0 + 2e−
2CuFeS2 + 5H2O → 2CuO + Fe2O3 + 4S0 + 10H+ + 10e−
CuFeS2 → 0.75CuS + 1.25S0 + 0.25Cu2+ + Fe2+ + 2.5e−
Comparing cyclic voltammograms of chalcopyrite with and without arsenopyrite showed noticeable changes, mainly in peaks B and C, during the cathodic scanning of the galvanic couple electrode. The current density of peak B increased while peak C decreased, indicating an enhanced reduction of S0 and a decrease in the generation of Cu2S products, as well as a weakened reduction of CuFeS2/Cu2S to Cu0. Observing the anodic scanning process, it can be observed that peaks D and H were enhanced, while peaks E, F, and G were weakened. The decrease in peaks E and F suggests reduced S0 generation. Meanwhile, the increase in peak D and the weakening of peak G indicate that Cu2S became the primary oxidation product. The higher current density of peak H indicated that the oxidation reaction releasing Cu2+ was more likely to occur.
3.6. XPS Characterization
Figure 6 shows the comprehensive XPS spectra of chalcopyrite electrodes after self-corrosion and galvanic coupling corrosion. Table 2 shows the relative contents of copper, iron, and sulfur on the surface of two types of chalcopyrite obtained from the spectrum, without considering carbon and oxygen. According to Table 2, the Fe 2p spectra of the chalcopyrite−arsenopyrite galvanic couple showed a low energy peak signal. The reason for this result may be due to the uneven distribution of elements on the surface of the chalcopyrite sample after galvanic coupling corrosion, which affects the determination of the Fe 2p. When analyzing the content of carbon, copper, iron, and sulfur elements on chalcopyrite after galvanic corrosion, the carbon content can reach up to 90.31%. Consequently, the C 1s may be one of the main factors affecting the peak strength of iron. Furthermore, the electrode has a certain thickness, which may also be a factor that affects the detection of iron content []. Since there were coordination sites on the surface of chalcopyrite after fragmentation and grinding, the surface atomic content was significantly different from the composition of bulk elements []. As shown in Table 2, the Cu/S ratio (0.34) in chalcopyrite after self-corrosion was lower than that in chalcopyrite after galvanic coupling corrosion (0.37), indicating a slightly higher surface copper content in chalcopyrite when coupled with arsenopyrite.
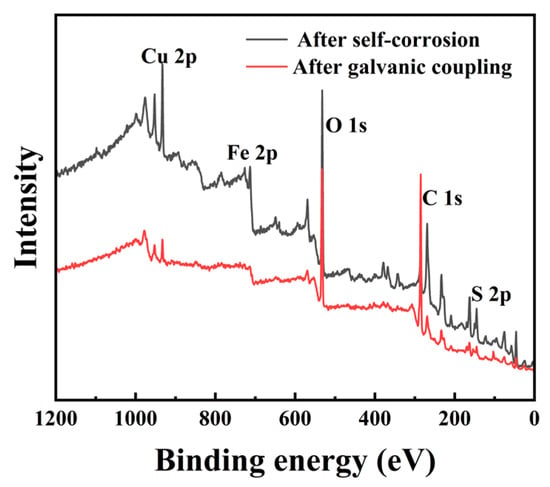
Figure 6.
Comprehensive XPS spectra of chalcopyrite electrodes after self-corrosion and galvanic coupling corrosion.

Table 2.
Relative content of elements on the surfaces of the two chalcopyrite samples.
Figure 7 displays the Cu 2p, Fe 2p, and S 2p spectra of chalcopyrite with and without galvanic coupling with arsenopyrite. The binding energies of Cu 2p3/2 on the chalcopyrite in both situations were 932.81 and 932.78 eV, respectively (Figure 7a). The Cu 2p3/2 peak near 932.4 eV indicates the presence of Cu (I) sulfide species on the surface of chalcopyrite [,,]. Figure 7b shows the presence of peaks in the Fe 2p spectra near 711 eV and below 708.0 eV. It was reported that the Fe 2p3/2 peak below 708.0 eV represents iron in the chalcopyrite lattice, while the Fe 2p3/2 peak near 711 eV indicates the presence of iron-oxyhydroxides on the chalcopyrite surface [].
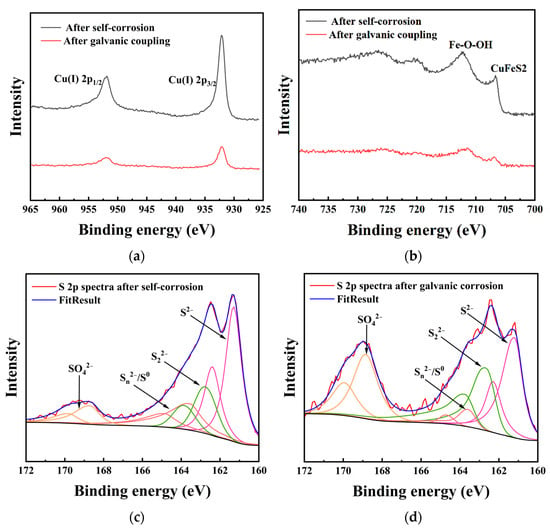
Figure 7.
XPS spectra of chalcopyrite electrodes after self-corrosion and galvanic corrosion: (a) Cu 2p; (b) Fe 2p; (c) S 2p after self-corrosion; (d) S 2p after galvanic corrosion.
The S 2p spectra was fitted, and the results after subtracting the background and removing spin orbit splitting are shown in Figure 7c,d. Table 3 lists the binding energy and relative content of each of S 2p. Based on previous reports, the binding energy positions of each sulfur species can be determined [,]. The peak of S2− is located near 161.3 eV, while the peak of S22− is approximately 162.7 eV. The energy region around 163.7 eV represents Sn2−/S0. The peak near 168.3 eV in the higher region corresponds to S from SO42−. For the surface of chalcopyrite after self-corrosion, S2− was the main species of sulfur, accounting for 47.04%. The contents of S22−, Sn2−/S0, and SO42− were 19.82%, 22.23%, and 10.91%, respectively. After galvanic coupling with arsenopyrite, the contents of S2− and Sn2−/S0 decreased to 33.35% and 5.84%, respectively, and the total content of SO42− increased to 37.60%. It is noticeable that the content of S22− after galvanic coupling (23.20%) was only 3.38% different from the content after self-corrosion (19.82%).

Table 3.
Contents of each chemical state of sulfur on chalcopyrite surfaces after self-corrosion and galvanic coupling with arsenopyrite.
3.7. Morphology Analysis
Figure 8 presents an intuitive SEM morphology of chalcopyrite after self-corrosion and galvanic coupling. It could be observed that the corrosion degree of the chalcopyrite electrode after self-corrosion at a scale of 100 μm was lighter than that after galvanic coupling, with only some areas exhibiting erosion shape, and the dissolution range mainly located in the surface layer. The integrity of some parts of the appearance can also be seen in Figure 8, which had a relatively flat characteristic. The surface after galvanic coupling exhibited a deep etch interface, with a high degree of mineral dissolution, and the dissolution range extended to the interior of the electrode, resulting in a form similar to holes with longitudinal depth.
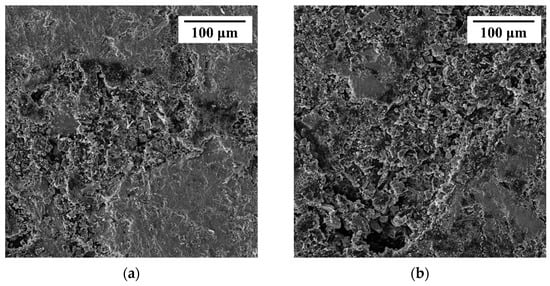
Figure 8.
The SEM of chalcopyrite surfaces after self-corrosion (a) and galvanic coupling with arsenopyrite (b).
4. Discussions
In this study, the influence of arsenopyrite on the dissolution of chalcopyrite in an acidic culture medium was comprehensively investigated from four aspects. Firstly, monitoring the leaching experiments of chalcopyrite without or with arsenopyrite. Secondly, XRD and SEM were used to detect the leached residues. Then, electrochemical measurements of chalcopyrite, arsenopyrite, and the chalcopyrite–arsenopyrite galvanic couple were taken. Finally, XPS and SEM analysis of the corroded electrode with and without the galvanic effect were conducted. It can be concluded that the galvanic effect of chalcopyrite and arsenopyrite promotes the dissolution of chalcopyrite in an acidic culture medium.
The leaching experiment showed the copper concentration in the co-leaching system of chalcopyrite and arsenopyrite is higher than that in the leaching of pure chalcopyrite (Figure 2a), indicating that arsenopyrite helps chalcopyrite dissolve in an acidic culture medium. The commonly used analysis factors affecting the leaching process of chalcopyrite include pH, Fe2+/Fe3+, and redox potential [,]. During the leaching process, due to the control of pH at 2.0, this study mainly explored two factors: Fe2+/Fe3+ and redox potential. During the dissolution of chalcopyrite without arsenopyrite, the potential jump in Figure 2b was observed, which is believed to be caused by the instability of the solution state in the early stages of the leaching process. The system gradually stabilized over time, and the initial fluctuations may be within an acceptable range. The redox potential of the solution was maintained in a lower range and almost unchanged over experimental time (Figure 2b). Existing studies have considered that the solution redox potential only increases with the enhancement of iron oxidation activity [,,]. It can also be understood that the redox potential in the leaching solution is related to c (Fe3+)/c (Fe2+) [,,]. Figure 2c shows that when arsenopyrite is added, there are more soluble ferrous ions in the initial solution compared to when only chalcopyrite is being leached. During the later stage of leaching, there was a slight increase in the concentration of Fe2+, while the increase in Fe3+ concentration can be attributed to the oxidation of Fe2+ to Fe3+ and the partial dissolution of arsenopyrite. In addition, the dissolved Fe2+/Fe3+ can also affect the redox potential. Research has shown that the leaching rate of chalcopyrite increases with the increase in redox potential, reaching its maximum value at the critical potential (about 450 mV vs. Ag/AgCl) [,]. The addition of arsenopyrite raises the redox potential of the leaching solution of chalcopyrite, while the increase in the leaching solution’s redox potential below the critical potential enhances the dissolution rate of chalcopyrite. Therefore, adding arsenopyrite can boost the reactivity of chalcopyrite and facilitate its dissolution.
Different forms of sulfur (polysulfides, metal-deficient sulfides, jarosite, and elemental sulfur) combine to form a passivation layer of chalcopyrite [,,,,]. The changes in the phase sulfur in the XRD (Figure 3a) of the leached residues to some extent indicate that the addition of arsenopyrite can reduce the production of elemental sulfur and weaken the hindrance of sulfur to the dissolution of chalcopyrite. The morphology of the leached residue is similar to that shown in previous studies []. The observation of residual morphology indicates that the addition of arsenopyrite exacerbates the surface corrosion morphology of chalcopyrite, supporting the evidence that co-leaching of arsenopyrite and chalcopyrite promotes the dissolution of chalcopyrite.
The leaching process of chalcopyrite involves complex reaction changes, and electrochemical characterization is a commonly used method for analyzing chalcopyrite leaching []. The rest potential results can reflect the charge rearrangement in the interface double layer of the electrode and the chemical reaction at the interface. The test results (Figure 4a) indicate that the reactivity of chalcopyrite in iron-free 9K medium is higher than that of arsenopyrite, because there was a difference in the other potentials. Therefore, they can form a galvanic cell when the chalcopyrite has a lower rest potential than the anode and the arsenopyrite has a with higher rest potential than the cathode. Since the galvanic potential represented a new equilibrium point between chalcopyrite and arsenopyrite, and the galvanic potential was more positive than the rest potential of chalcopyrite, the galvanic interaction can lead to anodic polarization of the chalcopyrite electrode, which helps accelerate the oxidation of chalcopyrite. The phenomenon that the galvanic potential was closer to the rest potential of arsenopyrite indicates that the galvanic interaction between arsenopyrite and chalcopyrite affects the rest potential of chalcopyrite more than it does arsenopyrite.
The Tafel polarization curve can analyze the kinetic information during the reaction process, in addition to the corrosion potential (φcorr), as well as corrosion current density (Jcorr), Tafel slope, and polarization resistance (Rp). On the basis of the data analysis in Table 1, the corrosion potential results of the Tafel curve are consistent with the testing conclusions of the rest potentials. The increase in corrosion current and the decrease in polarization resistance both indicate that the galvanic interaction with arsenopyrite helps to improve the dissolution of chalcopyrite. The results of the cathodic curves of chalcopyrite and galvanic couple represent similar reduction behaviors. Based on the linear relationship between reaction rate and current density, the galvanic coupling electrode promotes the cathodic reduction of chalcopyrite. The anodic oxidation process around ~600 mV of the galvanic couple represents possible reactions, as shown in Equations (26)–(28) [], which reflect the release of Cu2+:
Cu1−x−zS2 → (1 − x − z)Cu2+ + 2S0 + 2(1 − x − z)e−
CuFeS2 + 8H2O → Cu2+ + Fe3+ + 2SO42− + 16H+ + 17e−
CuFeS2 + 3H2O → Cu2+ + Fe2+ + S2O32− + 6H+ + 8e−
Both chalcopyrite and arsenopyrite were affected by the galvanic effect, and their impact on chalcopyrite was greater than that on arsenopyrite. This finding was confirmed by analyzing the rest potential. The comprehensive polarization curve data analysis and observation of the comparison curve shape show that the dissolution of chalcopyrite promoted by the galvanic couple is mainly related to the cathodic reduction enhancement in the presence of arsenopyrite.
Cyclic voltammetry can qualitatively and semi-quantitatively analyze the electrochemical reactions involved in the redox process. The results first demonstrate that during the dissolution process of chalcopyrite after the galvanic couple with arsenopyrite, resulting from the enhanced reduction of S0 and the reduced generation of S0, the surface aggregation coverage of S0 will be reduced, which reduces the obstruction of sulfur on the dissolution of chalcopyrite. This conclusion is consistent with the XRD conclusions mentioned earlier. Secondly, there is an enhanced release of Cu2+, which intuitively indicates the promotion of the dissolution of chalcopyrite, which is consistent with the research conclusion of this article. This confirms that the galvanic effect between chalcopyrite and arsenopyrite can change the surface of chalcopyrite, reduce the obstruction of the sulfur layer, and increase the chemical reactivity of the chalcopyrite surface.
After analyzing the electrochemical results, the surface element detection and morphology observation results were discussed. For the Cu 2p spectrum (Figure 7a), the binding energy of Cu 2p3/2 after self-corrosion of chalcopyrite is higher than that after electro coupling of chalcopyrite with arsenopyrite, indicating that leaching copper from chalcopyrite after self-corrosion is much more difficult. Comparing the Fe-O-OH/Fetotal ratios (Figure 7b), the ratio of chalcopyrite after self-corrosion (80.69%) was higher than the galvanic couple of chalcopyrite with arsenopyrite (68.12%). It has been reported that the formation of iron-oxyhydroxides inevitably leads to the formation of an indurative phase on the surface [], which can hinder the dissolution of chalcopyrite. Thus, higher iron-oxyhydroxides can also explain the weak dissolution of chalcopyrite after self-corrosion. The S 2p spectra (Figure 7c,d) indicate that the increase in SO42− is mainly because of the conversion of S2− and Sn2−/S0, and the galvanic effect of chalcopyrite enhances the oxidation reaction of S2− and Sn2−/S0. Compared with other sulfur species, S2− is the most reactive chemical state [], therefore its content in all sulfur species in this study accounted for more than 30%. Sulfur is a surface phase present in all corrosion samples, and its composition changes as the corrosion process progresses. SO42− mainly represents jarosite, which accumulates and forms a passivation layer to hinder dissolution [,,]. After self-corrosion, the passivation layer on the surface of chalcopyrite is mainly composed of S2− and Sn2−/S0. However, under the galvanic effect with arsenopyrite, the surface of chalcopyrite becomes a passivation layer containing S2− and SO42− as the main parts. This conclusion is supporting evidence for XRD and CV analysis of S0, and further reveals the transformation direction of S0. The observation results of electrode morphology are consistent with the above conclusions of this study, further confirming that the dissolution of chalcopyrite after galvanic coupling is better than that of the chalcopyrite after self-corrosion.
In the leaching process of chalcopyrite in acidic culture medium, in the absence of arsenopyrite, passivation layers such as polysulfides, metal-deficient sulfides, jarosite, elemental sulfur, and iron-oxyhydroxide are usually formed on the surface, hindering the release of dissolved ions. Nevertheless, when arsenopyrite comes into contact with chalcopyrite, chalcopyrite acts as the anode for this galvanic interaction, producing e− and promoting the release of Cu2+. Additionally, it may provide electrons for the reduction of Fe3+ and S0, thereby reducing the aggregation of passivating substances on the surface and weakening the hindering effect of the passivation layer. Consequently, copper and iron ions can migrate from the surface to the solution.
This study confirms that the presence of arsenopyrite in acidic culture media can promote the dissolution of chalcopyrite. Due to their natural symbiotic relationship [], this work enriches the study of the interaction between chalcopyrite and its natural symbiotic minerals, and proposes a new mineral additive for promoting chalcopyrite dissolution. However, this study had not conducted further research to determine the optimal conditions under which the presence of arsenopyrite can have the greatest effect on the dissolution of chalcopyrite. Therefore, it is currently inappropriate to compare our findings with other additives such as pyrite and bornite that have significant effects. In addition, since the requirements of actual industrial applications for arsenic content in copper resources [,,], this study lacks experiments to control the mass ratio of arsenopyrite to chalcopyrite, and there is also a lack of exploration for its application in biological leaching. In future research, it is necessary to conduct more detailed and in-depth supplementary studies on these aspects.
5. Conclusions
In an acidic culture medium (pH = 2 iron-free 9K medium), the addition of arsenopyrite increases the copper leaching concentration of chalcopyrite and weakens the passivation layer, allowing dissolved ions to migrate from the surface to the solution. During the leaching process, due to the galvanic effect between chalcopyrite and arsenopyrite, the high rest potential of arsenopyrite acts as the cathode to accelerate the anodic oxidation of chalcopyrite. Through cyclic voltammetry analysis, it was found that the S0 content of chalcopyrite–arsenopyrite galvanic couple decreased, the release of Cu2+ increased, and the surface of chalcopyrite was altered, reducing the hindrance of sulfur and increasing the chemical reactivity of chalcopyrite surface. Compared with the chalcopyrite after self-corrosion, the corrosion surface under galvanic effect has a lower content of iron-oxyhydroxide on the one hand, and on the other hand, it strengthens the oxidation reaction of S2− and Sn2−/S0, accelerating the conversion process of jarosite. Jarosite replaces Sn2−/S0 as the main component of the passivation layer. In addition, there is a more severe corrosion morphology, which indicates that the galvanic effect in the presence of arsenopyrite is the main reason for promoting the dissolution of chalcopyrite. Finally, it is necessary to explore under what conditions the greatest promotion effect can be achieved and to study the effect of the mass ratio of arsenopyrite to chalcopyrite on the leaching behavior of chalcopyrite. In addition, further research will be conducted on the galvanic interaction between chalcopyrite and arsenopyrite in the presence of leaching microorganisms.
Author Contributions
Conceptualization, Y.L. and X.S. (Xiangdong Shangguan); methodology, X.S. (Xiangdong Shangguan), R.L. and K.W.; software, X.S. (Xiangdong Shangguan), R.L., W.B. and J.H.; validation, Y.L., R.Y., X.W., W.Z. and L.S.; formal analysis, X.S. (Xiangdong Shangguan), K.W., J.H. and Y.T.; investigation, X.S. (Xiangdong Shangguan), R.L., K.W. and X.S. (Xinlei Sun); resources, Y.L., R.Y., X.W., W.Z. and L.S.; data curation, X.S. (Xiangdong Shangguan), R.L., K.W., Y.T. and X.S. (Xinlei Sun); writing—original draft preparation, X.S. (Xiangdong Shangguan); writing—review and editing, X.S. (Xiangdong Shangguan), Y.L. and W.B.; visualization, X.S. (Xiangdong Shangguan) and Y.L.; supervision, Y.L., R.Y., X.W., W.Z. and L.S.; project administration, Y.L.; funding acquisition, Y.L. All authors have read and agreed to the published version of the manuscript.
Funding
This research was funded by the Changsha Municipal Natural Science Foundation (No.kq2202084), the Hunan Provincial Natural Science Foundation of China (No.2019JJ40367, No.2015JJ2186), the National Natural Science Foundation of China (No.51274268, No.50904080), the China Postdoctoral Science Foundation (No.2013M540643, No.2014T70791), and the Fundamental Research Funds for the Central Universities of Central South University (No. 20230021020062). We are also grateful for resources from the High Performance Computing Center of Central South University.
Data Availability Statement
The data presented in this study are available on request from the corresponding author.
Conflicts of Interest
The authors declare no conflicts of interest.
References
- Li, Y.; Kawashima, N.; Li, J.; Chandra, A.P.; Gerson, A.R. A review of the structure, and fundamental mechanisms and kinetics of the leaching of chalcopyrite. Adv. Colloid Interface Sci. 2013, 197, 1–32. [Google Scholar] [CrossRef] [PubMed]
- Deng, S.; Gu, G.; Ji, J.; Xu, B. Bioleaching of two different genetic types of chalcopyrite and their comparative mineralogical assessment. Anal. Bioanal. Chem. 2018, 410, 1725–1733. [Google Scholar] [CrossRef] [PubMed]
- Zhao, H.; Huang, X.; Wang, J.; Li, Y.; Liao, R.; Wang, X.; Qiu, X.; Xiong, Y.; Qin, W.; Qiu, G. Comparison of bioleaching and dissolution process of p-type and n-type chalcopyrite. Miner. Eng. 2017, 109, 153–161. [Google Scholar] [CrossRef]
- Deng, S.; Yang, J.; Wang, Y.; Long, T.; Yang, W. Influence of magnetite on the leaching of chalcopyrite in sulfuric acid. Arab. J. Chem. 2023, 16, 104905. [Google Scholar] [CrossRef]
- Zhao, C.-x.; Yang, B.-j.; Wang, X.-x.; Zhao, H.-b.; Gan, M.; Qiu, G.-z.; Wang, J. Catalytic effect of visible light and Cd2+ on chalcopyrite bioleaching. Trans. Nonferrous Met. Soc. China 2020, 30, 1078–1090. [Google Scholar] [CrossRef]
- Wang, J.; Tao, L.; Zhao, H.; Hu, M.; Zheng, X.; Peng, H.; Gan, X.; Xiao, W.; Cao, P.; Qin, W.; et al. Cooperative effect of chalcopyrite and bornite interactions during bioleaching by mixed moderately thermophilic culture. Miner. Eng. 2016, 95, 116–123. [Google Scholar] [CrossRef]
- Hiroyoshi, N.; Arai, M.; Miki, H.; Tsunekawa, M.; Hirajima, T. A new reaction model for the catalytic effect of silver ions on chalcopyrite leaching in sulfuric acid solutions. Hydrometallurgy 2002, 63, 257–267. [Google Scholar] [CrossRef]
- Liang, C.-L.; Xia, J.-L.; Yang, Y.; Nie, Z.-Y.; Zhao, X.-J.; Zheng, L.; Ma, C.-Y.; Zhao, Y.-D. Characterization of the thermo-reduction process of chalcopyrite at 65 °C by cyclic voltammetry and XANES spectroscopy. Hydrometallurgy 2011, 107, 13–21. [Google Scholar] [CrossRef]
- Liao, R.; Wang, X.-x.; Yang, B.-j.; Hong, M.-x.; Zhao, H.-b.; Wang, J.; Qiu, G.-z. Catalytic effect of silver-bearing solid waste on chalcopyrite bioleaching: A kinetic study. J. Cent. South Univ. 2020, 27, 1395–1403. [Google Scholar] [CrossRef]
- Khoshkhoo, M.; Dopson, M.; Shchukarev, A.; Sandstrom, A. Chalcopyrite leaching and bioleaching: An X-ray photoelectron spectroscopic (XPS) investigation on the nature of hindered dissolution. Hydrometallurgy 2014, 149, 220–227. [Google Scholar] [CrossRef]
- Zhao, H.; Hu, M.; Li, Y.; Zhu, S.; Qin, W.; Qiu, G.; Wang, J. Comparison of electrochemical dissolution of chalcopyrite and bornite in acid culture medium. Trans. Nonferrous Met. Soc. China 2015, 25, 303–313. [Google Scholar] [CrossRef]
- Wang, J.; Gan, X.; Zhao, H.; Hu, M.; Li, K.; Qin, W.; Qiu, G. Dissolution and passivation mechanisms of chalcopyrite during bioleaching: DFT calculation, XPS and electrochemistry analysis. Miner. Eng. 2016, 98, 264–278. [Google Scholar] [CrossRef]
- Zhao, H.; Wang, J.; Gan, X.; Zheng, X.; Tao, L.; Hu, M.; Li, Y.; Qin, W.; Qiu, G. Effects of pyrite and bornite on bioleaching of two different types of chalcopyrite in the presence of Leptospirillum ferriphilum. Bioresour. Technol. 2015, 194, 28–35. [Google Scholar] [CrossRef] [PubMed]
- Khoshkhoo, M.; Dopson, M.; Engstrom, F.; Sandstrom, A. New insights into the influence of redox potential on chalcopyrite leaching behaviour. Miner. Eng. 2017, 100, 9–16. [Google Scholar] [CrossRef]
- Li, A.; Huang, S. Comparison of the electrochemical mechanism of chalcopyrite dissolution in the absence or presence of Sulfolobus metallicus at 70 °C. Miner. Eng. 2011, 24, 1520–1522. [Google Scholar] [CrossRef]
- Zhu, W.; Xia, J.-l.; Yang, Y.; Nie, Z.-y.; Zheng, L.; Ma, C.-y.; Zhang, R.-y.; Peng, A.-a.; Tang, L.; Qiu, G.-z. Sulfur oxidation activities of pure and mixed thermophiles and sulfur speciation in bioleaching of chalcopyrite. Bioresour. Technol. 2011, 102, 3877–3882. [Google Scholar] [CrossRef]
- Nazari, G.; Dixon, D.G.; Dreisinger, D.B. The mechanism of chalcopyrite leaching in the presence of silver-enhanced pyrite in the Galvanox™ process. Hydrometallurgy 2012, 113, 122–130. [Google Scholar] [CrossRef]
- Hiroyoshi, N.; Miki, H.; Hirajima, T.; Tsunekawa, M. A model for ferrous-promoted chalcopyrite leaching. Hydrometallurgy 2000, 57, 31–38. [Google Scholar] [CrossRef]
- Hiroyoshi, N.; Miki, H.; Hirajima, T.; Tsunekawa, M. Enhancement of chalcopyrite leaching by ferrous ions in acidic ferric sulfate solutions. Hydrometallurgy 2001, 60, 185–197. [Google Scholar] [CrossRef]
- Tanne, C.; Schippers, A. Electrochemical investigation of microbially and galvanically leached chalcopyrite. Hydrometallurgy 2021, 202, 105603. [Google Scholar] [CrossRef]
- Ruiz, M.C.; Montes, K.S.; Padilla, R. Galvanic Effect of Pyrite on Chalcopyrite Leaching in Sulfate-Chloride Media. Miner. Process. Extr. Metall. Rev. 2015, 36, 65–70. [Google Scholar] [CrossRef]
- Yang, Y.; Liu, W.; Bhargava, S.K.; Zeng, W.; Chen, M. A XANES and XRD study of chalcopyrite bioleaching with pyrite. Miner. Eng. 2016, 89, 157–162. [Google Scholar] [CrossRef]
- Majuste, D.; Ciminelli, V.S.T.; Osseo-Asare, K.; Dantas, M.S.S. Quantitative assessment of the effect of pyrite inclusions on chalcopyrite electrochemistry under oxidizing conditions. Hydrometallurgy 2012, 113, 167–176. [Google Scholar] [CrossRef]
- Liu, Q.; Wang, S.; Chen, M.; Yang, Y. Effect of pyrite on the electrochemical behavior of chalcopyrite at different potentials in pH 1.8 H2SO4. J. Chem. Res. 2019, 43, 493–502. [Google Scholar] [CrossRef]
- Hong, M.; Huang, X.; Gan, X.; Qiu, G.; Wang, J. The use of pyrite to control redox potential to enhance chalcopyrite bioleaching in the presence of Leptospirillum ferriphilum. Miner. Eng. 2021, 172, 107145. [Google Scholar] [CrossRef]
- Pearce, C.I.; Pattrick, R.A.D.; Vaughan, D.J. Electrical and magnetic properties of sulfides. Rev. Mineral. Geochem. 2006, 61, 127–180. [Google Scholar] [CrossRef]
- Silva, J.C.M.; De Abreu, H.A.; Duarte, H.A. Electronic and structural properties of bulk arsenopyrite and its cleavage surfaces—A DFT study. RSC Adv. 2015, 5, 2013–2023. [Google Scholar] [CrossRef]
- Li, Y.-Q.; He, Q.; Chen, J.-H.; Zhao, C.-H. Electronic and chemical structures of pyrite and arsenopyrite. Mineral. Mag. 2015, 79, 1779–1789. [Google Scholar] [CrossRef]
- Liu, Y.; Wei, Z.; Hu, X.; Zi, F.; Zhang, Y.; Zeng, M.; Chen, Y.; Chen, S.; Bai, R.; Xie, Z. Effect of peracetic acid as a depressant on the flotation separation of chalcopyrite from arsenopyrite. Miner. Eng. 2022, 178, 107426. [Google Scholar] [CrossRef]
- Liu, X.; Li, Q.; Zhang, Y.; Jiang, T.; Yang, Y.; Xu, B.; He, Y. Electrochemical behaviour of the dissolution and passivation of arsenopyrite in 9K culture medium. Appl. Surf. Sci. 2020, 508, 145269. [Google Scholar] [CrossRef]
- Antonio Diaz, J.; Serrano, J.; Leiva, E. Bioleaching of Arsenic-Bearing Copper Ores. Minerals 2018, 8, 215. [Google Scholar] [CrossRef]
- Luo, Y.; Xia, Y.; Zhou, H.; Yin, C.; Yang, H.; Chen, J.; Ou, L. Effect of calcium ions on surface properties of chalcopyrite and arsenopyrite and its response to flotation separation under low-alkalinity conditions. Appl. Surf. Sci. 2022, 602, 154191. [Google Scholar] [CrossRef]
- Deng, S.; Gu, G.-h.; Long, T.; Xiao, W.; Yang, W. Galvanic effect of magnetite on electrochemical oxidation of arsenopyrite in acidic culture medium. Trans. Nonferrous Met. Soc. China 2022, 32, 3744–3752. [Google Scholar] [CrossRef]
- Gu, G.; Hu, K.; Zhang, X.; Xiong, X.; Yang, H. The stepwise dissolution of chalcopyrite bioleached by Leptospirillum ferriphilum. Electrochim. Acta 2013, 103, 50–57. [Google Scholar] [CrossRef]
- Zeng, W.; Qiu, G.; Chen, M. Investigation of Cu-S intermediate species during electrochemical dissolution and bioleaching of chalcopyrite concentrate. Hydrometallurgy 2013, 134, 158–165. [Google Scholar] [CrossRef]
- Deng, S.; Gu, G.; He, G.; Li, L. Catalytic effect of pyrite on the leaching of arsenopyrite in sulfuric acid and acid culture medium. Electrochim. Acta 2018, 263, 8–16. [Google Scholar] [CrossRef]
- Hiroyoshi, N.; Kuroiwa, S.; Miki, H.; Tsunekawa, M.; Hirajima, T. Effects of coexisting metal ions on the redox potential dependence of chalcopyrite leaching in sulfuric acid solutions. Hydrometallurgy 2007, 87, 1–10. [Google Scholar] [CrossRef]
- Rafsanjani-Abbasi, A.; Davoodi, A. Electrochemical Characterization of Natural Chalcopyrite Dissolution in Sulfuric Acid Solution in Presence of Peroxydisulfate. Electrochim. Acta 2016, 212, 921–928. [Google Scholar] [CrossRef]
Disclaimer/Publisher’s Note: The statements, opinions and data contained in all publications are solely those of the individual author(s) and contributor(s) and not of MDPI and/or the editor(s). MDPI and/or the editor(s) disclaim responsibility for any injury to people or property resulting from any ideas, methods, instructions or products referred to in the content. |
© 2023 by the authors. Licensee MDPI, Basel, Switzerland. This article is an open access article distributed under the terms and conditions of the Creative Commons Attribution (CC BY) license (https://creativecommons.org/licenses/by/4.0/).