Abstract
Farmland soil quality is a crucial determinant for agricultural productivity, food safety, and human well-being. Among the various contaminants, heavy metals have emerged as pervasive factors significantly impacting farmland quality, attracting widespread societal concern. In this study, we systematically applied multivariate statistical analysis, geostatistical methods, and the positive matrix factorization (PMF) source apportionment technique to elucidate the sources and contributions of eight heavy metals (Cd, Hg, As, Pb, Cr, Cu, Zn, Ni) in farmland soils within an industrialized town. Our findings reveal that Cd, Hg, Pb, and Zn exhibit pollution or enrichment in farmland soils compared to natural background levels, with Hg and Cd surpassing 164.3% and 50.2%, respectively. Notably, Zn demonstrates discernible point-source pollution. Source apportionment results highlight industrial point sources, coal combustion, and agriculture as the primary anthropogenic contributors to heavy metal contamination, with zinc-plating enterprises being the predominant industrial point sources. Addressing the specific issue of point-source pollution from Zn in industrial activities, further analysis establishes a correlation between soil Zn content and the distance from zinc-plating enterprises. Utilizing an atmospheric transport model, we observe that the impact of industrial activities on soil Zn is limited when the distance exceeds 1.5 km, emphasizing the importance of monitoring Zn pollution within areas less than 1.5 km. This study pioneers a progressive source apportionment approach, considering the origins of different heavy metals, pollution levels, distance factors, and the cost-effectiveness of environmental measures. The insights gained provide scientifically sound strategies for future decision making in environmental protection.
1. Introduction
The rapid progress of urbanization, industrialization, and agriculture has led to an escalating transfer of heavy metals to the soil, posing a severe threat to the soil environment and food safety [1,2,3]. Due to their elevated toxicity, persistence, and resistance to degradation, heavy metals present a more formidable challenge to soil compared to other pollutants, demanding heightened attention [4,5]. The accumulation of heavy metals in farmland soil not only modifies the physicochemical properties of the soil, resulting in diminished soil functionality and reduced crop yields, but also jeopardizes human health through the transmission of contaminants along the food chain [6,7]. Surveys reveal that nearly 13.3% of soil samples in China surpass standard values for heavy metals, with the most serious heavy metal contamination in cultivated soils of industrially and agriculturally developed regions [6,8]. Consequently, there is an urgent need to conduct thorough investigations in regions experiencing significant heavy metal pollution, accurately and objectively identify the causes of soil metal accumulation, and implement measures for soil health management and human health protection in these areas [9,10].
Generally, heavy metals accumulate in the soil through two primary pathways. Firstly, natural sources contribute to heavy metal presence, as the weathering of parent rock formations naturally generates these contaminants. Areas with a high geological background are particularly susceptible to heavy metal enrichment through this natural process. Secondly, anthropogenic sources play a significant role, including industrial production, the excessive use of fertilizers and pesticides in agriculture, and emissions from vehicles. The rapid progress of industrialization and urbanization has led to human activities contributing pollutant fluxes that often surpass those originating from natural sources. Notably, industrial and agricultural activities have emerged as the principal sources of heavy metal enrichment in the soil [8,11,12].
Diverse sources of heavy metal pollution necessitate tailored remediation and prevention strategies, underscoring the importance of conducting source-tracing studies on heavy metals for effective soil pollution prevention and control. Multivariate statistical analysis serves as a common method for discerning the sources of heavy metals in the soil. Principal component analysis (PCA) is one such technique that transforms heavy metal factors into several principal components by analyzing combinations and correlations among various elements. These principal components can be qualitatively interpreted as the sources of heavy metals. However, PCA faces challenges in quantitatively analyzing the sources of heavy metals and calculating their contributions [8,13,14]. Positive matrix factorization (PMF) stands out as a quantitative source apportionment method that integrates uncertainty with concentration to allocate sources and derive more meaningful factors [15,16]. In recent years, the PMF method has gained recognition from the U.S. Environmental Protection Agency as a common multivariate factor analysis tool [10,17,18]. It can quantitatively calculate the contributions of potential sources to soil heavy metal pollution under non-negativity constraints and data uncertainty conditions. However, the PMF model lacks a method for determining a reasonable number of factors. While PMF primarily focuses on the global allocation of toxic metal pollution sources, its ability to define sources is confined to descriptive statistics and expert experience [19,20]. This limitation hampers its precise identification of pollution types and the analysis of spatial heterogeneity in local pollution sources. Therefore, a comprehensive approach involving the combined application of multivariate statistical analysis and the PMF method, with multivariate statistical analysis providing a reasonable number of factors for the PMF model, and the integration of PMF with geostatistical methods, offers a complementary advantage. This ensures that the results of heavy metal pollution source apportionment are more reasonable and reliable.
Building upon the considerations outlined above, we propose a comprehensive source apportionment method that integrates multivariate statistical analysis, geostatistical methods, and positive matrix factorization (PMF). This method is applied in a zinc-plating industrial town situated in the economically developed Yangtze River Delta region of China. The study aims to achieve four main objectives: (1) To comprehensively assess the concentration and spatial distribution of heavy metals (Cd, Hg, As, Pb, Cr, Cu, Zn, and Ni) in farmland soil using various indicators; (2) to identify the sources of heavy metals and quantify their contributions by employing a combination of multivariate statistical analysis, geostatistical methods, and PMF, along with industrial source information; (3) and to simulate the atmospheric transport and deposition of the major heavy metal pollutant, Zn, using an atmospheric transport model based on point source emission inventories, thereby predicting changes in Zn accumulation in farmland soil under different scenarios. The study results aim to provide crucial theoretical and practical references for the identification, risk assessment, and integrated management of soil heavy metal pollution sources in similar industrial towns.
2. Materials and Methods
2.1. Study Area
The study area, situated between 119.203369° to 119.372299° E and 32.586290° to 32.759941° N, is located in the western part of Yangzhou City, Jiangsu Province, China. Encompassing an approximate area of 153.67 km2, with arable land constituting 51.3%, the terrain exhibits a slight elevation in the southwest and a lower profile in the northeast, characterized mainly by a water-rich plain. The region experiences a subtropical humid monsoon climate, featuring an annual average temperature and precipitation of 15.3 °C and 1036.6 mm, respectively. The soil belongs to paddy soil, with three main types: Irrigated, submerged, and lateral seepage. The textures include light clay-heavy loam, light clay, and medium loam-heavy loam, respectively. Primary crops grown are rice, wheat, and rapeseed. The characteristic of agricultural production in this region is extensive fertilizer application, which may lead to the accumulation of heavy metals in the soil. Notably, the agricultural practices in this area involve extensive fertilization, potentially leading to the accumulation of heavy metals in the soil. Of significance, the area serves as the largest production base for street lighting in China and hosts well-developed zinc-plating industries. In the research area, there are three large-scale galvanizing enterprises, each with a production history of around 20 years. Collectively, they possess 10 hot-dip galvanizing production lines, with an annual production capacity of approximately 31.5 million square meters. As a consequence of agricultural, industrial, and urban development, inevitable issues of heavy metal pollution have arisen in the farmland soil. However, there is currently a dearth of research on the soil pollution status and spatial distribution of pollution sources in this region. To effectively address soil pollution and ensure food safety, it is imperative to conduct a comprehensive investigation into the pollution status and associated risks and quantify pollution sources in the area.
2.2. Sampling and Analysis
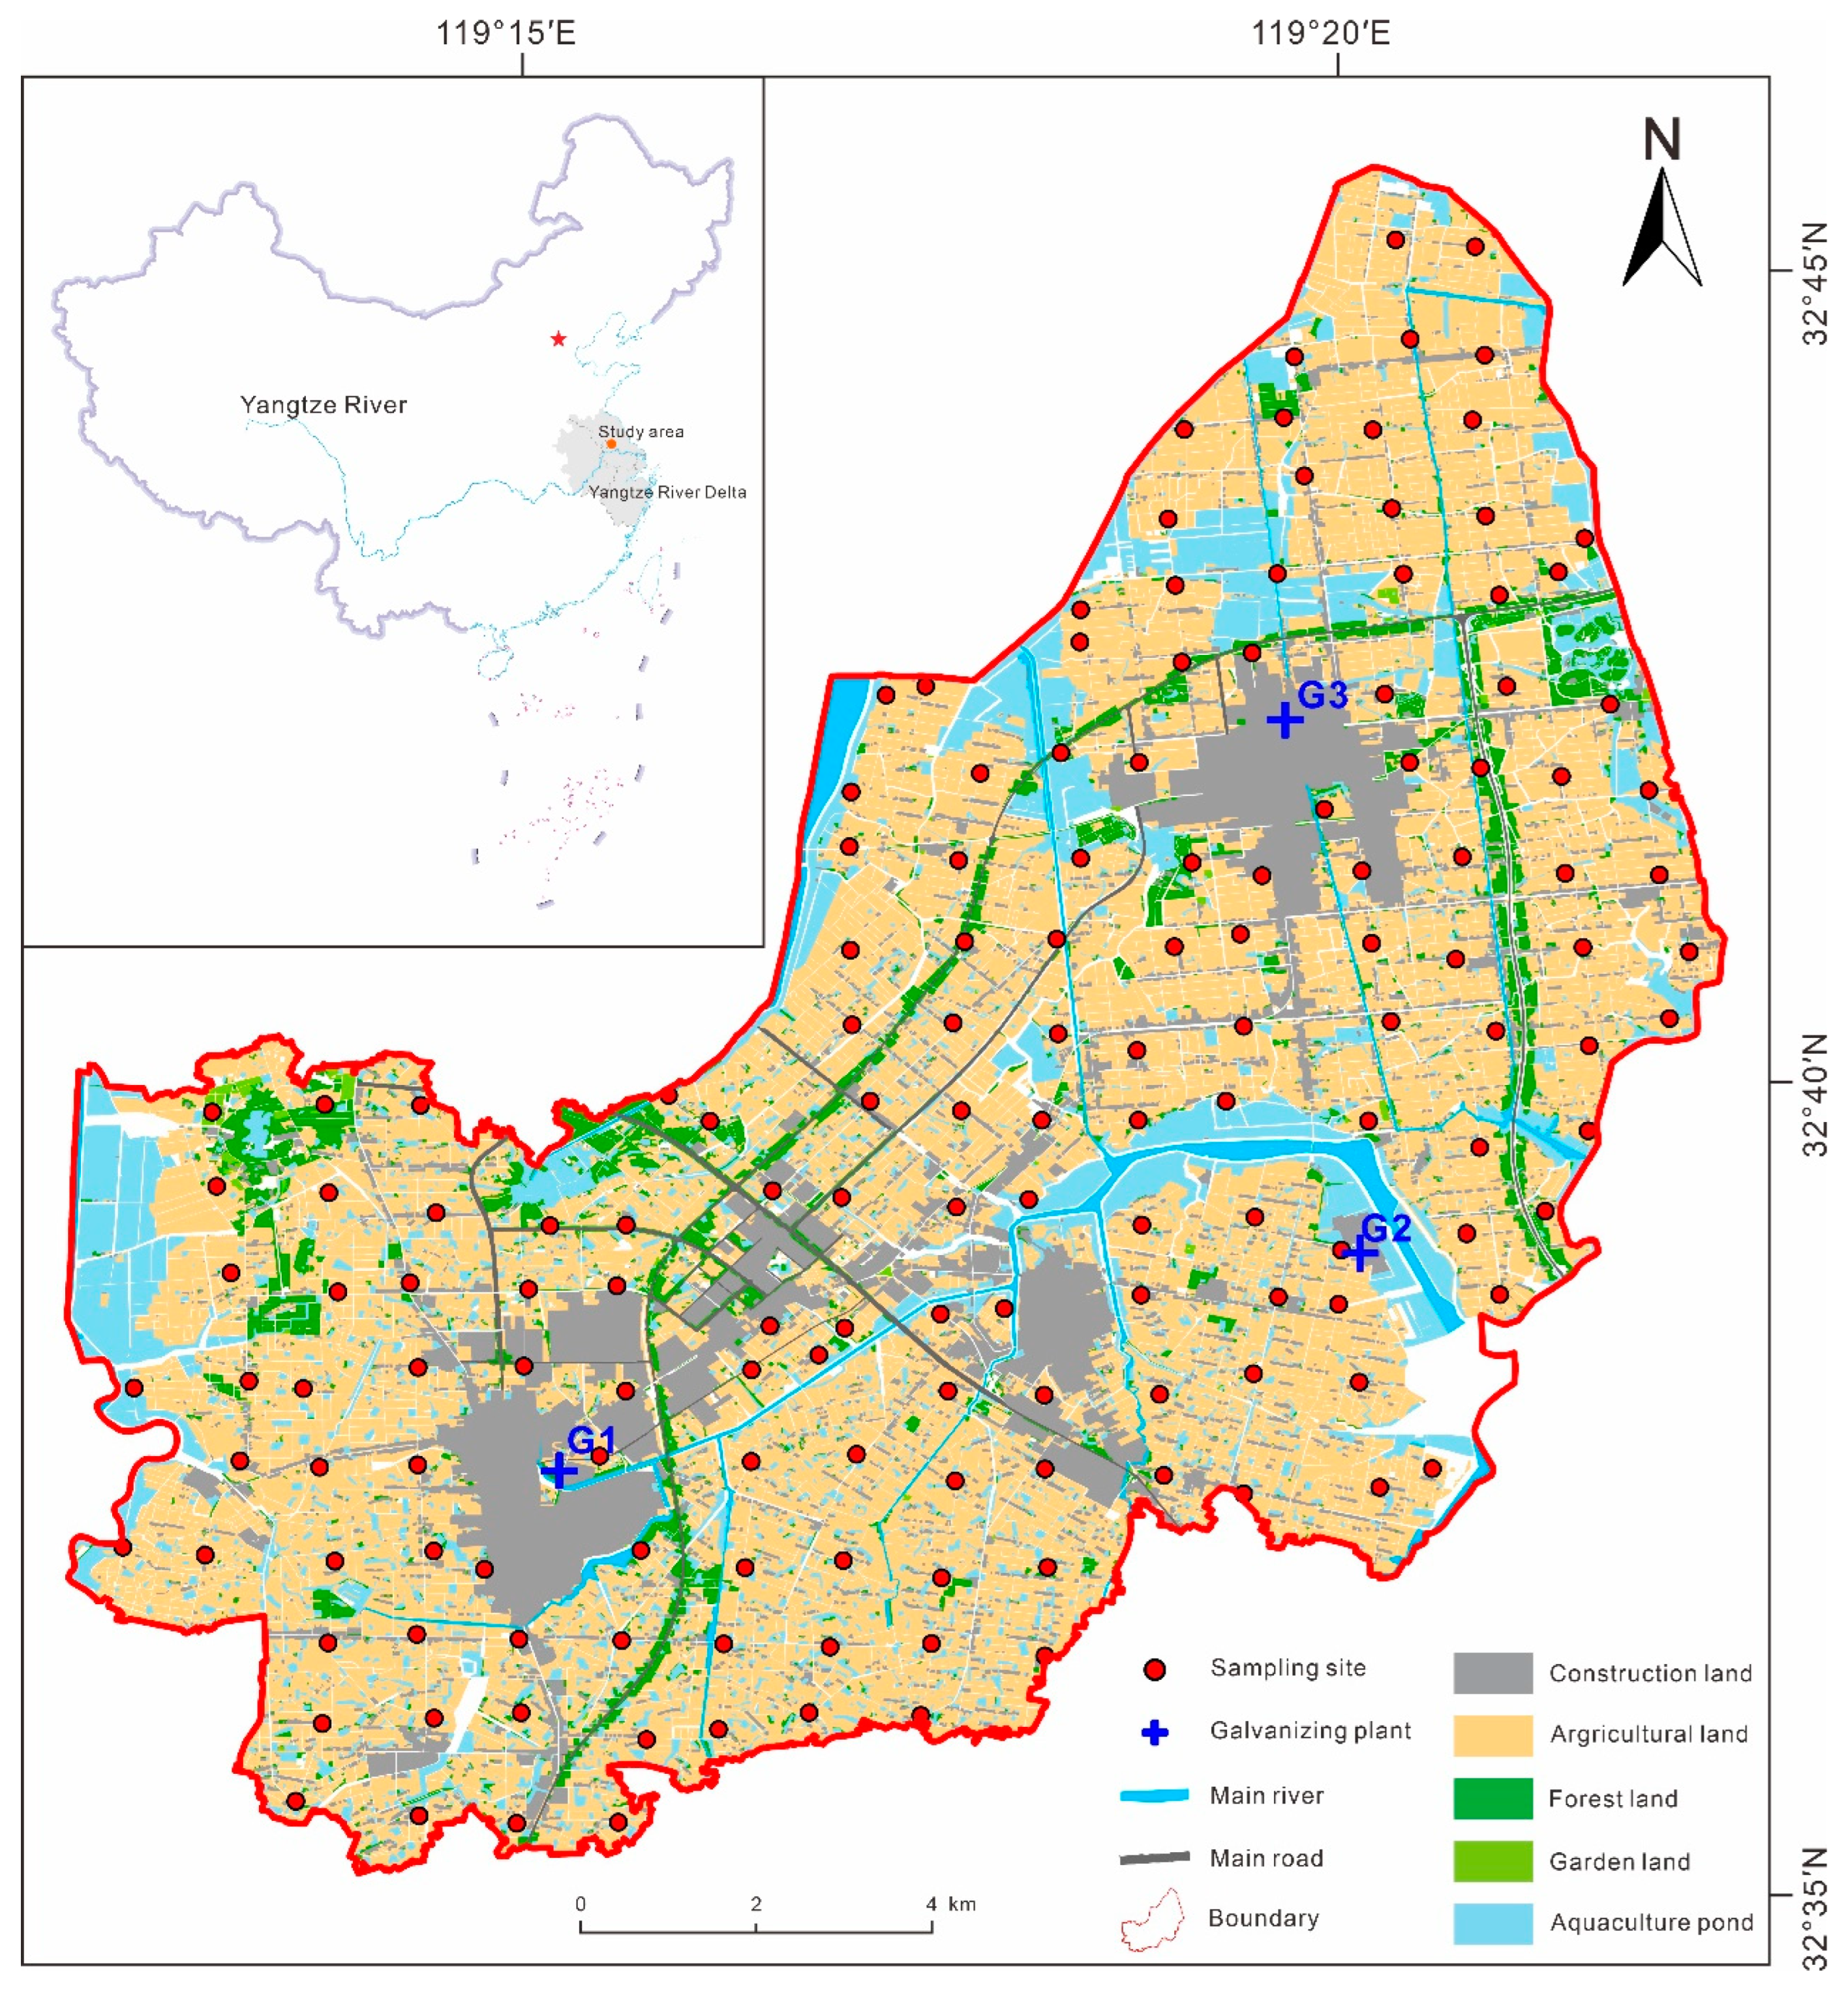
In April and May 2020, a systematic collection of 157 surface soil samples (0–20 cm) was conducted across farmland in the study area, employing a 1000 m grid. The sampling locations, recorded using GPS devices, and the land-use distribution are depicted in Figure 1. Each soil sample was gathered from a circular area with a 100 m radius around the sampling point, constituting a composite of five sub-samples of surface soil evenly collected within that range. After removing debris, the samples were air-dried at room temperature, further ground to 0.074 mm using an agate ball mill for the analysis of elements. The testing method for the samples refers to the standards outlined in the “The Specification of Testing Quality Management for Geological Laboratories DZ/T0130–2006” [21], which is a geological and mineral industry standard in the People’s Republic of China. Following digestion with HF-HNO3, Cd, Cu, Ni, Pb, and Zn were determined by ICP-MS (inductively coupled plasma mass spectrometry) at the Henan Geological and Mineral Test Center. Cr, Fe, and P were determined using XRF (X-ray fluorescence spectrometry). As and Hg were measured after digestion with (1 + 1) aqua regia using AFS (atomic fluorescence spectrometry). The detection limits for Cd, Hg, As, Pb, Cr, Cu, Zn, Ni, and P were 0.03, 0.0005, 0.3, 2.0, 3.0, 0.5, 2.0, 1.0, and 10 mg/kg, respectively, while the detection limit for Fe was 0.035%. The entire testing process follows quality assurance and control measures. National first-class standard reference materials (GBW07401 to GBW07408, GBW07423 to GBW07426) are used to monitor the testing process. The relative standard deviation (RSD) for the first-class standard material samples is consistently below 5%, and the overall qualification rate is 100%.
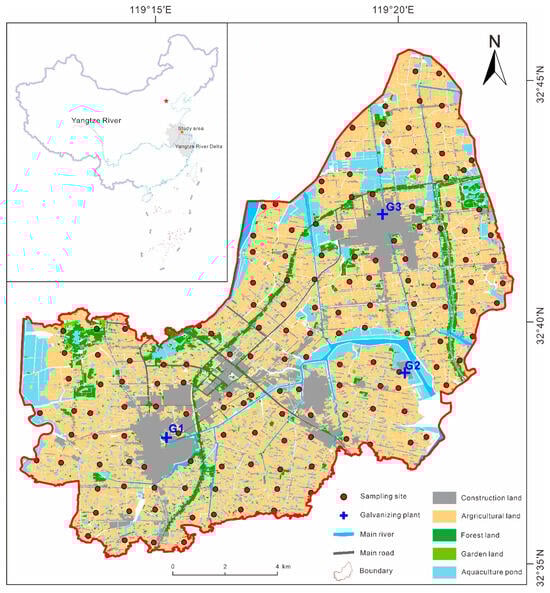
Figure 1.
Location of the study area and distribution of sampling sites.
2.3. Research Methods
In this study, we proposed a comprehensive approach that combines soil heavy metal source apportionment with atmospheric transport modeling for source risk assessment. This integrated method enables a more precise identification of pollution sources and facilitates the prediction of the extent and severity of their impact. By doing so, it contributes to a more nuanced understanding of heavy metal pollution dynamics, aiding in the development of targeted and evidence-based measures to safeguard environmental and human health.
2.3.1. Pollution Assessment
The geo-accumulation index (Igeo) was applied to evaluate the extent of soil heavy metal pollution [22], while the enrichment factor (EF) was employed to distinguish between heavy metals of anthropogenic or natural origin [23,24].
where Ci represents the concentration of element i in the surface soil (mg kg−1), Bi is the soil background value for element i (mg kg−1), and k is the correction factor (chosen as 1.5) accounting for lithogenic processes. This study takes the average background levels of heavy metals in C horizon soil in Jiangsu Province as Bi [25]. Cr denotes the concentration of the reference element (mg kg−1). The reference element is selected based on its high concentration in soil, minimal variation, and limited influence from anthropogenic sources [26]. In this study, Fe was chosen as the reference element due to its lower coefficient of variation compared to Mn and its relatively high concentration in the Earth’s crust.
2.3.2. Positive Matrix Factorization (PMF)
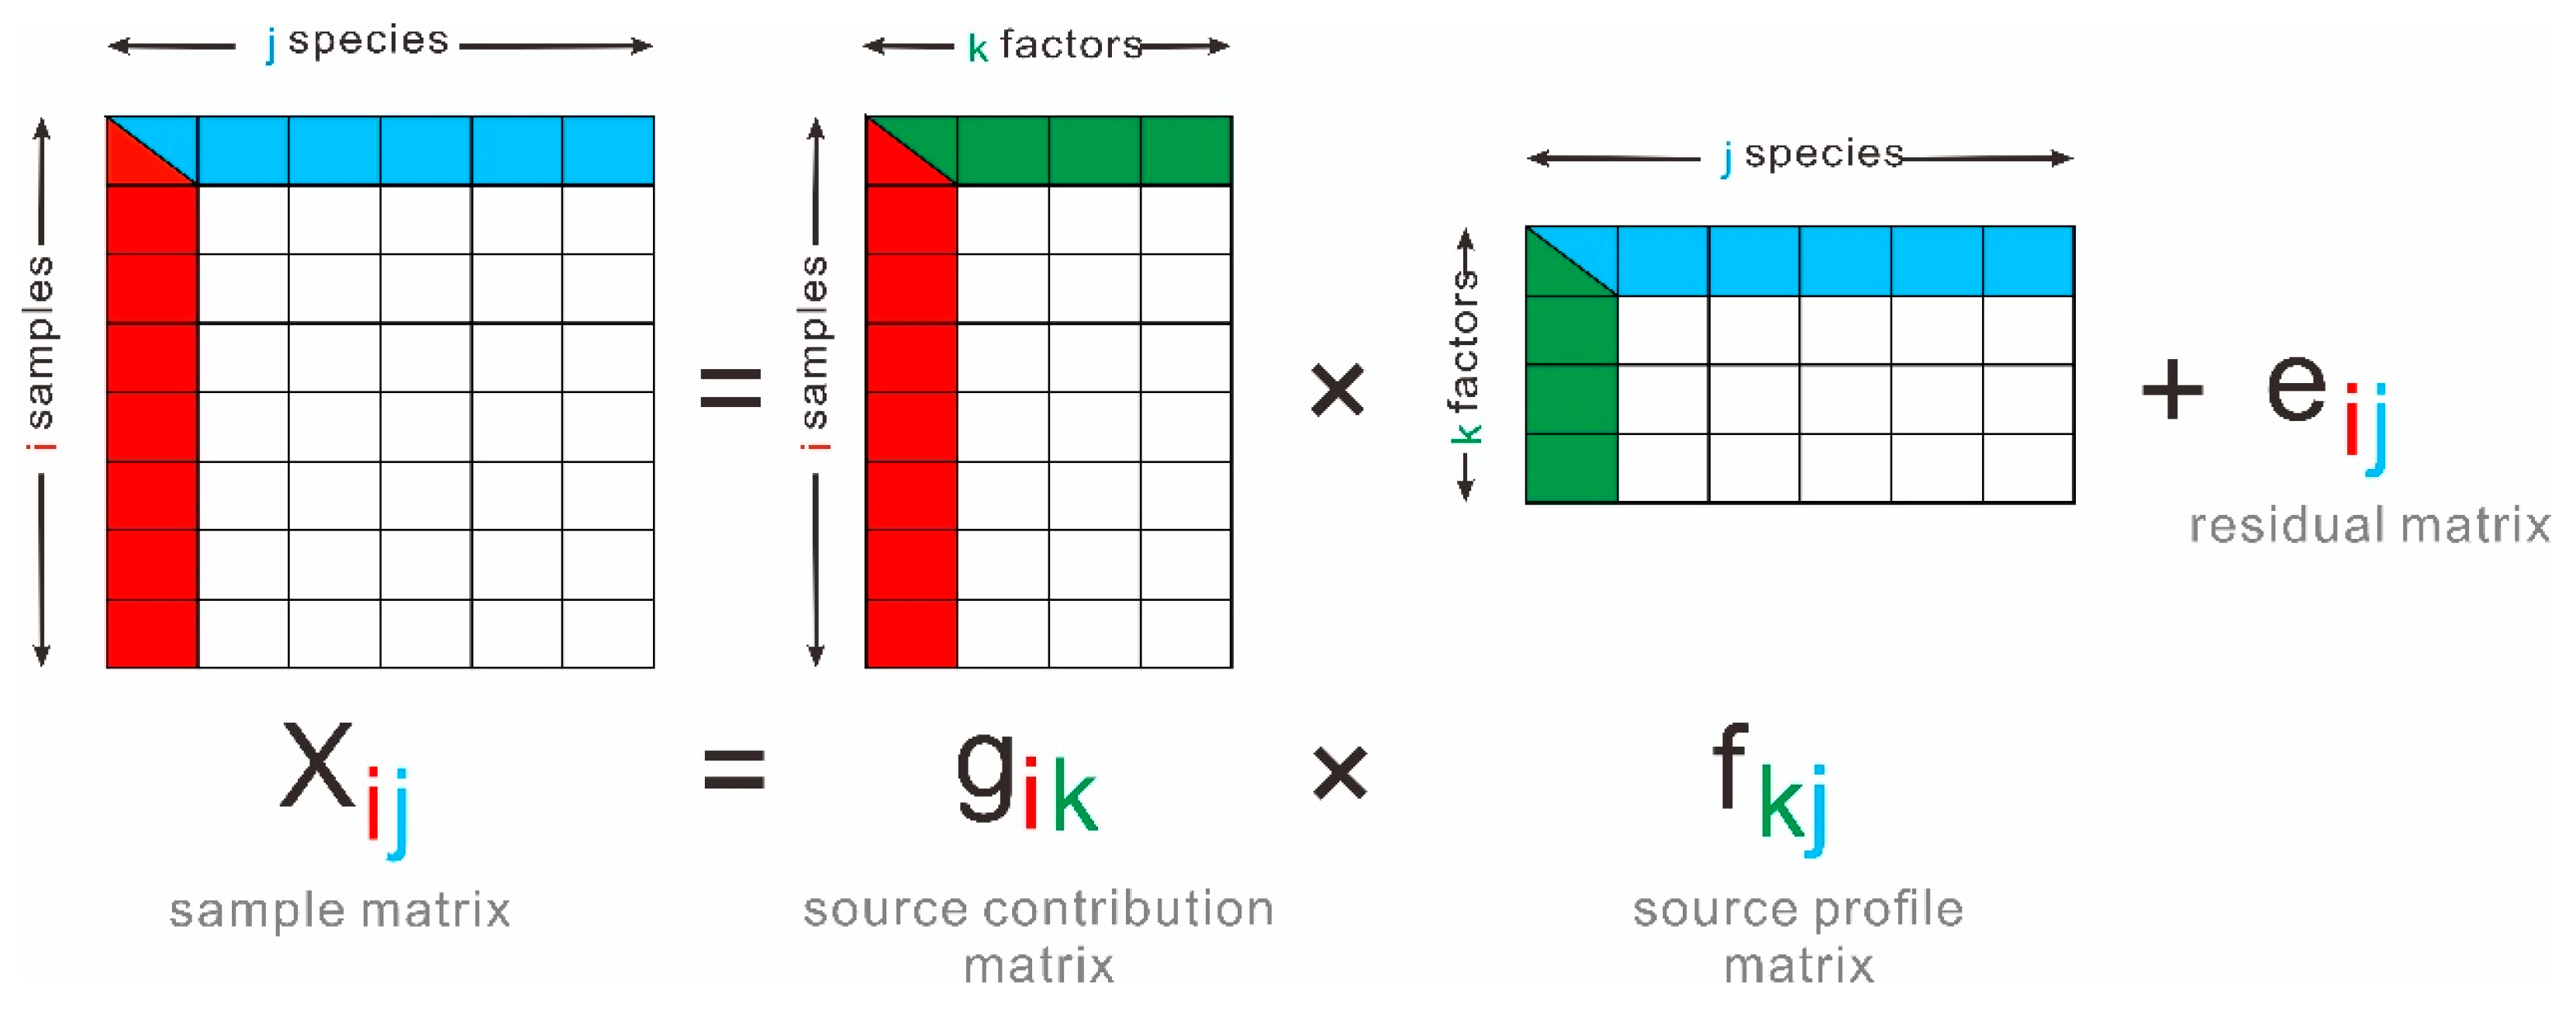
Positive matrix factorization (PMF) was employed to quantify the contributions of various sources to heavy metals in the samples. PMF decomposes the sample matrix into a source contribution matrix (G) and a source profile matrix (F) through covariance and correlation matrices. This method, implemented using EPA PMF 5.0, constrains matrices to be non-negative and handles missing and imprecise data [27].
The overall objective of the PMF model is to solve the chemical mass balance equation, which can be expressed as:
Xij = gik·fkj + eij
The parameters in Equation (3) are illustrated in Figure 2.

Figure 2.
PMF model concept diagram.
In the EPA PMF 5.0 program, the object function Q (Equation (4)) is solved using a multi-linear engine (ME) with multiple iterations at the lower level. The factor contributions and distributions are obtained by minimizing the object function Q:
where uij represents the uncertainty of element j in sample i, calculated based on the method detection limit (MDL) and the error percentage (E%) from the measurement of standard reference material for the specific method of the element. When the element content is not greater than MDL, the uncertainty calculation formula is: uij = 5/6 ∗ MDL; otherwise, the calculation formula is as follows:
where cij represents the concentration of element j in sample i.
2.3.3. Prediction Scenario Setup
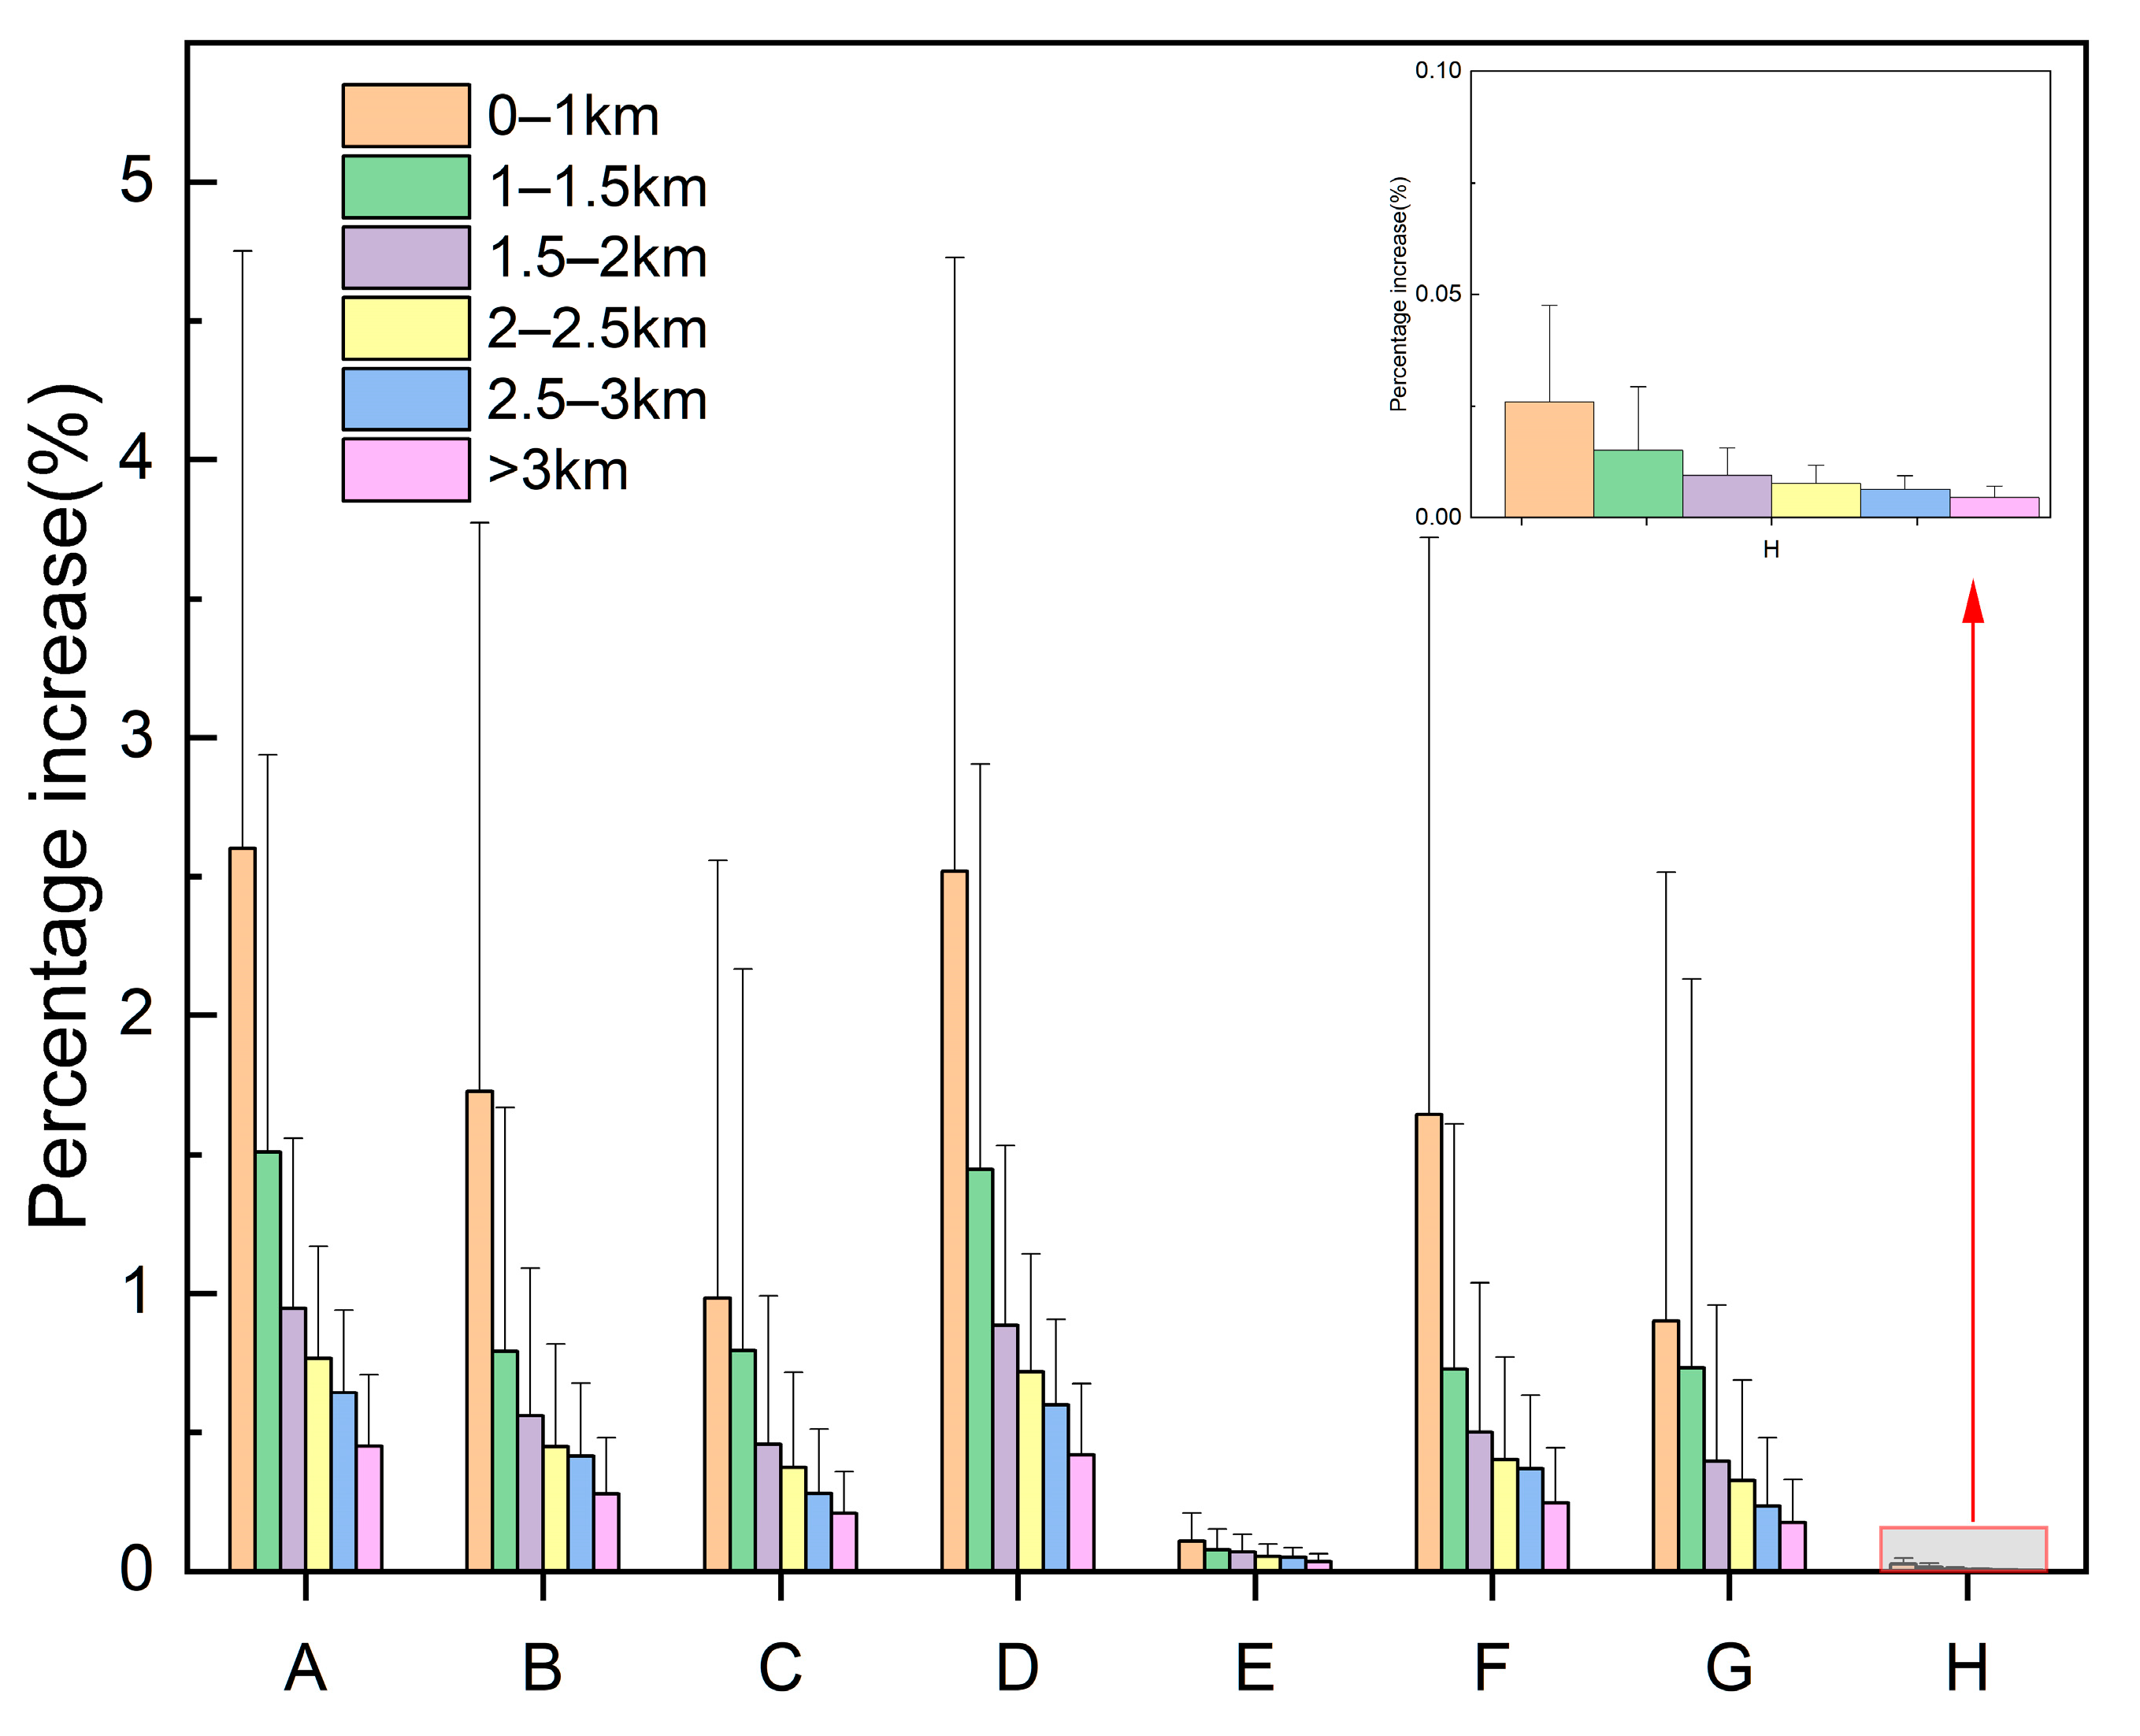
In the prediction scenario setup, eight scenarios were established based on the surface soil Zn content in farmland in 2020, considering whether three galvanizing companies (G1, G2, G3) use dust removal equipment. Scenario A: None of G1, G2, and G3 use dust removal equipment. Scenario B: Only G1 uses dust removal equipment, while G2 and G3 do not. Scenario C: Only G2 uses dust removal equipment, while G1 and G3 do not. Scenario D: Only G3 uses dust removal equipment, while G1 and G2 do not. Scenario E: Both G1 and G2 use dust removal equipment, while G3 does not. Scenario F: Both G1 and G3 use dust removal equipment, while G2 does not. Scenario G: Both G2 and G3 use dust removal equipment, while G1 does not. Scenario H: All three companies (G1, G2, G3) use dust removal equipment. These scenarios serve as a framework for assessing the potential impact of dust removal practices by galvanizing companies on the soil Zn content in farmland. The variations in scenarios allow for a comprehensive analysis of different operational setups and their implications for soil quality in the study area.
2.3.4. Atmospheric Transport Model
The AERMOD model (https://www.epa.gov/, accessed on 2 November 2023) utilized in this study is a steady-state plume model that combines air dispersion based on planetary boundary layer turbulent structure and scaling concepts. It incorporates treatments for both ground-level and elevated sources, as well as simple and complex terrain, enabling accurate simulation of spatial variations in atmospheric pollutant deposition under different emission scenarios [28,29]. The specific location, operating time, and source emission parameters of the galvanizing companies were extracted from the emission inventory provided by the local environmental protection agency, along with on-site survey data. The atmospheric Zn levels emitted by the galvanizing companies into the air were estimated by multiplying the activity level (A) by the corresponding emission factor (EF). The emission factor data were obtained from the United States Environmental Protection Agency (USEPA) Compilation of Air Pollutant Emissions Factors from Stationary Sources (AP-42) (https://www.epa.gov/air-emissions-factors-and-quantification/ap-42-compilation-air-emissions-factors-stationary-sources, accessed on 11 January 2024). Hourly surface meteorological data and upper-air meteorological data for the study area were provided by the local meteorological department.
The AERMOD model outputs the annual deposition flux (F) of Zn for each farmland plot. According to Equations (6) and (7), it predicts the cumulative amount (Δ) and cumulative percentage (P%) of Zn in the farmland soil in the study area.
where Δ represents the increment of Zn in the surface soil of farmland due to atmospheric deposition (mg kg−1); F is the Zn annual deposition flux output from the AERMOD model (mg m−2 year−1); k is the loss constant of the pollutant in the soil (year−1), chosen as 0.06 [28]; t represents the predicted number of years (year), set to 20 years in this case; Z and ρ are the mixing depth of the soil (m) and the bulk density of the soil particles (kg m−3), taken as 0.2 and 1125, respectively [30]; P% represents the rate of increase in Zn in the surface soil of farmland due to atmospheric deposition; BV represents the reference content of Zn in the surface soil of farmland (mg kg−1).
2.3.5. Statistical Analysis
Descriptive statistical analysis, normality tests, correlation analysis, and principal component analysis were conducted using SPSS 22.0 (IBM Inc., Armonk, NY, USA). The spatial distribution characteristics of soil heavy metals were analyzed using Kriging interpolation in ArcGIS 10.5 (ESRI Inc., Redlands, CA, USA). To better integrate spatial data, Kriging interpolation was applied to the PMF contribution factors.
3. Results and Discussion
3.1. Soil Heavy Metal Distribution Characteristics
Table 1 provides a summary of the characteristics of the heavy metal content in the soil. The average concentrations of Cd, Hg, As, Pb, Cr, Cu, Zn, and Ni are 0.12, 0.05, 9.93, 27.75, 71.71, 27.01, 70.77, and 30.67 mg/kg, respectively. Based on these average values, it is observed that although the concentrations of all eight heavy metals are below the pollution risk screening values of GB15618–2018 [31] and the target values of the Netherlands, Cd, Hg, Pb, Cu, and Zn surpass the local soil background values. Specifically, Hg and Cd exceed the soil background values by 164.3% and 50.2%, respectively. Additionally, the average values of Cd, As, and Zn in the study area are higher than those in a town of the southern Jiangsu Province. The soil type in that town is similar to that in the study area, and there is also an electroplating industry present.

Table 1.
Summarizes and compares the heavy metal content in farmland soil in the study area (n = 157, g kg−1 for Fe, mg kg−1 for other elements).
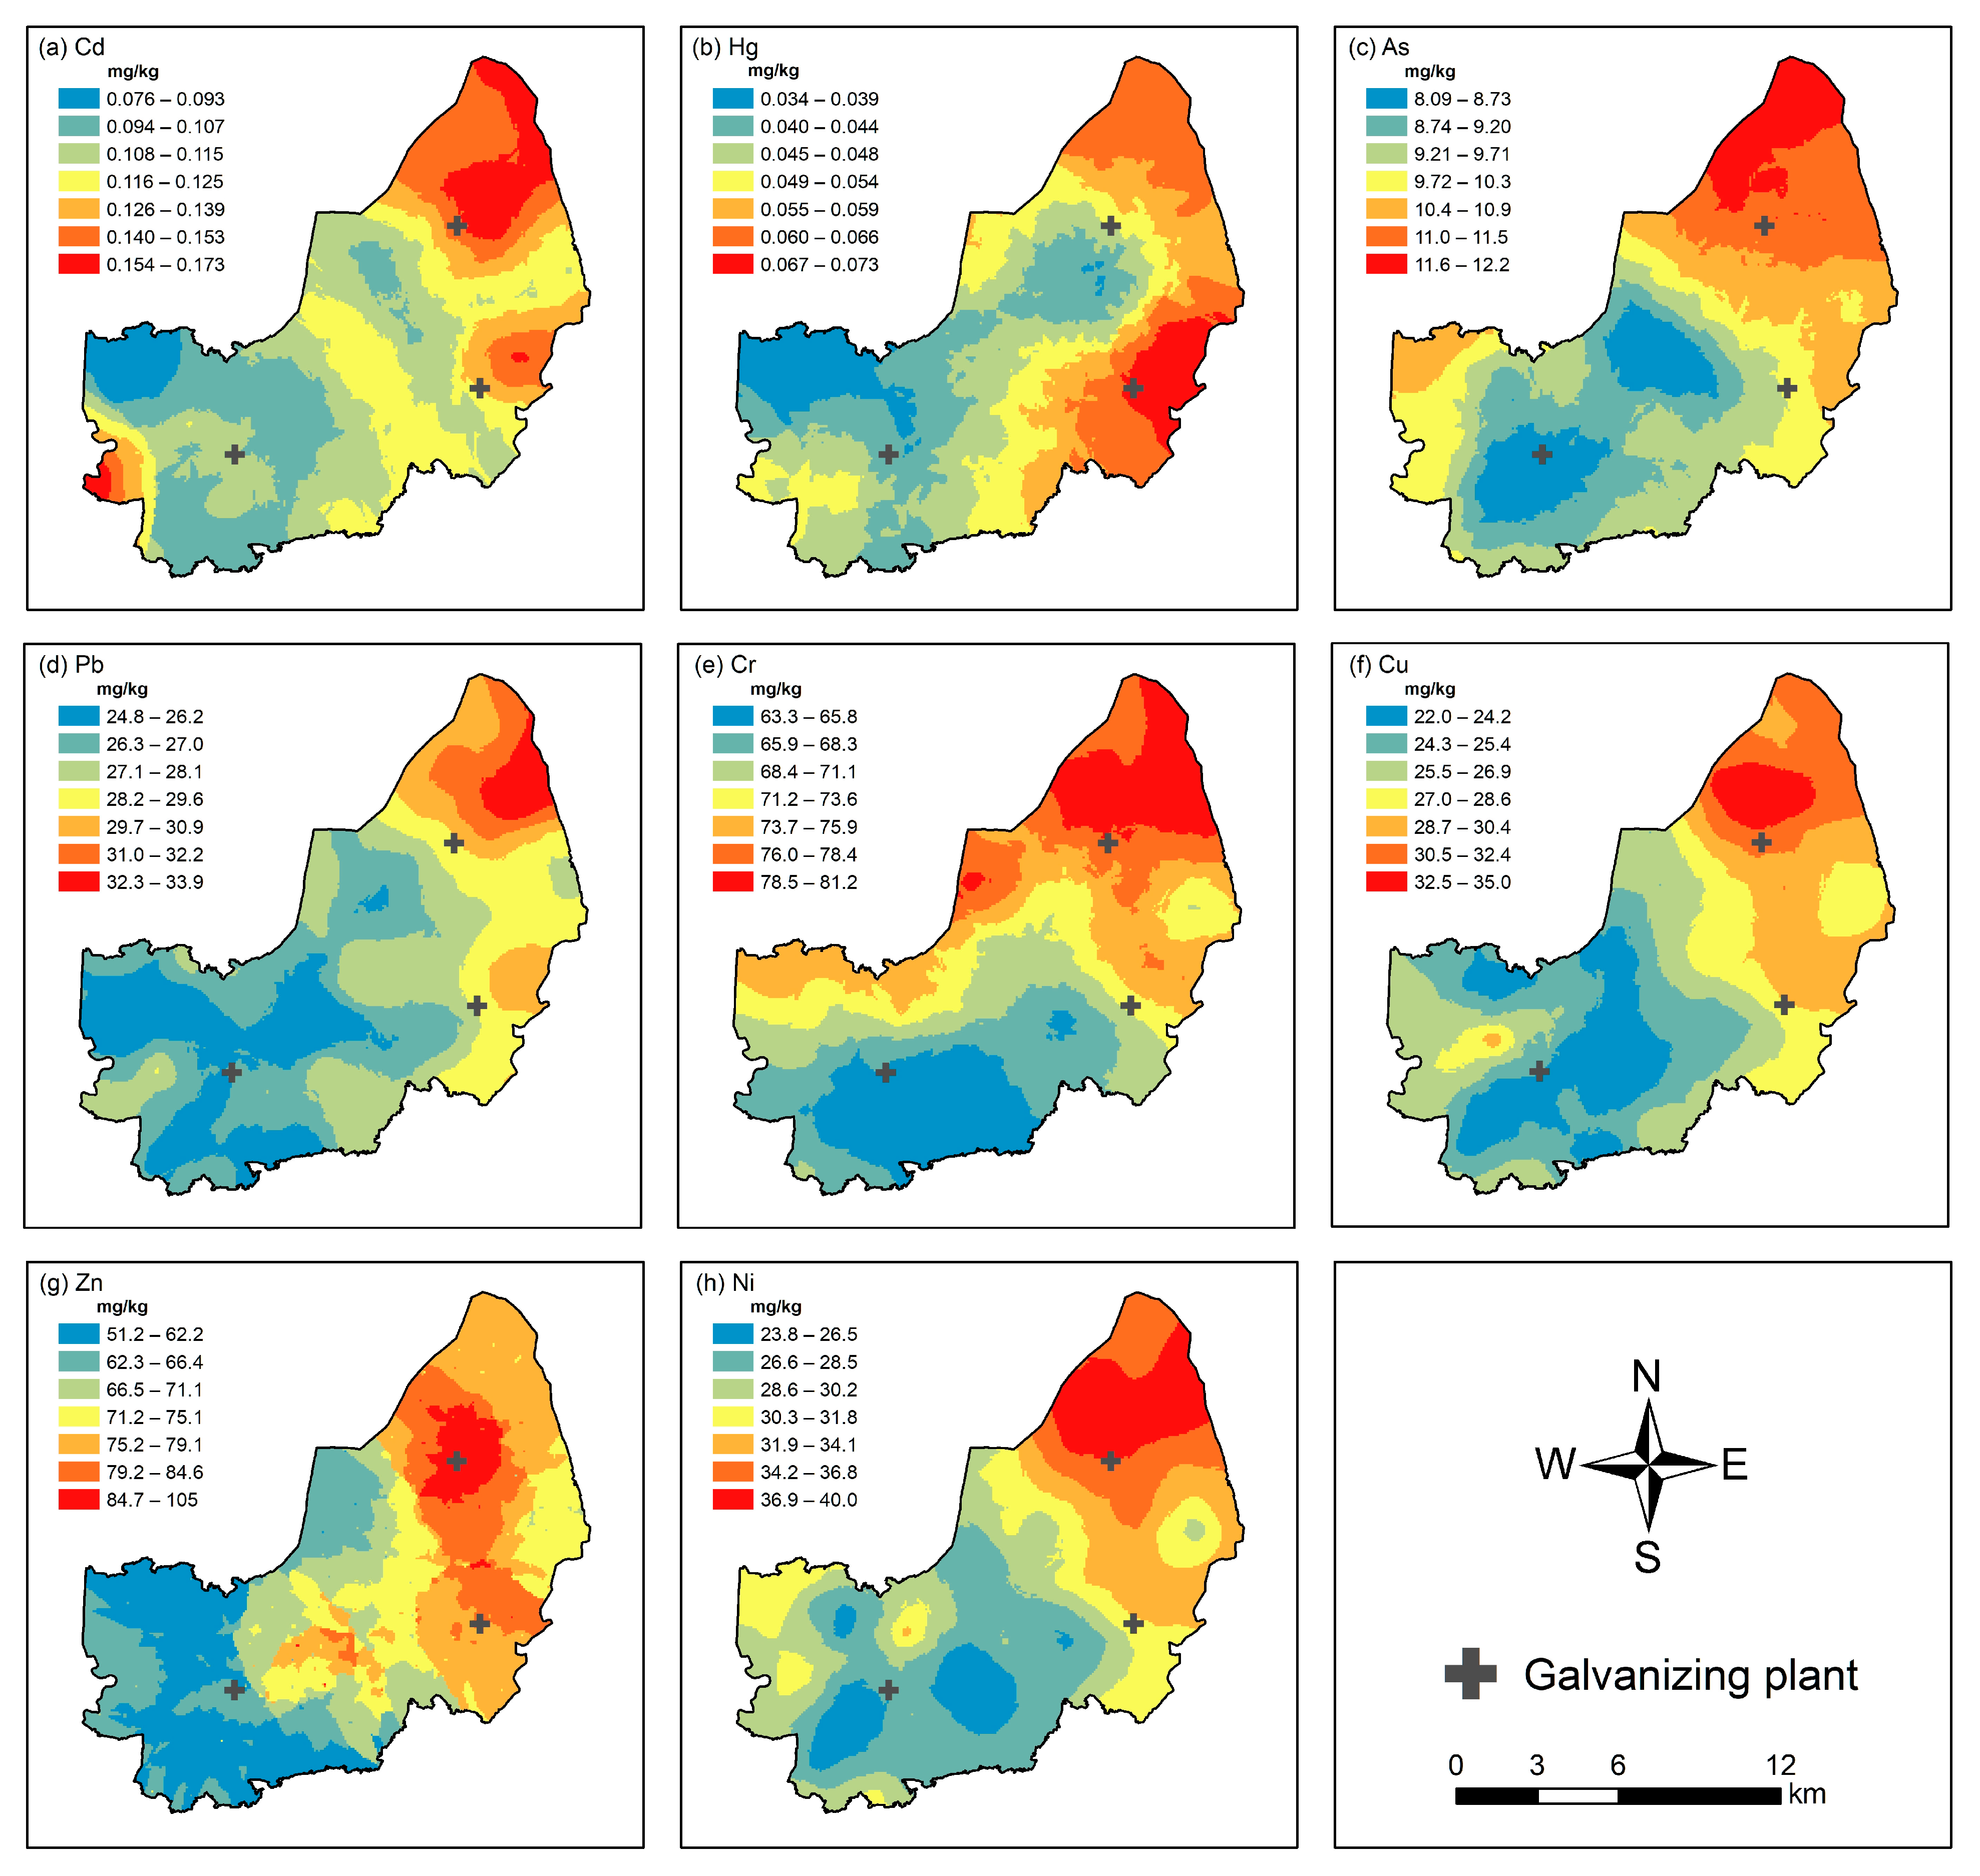
Figure 3 depicts the spatial distribution of soil heavy metal concentrations obtained through ordinary kriging interpolation. Overall, there are differences in the spatial distribution of heavy metals in the study area. As shown in Figure 3c,e,h, As, Cr, and Ni exhibit a similar spatial pattern, characterized by higher concentrations in the northeast and lower concentrations in the southwest. Cd and Pb, especially in the eastern part of the study area, show a similar spatial layout (Figure 3a,d). The Zn content is higher around the zinc-plating enterprises. Particularly in the eastern region, the closer the proximity to the galvanizing enterprises, the higher the concentration of zinc. (Figure 3g).

Figure 3.
Spatial distribution of heavy metal elements.
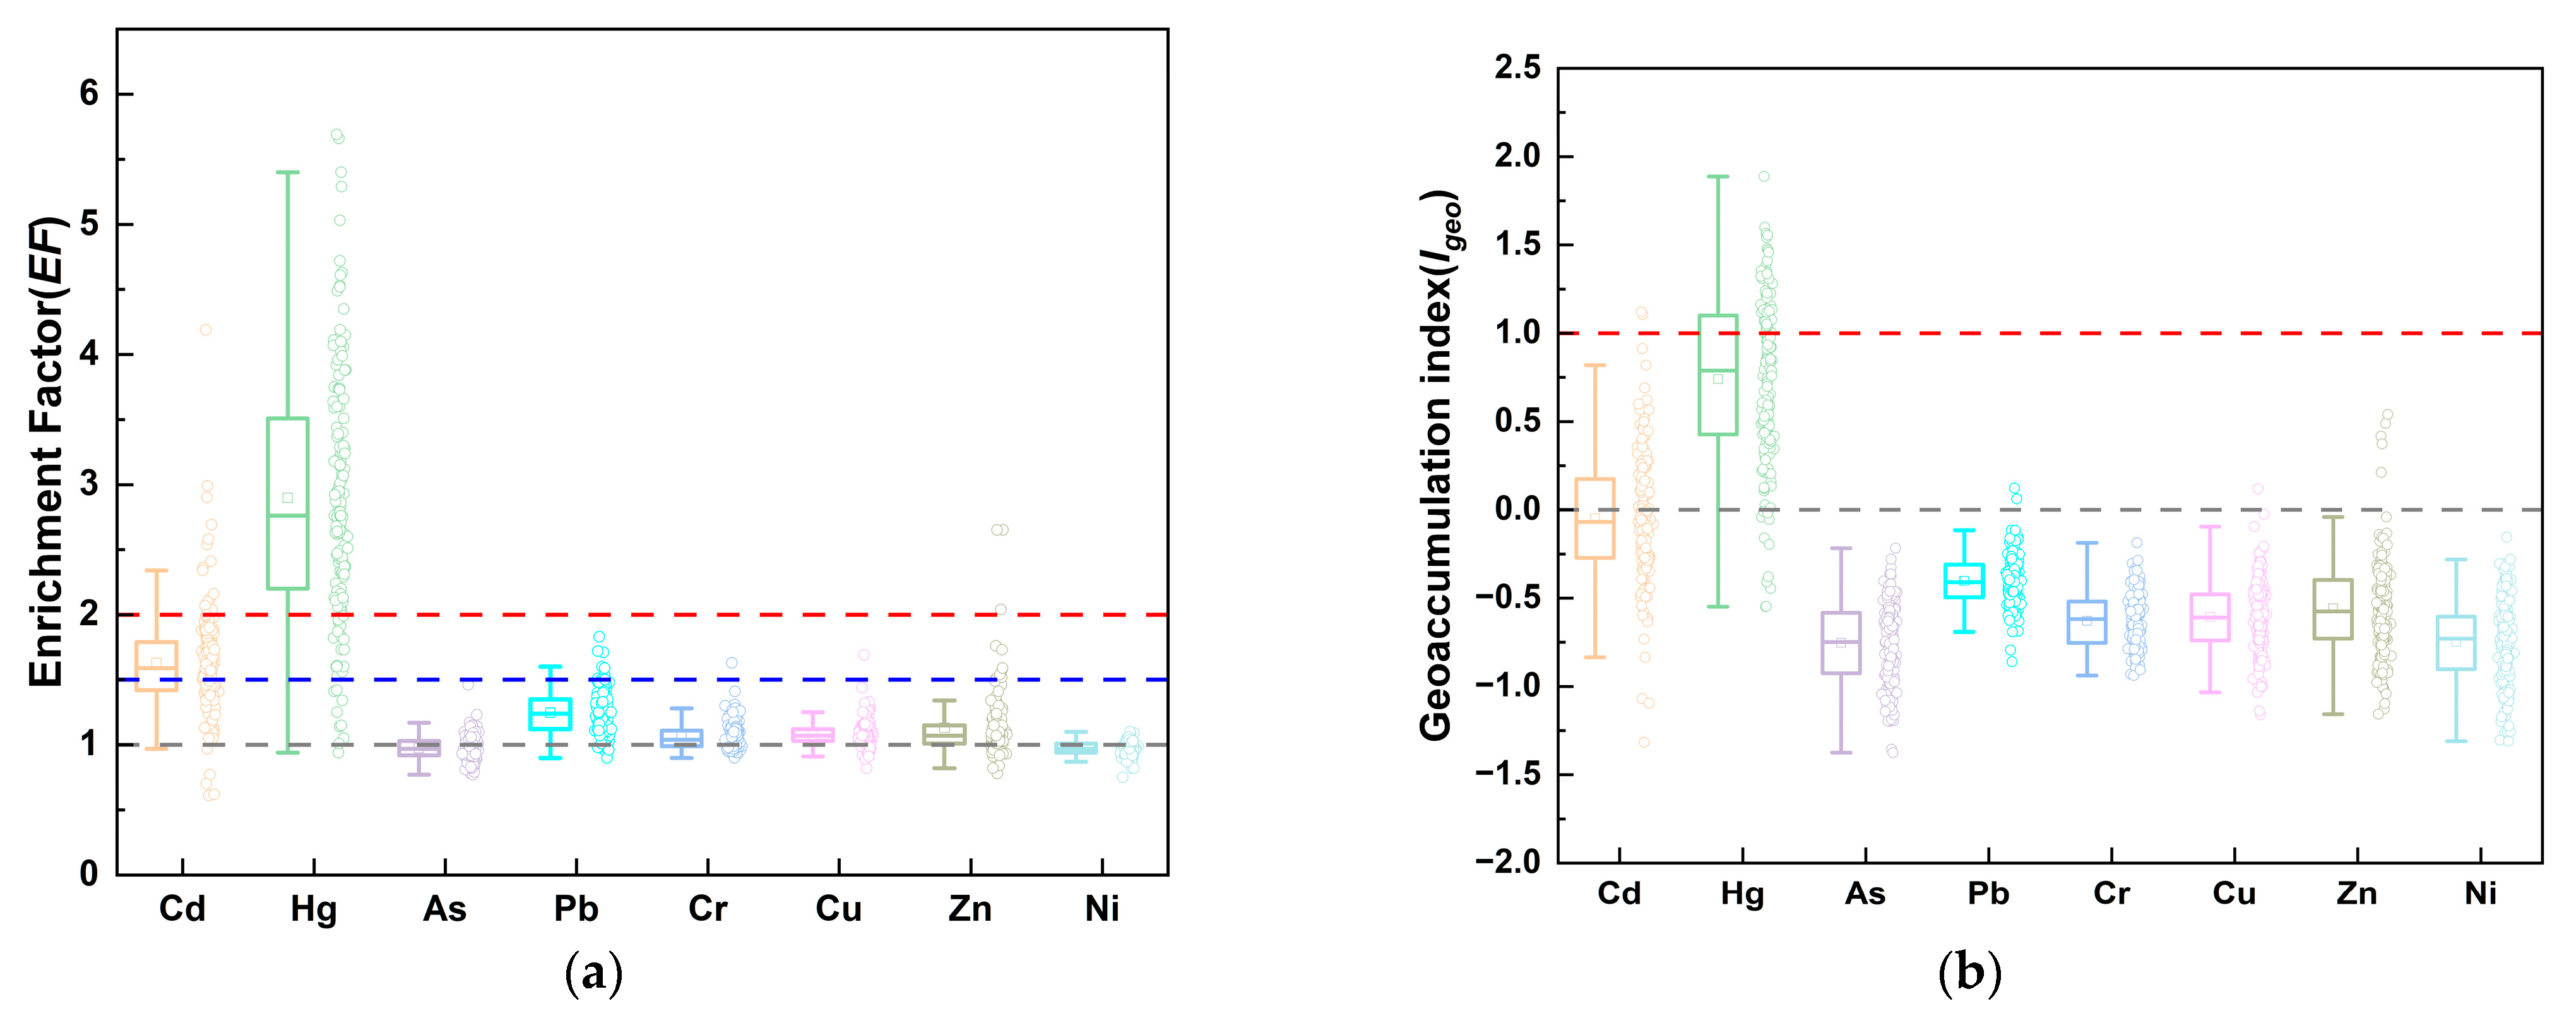
By calculating the geo-accumulation Index (Igeo) and enrichment factor (EF) of heavy metals in the soil, it is possible to distinguish elements originating from human activities and those from natural sources and assess the degree of anthropogenic impact. The results are shown in Figure 4. In descending order of magnitude based on the average Igeo values, the elements are ranked as follows: Hg > 0 > Cd > Pb > Zn > Cu > Cr > Ni > As. The Igeo values for Cr, Ni, and As are all less than 0 in all samples, indicating low pollution levels for these elements. Cd and Hg show moderate and mild pollution in 37.6% and 93.0% of samples, respectively. A few high values of Zn in the soil samples are classified as mild, suggesting the presence of point-source pollution for Zn. Combining the analysis of the spatial distribution of soil heavy metal concentrations, it is speculated that point-source pollution is likely associated with zinc-plating enterprises. The enrichment factor results align with the Geo-accumulation Index results, with the average EF values ranked as follows: Hg > 2 > Cd > 1.5 > Pb > Zn > Cu > Cr > 1 > Ni > As. EF values for As and Ni are less than 1, indicating natural sources. Cd exhibits a likely anthropogenic source (EF between 1.5 and 2), and Hg shows moderate enrichment. Cd, Hg, and Zn exhibit localized significant enrichment (EF values greater than 2).
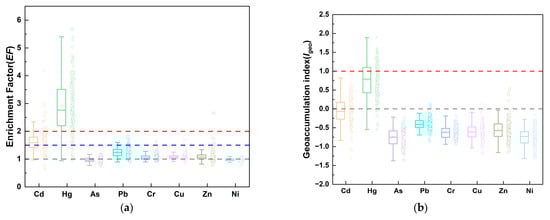
Figure 4.
The box plots depict the geo-accumulation index (a) and enrichment factor (b) for heavy metals. Circles at the top and bottom of each box correspond to the maximum and minimum values, respectively. Horizontal lines at the top, middle, and bottom of each box represent the 75th percentile, median, and 25th percentile, respectively. This visual representation provides insights into the distribution of heavy metals in geological samples. The circles at the extremities indicate the presence of maximum and minimum values, while the height and length of the boxes offer information about data dispersion and the central tendency. This graphical representation aids in comprehending the accumulation and enrichment patterns of heavy metals in surface soils.
In summary, the farmland soil in the study area is influenced by human activities, with significant impacts on Cd, Hg, and Zn. Further quantification of source analysis is needed to understand the contributions of human and natural activities to the accumulation of heavy metals in farmland soil. The point-source pollution associated with zinc-plating enterprises, especially for Zn, warrants further investigation.
3.2. Correlation Analysis of Soil Elements
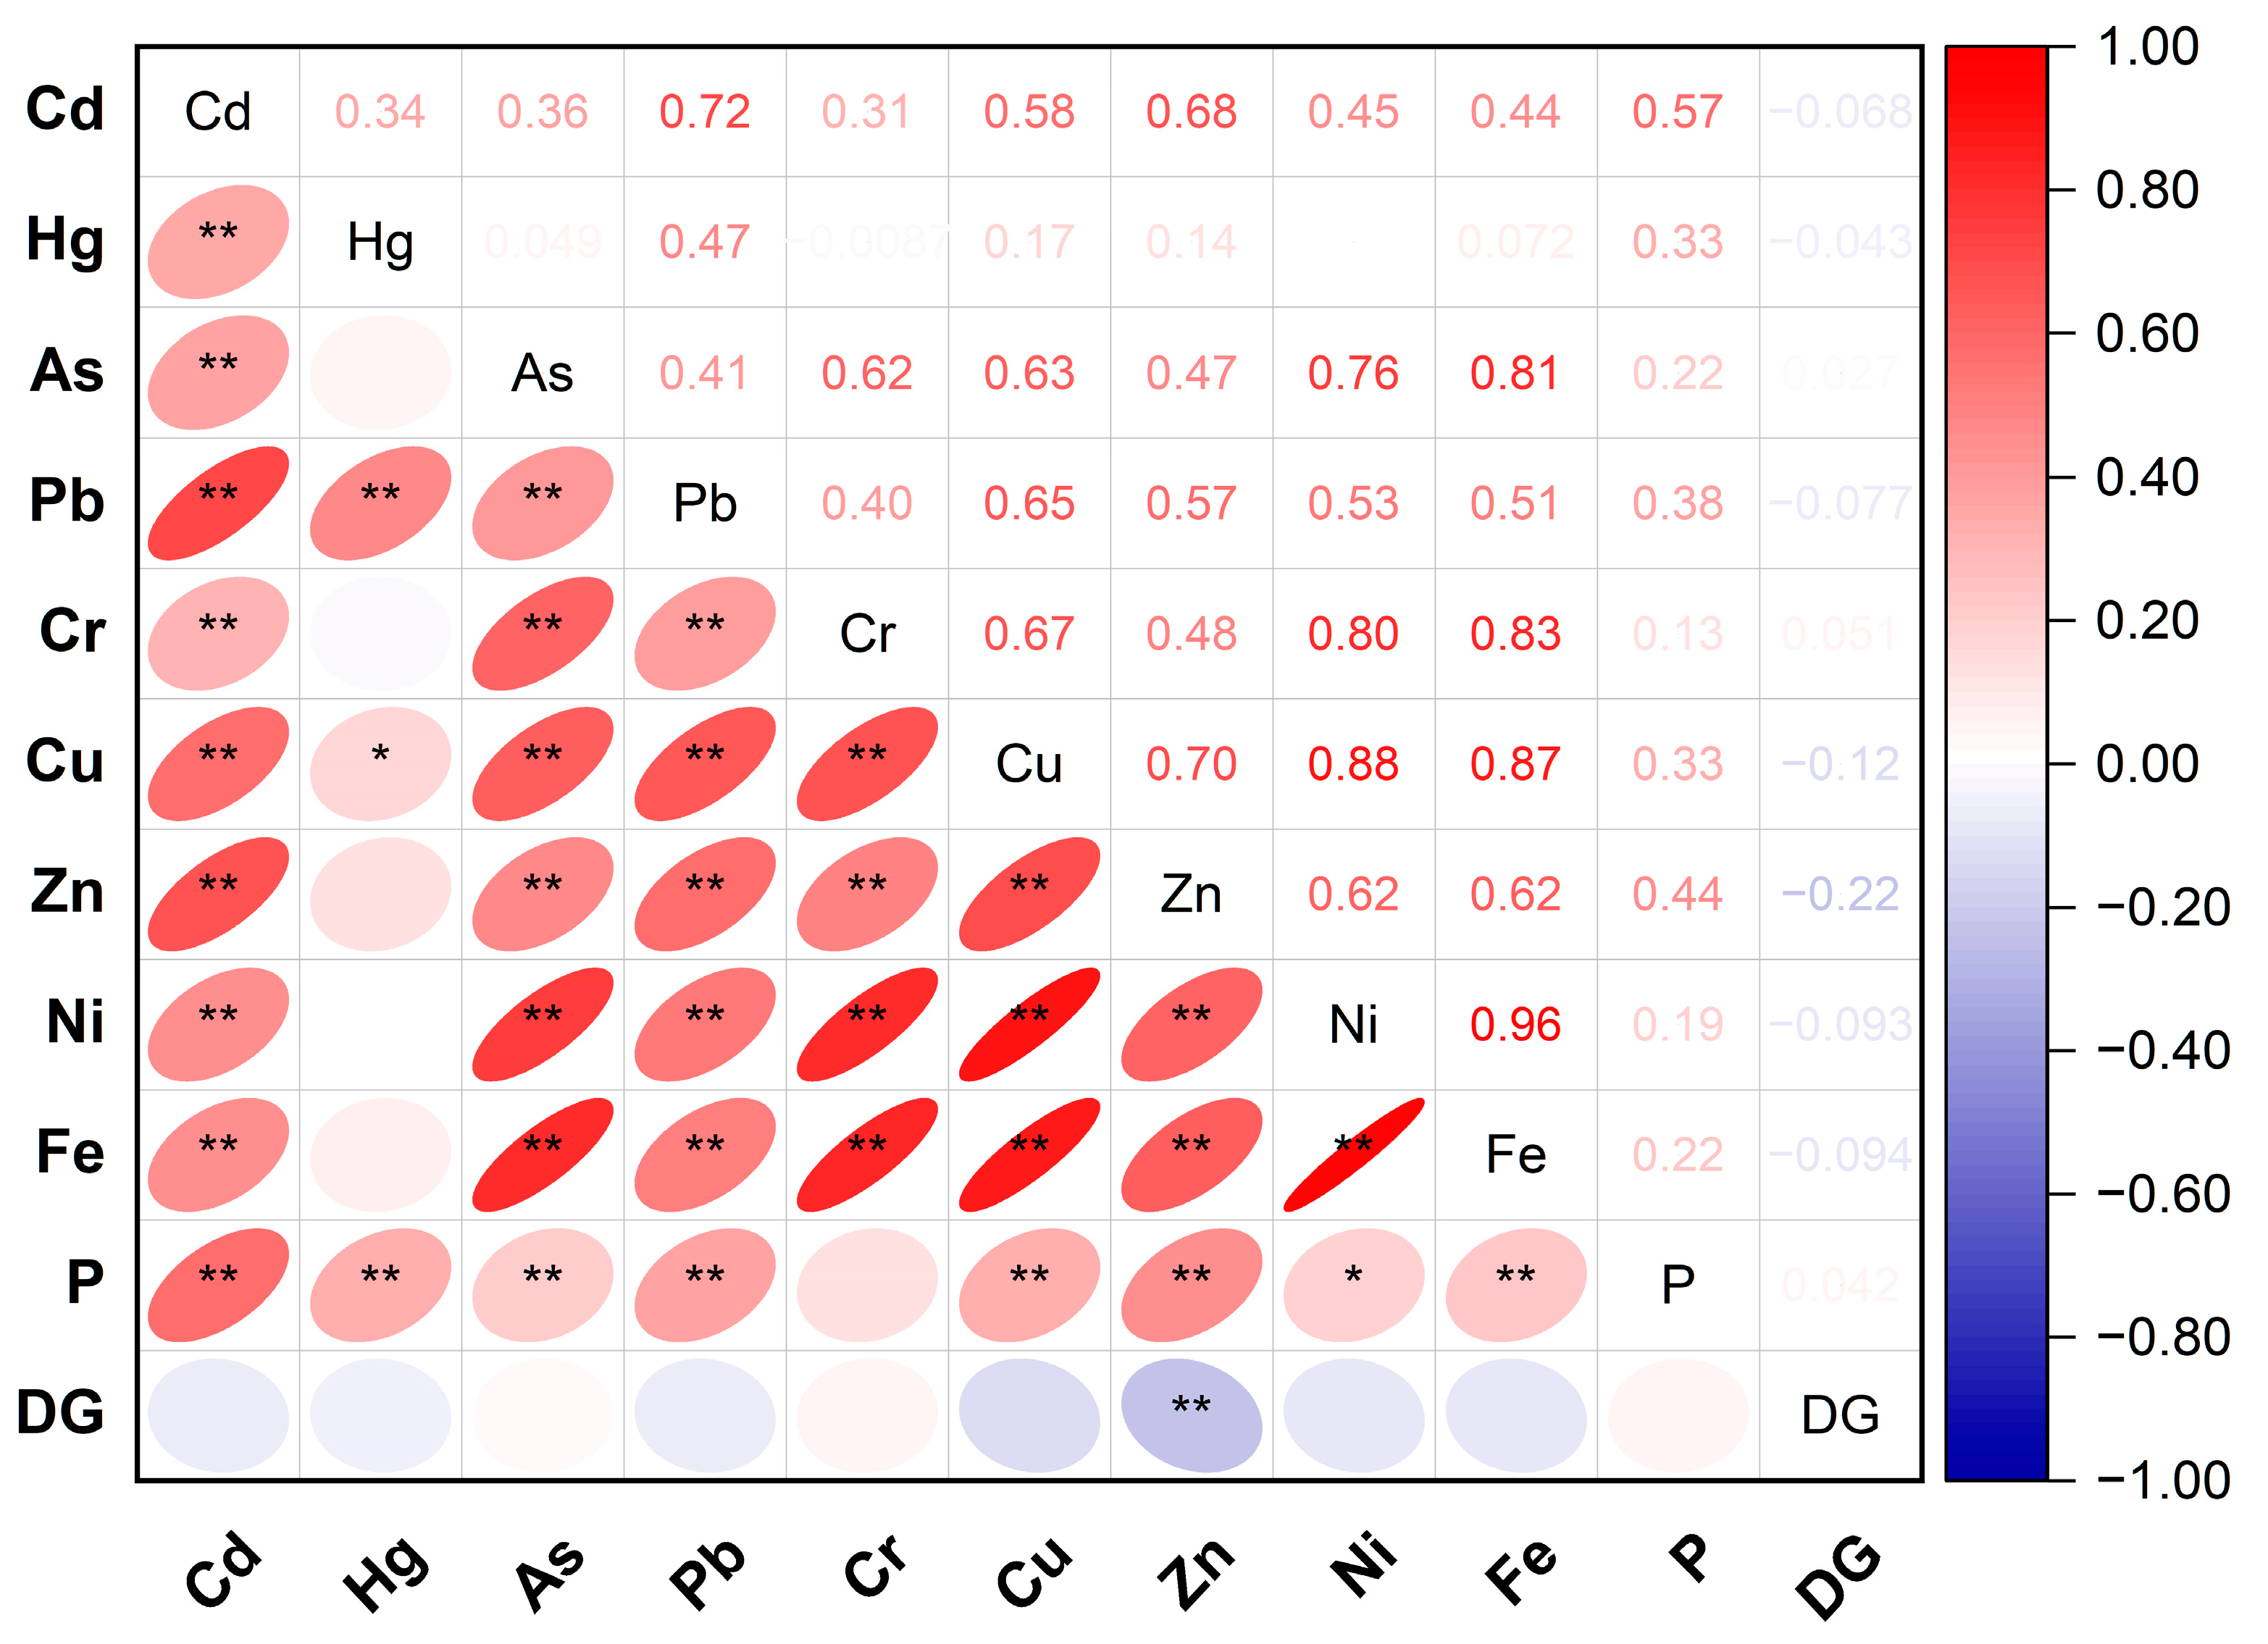
After examining the characteristics of heavy metal pollution in the soil, identifying the sources of heavy metals becomes a crucial prerequisite for preventing and controlling soil contamination. We performed a correlation analysis of heavy metal elements (refer to Figure 5), and the results reveal that, except for Hg, the other heavy metal elements display positive correlations, with high correlation coefficients (p ≤ 0.01). This implies that these elements in the farmland soil of the study area may share similar sources and migration pathways. Fe is significantly and positively correlated with Cd, As, Pb, Cr, Cu, Zn, and Ni (p ≤ 0.01), with correlation coefficients exceeding 0.8 for As, Cr, Cu, and Ni. This suggests a common source for these heavy metal elements with Fe. Cd and Zn exhibit significant positive correlations with P (p ≤ 0.01), and correlation coefficients surpassing 0.4 indicate a potential association among Cd, Pb, and P sources. DG shows a significant negative correlation with Zn (p ≤ 0.01), implying that the Zn content in farmland soil decreases with increasing distance from zinc-plating enterprises. This further underscores Zn as a noteworthy point-source pollutant in the farmland soil of the study area.
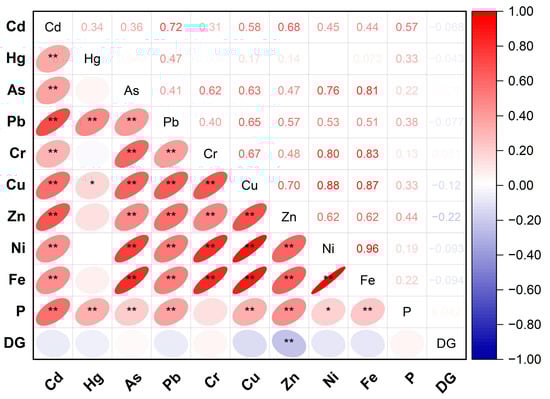
Figure 5.
Correlation analysis of elements and relevant parameters. Note: * p ≤ 0.05; ** p ≤ 0.01; DG: the distance from the nearby zinc-plating enterprises.
3.3. Principal Component Analysis (PCA)
To better uncover the inherent relationships between heavy metal elements in the soil and identify their sources, principal component analysis (PCA) was employed to further analyze the heavy metal content in the study area. The data successfully passed the Kaiser–Meyer–Olkin (KMO) test, with a KMO coefficient of 0.792, indicating a strong correlation among the various heavy metal elements and rendering them suitable for PCA [34,35].
As depicted in Table 2, four principal components (PCs) were extracted from the heavy metals, collectively explaining 85.74% of the total data variance. The most prominent principal component (PC1) exhibited the highest variance (52.08%), with As, Cr, Cu, and Ni showing relatively high positive and negative loads with similar values. The second principal component (PC2) was primarily influenced by Cd, Pb, and Cu, accounting for 17.67% of the total data variance. PC3 and PC4 were mainly associated with Hg and Zn, contributing to 9.66% and 6.32% of the total data variance, respectively.
Table 2.
Rotated composition matrix of heavy metal data in agricultural soil of the study area.
3.4. Positive Matrix Factorization (PMF)
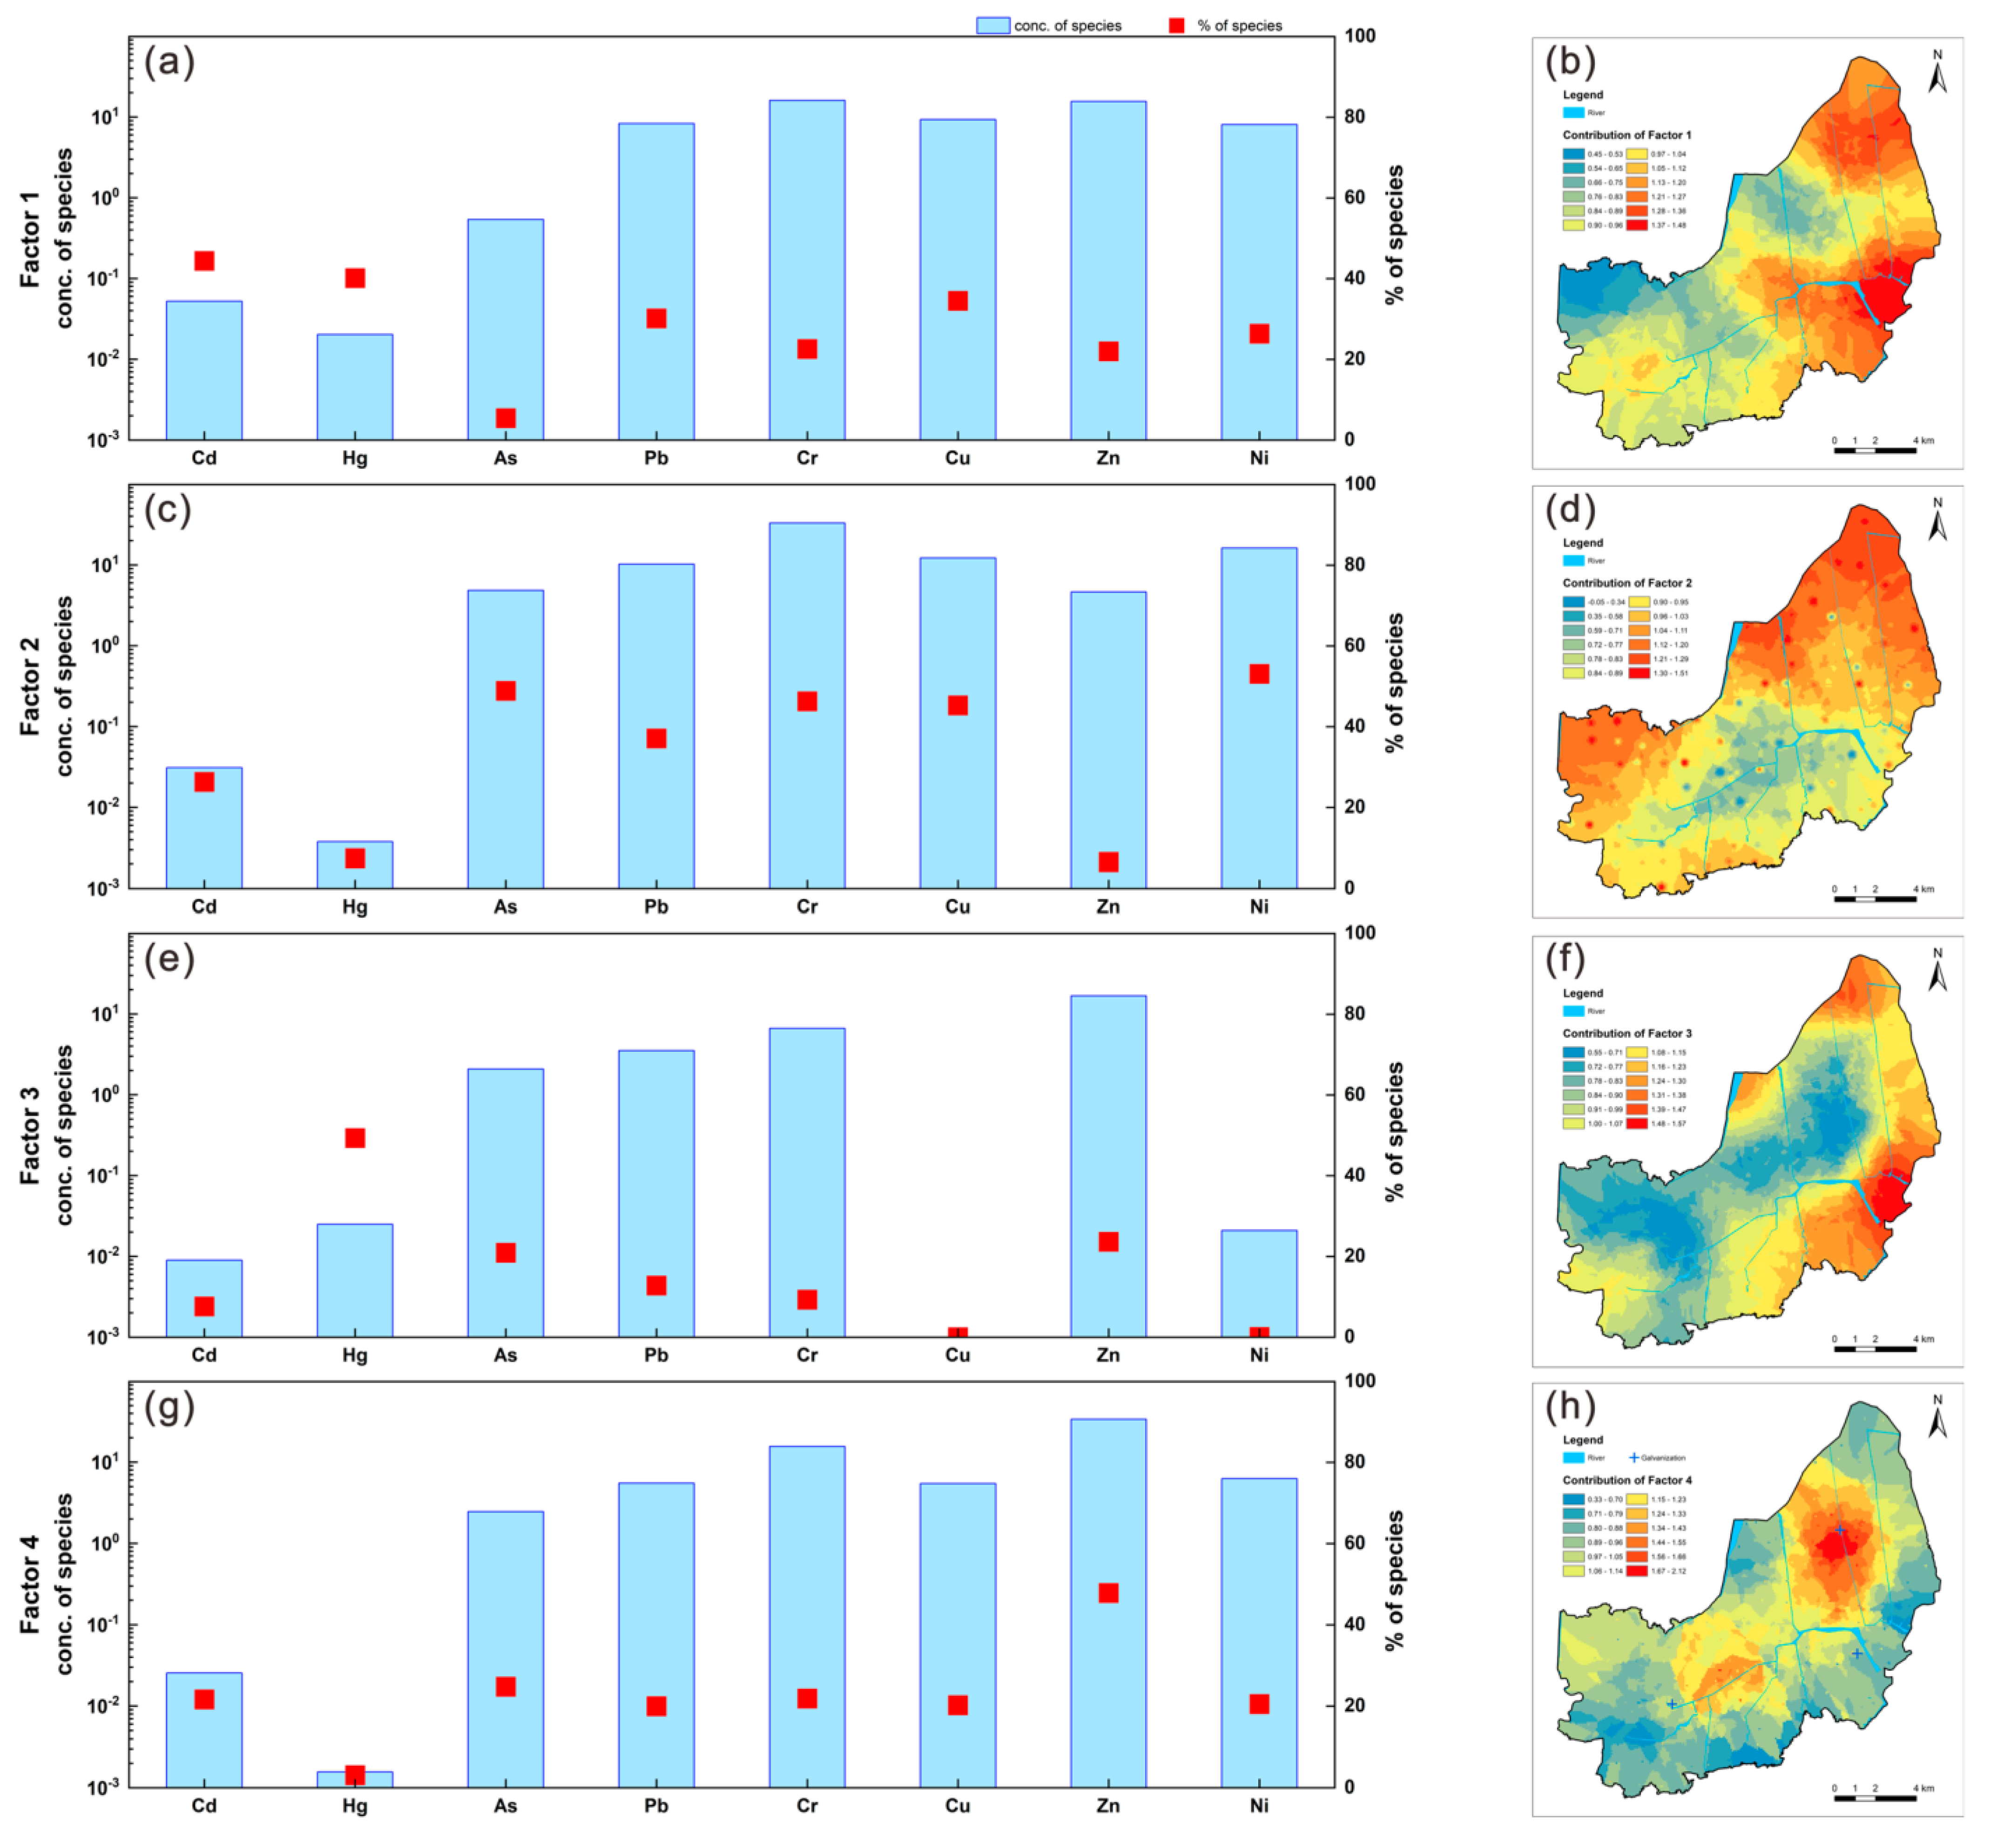
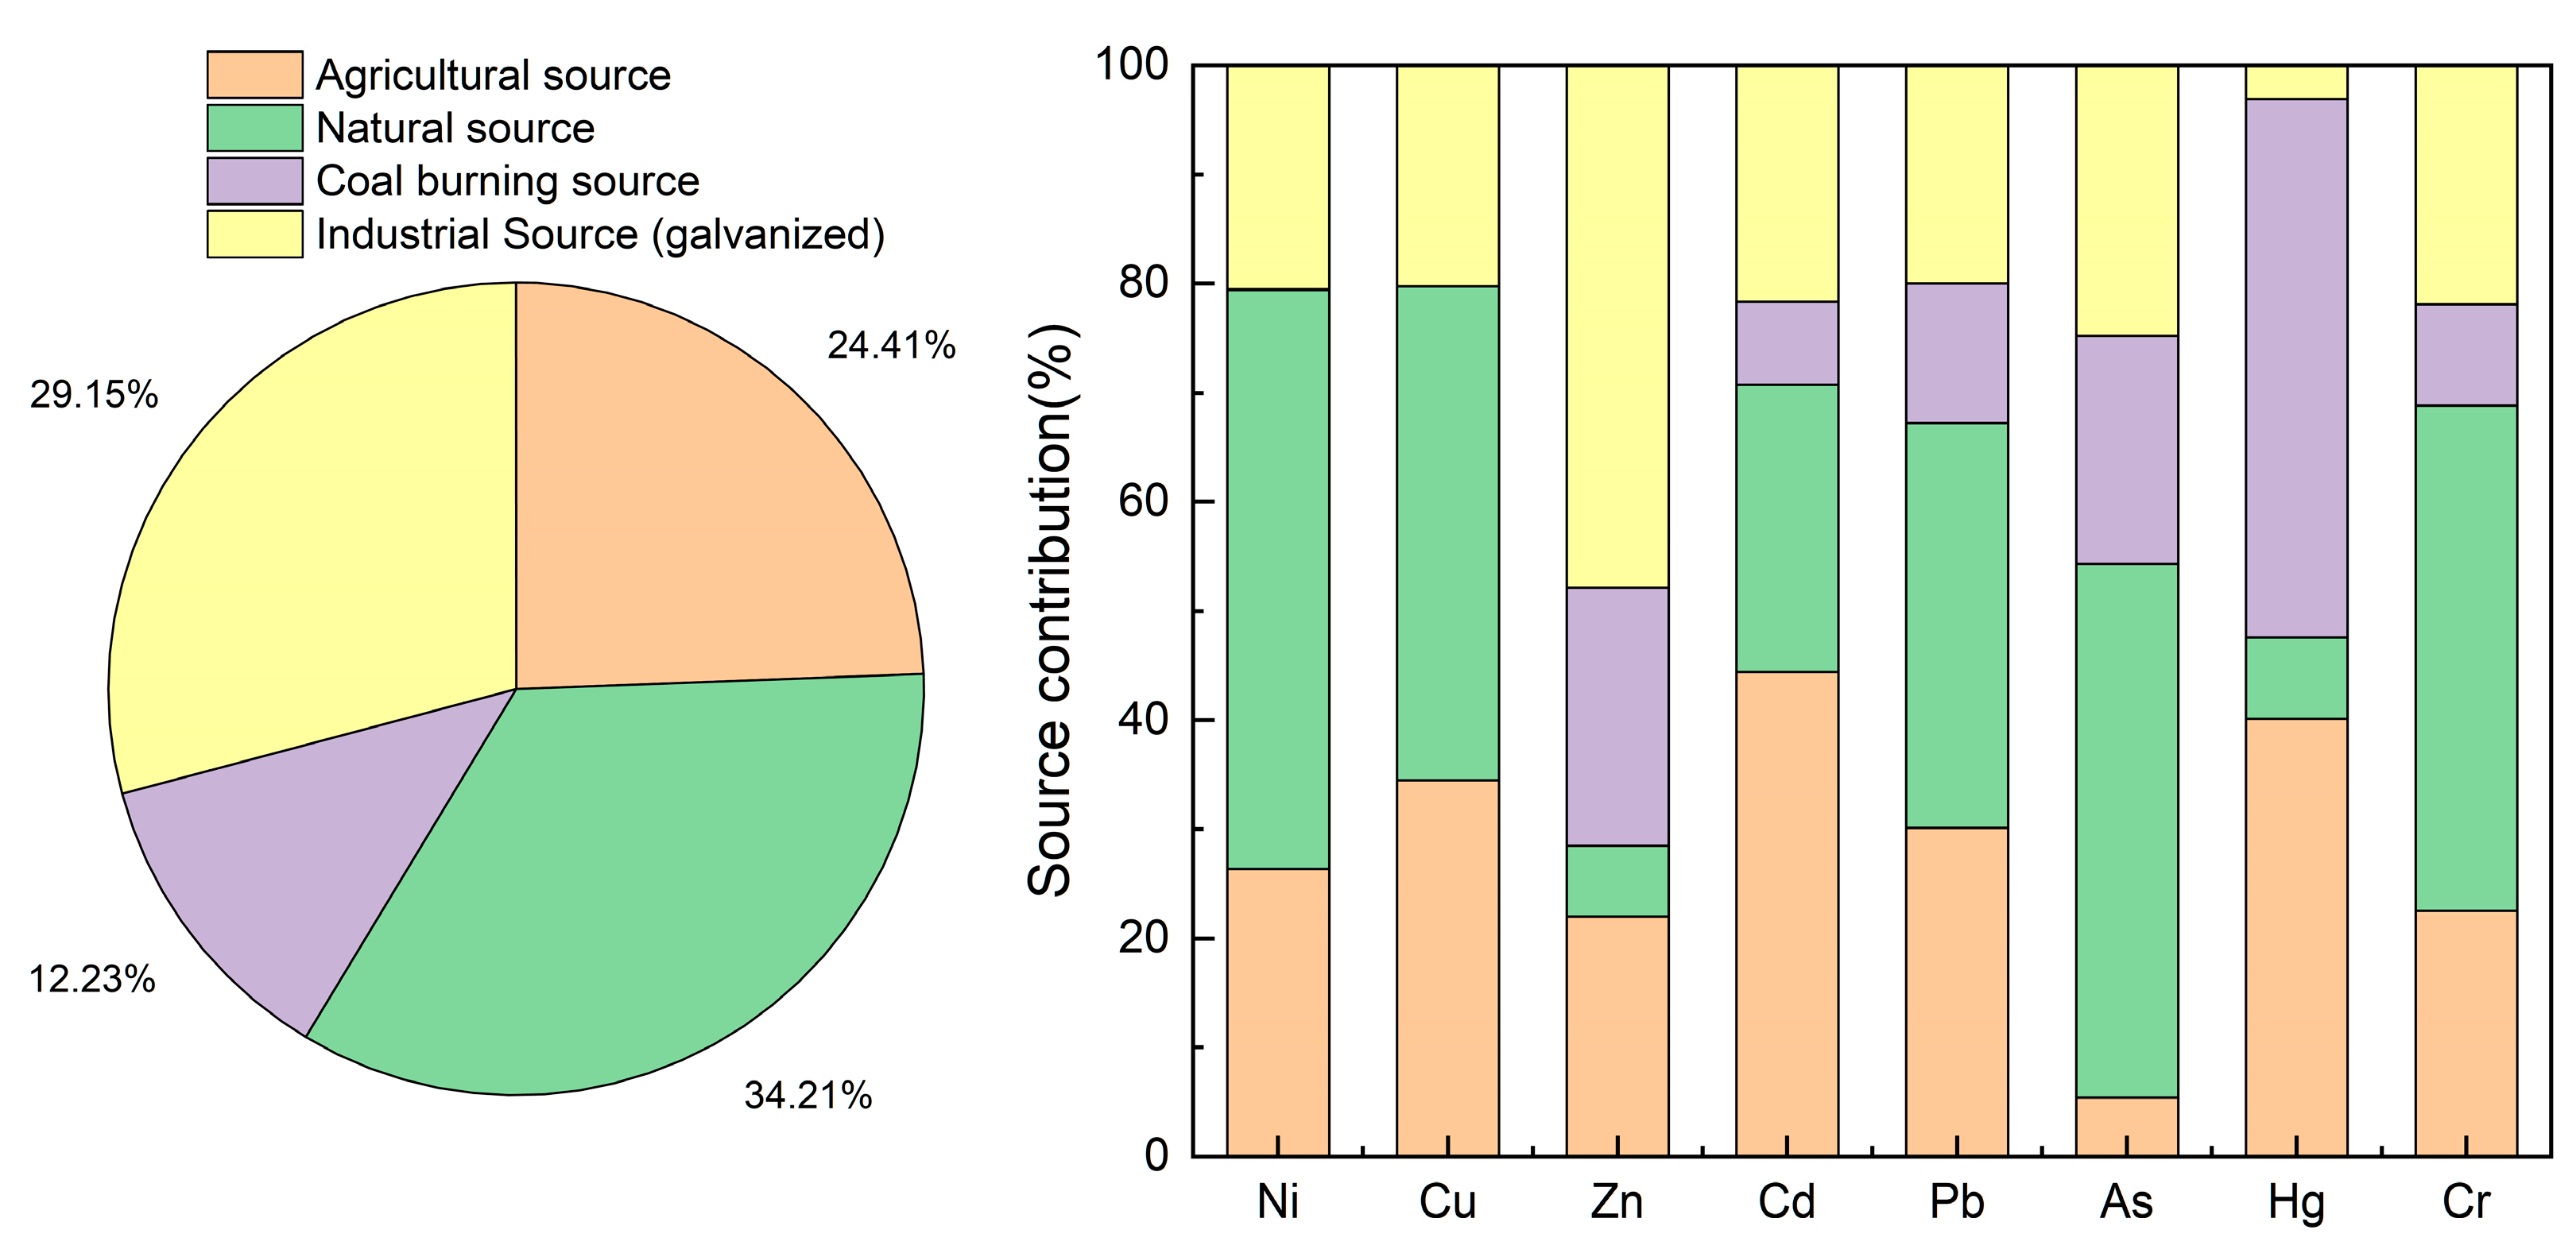
The PMF model was employed to identify the sources of heavy metals in the soil and quantify their contributions. In practical applications, PCA is often utilized to determine the optimal number of factors before conducting PMF analysis [36]. Accordingly, based on the Varimax-rotated principal component analysis results, the factor number for the model was set to 4, with random seed values and 20 runs. Under these settings, Q (true) remained stable and approximated Q (robust), while the signal-to-noise ratio ranged between 6.0 and 10.0, with the majority of residuals falling within the −3 to 3 range. Moreover, the determination coefficient between observed and predicted values for heavy metals ranged from 0.476 to 0.997, indicating the reliability of the PMF model and its ability to better elucidate the sources of heavy metals. The contribution and spatial analysis of each source factor to heavy metal concentrations are illustrated in Figure 6, with heavy metals exhibiting high loading factors considered representative in source apportionment. Factor 1 (F1) was dominated by Cd, Hg, and Cu, with contribution rates of 44.4%, 40.1%, and 34.5%, respectively. Factor 2 (F2) was primarily associated with Ni, As, Cr, and Cu, contributing rates of 53.1%, 48.9%, 46.3%, and 45.3%, respectively. Factor 3 (F3) and Factor 4 (F4) were mainly characterized by Hg and Zn, contributing rates of 49.3% and 47.8%, respectively.
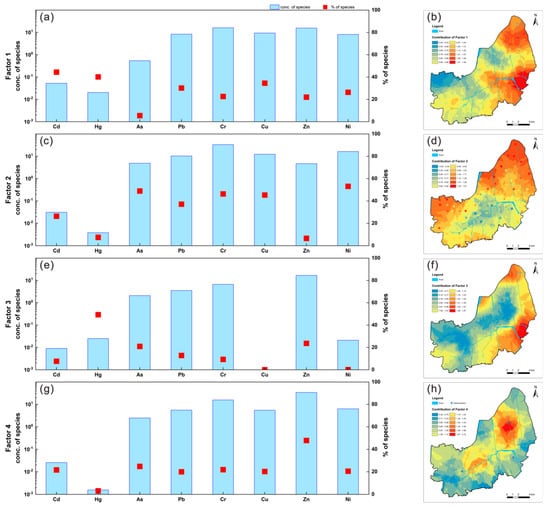
Figure 6.
Source apportionment based on PMF model: content and percentage contributions of each heavy metal from different sources (a,c,e,g) and spatial variations based on standardized contributions from four sources (b,d,f,h).
3.5. Comprehensive Source Apportionment of Soil Heavy Metals
Through the integration of PCA and PMF methods, heavy metal elements were categorized into natural sources caused by parent material weathering, agricultural sources related to fertilizer application, coal combustion sources, and industrial sources associated with galvanizing activities. The following will provide a detailed description of their characteristics.
3.5.1. Natural Sources (PC1 in PCA and F2 in PMF)
Both PC1 in principal component analysis (PCA) and Factor 2 (F2) in positive matrix factorization (PMF) were characterized by Ni, As, Cr, and Cu as predominant elements. These elements exhibited a relatively uniform spatial distribution, with average concentrations below their background values (refer to Table 1). Moreover, they are recognized as constituents widely present in soil genesis processes due to factors such as soil parent material [37,38]. The results suggest that external pollution sources, including industrial production and other anthropogenic factors, have relatively low contributions to Ni, As, Cr, and Cu. Additionally, correlation analysis indicated significant positive correlations (p ≤ 0.01) between Ni, As, Cr, Cu, and Fe, with correlation coefficients exceeding 0.8. Given that Fe serves as a structural element in terrestrial aluminosilicates and is controlled by soil parent material and soil development, it is typically considered an indicator element for natural soil sources [39]. Therefore, the presence of Ni, As, Cr, and Cu in the soil is likely attributed to the weathering of the parent material and subsequent soil processes. Therefore, Ni, As, Cr, and Cu in the soil are likely induced by soil weathering and other natural factors [22]. It can be considered that PC1 and F2 are natural sources resulting from parent material weathering.
3.5.2. Agricultural Sources (PC2 in PCA and F1 in PMF)
PC2 in PCA and Factor 1 (F1) in PMF were primarily associated with Cd and Cu. Given the focus on farmland soil in this study area, extensive agricultural activities involving the use of fertilizers and pesticides have occurred over the past few decades. Correlation analysis indicated significant positive correlations (p ≤ 0.01) between Cd, Cu, Zn, and P. Cadmium, as a companion metal to phosphorus, inevitably exists in phosphate fertilizers [40,41]. Therefore, continuous use of phosphate fertilizers can lead to excessive accumulation of cadmium in agricultural soil. Similarly, the extensive use of copper-based pesticides and fungicides can introduce substantial amounts of copper into farmland soil [42]. Studies by Liu, Wu [43] along the lower reaches of the Yangtze River, Liu, Zhang [5] in Shandong, and Guo, Li [44] in southeastern Yunnan have all indicated that Cd and Cu are primarily controlled by agricultural sources. Thus, PC2 and F1 can be considered indicative of agricultural sources.
3.5.3. Coal Combustion Sources (PC3 in PCA and F3 in PMF)
PC3 in PCA and Factor 3 (F3) in PMF were mainly associated with Hg. The coefficient of variation for Hg was at a moderate level, indicating its susceptibility to anthropogenic or other natural sources. Correlation analysis revealed a significant positive correlation (p ≤ 0.01) between Hg and Pb. Previous studies have suggested that the significant sources of mercury and lead accumulation in soil are industrial activities such as fossil fuel combustion and cement production, with enrichment occurring through atmospheric deposition. Mercury and lead contents in Chinese coal are relatively high, at approximately 0.35 and 35.7 mg/kg, respectively [45]. Moreover, it has been reported that approximately 40% of the external mercury input into Chinese agricultural soil comes from coal combustion, accounting for over 70% of the total atmospheric mercury input [18]. Studies by Wang, Wu [46], and Shi, Liu [47] have emphasized that the enrichment of soil Hg and Pb mainly results from atmospheric deposition associated with coal combustion. The high volatility of mercury makes it easily enter flue gas, ultimately leading to the accumulation of mercury in agricultural soil through atmospheric deposition [48]. Through field investigations and data collection, it was found that the annual average coal consumption in Gaoyou City exceeded 500,000 tons in 2015 and 2016. Despite a reduction in coal consumption of 200,000 tons since the initiation of the coal reduction action in 2017, the cumulative burning of coal over the years has led to the accumulation of mercury and lead in farmland soil in the study area. Therefore, PC3 and F3 can be considered indicative of coal combustion sources.
3.5.4. Industrial Sources (PC4 in PCA and F4 in PMF)
PC4 in PCA and Factor 4 (F4) in PMF were primarily associated with Zn. Correlation analysis indicated a significant negative correlation (p ≤ 0.01) between Zn and DG, suggesting that the enrichment of Zn is related to the production activities of zinc-plating enterprises. Based on the spatial distribution of F4 (refer to Figure 6h), high values of F4 were concentrated around large zinc-plating enterprises.
In the comprehensive assessment of heavy metal pollution in agricultural soils within the study area, approximately 65.79% of the contamination is attributed to anthropogenic activities, while the remaining 34.21% is attributed to parent material weathering. Among the anthropogenic sources, agricultural practices, coal combustion, and zinc-plating industrial activities contribute 24.41%, 12.23%, and 29.15% to the total pollution, respectively (refer to Figure 7). Cadmium and copper are linked to agricultural activities, while mercury is primarily derived from atmospheric deposition during coal combustion. Zinc is likely associated with zinc-plating industrial activities, whereas chromium, nickel, and arsenic primarily originate from natural sources. This comprehensive breakdown provides valuable insights into the major contributors to heavy metal pollution in the agricultural soils of the study area.
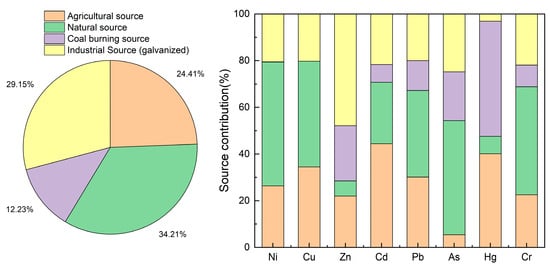
Figure 7.
Contribution of heavy metal sources in surface soil of the study area according to the PMF model.
In conclusion, the consistency observed among the results obtained from correlation analysis, PCA, and PMF enhances the robustness of the identified sources of heavy metals in the study area. PMF, in particular, emerges as a valuable tool for quantifying the contribution rates of distinct sources. Therefore, a comprehensive approach integrating various methods, such as correlation analysis, PCA, and PMF, can be employed stepwise for in-depth soil heavy metal source analysis. Correlation analysis and PCA contribute to a qualitative understanding of different sources, providing valuable insights for determining appropriate factor numbers in PMF. Subsequently, PMF allows for the quantitative assessment of the contribution rates from different sources. This methodological integration is advantageous for enhancing the accuracy of source apportionment results.
3.6. Simulation of Zinc Accumulation in Soil from Zinc-Plating Industrial Emissions
As indicated in the preceding analysis, industrial activities contribute significantly to heavy metal contamination in agricultural soils in the study area, including both coal combustion and industrial emissions. However, our on-site investigation revealed that coal combustion facilities throughout the entire study region have undergone renovation, eliminating substantial coal consumption. Consequently, this section focuses on the investigation of industrial point sources, specifically those represented by zinc-plating enterprises. Simulating the transport and contribution of zinc from atmospheric deposition to soil under different scenarios can provide insights to aid decision-makers in formulating appropriate policies for atmospheric heavy metal emissions. We have selected three major zinc-plating enterprises within the study area as point sources for emissions (refer to Figure 1) and predicted the contribution of zinc accumulation in agricultural soils from atmospheric emissions by these enterprises over the next 20 years under eight scenarios (A–H).
Figure 8 illustrates the predicted growth rates of zinc in soil under the eight scenarios (A–H), categorized by distance from zinc-plating enterprises into six groups (0–1 km, 1–1.5 km, 1.5–2 km, 2–2.5 km, 2.5–3 km, and >3 km). The results demonstrate a positive correlation between the predicted growth rate of zinc in soil and distance across all eight scenarios. As the distance increases, the growth rate of zinc gradually decreases, with a significant decline observed when the distance exceeds 1.5 km. Based on this finding, it is recommended to focus monitoring efforts on areas within 1.5 km to gain a comprehensive understanding of the dynamic impact of zinc-plating enterprise atmospheric emissions on surrounding soil zinc levels. This aids in accurately monitoring zinc pollution sources and implementing corresponding environmental protection measures.
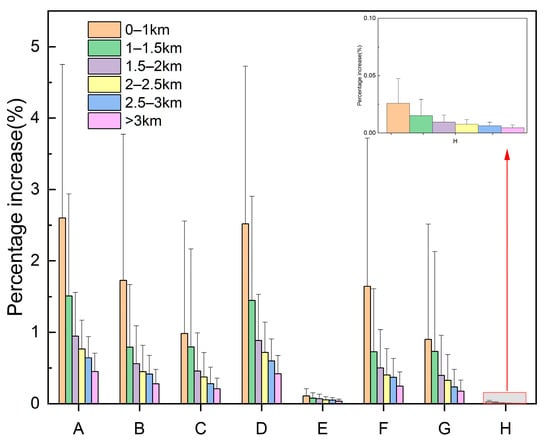
Figure 8.
Prediction of zinc accumulation contribution in farmland soil within different distances over the next 20 years based on atmospheric transport models for eight scenarios of zinc emissions from galvanizing enterprises.
Scenario H, where all three enterprises have dust removal equipment, exhibits the lowest soil zinc growth rate, indicating a significant inhibitory effect on zinc emissions into soil when comprehensive dust removal measures are implemented in environmental management. Conversely, Scenario A, where none of the three enterprises have dust removal equipment, shows a relatively higher zinc growth rate, suggesting more severe soil zinc pollution in the absence of proper environmental measures. However, in environmental protection decision making, it is crucial to balance ecological effects with economic benefits. When dust removal equipment is installed in only one enterprise (Scenario C), it has a lower zinc growth rate compared to Scenarios B and D. Similarly, when two enterprises have dust removal equipment (Scenario E), it exhibits a significantly lower zinc growth rate compared to Scenarios F and G. Therefore, the predictive results suggest that formulating scientifically sound environmental strategies is essential for simultaneously balancing economic benefits while ensuring soil quality and ecological health.
4. Conclusions
Although the average concentrations of heavy metals in the soil of the study area are generally below the relevant national environmental standards, accumulations of Cd, Hg, Pb, Cu, and Zn are still observed. Through a comprehensive analysis involving correlation analysis, principal component analysis, positive matrix factorization, and spatial statistical methods, four main sources of heavy metals in the soil of the study area have been identified. These sources include natural sources associated with parent material, agricultural sources related to fertilization, coal combustion sources, and industrial sources associated with zinc-plating activities. Among them, agricultural activities contribute significantly to Cd and Cu, coal combustion is primarily associated with Hg, and zinc-plating industrial activities are the main contributors to Zn in farmland soil. Subsequently, based on whether zinc-plating enterprises utilized dust removal equipment, eight scenarios were established to predict the soil Zn growth rate over the next 20 years. The results showed a significant decrease in the growth rate of Zn in soil when the distance exceeded 1.5 km. This provides a clear basis for environmental protection decision making, suggesting a focus on monitoring areas within 1.5 km to gain a comprehensive understanding of the impact of zinc-plating enterprise atmospheric emissions on surrounding soil Zn, enabling the implementation of economically effective environmental protection measures in line with prevention and control objectives.
We established a progressive source apportionment method by integrating PCA and PMF, demonstrating good applicability and accuracy. This method revealed the characteristics of soil heavy metal pollution under the joint influence of human and natural factors. To better manage and prevent soil heavy metal pollution, future environmental protection decisions should comprehensively consider the sources, pollution levels, distance factors, and economic feasibility of environmental protection measures for different heavy metals. This approach facilitates the formulation of scientifically sound environmental strategies, achieving a balance between economic benefits and ecological health. The comprehensive research methodology presented in this study serves as a valuable reference for addressing similar issues in other regions.
Author Contributions
Conceptualization, C.Q. and M.X.; methodology, C.L.; software, B.Y.; validation, M.X., J.L. and C.Q.; formal analysis, C.Q.; investigation, Z.J. and C.Q.; resources, B.G.; data curation, S.L.; writing—original draft preparation, C.Q.; writing—review and editing, M.X., J.L. and C.Q.; visualization, C.Q., B.Y. and C.L.; supervision, J.L.; project administration, M.X. and B.G. All authors have read and agreed to the published version of the manuscript.
Funding
This work was financially supported by the Special Funds for Geological Exploration of Jiangsu Province (Grant No. 202006047D1S).
Data Availability Statement
The data presented in this study are available in the article.
Acknowledgments
We extend our sincere gratitude to Ding Zhichao for his invaluable assistance in the field sampling work. We also appreciate the support and contributions of Zang Huihui in data collection and model execution.
Conflicts of Interest
The authors declare no conflicts of interest.
References
- Yang, Q.; Li, Z.; Lu, X.; Duan, Q.; Huang, L.; Bi, J. A review of soil heavy metal pollution from industrial and agricultural regions in China: Pollution and risk assessment. Sci. Total Environ. 2018, 642, 690–700. [Google Scholar] [CrossRef] [PubMed]
- Safari, Y.; Delavar, M.-A. The influence of soil pollution by heavy metals on the land suitability for irrigated wheat farming in Zanjan region, northwest Iran. Arab. J. Geosci. 2019, 12, 21. [Google Scholar] [CrossRef]
- Zeng, S.; Ma, J.; Yang, Y.; Zhang, S.; Liu, G.-J.; Chen, F. Spatial assessment of farmland soil pollution and its potential human health risks in China. Sci. Total Environ. 2019, 687, 642–653. [Google Scholar] [CrossRef] [PubMed]
- Zhang, J.; Hua, P.; Krebs, P. Influences of land use and antecedent dry-weather period on pollution level and ecological risk of heavy metals in road-deposited sediment. Environ. Pollut. 2017, 228, 158–168. [Google Scholar] [CrossRef] [PubMed]
- Liu, H.; Zhang, Y.; Yang, J.; Wang, H.; Li, Y.; Shi, Y.; Li, D.; Holm, P.E.; Ou, Q.; Hu, W. Quantitative source apportionment, risk assessment and distribution of heavy metals in agricultural soils from southern Shandong Peninsula of China. Sci. Total Environ. 2021, 767, 144879. [Google Scholar] [CrossRef] [PubMed]
- Shi, J.; Zhao, D.; Ren, F.; Huang, L. Spatiotemporal variation of soil heavy metals in China: The pollution status and risk assessment. Sci. Total Environ. 2023, 871, 161768. [Google Scholar] [CrossRef]
- Wu, H.; Xu, C.; Wang, J.; Xiang, Y.; Ren, M.; Qie, H.; Zhang, Y.; Yao, R.; Li, L.; Lin, A. Health risk assessment based on source identification of heavy metals: A case study of Beiyun River, China. Ecotoxicol. Environ. Saf. 2021, 213, 112046. [Google Scholar] [CrossRef]
- Ren, S.; Song, C.; Ye, S.; Cheng, C.; Gao, P. The spatiotemporal variation in heavy metals in China’s farmland soil over the past 20 years: A meta-analysis. Sci. Total Environ. 2022, 806, 150322. [Google Scholar] [CrossRef]
- Fei, X.; Lou, Z.; Christakos, G.; Ren, Z.; Liu, Q.; Lv, X. The association between heavy metal soil pollution and stomach cancer: A case study in Hangzhou City, China. Environ. Geochem. Health 2018, 40, 2481–2490. [Google Scholar] [CrossRef]
- Huang, J.; Guo, S.; Zeng, G.-M.; Li, F.; Gu, Y.; Shi, Y.; Shi, L.; Liu, W.; Peng, S. A new exploration of health risk assessment quantification from sources of soil heavy metals under different land use. Environ. Pollut. 2018, 243, 49–58. [Google Scholar] [CrossRef] [PubMed]
- Sun, L.; Liao, X.; Yan, X.; Zhu, G.; Ma, D. Evaluation of heavy metal and polycyclic aromatic hydrocarbons accumulation in plants from typical industrial sites: Potential candidate in phytoremediation for co-contamination. Environ. Sci. Pollut. Res. 2014, 21, 12494–12504. [Google Scholar] [CrossRef] [PubMed]
- Sun, L.; Guo, D.; Liu, K.; Meng, H.; Zheng, Y.; Yuan, F.; Zhu, G. Levels, sources, and spatial distribution of heavy metals in soils from a typical coal industrial city of Tangshan, China. CATENA 2019, 175, 101–109. [Google Scholar] [CrossRef]
- Zhang, J.; Li, R.; Zhang, X.; Bai, Y.; Cao, P.; Hua, P. Vehicular contribution of PAHs in size dependent road dust: A source ap-portionment by PCA-MLR, PMF, and Unmix receptor models. Sci. Total Environ. 2019, 649, 1314–1322. [Google Scholar] [CrossRef] [PubMed]
- Liao, S.; Jin, G.; Khan, M.A.; Zhu, Y.; Duan, L.; Luo, W.; Jia, J.; Zhong, B.; Ma, J.; Ye, Z.; et al. The quantitative source apportionment of heavy metals in peri-urban agricultural soils with UNMIX and input fluxes analysis. Environ. Technol. Innov. 2021, 21, 101232. [Google Scholar] [CrossRef]
- Guan, Q.; Zhao, R.; Pan, N.; Wang, F.; Yang, Y.; Luo, H. Source apportionment of heavy metals in farmland soil of Wuwei, China: Comparison of three receptor models. J. Clean. Prod. 2019, 237, 117792. [Google Scholar] [CrossRef]
- Song, L.; Dai, Q.; Feng, Y.; Hopke, P.K. Estimating uncertainties of source contributions to PM(2.5) using moving window evolving dispersion normalized PMF. Environ. Pollut. 2021, 286, 117576. [Google Scholar] [CrossRef] [PubMed]
- Dong, B.; Zhang, R.; Gan, Y.; Cai, L.; Freidenreich, A.; Wang, K.; Guo, T.; Wang, H. Multiple methods for the identification of heavy metal sources in cropland soils from a resource-based region. Sci. Total Environ. 2019, 651, 3127–3138. [Google Scholar] [CrossRef]
- Fei, X.; Lou, Z.; Xiao, R.; Ren, Z.; Lv, X. Source analysis and source-oriented risk assessment of heavy metal pollution in agricultural soils of different cultivated land qualities. J. Clean. Prod. 2022, 341, 130942. [Google Scholar] [CrossRef]
- Fei, X.; Lou, Z.; Xiao, R.; Ren, Z.; Lv, X. Contamination assessment and source apportionment of heavy metals in agricultural soil through the synthesis of PMF and GeogDetector models. Sci. Total Environ. 2020, 747, 141293. [Google Scholar] [CrossRef]
- Zheng, J.; Wang, P.; Shi, H.; Zhuang, C.; Deng, Y.; Yang, X.; Huang, F.; Xiao, R. Quantitative source apportionment and driver identification of soil heavy metals using advanced machine learning techniques. Sci. Total Environ. 2023, 873, 162371. [Google Scholar] [CrossRef]
- DZ/T 0130–2006; The Specification of Testing Quality Management for Geological Laboratories. Ministry of Land and Resources of the People’s Republic of China: Beijing, China, 2006.
- Fei, X.; Christakos, G.; Lou, Z.; Xiao, R.; Lv, X.; Ren, Z. Assessment and source apportionment of toxic metal in soils using integrated positive matrix factorization and Bayesian maximum entropy: A case study in Z county, southeastern China. Ecolog. Indic. 2022, 145, 109647. [Google Scholar] [CrossRef]
- Wu, Q.; Hu, W.; Wang, H.; Liu, P.; Wang, X.; Huang, B. Spatial distribution, ecological risk and sources of heavy metals in soils from a typical economic development area, Southeastern China. Sci. Total Environ. 2021, 780, 146557. [Google Scholar] [CrossRef]
- Kowalska, J.B.; Mazurek, R.; Gąsiorek, M.; Zaleski, T. Pollution indices as useful tools for the comprehensive evaluation of the degree of soil contamination—A review. Environ. Geochem. Health 2018, 40, 2395–2420. [Google Scholar] [CrossRef] [PubMed]
- CEMS (China Environmental Monitoring Station). Soil Element Background Values of China; China Environmental Science Press: Beijing, China, 1990. [Google Scholar]
- Cheng, Z.; Chen, L.-J.; Li, H.-H.; Lin, J.-Q.; Yang, Z.-B.; Yang, Y.-X.; Xu, X.-X.; Xian, J.-R.; Shao, J.-R.; Zhu, X.-M. Characteristics and health risk assessment of heavy metals exposure via household dust from urban area in Chengdu, China. Sci. Total Environ. 2018, 619–620, 621–629. [Google Scholar] [CrossRef] [PubMed]
- Paatero, P. The multilinear engine—A table-driven, least squares program for solving multilinear problems, including the n-way parallel factor analysis model. J. Comput. Graph. Stat. 1999, 8, 854–888. [Google Scholar]
- Yang, S.; Yang, D.; Taylor, D.; He, M.; Liu, X.; Xu, J. Tracking cadmium pollution from source to receptor: A health-risk focused transfer continuum approach. Sci. Total Environ. 2023, 867, 161574. [Google Scholar] [CrossRef]
- Zeng, W.; Wan, X.; Gu, G.; Lei, M.; Yang, J.; Chen, T. An interpolation method incorporating the pollution diffusion character-istics for soil heavy metals—Taking a coke plant as an example. Sci. Total Environ. 2023, 857, 159698. [Google Scholar] [CrossRef]
- Liu, P.; Wu, Q.; Hu, W.; Tian, K.; Huang, B.; Zhao, Y. Effects of atmospheric deposition on heavy metals accumulation in agri-cultural soils: Evidence from field monitoring and Pb isotope analysis. Environ. Pollut. 2023, 330, 121740. [Google Scholar] [CrossRef]
- GB 15618–2018; Soil Environmental Quality Risk Control Standard for Soil Contamination of Agricultural Land. China Environmental Monitoring Station: Beijing, China, 2018.
- Jiang, Y.; Chao, S.; Liu, J.; Yang, Y.; Chen, Y.; Zhang, A.; Cao, H. Source apportionment and health risk assessment of heavy metals in soil for a township in Jiangsu Province, China. Chemosphere 2017, 168, 1658–1668. [Google Scholar] [CrossRef]
- Swartjes, F.A. Risk-based assessment of soil and groundwater quality in The Netherlands: Standards and remediation urgency. Risk Anal. 1999, 19, 1235–1249. [Google Scholar] [CrossRef]
- Jia, Y.; Wang, L.; Qu, Z.; Yang, Z. Distribution, contamination and accumulation of heavy metals in water, sediments, and freshwater shellfish from Liuyang River, Southern China. Environ. Sci. Pollut. Res. 2017, 25, 7012–7020. [Google Scholar] [CrossRef] [PubMed]
- Ni, S.; Liu, G.; Zhao, Y.; Zhang, C.; Wang, A. Distribution and Source Apportionment of Heavy Metals in Soil around Dexing Copper Mine in Jiangxi Province, China. Sustainability 2023, 15, 1143. [Google Scholar] [CrossRef]
- Yuanan, H.; He, K.; Sun, Z.; Chen, G.; Cheng, H. Quantitative source apportionment of heavy metal(loid)s in the agricultural soils of an industrializing region and associated model uncertainty. J. Hazard. Mater. 2020, 391, 122244. [Google Scholar] [CrossRef]
- Hu, B.; Zhou, Y.; Jiang, Y.; Ji, W.; Fu, Z.; Shao, S.; Li, S.; Huang, M.; Zhou, L.; Shi, Z. Spatio-temporal variation and source changes of potentially toxic elements in soil on a typical plain of the Yangtze River Delta, China (2002–2012). J. Environ. Manag. 2020, 271, 110943. [Google Scholar] [CrossRef]
- Jiang, H.-H.; Cai, L.-M.; Wen, H.-H.; Hu, G.-C.; Chen, L.-G.; Luo, J. An integrated approach to quantifying ecological and human health risks from different sources of soil heavy metals. Sci. Total Environ. 2020, 701, 134466. [Google Scholar] [CrossRef] [PubMed]
- Maher, B.A.; Taylor, R.M. Formation of ultrafine-grained magnetite in soils. Nature 1988, 336, 368–370. [Google Scholar] [CrossRef]
- Park, H.J.; Kim, S.U.; Jung, K.Y.; Lee, S.; Choi, Y.D.; Owens, V.N.; Kumar, S.; Yun, S.W.; Hong, C.O. Cadmium phytoavailability from 1976 through 2016, Changes in soil amended with phosphate fertilizer and compost. Sci. Total Environ. 2021, 762, 143132. [Google Scholar] [CrossRef] [PubMed]
- Carne, G.; Leconte, S.; Sirot, V.; Breysse, N.; Badot, P.-M.; Bispo, A.; Deportes, I.; Dumat, C.; Rivière, G.; Crépet, A. Mass balance approach to assess the impact of cadmium decrease in mineral phosphate fertilizers on health risk: The case-study of French agricultural soils. Sci. Total Environ. 2021, 760, 143374. [Google Scholar] [CrossRef]
- Xie, X.; Liu, Y.; Qiu, H.; Yang, X. Quantifying ecological and human health risks of heavy metals from different sources in farmland soils within a typical mining and smelting industrial area. Environ. Geochem. Health 2023, 45, 5669–5683. [Google Scholar] [CrossRef]
- Liu, P.; Wu, Q.; Wang, X.; Hu, W.; Liu, X.; Tian, K.; Fan, Y.; Xie, E.; Zhao, Y.; Huang, B.; et al. Spatiotemporal variation and sources of soil heavy metals along the lower reaches of Yangtze River, China. Chemosphere 2022, 291, 132768. [Google Scholar] [CrossRef]
- Guo, G.; Li, K.; Zhang, D.; Lei, M. Quantitative source apportionment and associated driving factor identification for soil potential toxicity elements via combining receptor models, SOM, and geo-detector method. Sci. Total Environ. 2022, 830, 154721. [Google Scholar] [CrossRef]
- Wu, H.; Cheng, N.; Chen, P.; Zhou, F.; Fan, Y.; Qi, M.; Shi, J.; Zhang, Z.; Ren, R.; Wang, C.; et al. Integrative risk assessment method via combining geostatistical analysis, random forest, and receptor models for potentially toxic elements in selenium-rich soil. Environ. Pollut. 2023, 337, 122555. [Google Scholar] [CrossRef] [PubMed]
- Wang, J.; Wu, H.; Wei, W.; Xu, C.; Tan, X.; Wen, Y.; Lin, A. Health risk assessment of heavy metal(loid)s in the farmland of megalopolis in China by using APCS-MLR and PMF receptor models: Taking Huairou District of Beijing as an example. Sci. Total Environ. 2022, 835, 155313. [Google Scholar] [CrossRef] [PubMed]
- Shi, X.-M.; Liu, S.; Song, L.; Wu, C.-S.; Yang, B.; Lu, H.-Z.; Wang, X.; Zakari, S. Contamination and source-specific risk analysis of soil heavy metals in a typical coal industrial city, central China. Sci. Total Environ. 2022, 836, 155694. [Google Scholar] [CrossRef] [PubMed]
- Huang, H.; Lin, C.; Yu, R.; Yan, Y.; Hu, G.; Li, H. Contamination assessment, source apportionment and health risk assessment of heavy metals in paddy soils of Jiulong River Basin, Southeast China. RSC Adv. 2019, 9, 14736–14744. [Google Scholar] [CrossRef]
Disclaimer/Publisher’s Note: The statements, opinions and data contained in all publications are solely those of the individual author(s) and contributor(s) and not of MDPI and/or the editor(s). MDPI and/or the editor(s) disclaim responsibility for any injury to people or property resulting from any ideas, methods, instructions or products referred to in the content. |
© 2024 by the authors. Licensee MDPI, Basel, Switzerland. This article is an open access article distributed under the terms and conditions of the Creative Commons Attribution (CC BY) license (https://creativecommons.org/licenses/by/4.0/).