1. Introduction
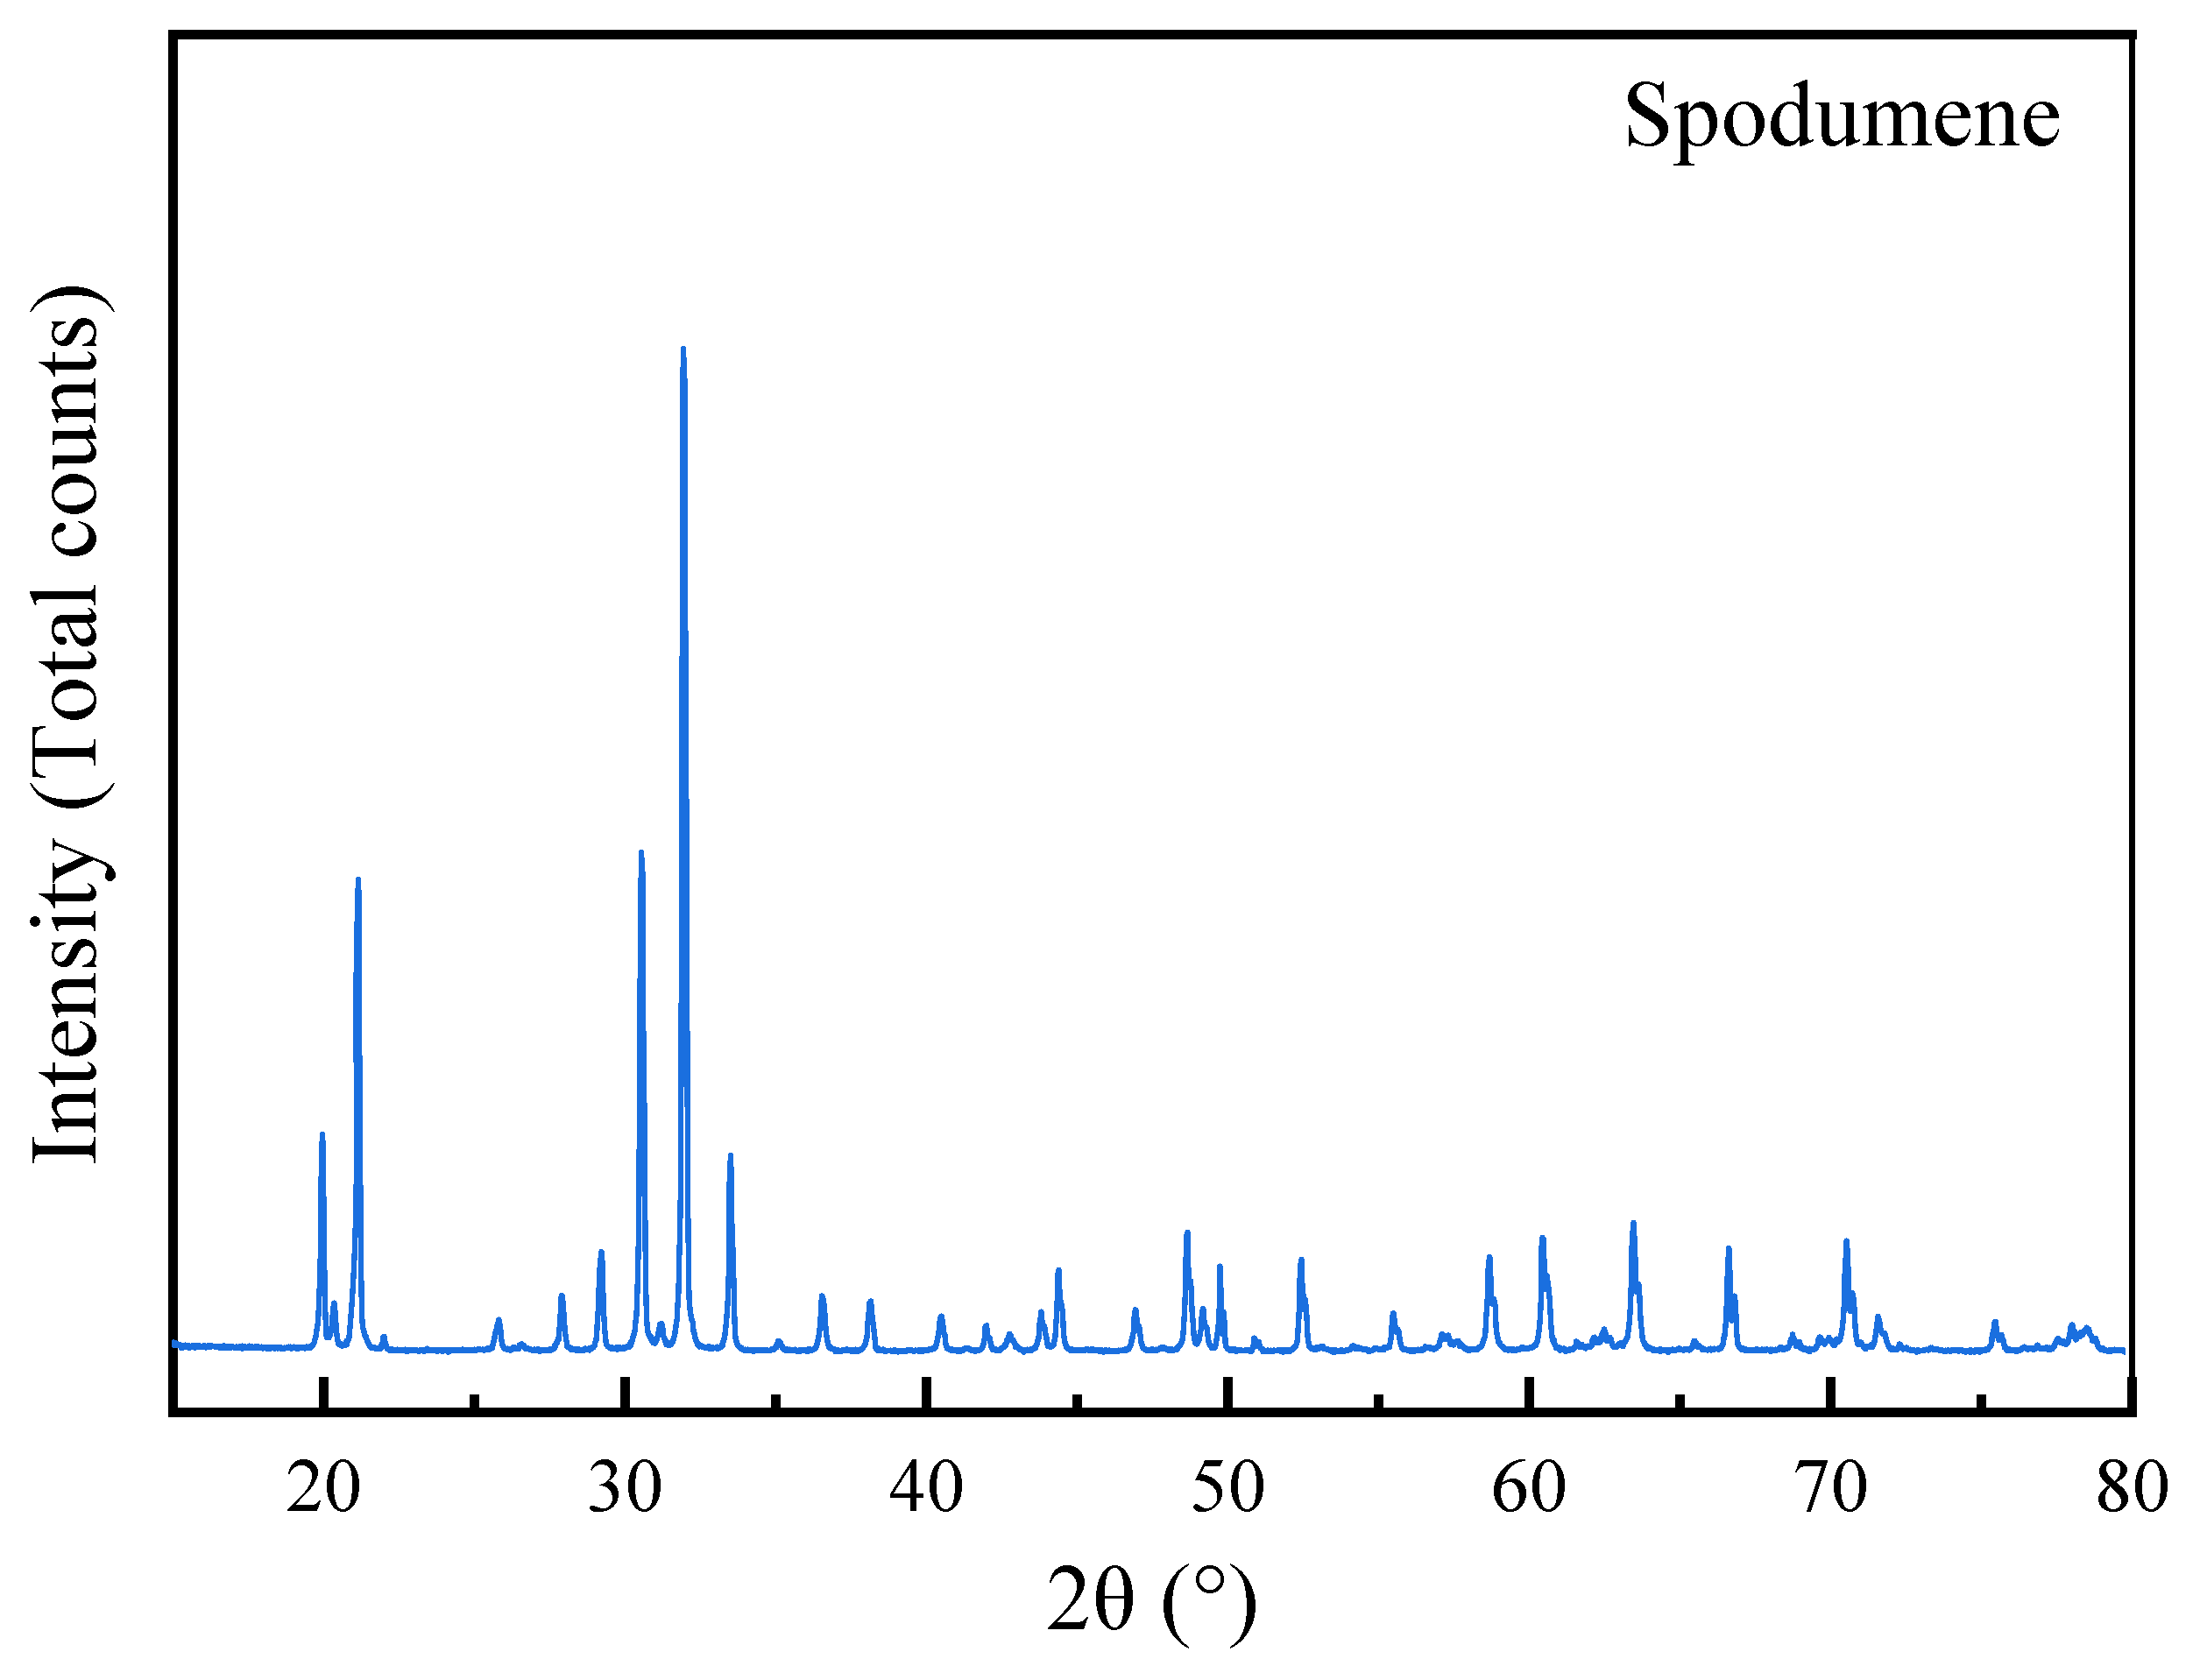
Spodumene, the main resource utilized for lithium extraction [
1], is predominantly located in high-altitude regions exceeding 4000 m in China [
2]. These regions are characterized by consistently low temperatures and atmospheric pressure. In industrial practice [
3], it has been observed that the flotation performance of spodumene deteriorates as the temperature drops. Therefore, understanding the impact of the environmental factors in high-altitude regions, especially the temperature, on spodumene flotation is crucial for investigating new flotation collectors to efficiently exploit spodumene in these areas.
The impact of temperature on the flotation process is a critical area of research within mineral processing. Previous studies [
4] have shown that fluctuations in temperature significantly alter the physicochemical properties of both mineral particles and reagents, as well as their interactions. Firstly, temperature impacts the performance of flotation reagents and their solutions [
5]. Under low-temperature conditions, the solubility of collectors decreases, particularly fatty acids, resulting in their reduced activity. This leads to a decrease in their adsorption capacity on the mineral’s surface. Secondly, temperature affects the viscosity and density of the flotation pulp [
6]. A lower temperature increases the viscosity and density of the flotation pulp, thereby reducing pulp fluidity and affecting the dispersion of mineral particles. Thirdly, temperature influences the formation of flotation bubbles and foam stability [
6,
7]. As temperature drops, high-viscosity solutions reduce bubble stability. Moreover, lower temperatures lead to an increase in bubble size, reducing the collision probability of bubbles with mineral particles. Lastly, temperature affects the kinetics of flotation [
8]. A lower temperature slows the chemical reaction rates during flotation processes such as collector–mineral surface adsorption reactions, thereby extending flotation time. It should be noted that the effect of temperature on flotation has always been reciprocal rather than independent. To enhance flotation efficiency at lower temperatures, strategies typically involve augmenting the dosage of the collector or adopting high-temperature processes [
9], but these cause an increase in production costs. Numerous studies have substantiated that the addition of cationic or non-ionic surfactants, such as amines [
10], ether amines [
11], amides [
12], alkenes [
13], and Gemini surfactants [
14], can improve the collecting performance of anionic surfactants, and particularly fatty acids, at lower temperatures, thereby augmenting the flotation recovery of minerals. The trend of collector modification and mixed collectors signifies a crucial research focus which aims at tackling the difficulties linked to low-temperature flotation processes.
Various interface interactions during the flotation process have significant effects on flotation, while the influence of temperature on the flotation process can also be attributed to the influence of temperature on gas–liquid, solid–liquid, and solid–liquid–gas interfaces [
15]. The collector not only alters the hydrophobicity of the mineral’s surface but also influences the characteristics of the flotation foam. Consequently, investigating the self-assembly process of the collector at the gas–liquid interface is integral to understanding the mineral’s flotation mechanism. The gas–liquid interface interaction during the flotation process is typically analyzed using techniques including surface tension measurements, interface structure examinations, frothiness assessments [
16], and other relevant methods. Surface tension is a pivotal property of the collector solution, profoundly affecting the action at the gas–liquid interface during flotation. During the flotation process, the introduction of surfactants reduces the surface tension of the pulp solution, thereby augmenting the floatability of mineral particles. An examination of the microscopic mechanisms underlying surface tension provides insights into its nature and how temperature influences surface tension by altering intermolecular interactions.
The complexity of the gas–liquid interface arises from the intricate interplay of electrostatic, polarization, and van der Waals interactions at the molecular level [
17,
18]. Molecular simulation offers the advantage of dissecting individual interactions in appropriately selected systems, enabling a detailed analysis of their impact on the interface’s properties [
19]. Experimentally, determining the surface composition of liquid mixtures presents challenges due to the highly disordered, non-uniform nature of the interfacial region, which is typically only a few molecular diameters thick. Nevertheless, MD simulation provides a more direct means of obtaining the distribution of molecules at the interface [
20]. Further efforts are needed to establish a direct correlation between simulation results and experimental observations. Therefore, our objective was to quantitatively investigate the impact of surfactants on surface tension.
Numerous studies have been conducted on spodumene flotation, including on the characteristics of spodumene collectors [
21], adsorption mechanisms [
22], surface dissolution [
23], isomorphous substitution, and grinding methods [
24]. Nevertheless, the effect of the environmental factors in high-altitude regions on the spodumene flotation process, such as temperature and atmospheric pressure, remains largely unexplored. This study aims to integrate experimental research with computational simulations of the gas–liquid interface interactions occurring during the flotation process to elucidate the mechanisms by which temperature factors influence spodumene flotation. Our main experiments include micro-flotation tests, surface tension tests, and MD simulations.
3. Results and Discussion
3.1. Effect of Temperature on Spodumene Flotation
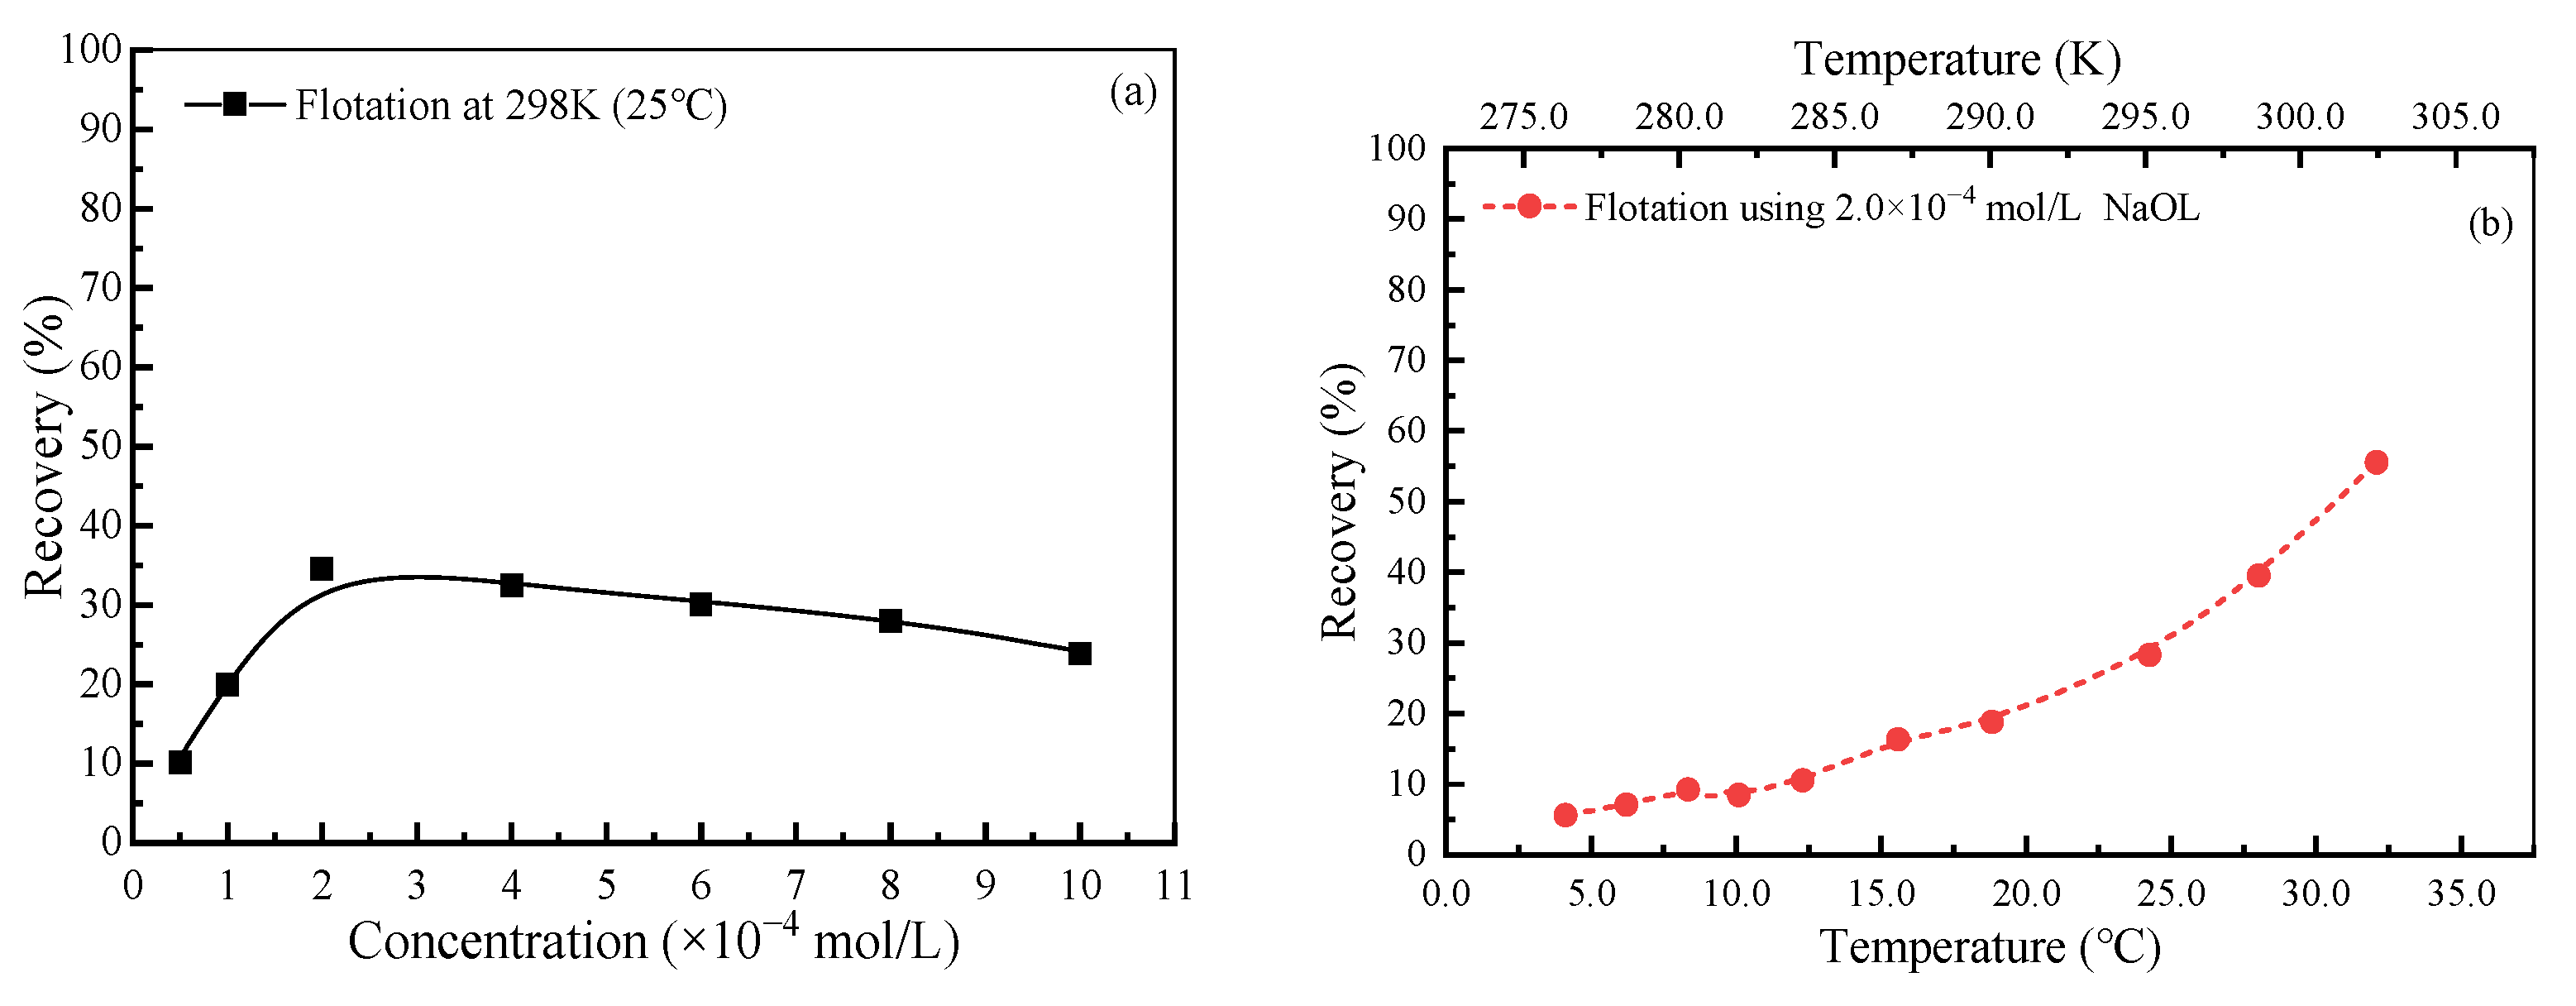
The correlation between the NaOL dosage and flotation recovery of spodumene at 298.0 K (25.0 °C), as well as the correlation between spodumene flotation recovery and pulp temperature within a 2 × 10
−4 mol/L NaOL solution, are presented in
Figure 4. The flotation pulp’s pH was maintained at 8.5 ± 0.5 by pH regulators.
As shown in
Figure 4, the flotation recovery of spodumene initially increased before decreasing with the increase in NaOL dosage, reaching its peak value of 34.5% at a concentration of 2 × 10
−4 mol/L NaOL. At this optimal NaOL dosage, the flotation recovery of spodumene consistently declined from 55.3% to 5.1% as the pulp temperature decreases from 305.4 K (32.3 °C) to 277.3 K (4.2 °C).
The flotation tests demonstrated the significant impact of pulp temperature on the flotation recovery of spodumene while using NaOL as the collector. Subsequently, the influence of pulp temperature on spodumene flotation was studied based on the gas–liquid interface effect of the NaOL solution, including the surface tension and CMC of the NaOL solution.
3.2. Effect of Temperature on the Surface Tension and CMC of NaOL Solution
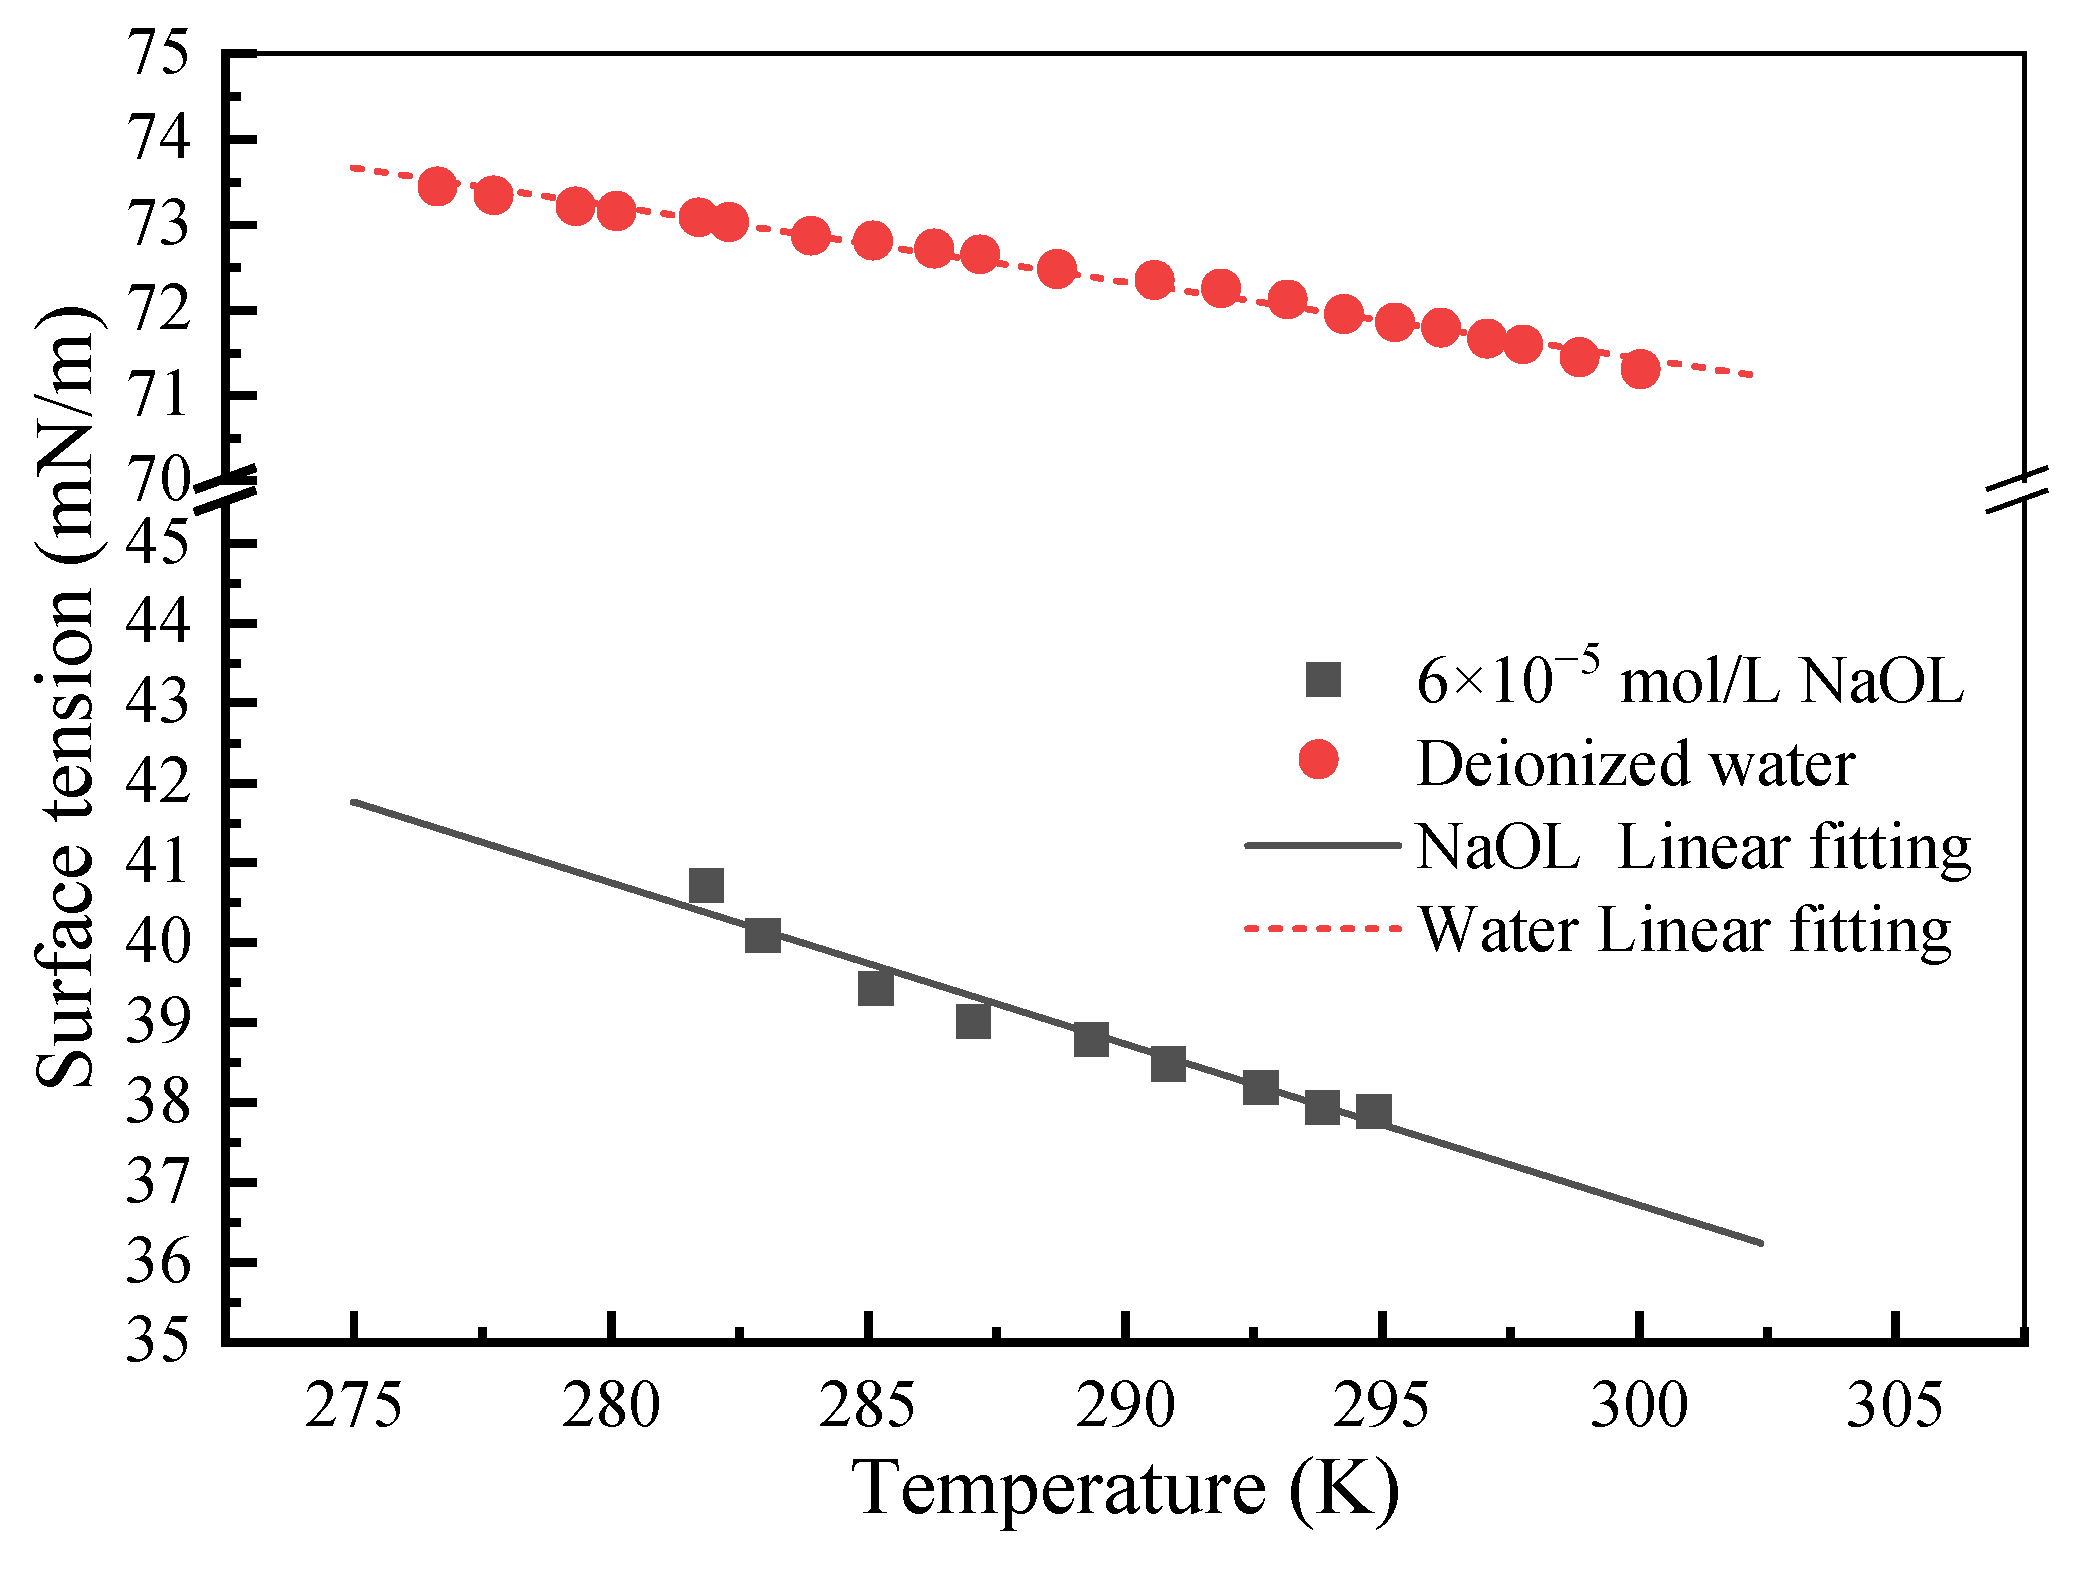
Figure 5 illustrates the surface tension of deionized water and NaOL solution at a concentration of 6 × 10
−5 mol/L as a function of temperature. The results clearly show that the surface tension of the NaOL solution is significantly lower than that of deionized water. Additionally, the surface tension of the deionized water and 6 × 10
−5 mol/L NaOL solution exhibits a strong linear relationship with temperature within the range of 308.2 K to 273.2 K. With a decreasing temperature, the surface tension of the NaOL solution increases from 37.88 mN/m at 294.9 K to 40.71 mN/m at 281.9 K.
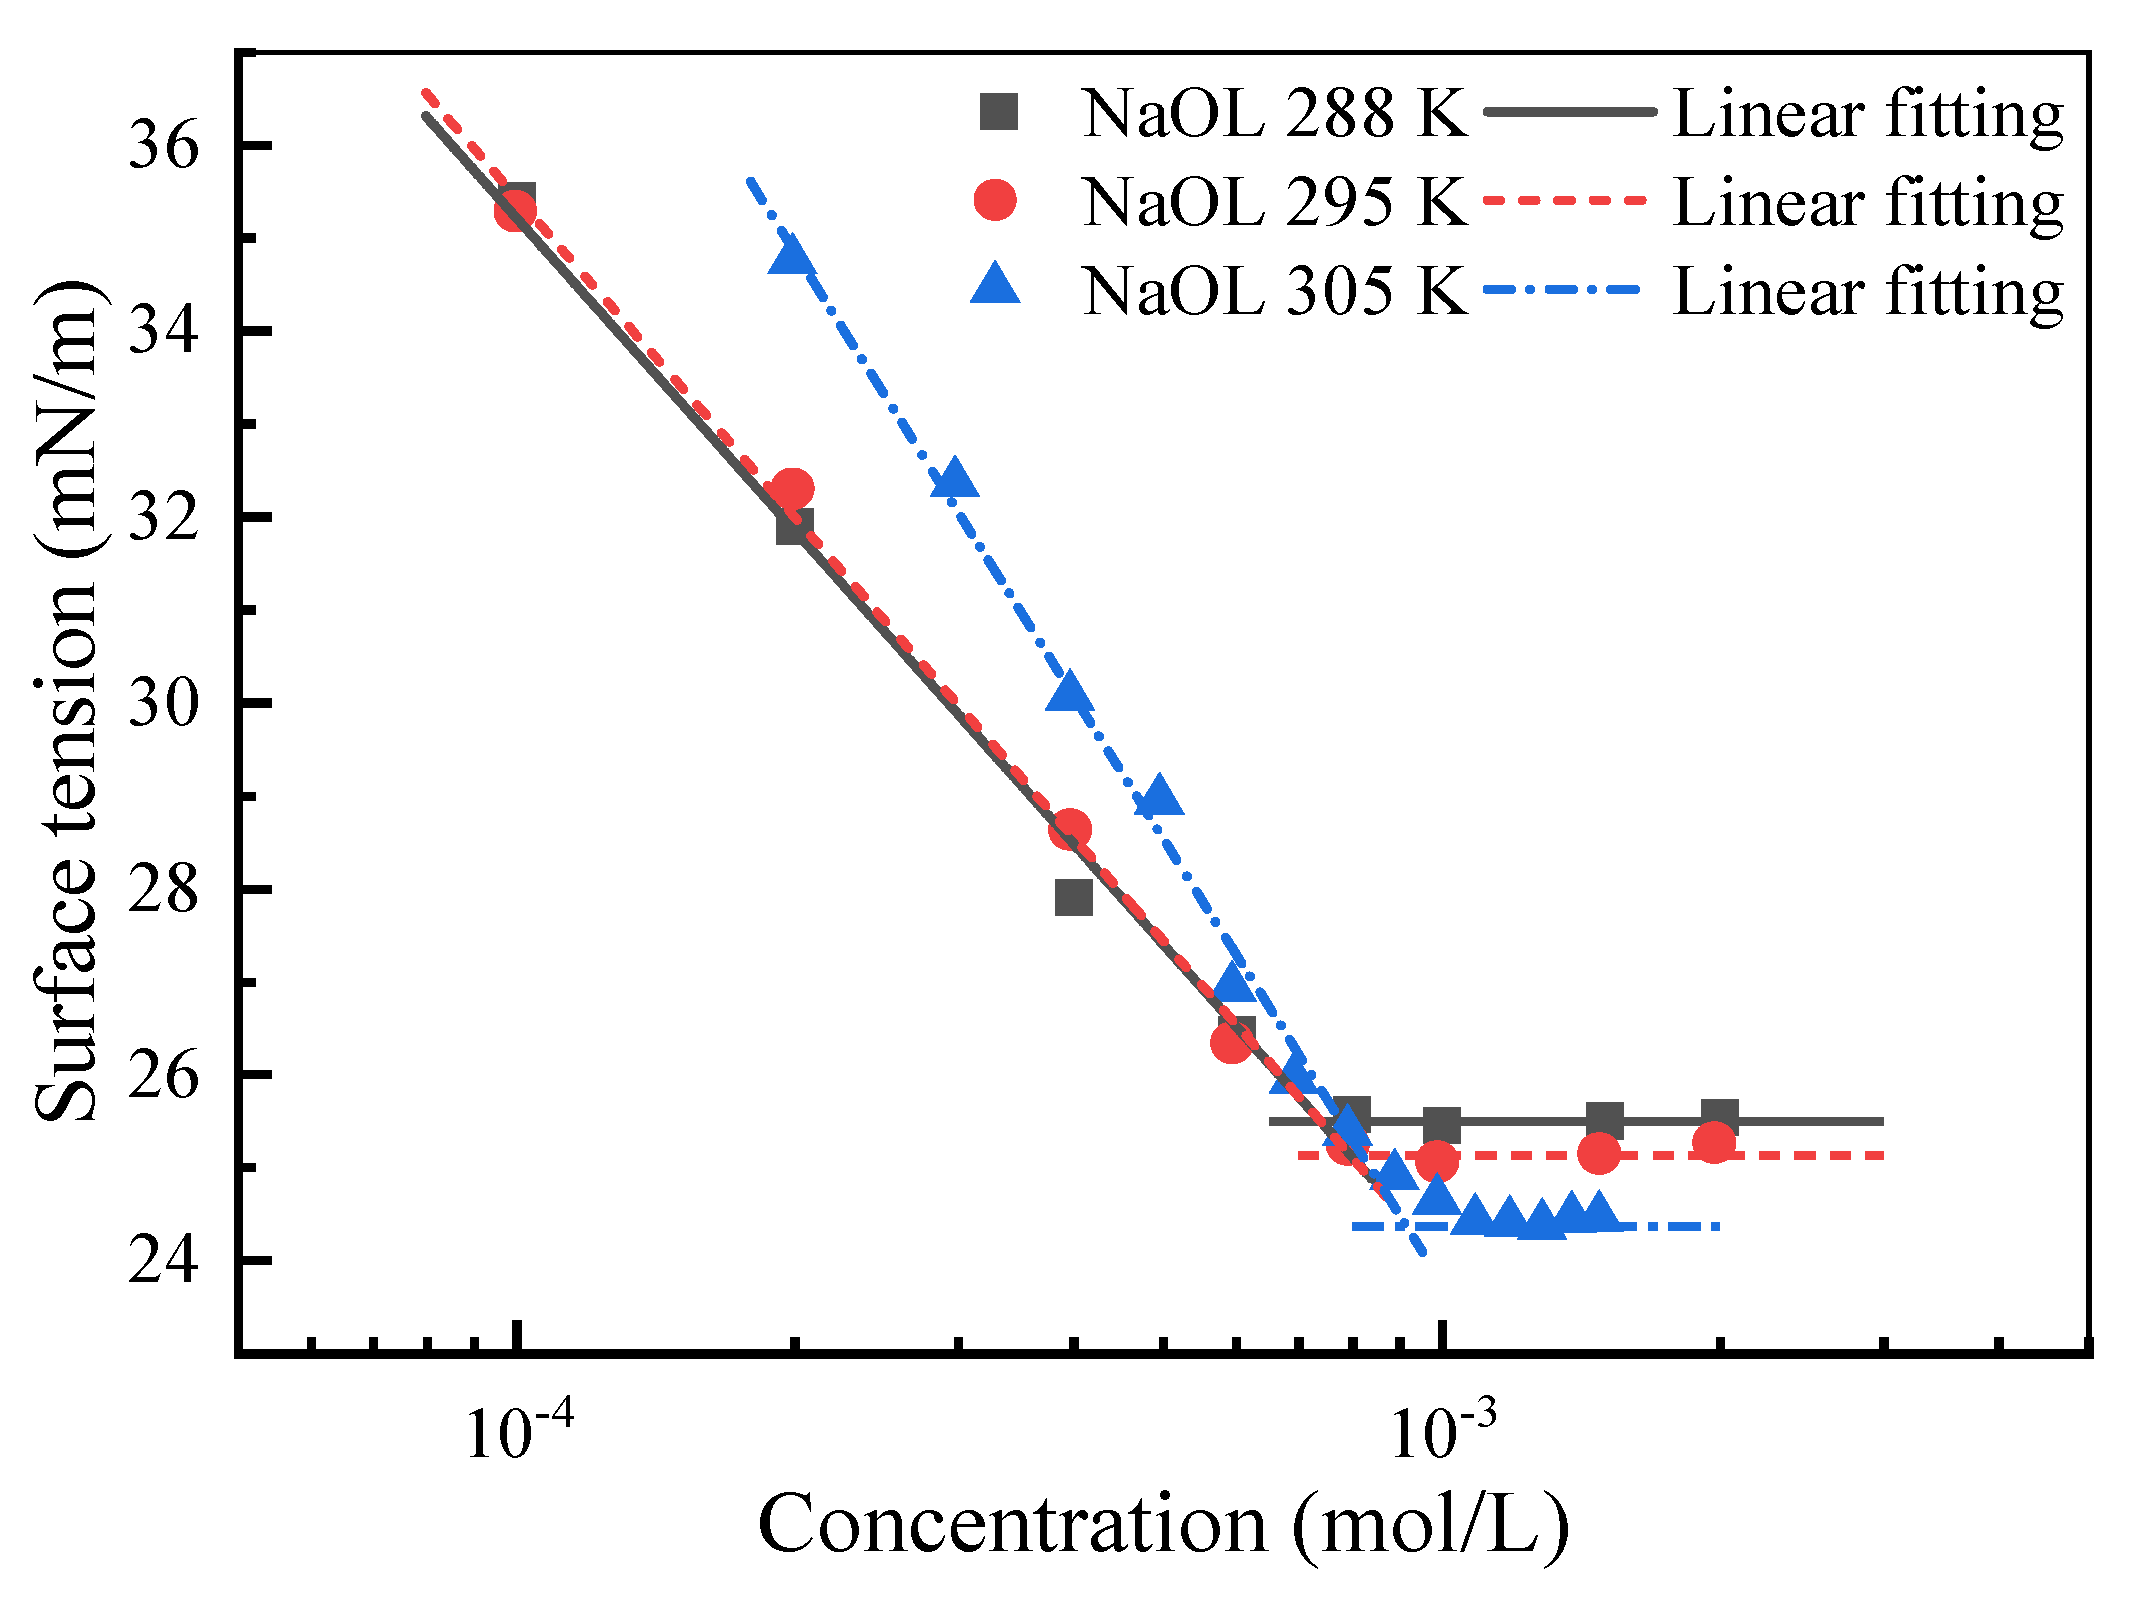
Moreover, the surface tension of NaOL solution, as a function of concentration under different temperatures. is shown in
Figure 6. At different temperatures, the surface tension of the NaOL solution decreases as the NaOL concentration increases. However, the surface tension of the NaOL solution ceases to decrease at a certain concentration, whatever the temperature. At these inflection points, the surface tension of the NaOL solution is minimal, and the corresponding concentration of the NaOL solution is its CMC. Therefore, the surface tension of the NaOL solution attains its lowest value of 24.37 mN/m when the temperature is 305.0 K and the CMC of the NaOL solution is 9.49 × 10
−4 mol/L. Similarly, the CMC of the NaOL solution is 7.84 × 10
−4 mol/L and 6.85 × 10
−4 mol/L when the temperature is 295.0 K and 288.0 K, respectively, with corresponding surface tensions of 25.13 mN/m and 25.5 mN/m observed.
The CMC is a vital surfactant property that serves as a gauge of its surface activity. As the temperature decreases, the CMC of the NaOL solution decreases as well, leading to a reduction in the concentration needed to achieve monomolecular layer saturation adsorption and an increase in surface tension. Consequently, in the low-temperature conditions prevalent in high-altitude regions, the solution’s surface tension rises while its CMC decreases, contributing significantly to the reduced flotation efficiency of spodumene. This phenomenon underscores the importance of considering temperature when optimizing flotation processes for spodumene.
Theoretically, the variations of the surface tension of the NaOL solution with temperature are the results of the interaction between NaOL molecules and water molecules at the gas–liquid interface. Therefore, further research was conducted on the molecular interaction behavior at the gas–liquid interface of the NaOL solution.
3.3. Effect of Temperature on Intermolecular Interactions
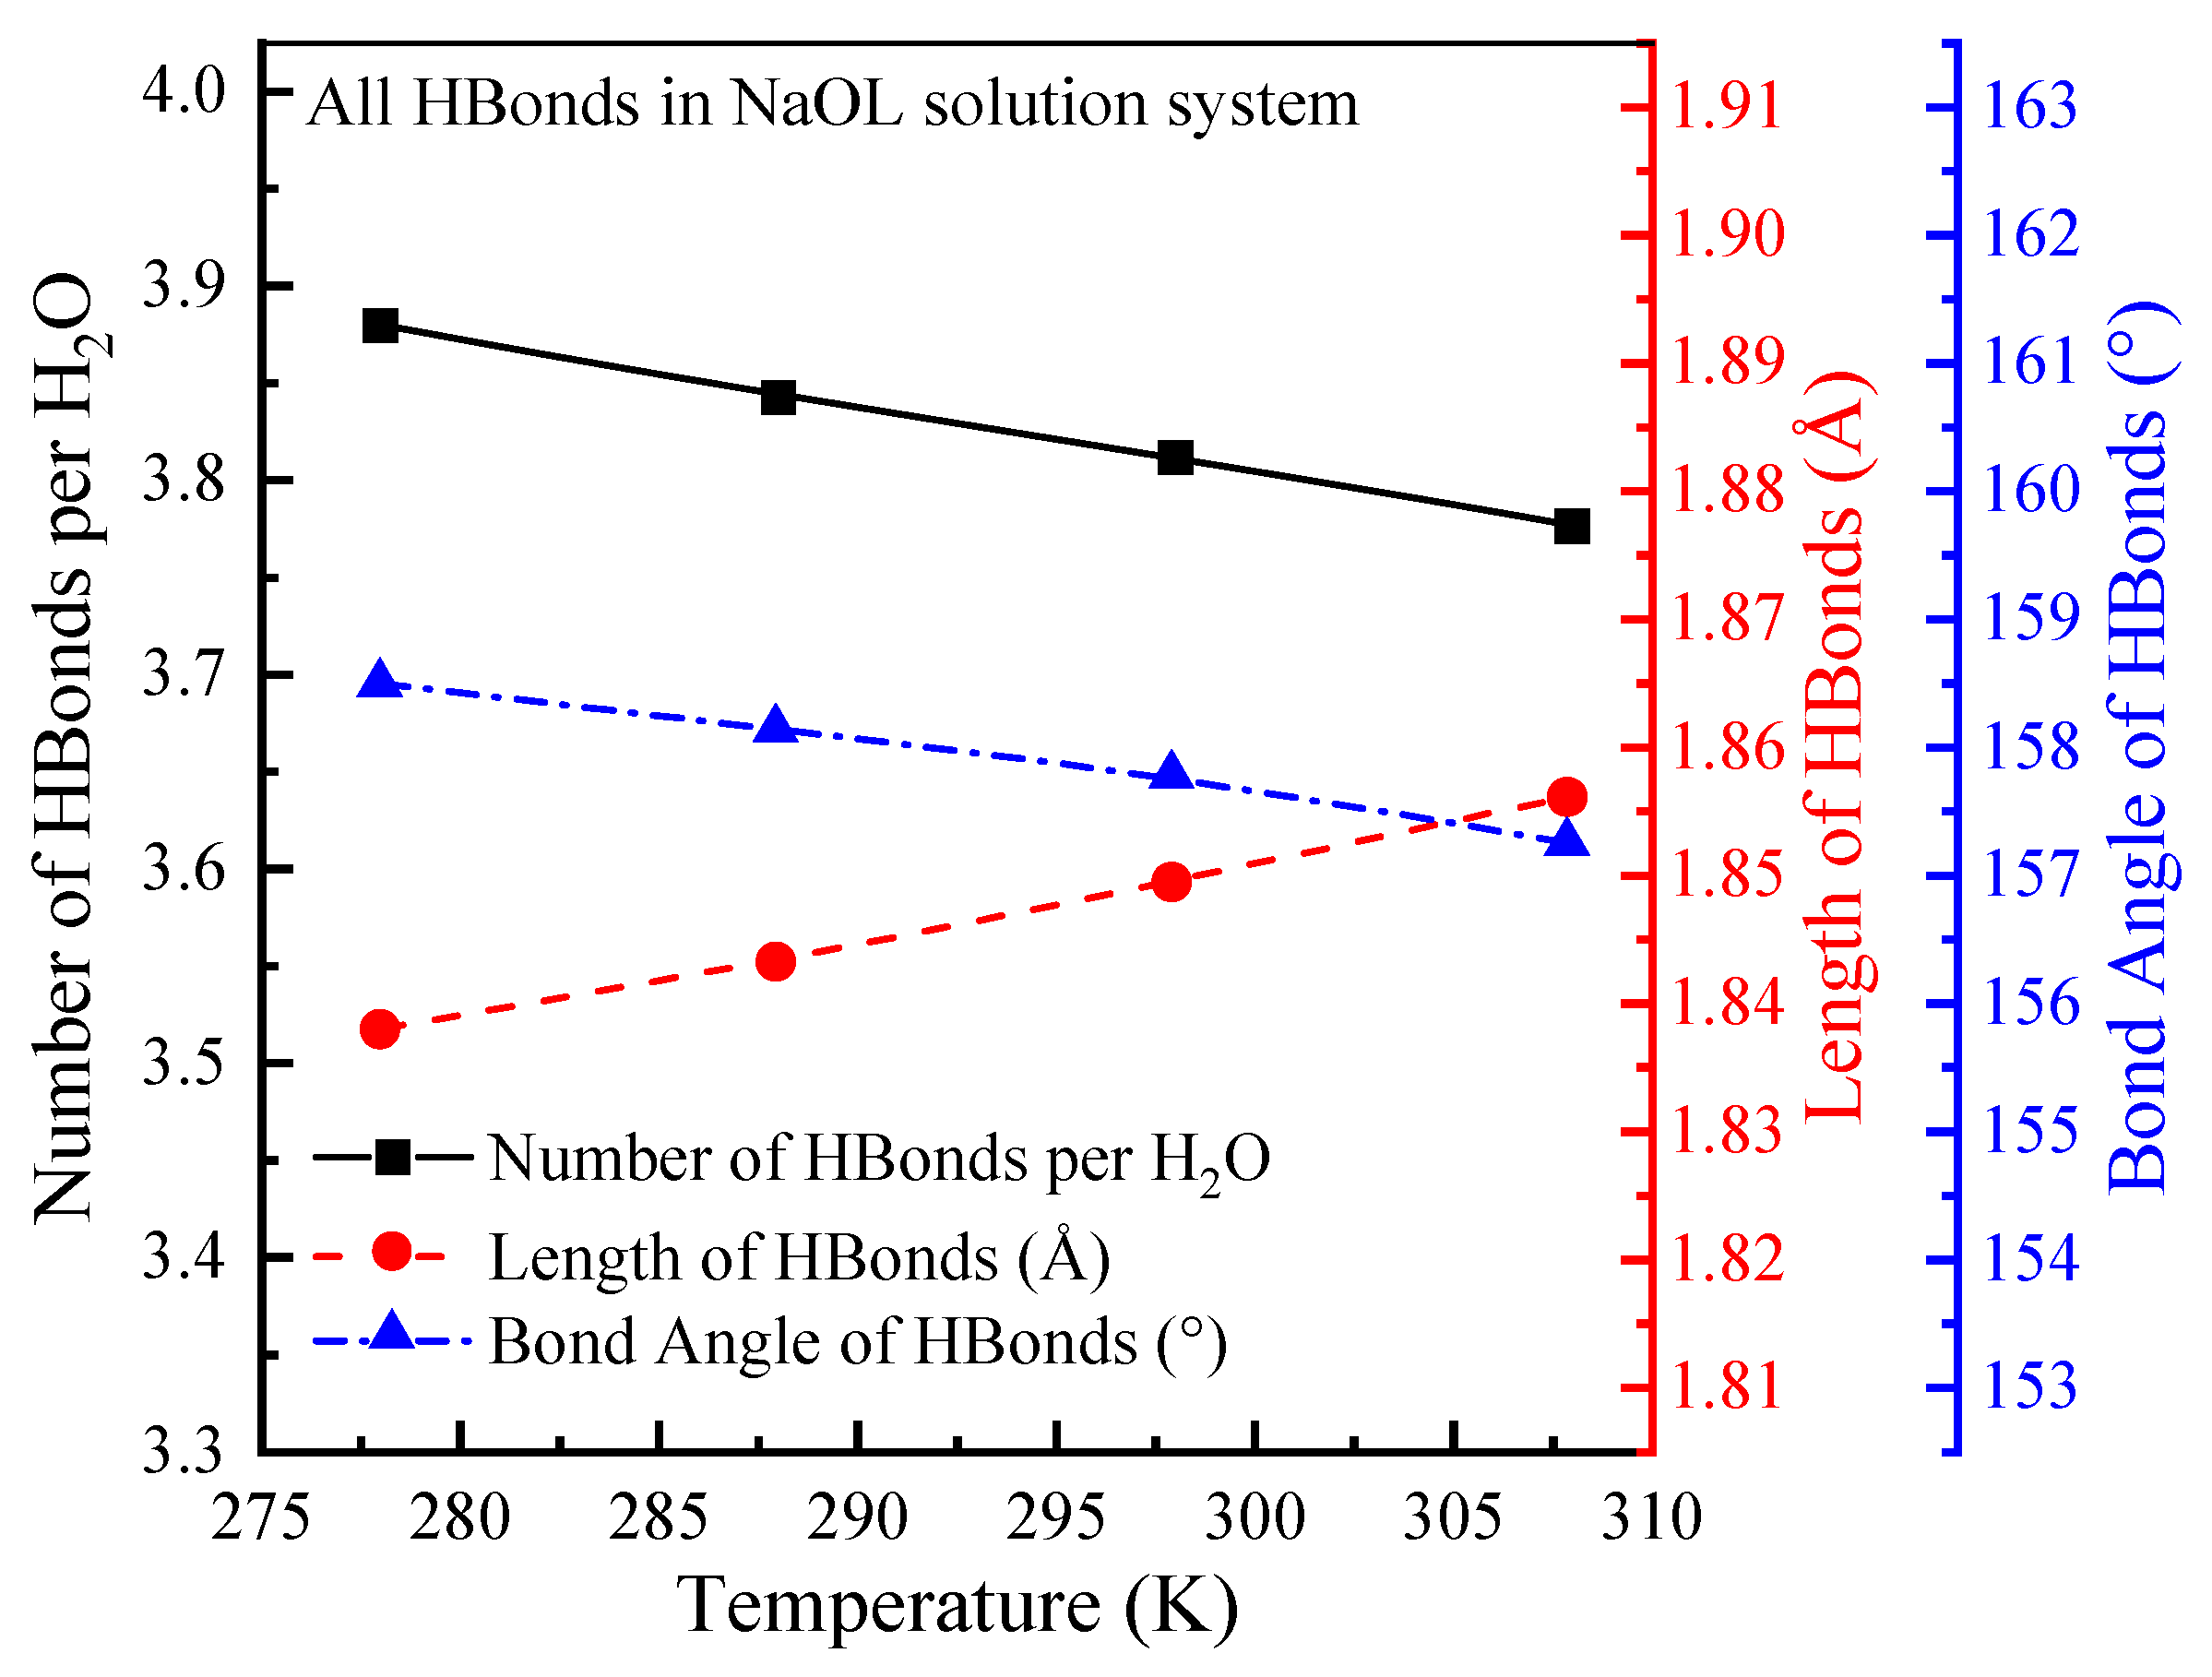
Hydrogen bonds refer to the interactions between hydrogen atoms and more electronegative atoms like oxygen, nitrogen, or fluorine. They influence the strength of the interactions at the gas–liquid interface and the arrangement of molecular structures. The higher the quantity of hydrogen bonds, the shorter the bond length, the larger the bond angle, and the stronger the intermolecular interaction becomes.
Figure 7,
Figure 8 and
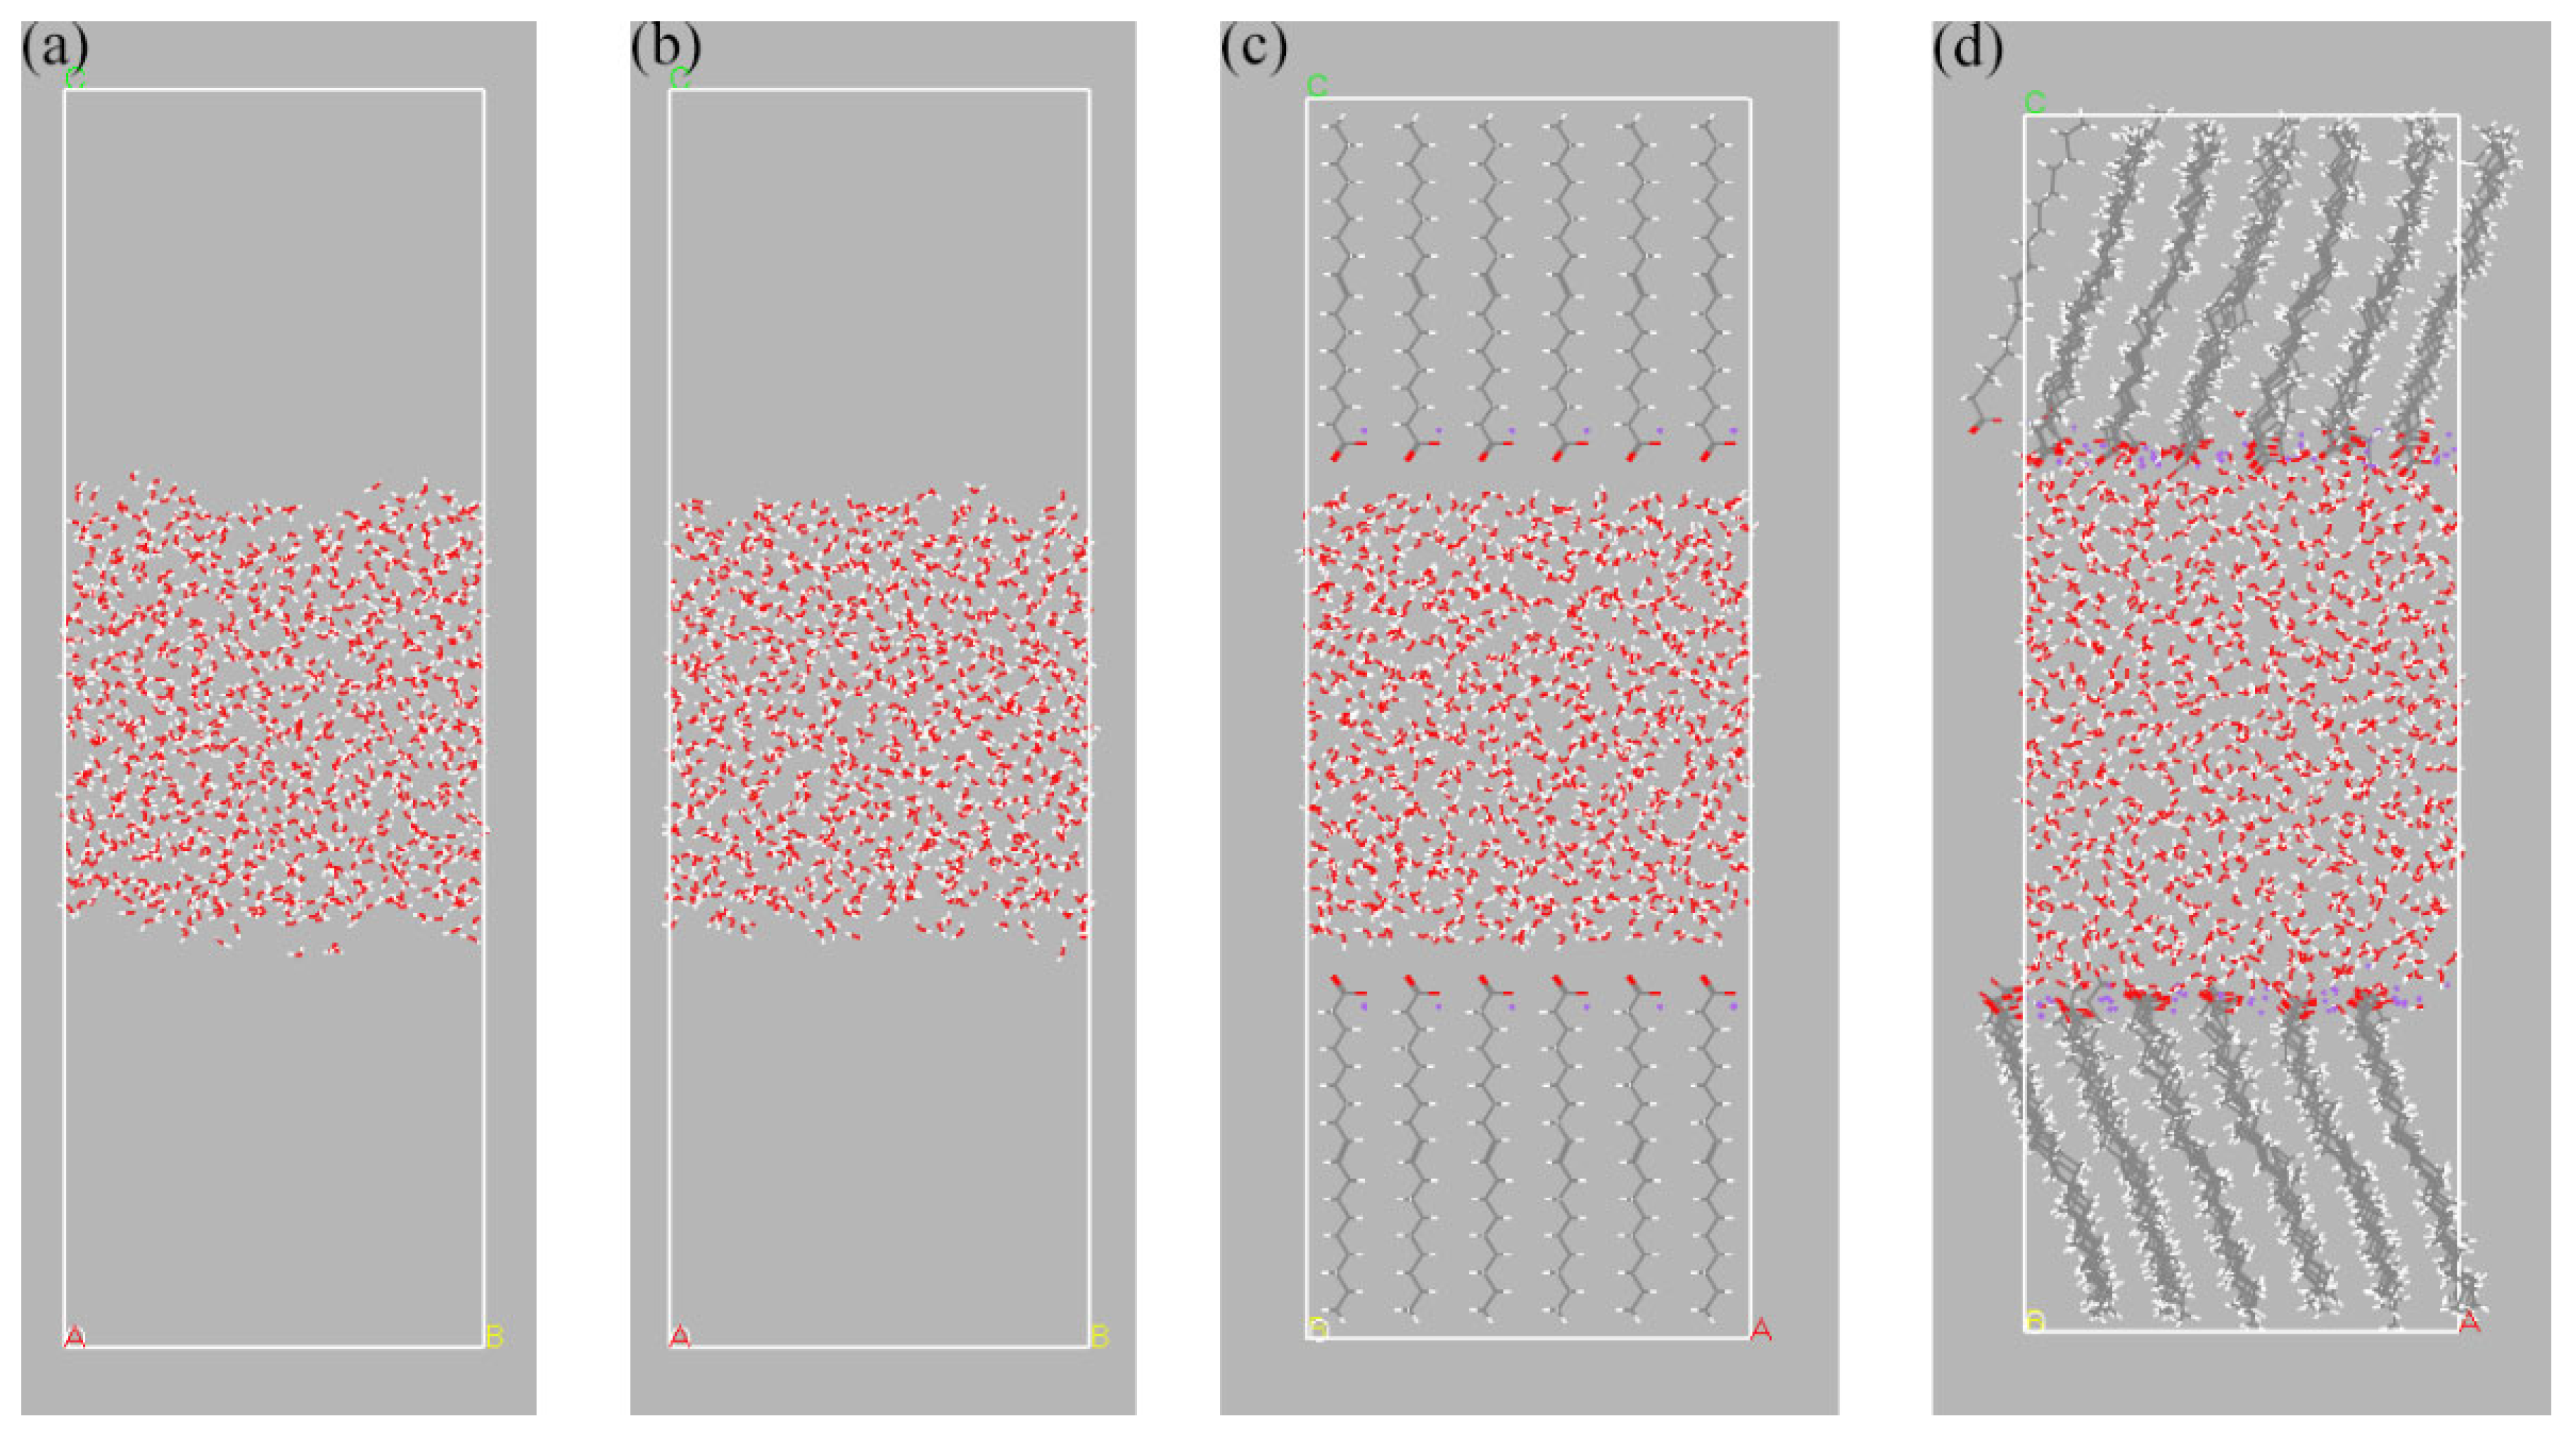
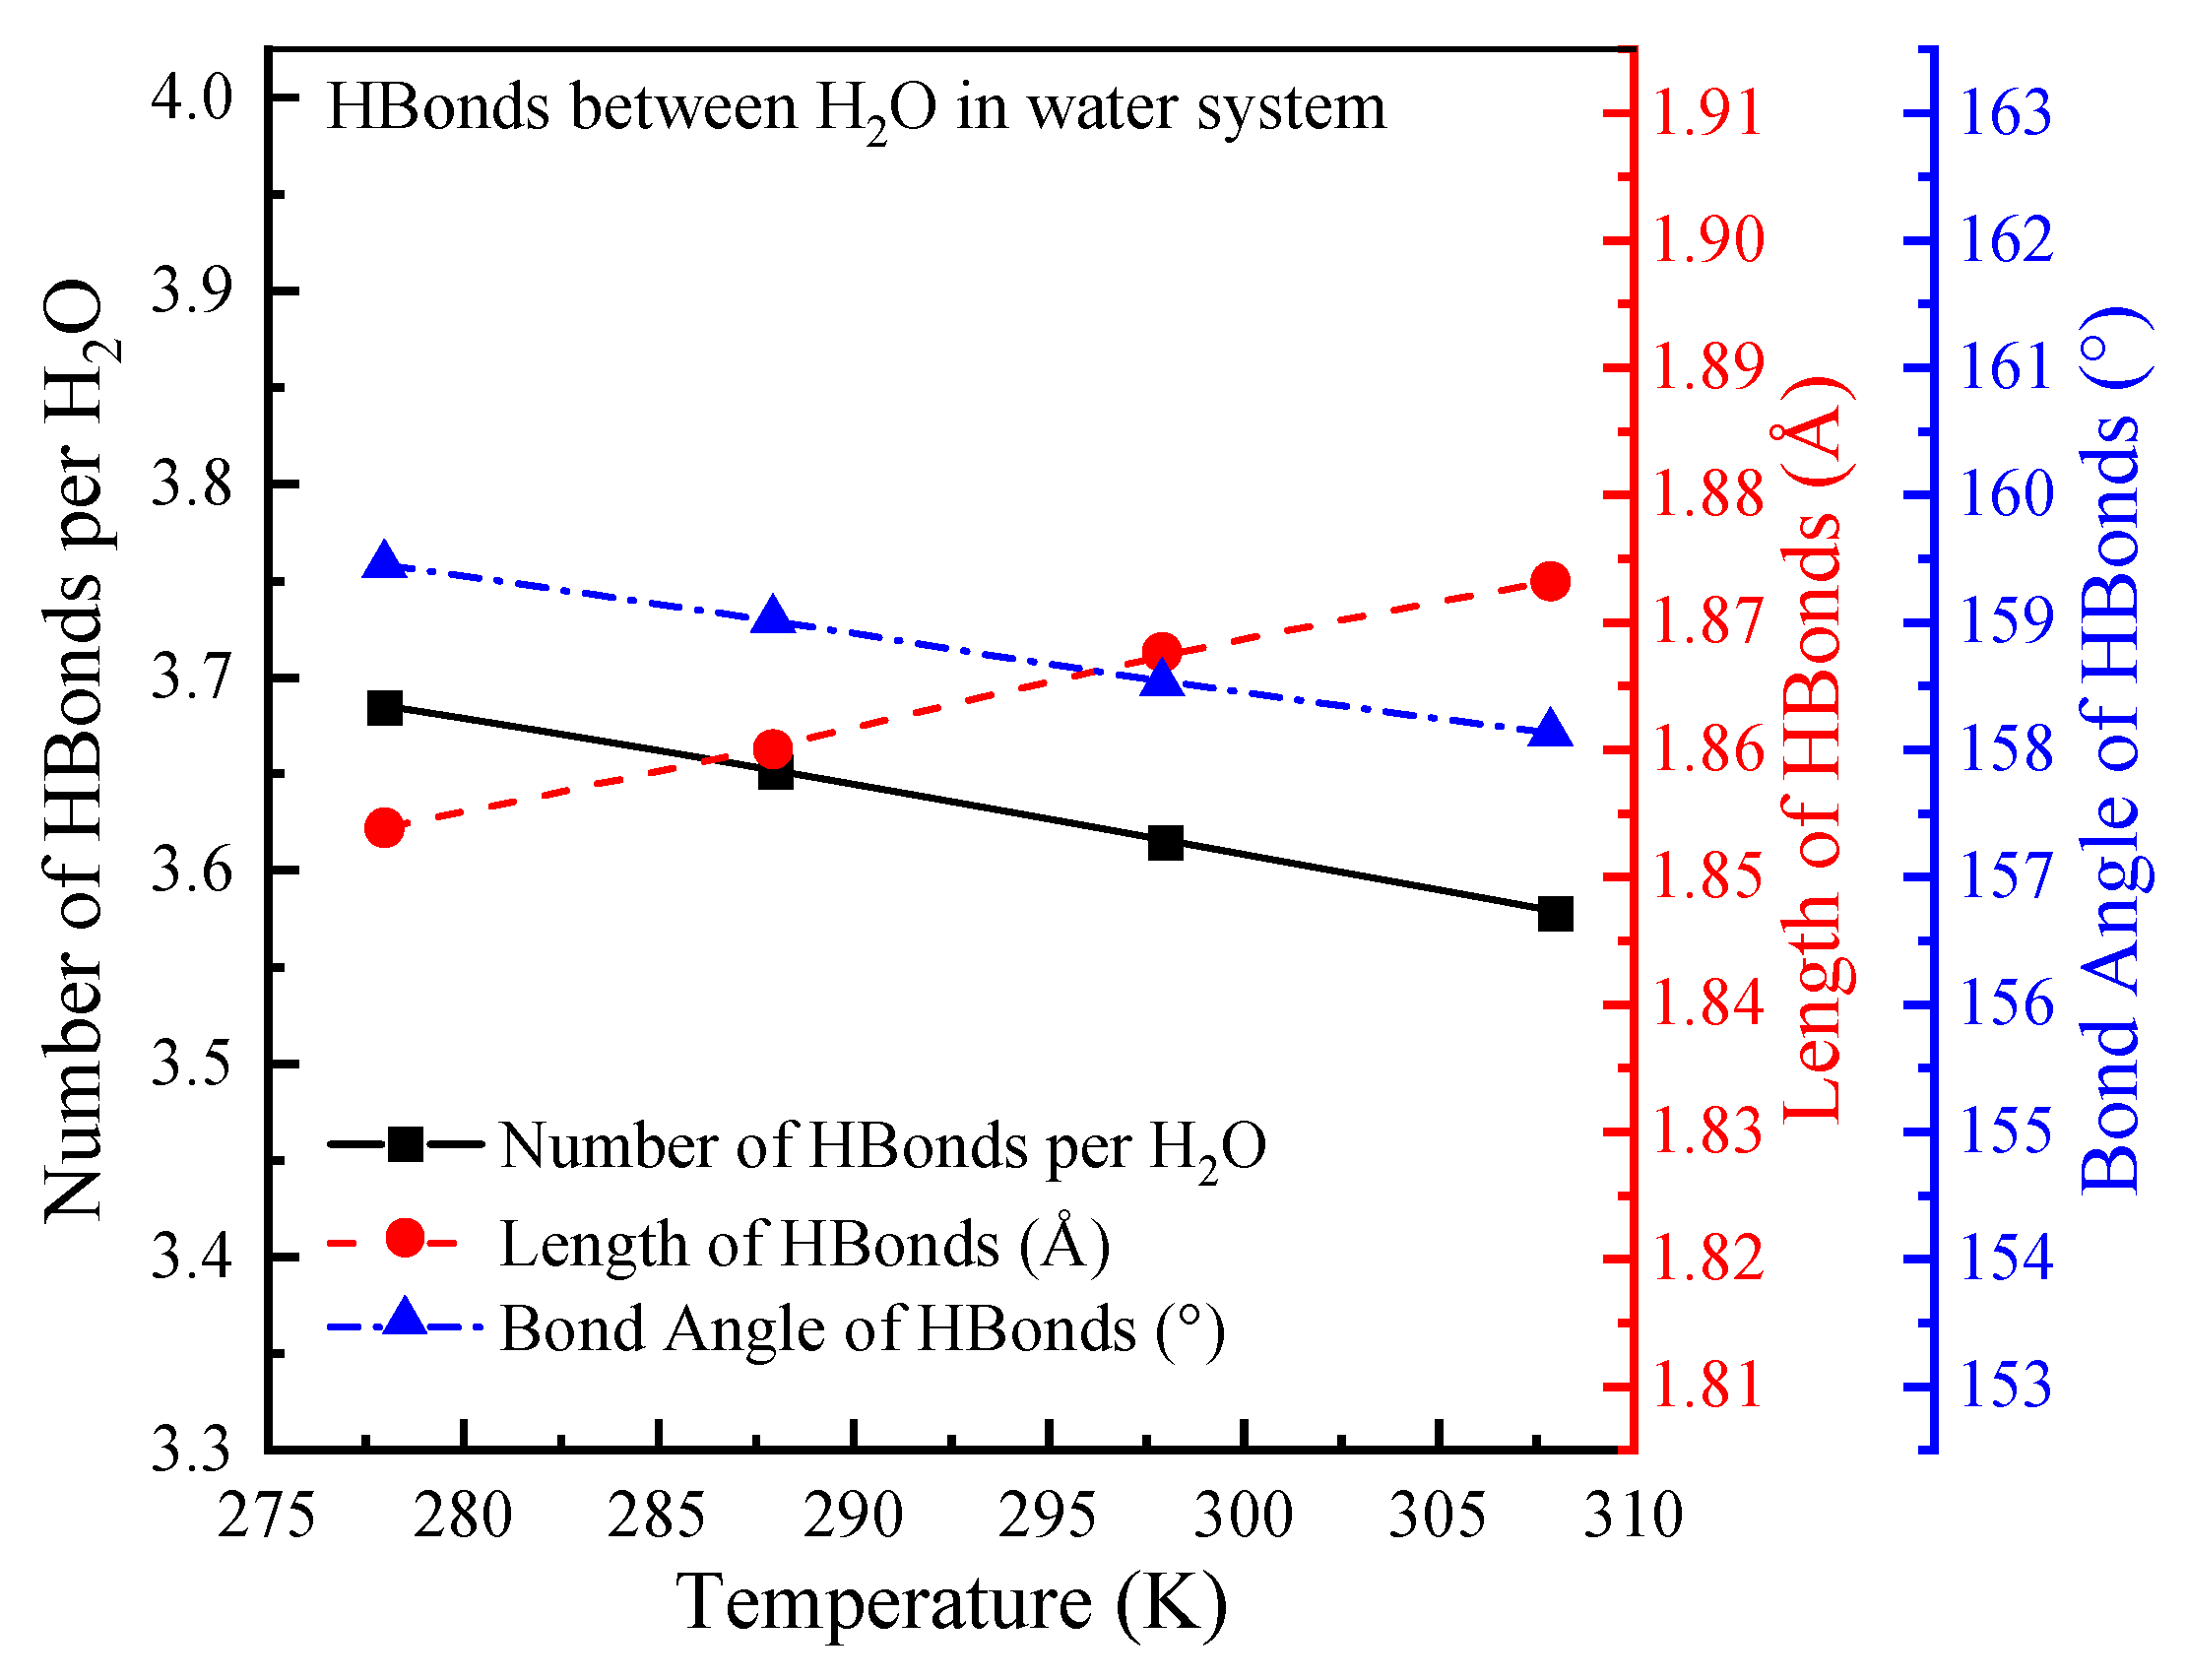
Figure 9 illustrate the quantity and structural characteristics of hydrogen bonds formed in water and NaOL solution systems. The characteristics of the hydrogen bonds between water molecules in water system (
Figure 3b) are depicted in
Figure 7. On average, each water molecule forms 3.61 hydrogen bonds, with a bond length of 1.87 Å and a bond angle of 158.50° at 298.0 K. When decreasing the temperature from 308.0 K to 278.0 K, the number of hydrogen bonds per water molecule increases from 3.578 to 3.684, the hydrogen bond length decreases from 1.873 Å to 1.853 Å, and the hydrogen bond angle increases from 158.10° to 159.43° in the water system.
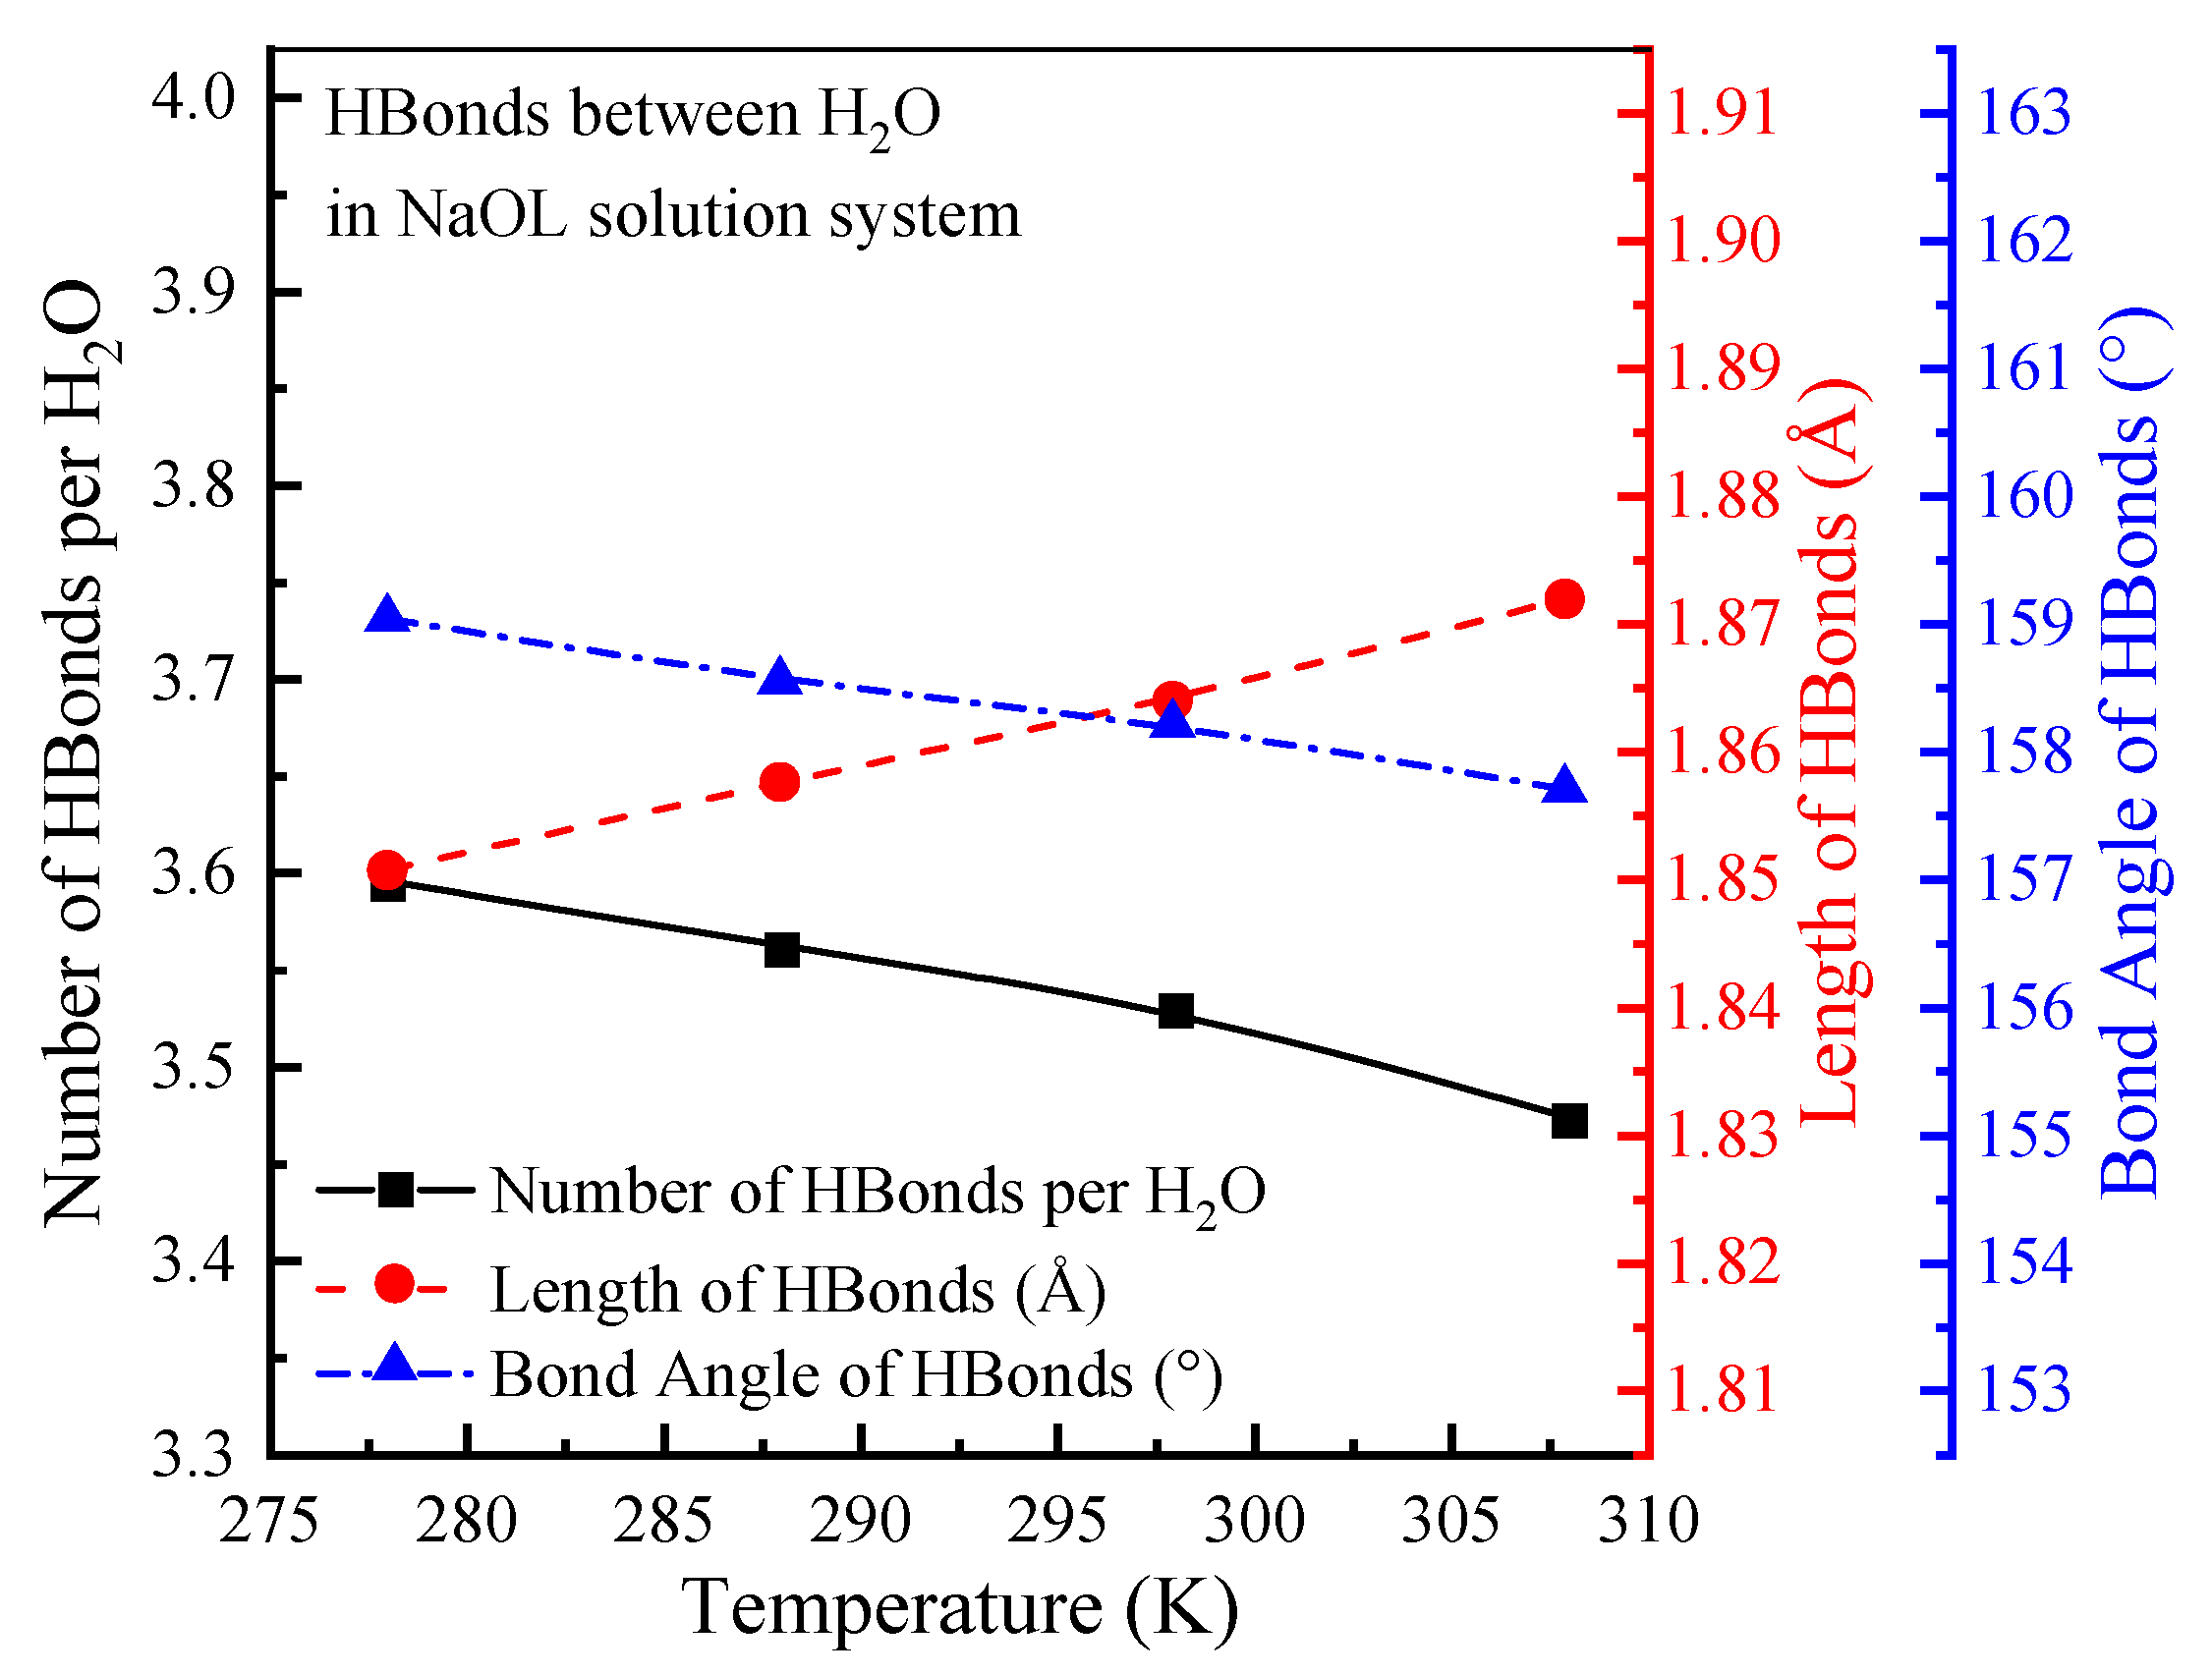
As shown in
Figure 8, the number of hydrogen bonds between water molecules decreases by 0.09 (2.44%) in the NaOL solution system (
Figure 3d), but no significant changes are observed in hydrogen bond length or angle. This indicates that part of the water molecule is squeezed out by NaOL at the gas–liquid interface, forming a hydrogen bond between NaOL and H
2O. The hydrogen bonds of H
2O-H
2O and NaOL-H
2O in the NaOL solution system are shown in
Figure 9. As a result, the total number of hydrogen bonds per water molecule increases by 0.1974 (5.46 %), while the bond length decreases by 0.0183 Å (0.98%) and the bond angle is reduced by 0.7417° (0.47%). The decrease in the hydrogen bond length and bond angle means that there is a stronger interaction between NaOL and water molecules than between individual water molecules. With decreasing the temperature from 308.0 K to 278.0 K, the number of all hydrogen bonds (H
2O-H
2O and NaOL-H
2O) observed per water molecule increases from 3.776 to 3.880 in the NaOL solution system, the hydrogen bond length decreases from 1.856 Å to 1.838 Å, and the hydrogen bond angle increases from 157.228° to 158.475°.
Therefore, with the decrease in temperature, both the water system and the NaOL solution system exhibit an increase in the number of hydrogen bonds, a decrease in bond length, and an increase in bond angle. This suggests an enhancement in the strength of the hydrogen bonds, thereby increasing the surface tension at gas–liquid interfaces.
3.4. Effect of Temperature on the Gas–Liquid Interface’s Structure
Figure 10 and
Figure 11, respectively, depict the density profiles of water and NaOL molecules along the z axis of
Figure 3, starting from the origin at the bottom of the cell, under varying temperature conditions in the water simulation system and NaOL simulation system.
As shown in
Figure 10, it is clear from the density profiles of the water system that two well-defined gas–liquid interfaces are established. There is a bulk liquid region of approximately 30 Å thickness between the two interfaces, and its profile is symmetric around the middle of the slab. The gas phase density is 0 g/cm
3, ranging between the 0–26 Å and 64.5–90 Å intervals, while the bulk liquid phase density is about 1.0 g/cm
3 in the range of 32.5–58 Å. The thickness [
25] of both gas–liquid interfaces is 3 Å, respectively, spanning from 28.5 Å to 31.5 Å and from 59 Å to 62 Å. As the temperature decreases, the density profile curve of the gas–liquid interface shifts to the center, and the density profile curve of the bulk liquid phase moves upward. Consequently, the density of the bulk liquid phase decreases and the gas–liquid interface’s thickness increases, in the water system, as the temperature increases.
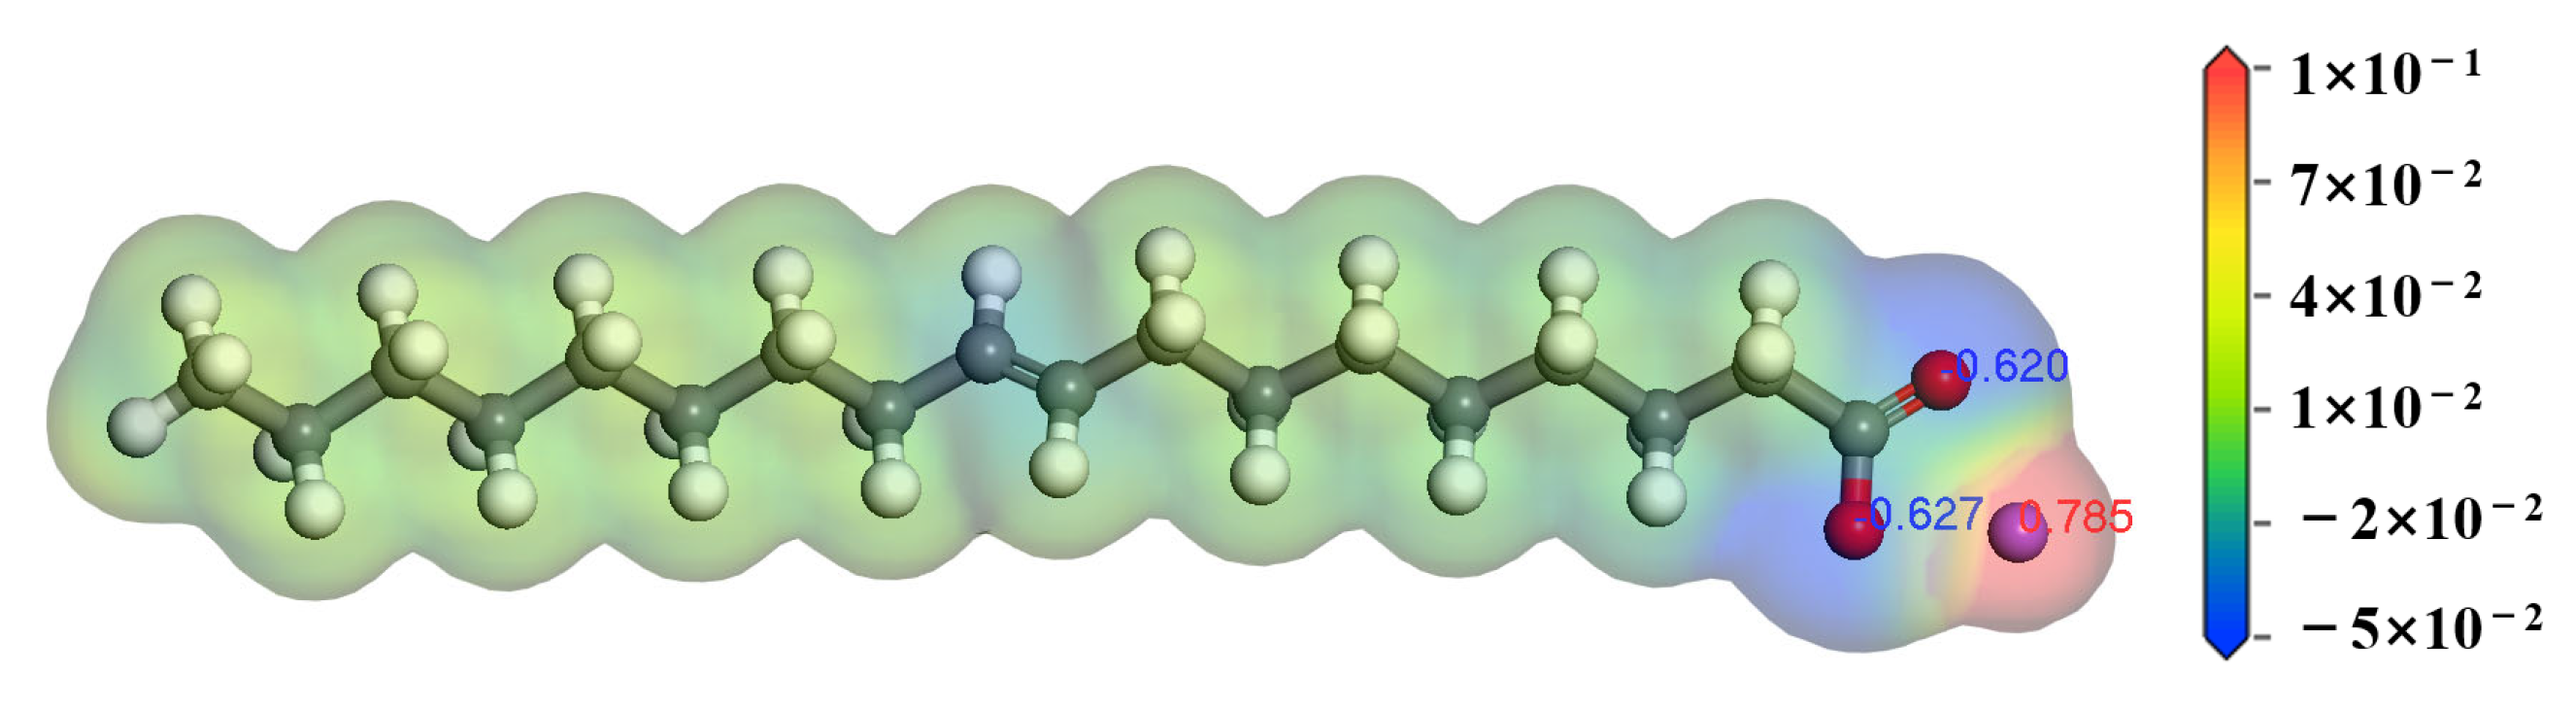
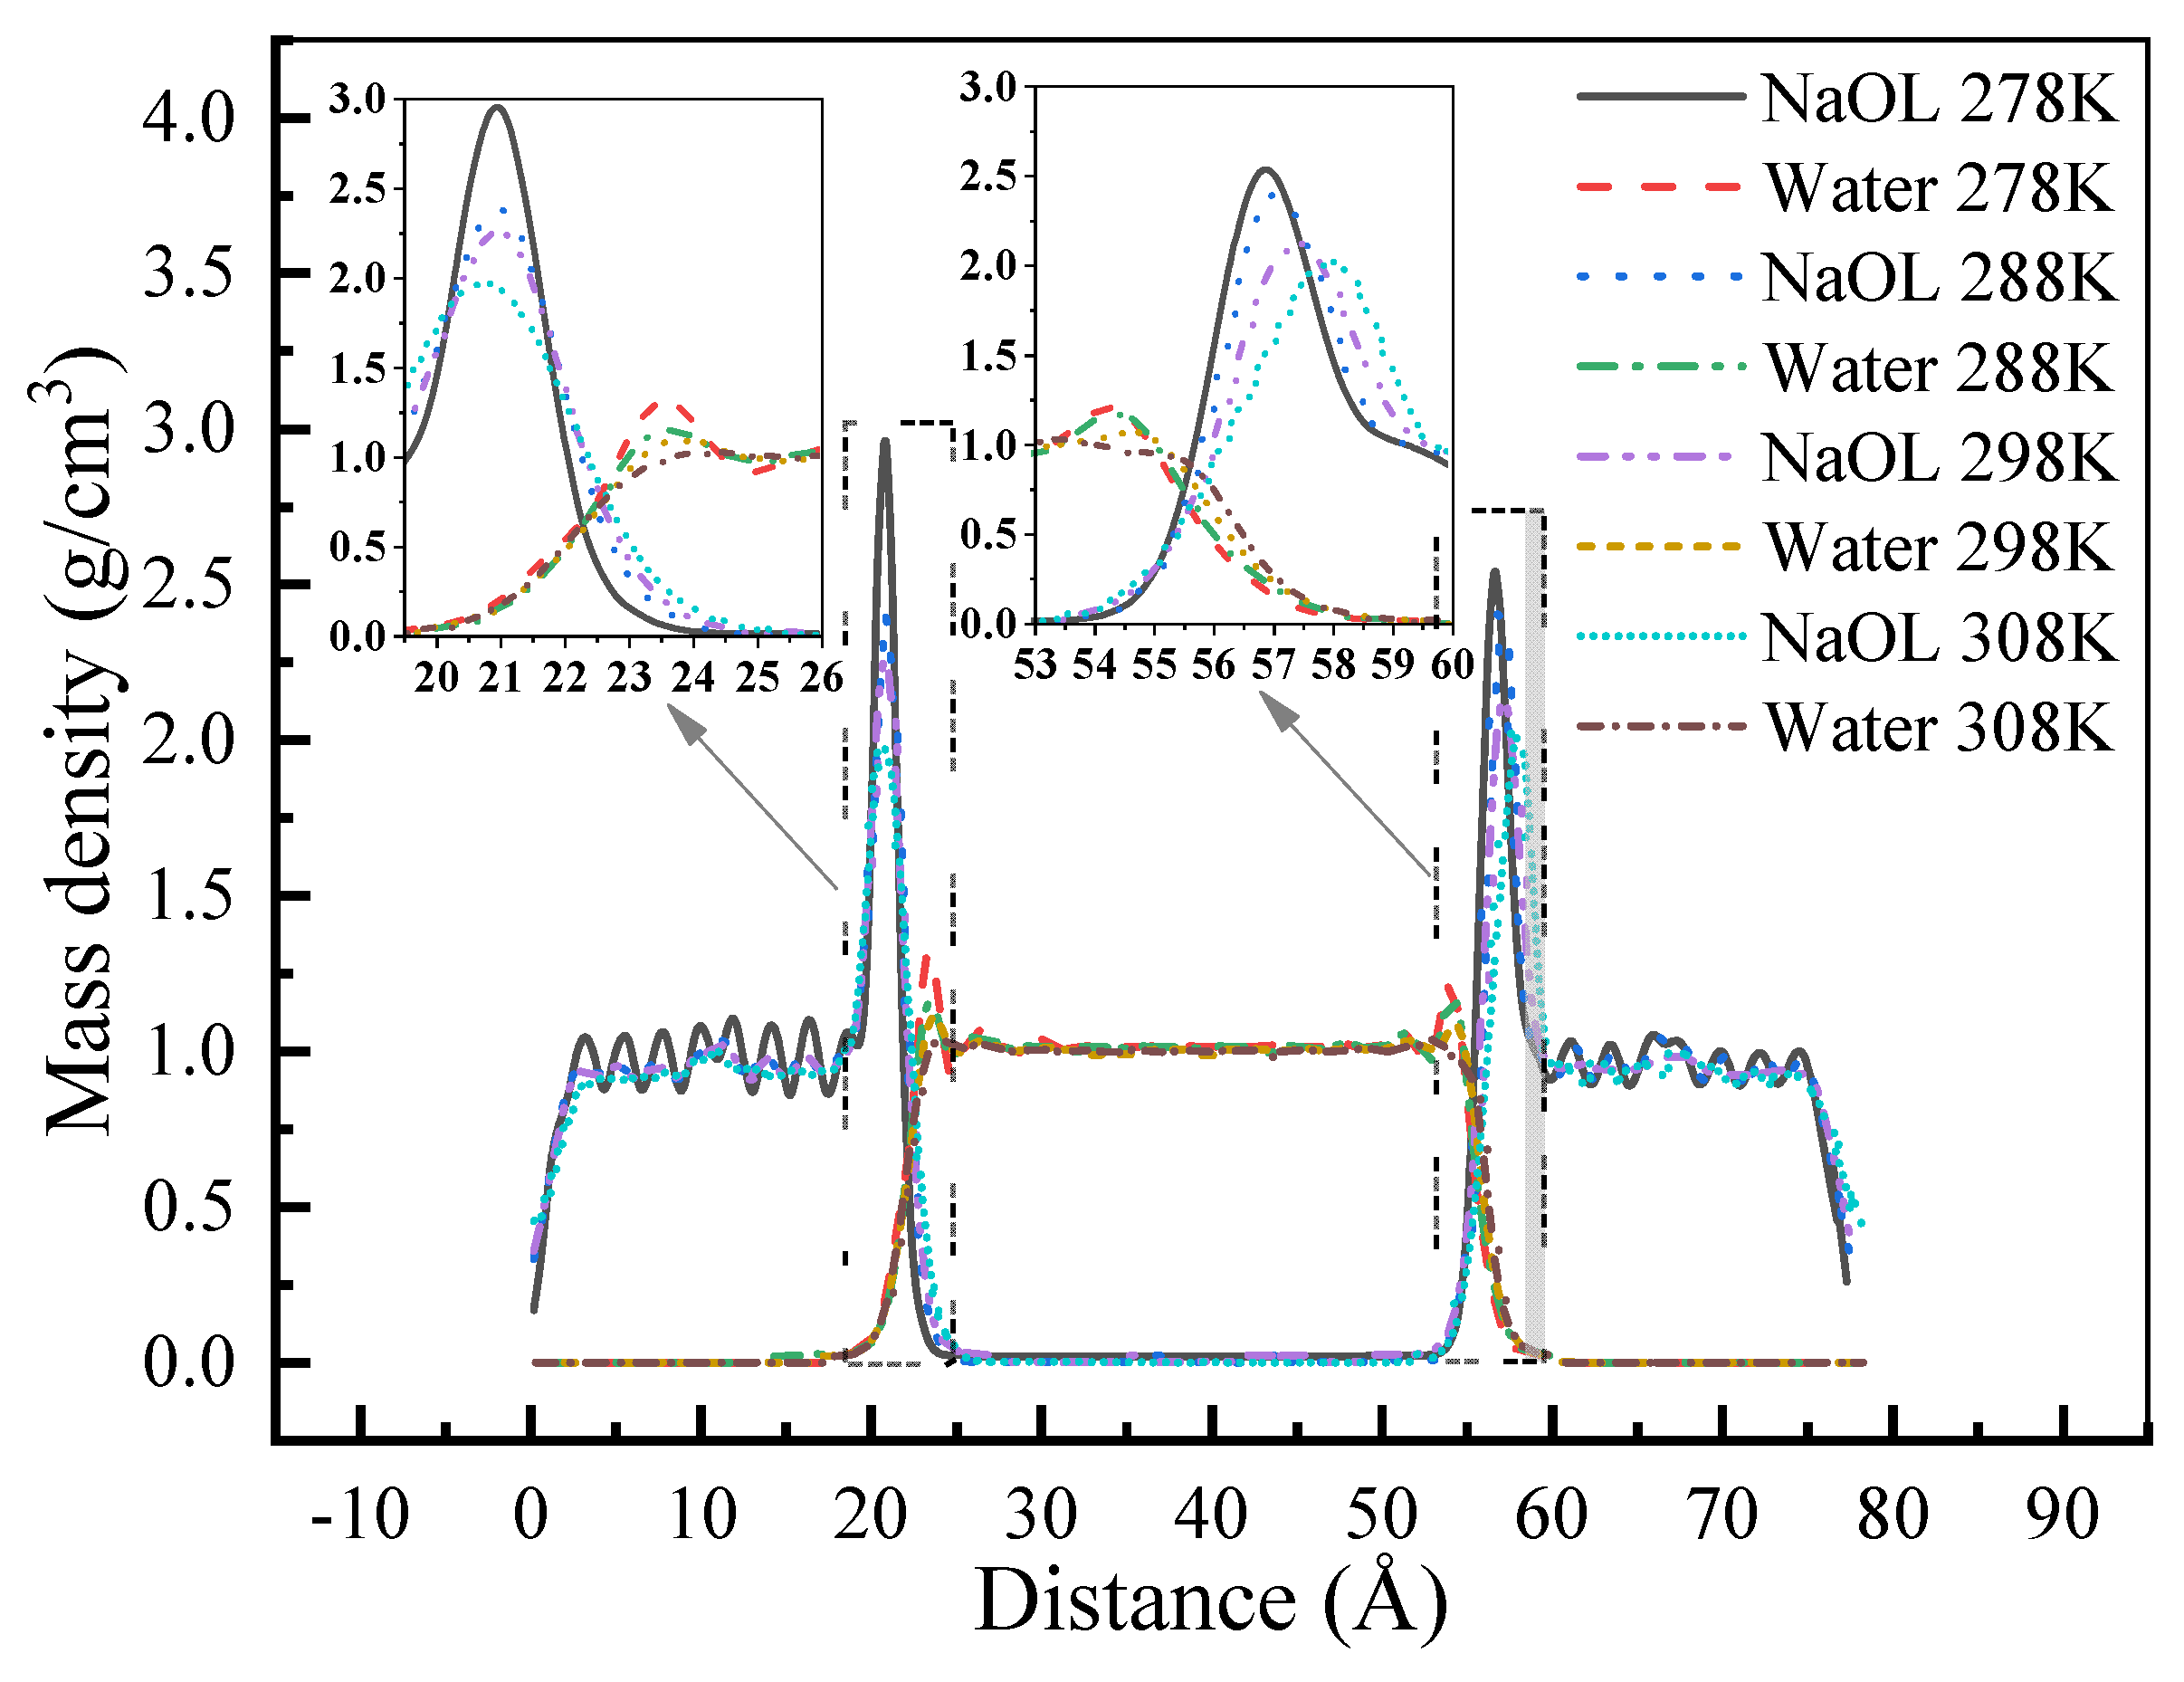
Figure 11 illustrates the density profiles of NaOL and H
2O at different temperatures, while the NaOL solution MD simulation system reaches equilibrium. Upon examining the density profile curve of the NaOL component at 298.0 K, within the 0–24.5 Å and 53–77.5 Å ranges, the density progressively increases, followed by a decrease, indicating that there are two NaOL monomolecular interfacial films and that their thickness is 24.5 Å. Concurrently, it is evident that the two prominent peaks in the density profiles of the NaOL solution system, observed at 21 Å and 57.5 Å, correspond to the carboxyl group (-COO
−) in the NaOL molecules. For the density profile curve of the H
2O component at 298.0 K, an initial rise in density is noted between the 20–23 Å and 55.5–58.5 Å ranges which then reaches equilibrium. This region signifies the interface thickness of the water phase, aligning with findings in the water system. Unlike our earlier observations, the primary peaks appeared at 24 Å and 55 Å, significantly higher than the original primary peak in the water system, due to the carboxyl hydrophilicity of NaOL, which caused the aggregation of water molecules. Additionally, two mixed regions exist where both water and NaOL molecules combine, in the 20–24.5 Å and 54–58.5 Å ranges. Within these regions, these segment of NaOL molecules interact with water molecules, reflecting that their hydrophilic polar group is being combined with water molecules. With a decrease in temperature, the main peak of the density profile curve increases in height, decreases in width, and shifts to the center. This suggests that the arrangement of molecules on the surface becomes more compact and that the thickness of the interface between the water and NaOL constituents becomes narrower.
These aforementioned experiments indicate that, in both single water and NaOL systems, a decrease in temperature results in an increased formation of hydrogen bonds characterized by shorter bond lengths and larger bond angles. This enhanced intermolecular interaction leads to an increase in solution density and a decrease in interface thickness and intermolecular spacing, consequently increasing the surface tension of the solutions under low-temperature conditions.
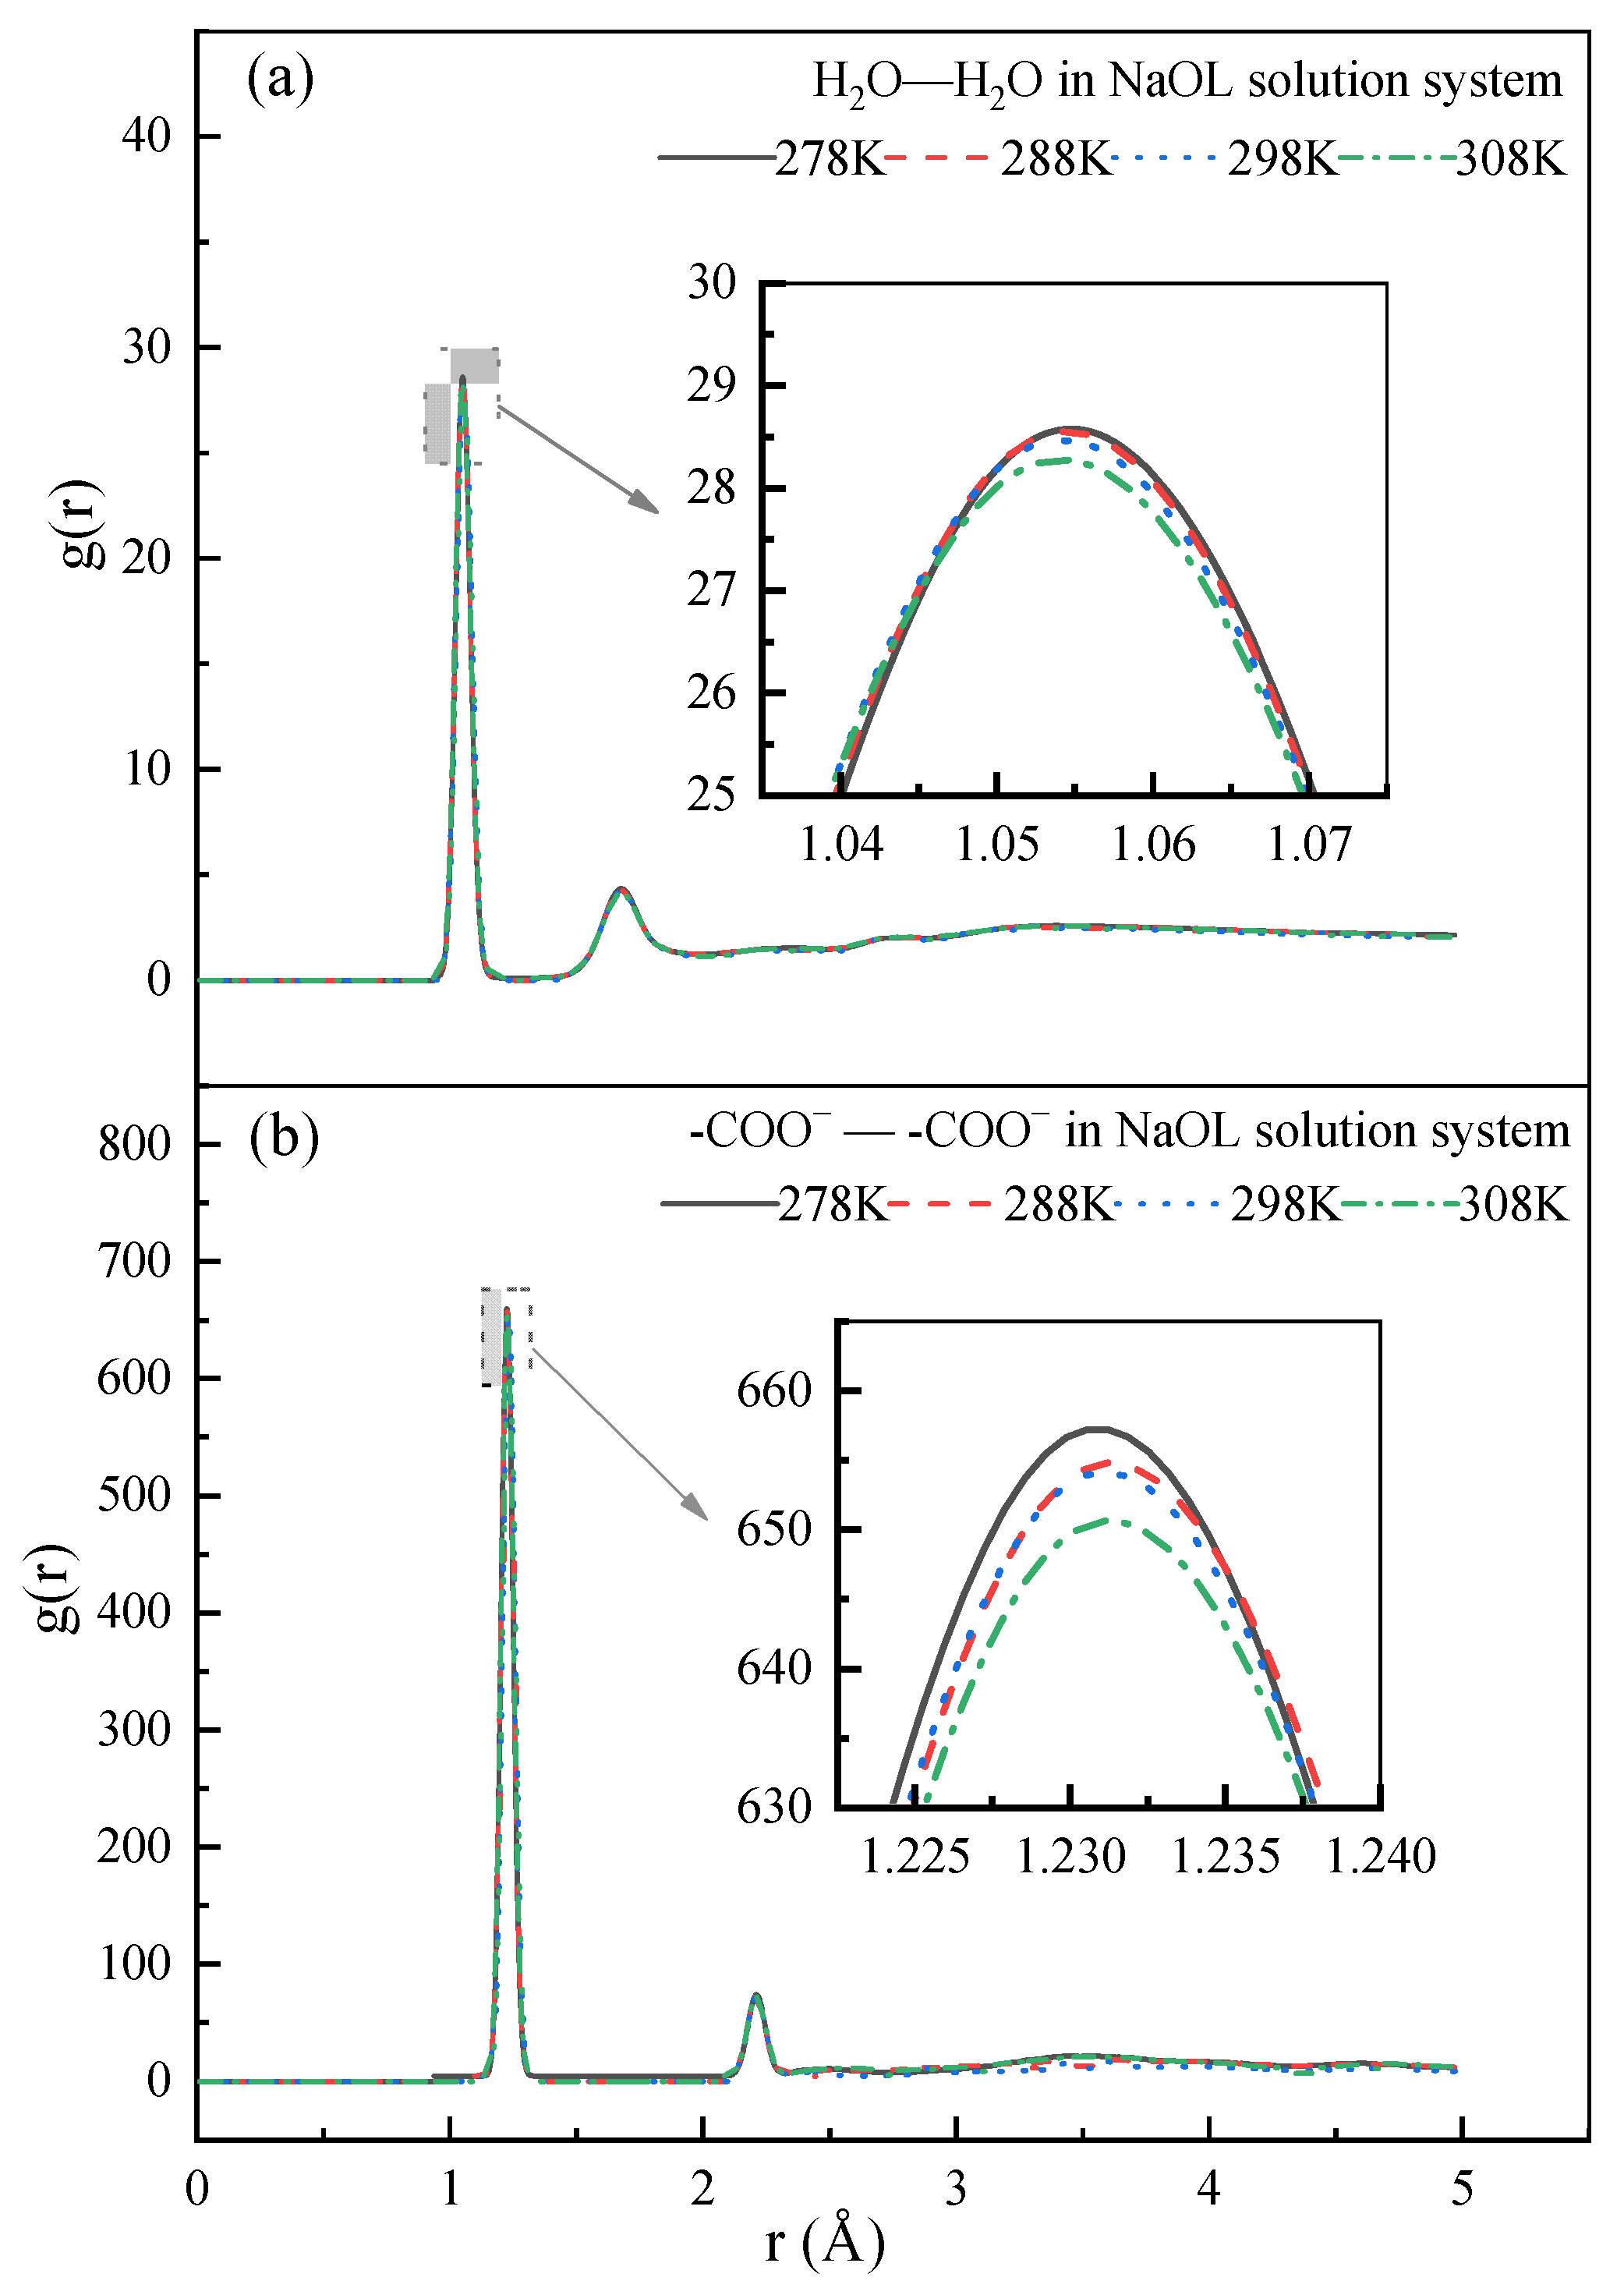
Contrastingly, the arrangement of the surfactants and water molecules was investigated through the analysis of the radial distribution function (RDF) of the H
2O and –COO
− constituents in the NaOL solution system, which is illustrated in
Figure 12. The RDF of water exhibits two peaks at radii of 1.05 Å and 1.69 Å, which represent the first and second dense water molecular layers encircling a fixed water molecule. The RDF of the –COO
− constituent displays two significant peaks at radii of 1.23 Å and 2.23 Å. These peaks represent the first and second dense carboxyl layers surrounding a fixed carboxyl. Significantly, both the RDF curves of the H
2O and –COO
− constituents exhibit a consistent pattern such that as the temperature decreases, the value of the main peak increases and its width diminishes, indicating strengthened molecular interactions, thereby elevating the surface tension of the NaOL solution.
3.5. Effect of Temperature on Molecular Thermal Motion
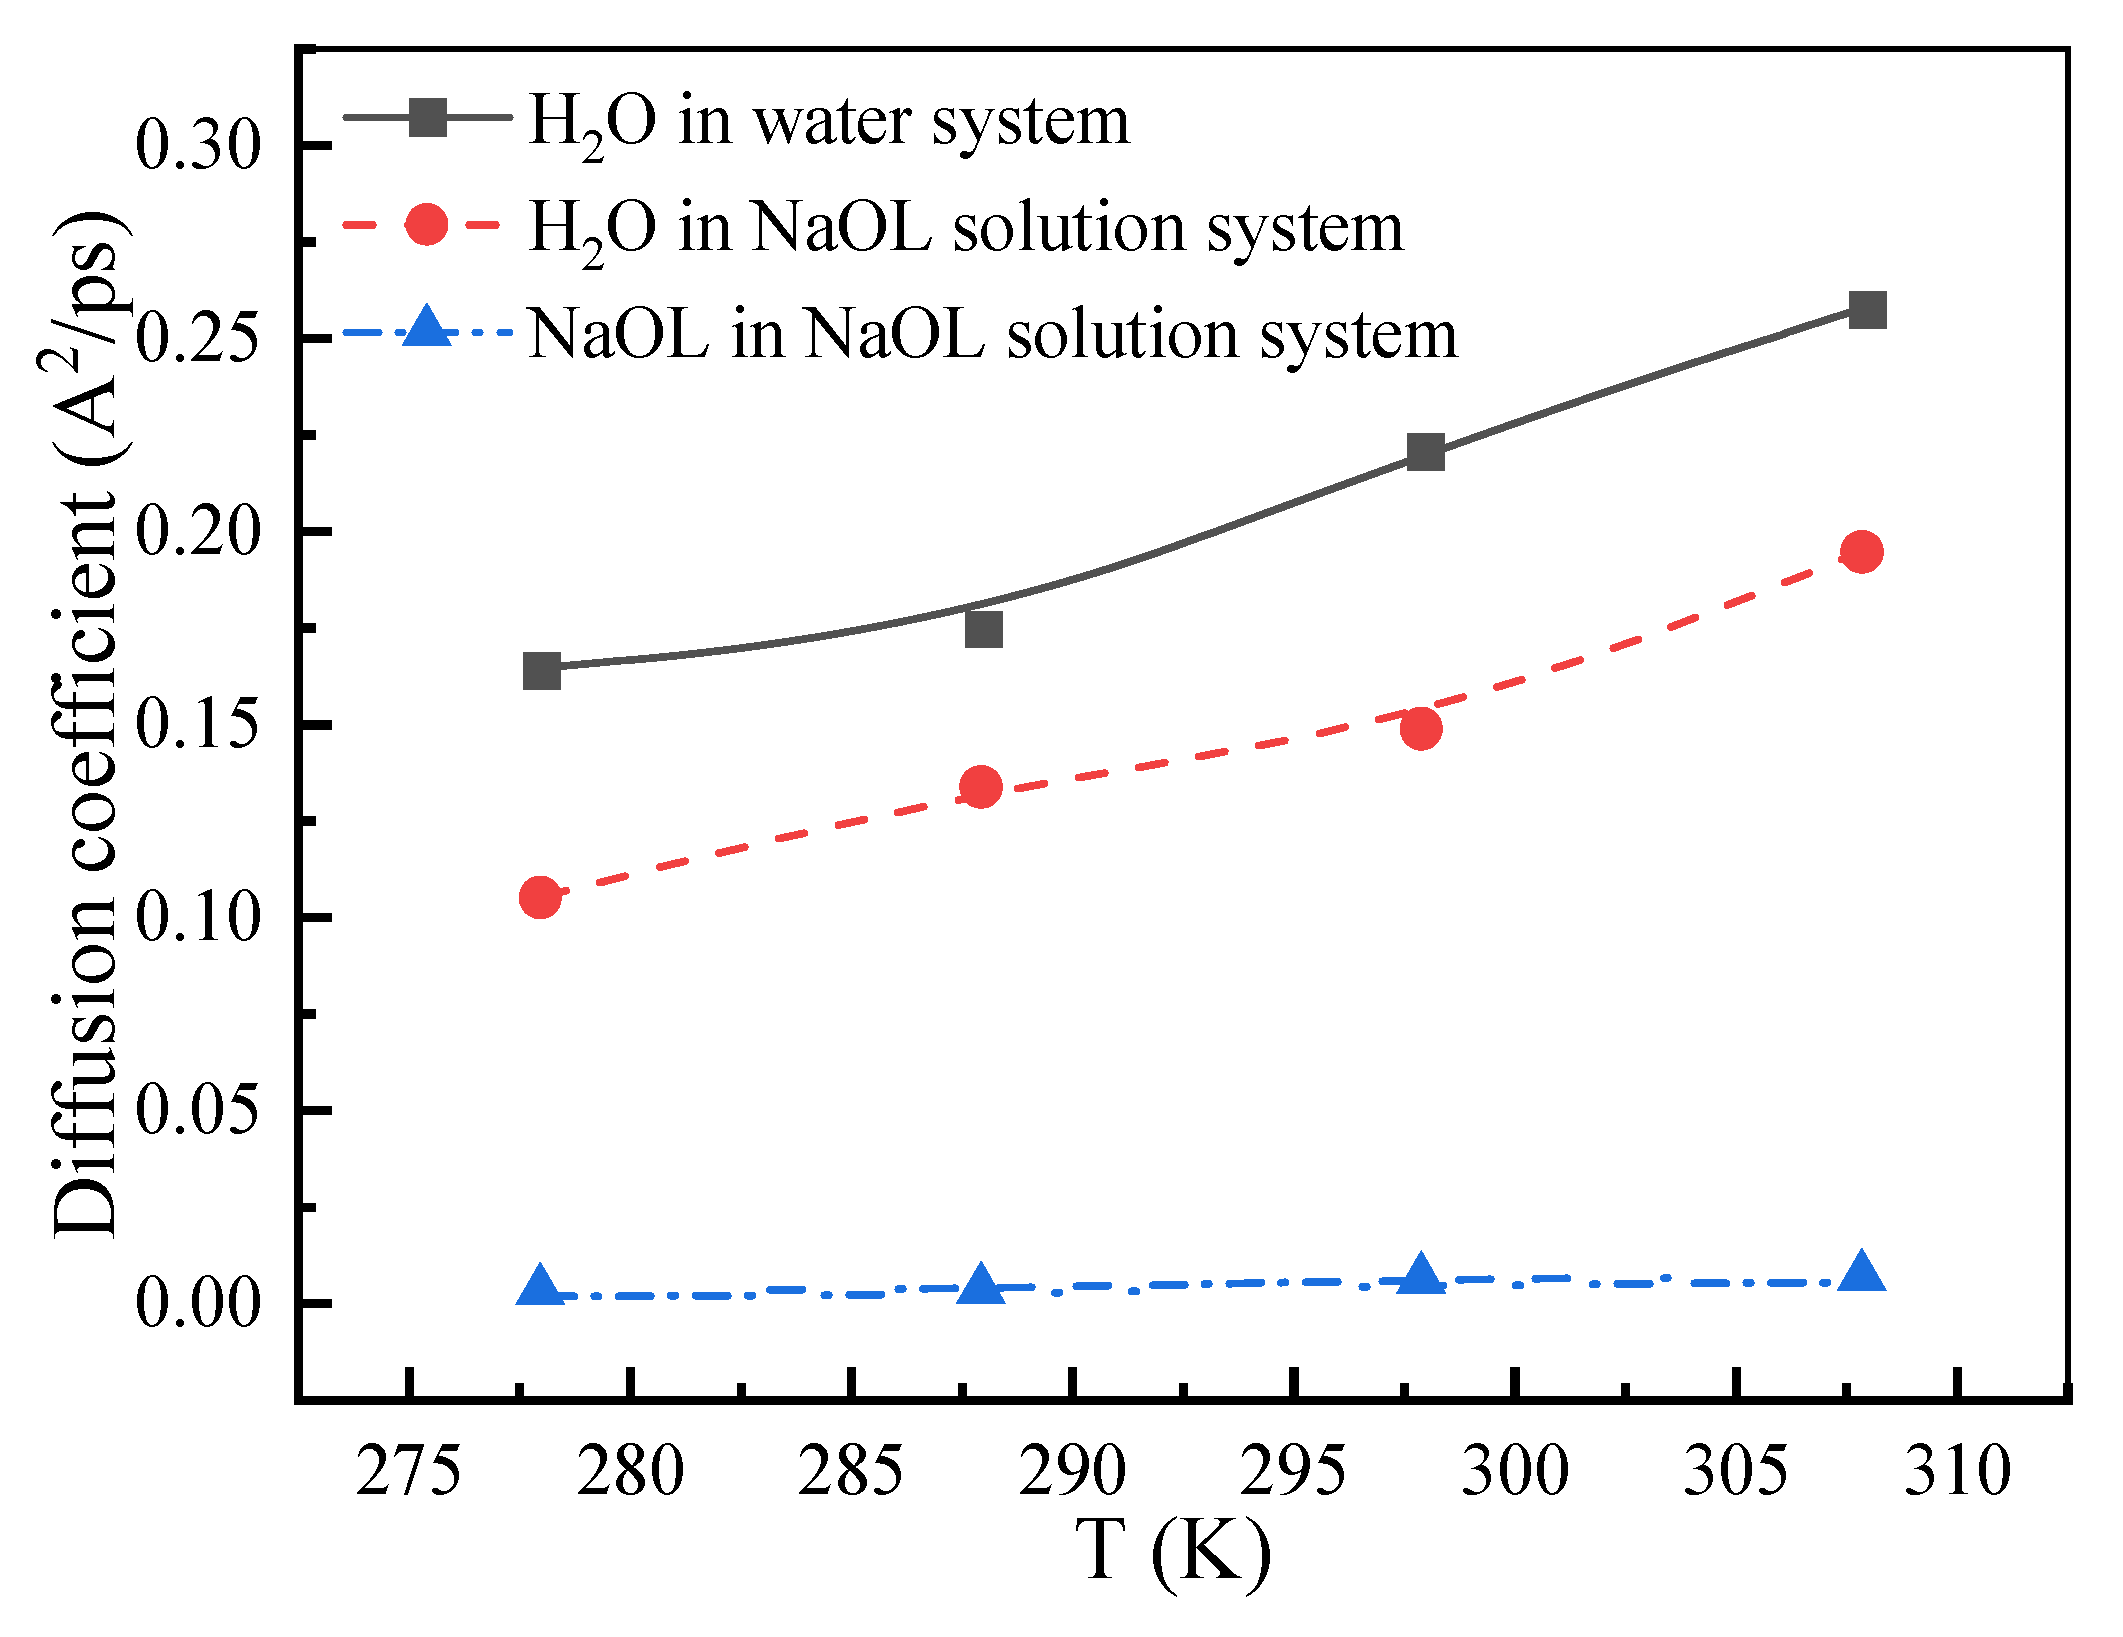
Based on the mean square displacement analysis of the H
2O and NaOL molecules in the water and NaOL solution systems, the relationship between the diffusion coefficient of these molecules (H
2O and NaOL molecules) and temperature is presented in
Figure 13. At each temperature, the diffusion coefficient of the water molecules in the NaOL system is approximately 30% lower than that in the water system. The amphiphilic structure of NaOL promotes its aggregation at the interface, leading to the interaction between its head group and water molecules at the interface, forming hydrogen bonds. Consequently, the water molecules at the interface transition from “free water” to “bound water”. The diffusion coefficient of water molecules in the water solution system exhibits a gradual decrease from 0.25755 Å
2/ps at 308.0 K to 0.16387 Å
2/ps at 278.0 K. As the temperature drops from 308.0 K to 278.0 K, the diffusion coefficient of the water molecules decreases from 0.1943 Å
2/ps to 0.10422 Å
2/ps and the diffusion coefficient of the NaOL molecules shows a reduction from 0.00561 Å
2/ps to 0.00199 Å
2/ps, in the NaOL solution system.
Consequently, the decrease in the molecular thermal motion in the NaOL solution system as the temperature decreases reduces the probability of intermolecular hydrogen bond rupture. This stability enhances intermolecular interactions, thereby elevating the surface tension of the NaOL solution.
4. Conclusions
This research investigated the effect of temperature on spodumene flotation in NaOL systems by employing both experimental studies and MD simulations. Micro-flotation tests revealed that a decrease in temperature from 305.4 K to 277.3 K resulted in a significant decrease, from 55.3% to 5.1%, in the floatation recovery of spodumene.
The decrease in temperature from 294.9 K to 281.9 K resulted in an increase in the surface tension of the NaOL solution, from 37.88 to 40.71 mN/m. Simultaneously, its CMC decreased from 9.49 × 10⁻⁴ mol/L at 305.0 K to 6.85 × 10⁻⁴ mol/L at 288.0 K. The rise in the surface tension of the NaOL solution with decreasing temperature, reflecting a decline in the collecting efficiency of NaOL, emerges as the primary factor contributing to the reduced flotation recovery of spodumene at lower temperatures.
The study of the intermolecular interaction forces reveals that a decrease in temperature leads to an increase in the number of hydrogen bonds, a decrease in the length of the hydrogen bonds, and an increase in the angle of the hydrogen bonds in the NaOL solution. The results concerning the interfacial structure of the solution demonstrate that lowering the temperature leads to decreased intermolecular spacing, increased density, and reduced interface thickness. The results of molecular thermal motion indicated that decreasing the temperature caused a reduction in the diffusion coefficient of molecules within the NaOL solution. These changes strengthen the intermolecular interactions at the interface, ultimately increasing the surface tension and consequently diminishing the collecting performance of the NaOL solution. Despite the limitations of the ideal model, MD simulation studies have convincingly shown that low temperatures impact the gas–liquid interface’s molecular interactions, structure, and molecular thermal motion. This is one of the mechanisms contributing to the challenges in collector performance, and spodumene flotation specifically, in high-altitude and cold regions.
5. Future Works
In high-altitude regions, the environmental factors that have negative effects on spodumene flotation are not only temperature but also atmospheric pressure, air humidity, oxygen content, and so on. Exploring the impacts of these factors is a novel and promising research avenue for future studies. While this paper primarily addresses the influence of temperature on spodumene flotation, with a focus on the gas–liquid interface, future research will expand on this to include the solid–liquid interface and the gas–liquid–solid three-phase interface. This will encompass aspects such as reagent and mineral adsorption, as well as the processes of the collision, adsorption, and desorption of bubbles from particles. These foundational studies aim to develop reagents and process services suitable for flotation recovery in cold high-altitude regions, with the ultimate goal of efficiently exploiting the resources in these areas.


