
Petrography and Geochemistry of Hydrothermal Alteration in the Low-Sulfidation Epithermal Kestanelik Au Deposit, Biga Peninsula, NW Turkey

Abstract
:1. Introduction
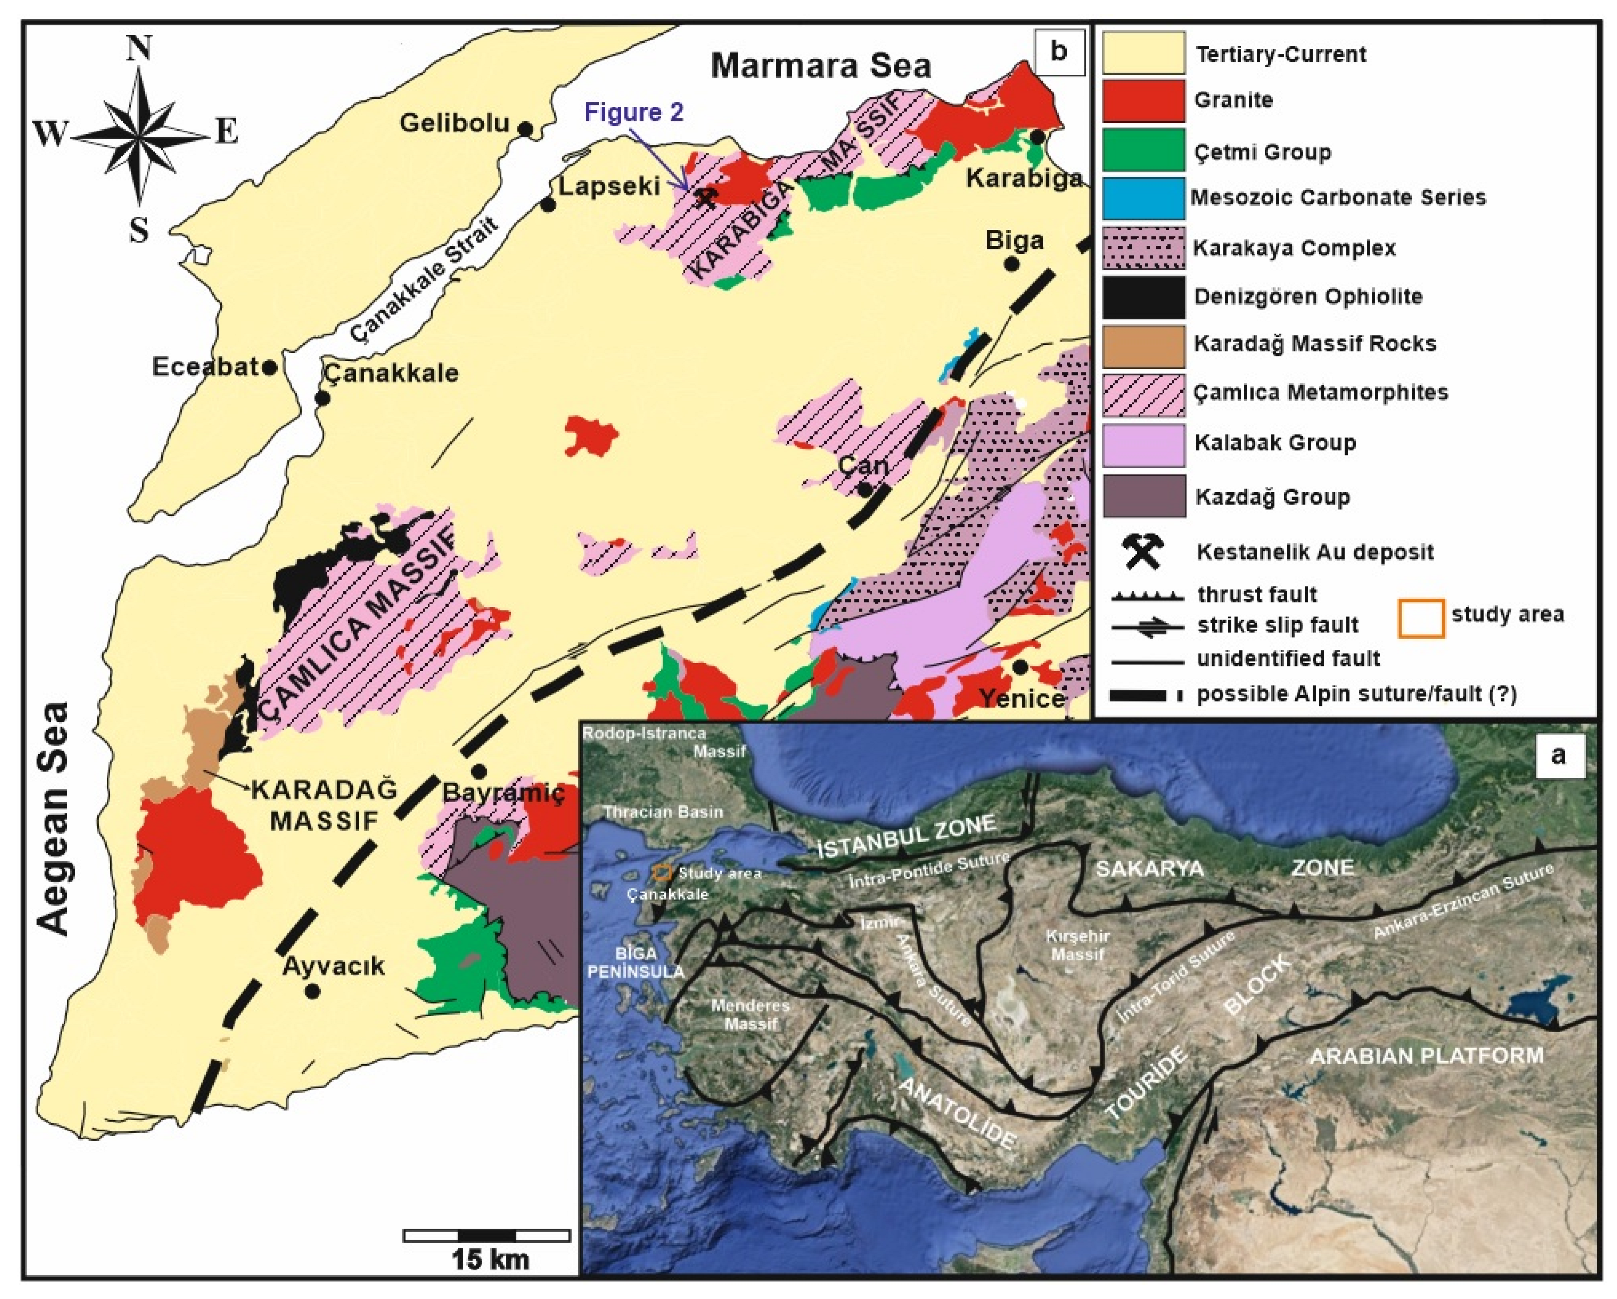
2. Regional Geology
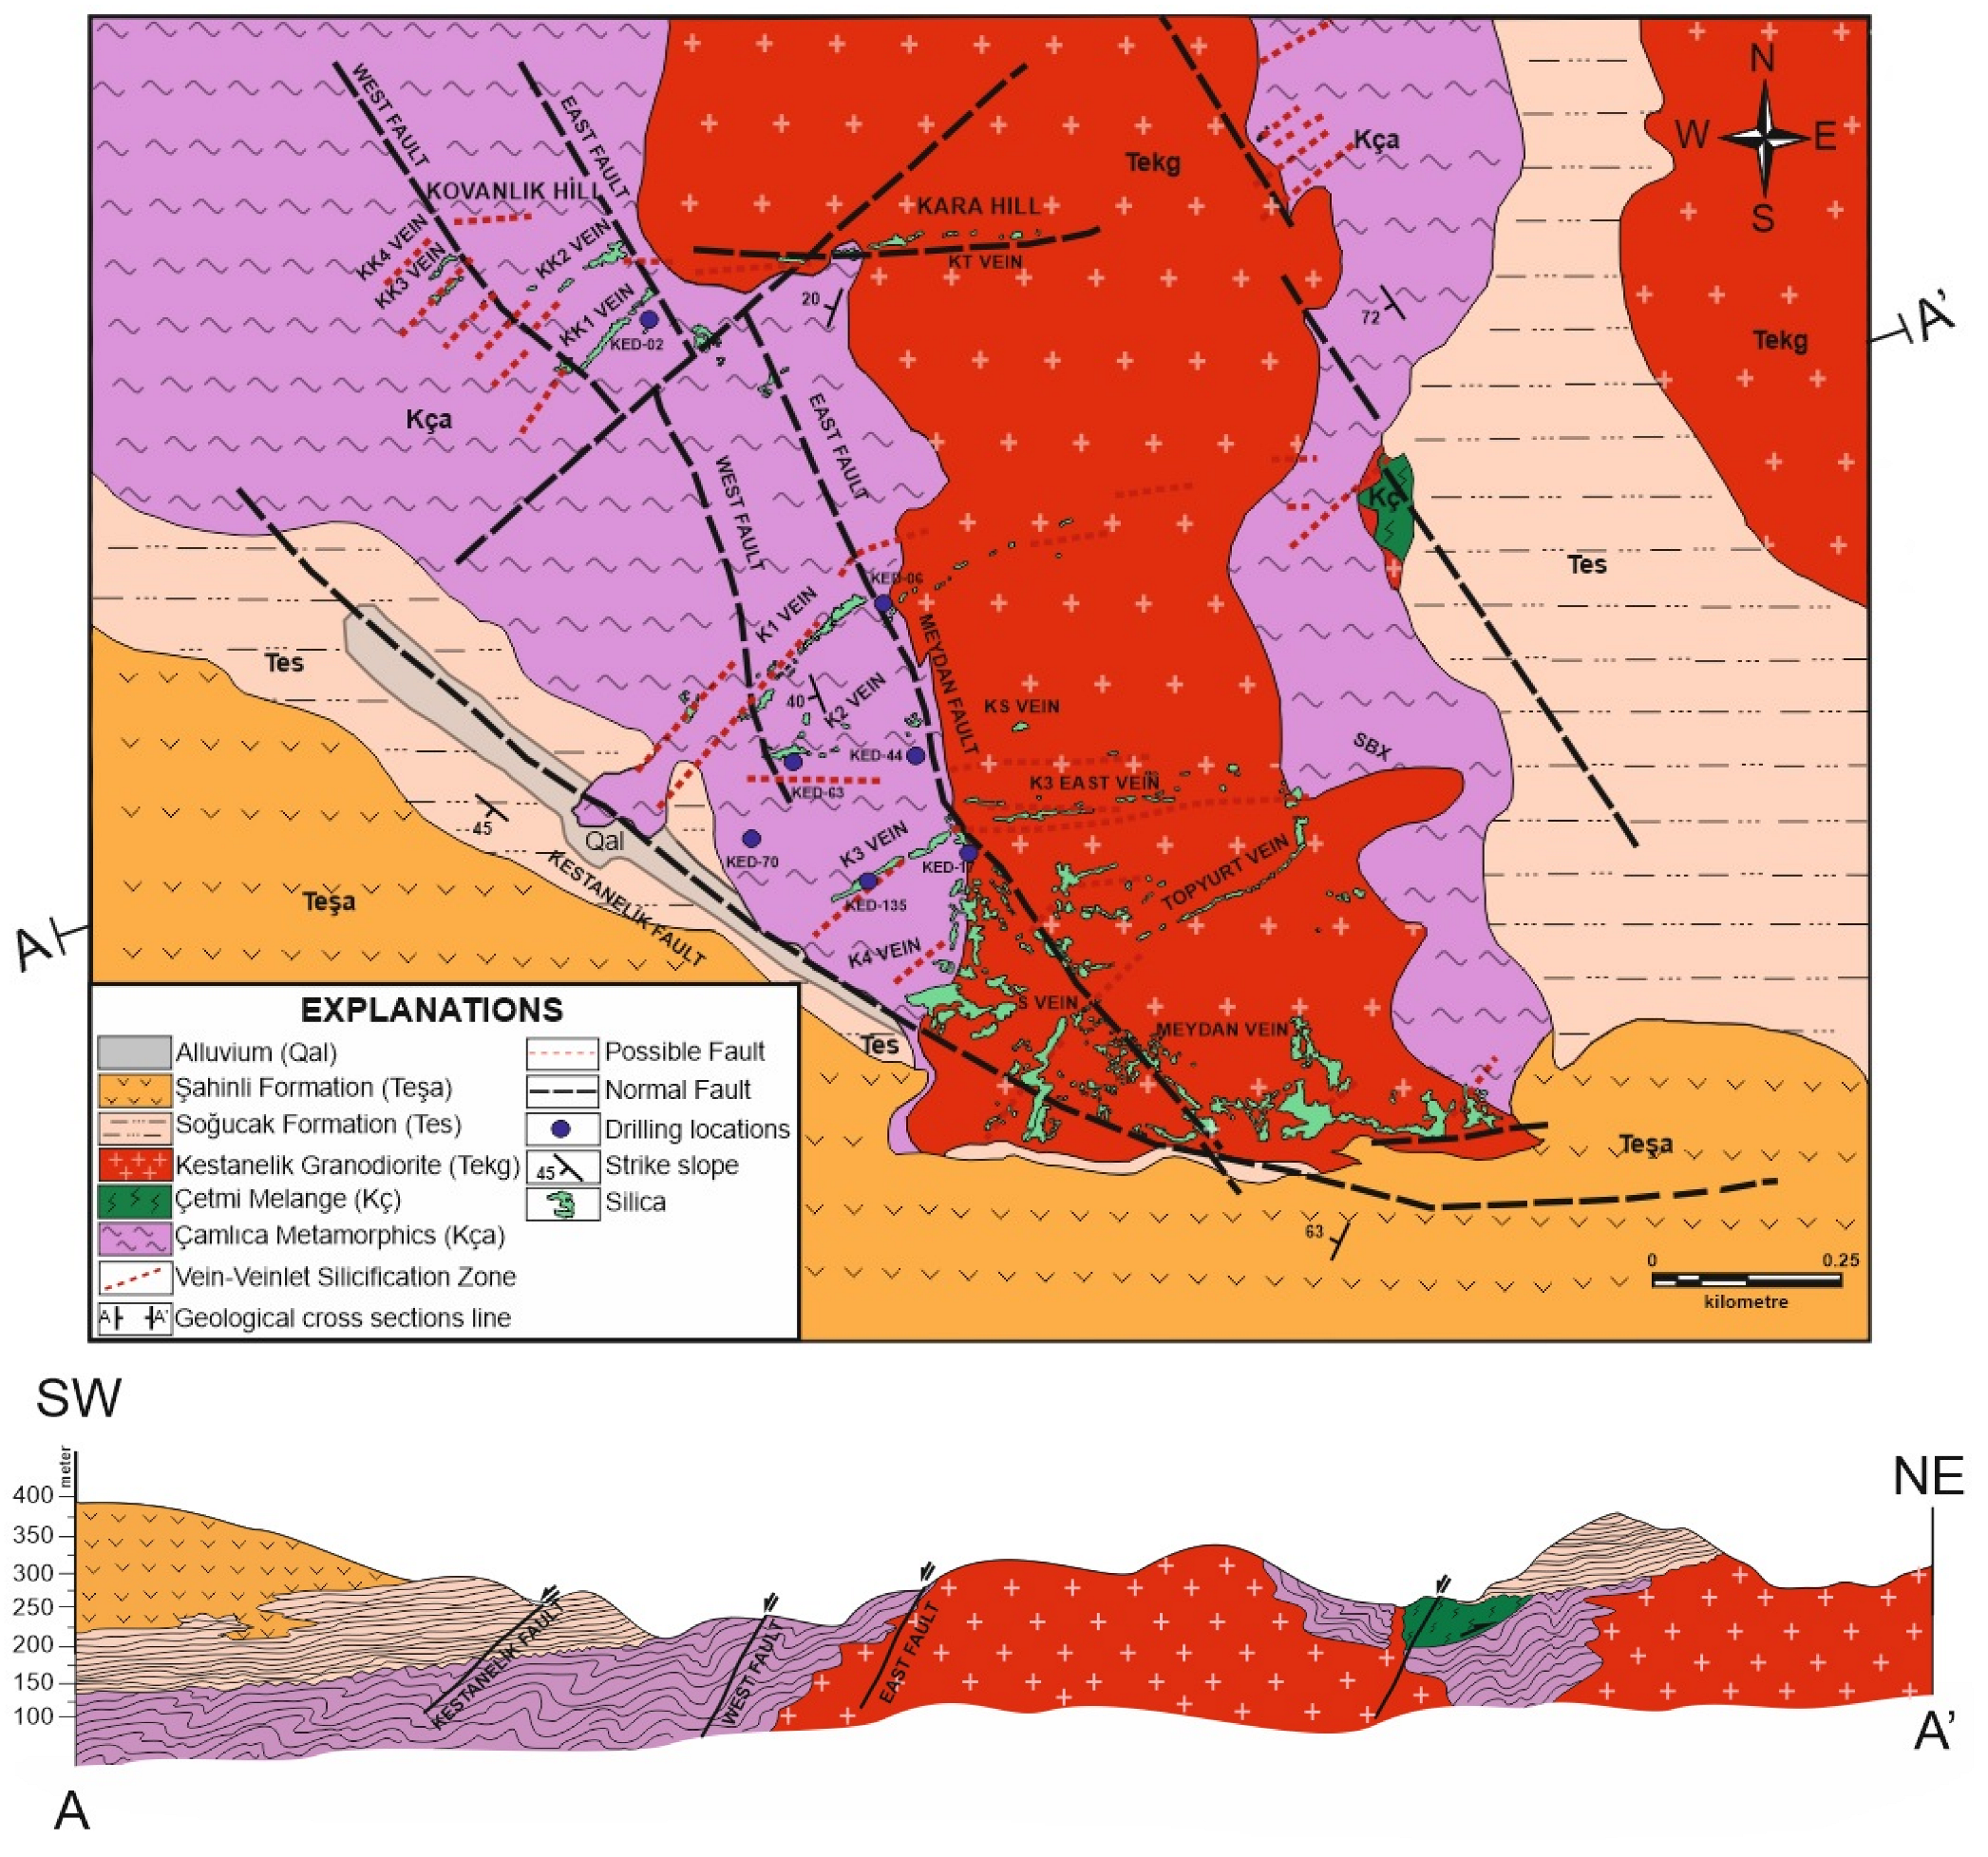
3. Local Geology
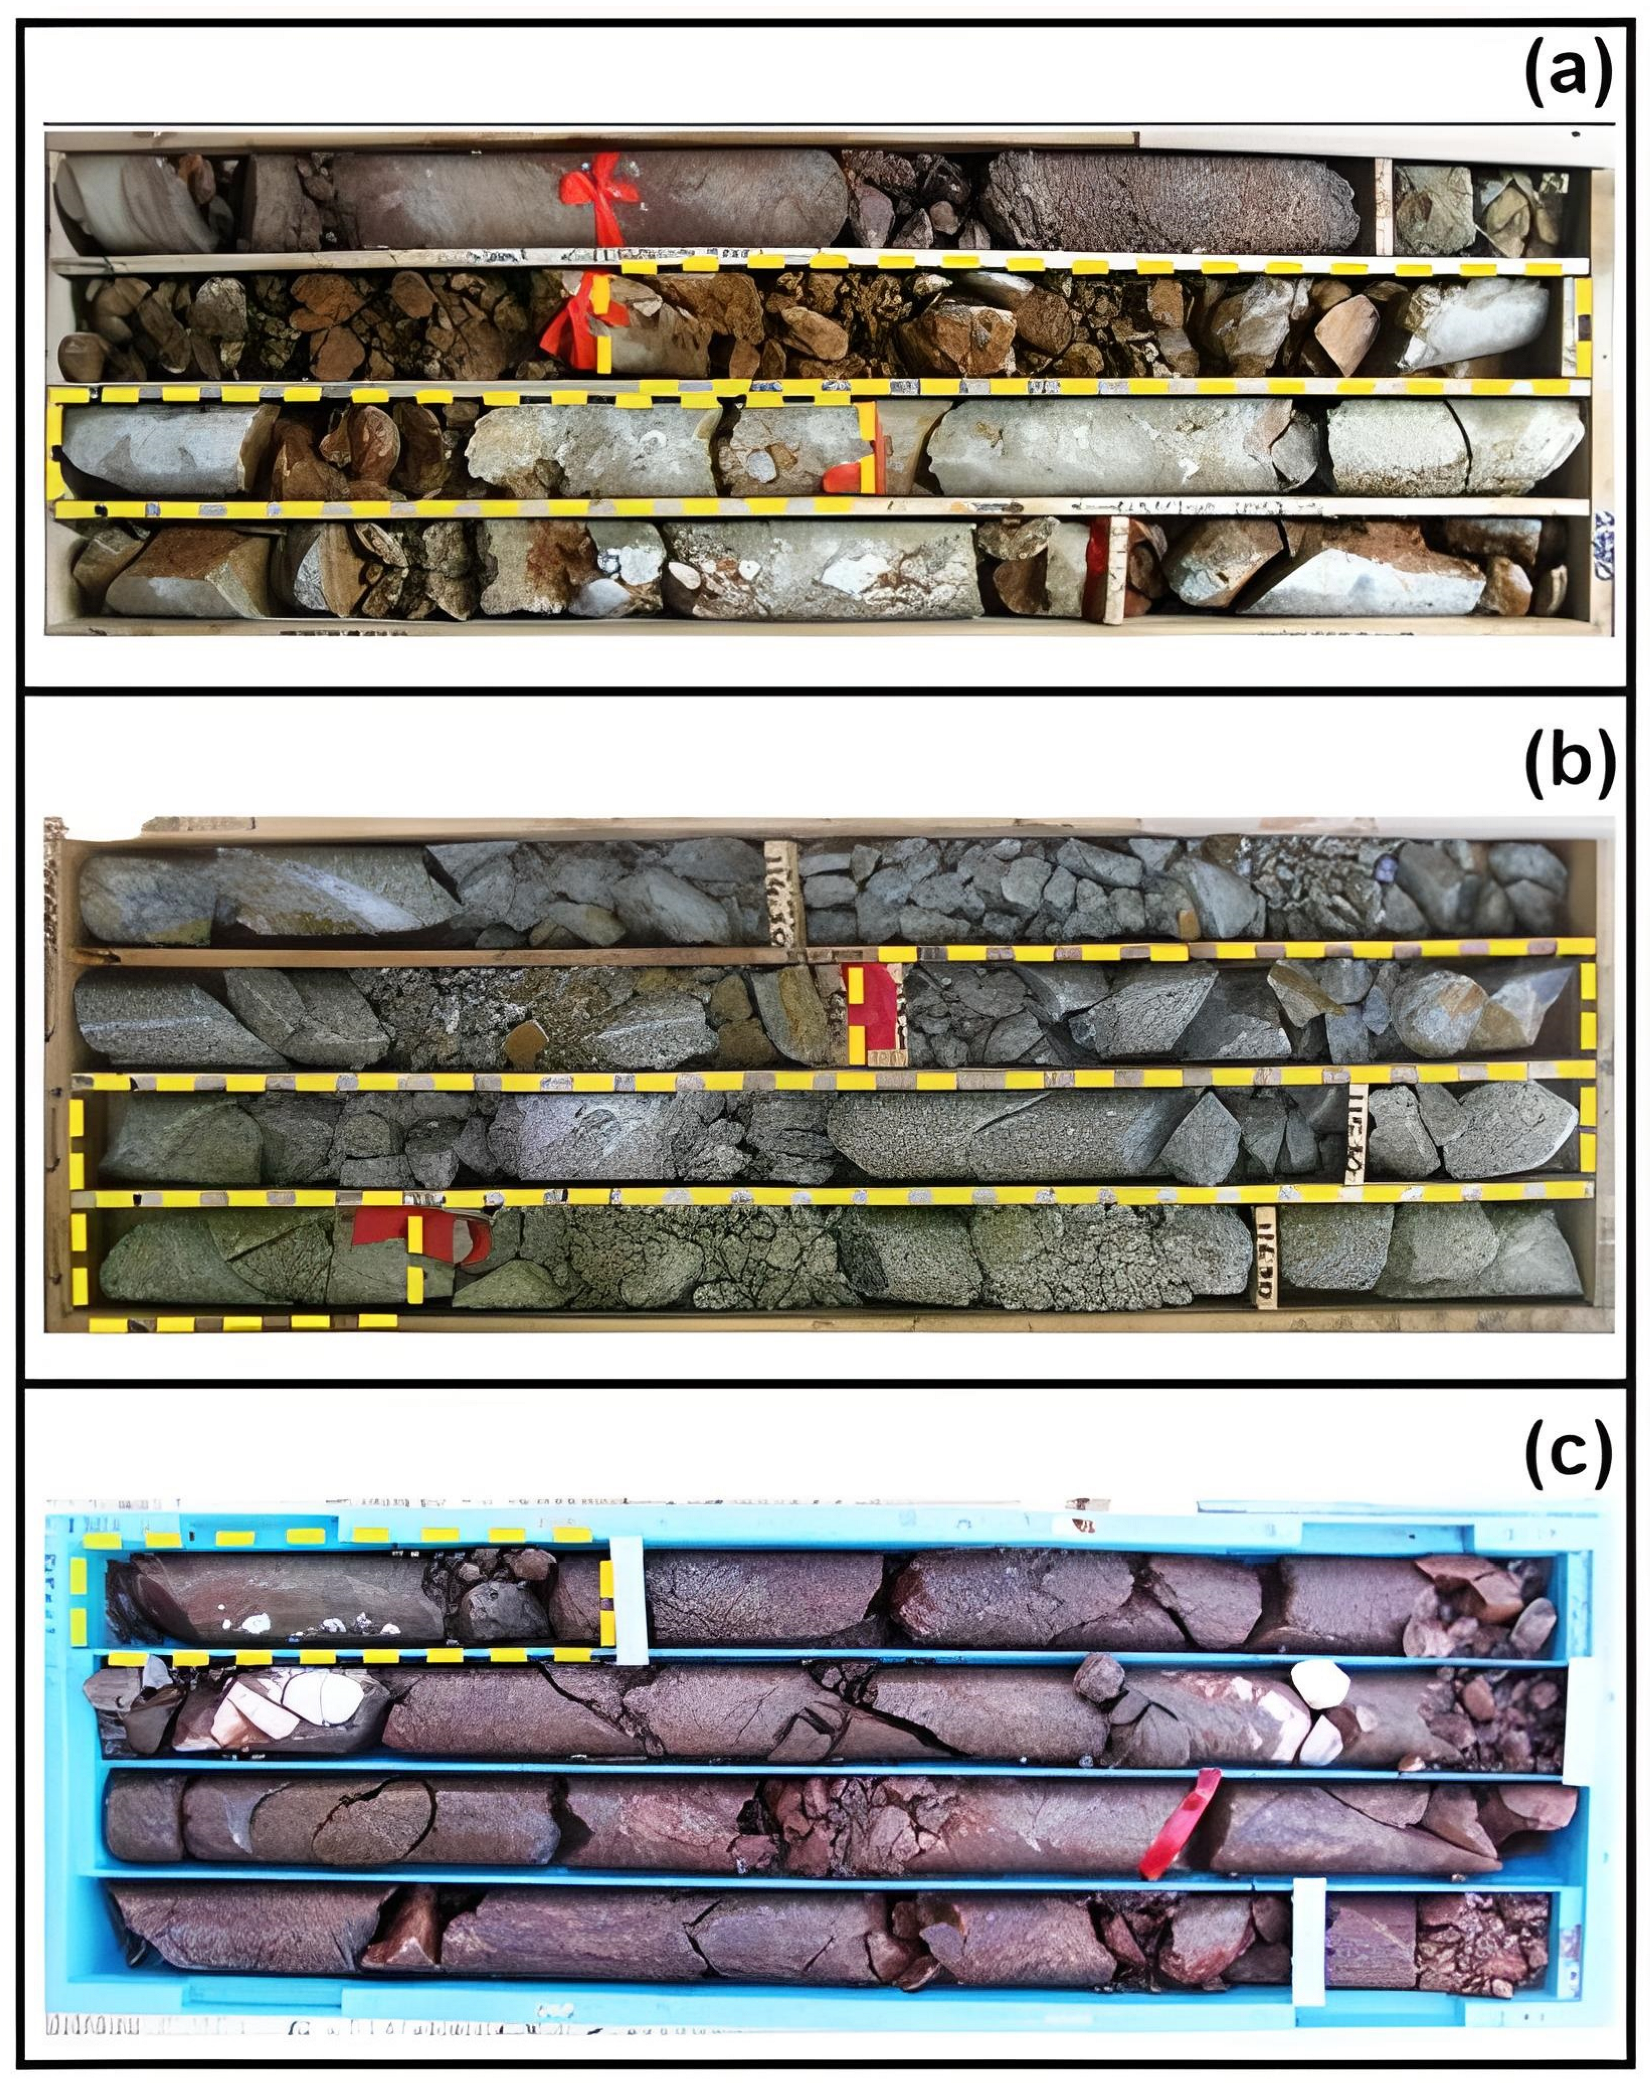
4. Materials and Methods
5. Results
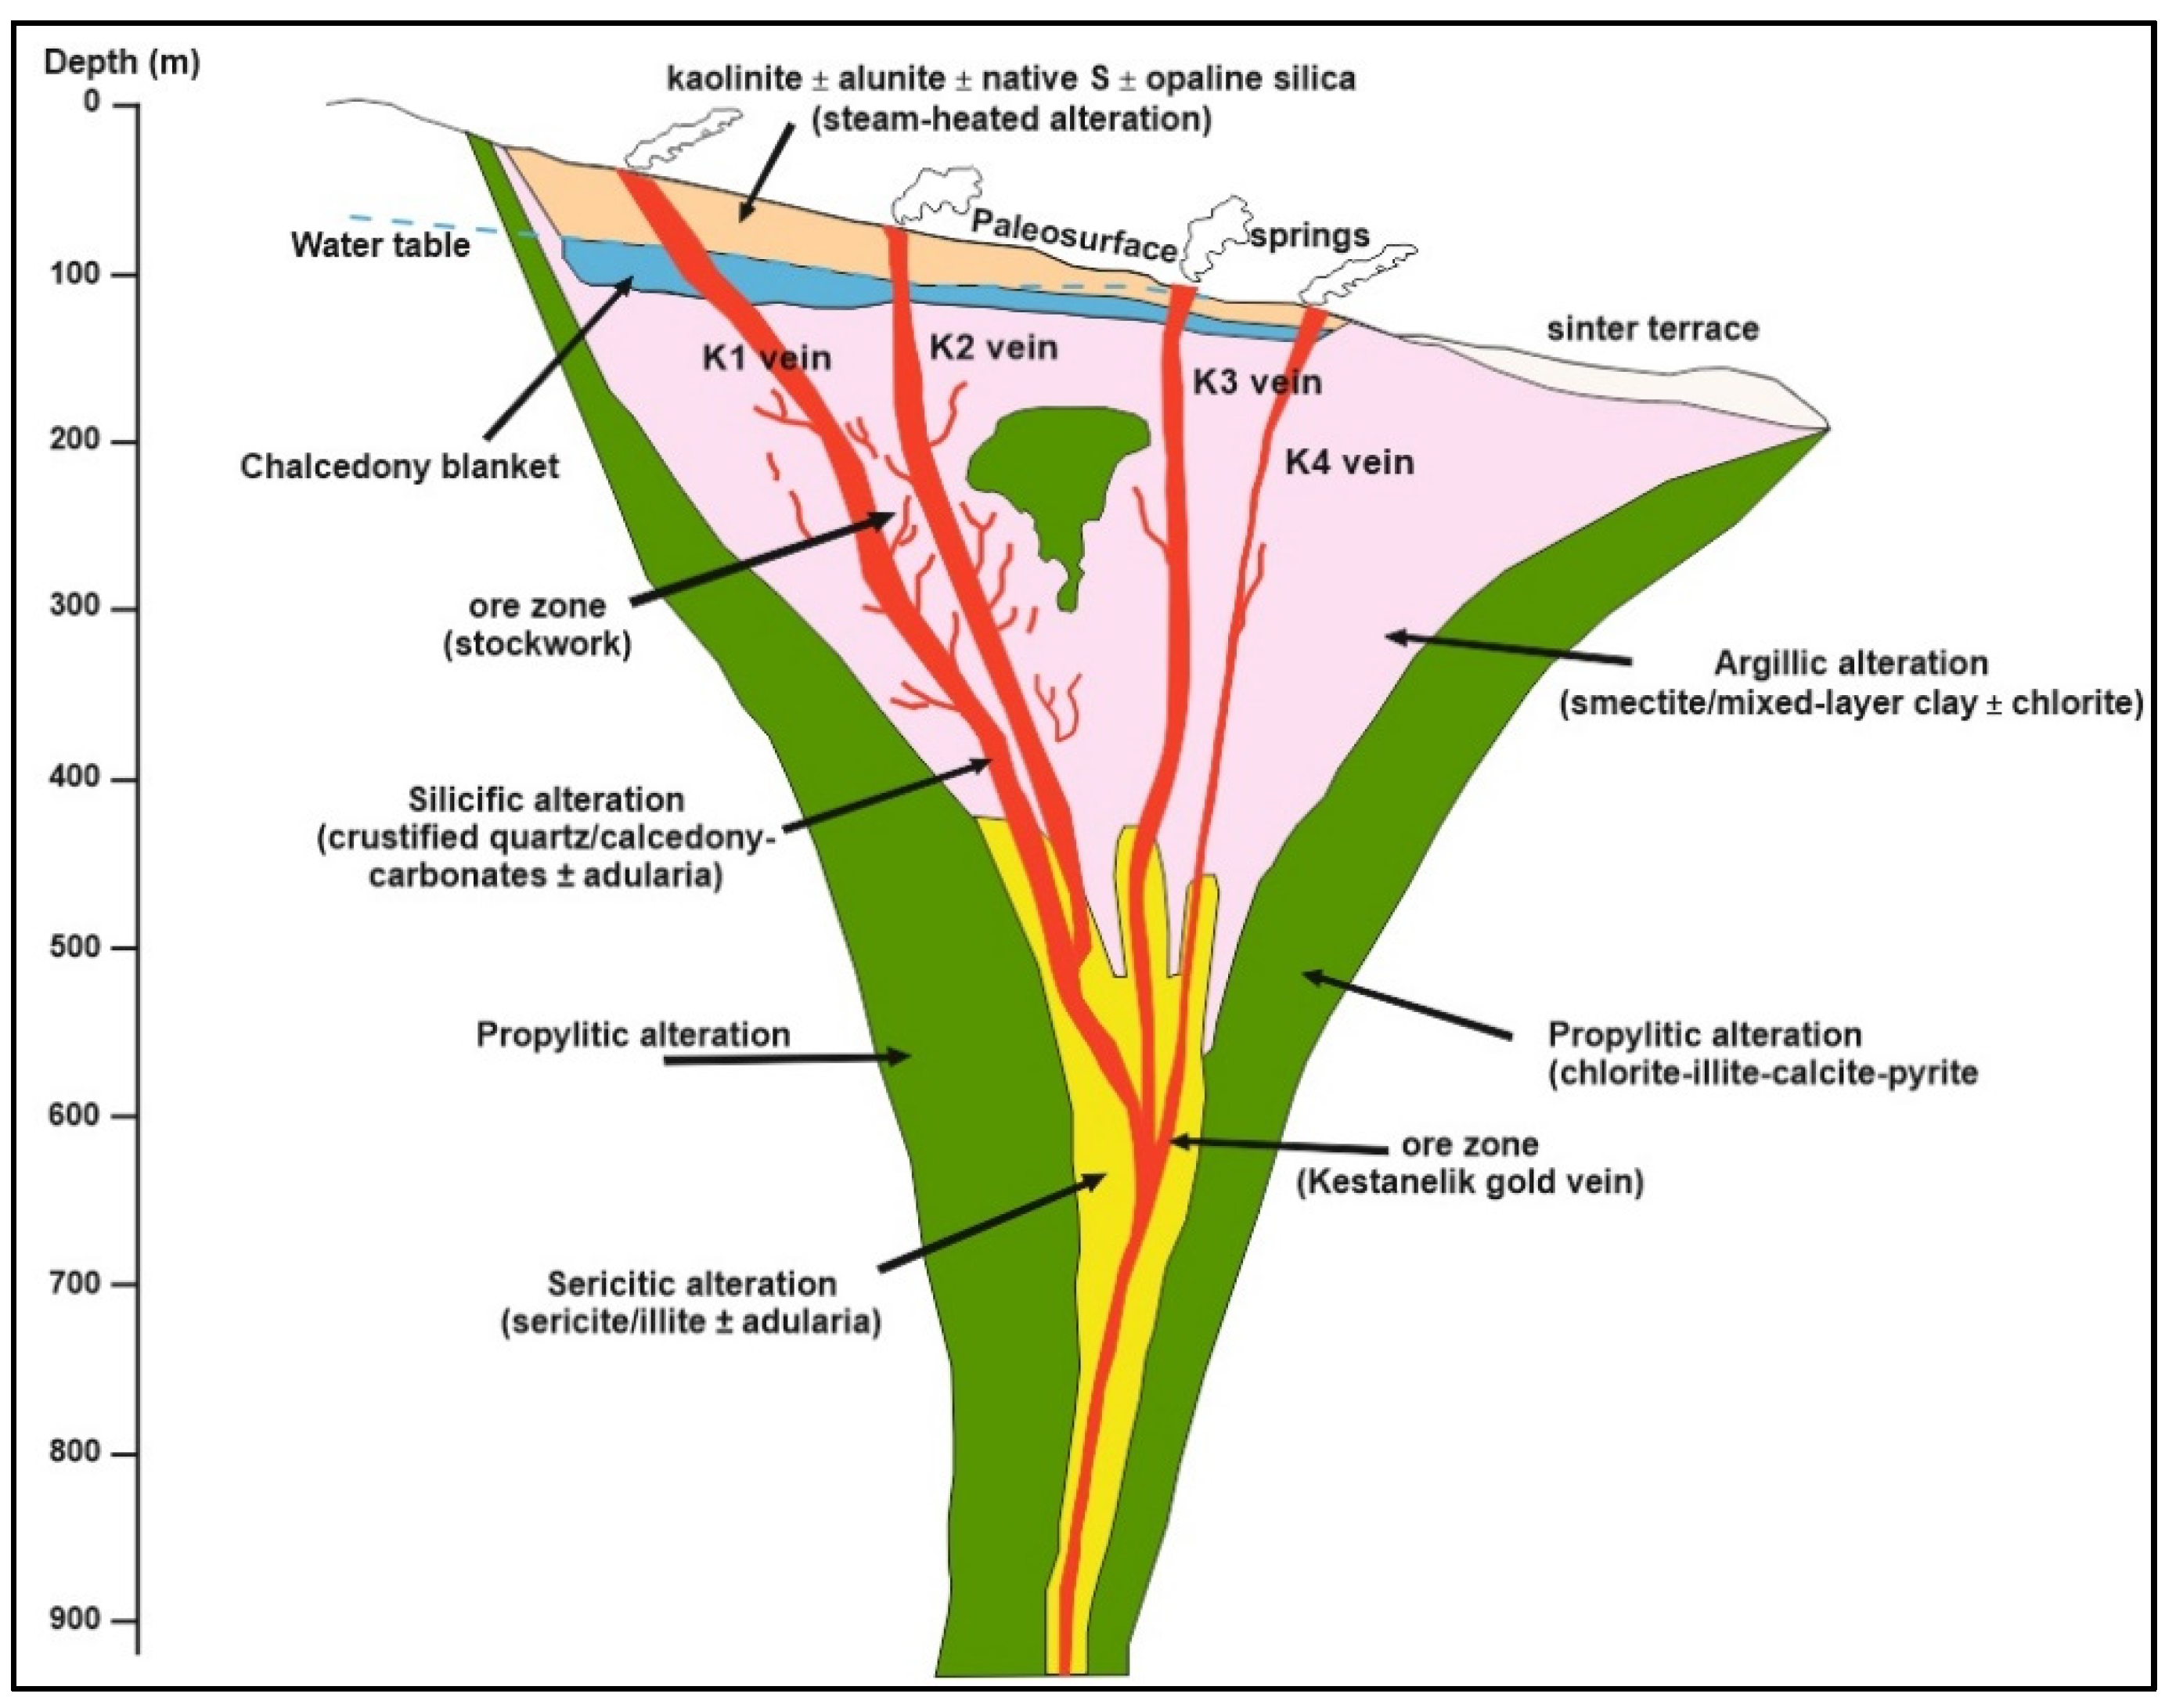
5.1. Hydrothermal Alteration and Au Mineralization
5.2. Petrography–Mineralogy of Alteration Forms
5.2.1. Polarizing Microscope Investigations
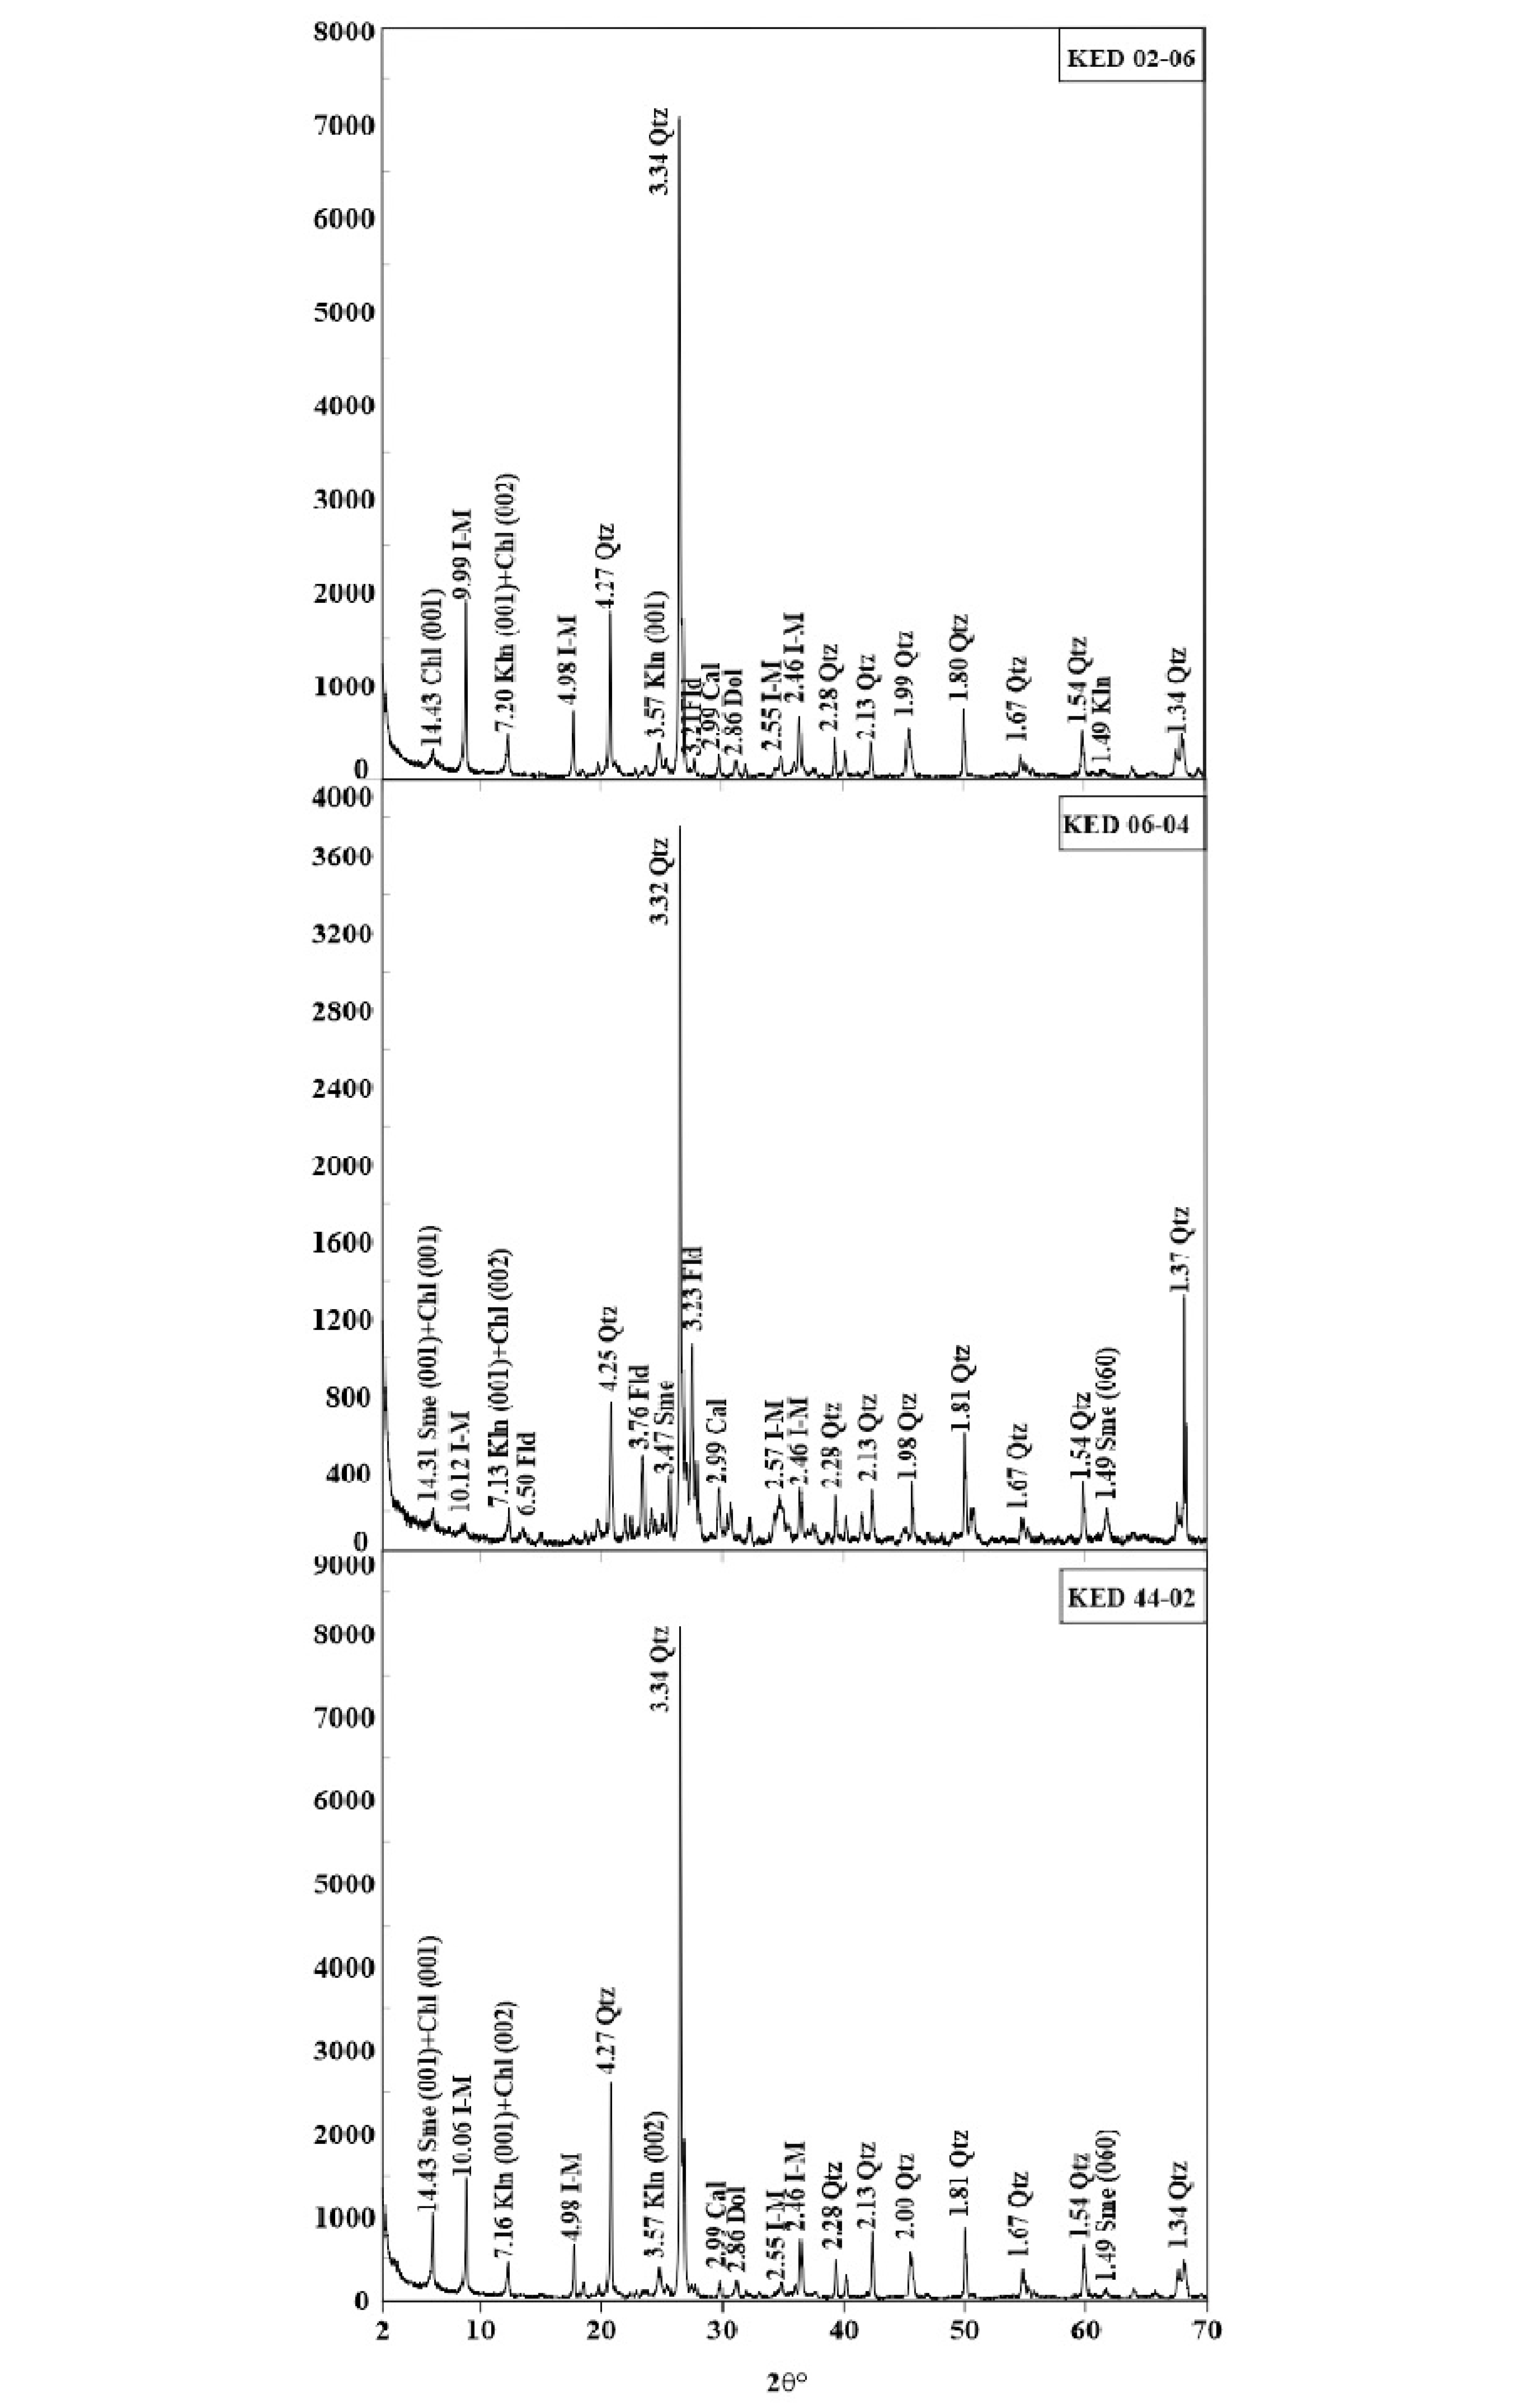
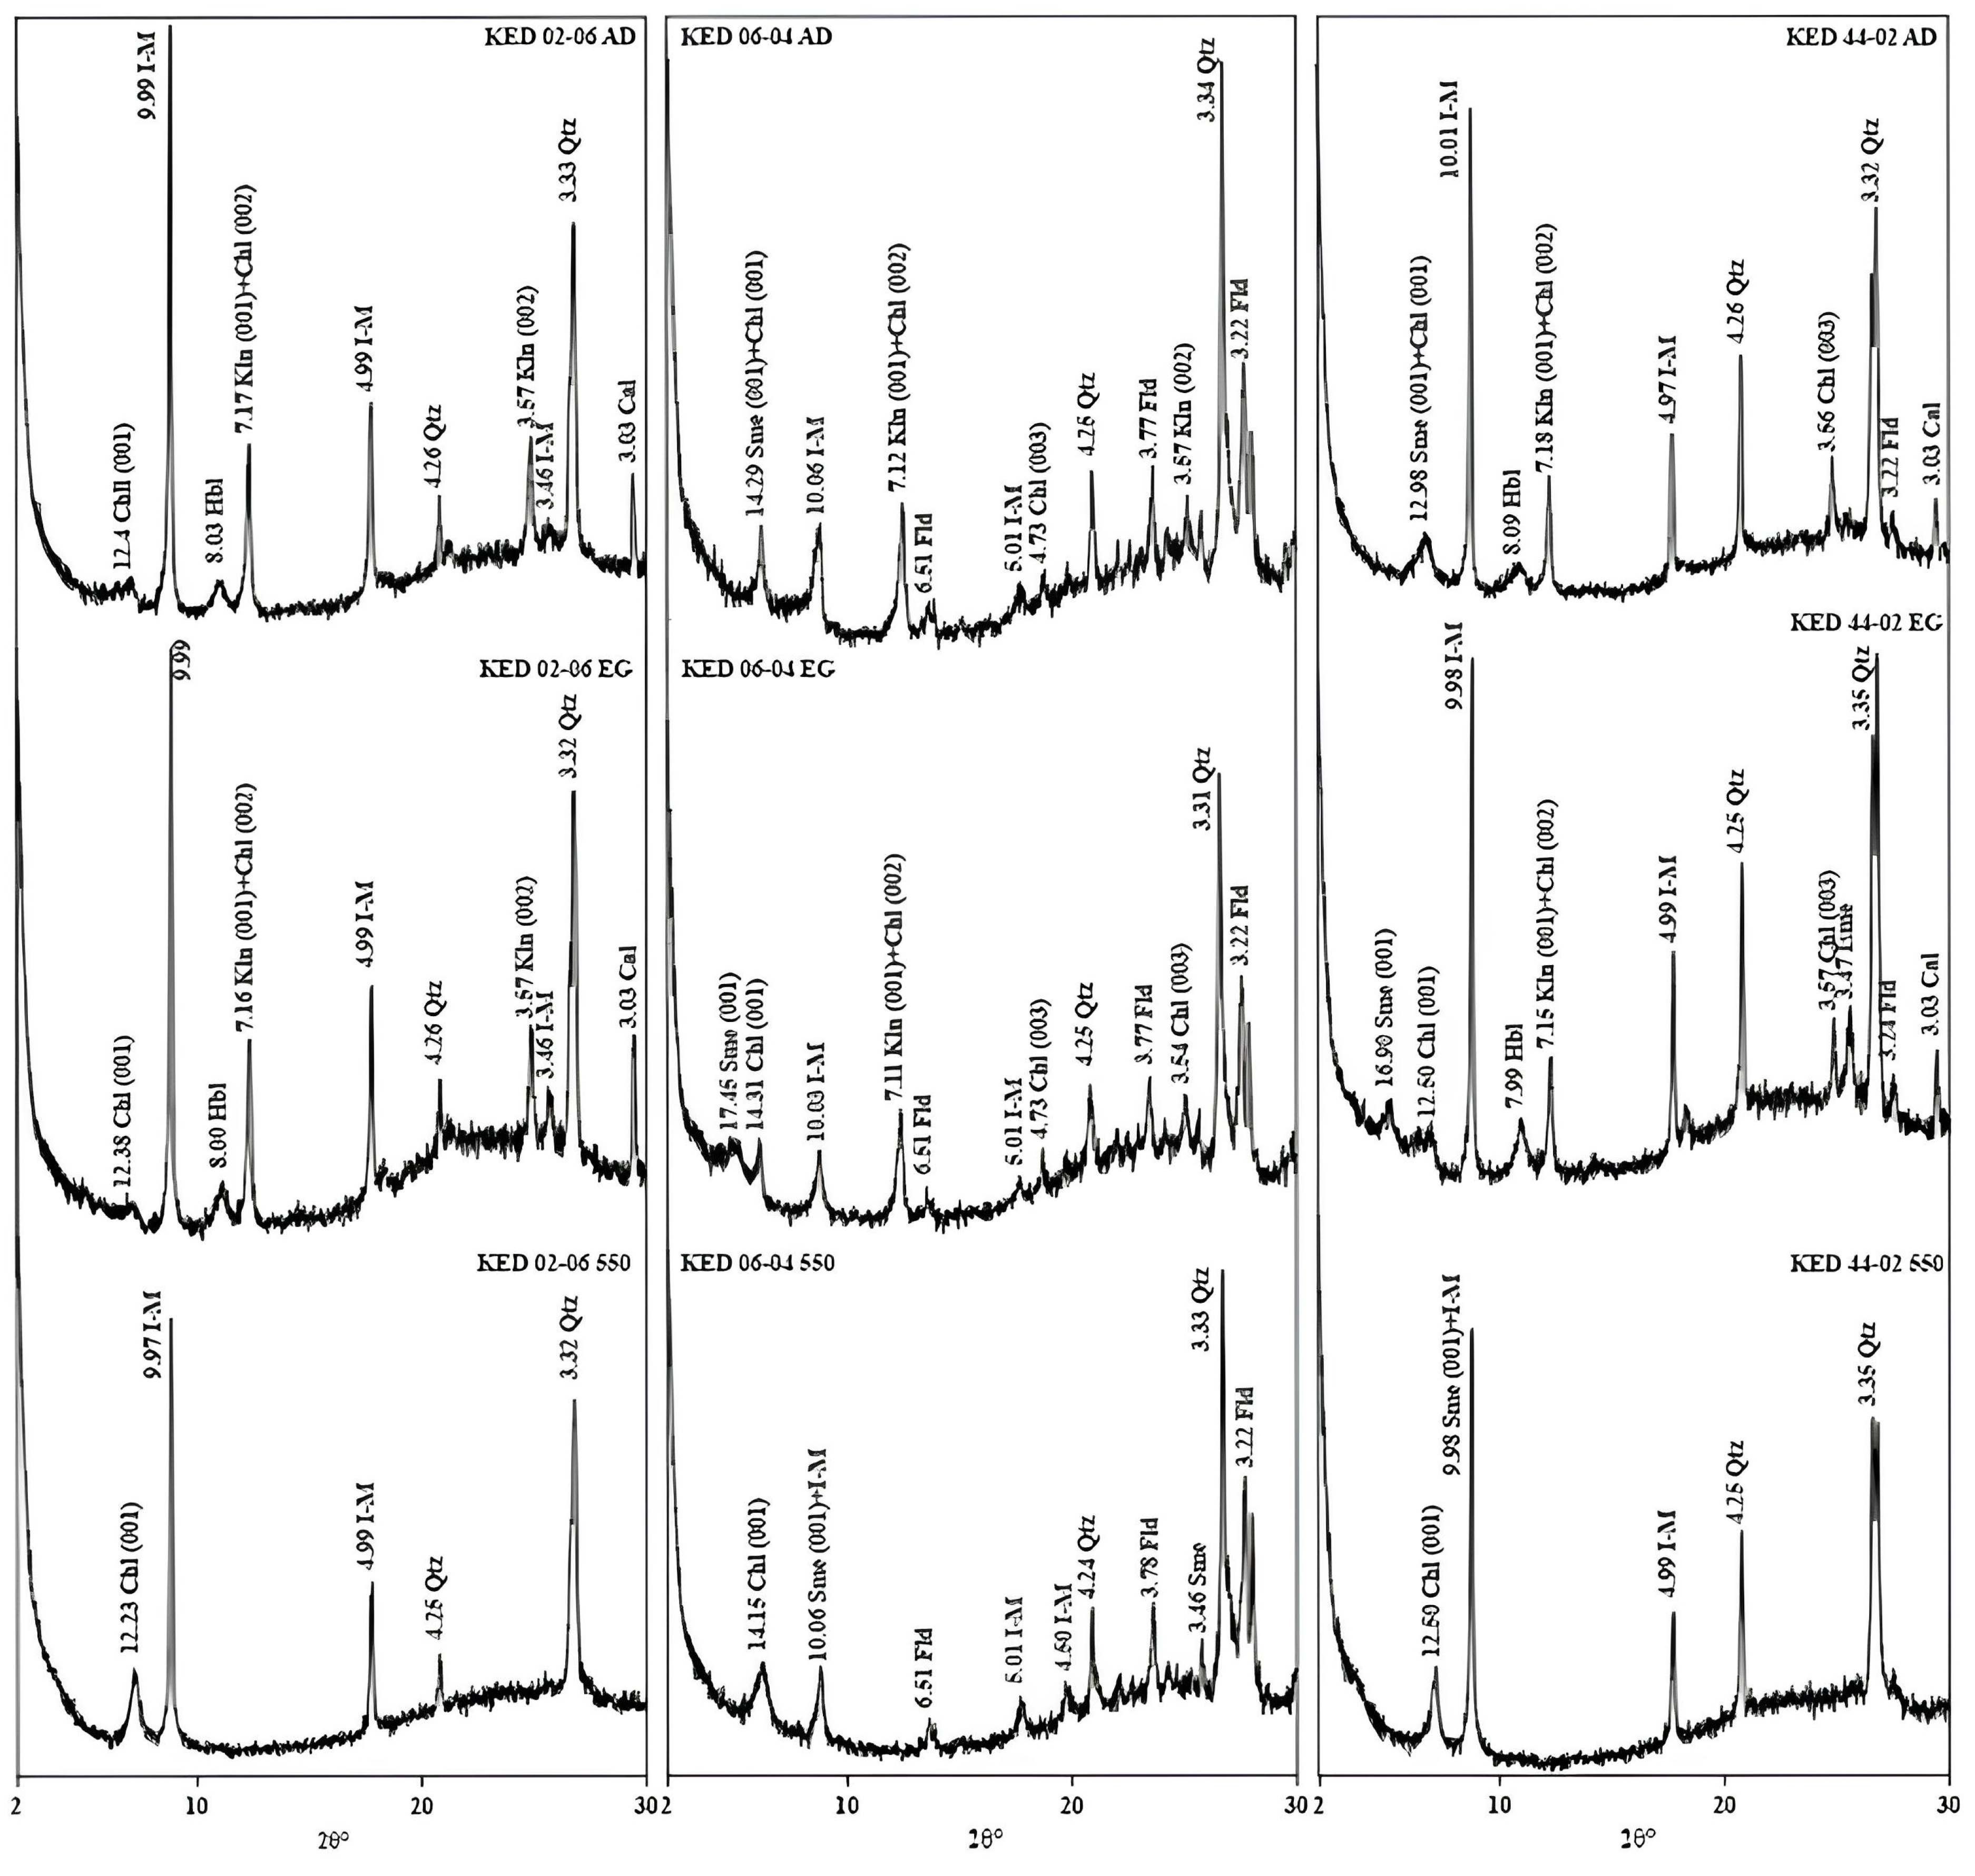
5.2.2. X-ray Diffraction-Mineralogy of Alteration
5.3. Geochemistry
5.3.1. Petrogenic Elements
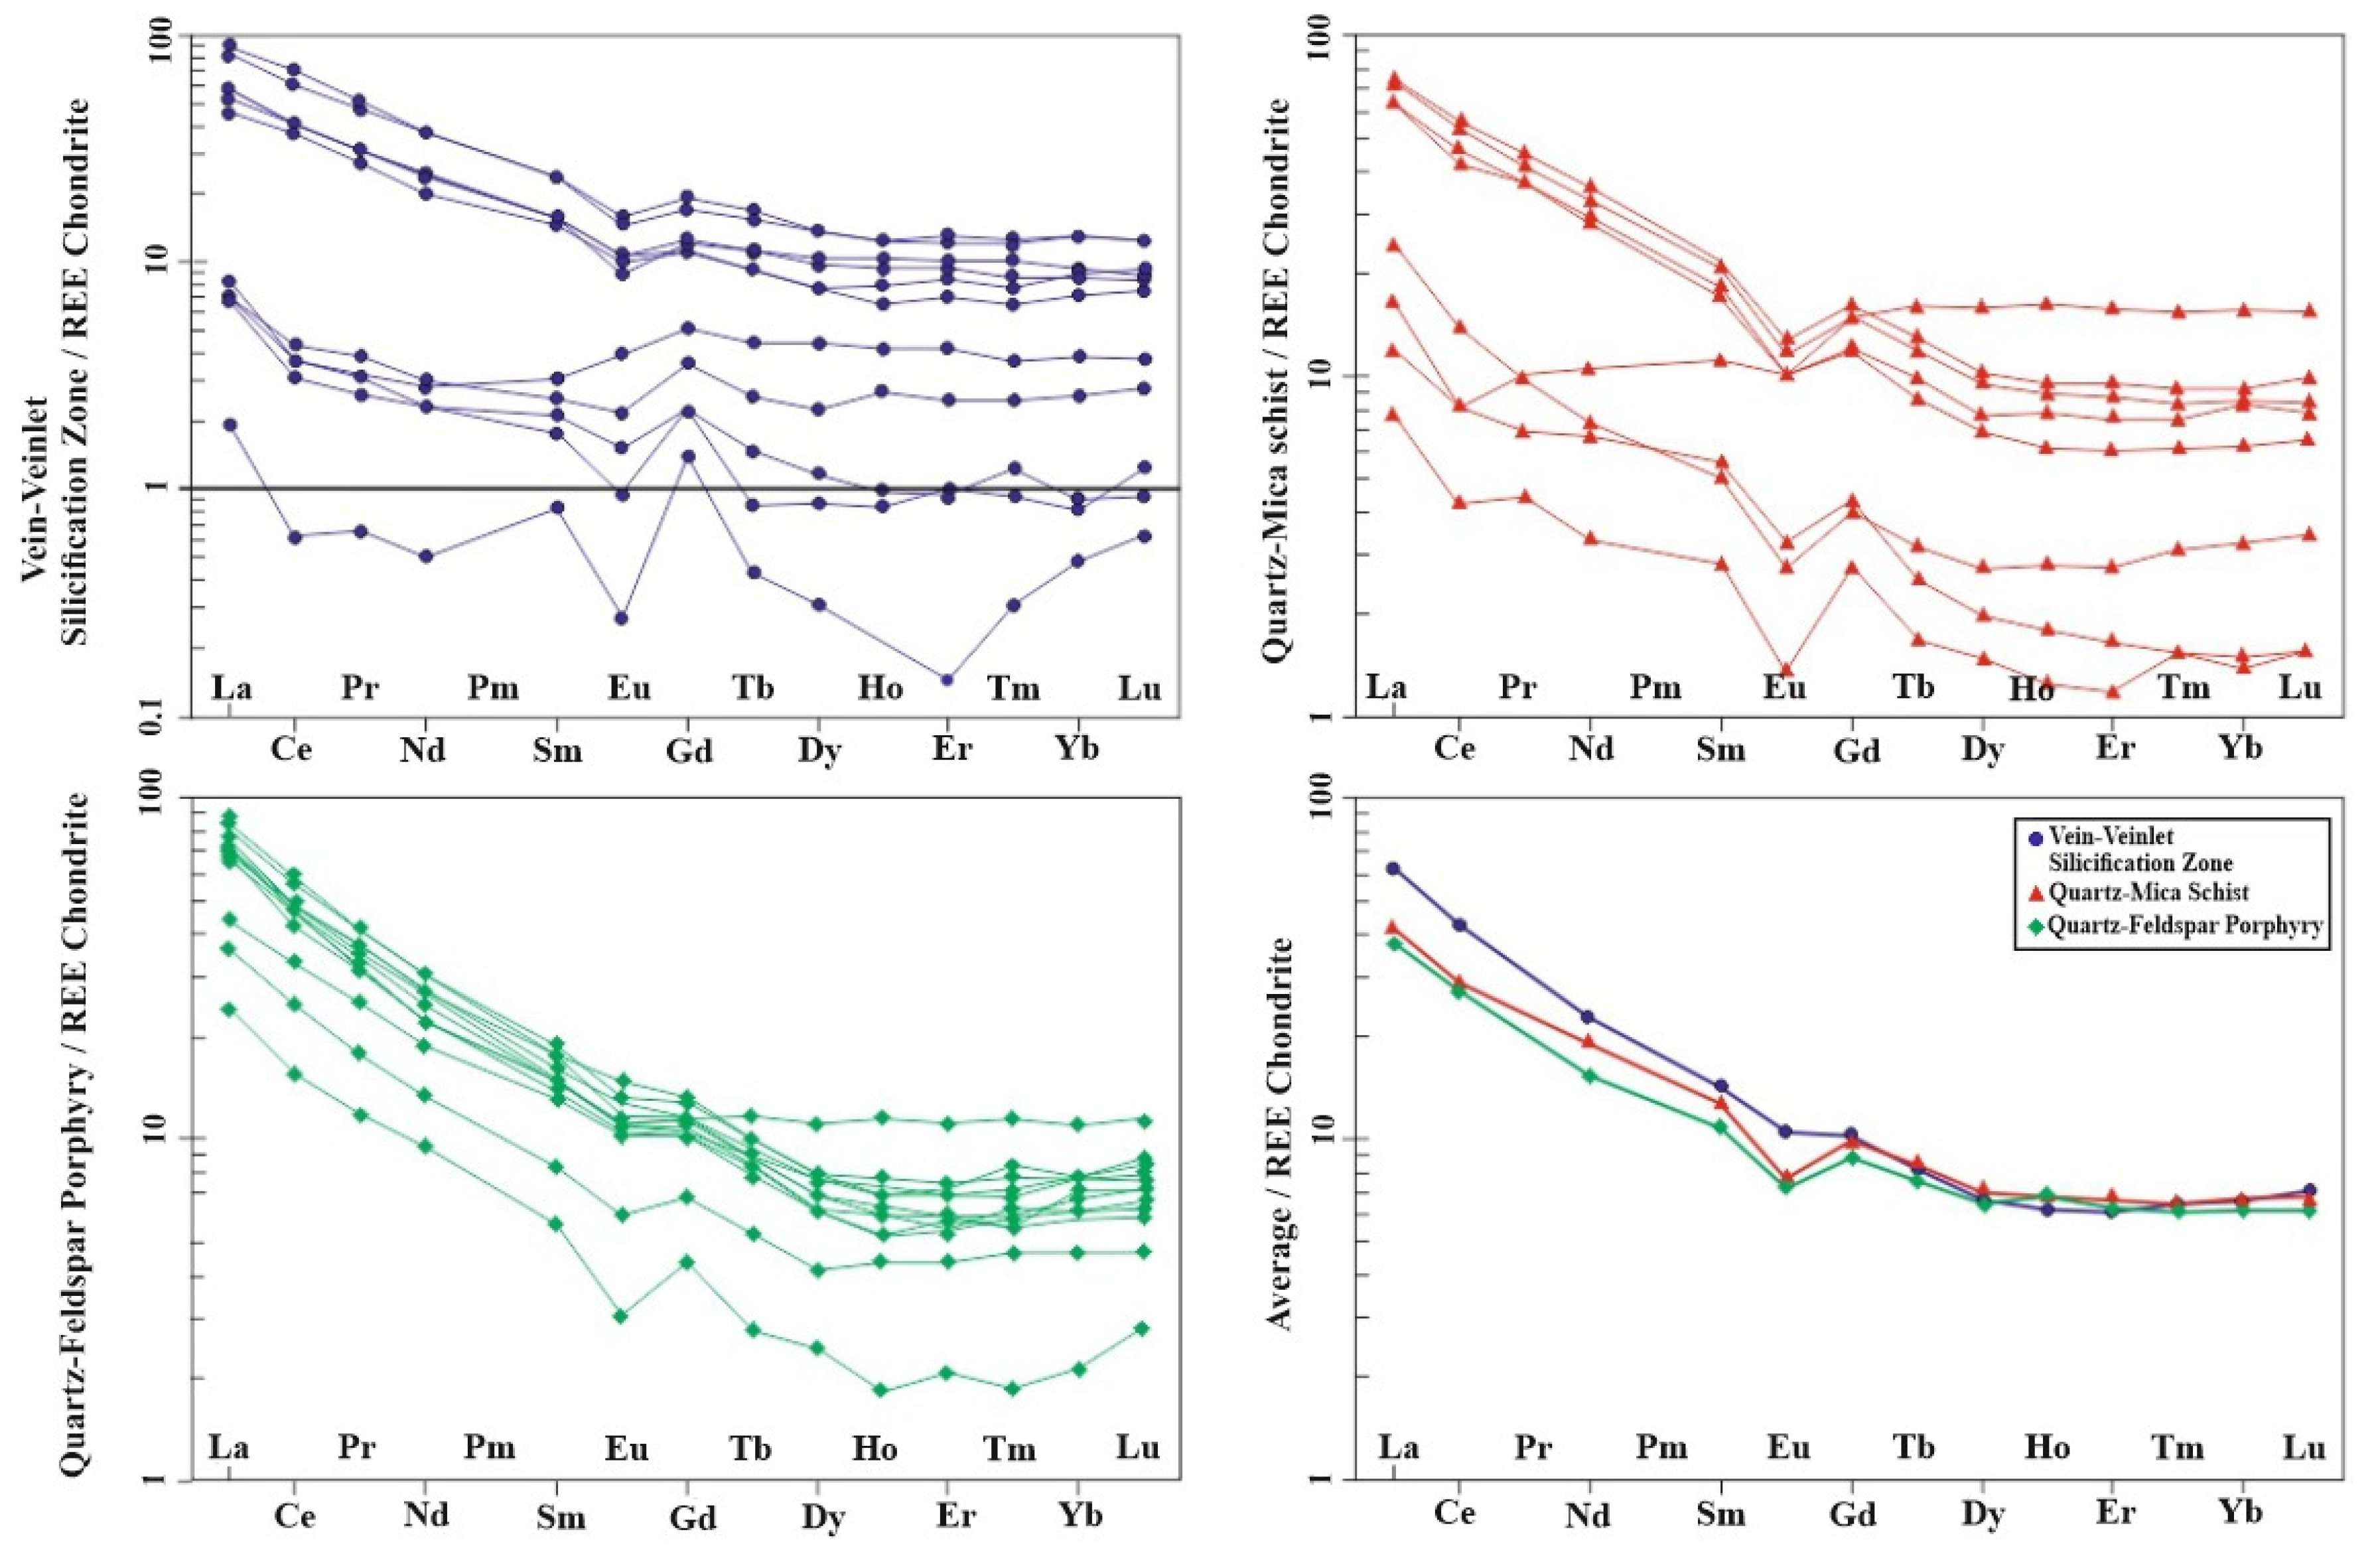
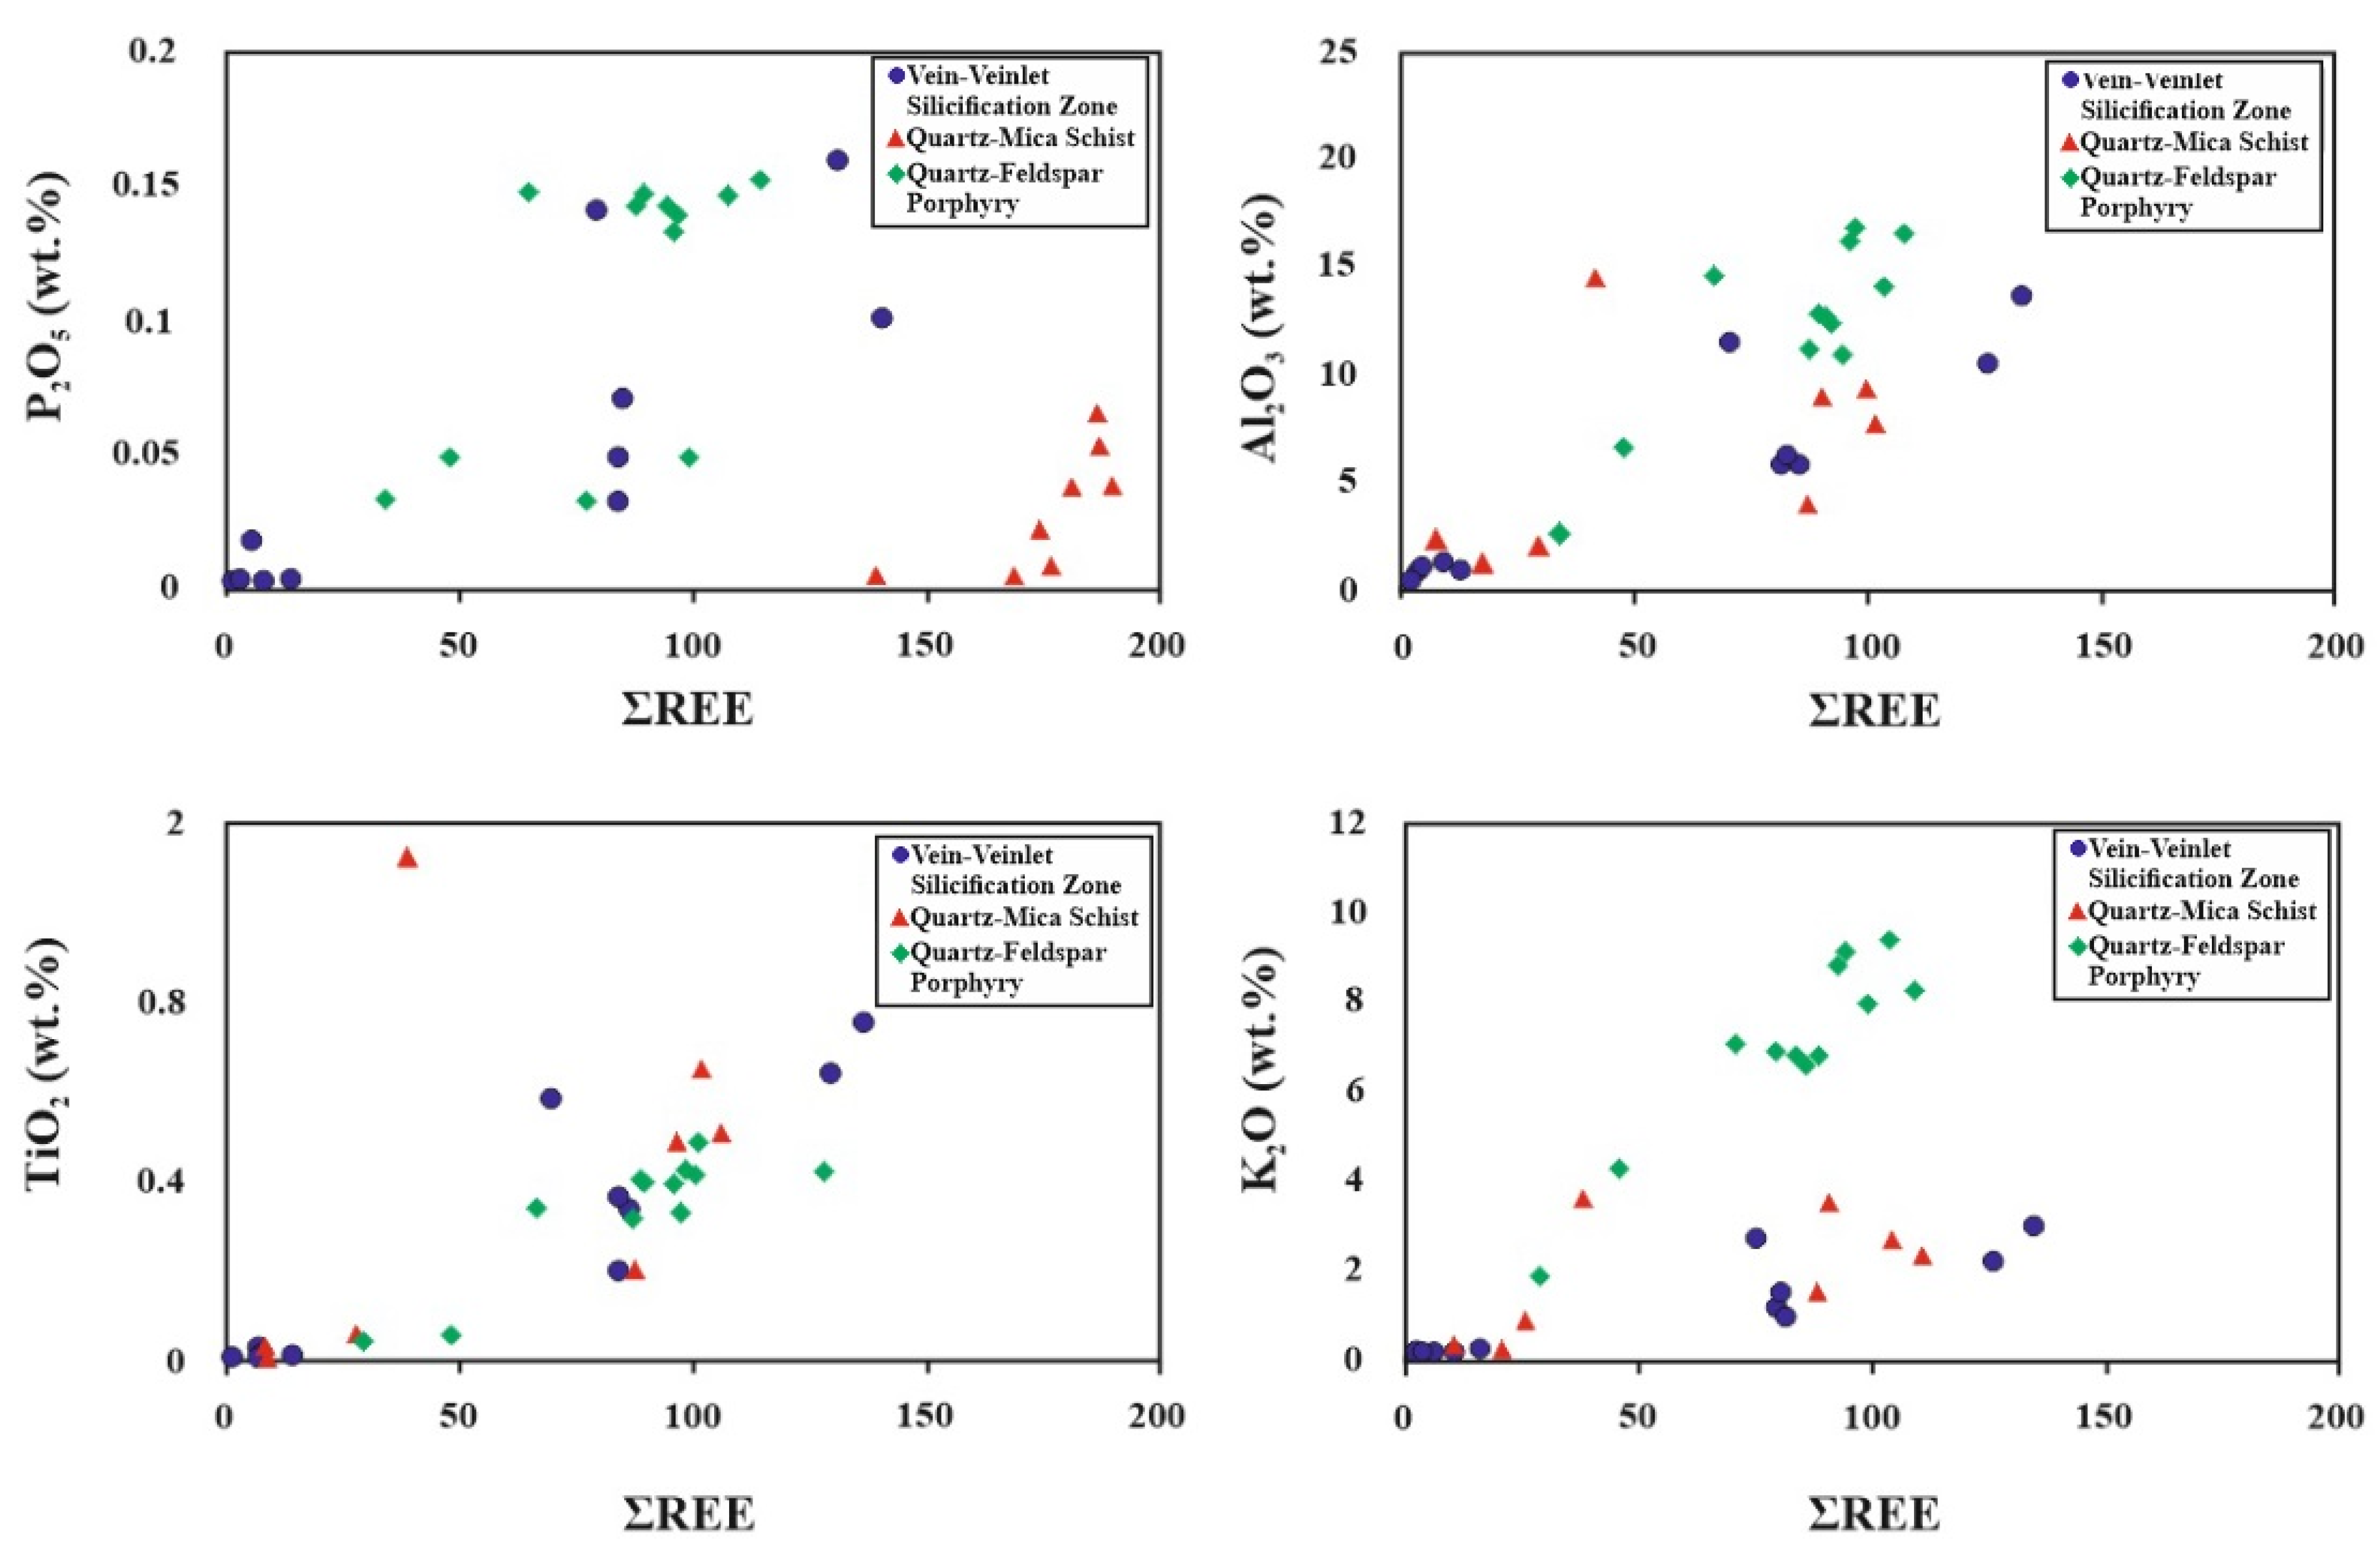
5.3.2. Rare Earth Elements
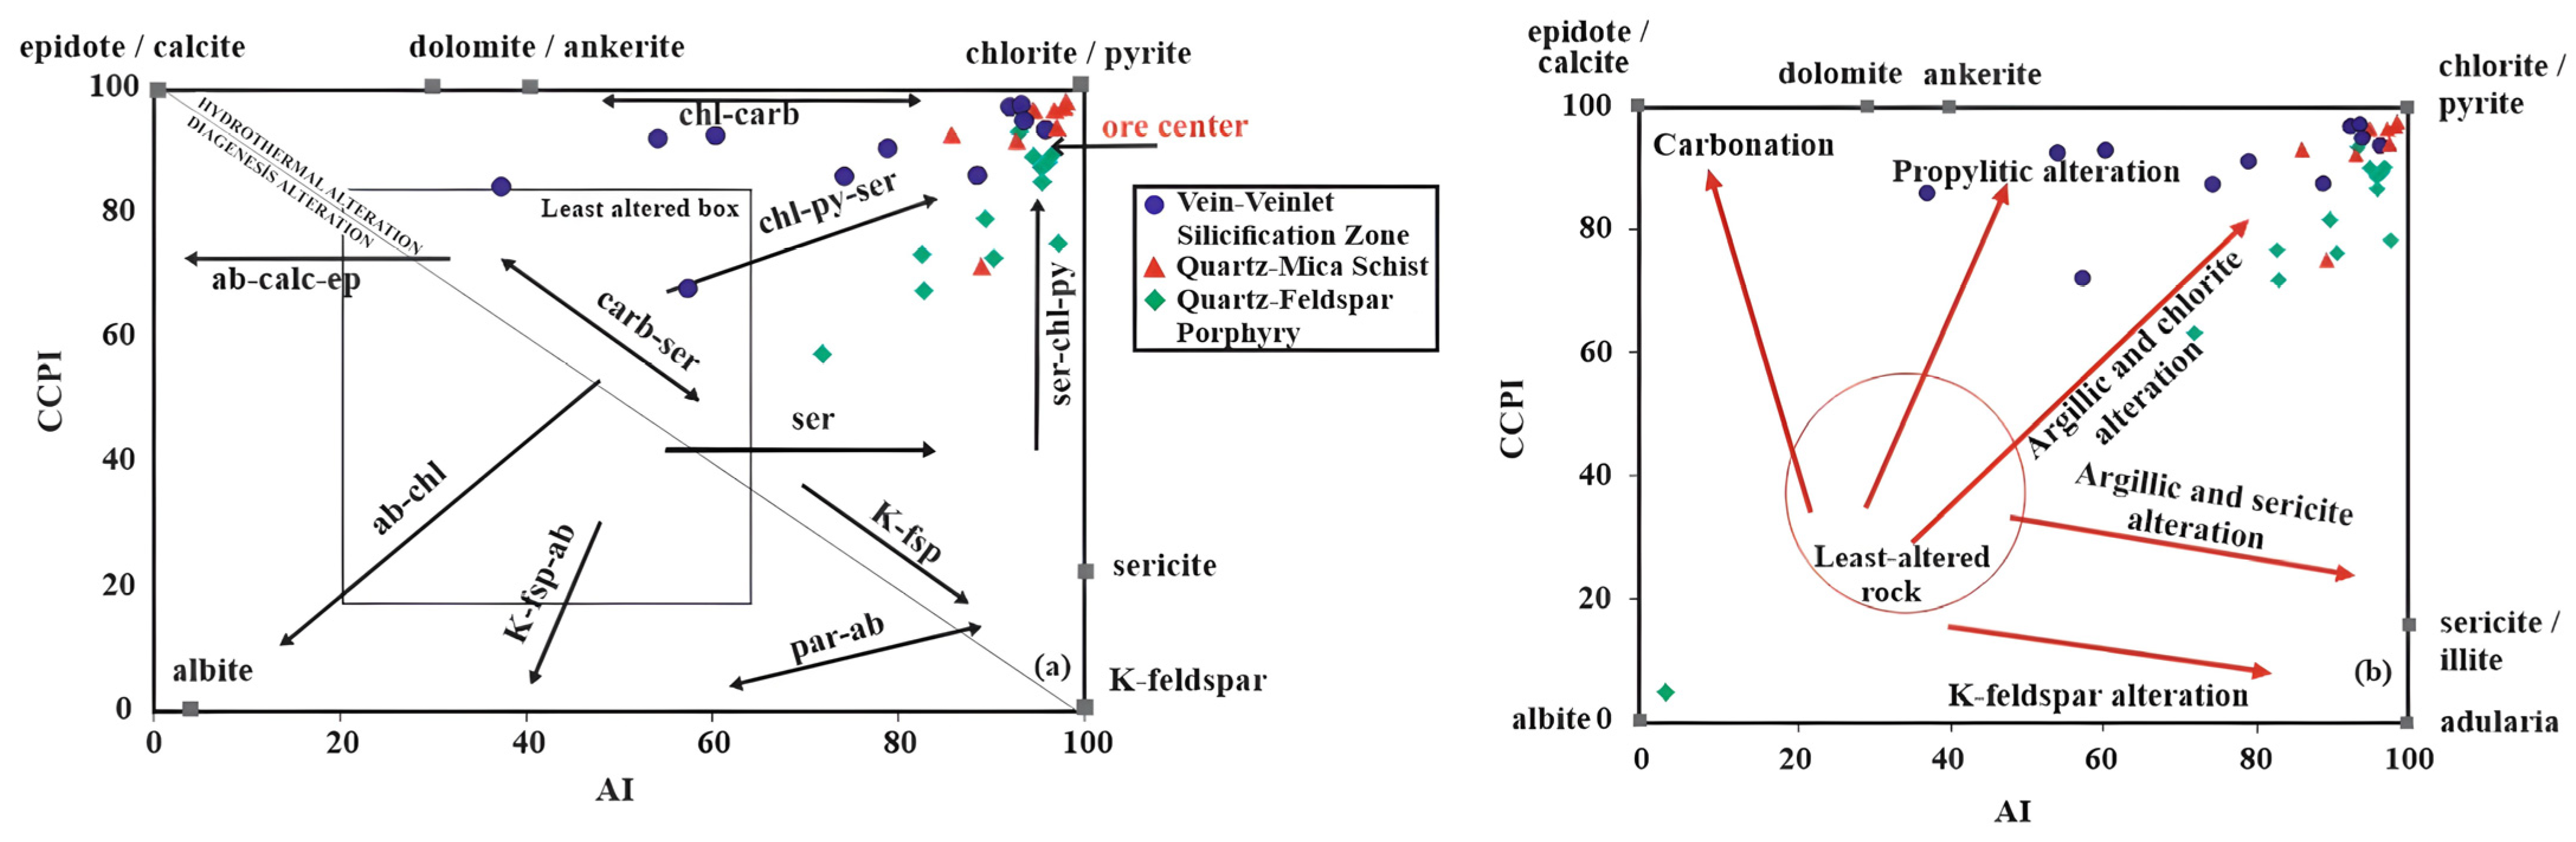
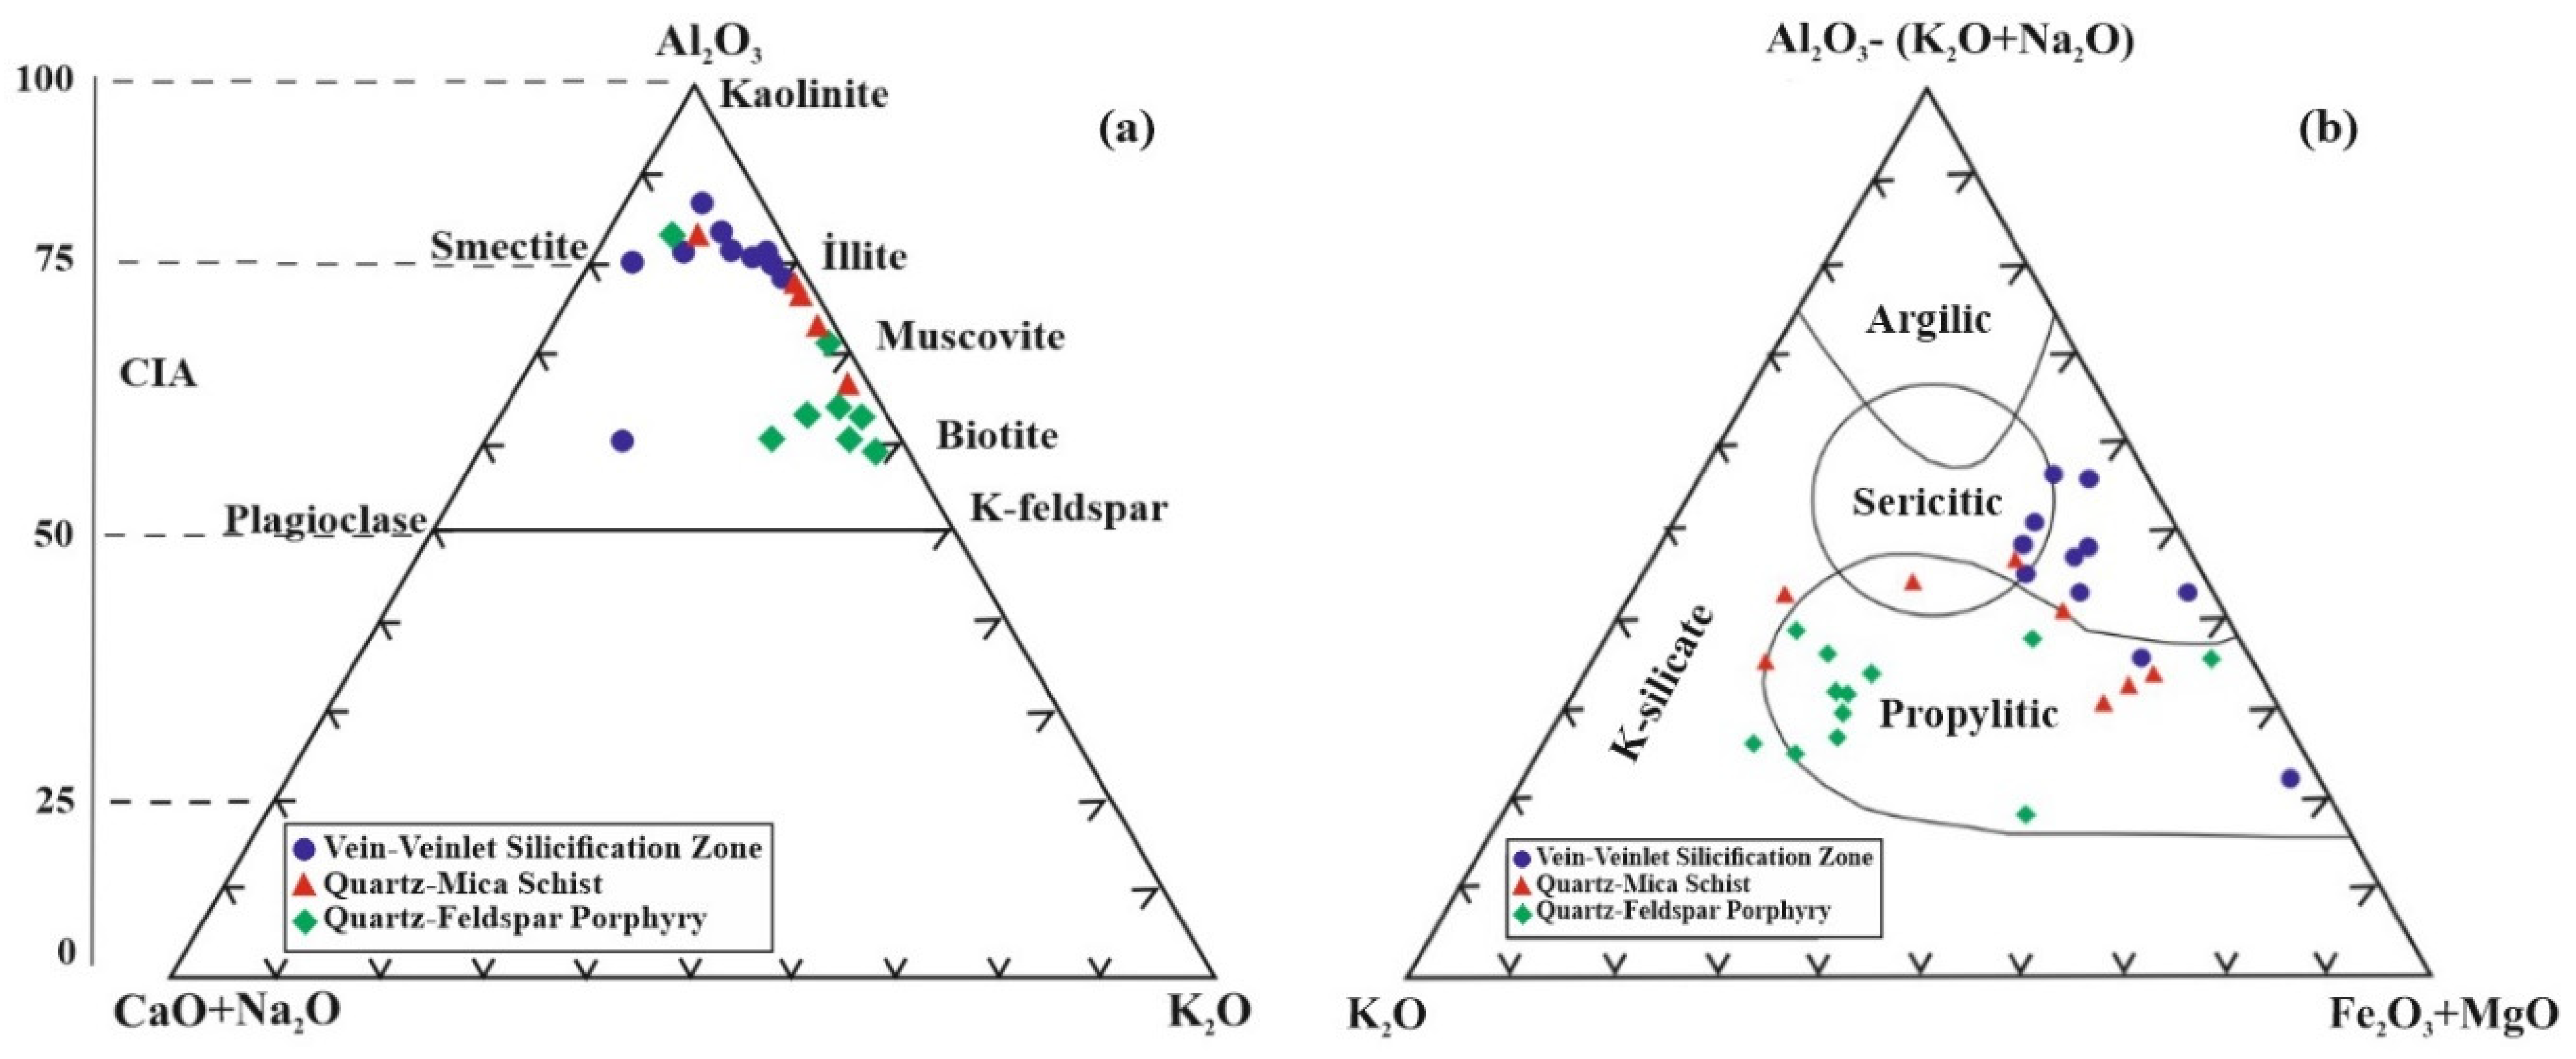
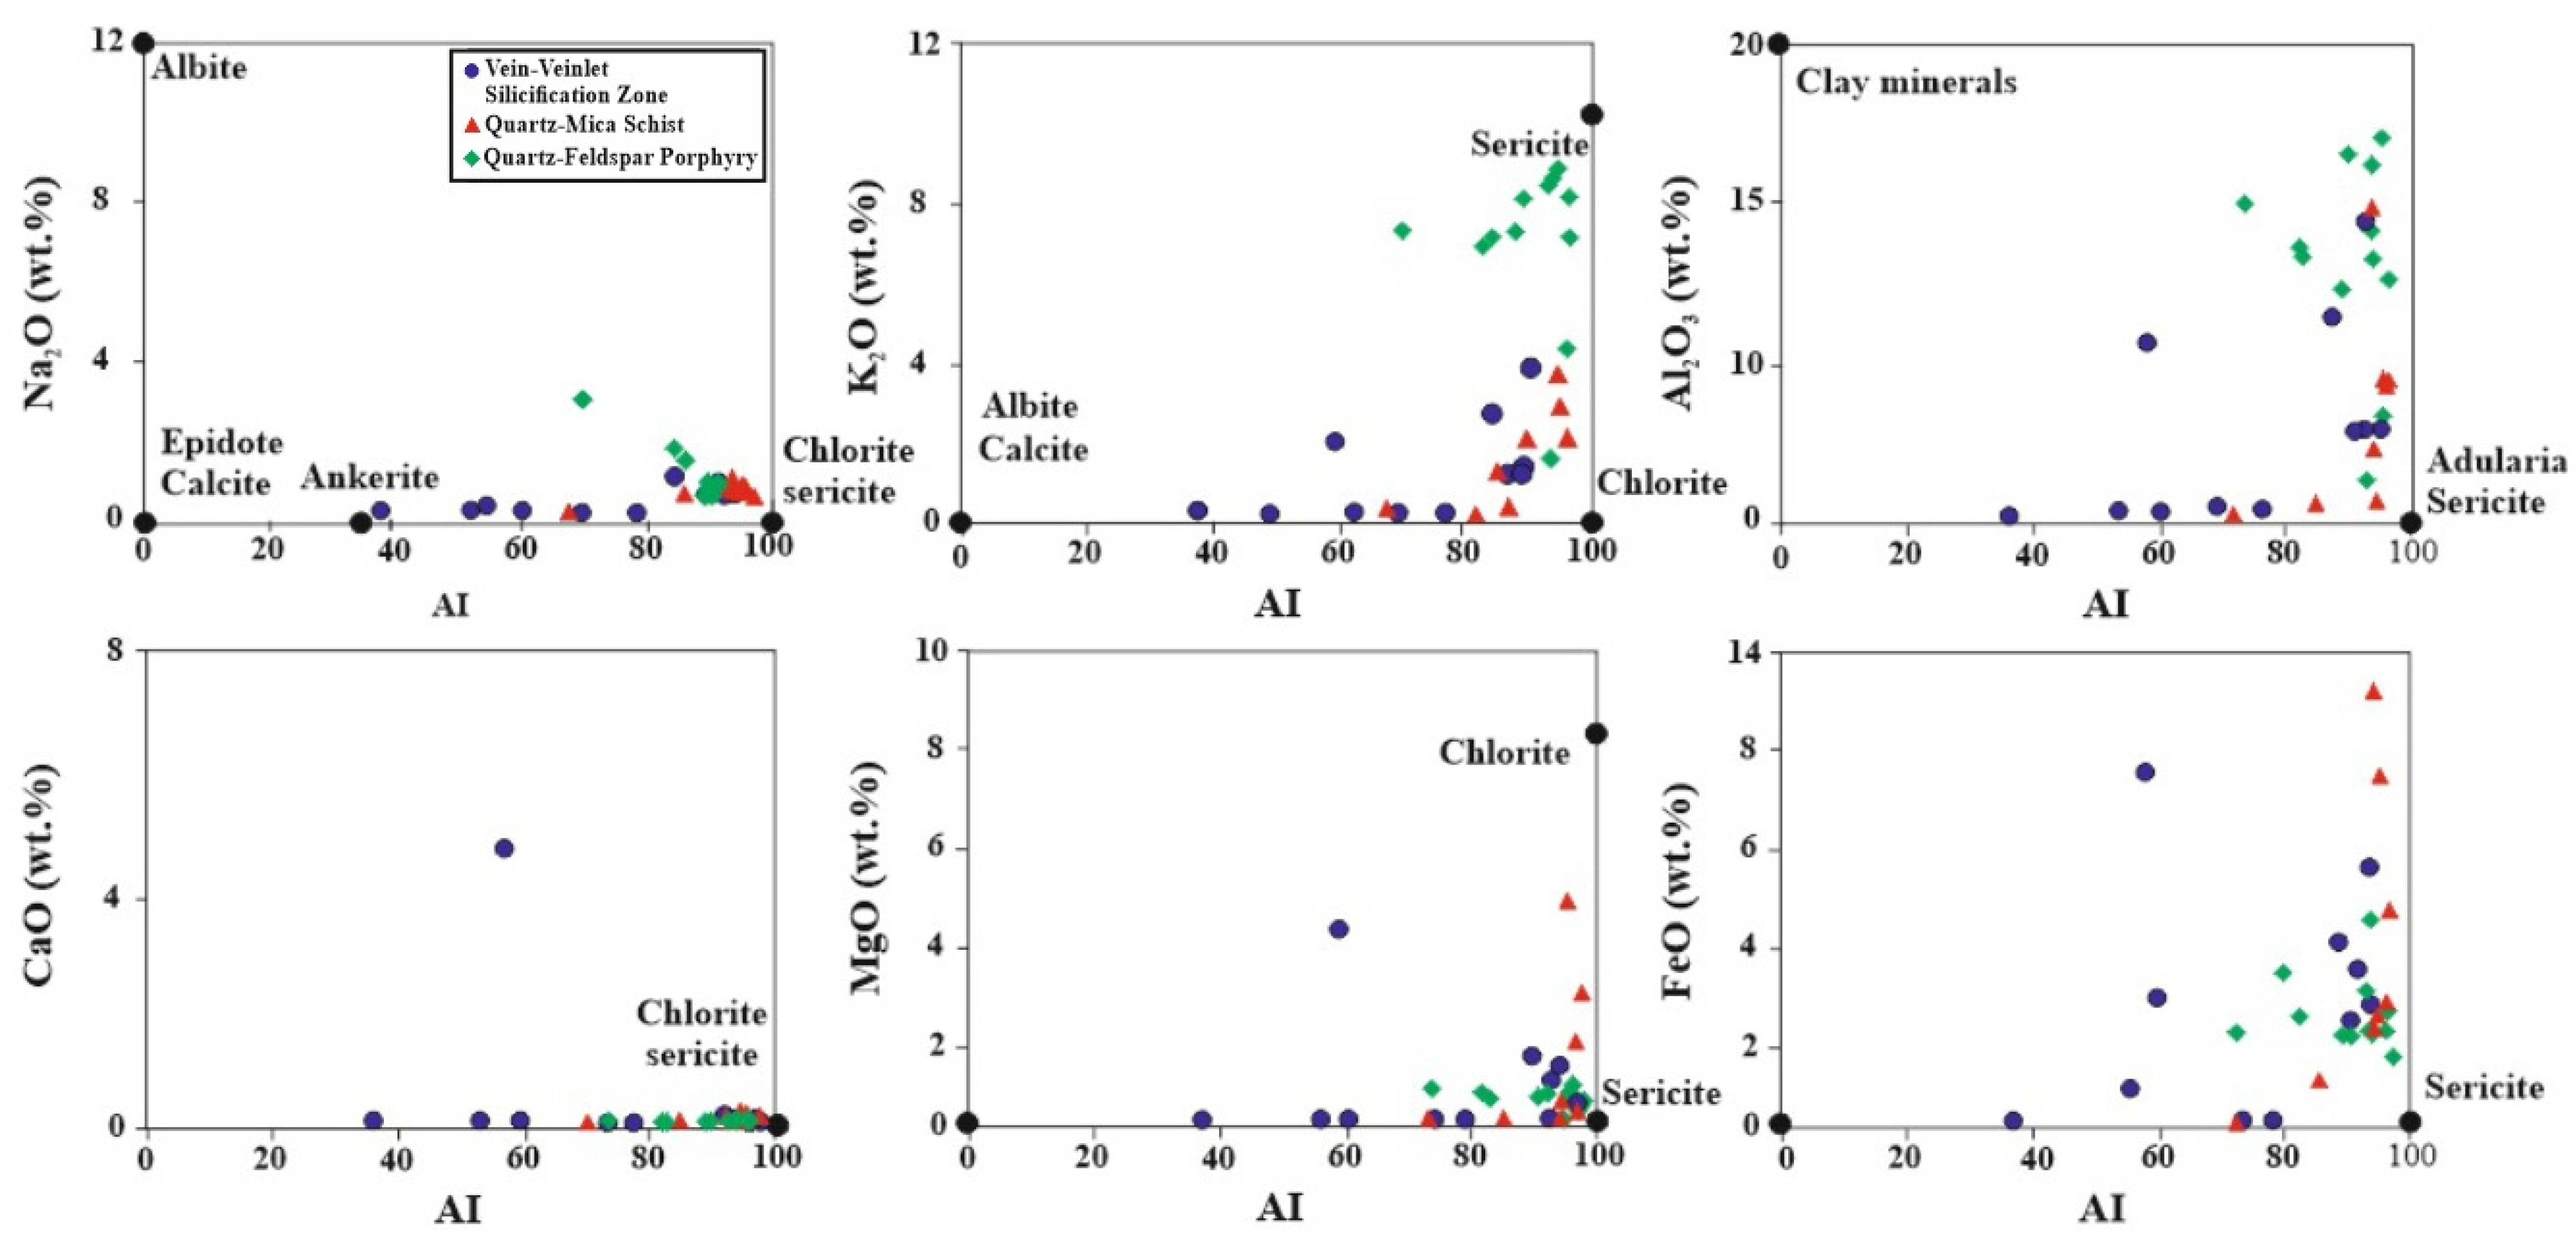
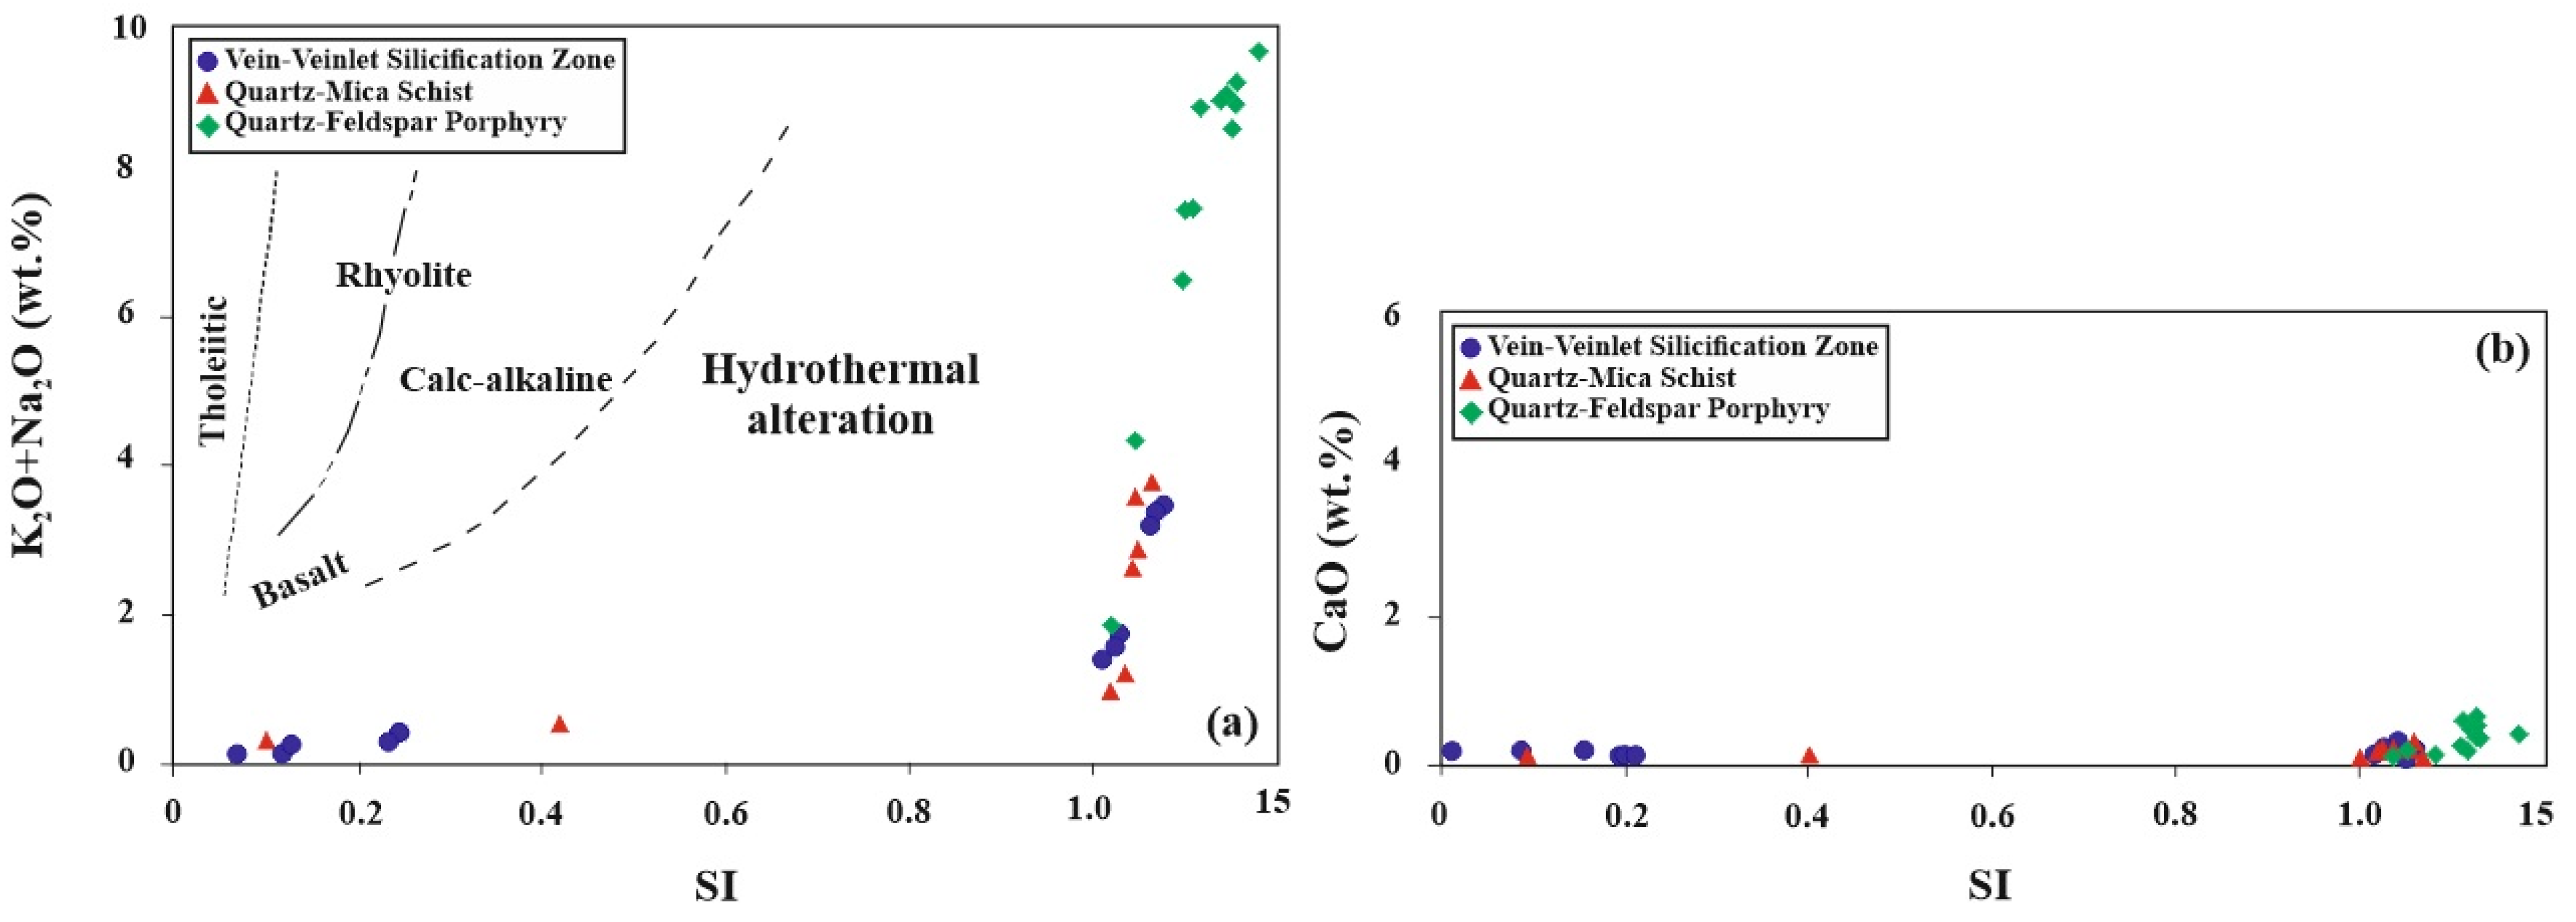
5.4. Hydrothermal Alteration Indices
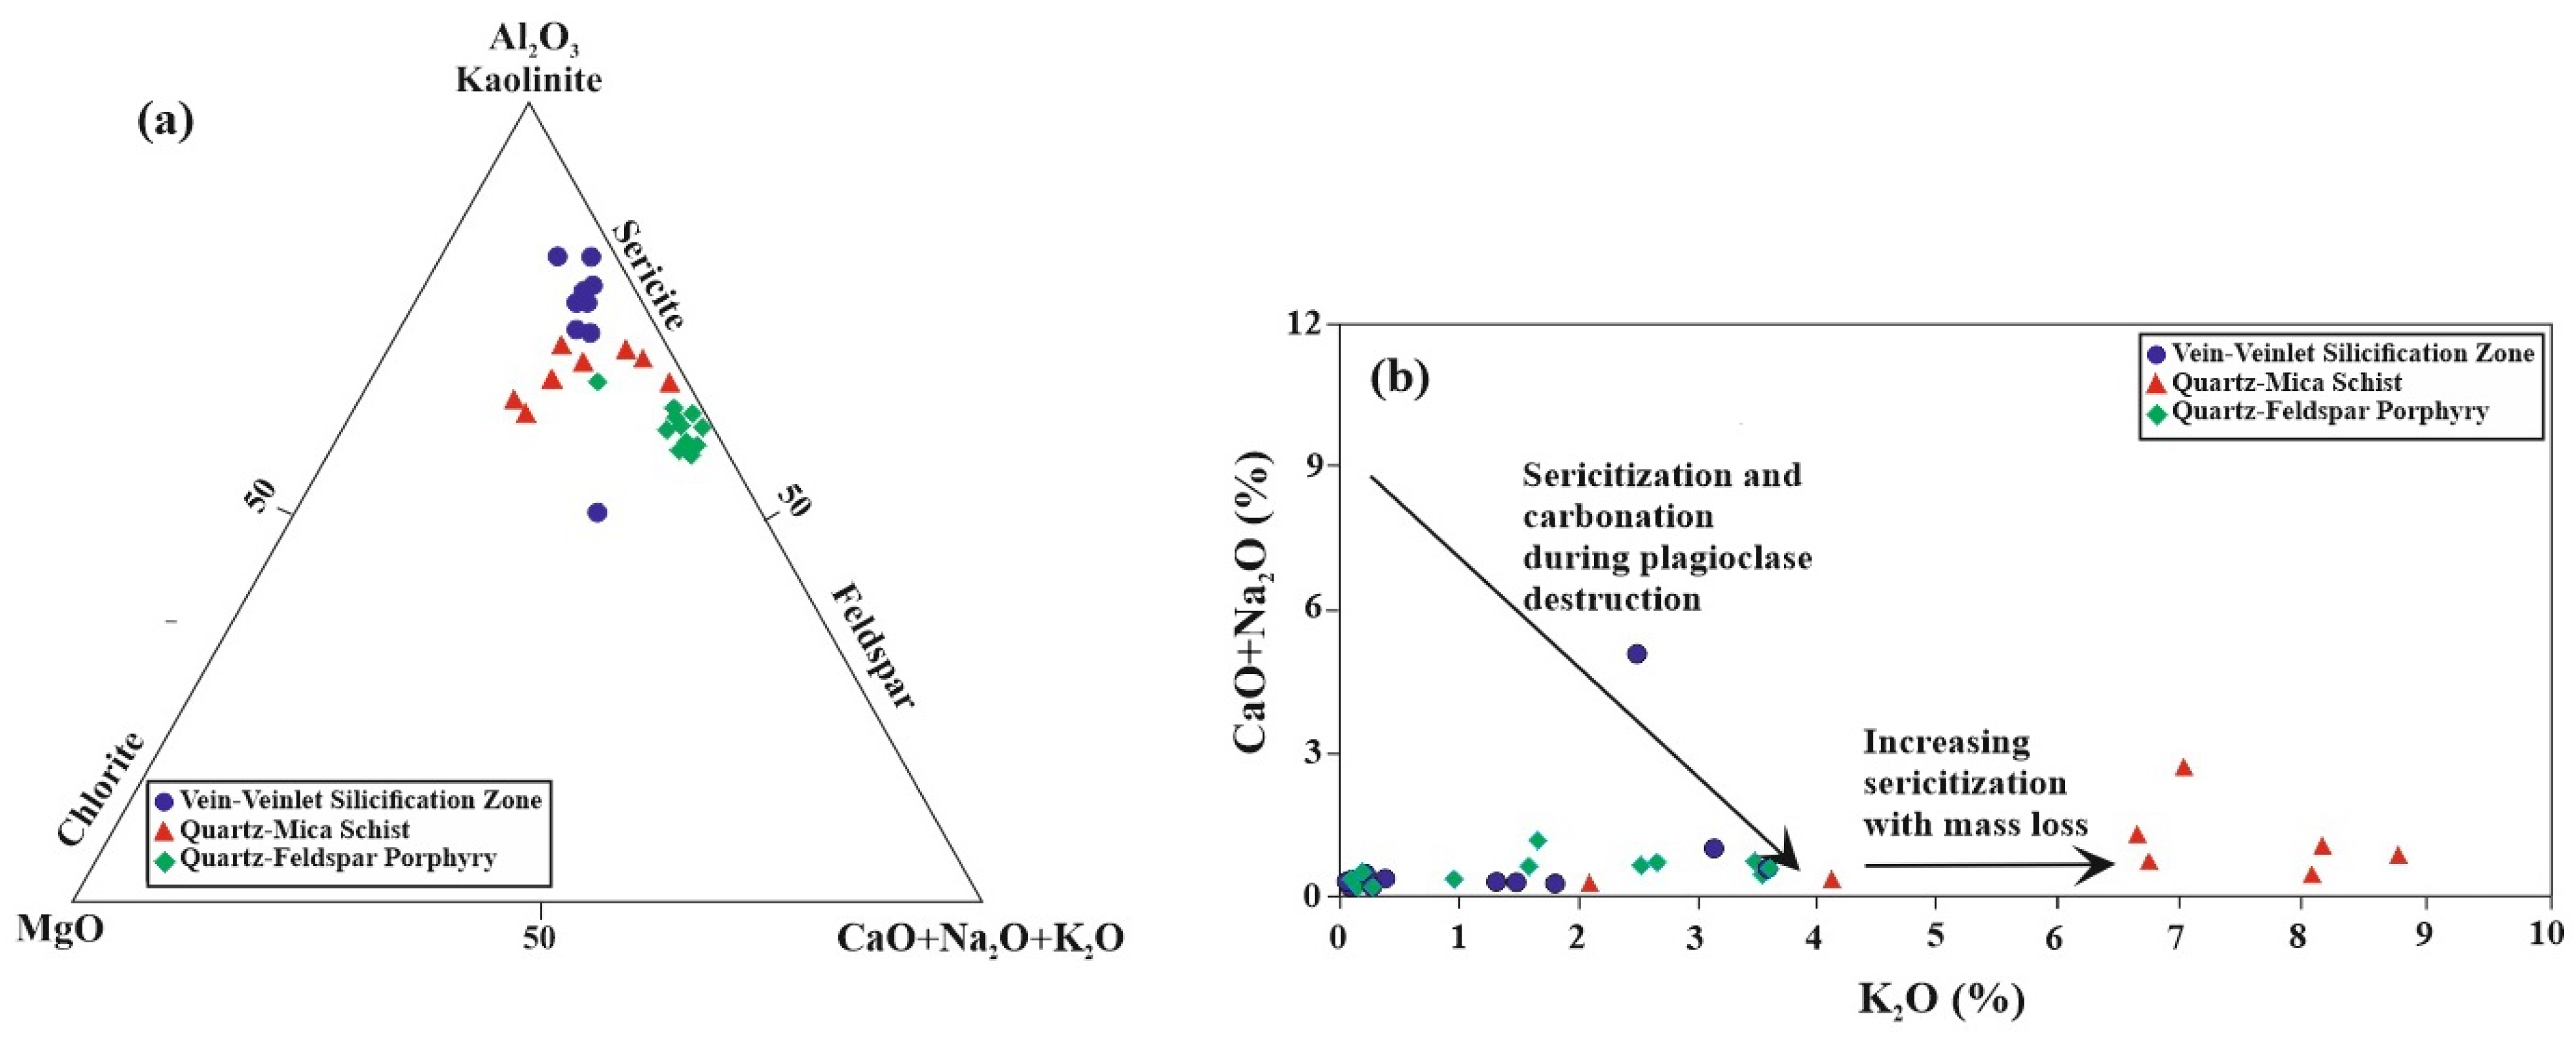
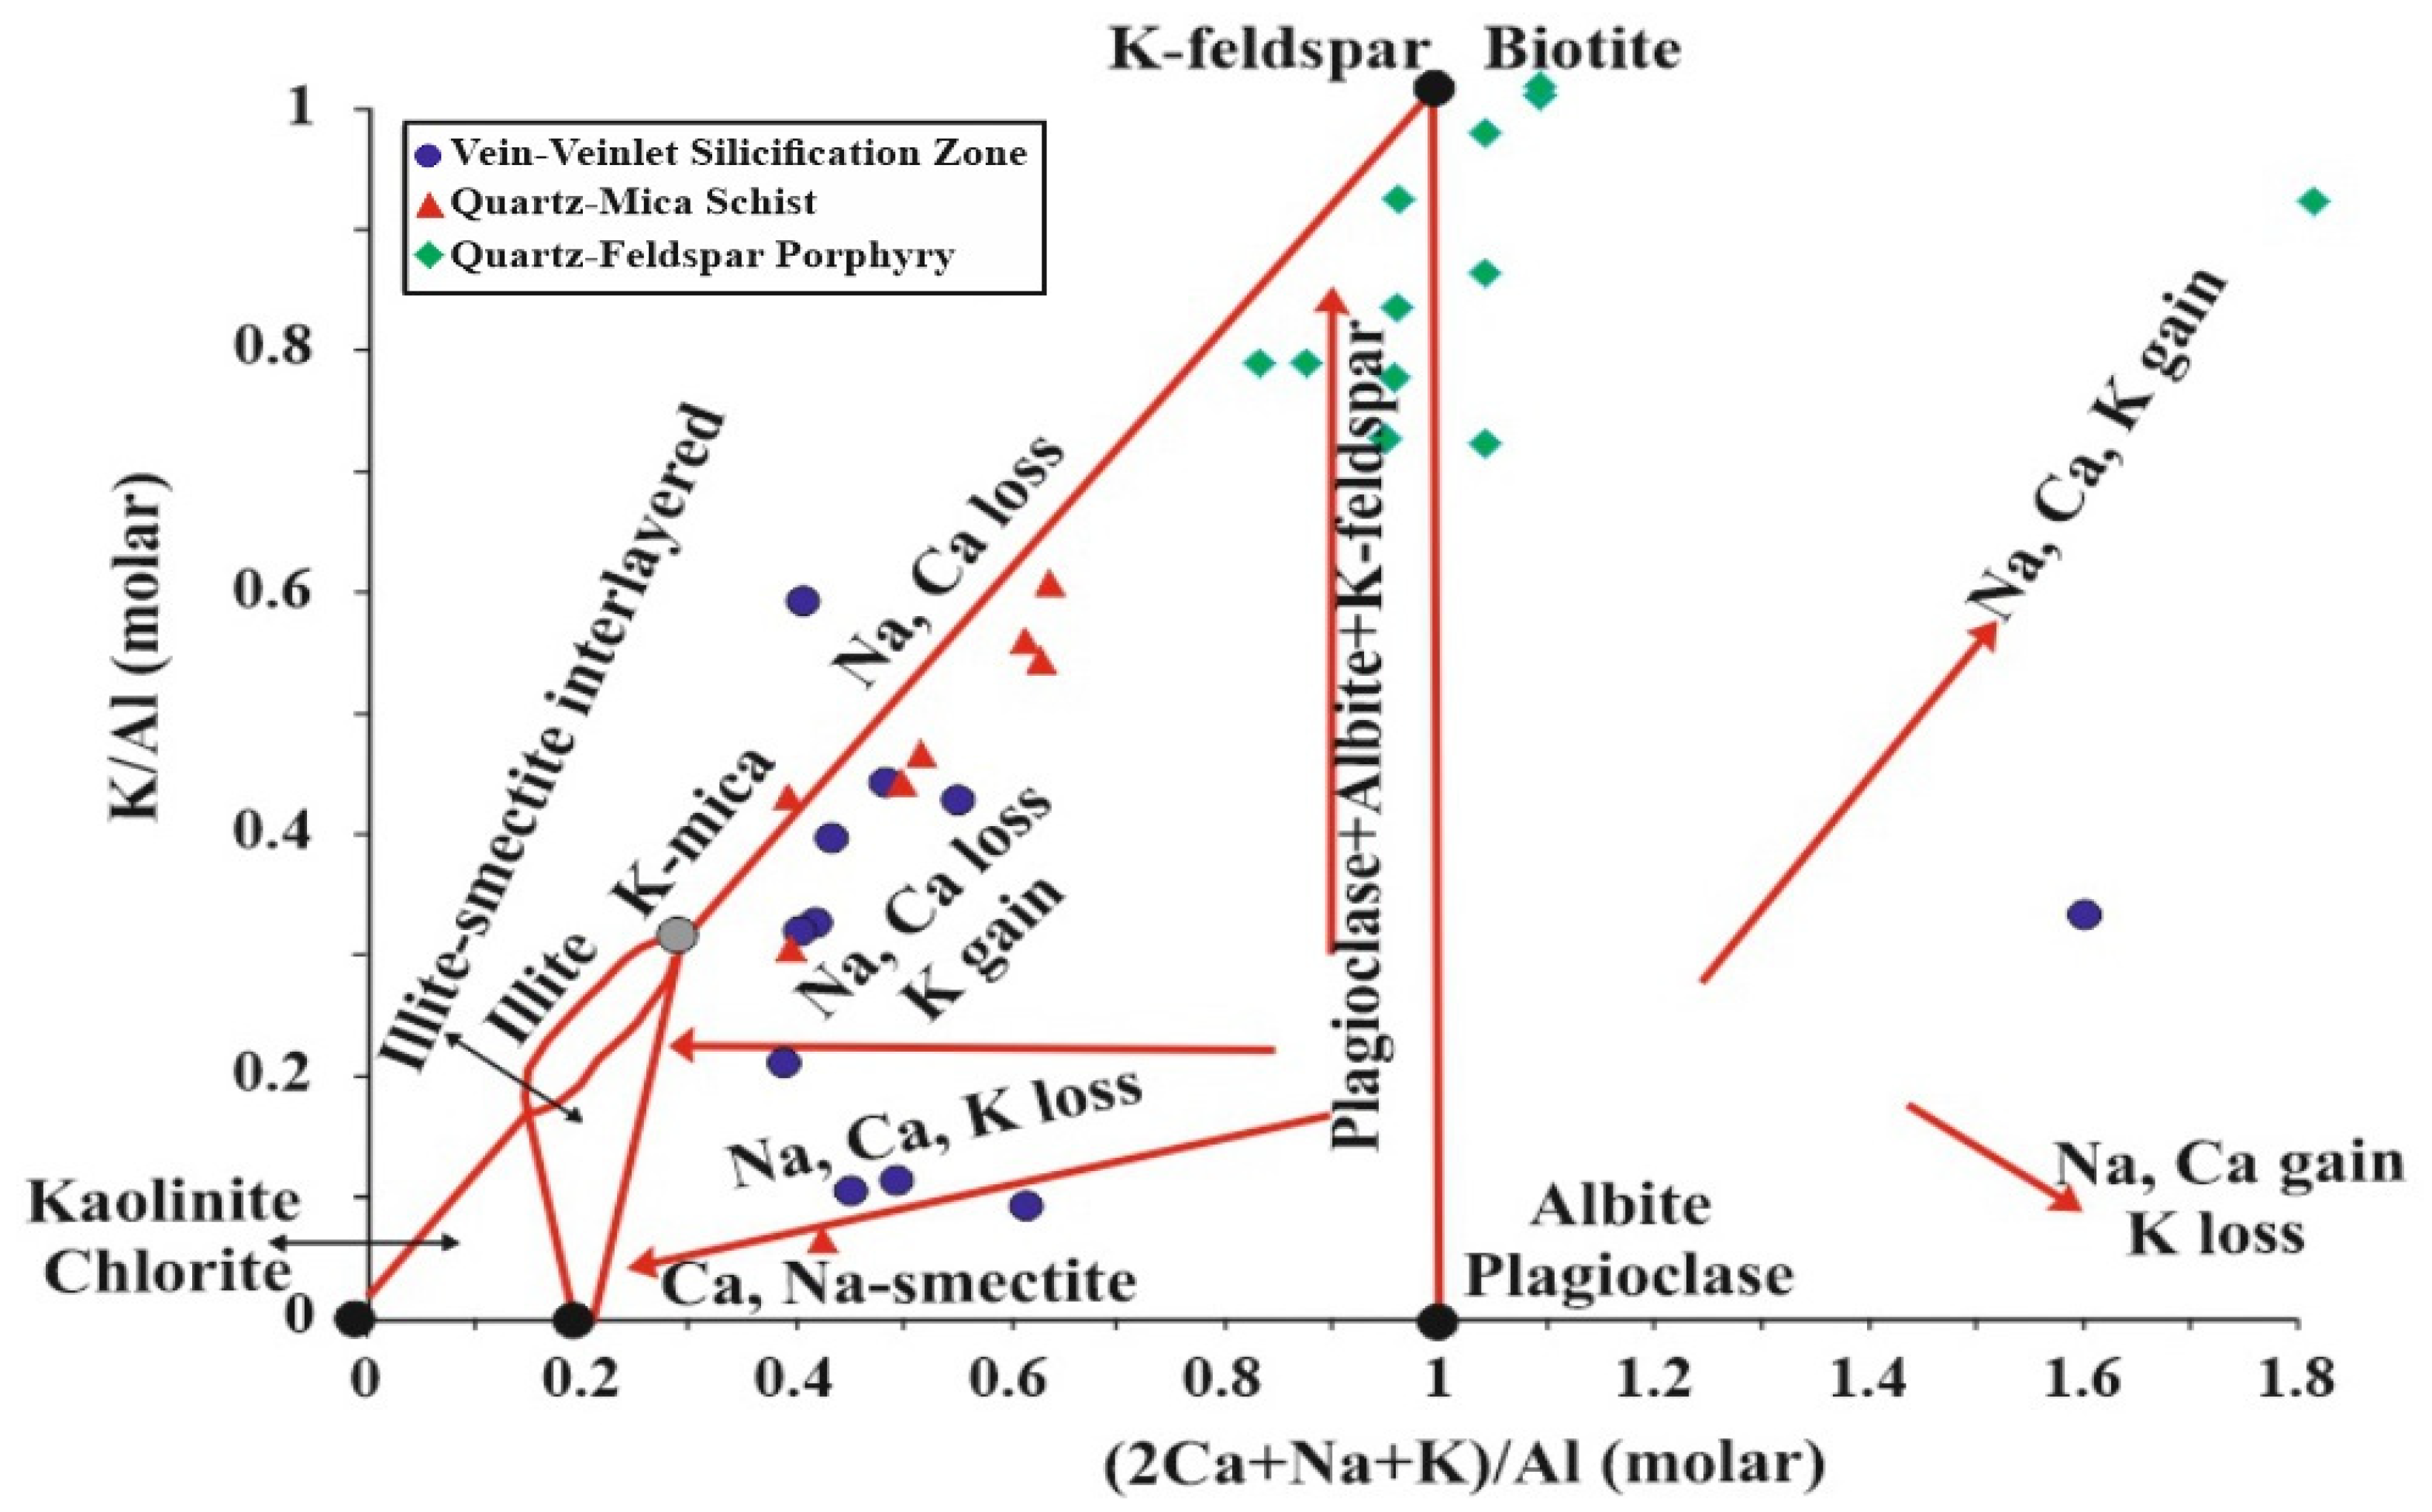
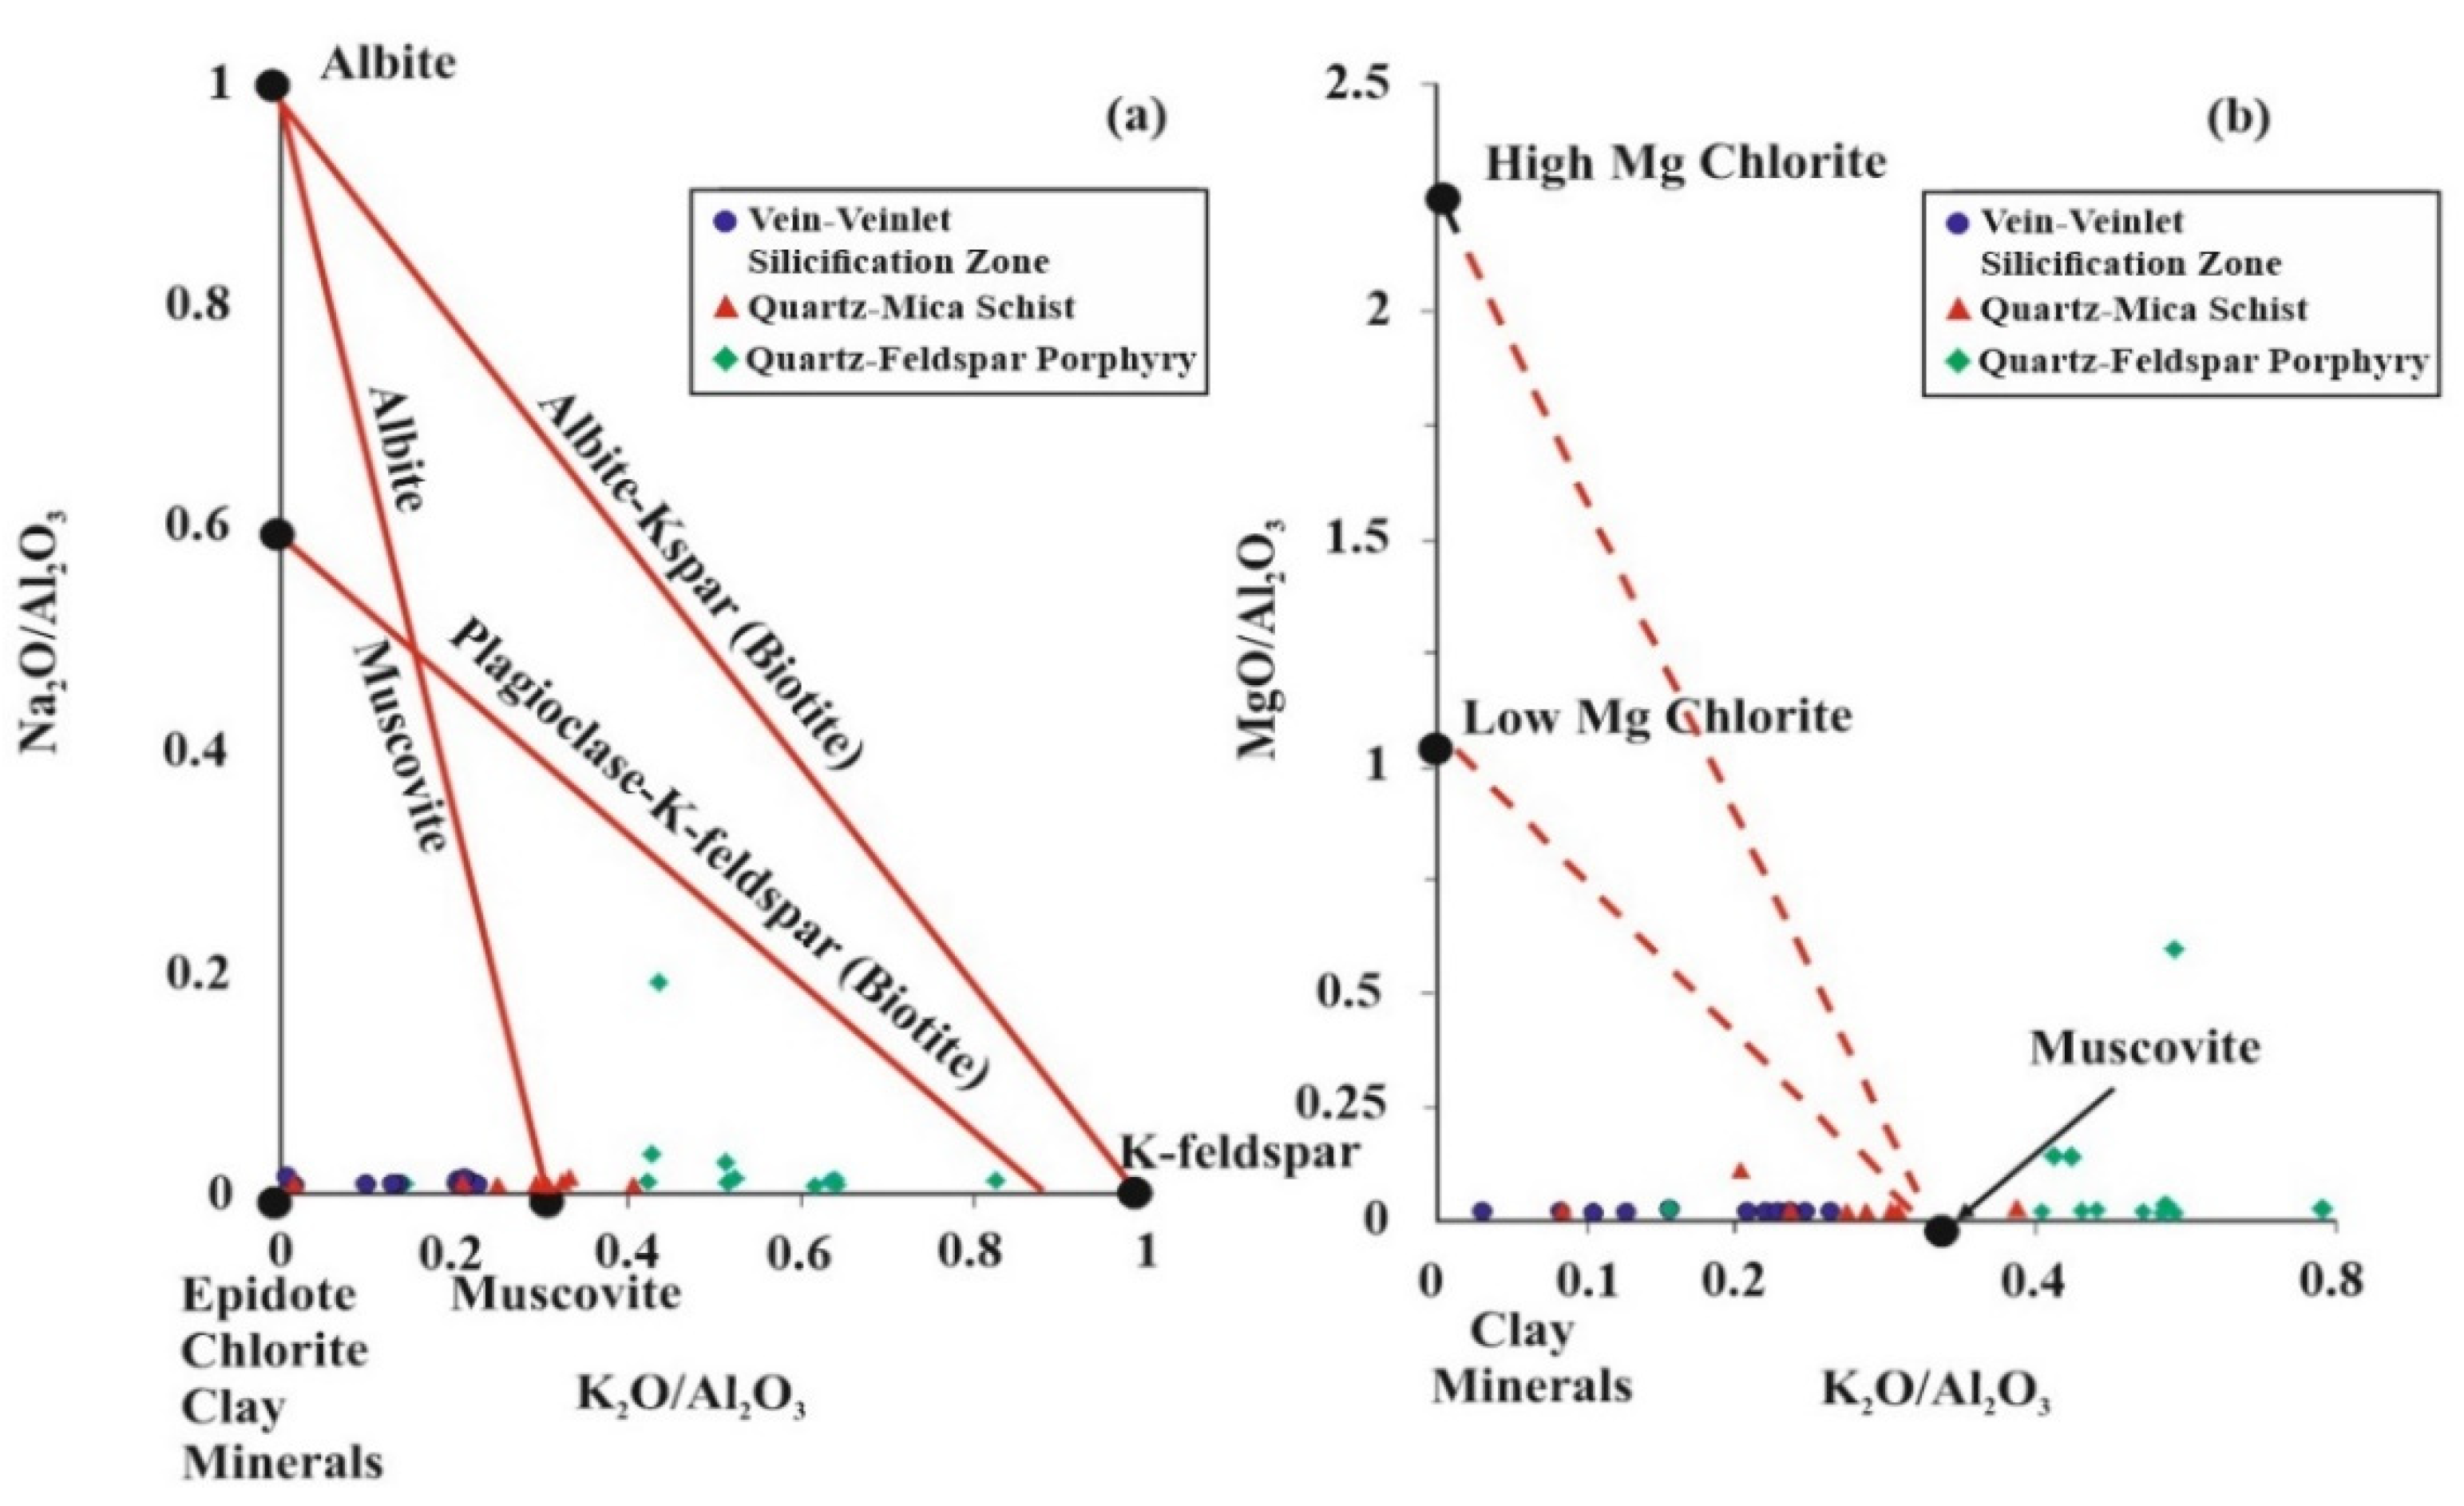
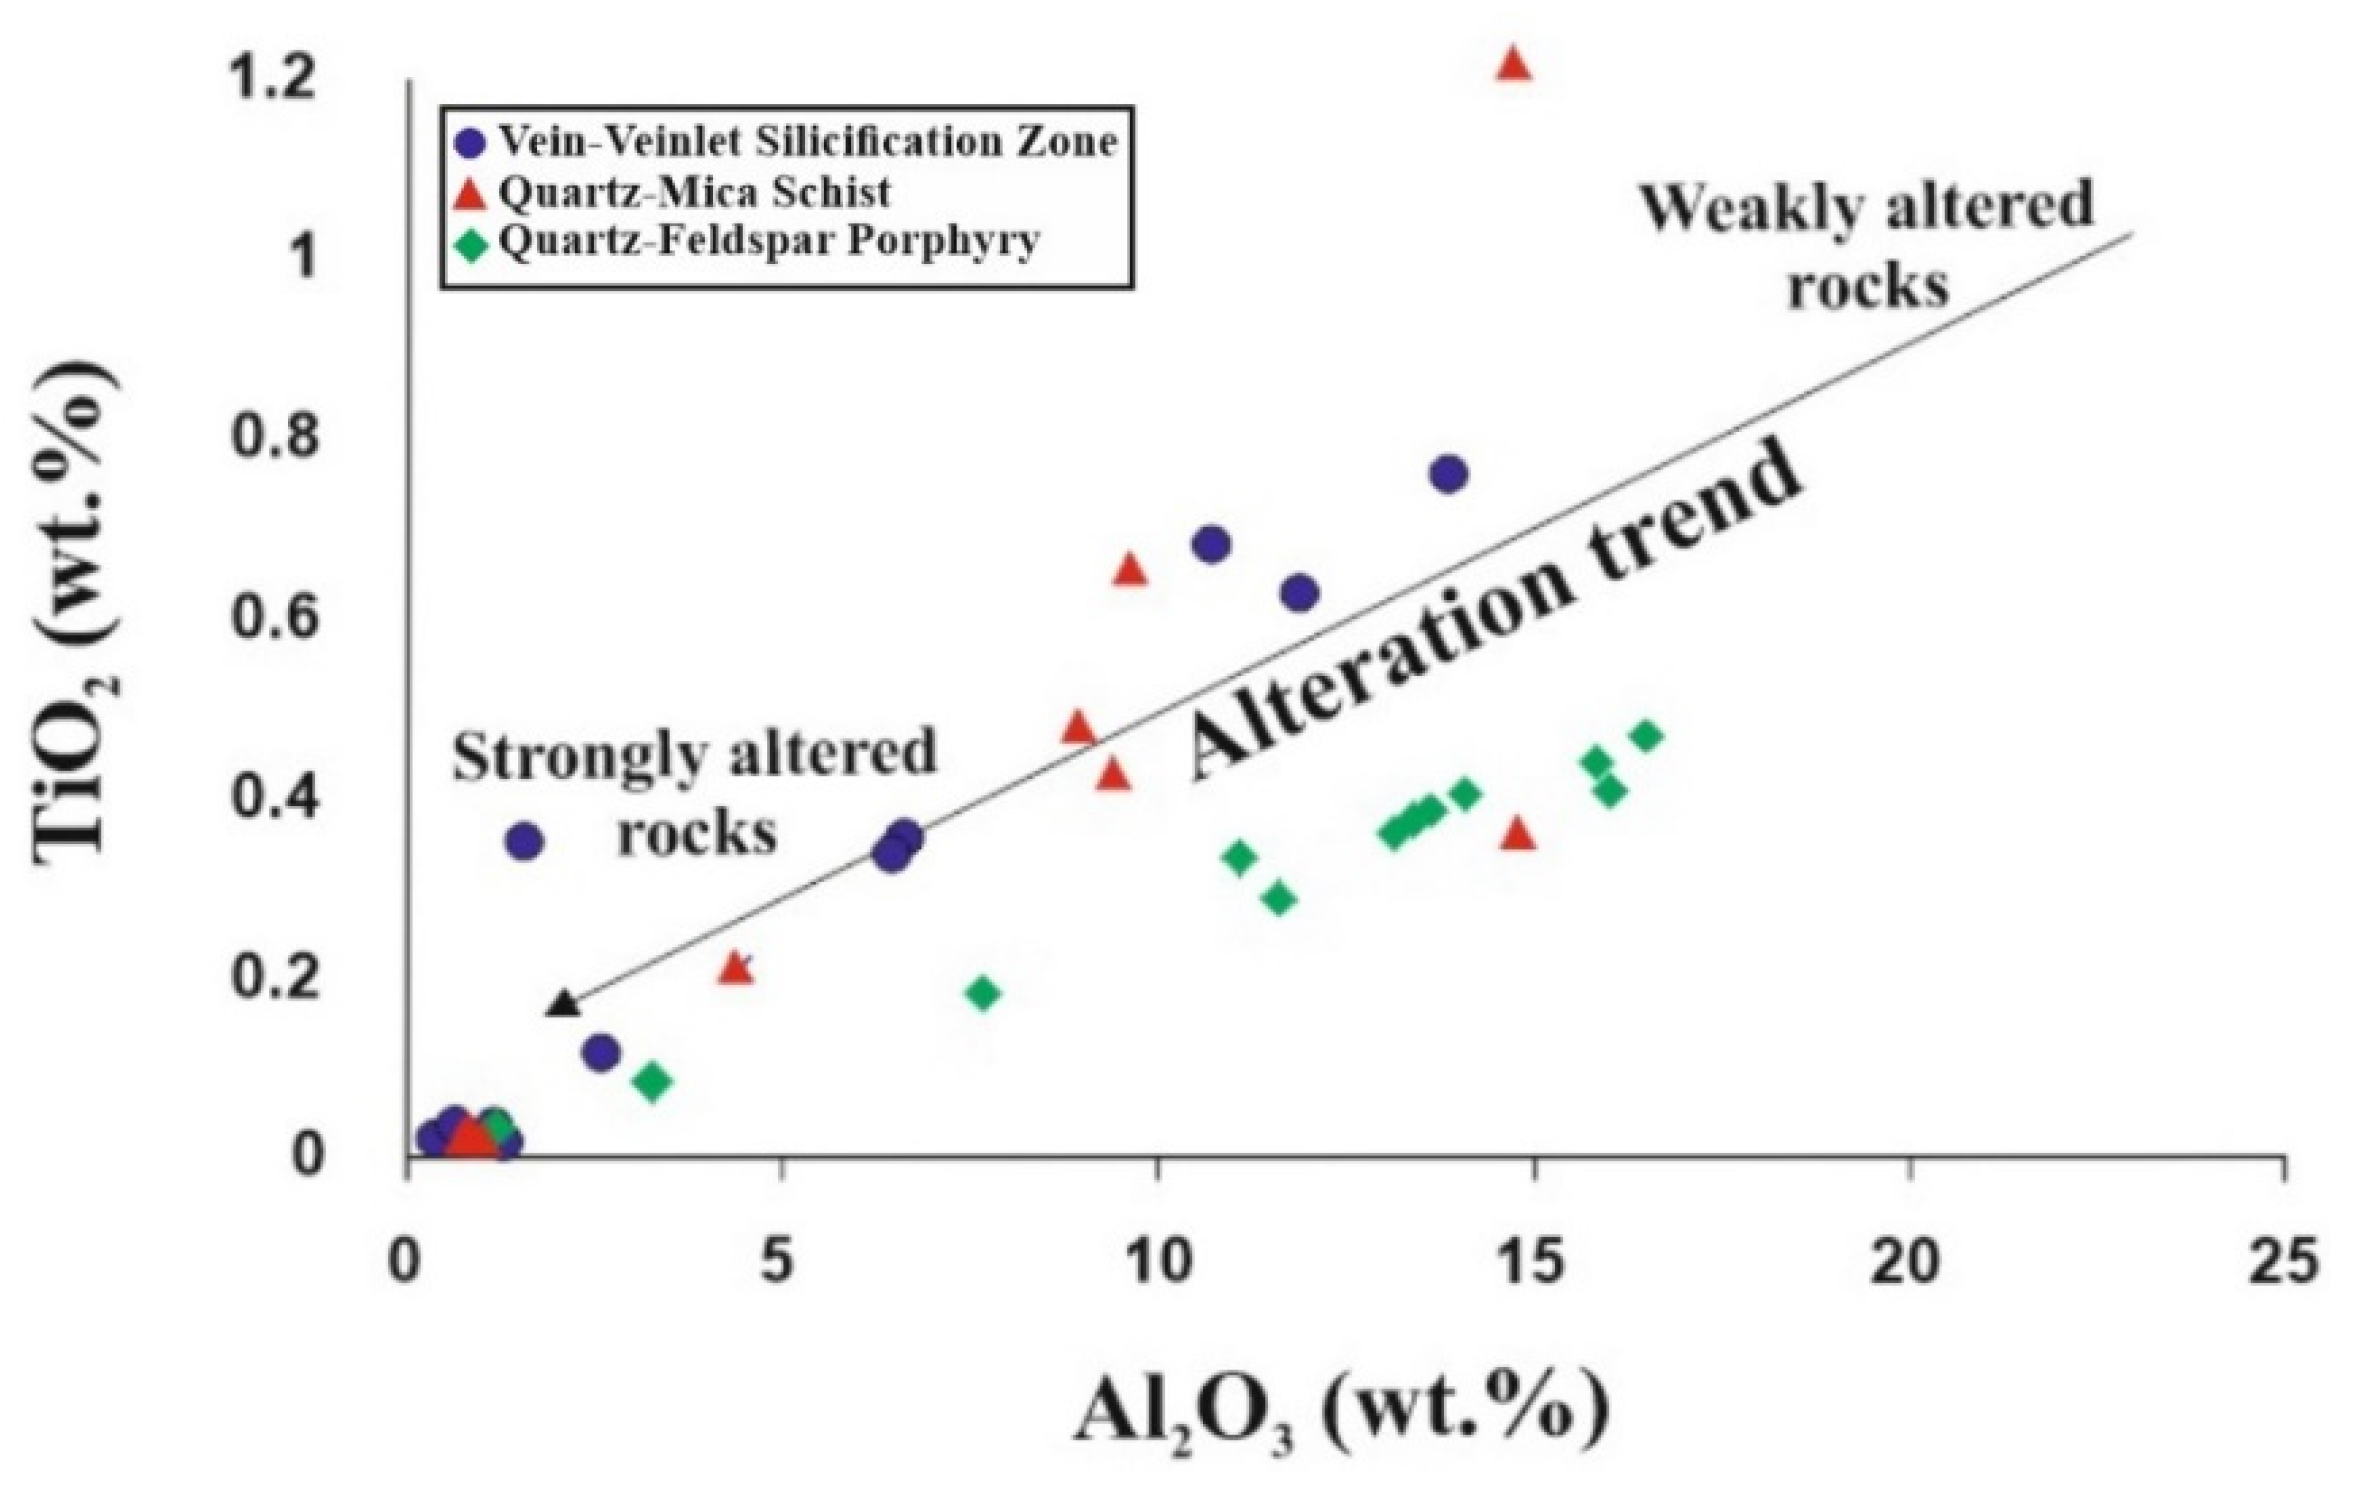
5.5. Molar Ratio and Mass Gain/Loss
6. Discussion
7. Conclusions
Author Contributions
Funding
Data Availability Statement
Acknowledgments
Conflicts of Interest
Appendix A

| Silicified Vein | |||||||||||||
| Major Oxides (wt.%) | DL | KED 2-2 | KED2-6 | KED2-7 | KED2-13 | KED17-8 | KED63-2 | KED63-3 | KED63-5 | KED63-9 | KED63-10 | KED63-11 | |
| SiO2 | 0.01 | 96.32 | 84.32 | 96.50 | 98.02 | 95.37 | 74.04 | 57.74 | 83.90 | 93.53 | 86.04 | 69.14 | |
| Al2O3 | 0.01 | 1.20 | 6.67 | 1.23 | 0.55 | 0.97 | 11.89 | 10.85 | 6.41 | 1.19 | 6.36 | 14.33 | |
| Fe2O3 | 0.04 | 0.77 | 3.18 | 0.60 | 0.61 | 1.45 | 4.49 | 8.03 | 3.87 | 3.46 | 3.09 | 6.09 | |
| MgO | 0.01 | 0.09 | 0.76 | 0.05 | 0.04 | 0.04 | 1.90 | 4.13 | 1.07 | 0.10 | 0.41 | 1.79 | |
| CaO | 0.01 | 0.06 | 0.06 | 0.06 | 0.10 | 0.10 | 0.29 | 4.75 | 0.13 | 0.13 | 0.09 | 0.12 | |
| Na2O | 0.01 | 0.02 | 0.07 | 0.02 | <0.01 | 0.01 | 0.42 | 0.16 | 0.06 | 0.02 | 0.06 | 0.24 | |
| K2O | 0.01 | 0.20 | 1.84 | 0.17 | 0.03 | 0.09 | 3.11 | 2.54 | 1.51 | 0.13 | 1.35 | 3.59 | |
| TiO2 | 0.01 | 0.05 | 0.37 | 0.02 | <0.01 | <0.01 | 0.57 | 0.64 | 0.36 | 0.02 | 0.31 | 0.75 | |
| P2O5 | 0.01 | 0.02 | 0.05 | <0.01 | <0.01 | 0.02 | 0.13 | 0.16 | 0.07 | 0.02 | 0.03 | 0.10 | |
| MnO | 0.01 | 0.01 | 0.02 | <0.01 | <0.01 | <0.01 | 0.11 | 0.47 | 0.03 | 0.02 | <0.01 | 0.03 | |
| Cr2O3 | 0.002 | 0.002 | 0.022 | 0.002 | <0.002 | <0.002 | 0.015 | 0.013 | 0.012 | <0.002 | 0.009 | 0.015 | |
| Total/C | 0.02 | 0.02 | 0.04 | 0.02 | 0.03 | 0.03 | 0.03 | 2.54 | 0.04 | 0.07 | 0.04 | 0.10 | |
| Total/S | 0.02 | <0.02 | <0.02 | <0.02 | <0.02 | 0.46 | 0.07 | 0.13 | <0.02 | <0.02 | <0.02 | <0.02 | |
| LOI | 0.1 | 1.20 | 2.60 | 1.30 | 0.60 | 1.47 | 2.90 | 10.30 | 2.50 | 1.35 | 2.20 | 3.6 | |
| Total | 0.01 | 99.94 | 99.96 | 99.95 | 99.95 | 99.98 | 99.94 | 99.91 | 99.92 | 99.97 | 99.95 | 99.80 | |
| Trace-REE (ppm) | |||||||||||||
| Ba | 1 | 199.00 | 225.00 | 18.000 | 252.00 | 27.00 | 428.00 | 305.00 | 173.00 | 21.00 | 165.00 | 405.00 | |
| Rb | 0.1 | 0.20 | 2.50 | 0.20 | <0.10 | 0.20 | 2.90 | 3.20 | 2.00 | 0.10 | 1.80 | 4.5 | |
| Sr | 0.5 | 1.80 | 6.60 | 0.90 | 0.50 | 0.60 | 9.40 | 10.00 | 6.10 | 0.60 | 5.50 | 13.3 | |
| Nb | 0.1 | 12.70 | 90.90 | 11.90 | 4.00 | 7.20 | 99.90 | 106.90 | 72.90 | 11.50 | 71.90 | 173.6 | |
| Hf | 0.1 | 12.60 | 27.00 | 17.30 | 10.00 | 20.30 | 14.90 | 44.40 | 21.20 | 14.10 | 23.70 | 59.2 | |
| Ta | 0.1 | 0.60 | 4.40 | 0.70 | <0.20 | <0.20 | 6.50 | 9.60 | 5.60 | 0.90 | 4.60 | 9.8 | |
| V | 8 | 12.00 | 61.00 | <8.00 | <8.00 | 20.00 | 107.00 | 119.00 | 60.00 | 19.00 | 63.00 | 125 | |
| Zr | 0.1 | 7.60 | 89.70 | 6.30 | 2.00 | 5.10 | 104.50 | 115.70 | 78.70 | 4.50 | 69.50 | 165.0 | |
| Y | 0.1 | 1.70 | 23.00 | 5.90 | 0.20 | 10.40 | 14.50 | 24.90 | 19.10 | 1.80 | 14.70 | 25.4 | |
| Cu | 0.1 | 15.80 | 11.30 | 9.70 | 6.80 | 20.10 | 62.30 | 75.90 | 16.20 | 8.30 | 9.50 | 18.1 | |
| Pb | 0.1 | 171.30 | 57.9 | 93.50 | 65.30 | 60.90 | 18.40 | 44.50 | 16.60 | 28.90 | 20.00 | 17.9 | |
| Zn | 1 | 65.00 | 86.000 | 32.00 | 18.00 | 25.00 | 62.00 | 88.00 | 54.00 | 24.00 | 21.00 | 86 | |
| As | 0.5 | 15.20 | 36.40 | 10.10 | 9.70 | 615.20 | 37.00 | 37.60 | 48.60 | 318.10 | 151.10 | 41.8 | |
| Sb | 0.1 | 5.80 | 12.00 | 4.70 | 1.50 | 17.20 | 21.20 | 3.10 | 25.00 | 258.00 | 76.30 | 15.7 | |
| Ag | 0.1 | 2.40 | 0.20 | 0.70 | 1.00 | 2.90 | <0.10 | 0.30 | 0.20 | 0.50 | 0.50 | 0.3 | |
| Au (ppb) | 0.5 | 266.20 | 80.80 | 64.70 | 434.20 | 7060.70 | 4.00 | 2.50 | 140.10 | 95.20 | 432.00 | 42.8 | |
| Hg | 0.01 | 0.08 | 0.02 | 0.05 | 0.02 | 0.09 | 0.11 | 0.05 | 0.02 | 0.06 | 0.05 | 0.04 | |
| La | 0.1 | 2.10 | 16.20 | 2.20 | 0.60 | 2.20 | 14.20 | 25.90 | 18.00 | 2.50 | 17.80 | 27.7 | |
| Ce | 0.1 | 2.50 | 32.70 | 3.50 | 0.50 | 3.00 | 29.80 | 48.50 | 32.80 | 3,00 | 33.20 | 56.6 | |
| Pr | 0.02 | 0.32 | 3.77 | 0.47 | 0.08 | 0.39 | 3.36 | 5.84 | 3.79 | 0.38 | 3.84 | 6.33 | |
| Nd | 0.30 | 1.40 | 14.30 | 1.80 | 0.30 | 1.70 | 12.10 | 22.50 | 14.20 | 1.40 | 14.70 | 22.6 | |
| Sm | 0.05 | 0.35 | 3.04 | 0.49 | 0.16 | 0.60 | 2.85 | 4.66 | 3.06 | 0.41 | 3.01 | 4.53 | |
| Eu | 0.02 | 0.07 | 0.64 | 0.16 | 0.02 | 0.29 | 0.73 | 1.16 | 0.79 | 0.11 | 0.78 | 1.09 | |
| Gd | 0.05 | 0.58 | 3.13 | 0.92 | 0.36 | 1.31 | 2.84 | 5.01 | 3.22 | 0.57 | 2.95 | 4.44 | |
| Tb | 0.01 | 0.04 | 0.54 | 0.12 | 0.02 | 0.21 | 0.44 | 0.81 | 0.52 | 0.07 | 0.44 | 0.74 | |
| Dy | 0.05 | 0.28 | 3.36 | 0.72 | 0.10 | 1.43 | 2.45 | 4.43 | 3.15 | 0.37 | 2.54 | 4.37 | |
| Ho | 0.02 | 0.06 | 0.75 | 0.19 | <0.02 | 0.30 | 0.56 | 0.90 | 0.68 | 0.07 | 0.47 | 0.90 | |
| Er | 0.03 | 0.21 | 2.13 | 0.52 | 0.03 | 0.88 | 1.77 | 2.76 | 1.97 | 0.20 | 1.47 | 2.58 | |
| Tm | 0.01 | 0.03 | 0.33 | 0.08 | 0.01 | 0.12 | 0.25 | 0.41 | 0.28 | 0.04 | 0.21 | 0.39 | |
| Yb | 0.05 | 0.17 | 1.98 | 0.54 | 0.10 | 0.81 | 1.87 | 2.74 | 1.80 | 0.19 | 1.49 | 2.71 | |
| Lu | 0.01 | 0.04 | 0.28 | 0.09 | 0.02 | 0.12 | 0.30 | 0.40 | 0.27 | 0.03 | 0.24 | 0.40 | |
| Quartz–Feldspar-Porphyry | |||||||||||||
| Major Oxides (wt.%) | DL | KED6-3 | KED6-4 | KED6-5 | KED6-6 | KED6-7 | KED6-8 | KED6-10 | KED17-1 | KED17-2- | KED17-6 | KED17-7 | KED135-3 |
| SiO2 | 0.01 | 67.88 | 70.41 | 69.97 | 67.10 | 71.32 | 6618 | 73.71 | 64.79 | 75.49 | 89.52 | 83.08 | 67.69 |
| Al2O3 | 0.01 | 14.99 | 13.77 | 13.45 | 16.39 | 13.62 | 14.04 | 11.48 | 16.00 | 11.92 | 3.34 | 7.37 | 16.61 |
| Fe2O3 | 0.04 | 3.05 | 3.61 | 2.52 | 2.59 | 2.79 | 3.48 | 3.46 | 4.57 | 2.10 | 3.35 | 2.35 | 2.31 |
| MgO | 0.01 | 1.51 | 1.30 | 0.89 | 0.94 | 0.90 | 1.15 | 0.83 | 1.03 | 0.38 | 0.10 | 0.47 | 0.56 |
| CaO | 0.01 | 0.30 | 0.33 | 0.26 | 0.31 | 0.34 | 0.28 | 0.22 | 0.35 | 0.13 | 0.07 | 0.15 | 0.17 |
| Na2O | 0.01 | 2.82 | 1.30 | 0.31 | 0.71 | 1.16 | 0.34 | 0.69 | 0.25 | 0.19 | 0.09 | 0.08 | 0.25 |
| K2O | 0.01 | 7.00 | 6.61 | 8.90 | 8.27 | 6.68 | 9.21 | 6.79 | 9.03 | 6.89 | 2.06 | 4.34 | 8.13 |
| TiO2 | 0.01 | 0.36 | 0.40 | 0.39 | 0.44 | 0.40 | 0.42 | 0.35 | 0.45 | 0.34 | 0.08 | 0.19 | 0.48 |
| P2O5 | 0.01 | 0.14 | 0.14 | 0.13 | 0.15 | 0.13 | 0.14 | 0.12 | 0.13 | 0.03 | 0.03 | 0.05 | 0.05 |
| MnO | 0.01 | 0.07 | 0.07 | 0.05 | 0.04 | 0.05 | 0.06 | 0.05 | 0.03 | 0.01 | <0.01 | 0.03 | 0.02 |
| Cr2O3 | 0.002 | 0.004 | <0.002 | <0.002 | <0.002 | <0.002 | <0.002 | <0.002 | <0.002 | <0.002 | <0.002 | <0.002 | <0.002 |
| Total/C | 0.02 | 0.02 | 0.03 | 0.02 | 0.03 | 0.03 | 0.06 | <0.02 | 0.04 | 0.04 | 0.04 | 0.03 | <0.02 |
| Total/S | 0.02 | 0.45 | 0.05 | 0.62 | 0.38 | 0.11 | 1.22 | 1.22 | <0.02 | <0.02 | 0.54 | <0.02 | <0.02 |
| LOI | 0.1 | 1.31 | 1.90 | 2.35 | 2.51 | 2.50 | 3.30 | 0.95 | 3.20 | 2.40 | 0.78 | 1.80 | 3.60 |
| Total | 0.01 | 99.88 | 99.89 | 99.84 | 99.83 | 99.97 | 99.82 | 99.87 | 99.83 | 99.88 | 99.96 | 99.91 | 99.87 |
| Trace-REE (ppm) | |||||||||||||
| Ba | 1 | 230.00 | 670.00 | 674.00 | 791.00 | 668.00 | 647.00 | 583.00 | 836.00 | 575.00 | 190.00 | 142.00 | 866.00 |
| Rb | 0.1 | 3.50 | 3.30 | 3.10 | 3.30 | 3.00 | 3.00 | 2.60 | 3.20 | 2.80 | 0.60 | 1.40 | 2.90 |
| Sr | 0.5 | 3.70 | 6.40 | 6.30 | 7.10 | 6.70 | 6.30 | 5.50 | 7.10 | 5.70 | 2.00 | 3.00 | 6.70 |
| Nb | 0.1 | 365.00 | 315.80 | 426.70 | 404.40 | 319.70 | 442.20 | 307.50 | 420.60 | 325.50 | 97.20 | 217.00 | 371.80 |
| Hf | 0.1 | 65.60 | 159.00 | 124.70 | 114.30 | 171.80 | 143.40 | 72.20 | 78.60 | 90.30 | 30.80 | 36.90 | 96.60 |
| Ta | 0.1 | 3.90 | 9.10 | 10.00 | 11.10 | 9.70 | 9.60 | 9.10 | 10.80 | 8.10 | 2.40 | 4.30 | 10.80 |
| V | 8 | 50.00 | 76.00 | 74.00 | 74.00 | 68.00 | 74.00 | 59.00 | 83.00 | 51.00 | 23.00 | 43.00 | 75.00 |
| Zr | 0.1 | 134.90 | 121.30 | 105.60 | 113.20 | 108.30 | 109.50 | 99.00 | 113.60 | 93.00 | 19.60 | 53.40 | 109.00 |
| Y | 0.1 | 26.00 | 10.50 | 11.60 | 13.90 | 14.50 | 13.60 | 12.00 | 12.30 | 10.30 | 4.10 | 8.60 | 12.20 |
| Cu | 0.1 | 12.80 | 10.40 | 12.40 | 16.10 | 26.60 | 34.60 | 9.30 | 8.30 | 7.10 | 22.50 | 20.80 | 6.60 |
| Pb | 0.1 | 60.90 | 35.90 | 53.40 | 29.40 | 13.50 | 102.10 | 32.40 | 31.40 | 34.70 | 69.60 | 46.80 | 7.20 |
| Zn | 1 | 93.00 | 49.00 | 34.00 | 31.00 | 32.00 | 54.00 | 40.00 | 97.00 | 33.00 | 26.00 | 62.00 | 22.00 |
| As | 0.5 | 413.70 | 5.50 | 340.90 | 458.20 | 175.50 | 1376.50 | 213.60 | 154.20 | 85.60 | 356.00 | 68.40 | 43.60 |
| Sb | 0.1 | 7.30 | 1.00 | 10.60 | 8.20 | 3.90 | 28.80 | 3.00 | 23.00 | 9.80 | 19.40 | 14.70 | 6.60 |
| Ag | 0.1 | 0.20 | 0.10 | 0.20 | 0.40 | 0.20 | 0.30 | 0.70 | 0.20 | 0.20 | 2.60 | 0.30 | 0.10 |
| Au (ppb) | 0.5 | 26.10 | 39.60 | 25.70 | 2.30 | 2.40 | 59.20 | 436.00 | 71.10 | 171.50 | 1205.10 | 461.20 | 136.20 |
| Hg | 0.01 | 0.11 | 0.03 | 0.29 | 0.24 | 0.11 | 0.66 | 0.10 | 0.01 | 0.02 | 0.16 | 0.03 | <0.01 |
| La | 0.1 | 13.50 | 20.60 | 22.30 | 26.00 | 20.50 | 25.00 | 22.30 | 21.20 | 20.70 | 7.50 | 11.20 | 23.60 |
| Ce | 0.1 | 26.30 | 37.10 | 39.70 | 47.80 | 37.10 | 45.30 | 39.10 | 38.90 | 34.10 | 12.60 | 20.00 | 40.20 |
| Pr | 0.02 | 3.40 | 4.02 | 4.28 | 5.08 | 3.85 | 5.06 | 4.32 | 4.57 | 3.78 | 1.43 | 2.18 | 4.49 |
| Nd | 0.30 | 11.20 | 14.80 | 14.70 | 18.30 | 13.10 | 18.20 | 16.00 | 16.50 | 13.40 | 5.70 | 8.00 | 16.30 |
| Sm | 0.05 | 2.58 | 2.95 | 2.93 | 3.42 | 2.87 | 3.65 | 2.95 | 3.13 | 2.70 | 1.09 | 1.60 | 3.44 |
| Eu | 0.02 | 0.75 | 0.80 | 0.80 | 1.09 | 0.79 | 0.96 | 0.82 | 0.92 | 0.77 | 0.22 | 0.44 | 0.85 |
| Gd | 0.05 | 2.97 | 2.84 | 2.68 | 3.40 | 2.74 | 3.30 | 2.93 | 2.98 | 2.59 | 1.12 | 1.75 | 2.98 |
| Tb | 0.01 | 0.55 | 0.39 | 0.40 | 0.47 | 0.42 | 0.47 | 0.40 | 0.42 | 0.37 | 0.13 | 0.25 | 0.41 |
| Dy | 0.05 | 3.55 | 1.99 | 2.01 | 2.52 | 2.39 | 2.53 | 2.19 | 2.43 | 1.98 | 0.78 | 1.33 | 2.18 |
| Ho | 0.02 | 0.82 | 0.37 | 0.43 | 0.49 | 0.55 | 0.49 | 0.43 | 0.52 | 0.38 | 0.13 | 0.31 | 0.45 |
| Er | 0.03 | 2.32 | 1.12 | 1.17 | 1.49 | 1.56 | 1.43 | 1.24 | 1.43 | 1.19 | 0.43 | 0.89 | 1.24 |
| Tm | 0.01 | 0.37 | 0.19 | 0.20 | 0.27 | 0.25 | 0.22 | 0.19 | 0.23 | 0.18 | 0.06 | 0.15 | 0.18 |
| Yb | 0.05 | 2.30 | 1.30 | 1.28 | 1.59 | 1.59 | 1.56 | 1.40 | 1.63 | 1.21 | 0.44 | 0.95 | 1.48 |
| Lu | 0.01 | 0.37 | 0.21 | 0.20 | 0.28 | 0.24 | 0.25 | 0.23 | 0.27 | 0.19 | 0.09 | 0.15 | 0.23 |
| Quartz–Mica Schist | |||||||||||||
| Major Oxides (wt.%) | DL | KED2-5 | KED2-11 | KED6-11 | KED44-2 | KED44-3 | KED44-12 | KED70-1 | KED70-2 | ||||
| SiO2 | 0.01 | 90.65 | 95.19 | 80.37 | 87.95 | 78.10 | 52.92 | 95.78 | 71.54 | ||||
| Al2O3 | 0.01 | 2.79 | 1.88 | 9.22 | 4.66 | 8.78 | 14.85 | 1.19 | 9.37 | ||||
| Fe2O3 | 0.04 | 2.88 | 1.15 | 2.91 | 2.67 | 4.66 | 14.06 | 0.65 | 7.92 | ||||
| MgO | 0.01 | 0.21 | 0.16 | 0.49 | 0.73 | 2.00 | 4.78 | 0.09 | 3.08 | ||||
| CaO | 0.01 | 0.004 | 0.06 | 0.09 | 0.13 | 0.15 | 0.44 | 0.07 | 0.17 | ||||
| Na2O | 0.01 | 0.03 | 0.03 | 0.09 | 0.03 | 0.04 | 0.06 | 0.01 | 0.03 | ||||
| K2O | 0.01 | 0.99 | 0.37 | 3.61 | 1.60 | 2.44 | 3.56 | 0.11 | 2.77 | ||||
| TiO2 | 0.01 | 0.13 | 0.07 | 0.45 | 0.22 | 0.50 | 1.63 | 0.01 | 0.68 | ||||
| P2O5 | 0.01 | 0.07 | 0.02 | 0.06 | 0.05 | 0.07 | 0.15 | 0.07 | 0.09 | ||||
| MnO | 0.01 | 0.02 | 0.02 | <0.01 | 0.01 | 0.03 | 0.07 | <0.01 | 0.04 | ||||
| Cr2O3 | 0.002 | 0.008 | 0.004 | 0.010 | 0.004 | 0.035 | 0.036 | <0.002 | 0.030 | ||||
| Total/C | 0.02 | 0.08 | 0.03 | 0.04 | <0.02 | 0.03 | 0.02 | 0.79 | 0.07 | ||||
| Total/S | 0.02 | 0.06 | <0.02 | <0.02 | <0.02 | <0.02 | <0.02 | <0.02 | <0.02 | ||||
| LOI | 0.1 | 2.10 | 1.00 | 2.60 | 1.90 | 3.10 | 7.20 | 2.00 | 4.10 | ||||
| Total | 0.01 | 99.98 | 99.95 | 99.90 | 99.95 | 99.91 | 99.77 | 99.98 | 99.82 | ||||
| Trace-REE (ppm) | |||||||||||||
| Ba | 1 | 90.00 | 92.00 | 281.00 | 120.00 | 279.00 | 95.00 | 36.00 | 208.00 | ||||
| Rb | 0.1 | 0.80 | 0.60 | 3.30 | 1.30 | 2.80 | 2.80 | 0.20 | 2.30 | ||||
| Sr | 0.5 | 2.50 | 1.70 | 8.60 | 4.10 | 8.90 | 1.80 | 0.40 | 11.00 | ||||
| Nb | 0.1 | 49.40 | 21.80 | 191.10 | 67.80 | 113.00 | 177.80 | 10.20 | 132.40 | ||||
| Hf | 0.1 | 16.20 | 19.00 | 58.00 | 24.50 | 18.40 | 75.20 | 149.60 | 47.60 | ||||
| Ta | 0.1 | 2.10 | 1.00 | 6.70 | 4.00 | 6.60 | <0.20 | 0.80 | 5.90 | ||||
| V | 8 | 25.00 | 18.00 | 71.00 | 41.00 | 75.00 | 319.00 | 10.00 | 103.00 | ||||
| Zr | 0.1 | 33.90 | 24.10 | 129.70 | 47.30 | 105.00 | 100.50 | 6.0 | 94.60 | ||||
| Y | 0.1 | 5.30 | 2.70 | 14.60 | 13.10 | 20.50 | 30.10 | 4.000 | 17.50 | ||||
| Cu | 0.1 | 33.50 | 15.90 | 13.90 | 16.70 | 22.30 | 40.60 | 54.60 | 33.70 | ||||
| Pb | 0.1 | 128.10 | 95.10 | 27.90 | 24.80 | 13.70 | 21.80 | 26.00 | 28.00 | ||||
| Zn | 1 | 49.00 | 54.00 | 21.00 | 38.00 | 88.00 | 128.00 | 16.00 | 101.00 | ||||
| As | 0.5 | 169.80 | 16.10 | 99.50 | 105.60 | 118.60 | 326.20 | 10.90 | 422.40 | ||||
| Sb | 0.1 | 7.80 | 3.60 | 18.90 | 25.80 | 17.00 | 40.70 | 8.90 | 58.90 | ||||
| Ag | 0.1 | 0.70 | 0.70 | 0.30 | 0.20 | <0.10 | 0.20 | 10.40 | 0.40 | ||||
| Au (ppb) | 0.5 | 376.40 | 376.70 | 552.1 | 79.4 | 18.70 | 128.00 | 903.10 | 158.10 | ||||
| Hg | 0.01 | 0.06 | 0.04 | 0.04 | 0.01 | <0.01 | 0.020 | 2.87 | 0.02 | ||||
| La | 0.1 | 7.60 | 2.40 | 19.5 | 19.6 | 23.30 | 3.70 | 5.20 | 22.90 | ||||
| Ce | 0.1 | 11.30 | 3.40 | 37.6 | 33.8 | 45.40 | 6.50 | 6.70 | 43.80 | ||||
| Pr | 0.02 | 1.19 | 0.54 | 4.51 | 4.58 | 5.54 | 1.23 | 0.84 | 5.02 | ||||
| Nd | 0.30 | 4.40 | 2.00 | 17.5 | 17.0 | 21.80 | 6.30 | 4.00 | 19.90 | ||||
| Sm | 0.05 | 0.99 | 0.55 | 3.57 | 3.37 | 4.29 | 2.19 | 1.10 | 4.03 | ||||
| Eu | 0.02 | 0.20 | 0.10 | 0.75 | 0.74 | 0.94 | 0.74 | 0.24 | 0.85 | ||||
| Gd | 0.05 | 1.04 | 0.72 | 3.13 | 3.08 | 4.19 | 3.87 | 1.12 | 3.85 | ||||
| Tb | 0.01 | 0.15 | 0.08 | 0.47 | 0.41 | 0.62 | 0.76 | 0.12 | 0.57 | ||||
| Dy | 0.05 | 0.88 | 0.48 | 2.47 | 2.21 | 3.30 | 5.10 | 0.64 | 3.07 | ||||
| Ho | 0.02 | 0.20 | 0.09 | 0.56 | 0.44 | 0.69 | 1.17 | 0.13 | 0.64 | ||||
| Er | 0.03 | 0.58 | 0.25 | 1.58 | 1.28 | 2.01 | 3.31 | 0.35 | 1.84 | ||||
| Tm | 0.01 | 0.10 | 0.05 | 0.24 | 0.20 | 0.30 | 0.50 | 0.05 | 0.27 | ||||
| Yb | 0.05 | 0.67 | 0.29 | 1.74 | 1.30 | 1.92 | 3.27 | 0.31 | 1.77 | ||||
| Lu | 0.01 | 0.11 | 0.05 | 0.25 | 0.21 | 0.32 | 0.50 | 0.05 | 0.27 | ||||
References
- Berger, B.R.; Bonham, H.F., Jr. Epithermal gold-silver deposits in the western United States: Time-space products of evolving plutonic, volcanic and tectonic environments. J. Geochem. Explor. 1990, 36, 103–142. [Google Scholar] [CrossRef]
- Yılmaz, H.; Oyman, T.; Arehart, G.A.; Çolakoğlu, R.; Billor, Z. Low-sulfidation type Au–Ag mineralization at Bergama, Izmir, Turkey. Ore Geol. Rev. 2007, 32, 81–124. [Google Scholar] [CrossRef]
- Yılmaz, H.; Oyman, T.; Sönmez, F.N.; Arehart, G.B.; Billor, Z. Intermediate sulfidation epithermal gold-base metal deposits in Tertiary subaerial volcanic rocks Şahinli/Tespih Dere (Lapseki/Western Turkey). Ore Geol. Rev. 2010, 37, 236–258. [Google Scholar] [CrossRef]
- Ünal İmer, E.; Güleç, N.; Kuşcu, İ.; Fallick, A.E. Genetic investigation and comparison of Kartaldag and Madendag epithermal gold deposits in Çanakkale, NW Turkey. Ore Geol. Rev. 2013, 53, 204–222. [Google Scholar] [CrossRef]
- Liu, Z.; Mao, X.; Deng, H.; Li, B.; Zhang, S.; Lai, J.; Bayless, R.C.; Pan, M.; Li, L.; Shang, Q. Hydrothermal processes at the Axi epithermal Au deposit, Western Tianshan: Insights from geochemical effects of alteration, mineralization and trace elements in pyrite. Ore Geol. Rev. 2018, 102, 368–385. [Google Scholar] [CrossRef]
- Najaran, M.; Mehrabi, B.; Siani, M.G. Mineralogy, hydrothermal alteration, fluid inclusion, and O–H stable isotopes of the Siah Jangal-Sar Kahno epithermal gold deposit, SE Iran. Ore Geol. Rev. 2020, 125, 103689. [Google Scholar] [CrossRef]
- Novruzov, N.; Valiyev, A.; Bayramov, A.; Mammadov, S.; Ibrahimov, J.; Ebdulrehimli, A. Mineral composition and paragenesis of altered and mineralized zones in the Gadir low sulfidation epithermal deposit (Lesser Caucasus, Azerbaijan). Iran. J. Earth Sci. 2019, 11, 14–29. [Google Scholar]
- Siani, M.G.; Lentz, D.R. Lithogeochemistry of various hydrothermal alteration types associated with precious and base metal epithermal deposits in the Tarom-Hashtjin metallogenic province, NW Iran: Implications for regional exploration. J. Geochem. Explor. 2022, 232, 106903. [Google Scholar] [CrossRef]
- Simpson, M.P.; Gazley, M.F.; Stuart, A.G.; Pearce, M.A.; Birchall, R.; Chappell, D.; Christie, A.B.; Stevens, M.R. Hydrothermal alteration at the Karangahake epithermal Au-Ag deposit, Hauraki Goldfield, New Zealand. Econ. Geol. 2019, 114, 243–273. [Google Scholar] [CrossRef]
- Taylor, B.E. Epithermal gold deposits. In Mineral Deposits of Canada: A Synthesis of Major Deposits-Types, District Metallogeny, the Evolution of Geological Provinces, and Exploration Methods; Goodfellow, W.D., Ed.; Special Publication N. 5; Geological Association of Canada, Mineral Deposits Division: St. John’s, NL, Canada, 2007; pp. 113–139. [Google Scholar]
- White, N.C.; Hedenquist, J.W. Epithermal gold deposits: Styles, characteristics and exploration. SEG Newsl. 1995, 23, 9–13. [Google Scholar] [CrossRef]
- Evans, A.M. Ore Geology and Industrial Minerals: An Introduction; Blackwell Publ.: Oxford, UK, 1993; p. 389. [Google Scholar]
- Hedenquist, J.W.; Arribas, R.A.; Gonzalez-Urien, E. Exploration for epithermal gold deposits. Soc. Econ. Geol. Rev. 2000, 13, 245–277. [Google Scholar]
- Duba, D.; Williams-Jones, A.E. The application of illite crystallinity, organic-matter reflectance, and isotopic techniques to mineral exploration-A case-study in southwestern Gaspé, Quebec. Econ. Geol. 1983, 78, 1350–1363. [Google Scholar] [CrossRef]
- Kelley, D.L.; Kelley, K.D.; Coker, W.B.; Caughlin, B.; Doherty, M.E. Beyond the obvious limits of ore deposits: The use of mineralogical, geochemical, and biological features for the remote detection of mineralization. Econ. Geol. 2006, 101, 729–752. [Google Scholar] [CrossRef]
- Meyer, C.; Hemley, J.J. Wall Rock Alteration in Geochemistry of Ore Deposits; Barnes, H.L., Ed.; Holt, Rinehart and Winston: New York, NY, USA, 1967; pp. 166–235. [Google Scholar]
- Yoneda, T.; Mokko, H.; Matsumoto, A.; Sato, T. Comparison of smectite–corrensite–chlorite series minerals in the Todoroki and Hishikari Au–Ag deposits: Applicability of mineralogical properties as exploration index for epithermal systems. Nat. Resour. Res. 2021, 30, 2889–2908. [Google Scholar] [CrossRef]
- Guo, N.; Guo, W.; Shi, W.; Huang, Y.; Guo, Y.; Lian, D. Characterization of illite clays associated with the Sinongduo low sulfidation epithermal deposit, Central Tibet using field SWIR spectrometry. Ore Geol. Rev. 2020, 120, 103228. [Google Scholar] [CrossRef]
- Rose, A.W.; Burt, D.M. Hydrothermal alteration. In Geochemistry of Hydrothermal Ore Deposits; Barnes, H.L., Ed.; John Wiley & Sons: New York, NY, USA, 1979; pp. 173–235. [Google Scholar]
- Chen, M.T.; Wei, J.H.; Li, Y.J.; Shi, W.J.; Liu, N.Z. Epithermal gold mineralization in Cretaceous volcanic belt, SE China: Insight from the Shangshangang deposit. Ore Geol. Rev. 2020, 118, 103355. [Google Scholar] [CrossRef]
- Prihatmoko, S.; Idrus, A. Low sulfidation epithermal gold deposits in Java, Indonesia: Characteristic and linkage to the volcano-tectonic setting. Ore Geol. Rev. 2020, 121, 103490. [Google Scholar] [CrossRef]
- Kıray, D. Determination of the Origin of Kestanelik Au-Ag Mineralization in Şahinli (Lapseki-Çanakkale, Western Turkey) Region by Geological, Mineralogical and Geochemical Investigations. Ph.D. Thesis, Süleyman Demirel University, Isparta, Turkey, 2021; p. 217. [Google Scholar]
- Bakhsh, R.A.; Ahmed, A.H. The Umm Matierah gold prospect: Mineralogical and geochemical characteristics of a potential low-sulfidation epithermal gold deposits, southeastern Arabian Shield, Saudi Arabia. J. Asian Earth Sci. X 2023, 9, 100153. [Google Scholar] [CrossRef]
- Mikaeili, K.; Hosseinzadeh, M.R.; Moayyed, M.; Maghfouri, S. The Shah-Ali-Beiglou Zn-Pb-Cu (-Ag) deposit, Iran: An example of intermediate sulfidation epithermal type mineralization. Minerals 2018, 8, 148. [Google Scholar] [CrossRef]
- Imer, A.; Richards, J.P.; Muehlenbachs, K. Hydrothermal evolution of the Çöpler porphyry-epithermal Au deposit, Erzincan Province, central eastern Turkey. Econ. Geol. 2016, 111, 1619–1658. [Google Scholar] [CrossRef]
- Kıray, D.; Cengiz, O. Petrographical and geochemical characteristics of the Kestanelik granitoid (Çanakkale, Biga Peninsula). Geol. Bull. Turk. 2023, 66, 127–148. [Google Scholar]
- Gürler, Z. Karadere Low Sulfidation Gold Deposit (İvrindi, Balıkesir): An example for Detachment Fault-Related Epithermal Gold Deposits in Western Turkey. Master’s Thesis, Balıkesir University, Balıkesir, Turkey, 2019; p. 100. [Google Scholar]
- Dill, H.G.; Dohrmann, R.; Kaufhold, S.; Çiçek, G. Mineralogical, chemical and micromorphological studies of the argillic alteration zone of the epithermal gold deposit Ovacik, Western Turkey: Tools for applied and genetic economic geology. J. Geochem. Explor. 2015, 148, 105–127. [Google Scholar] [CrossRef]
- Carrillo-Rosúa, J.; Morales-Ruano, S.; Esteban-Arispe, I.; Hach-Ali, P.F. Significance of phyllosilicate mineralogy and mineral chemistry in an epithermal environment. Insights from the Palai-Islica Au-Cu deposit (Almeria, SE Spain). Clays Clay Miner. 2009, 57, 1–24. [Google Scholar] [CrossRef]
- Cravero, F.; Domınguez, E.; Iglesias, C. Genesis and applications of the Cerro Rubio kaolin deposit, Patagonia Argentina. Appl. Clay Sci. 2001, 18, 157–172. [Google Scholar] [CrossRef]
- Kadir, S.; Erkoyun, H. Genesis of the hydrothermal Karaçayır kaolinite deposit in Miocene volcanics and Palaeozoic metamorphic rocks of the Uşak-Güre Basin, western Turkey. Turk. J. Earth Sci. 2013, 22, 444–468. [Google Scholar] [CrossRef]
- Bozkaya, Ö.; Bozkaya, G.; Uysal, İ.T.; Banks, D.A. Illite occurrences related to volcanic-hosted hydrothermal mineralization in the Biga Peninsula, NW Turkey: Implications for the age and origin of fluids. Ore Geol. Rev. 2016, 76, 35–51. [Google Scholar] [CrossRef]
- Bozkaya, Ö.; Bozkaya, G.; Hanilçi, N.; Güven, A.S.; Banks, D.A.; Uysal, İ.T. Mineralogical evidences on argillic alteration in the Çöpler porphyry-epithermal gold deposit (Erzincan, East-Central Anatolia). Geol. Bull. Turk. 2018, 31, 335–358. [Google Scholar]
- Schalamuck, I.B.; Zubia, M.; Genini, A.; Fernandez, R.R. Jurassic epithermal Au–Ag deposits of Patagonia, Argentina. Ore Geol. Rev. 1997, 305, 57–71. [Google Scholar] [CrossRef]
- Gresens, R.L. Composition volume relationships of metasomatism. Chem. Geol. 1967, 2, 47–65. [Google Scholar] [CrossRef]
- Ishikawa, Y.; Sawaguchi, T.; Iwaya, S.; Horiuchi, M. Delineation of prospecting targets for Kuroko deposits based on models of volcanism of underlying dacite and alteration haloes. Min. Geol. 1976, 26, 105–117. [Google Scholar]
- Nesbitt, H.W.; Young, G.M. Early Proterozoic climates and plate motions inferred from major element chemistry of lutites. Nature 1982, 299, 715–717. [Google Scholar] [CrossRef]
- Myers, R.E.; MacLean, W.H. The geology of the New Insco copper deposit, Noranda District, Quebec. Can. J. Earth Sci. 1983, 20, 1291–1304. [Google Scholar] [CrossRef]
- MacLean, W.H.; Hoy, L.D. Geochemistry of hydrothermally altered rocks at the Horne mine, Noranda, Quebec. Econ. Geol. 1991, 86, 506–528. [Google Scholar] [CrossRef]
- Davies, J.F.; Whitehead, R.E. Molar ratios in the study of unaltered and hydrothermally altered greywackes and shales. Chem. Geol. 1994, 111, 85–100. [Google Scholar] [CrossRef]
- Davies, J.F.; Whitehead, R.E. Alkali-alumina and MgO-alumina molar ratios of altered and unaltered rhyolites. Explor. Min. Geol. 2006, 15, 75–88. [Google Scholar] [CrossRef]
- Davies, J.F.; Whitehead, R.E. Alkali/alumina molar ratio trends in altered granitoid rocks hosting porphyry and related deposits. Explor. Min. Geol. 2010, 19, 13–22. [Google Scholar] [CrossRef]
- Leitch, C.H.B.; Lentz, D.R. The gresens approach to mass balance constraints of alteration systems. In Alteration and Alteration Processes Associated with Ore-Forming Systems; Geological Association of Canada: St. John’s, NL, Canada, 1994; Volume 11, pp. 161–192. [Google Scholar]
- Lentz, D.R.; Gregoire, C. Petrology and mass-balance constraints on major-, trace-, and rare-earth-element mobility in porphyry-greisen alteration associated with the epizonal True Hill granite, southwestern New Brunswick, Canada. J. Geochem. Explor. 1995, 52, 303–331. [Google Scholar] [CrossRef]
- Madeisky, H.E. Quantitative Analysis of Hydrothermal Alteration: Applications in Lithogeochemical Exploration. Doctoral Dissertation, University of London, London, UK, 1996. [Google Scholar]
- Aiuppa, A.; Allard, P.; D’Alessandro, W.; Michel, A.; Parello, F.; Treuil, M.; Valenza, M. Mobility and fluxes of major, minor and trace metals during basalt weathering and groundwater transport at Mt. Etna Volcano (Sicily). Geochim. Cosmochim. Acta 2000, 64, 1827–1841. [Google Scholar] [CrossRef]
- Large, R.R.; Gemmell, J.B.; Paulick, H.; Huston, D.L. The alteration box plot: A simple approach to understanding the relationship between alteration mineralogy and lithogeochemistry associated with volcanic-hosted massive sulfide deposits. Econ. Geol. 2001, 96, 957–971. [Google Scholar] [CrossRef]
- Kirschbaum, A.; Martinez, E.; Pettinari, G.; Herrero, S. Weathering profiles in granites, Sierra Notre (Cordoba, Argentina). J. South Am. Earth. Sci. 2005, 19, 479–493. [Google Scholar] [CrossRef]
- Sipahi, F.; Sadıklar, M.B. The alteration mineralogy and mass change of the Zigana (Gümüşhane) volcanics of NE Turkey. Geol. Bull. Turk. 2010, 53, 97–128. [Google Scholar]
- Akaryalı, E.; Tüysüz, N. The genesis of the slab window-related Arzular low-sulfidation epithermal gold mineralization (Eastern Pontides, NE Turkey). Geosci. Front. 2013, 4, 409–421. [Google Scholar] [CrossRef]
- Giggenbach, W.F. Mass transfer in hydrothermal alteration systems-a conceptual approach. Geochim. Cosmochim. Acta 1984, 48, 2693–2711. [Google Scholar] [CrossRef]
- Giggenbach, W.F. Geothermal solute equilibria: Derivation of Na-K-Mg-Ca geoindicators. Geochim. Cosmochim. Acta 1988, 52, 2749–2765. [Google Scholar] [CrossRef]
- Stanley, C.R. Graphical investigation of lithogeochemical variations using molar element ratio diagrams: Theoretical foundation. In Lithogeochemical Exploration for Metasomatic Zones Associated with Hydrothermal Mineral Deposits Using Molar Element Ratio Analysis; Stanley, C.R., Ed.; Short Course Notes; Mineral Deposits Research Unit, Lithogeochemical Exploration Research Project, University of British Columbia: Vancouver, BC, Canada, 1998; pp. 63–103. [Google Scholar]
- Stanley, C.R. Molar element ratio analysis of lithogeochemical data: A toolbox for use in mineral exploration and mining. Geochem. Explor. Environ. Anal. 2020, 20, 233–256. [Google Scholar] [CrossRef]
- Okay, A.İ.; Tüysüz, O. Tethyan sutures of northern Turkey. In Mediterranean Basins: Tertiary Extension within the Alpine Orogen; Durand, B., Jolivet, L., Horvath, F., Seranne, M., Eds.; Special Publication 156; Geological Society: London, UK, 1999; pp. 475–515. [Google Scholar]
- MTA. General and Economic Geology of the Biga Peninsula; Special Publication Series 28; MTA: Ankara, Turkey, 2012; p. 326. (In Turkish) [Google Scholar]
- Şengör, A.M.C.; Yılmaz, Y. Tethyan evolution of Turkey: Aplate tectonic approach. Tectonophysics 1981, 75, 181–241. [Google Scholar] [CrossRef]
- Richards, J.P. Tectonic, magmatic, and metallogenic evolution of the Tethyan Orogen: From subduction to collision. Ore Geol. Rev. 2015, 70, 323–345. [Google Scholar] [CrossRef]
- Aldanmaz, E.; Pearce, J.A.; Thirlwall, M.F.; Mitchell, J.G. Petrogenetic evolution of late Cenozoic, post collision volcanism in western Anatolia, Turkey. J. Volcanol. Geotherm. Res. 2000, 102, 67–95. [Google Scholar] [CrossRef]
- Altunkaynak, Ş.; Genç, Ş.C. Petrogenesis and time-progressive evolution of the Cenozoic continental volcanism in the Biga Peninsula, NW Anatolia. Lithos 2008, 102, 316–340. [Google Scholar] [CrossRef]
- Ketin, İ. Anadolu’nun tektonik birlikleri. Bull. Miner. Res. Explor. 1966, 66, 20–34. [Google Scholar]
- Yılmaz, Y. Comparision of young volcanic associations of western and eastern Anatolia under compressional regime: A review. J. Volcanol. Geotherm. Res. 1990, 44, 69–87. [Google Scholar] [CrossRef]
- Şengör, A.M.C.; Lom, N.; Sunal, G.; Zabcı, C.; Sancar, T. The Phanerozoic palaeotectonics of Turkey. Part I: An inventory. Mediterr. Geosci. Rev. 2019, 1, 91–161. [Google Scholar] [CrossRef]
- Okay, A.İ.; Siyako, M.; Bürkan, K.A. Geology and tectonic evolution of the Biga Peninsula. Turk. Assoc. Pet. Geol Bull 1990, 2, 83–121, (In Turkish with English Abstract). [Google Scholar]
- Göncüoğlu, M.C. Introduction to the geology of Turkey: Geodynamic evolution of the pre-Alpine and Alpine terranes. In General Directorate of Mineral Research and Exploration Monographs Series; MTA: Ankara, Turkey, 2010; p. 66. ISBN 978-605-4075-74. [Google Scholar]
- Topuz, G.; Altherr, R.; Schwartz, W.H.; Dokuz, A.; Meyer, H.P. Variscan amphibolites-facies rocks from the Kurtoğlu metamorphic complex (Gümüşhane area, Eastern Pontides, Turkey). Int. J. Earth Sci. 2007, 96, 861–873. [Google Scholar] [CrossRef]
- Okay, A.I.; Satir, M.; Siebel, W. Pre-Alpide Palaeozoic and Mesozoic orogenic events in the eastern Mediterranean region. In European Lithosphere Dynamics. Geological Society; Memoirs: London, UK, 2006; Volume 32, pp. 389–405. [Google Scholar]
- Delaloye, M.; Bingöl, E. Granitoids from western and nortwestern Anatolia: Geochemistry and modeling of geodynamic evolution. Int. Geol. Rev. 2000, 42, 241–268. [Google Scholar] [CrossRef]
- Okay, A.İ.; Satır, M. Coeval plutonism and metamorphism in a Latest Oligocene metamorphic core complex in northwest Turkey. Geol. Mag. 2000, 137, 495–516. [Google Scholar] [CrossRef]
- Okay, A.İ.; Monod, O.; Monie, P. Triassic blueschists and eclogites from northwest Turkey: Vestiges of the Paleo-Tethyan subduction. Lithos 2002, 64, 155–178. [Google Scholar] [CrossRef]
- Okay, A.İ.; Göncüoğlu, C. The Karakaya complex: A review of data and concepts. Turk. J. Earth Sci. 2004, 13, 77–95. [Google Scholar]
- Chesser Resources. Annual Report; Chesser Resources Limited: Çanakkale, Turkey, 2012. [Google Scholar]
- Tümad Mining. Annual Report, 10; Tümad Mining Industry and Trade Inc.: Çanakkale, Turkey, 2020. [Google Scholar]
- Okay, A.İ.; Satır, M. Upper Cretaceous eclogite-facies metamorphic rocks from the Biga Peninsula, northwest Turkey. Turk. J. Earth Sci. 2000, 9, 47–56. [Google Scholar]
- Dönmez, M.; Akçay, A.E.; Genç, Ş.C.; Acar, Ş. Middle-upper Eocene volcanism and marine ignimbrites in the Biga Peninsula. Bull. Miner. Res. Explor. 2005, 131, 49–61. [Google Scholar]
- Erenoğlu, O. Chrono-Stratigraphic Position of Eocene, Oligo-Miocene Volcanics around Dededag (Beyçayır-Çanakkale) and Their Importance for Regional Volcanism in the Biga Peninsula. Ph.D. Thesis, Çanakkale Onsekiz Mart University, Çanakkale, Turkey, 2014; p. 217. [Google Scholar]
- Hedenquist, J.W. Observations on the Kestanelik and Karaayi Prospects, Biga Peninsula, Turkey. In Annual Report; Chesser Resources Limited: Çanakkale, Turkey, 2012. [Google Scholar]
- Gülyüz, N.; Shipton, Z.K.; Kuşcu, İ.; Lord, R.A.; Kaymakcı, N.; Gülyüz, E.; Gladwell, D.R. Repeated reactivation of clogged permeable pathways in epithermal gold deposits: Kestanelik epithermal vein system, NW Turkey. J. Geol. Soc. 2018, 175, 509–524. [Google Scholar] [CrossRef]
- Gülyüz, N.; Shıpton, Z.K.; Kuşcu, İ. Multiphase deformation, fluid flow and mineralization in epithermal systems: Inferences from structures, vein textures and breccias of the Kestanelik epithermal Au-Ag deposit, NW Turkey. Turk. J. Earth Sci. 2023, 32, 75–95. [Google Scholar] [CrossRef]
- Brown, G.; Brindley, G.W. X-ray diffraction procedures for clay mineral identification. In Crystal Structure of Clay Minerals and Their X-ray Identification; Brindley, G.W., Brown, G., Eds.; Mineralogical Society: London, UK, 1980. [Google Scholar]
- Celenk, O.; Flores, R.A.; dela Cruz, A.P., Jr. Geochemical characterization of epithermal alteration in Southeast Negros, Philippines. J. Geochem. Explor. 1987, 27, 189–211. [Google Scholar] [CrossRef]
- Berger, B.R. Geologic-geochemical features of hot-spring precious-metal deposits. In Geologic Characteristics of Sediment- and Volcanic-Hosted Disseminated Gold Deposits-Search for an Occurrence Model; Tooker, E.W., Ed.; U.S. Geological Survey Bulletin 1646; U.S. Government Printing Office: Washington, DC, USA, 1985; pp. 47–53. [Google Scholar]
- Hedenquist, J.W.; Reid, F. Epithermal Gold. Earth Resources Foundation; University of Sydney: Sydney, Australia, 1985; 31p. [Google Scholar]
- Turner, S. Fluid inclusion, alteration and ore mineral studies of an epithermal vein system: Mount Kasi, Vanua Levu, Fiji. In Proceedings of the Symposium 5: Volcanism, Hydrothermal Systems and Related Mineralization, International Volcanological Congress, Hamilton, New Zealand, 1–9 February 1986; Volume 5, pp. 87–94. [Google Scholar]
- Sverjensky, D.A. Europium redox equilibria in aqueous solution. Earth Planet. Sci. Lett. 1984, 67, 70–78. [Google Scholar] [CrossRef]
- Yongliang, X.; Yusheng, Z. The mobility of rare-earth elements during hydrothermal activity: A review. Chin. J. Geochem. 1991, 10, 295–306. [Google Scholar] [CrossRef]
- Poitrasson, F.; Pin, C.; Duthou, J.L. Hydrothermal remobilization of rare earth elements and its effect on Nd isotopes in rhyolite and granite. Earth Planet. Sci. Lett. 1995, 130, 1–11. [Google Scholar] [CrossRef]
- Boynton, W.V. Cosmochemistry of the rare earth elements: Meteorite studies. Chapter 3. Dev. Geochem. 1984, 2, 63–114. [Google Scholar]
- Barrett, T.; Cattalani, S.; MacLean, W.H. Volcanic lithogeochemistry and alteration at the Dalbridge massive sulphide deposits, Noranda Quebec. J. Geochem. Explor. 1993, 48, 135–173. [Google Scholar] [CrossRef]
- Van Gerven, M. Geochemische Nebengesteins Alterationen and Erfassung Signifikanter Zonierungen im Bereich des Jade-Erzfeldes, Okinawa, Trog, Japan. Ph.D. Thesis, Freir Universitate, Rohstoff and Umweltgeologie, Berlin, Germany, 1995; p. 186. [Google Scholar]
- Buchanan, L.J. Precious metal deposits associated with volcanic environments in the southwest. Arizona Geol. Soc. Digest 1981, 14, 237–261. [Google Scholar]
- Dilekler, G. Mineralization, Textural and Alteration Characteristics of the Şahinli (Sırakayalar and Karatepe) Low Sulfidation Epithermal Deposit (Lapseki, NW Turkey). Master’s Thesis, Middle East Technical University, Ankara, Turkey, 2022; p. 148. [Google Scholar]
- Alderton, D.H.M.; Pearce, J.A.; Potts, P.J. Rare earth element mobility during granite alteration: Evidence from southwest England. Earth Planet. Sci. Lett. 1980, 49, 149–165. [Google Scholar] [CrossRef]
- Palacios, C.M.; Hein, U.F.; Dulski, P. Behaviour of rare earth elements during hydrothermal alteration at the Buena Esperanza copper–silver deposit, northern Chile. Earth Planet. Sci. Lett. 1986, 80, 208–216. [Google Scholar] [CrossRef]
- Nesbitt, H.W. Mobility and fractionation of rare earth elements during weathering of a granodiorite. Nature 1979, 279, 206–210. [Google Scholar] [CrossRef]
- Warren, I.; Simmons, S.F.; Mauk, J.L. Whole-rock geochemical techniques for evaluating hydrothermal alteration, mass changes, and compositional gradients associated with epithermal Au-Ag mineralization. Econ. Geol. 2007, 102, 923–948. [Google Scholar] [CrossRef]
- Michard, A.; Albarede, F. The REE content of some hydrothermal fluids. Chem. Geol. 1986, 55, 51–60. [Google Scholar] [CrossRef]


| Sample Number | Sample Type | Qtz | I-M | Sme+I-M | Kln | Fld | Chl | Kln+Chl | Sme+Chl | Sme | Cal | Dol | Hm | Alu | Hbl |
|---|---|---|---|---|---|---|---|---|---|---|---|---|---|---|---|
| KED02-02 | SV | 16 | 3 | 0 | 2 | 0 | 0 | 0 | 0 | 0 | 2 | 0 | 0 | 0 | 0 |
| KED02-06 | SV | 16 | 10 | 0 | 3 | 0 | 6 | 0 | 0 | 2 | 3 | 1 | 0 | 0 | 1 |
| KED02-07 | SV | 16 | 6 | 0 | 4 | 0 | 0 | 0 | 0 | 0 | 1 | 0 | 0 | 0 | 0 |
| KED02-13 | SV | 17 | 0 | 0 | 0 | 0 | 0 | 0 | 0 | 0 | 1 | 0 | 0 | 0 | 0 |
| KED17-08 | SV | 15 | 0 | 0 | 2 | 0 | 0 | 0 | 0 | 0 | 3 | 0 | 0 | 0 | 0 |
| KED63-02 | SV | 17 | 8 | 1 | 2 | 4 | 11 | 2 | 1 | 1 | 0 | 0 | 0 | 0 | 0 |
| KED63-03 | SV | 8 | 9 | 0 | 2 | 1 | 10 | 2 | 0 | 0 | 3 | 1 | 0 | 0 | 0 |
| KED63-05 | SV | 17 | 8 | 1 | 5 | 1 | 0 | 0 | 0 | 4 | 2 | 1 | 0 | 0 | 0 |
| KED63-09 | SV | 15 | 3 | 0 | 0 | 0 | 0 | 0 | 0 | 0 | 2 | 0 | 0 | 0 | 0 |
| KED63-10 | SV | 17 | 8 | 0 | 6 | 1 | 0 | 0 | 0 | 0 | 2 | 0 | 1 | 0 | 0 |
| KED63-11 | SV | 16 | 8 | 0 | 2 | 1 | 9 | 2 | 0 | 0 | 4 | 1 | 0 | 0 | 0 |
| KED06-03 | QFP | 15 | 0 | 0 | 2 | 5 | 7 | 0 | 0 | 3 | 2 | 1 | 1 | 0 | 0 |
| KED06-04 | QFP | 16 | 7 | 0 | 1 | 13 | 9 | 0 | 0 | 4 | 3 | 1 | 1 | 0 | 0 |
| KED06-05 | QFP | 14 | 6 | 0 | 2 | 11 | 6 | 0 | 0 | 5 | 3 | 1 | 1 | 0 | 0 |
| KED06-06 | QFP | 15 | 6 | 1 | 1 | 12 | 6 | 0 | 1 | 9 | 1 | 1 | 0 | 0 | 0 |
| KED06-07 | QFP | 18 | 3 | 0 | 1 | 11 | 5 | 0 | 1 | 7 | 2 | 1 | 0 | 0 | 0 |
| KED06-08 | QFP | 13 | 4 | 0 | 2 | 9 | 4 | 0 | 0 | 3 | 0 | 0 | 0 | 0 | 0 |
| KED06-10 | QFP | 15 | 4 | 0 | 1 | 11 | 9 | 0 | 0 | 4 | 1 | 1 | 0 | 0 | 0 |
| KED17-01 | QFP | 11 | 7 | 0 | 0 | 9 | 0 | 0 | 0 | 3 | 1 | 0 | 1 | 0 | 0 |
| KED17-02 | QFP | 12 | 6 | 0 | 0 | 10 | 0 | 0 | 0 | 0 | 0 | 0 | 0 | 0 | 0 |
| KED17-06 | QFP | 16 | 0 | 0 | 0 | 3 | 0 | 0 | 0 | 0 | 0 | 0 | 0 | 0 | 0 |
| KED17-07 | QFP | 15 | 3 | 0 | 0 | 8 | 0 | 0 | 0 | 0 | 2 | 0 | 0 | 0 | 0 |
| KED135-3 | QFP | 17 | 7 | 1 | 4 | 12 | 0 | 0 | 0 | 9 | 3 | 0 | 1 | 2 | 0 |
| KED02-05 | QMS | 16 | 8 | 0 | 2 | 0 | 0 | 0 | 0 | 0 | 3 | 0 | 0 | 0 | 0 |
| KED02-11 | QMS | 16 | 8 | 0 | 2 | 0 | 0 | 0 | 0 | 0 | 2 | 0 | 0 | 0 | 0 |
| KED06-11 | QMS | 14 | 9 | 0 | 6 | 8 | 0 | 0 | 0 | 2 | 3 | 0 | 0 | 0 | 0 |
| KED44-02 | QMS | 16 | 6 | 3 | 2 | 3 | 8 | 0 | 1 | 2 | 2 | 0 | 0 | 0 | 0 |
| KED44-03 | QMS | 17 | 9 | 0 | 0 | 1 | 7 | 0 | 0 | 0 | 3 | 1 | 0 | 0 | 0 |
| KED44-12 | QMS | 15 | 2 | 0 | 0 | 5 | 13 | 0 | 0 | 0 | 3 | 1 | 1 | 0 | 0 |
| KED70-01 | QMS | 18 | 0 | 0 | 2 | 0 | 0 | 0 | 0 | 0 | 2 | 0 | 0 | 0 | 0 |
| KED70-02 | QMS | 15 | 9 | 0 | 0 | 2 | 12 | 0 | 0 | 0 | 4 | 1 | 0 | 0 | 0 |
| Sample Type | Mean Eu/Eu* | La/Yb | La/Sm | LREE/HREE | ƩREE |
|---|---|---|---|---|---|
| Silicified vein | 0.72 | 5.87 | 3.30 | 2.85 | 65.95 |
| Quartz–feldspar porphyry | 0.82 | 9.84 | 4.41 | 4.04 | 81.06 |
| Quartz–mica schist | 0.66 | 7.49 | 3.21 | 3.12 | 63.24 |
Disclaimer/Publisher’s Note: The statements, opinions and data contained in all publications are solely those of the individual author(s) and contributor(s) and not of MDPI and/or the editor(s). MDPI and/or the editor(s) disclaim responsibility for any injury to people or property resulting from any ideas, methods, instructions or products referred to in the content. |
© 2024 by the authors. Licensee MDPI, Basel, Switzerland. This article is an open access article distributed under the terms and conditions of the Creative Commons Attribution (CC BY) license (https://creativecommons.org/licenses/by/4.0/).
Share and Cite
Kiray, D.; Cengiz, O. Petrography and Geochemistry of Hydrothermal Alteration in the Low-Sulfidation Epithermal Kestanelik Au Deposit, Biga Peninsula, NW Turkey. Minerals 2024, 14, 379. https://doi.org/10.3390/min14040379
Kiray D, Cengiz O. Petrography and Geochemistry of Hydrothermal Alteration in the Low-Sulfidation Epithermal Kestanelik Au Deposit, Biga Peninsula, NW Turkey. Minerals. 2024; 14(4):379. https://doi.org/10.3390/min14040379
Chicago/Turabian StyleKiray, Didem, and Oya Cengiz. 2024. "Petrography and Geochemistry of Hydrothermal Alteration in the Low-Sulfidation Epithermal Kestanelik Au Deposit, Biga Peninsula, NW Turkey" Minerals 14, no. 4: 379. https://doi.org/10.3390/min14040379