1. Introduction
Cancrinite-group minerals are trigonal and hexagonal tecto-aluminosilicates whose frameworks are built by the stacking of layers containing six-membered rings of (Si,Al)O
4 tetrahedra. Three kinds of layers are distinguished, with the six-membered rings situated around the [2/3 1/3
z], [1/3 2/3
z] and [0 0
z] axes (the layers
A,
B and
C, respectively) [
1,
2,
3,
4]. Ten types of the cancrinite-related frameworks with 2 to 36 layers per repeat unit have been included in the Database of Zeolite Structures [
5].
Tounkite was discovered at the Malo-Bystrinskoe and Tultuy gem lazurite deposits, both near Slyudyanka, Baikal Lake area, Eastern Siberia, Russia [
6]. Both deposits are considered as co-type localities of this mineral species.
Tounkite was initially described as a 12-layer cancrinite-group mineral with the ideal formula (Na,Ca,K)
8[Al
6Si
6O
24](SO
4)
2Cl·H
2O (
Z = 6), or (Na,K)
30Ca
18[Al
36Si
36O
144](SO
4)
12Cl
6·6H
2O (
Z = 1), and a 12-layer framework [
6]. The crystal structure of holotype tounkite has not been determined because of the strongly disordered and diffuse nature of the
hkl reflections with
l = 3
n. Later, a structural model of another 12-layer sample was obtained. The framework of this mineral is composed of layers of (Si,Al)O
4 tetrahedra forming the САСАСВСВСАСВ stacking sequence with ordered Si and Al atoms [
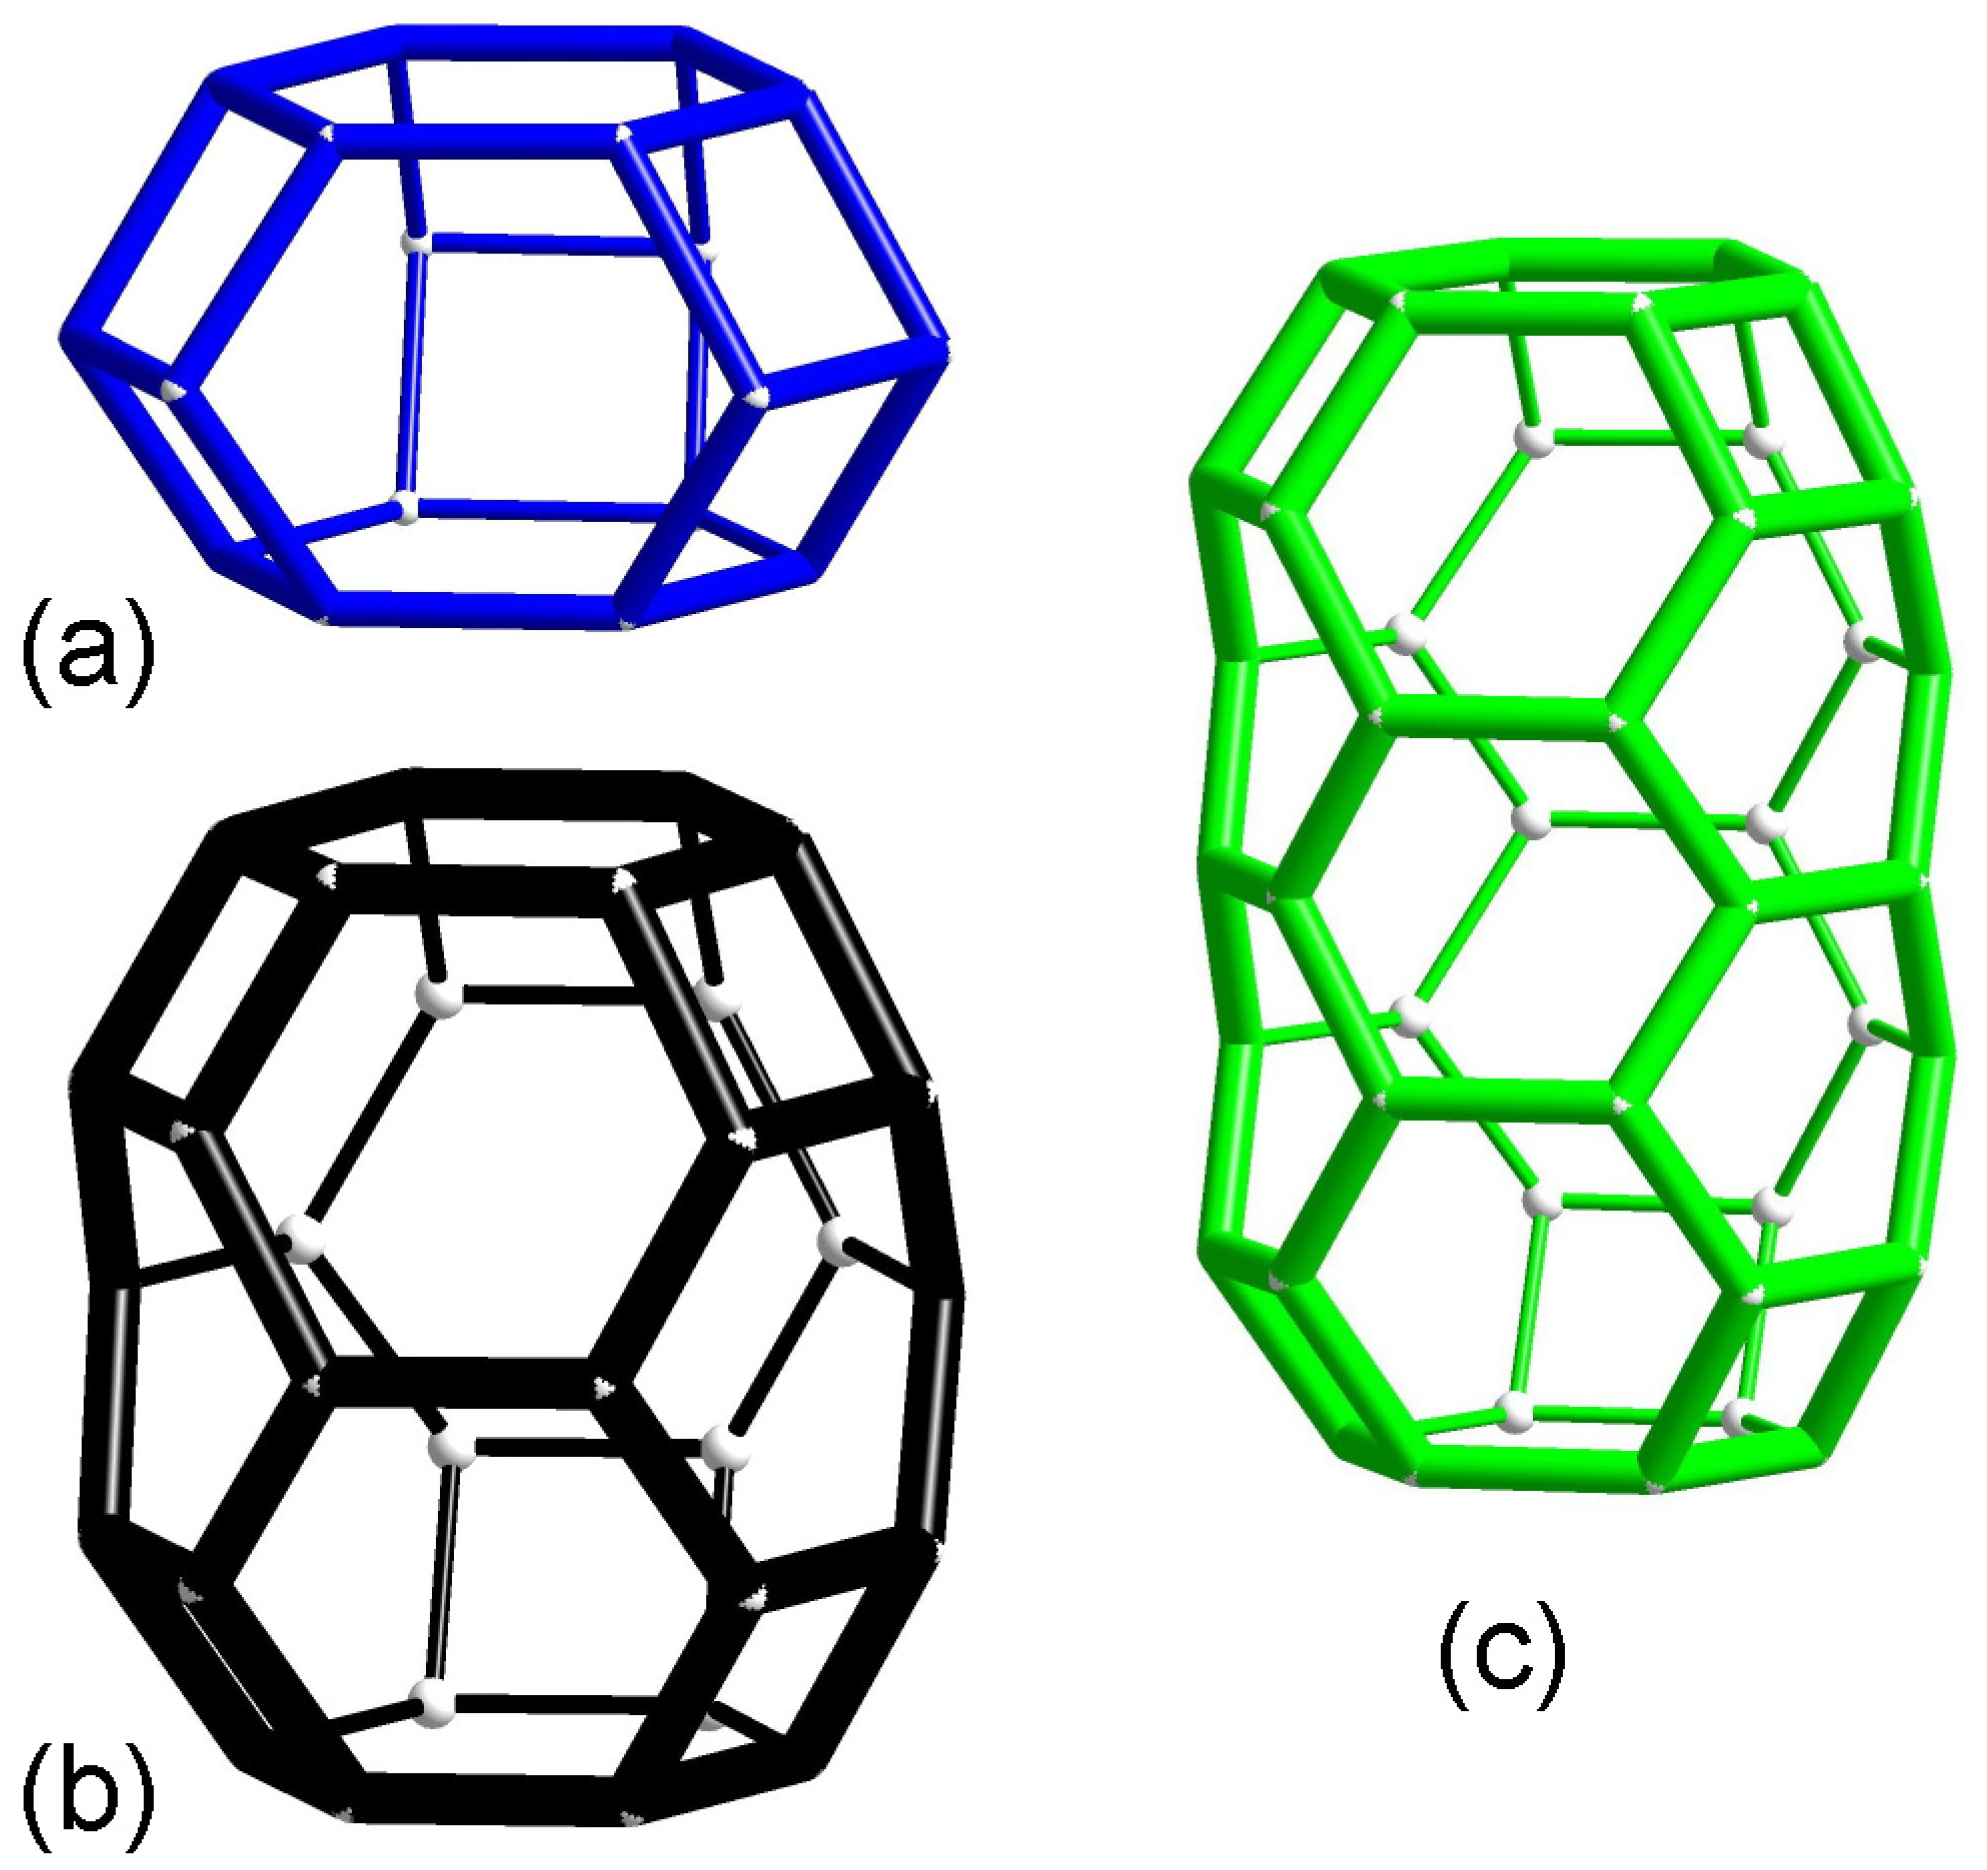
7]. This mineral was considered as a disordered tounkite variety. The topological type of the aluminosilicate framework of tounkite has been determined reliably. However, precise structure data, especially those related to extra-framework components, could not be obtained because the single-crystal X-ray diffraction pattern contained multiple weak reflections that did not correspond to the suggested model. The framework of tounkite hosts bystrite (Losod) and liottite cages, as well as columns of cancrinite cages (see
Figure 1).
Tounkite was mentioned among the twelve minerals with the most complex structures [
8]. Even the simplified structure model [
7] has a complexity factor of 2187.8 bits per atom.
In this work, three tounkite samples that are significantly different in chemical composition and physical properties have been studied by single-crystal X-ray diffraction, electron microprobe analysis, and a complex of spectroscopic methods. In particular, the mechanism of polysynthetic twinning and the structure of the sheet at the border between twin components have been determined. The occurrence of a new 10-layer cage in tounkite based on single-crystal structural data has been confirmed by IR spectroscopy. It is here shown for the first time that S52− and HS− anions and S4 molecules are significant components of tounkite, and there are wide variations in K+ contents in this mineral. Based on these data, a revised general crystal-chemical formula of tounkite is suggested. Color centers as well as the role of extra-framework components as markers of the conditions of mineral formation are discussed.
2. Materials
All three studied samples originate from common, “classic” lazurite-bearing metasomatic rocks, which mainly consist of diopside, calcite and Na-Ca feldspathoids.
Sample 1 is tounkite from the Tultuy gem lazurite deposit described earlier with the empirical formula (Na
5.18Ca
2.58K
0.15)
∑7.91[Al
5.99Si
6.01O
24](SO
4)
1.79Cl
1.33, space group
P3 and unit cell parameters
a = 12.757 Å and
c = 32.211 Å [
7]. It forms light blue elongate individuals (crude crystals) up to 1 cm long in association with calcite, diopside, afghanite and vladimirivanovite. In the present work, the crystal structure of sample 1 has been re-examined in the space group
P321.
Sample 2 also originates from the Tultuy deposit. This tounkite forms pale blue equant grains up to 3 mm across that are intimately associated with vladimirivanovite, diopside and calcite.
Sample 3 was collected at the Malo-Bystrinskoe deposit. It is a part of the type specimen of tounkite provided in 1980s by V.G. Ivanov, who was the senior author of its first description [
6] to the Fersman Mineralogical Museum of the Russian Academy of Sciences, Moscow. This tounkite sample occurs as a bottle-green granular aggregate replacing lazurite in a diopside-lazurite rock.
3. Methods
The IR spectra in the middle range were measured in the Federal Research Center of Problems of Chemical Physics and Medicinal Chemistry, Russian Academy of Sciences, Chernogolovka, Russia. In order to obtain IR absorption spectra, powdered samples were mixed with anhydrous KBr (in a KBr to mineral ratio of about 150:1), pelletized and analyzed using an ALPHA FTIR spectrometer (Bruker Optics, Ettlingen, Germany) with a resolution of 4 cm−1. A total of 16 scans were collected for each spectrum. The IR spectrum of an analogous pellet of pure KBr was used as a reference.
The Raman spectra were obtained for randomly oriented grains using an EnSpectr R532 spectrometer based on an OLYMPUS CX 41 microscope (Enhanced Spectrometry, San Jose, CA, USA) coupled with a diode laser (λ = 532 nm) at room temperature (Moscow State University, Faculty of Geology, Department of Mineralogy). The spectra were recorded in the range of 100 to 4000 cm−1 with a diffraction grating (1800 gr mm−1) and spectral resolution of about 6 cm−1. The output power of the laser beam was in the range of 5 to 13 mW. The diameter of the focal spot on the sample was 5–10 μm. The backscattered Raman signal was collected with a 40× objective; the signal acquisition time for a single scan of the spectral range was 1 s, and the signal was averaged over 50 scans. Crystalline silicon was used as a standard.
The chemical composition of tounkite was studied at the Laboratory of Analytical Techniques of High Spatial Resolution, Faculty of Geology, Moscow State University using a Jeol JSM-6480LV scanning electron microscope (Jeol, Tokyo, Japan) equipped with an energy-dispersive spectrometer X-Max 50 (Jeol, Tokyo, Japan). The analysis conditions were as follows: an acceleration voltage of 20 kV, a beam current of 0.7 nA, and a 5 μm beam diameter. The following standards were used: Na, Cl—NaCl; K—potassic feldspar (NMNH 143966); Ca, Al—anorthite (NMNH 137041); Si—diopside; S—FeS2; O—plagioclase (NMNH 115900). The correctness of the quantitative determination of oxygen was controlled using quartz, as a so-called inner standard, mounted in a polished epoxy resin sample together with tounkite.
Single-crystal XRD studies were carried out for all three samples. Data collection for Sample 1 was carried out approximately 20 years ago in Toledo, OH, USA with a Bruker SMART Platform diffractometer (Bruker, Ettlingen, Germany) equipped with a 2K CCD detector. New XRD data for samples 2 and 3 were collected at the Faculty of Geology, Moscow State University using an Xcalibur CCD diffractometer (OXFORD DIFFRACTION, Oxford, UK), and data reduction was performed using CrysAlisPro program system [
9]. Single-crystal structure analysis was performed using SHELX (version 2008/2) [
10] and Jana (version JANA2006) [
11] program complexes.
The UV–Vis–near-IR absorption spectra were measured in the Vinogradov Institute of Geochemistry, Irkutsk, Russia at room temperature in a transmission regime using a Lambda 950 spectrophotometer (Perkin-Elmer, Shelton, CT, USA). The thickness of samples varied from 0.1 to 1.5 mm.
The photoluminescence spectra were measured in the Vinogradov Institute of Geochemistry, Irkutsk, Russia using a spectrometer based on an SDL-1 monochromator with a 600-lines-per-mm threaded diffraction grating (LOMO, St. Petersburg, Russia). The spectral slit width was 0.4 nm. Registration was carried out using a Hamamatsu H10721-04 photomodule (Hamamatsu, Sendai, Japan). Excitation was performed using a Xe-lamp of the same manufacturer with a power of 250 W. The wavelength of exciting radiation was 381 nm. The sample was fixed on the cryofinger of a filling nitrogen cryostat, which was placed in a vacuum chamber and evacuated to 10−4 Pa. Photoluminescence and excitation spectra were measured at 77 K.
The electron spin resonance (ESR) spectra were measured in the Vinogradov Institute of Geochemistry, Irkutsk, Russia with an RE-1306 X-band spectrometer (KBST, Smolensk, Russia) with a frequency of 9.3841 GHz at room temperature. For low-temperature measurements, the sample was placed in a flooded quartz cryostat.
4. Results
4.1. Infrared Spectroscopy
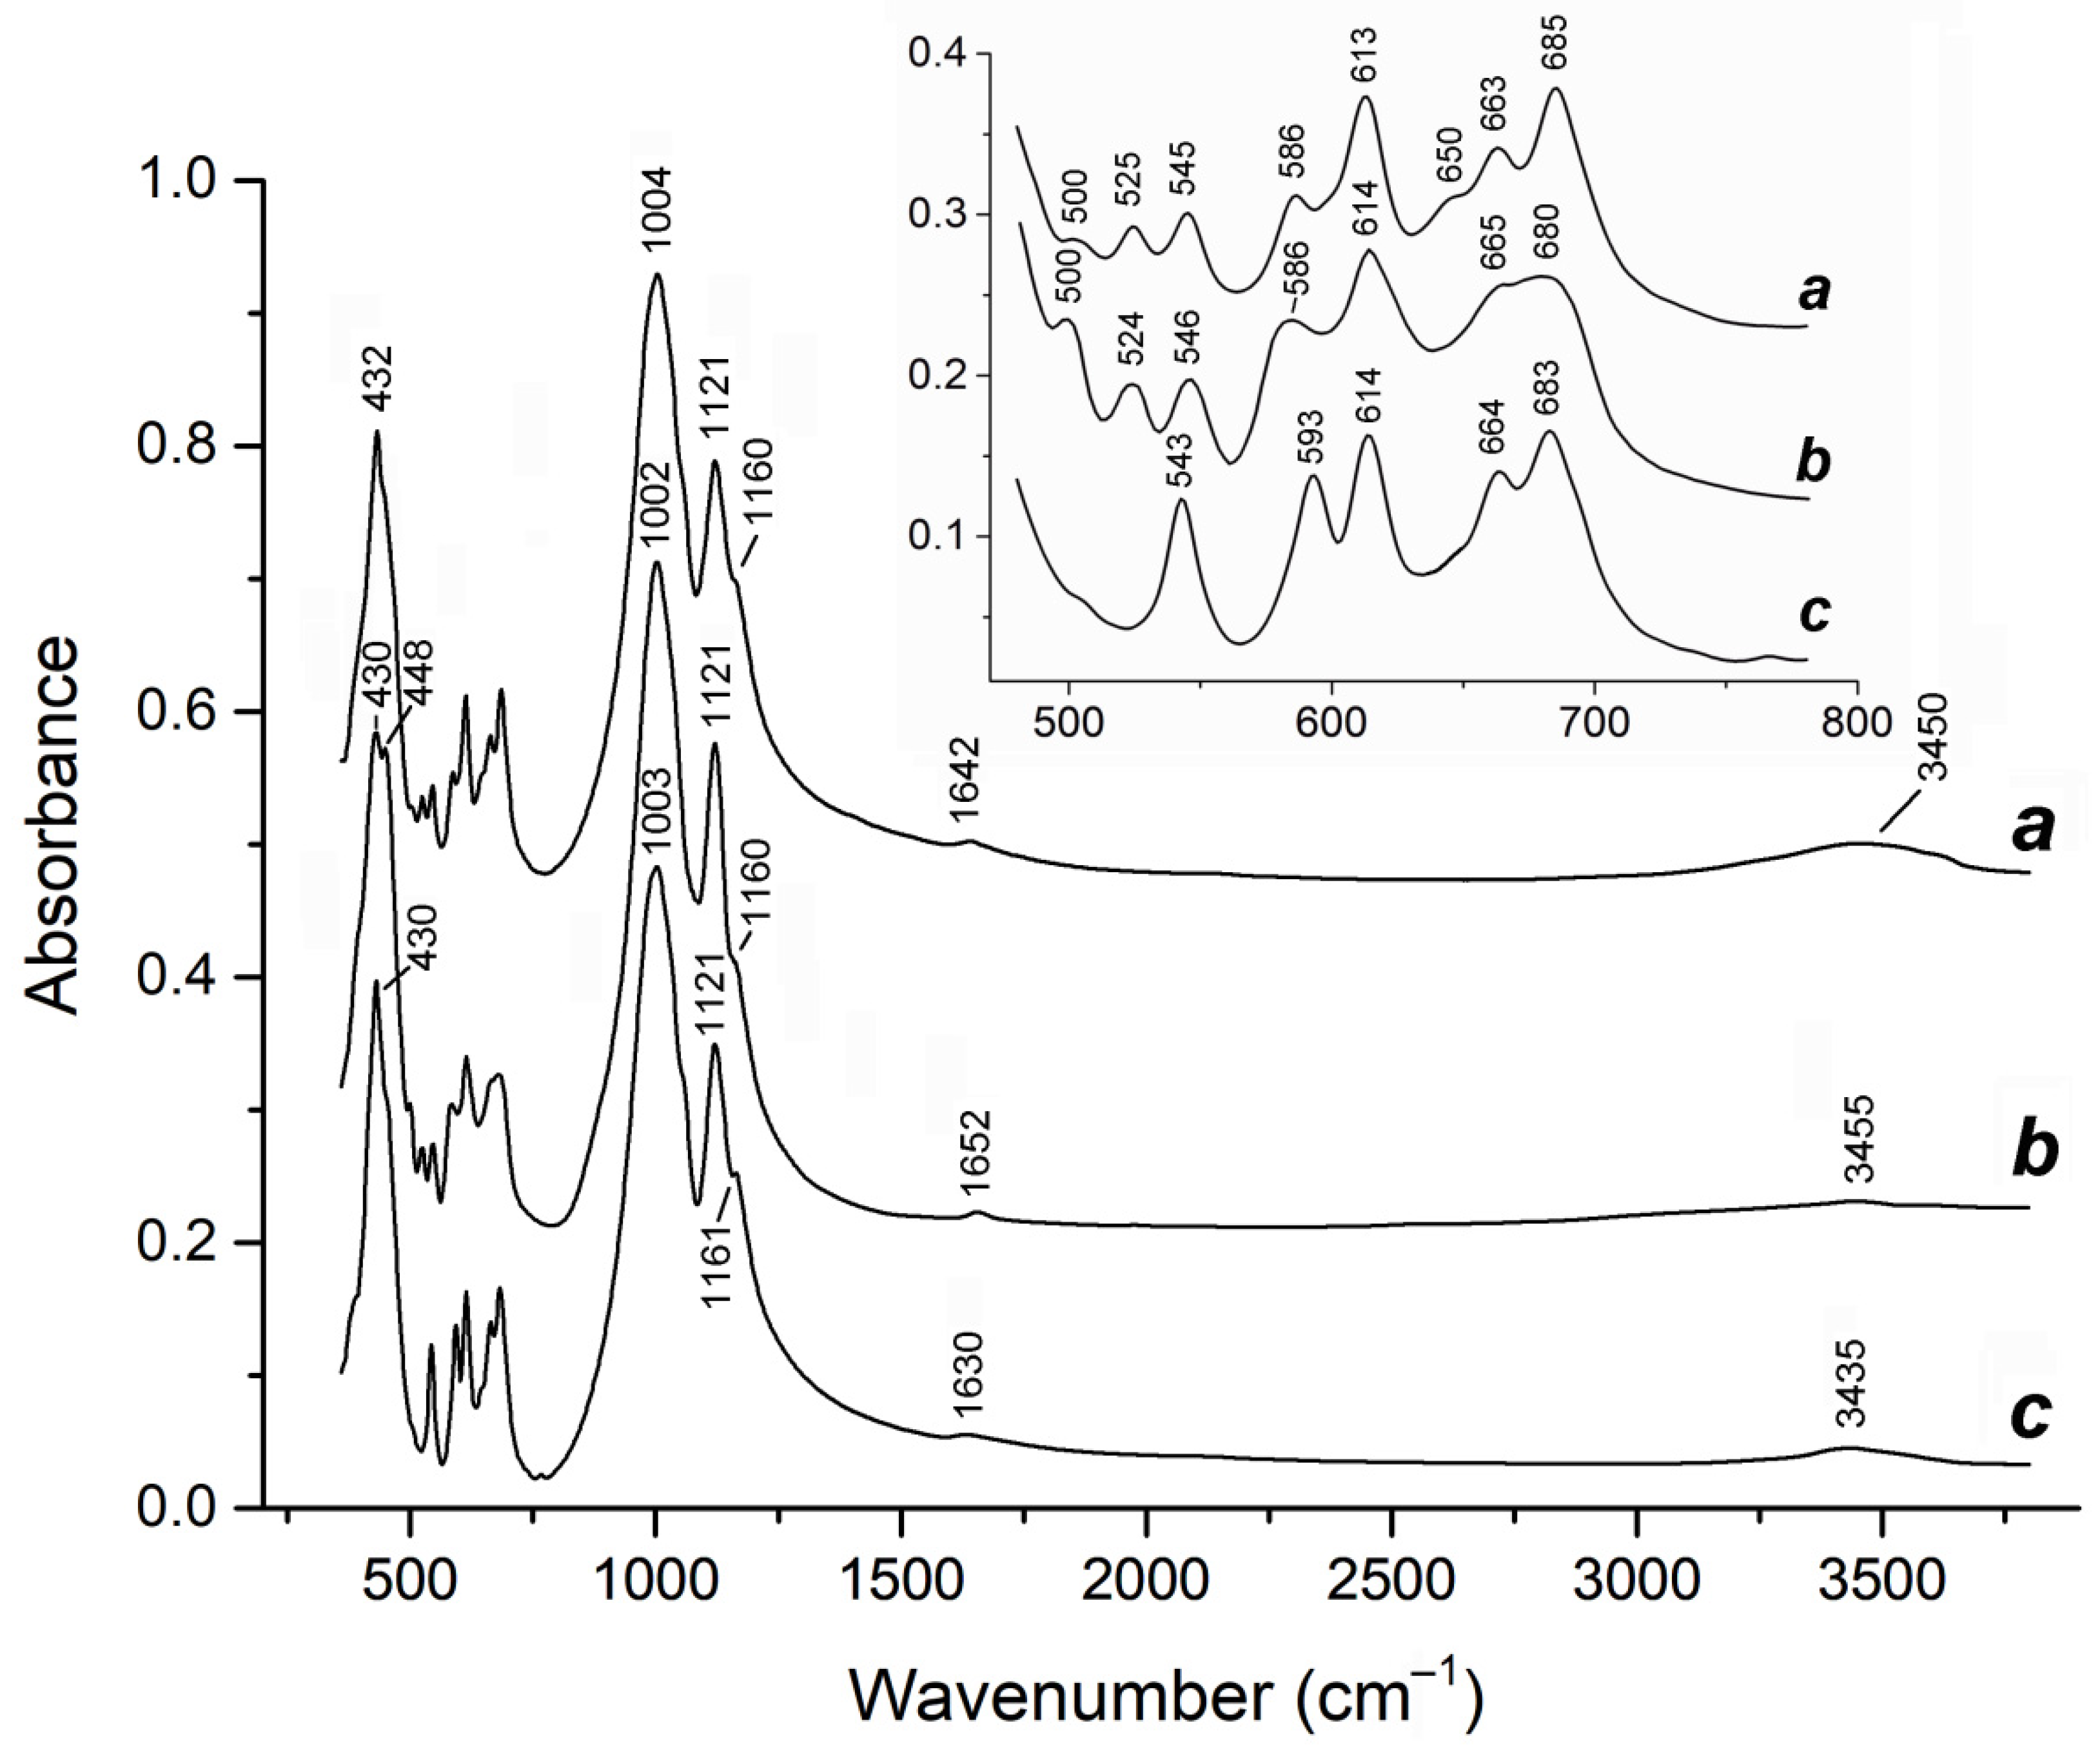
The IR spectra of tounkite are close to those of afghanite, a cancrinite-group mineral whose framework hosts liottite cages and columns of cancrinite cages [
1,
12] (
Figure 2). In the spectra of both minerals, the bands at 1002–1004 and 430–432 cm
−1 correspond to collective T–O stretching and T–O–T bending vibrations, respectively, where T = Si,Al. The bands at 1121 and 1160–1161 cm
−1 are due to asymmetric stretching vibrations of distorted extra-framework SO
42− anionic groups, related to the F
2(ν
3) mode of undistorted SO
4 tetrahedron. The band at 613–614 cm
−1 corresponds to bending vibrations of the SO
42− groups, related to the F
2(ν
4) mode of the undistorted SO
4 tetrahedron.
Other bands in the so-called finger-print region (480–780 cm
−1) are related to collective O–T–O bending vibrations. According to the assignment made in [
13] based on the analysis of IR spectra of all known cancrinite-group minerals (28 mineral species in total), one can conclude that the IR spectra of both tounkite and afghanite contain bands corresponding to liottite cages (at 543–546 cm
−1) and columns of cancrinite cages (at 586–593, 663–665 and 680–683 cm
−1), whereas bands corresponding to sodalite and giuseppettite cages are not observed, in accordance with available data on the crystal structures of these minerals [
1,
7].
The characteristic band of Losod cages (at 534–525 cm−1) is also observed in the IR spectra of tounkite, but this band is absent in the IR spectra of afghanite, which is also in agreement with the structural data. The assignment of the weak bands at 500 and 650 cm−1 is ambiguous. This problem is discussed below in reference to new structural data.
The band at 448 cm
−1 in the IR spectrum of Sample 3 may correspond to stretching vibrations of S
52−, which is a thermodynamically favored polysulfide anion [
14]. For example, in the IR spectrum of sulfhydrylbystrite, K
2Na
5Ca(Al
6Si
6O
24)S
52−(HS)
−, the band of S
52− is observed at 454 cm
−1 [
15]. The wavenumbers of fundamental S–S stretching vibrations, predicted for S
52− coordinaterd by Li
+ based on high-level ab initio calculations, are 471, 463, and 416 cm
−1 [
14]. The presence of S
52− in Sample 3 is confirmed by Raman and UV–Vis–near-IR absorption spectra (see below).
Weak absorptions in the ranges of 3435–3455 and 1630–1652 cm−1 are due to the stretching and bending vibrations of admixed extra-framework H2O molecules, respectively.
4.2. Raman Spectroscopy
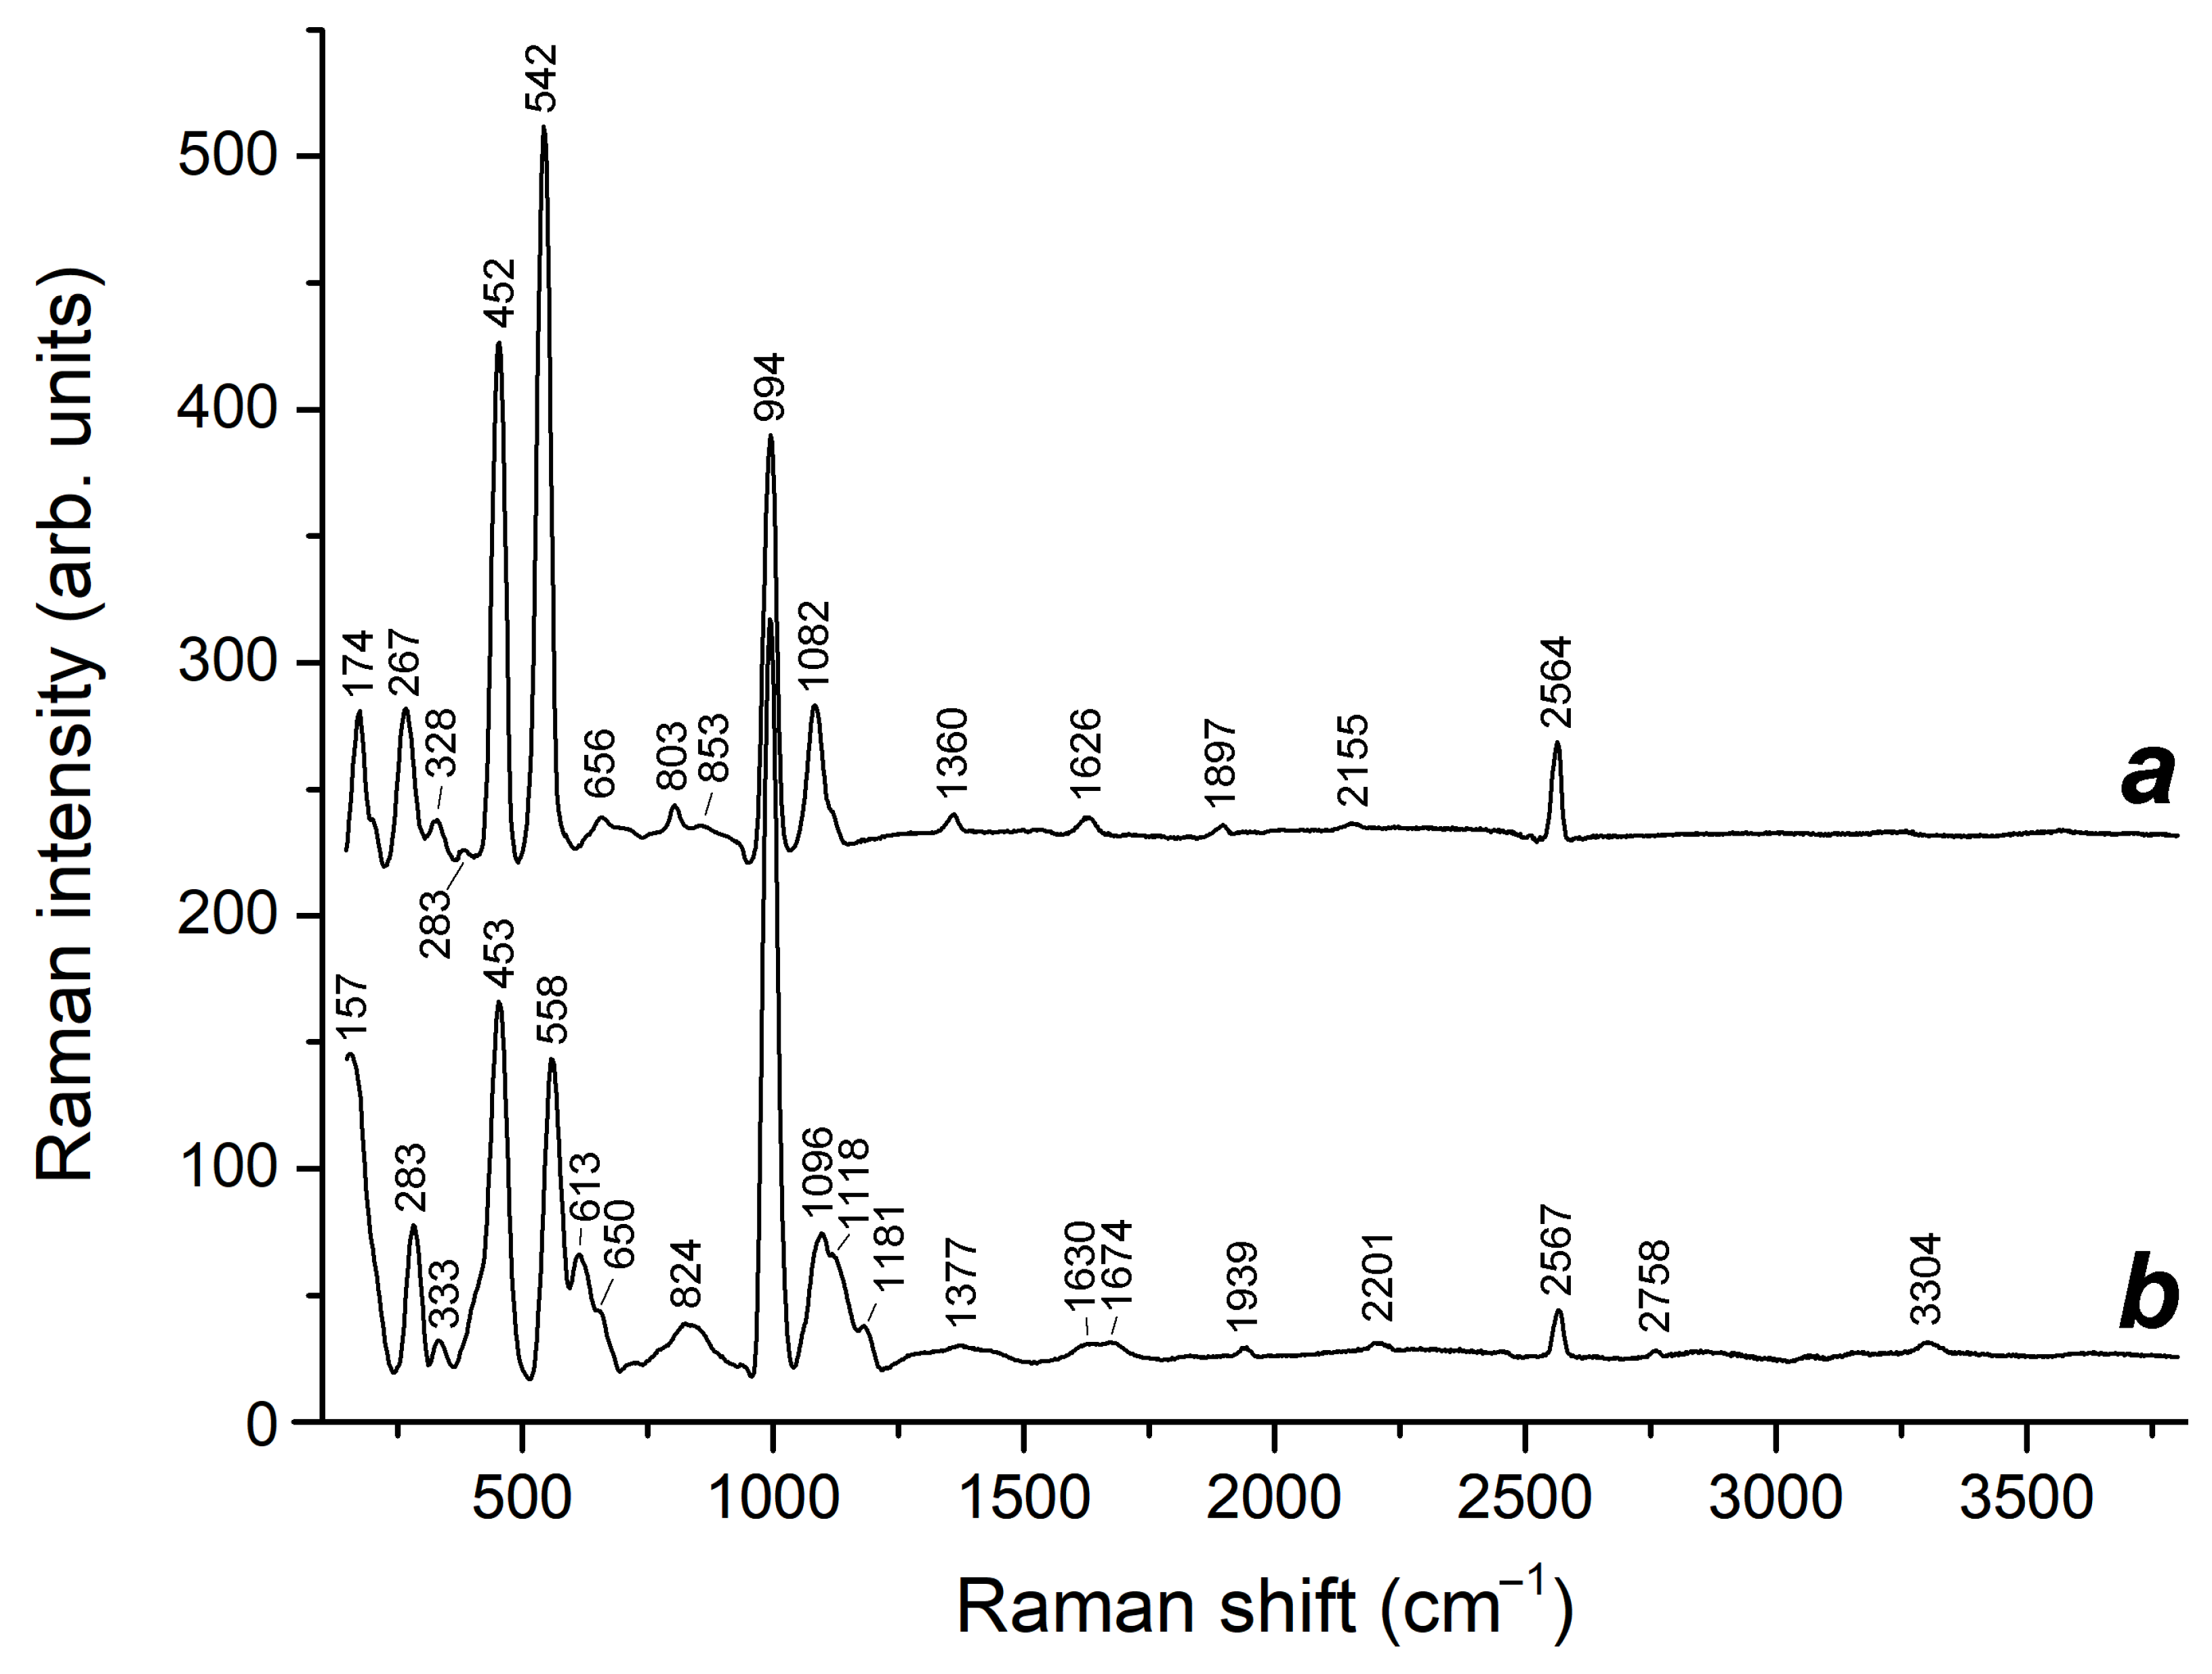
Unlike IR spectroscopy, the Raman spectroscopy of feldsphatoids is very sensitive to different kinds of polysulfide groups, but is much less sensitive to framework modes. The Raman spectra of the tounkite Samples 2 and 3 are given in
Figure 3. The assignment of bands in the Raman spectra (
Table 1) was performed in accordance with [
14,
15,
16,
17,
18,
19,
20,
21,
22,
23,
24,
25,
26,
27] and references therein.
Despite bands of the S
3⦁− radical anion being distinct in both spectra, their relative intensities correspond to very low (trace) contents of this species. On the other hand, contents of some other polysulfide groups are significant in both samples (mainly S
2⦁−, as well as S
4⦁− and/or S
4, in Sample 2, and mainly S
52− in Sample 3). In this reference, it is worth noting that a distinct band of S
52− (at 448 cm
−1) was observed only in the IR spectrum of Sample 3, whereas in the IR spectrum of Sample 2, only an indistinct shoulder is present in this region (
Figure 2).
In the Raman spectrum of Sample 2, all bands of S
3⦁− are shifted towards higher wavenumbers as compared to their common positions [
12]. In the Raman spectrum of Sample 3, analogous bands are observed at normal wavenumbers. This fact indicates that in Sample 2, the groups S
3⦁− are strained, which may be related to a smaller unit cell volume of Sample 2 in comparison with Sample 3.
Both samples contain HS− anions whose content in Sample 3 is higher than in Sample 2.
4.3. UV–Vis–Near-IR Absorption Spectroscopy
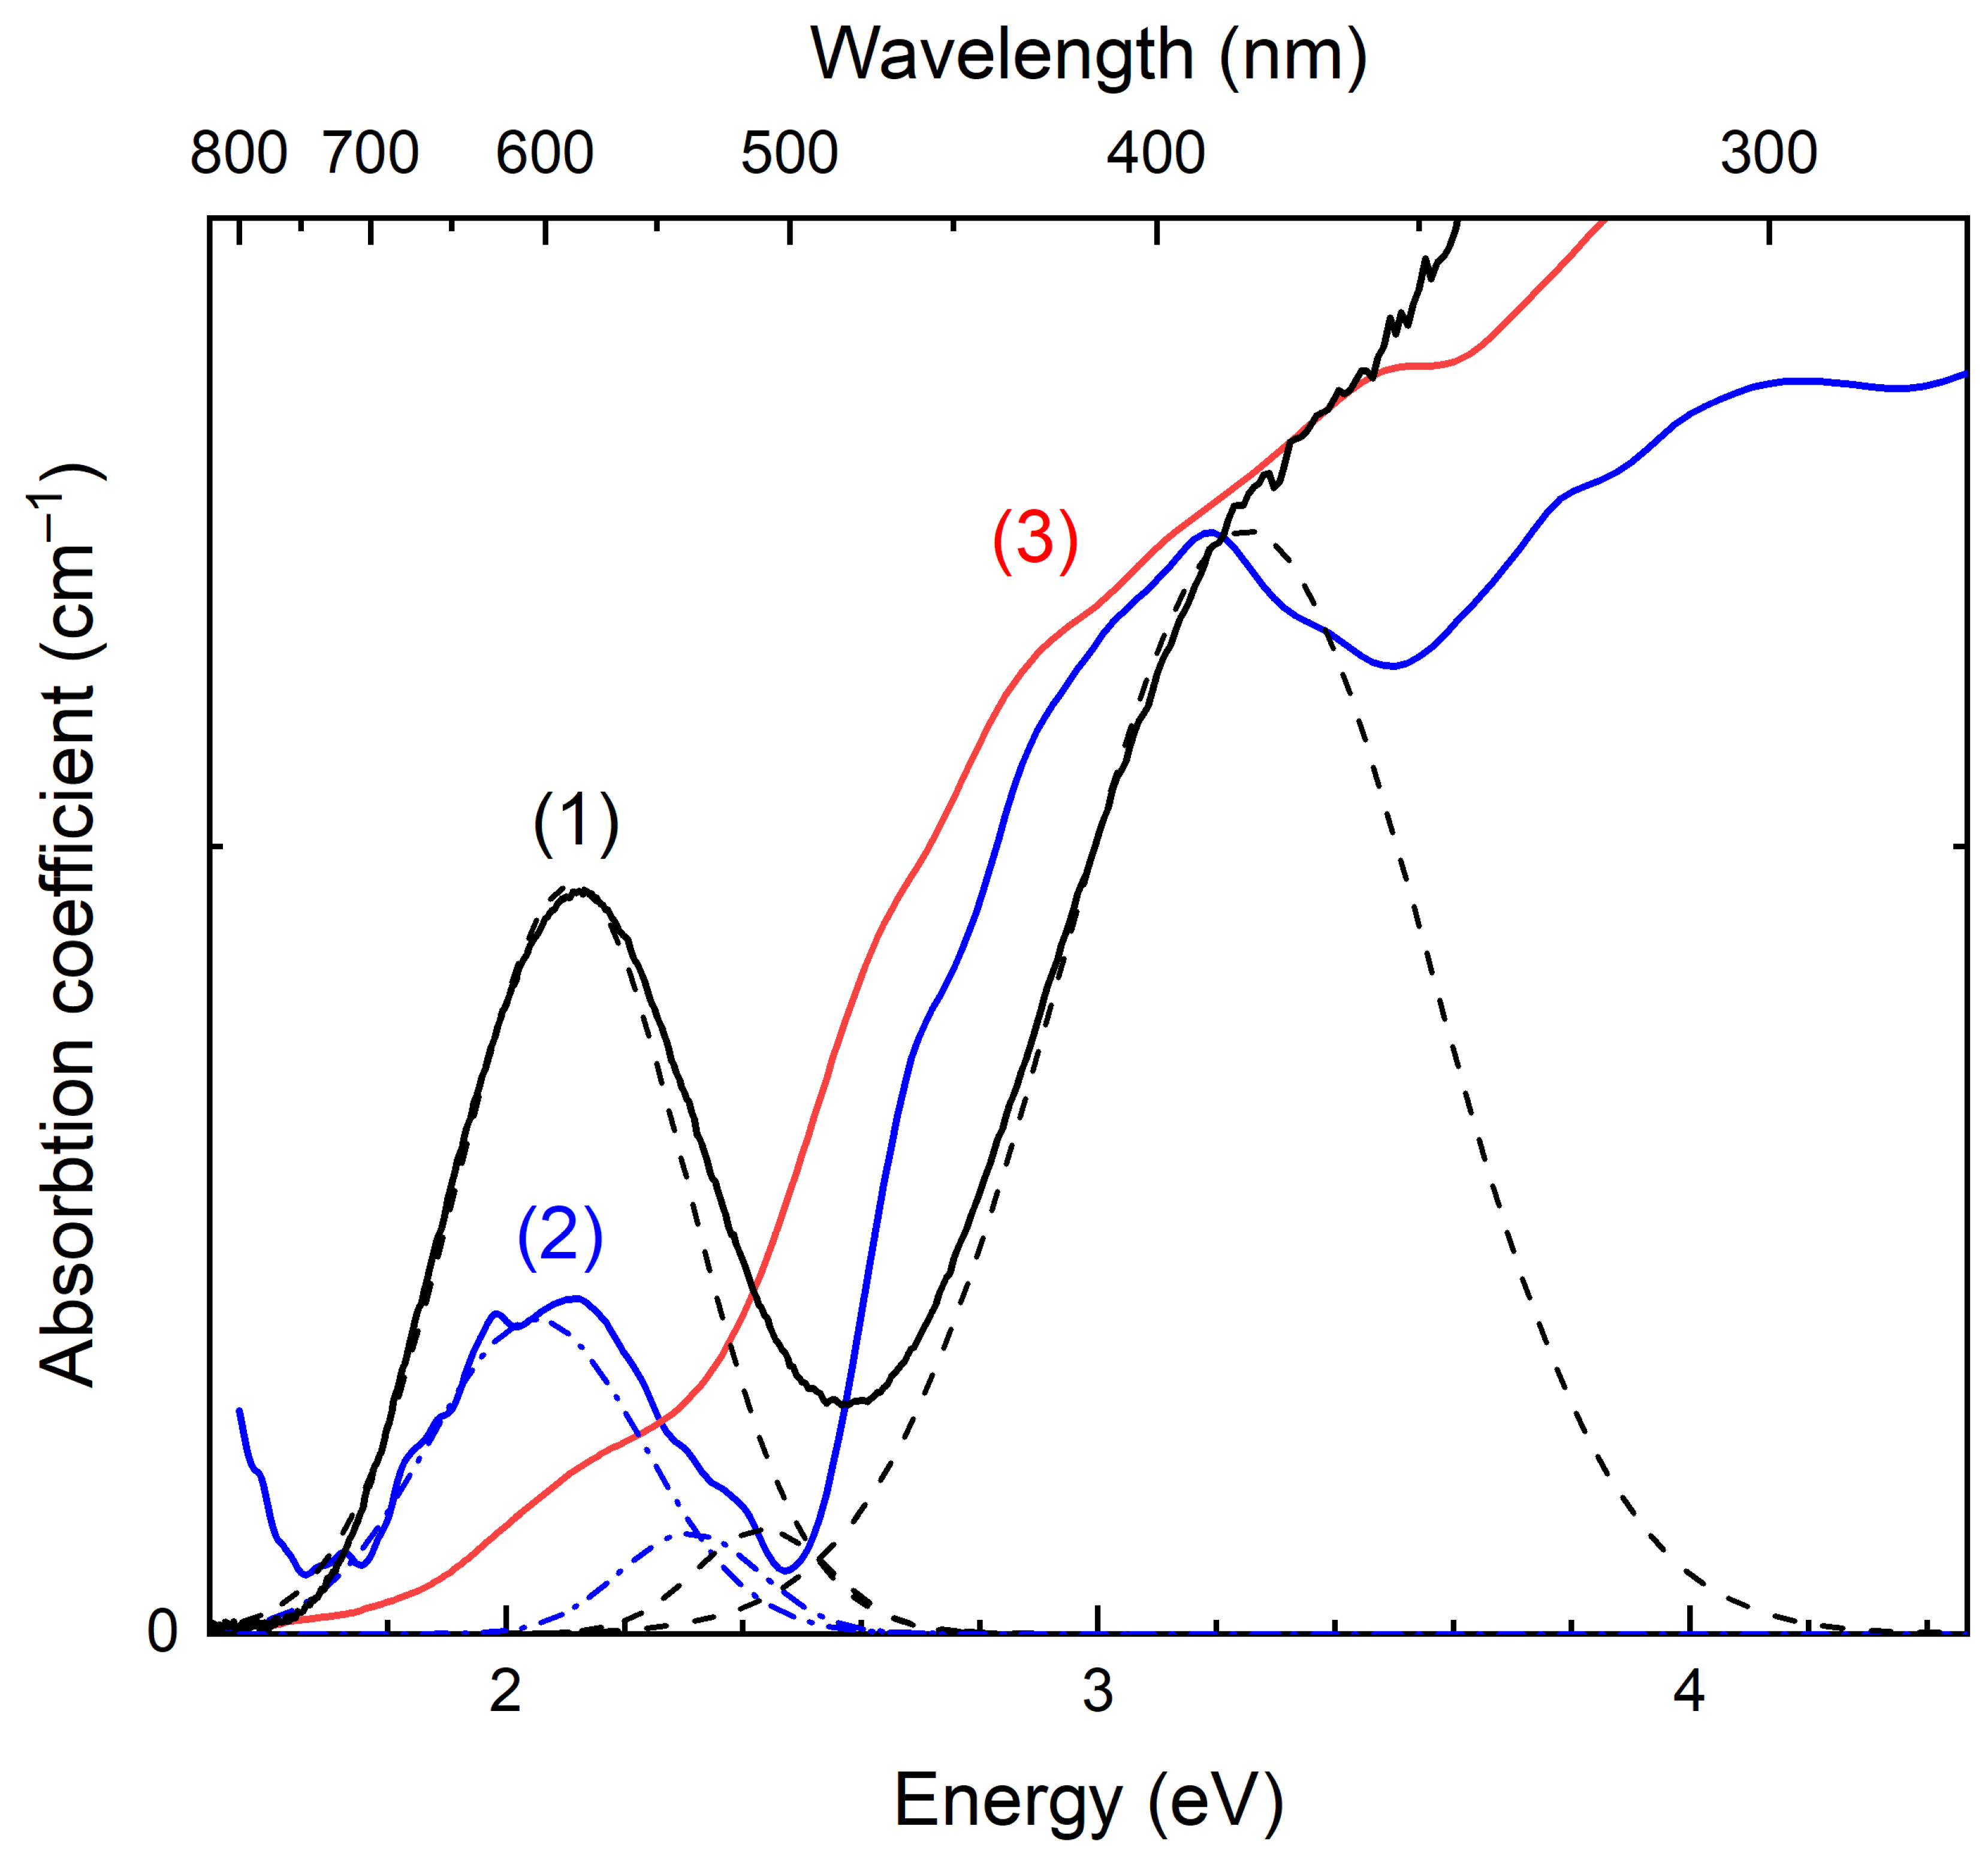
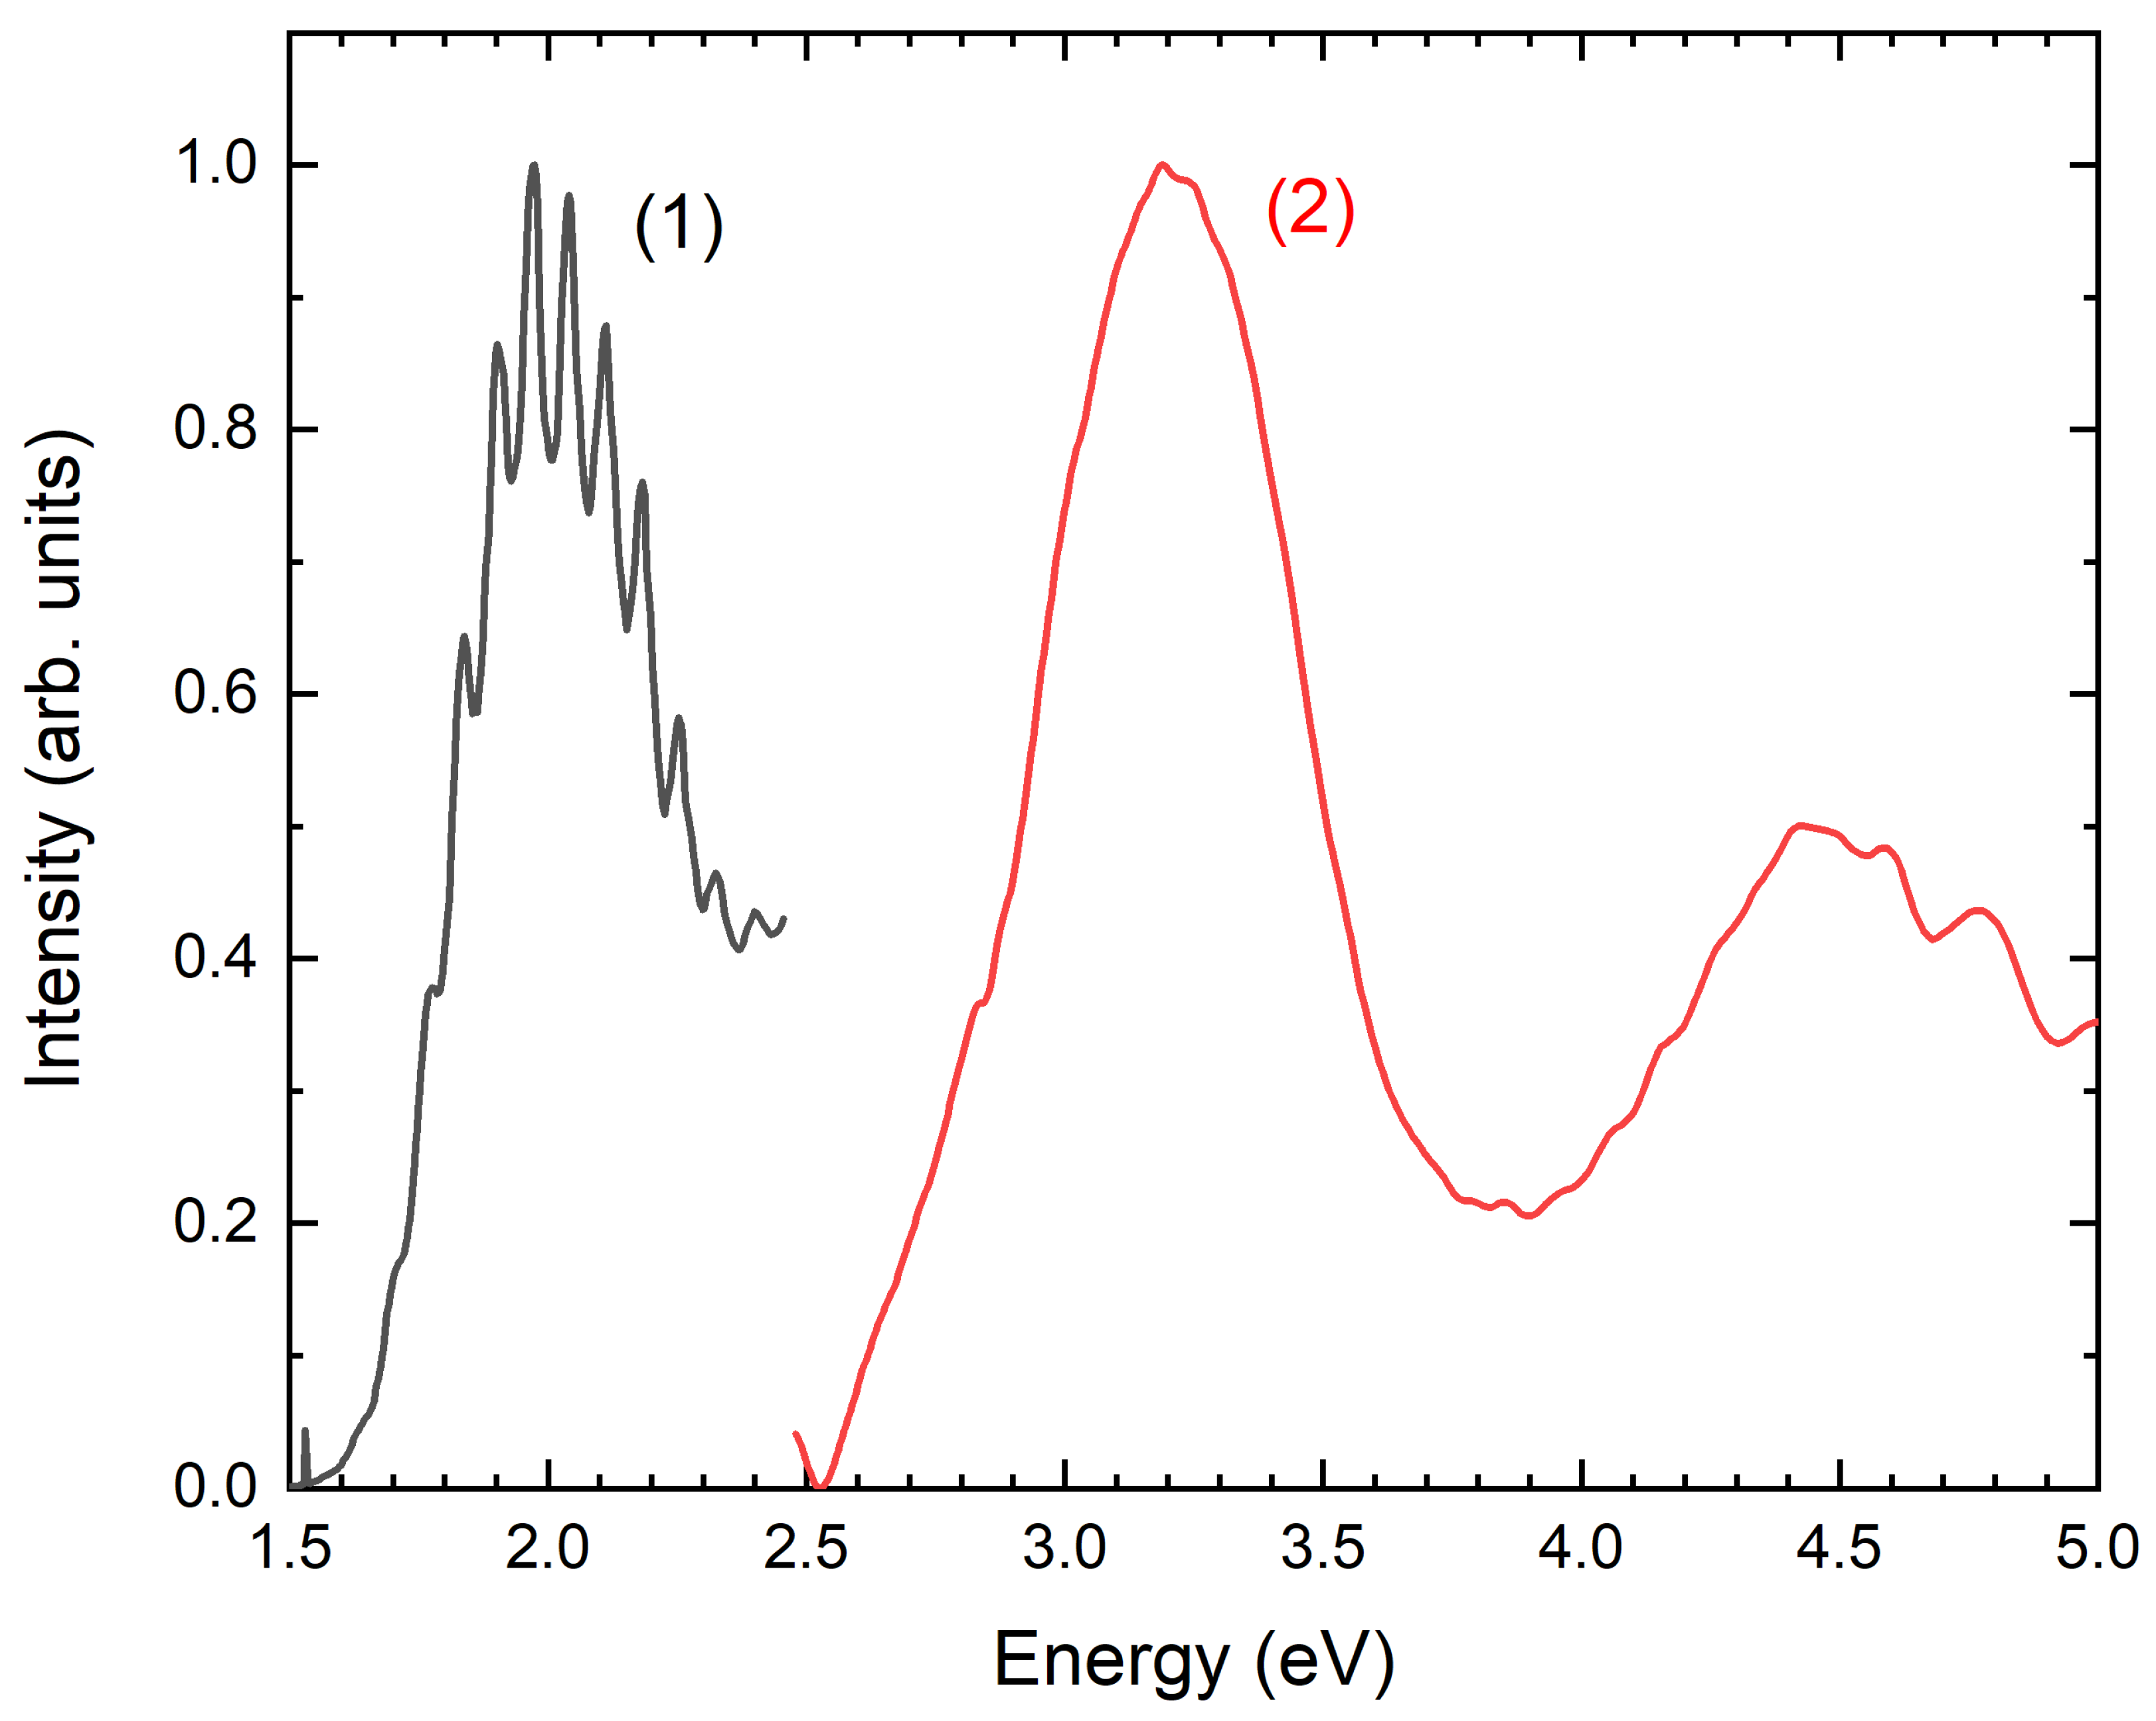
The UV–Vis–near-IR absorption spectrum of Sample 2 in the range of 1.5 to 4 eV (curve 1 in
Figure 4) is a superposition of three bands with the maxima at 2.11, 2.43 and 3.25 eV or 588, 510 and 381 nm, respectively. The absorption spectrum of Sample 3 contained in this range has two maxima observed at 2.05 eV (605 nm), 2.30 eV (539 nm) and 3.1 eV (400 nm), and several shoulders (inflection points).
Absorption bands at 2.11 and 2.05 eV in the Samples 2 and 3, respectively, are due to the presence of S
3⦁− radical anions. Earlier similar bands (at 2.09 eV) were observed in the absorption spectra of S
3⦁−-bearing samples of afghanite and the oxalate-bearing cancrinite-group mineral kyanoxalite [
12], 2.05 eV in the spectrum of haüyne [
12] and at 2.1 eV in the spectrum of balliranoite [
18].
The relative intensity of the band of S3⦁− in the spectrum of Sample 3, as compared to the spectrum of Sample 2, is rather low.
Weak bands at 2.43 eV for Sample 2 and 2.30 eV for Sample 3 may be related to the S
4 neutral molecules. Similar bands were observed in absorption spectra of S
4-bearing haüyne [
27] and balliranoite [
18]. It is to be noted that bands of S
4 are observed in the Raman spectra of both tounkite samples.
4.4. Photoluminescence and Luminescence Excitation Spectroscopy
As one can see from
Figure 4, thabsorption spectra of the Samples 2 and 3 in the range of 3–4 eV are different. The band at 3.25 eV in the absorption spectrum of Sample 2 has the same position as its luminescence excitation band (curve 2 in
Figure 5) and corresponds to the 2
Πg → 2
Πu transition in S
2⦁− radical anions, which were detected in this sample by means of Raman spectroscopy (see above). A weaker band observed in the luminescence excitation spectrum of Sample 2 at 4.45 eV (280 nm) is related to 2
Πg → 3
∑g transition in the S
2⦁− radical anions.
The photoluminescence spectrum of the S
2⦁− radical anions in Sample 2 (curve 1 in
Figure 5) has a distinct vibrational structure, with the strongest maximum at 1.97 eV (630 nm), and the distance between the components of the vibrational structure of 0.076 eV corresponds to the wavenumber of 613 cm
−1. This observation is in excellent agreement with the band of S
2⦁− observed in the Raman spectrum of Sample 2 at 613 cm
−1.
Sample 3 does not show luminescence from S
2⦁−. In the range of 2.8–4.5 eV, the absorption spectrum of Sample 3 is close to the spectra of bystrite, Na
7Ca(Al
6Si
6O
24)S
52−Cl
−, and sulfhydrylbystrite, Na
5K
2Ca(Al
6Si
6O
24)S
52−(HS)
−, in which strong absorption with numerous inflection points observed in this range may be related to S
52− anions occurring in these minerals in different conformation states [
15,
20,
28] (see curve 3 in
Figure 4).
4.5. ESR Spectroscopy
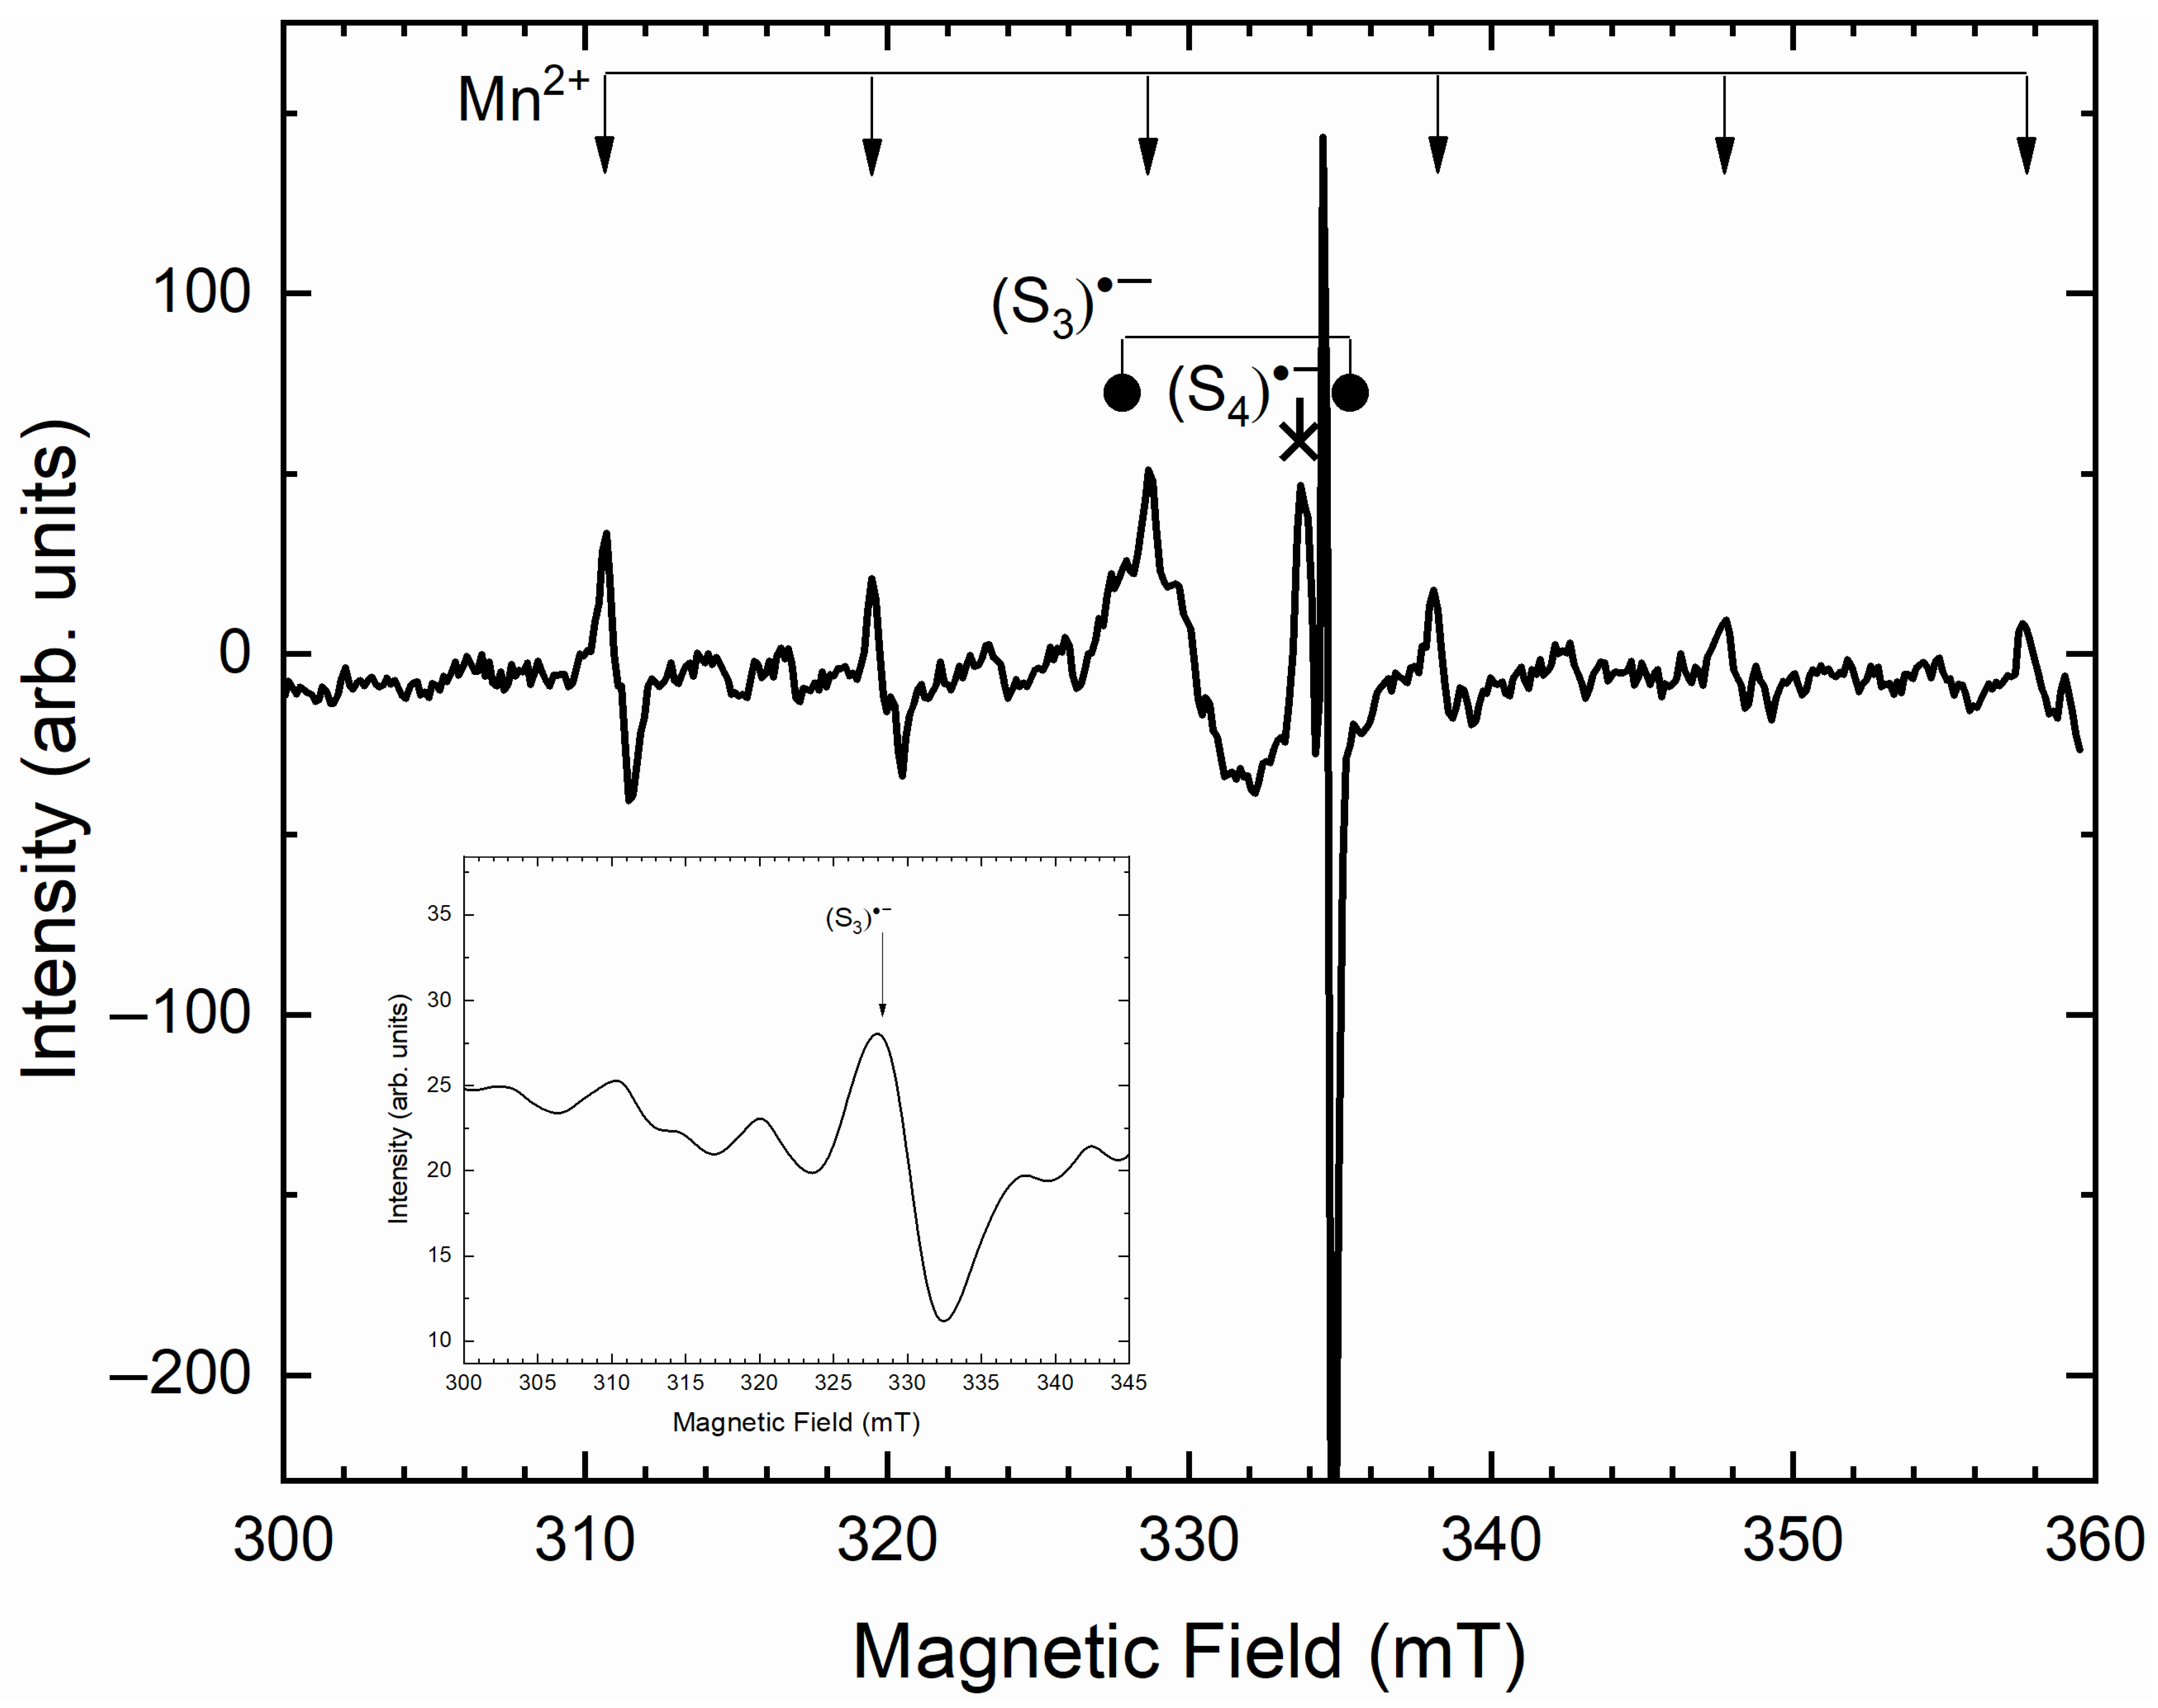
The ESR spectrum of Sample 2 (
Figure 6) contains a rather strong sextet with a
g-factor of 2.004, which is related to low-spin Mn
2+ cations. In addition, in this spectrum, weak lines with
g-factors of 2.003 and 2.043, as well as a line with
g = 2.007, are observed.
The ESR spectrum of Sample 3 is less intense. It contains a line with g = 2.043.
The intensity of the ESR line with
g1 = 2.041 and
g2 = 2.003 correlates with the intensities of absorption at 2.05 eV and bands of S
3⦁− radical anions in Raman spectra, as well as the deepness of the blue color of minerals belonging to the cancrinite and sodalite groups. In particular, similar signals were detected in ESR spectra of blue varieties of afghanite, kyanoxalite, haüyne and lazurite [
12]. Based on these facts, the signal with
g1 = 2.041 and
g2 = 2.003 is assigned to S
3⦁− radical anions.
The signal with
g = 2.007 observed in the ESR spectrum of Sample 2 may be related to the presence of
cis-S
4⦁− radical anions [
12,
19].
4.6. Chemical Composition
Chemical data for the Samples 2 and 3 are given in
Table 2. The contents of other elements with atomic numbers >8 are below detection limits. IR and Raman spectra (see below) show the absence of carbon-bearing groups. Water content was not measured due to the scarcity of pure material.
The empirical formulae were calculated on the basis of Si + Al = 12 atoms per formula unit (apfu). We avoided an anionic basis of formula calculation because o the presence of different forms of sulfur (both sulfate and polysulfide groups) and uncertainties with O distribution between sulfate anions and water molecules.
The atomic Al:Si ratio in both samples is close to 1:1, in accordance with the ordered alternation of these components in the framework of previously studied tounkite [
3]. However, Samples 2 and 3 significantly differ from one another in amounts of large cations, especially in the Na:K ratio. Sample 3 from the Malo-Bystrinskoe deposit is K-enriched with K:Na = 0.42 in atomic proportions, whereas Sample 2 from the Tultuy deposit is K-poor (with K:Na = 0.03), and slightly richer in Ca than Sample 3. The gross Cl:S ratio in Sample 2 (0.73 in atomic proportions) is higher than that in Sample 3 (0.49).
Sample 3 contains less oxygen than Sample 2. Based on this fact, one can suppose that Sample 3 is enriched in sulfide forms of sulfur as compared to Sample 2. This assumption is in agreement with relative intensities of bands of SO42− groups and sulfide species in the Raman spectra.
4.7. Crystal Structure
4.7.1. New Data on the Crystal Structure of Tounkite
All three samples studied in this work have similar structures with P321 symmetry. In the early work [
7], the structure of Sample 1 was solved in the space group P3 due to an unsuccessful choic of the origin of coordinates, which did not permit us to notice that the atoms are connected not only by a three-fold axis [001], but also by a rotation of 180° around a short diagonal of the rhombus [110] at the base of the hexagonal unit cell. In addition, it was established for the first time that all tounkite samples, including Sample 1, are twinned by rotating by 180° around the [001] axis. In Sample 1, the fraction of the second twin component is small (about 16%), but in the Samples 2 and 3, the fractions of twin domains are approximately equal in volume. In other words, Sample 1 is much less defective, which made it possible to refine the structure with a low R-factor excluding twinning, although only after rejecting a significant portion of the measured diffraction reflections [
7]. The a and c parameters of hexagonal unit cells and charge-balanced simplified crystal chemical formulae of the three studied tounkite samples are presented in
Table 3. The coefficients of monoatomic ions in the formulae given in
Table 3 correspond to the data from the chemical analysis. The amounts of the SO
42− groups were determined from the occupancies of sulfur positions refined in the structures. According to the Raman spectroscopy data, the predominant forms of sulfide forms of sulfur in Samples 2 and 3 are S
4 and S
52−, respectively. When calculating the simplified crystal chemical formulas, we neglected the contents of other forms of sulfide sulfur and slightly adjusted the amounts of SO
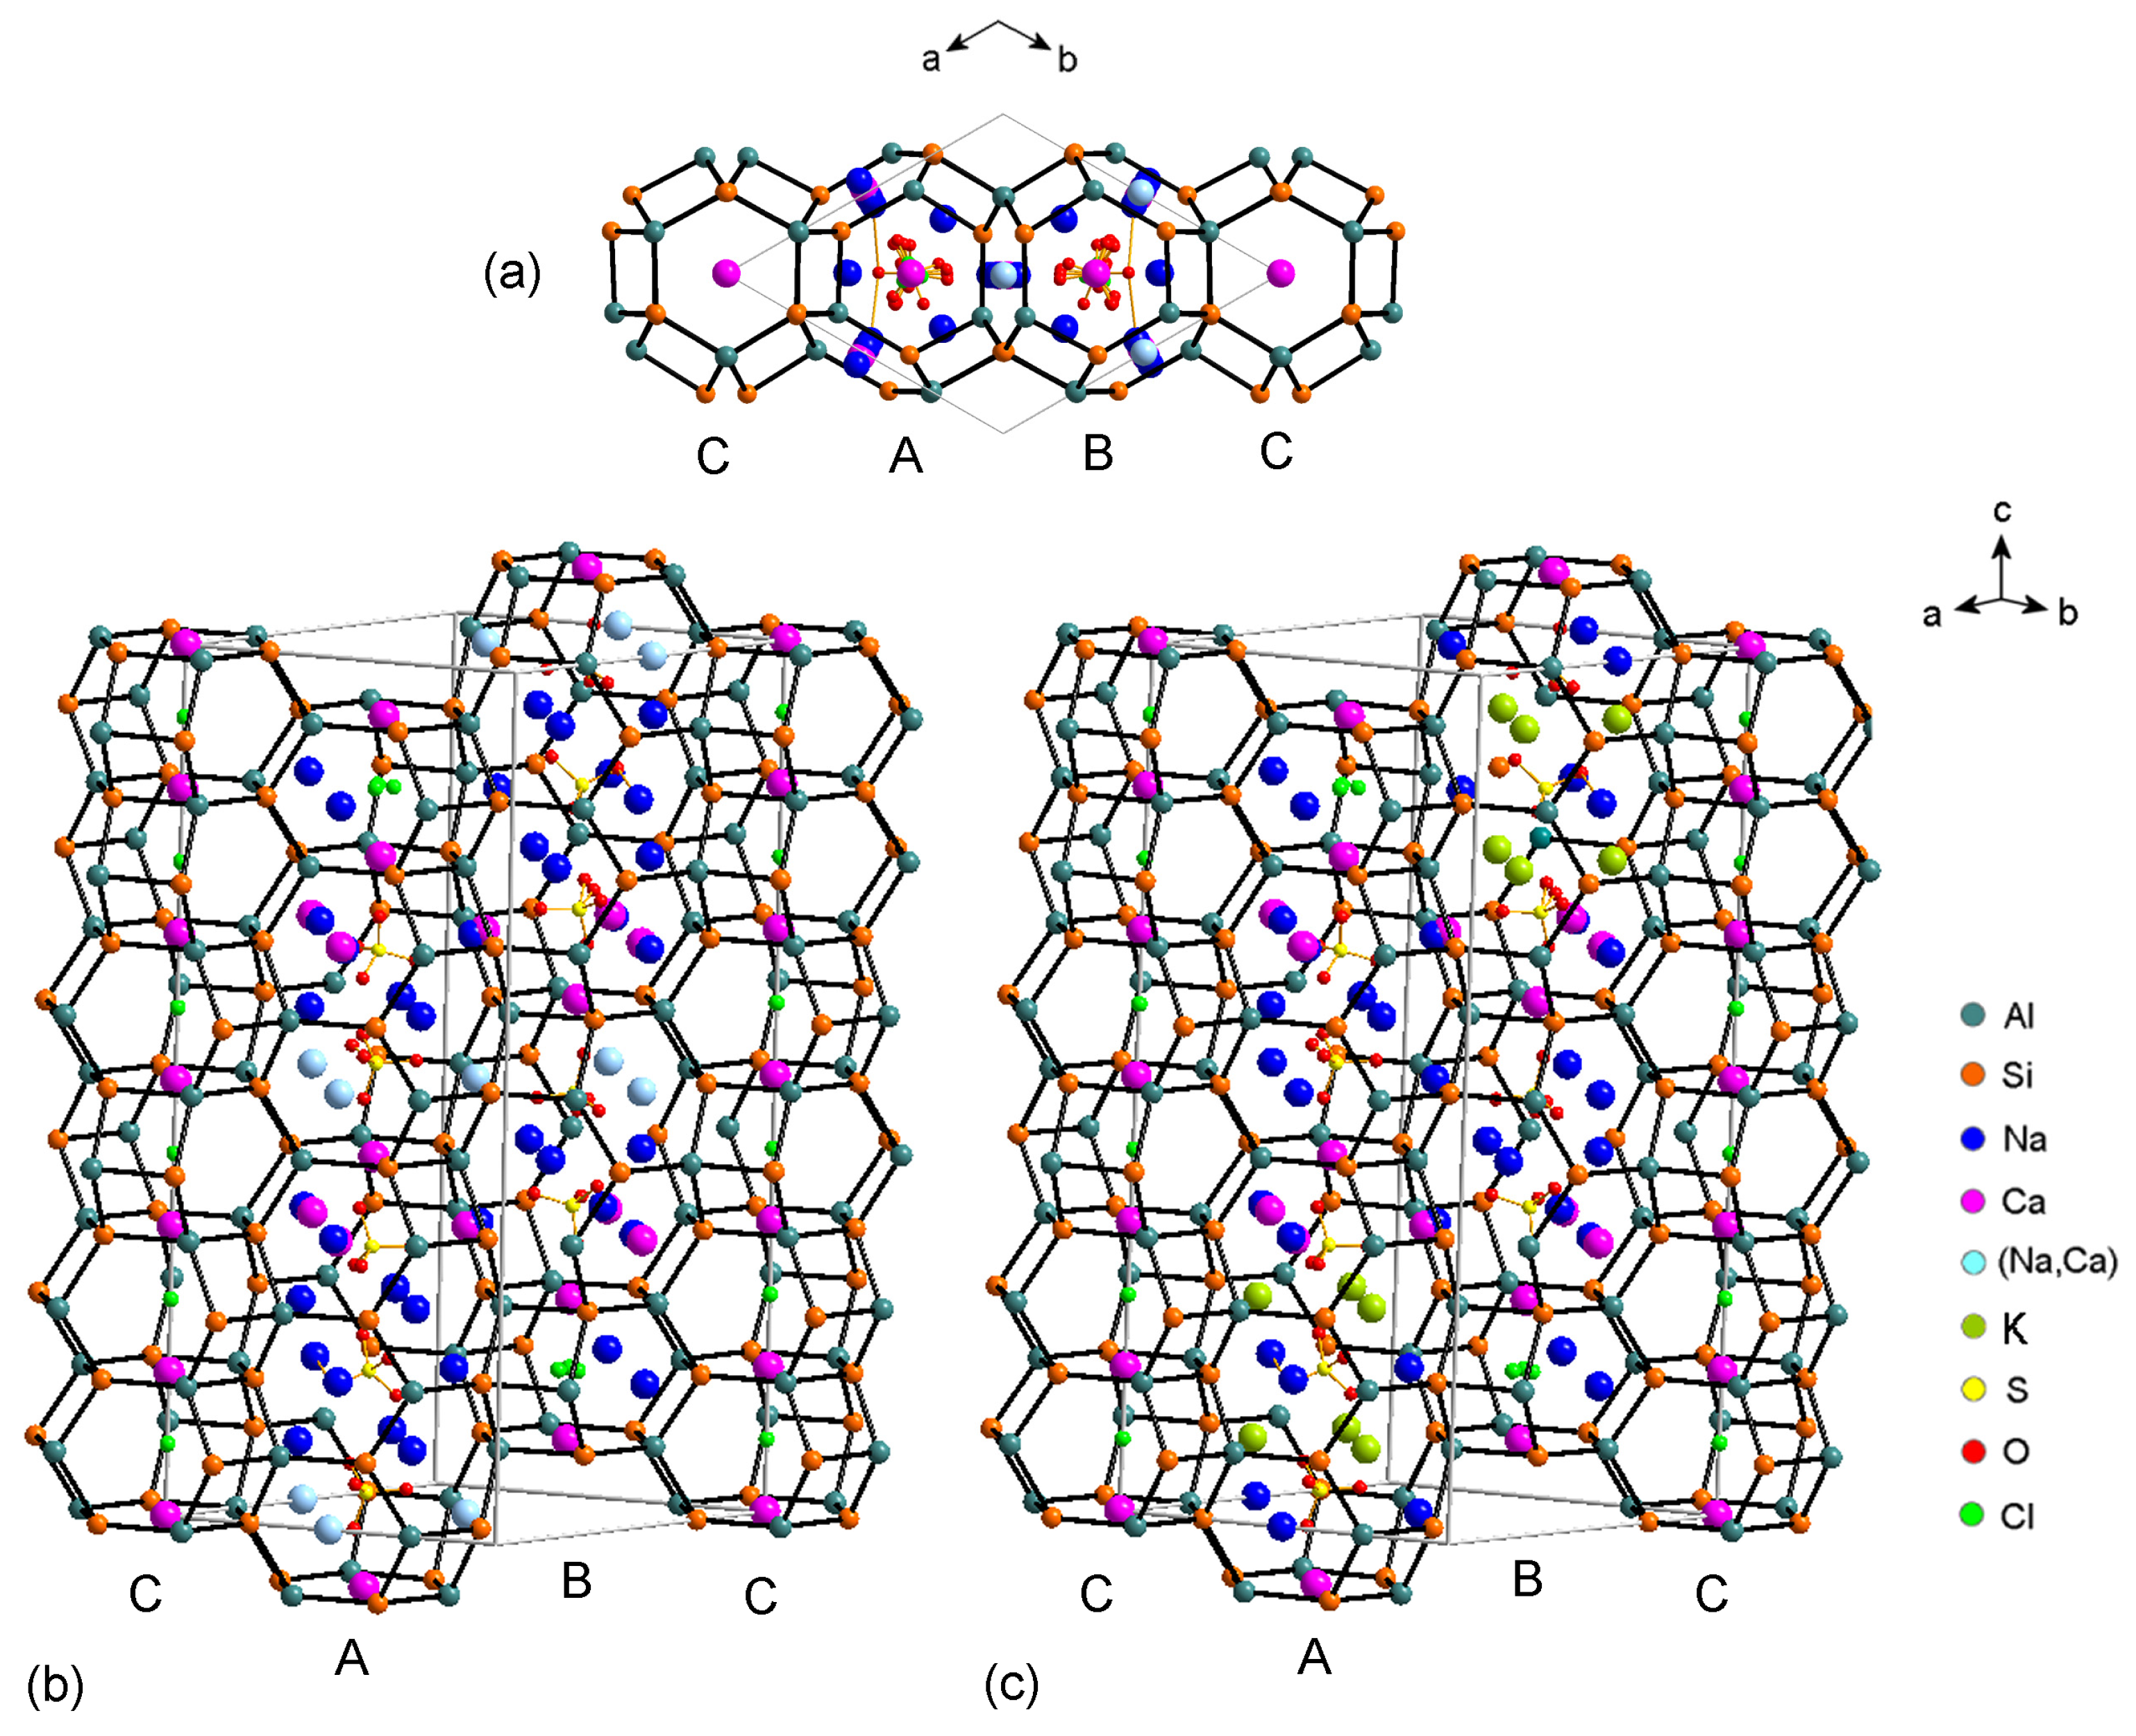
42− to achieve charge balance. The crystal structure is shown in
Figure 7.
The crystal structure of tounkite, like other minerals of the cancrinite group, is formed by a framework composed of AlO
4 and SiO
4 tetrahedra connected via common vertices and ordered so that each AlO
4 tetrahedron is connected exclusively with SiO
4 tetrahedra and vice versa. Six rings of tetrahedra are formed around the three-fold axes A = (2/3, 1/3,
z), B = (1/3, 2/3,
z) and C = (0, 0,
z), limiting the heights of the cages forming columns of the framework along the
c direction. Twelve layers of six-membered rings alternate along the
c-period of the tounkite unit cell in the sequence CBCBCACBCACA (
Figure 7b,c). The C columns consist entirely of two-layer cancrinite cages centered by Cl
− anions with a minor admixture of SH
−, according to Raman spectroscopy (see above). Moving along the three-fold axis of the A column (from bottom to top of
Figure 7b,c), one can observe the transition from a six-layer liottite cage to a bystrite (Losod) four-layer cage, and then to a cancrinite cage. The cages in the B column alternate in the reverse order. Each liottite cage may contain at most three tetrahedral SO
42− anionic groups, the bystrite cage contains two such groups, and the smallest cancrinite cage does not contain SO
42− and is occupied by Cl
− (+ minor SH
−) and Na
+.
Attention should be paid to the difference between Samples 2 and 3 in the cationic composition. Sample 3 is enriched in K+ cations whose positions occur in the middle part of the liottite cage, occupied in Sample 2 by Na+ cations. The K+ sites in Sample 3 are not completely occupied (with the occupancy of 80% each), and nor are the positions of the SO42− anionic groups. In all respects, the liottite cage is most suitable for the occurrence of large polysulfide groups S4 and S52−, characteristic of Samples 2 and 3, respectively.
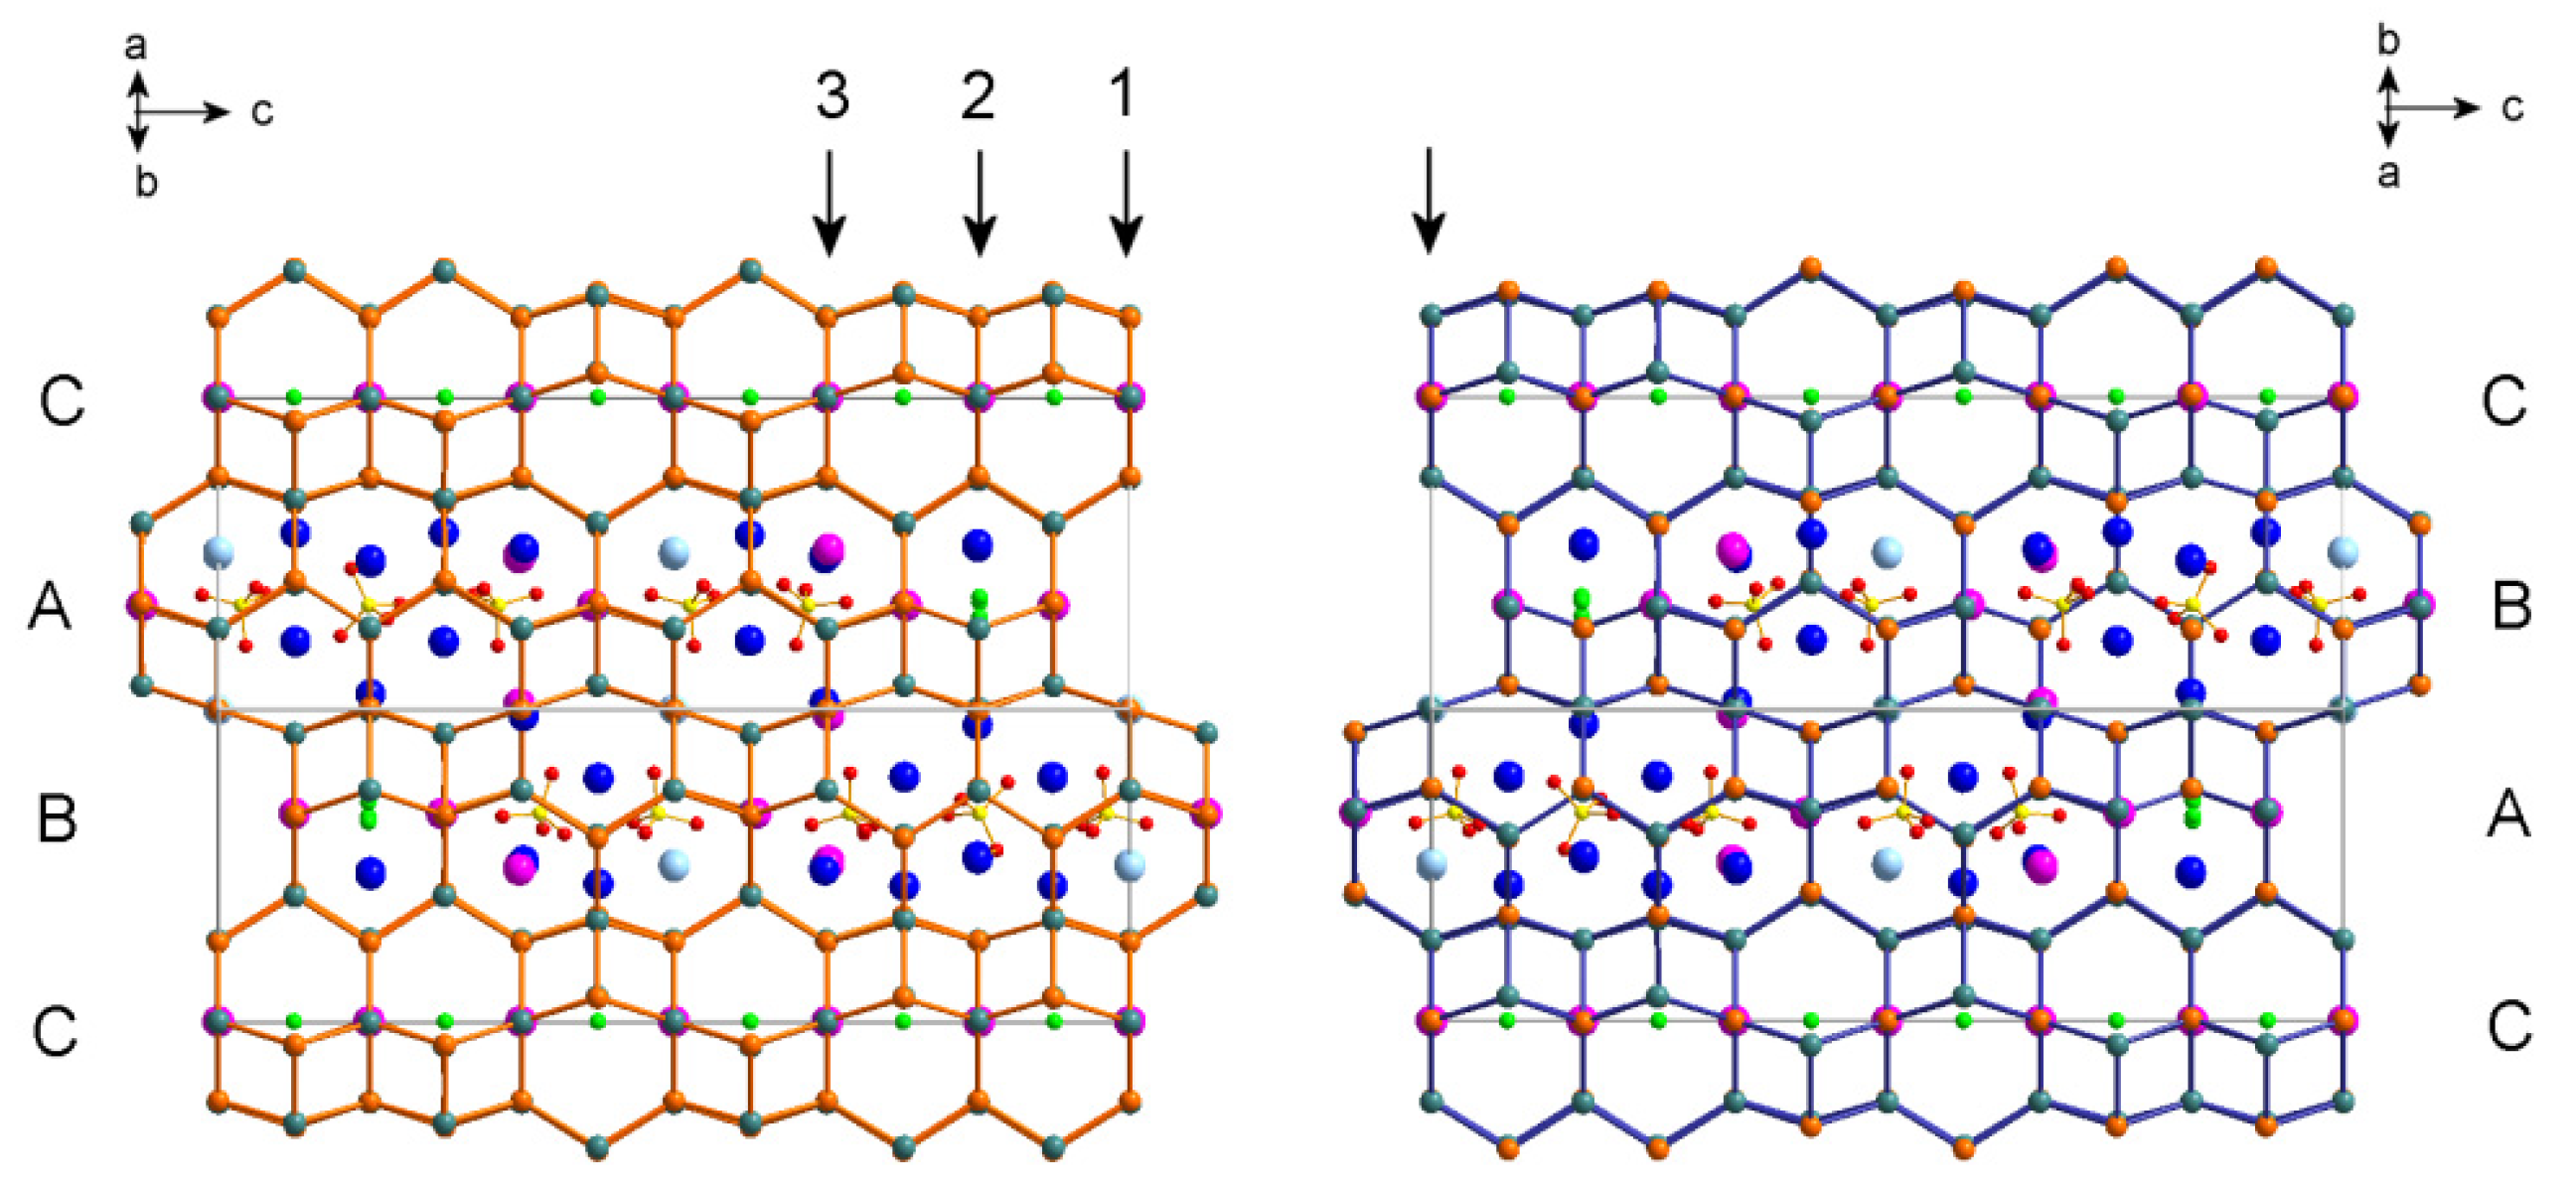
4.7.2. Twinning of Tounkite
As noted above, all studied tounkite samples are twinned. Inevitable violations of the regular structure at the boundaries between parts of the twin distort the diffraction pattern, especially in the case of samples with multiple twin boundaries (polysynthetic twins). This situation may take place in Sample 3. As can be seen in
Table 4, the measured diffraction pattern from Sample 3 contains fewer observable reflections and weaker reflections compared to the other two samples. Most likely, this is due to the diffuse noise generated by the poor quality of the twinned crystal and small areas of coherent scattering of X-day radiation. The corresponding values of
R-factors for Sample 3 are significantly higher than for Samples 1 and 2.
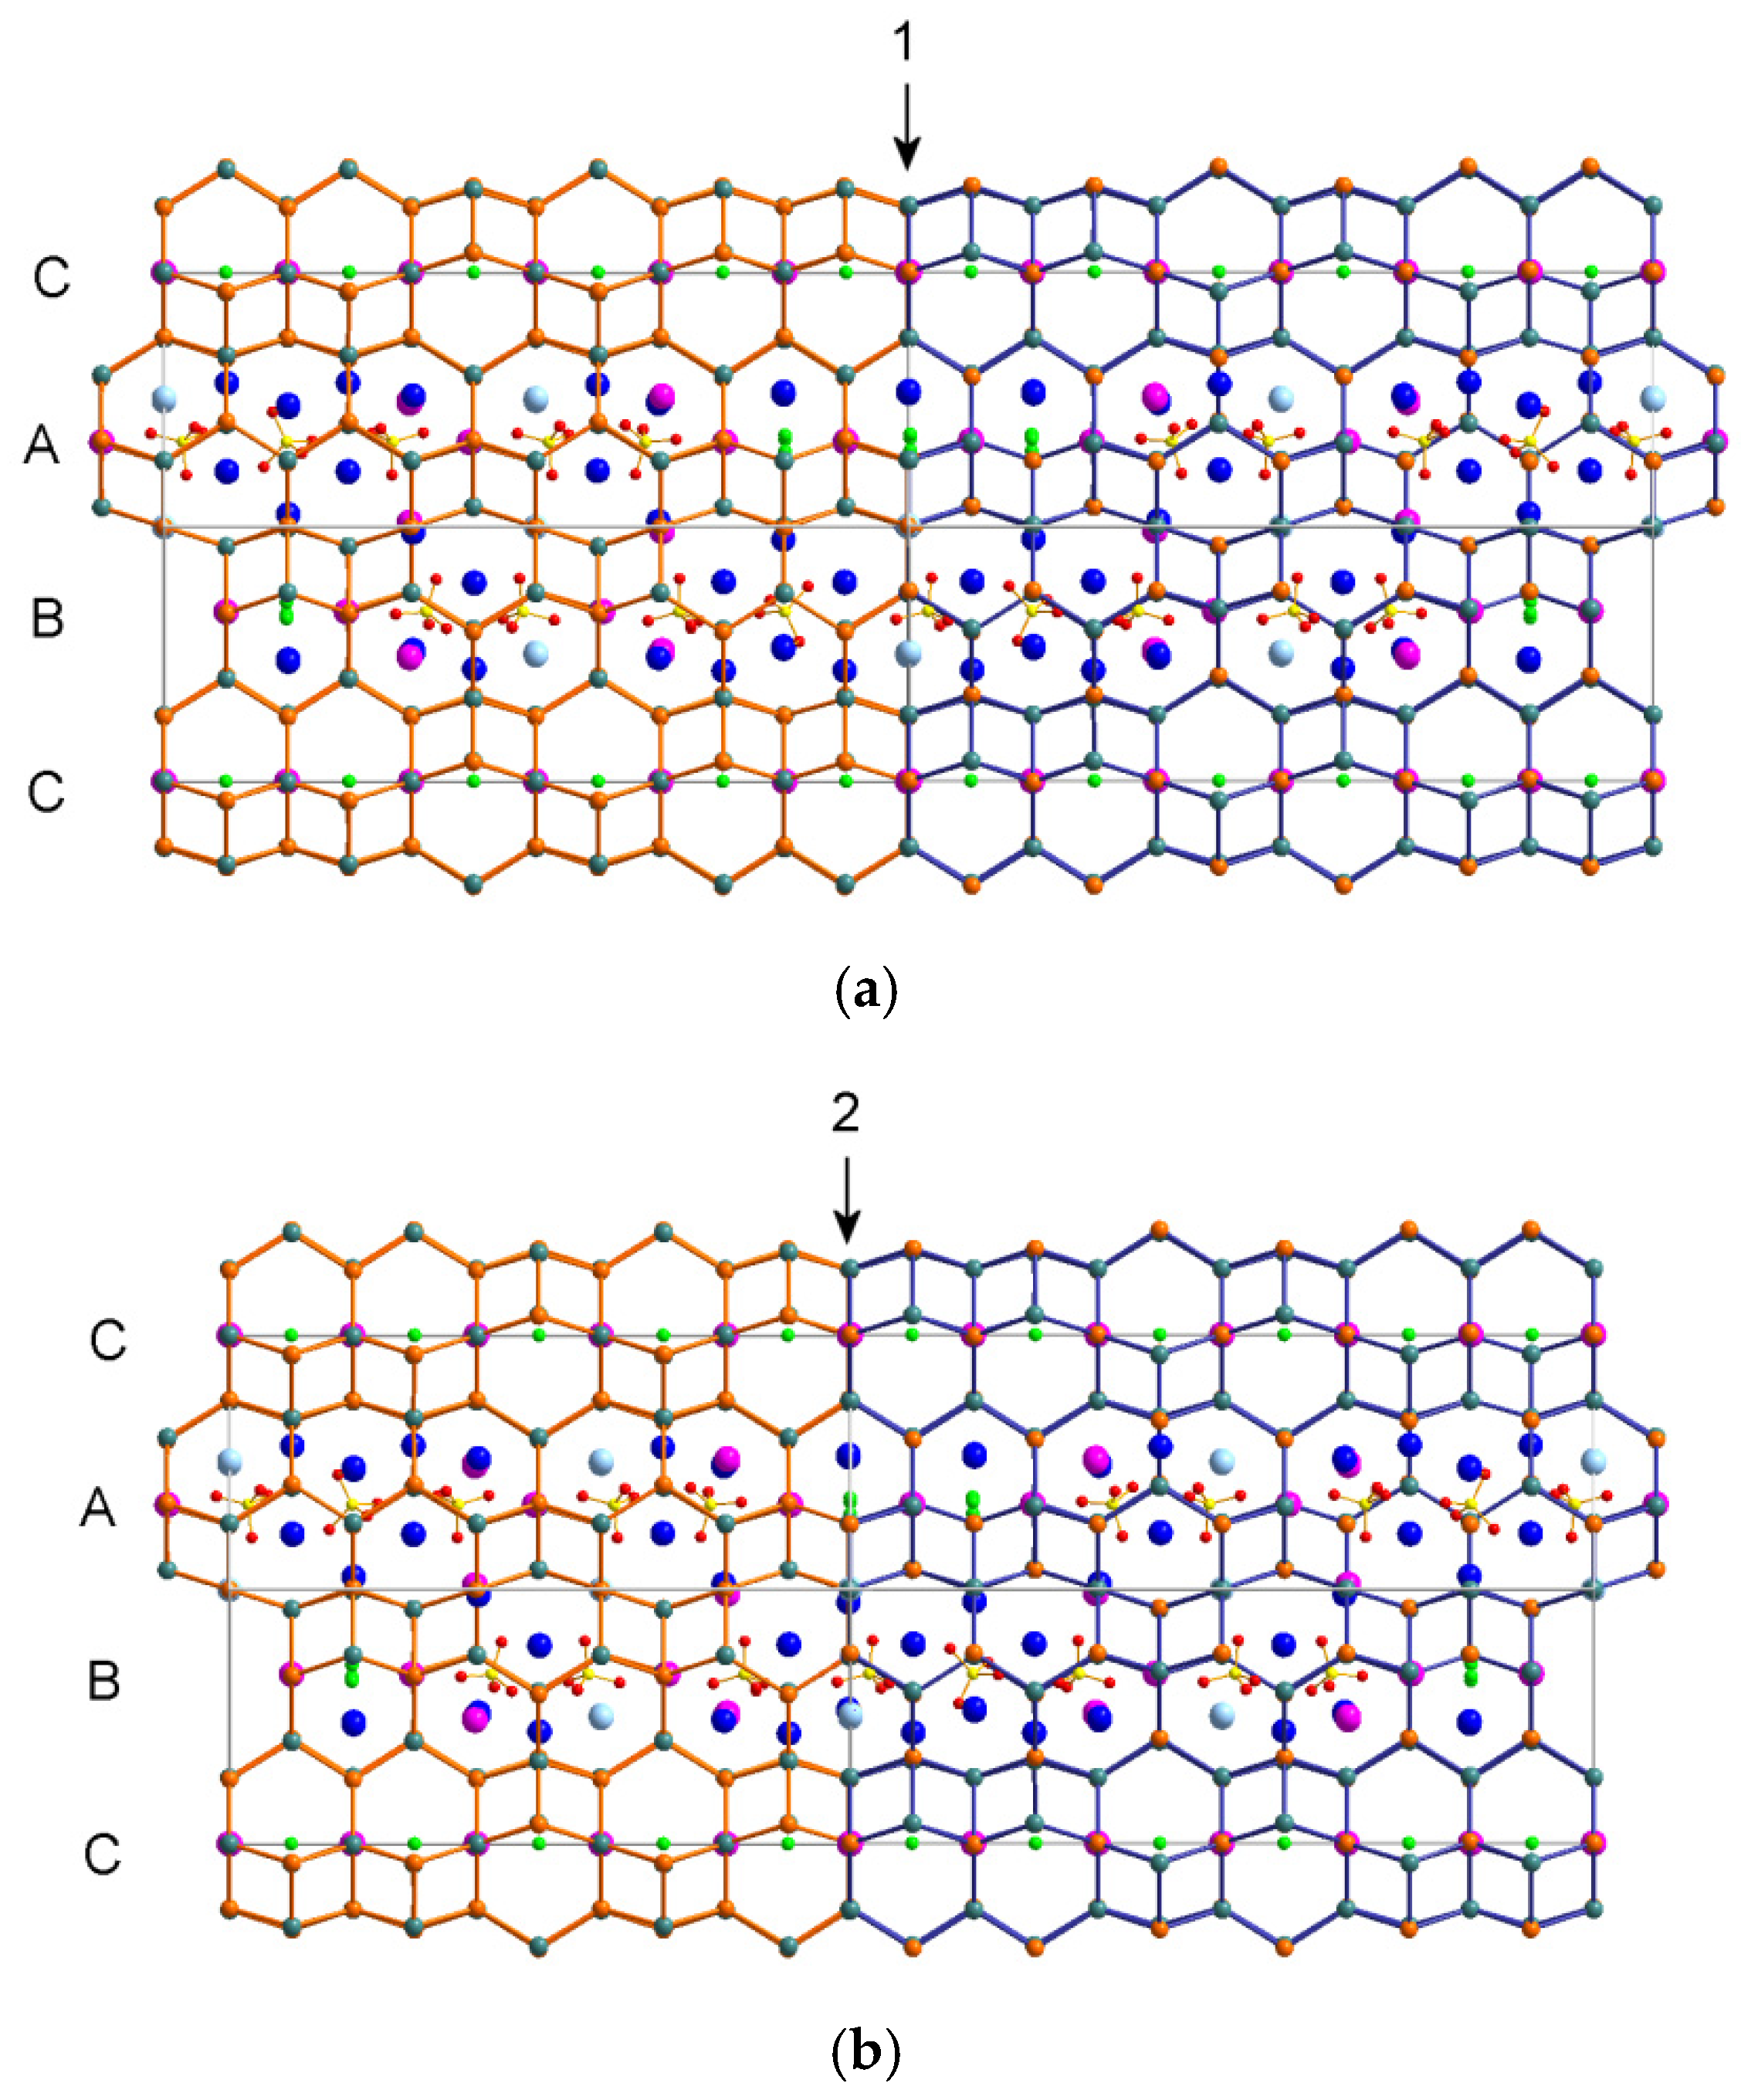
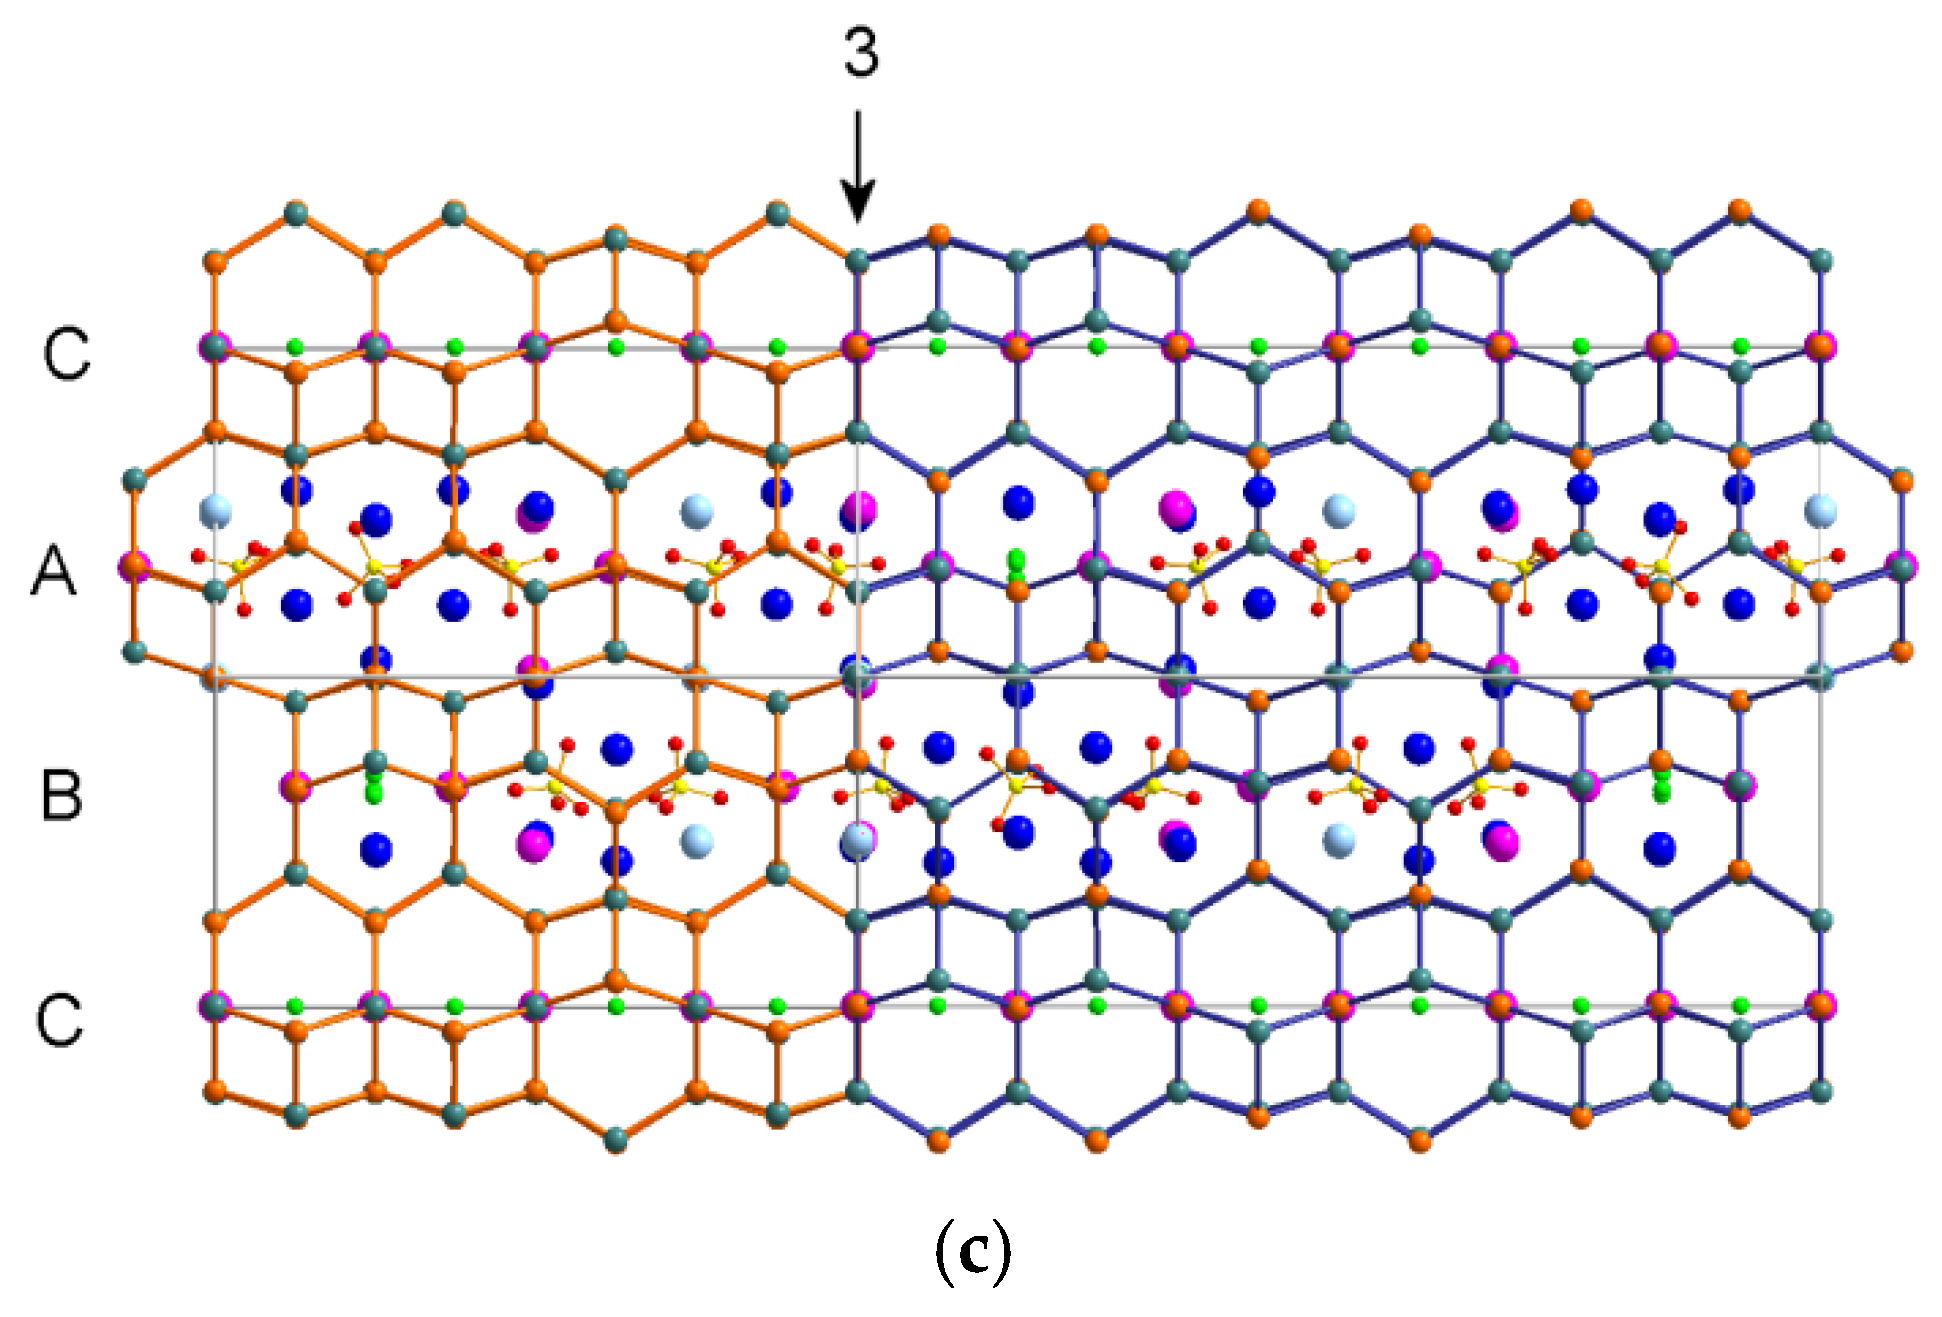
The boundaries of twin components, connected by a rotation of 180° around the [001] axis, run perpendicular to this axis, along the planes of the six-membered rings. For modeling the structures of boundaries between twin components, fragments of two domains, each in the volume of a unit cell, are drawn in
Figure 8 (the original fragment is shown on the left and a fragment expanded around [001] is shown on the right). Let us mentally dissect the right fragment with a plane at the level marked by the arrow and align it with the original fragment dissected at the levels 1, 2 or 3 (marked by corresponding arrows). The resulting model structure at the border between twin components is shown in
Figure 9a–c.
Domain-joining along the boundary between unit cells (
Figure 9a) may lead to the formation of a new 10-layer cage in the B column, which can be populated, for example, with five SO
42− tetrahedra (as is shown in the figure) or by a large polysulfide group (S
4 or S
52−). In the A column, an “extra” cancrinite cavity is formed, populated in the figure by a chlorine anion. The joining of the domains at level 2 is accompanied by the formation of an eight-layer giuseppettite cage in the B column. However, this situation is not realized in tounkite (see
Section 5). The domain joining at level 3 only disrupts the order of alternation of cavities, and does not lead to the appearance of cages of unusual lengths.
5. Discussion
5.1. Extra-Framework Components
The comparison of the electron microprobe data, spectra in the middle IR range, ESR, luminescence, Raman and UV–Vis–near IR absorption spectra shows that the samples 2 and 3 contain extra-framework Na
+, K
+ and Ca
2+ cations; SO
42−, S
4 and S
52− group Cl
− anions; as well as minor H
2O, HS
− and S
3⦁− groups. The specific features of Sample 3 distinguishing it from Sample 2 are the high contents of K
+ and S
52− anions and the admixture of S
3⦁− radical anions, whereas Sample 2 is enriched in S
4. Positions in the middle part of the liottite cage are occupied by Na
+ cations in Sample 2 and by larger K
+ cations in Sample 3. As a result, the volume of the liottite cage and, consequently, the volume of the unit cell of Sample 3 are larger than in Sample 2 (
Table 3).
The total contents of Cl− and HS− in the studied samples exceed those in the ideal tounkite formula. Excessive Cl− and HS− anions, as well as water molecules, may occur either in the liottite cages (together with polysulfide species) or at the border between twin components.
As noted above, the Raman band of symmetric stretching vibrations of S3⦁− in Sample 2 is shifted towards a higher wavenumber as compared to Sample 3 (558 cm−1 vs. 542 cm−1). This fact indicates that the S3⦁− radical anion in Sample 2 is compressed. The compression of S3⦁− can be explained by differences in the sizes of the liottite cage in these samples: Sample 2 is K-depleted and has a smaller liottite cage compared to Sample 3. Thus, most probably, the admixed S3⦁− radical anion occurs in the liottite cage.
Most samples of minerals belonging to the cancrinite and sodalite groups contain admixed extra-framework CO
2 molecules [
9]. The absence of this species, as well as the presence of HS
− and/or S
52− cations in tounkite as well as sapozhnikovite, Na
8(Al
6Si
6O
24)(HS)
2, sulfide-rich balliranoite, Na
5.4K
0.1Ca
2.4(Si
6Al
6O
24)Cl
2[(CO
3)
0.7(SO
4)
0.18S
0.95Cl
0.1(H
2O)
0.16 [
18] and members of the bystrite–sulfhydrylbystrite solid-solution series K
2Na
5Ca(Al
6Si
6O
24)S
52−(HS,Cl)
− [
15], indicate the highly reducing conditions of their formation [
8,
16,
26].
5.2. Framework Distortions
The spectral bands at 705 ± 8, 528 ± 5, 547 ± 4, and 555 ± 3 cm
−1 in the IR spectra of cancrinite-group minerals indicate the presence of the sodalite, Losod, liottite, and giuseppettite cages, respectively, whereas the band at 590 ± 5 cm
−1 and a doublet in the range of 650–690 cm
−1 correspond to vibrations involving columns of cancrinite cages [
9]. The bands of Losod and liottite cages and columns of cancrinite cages are observed in the IR spectra of tounkite, whereas the bands of sodalite and giuseppettite cages are absent, in accordance with the ideal tounkite structure.
The main cause of distortions in the aluminosilicate framework of tounkite is polysynthetic twinning. As noted above, the joining of polysynthetic twin components may lead to the formation of an 8-layer giuseppettite cage or a new 10-layer cage. Thus, the bands at 500 and 640 cm−1 in the IR spectra of tounkite may be tentatively attributed to the framework vibrations involving the new large 10-layer cage. These bands have never been observed before in the IR spectra of cancrinite group minerals. The absence of bands in the range of 552–558 cm−1 in the IR spectra of tounkite indicates that twinning with the formation of the giuseppettite cage is atypical for tounkite.
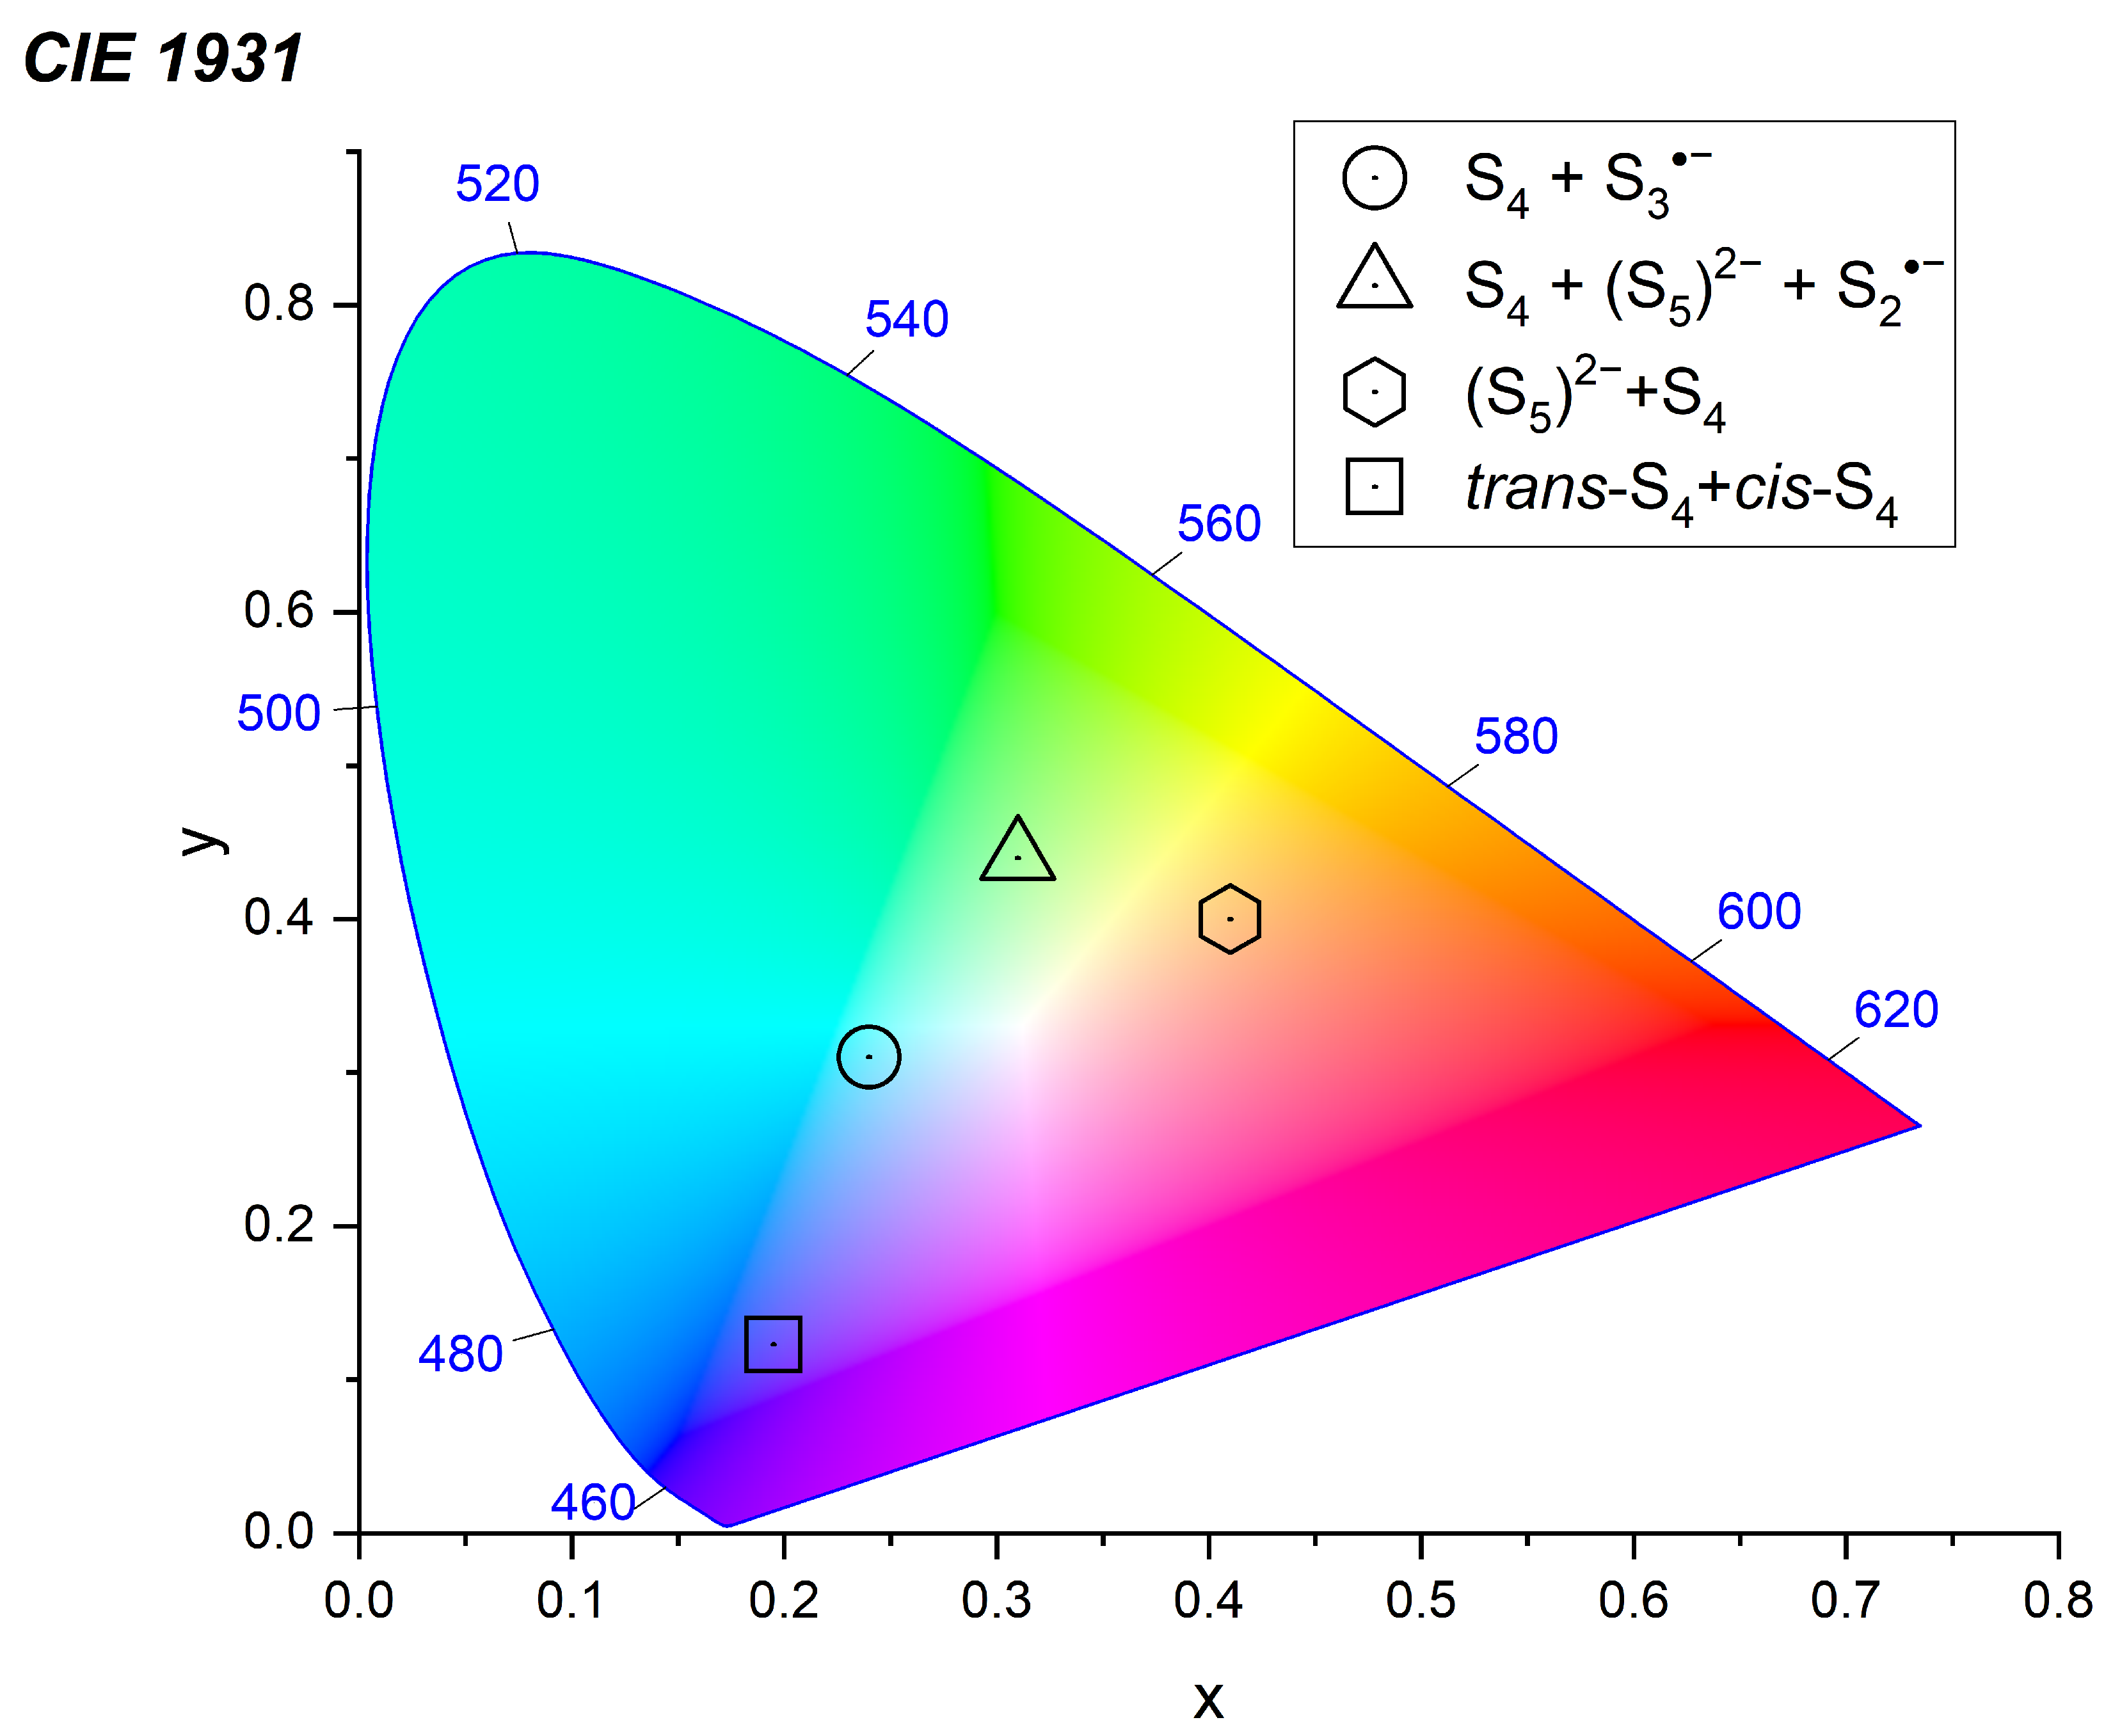
5.3. Color Centers
The observed differences in the colors of Samples 2 and Sample 3 (
Figure 10) are associated with the different amounts of polysulfide groups contained in them. Both samples contain different amounts S
52− anions, which are a yellow chromophore, and minor admixtures of the S
3⦁− radical anions, which are a very strong blue chromophore, Sample 3 being more enriched in S
52−. In addition, Sample 2 contains significant amounts of S
4 molecules (a weak red chromophore) and Sample 3 contains S
2⦁− radical anions (a yellow chromophore). Thus, the blue color of Sample 2 is mainly related to the presence of S
3⦁− and S
4, whereas the green color of Sample 3 is due to the combination of S
3⦁−, S
2⦁− and S
52−.
The absorption bands of S3⦁− in Samples 2 and 3 observed in the visible range are shifted with respect to each other. Their maxima are observed at 2.11 and 2.05 eV, respectively. This fact may additionally influence the differences in color of Samples 1 and 2.
6. Conclusions and Implications
Until recently, tounkite was the only cancrunite-group mineral whose crystal structure and crystal chemical features remained insufficiently studied. In this work, the problem of the tounkite structure has been solved, and all extra-framework components have been identified based on a multimethodic approach involving electron microprobe analysis, single-crystal X-ray diffraction, and infrared, Raman, ESR, UV–Vis–near-IR absorption and photoluminescence spectroscopy.
Tounkite is defined as a 12-layer cancrinite-group mineral with the ordered aluminosilicate framework formed by the CBCBCACBCACA stacking sequence of layers composed of six-membered rings of tetrahedra, with the simplified general formula (Na,Ca,K)8[Al6Si6O24](SO42−,S4,S52−)2(Cl−,HS−)·nH2O, minor admixtures of S3⦁− and/or S2⦁− radical anions, and wide variations of the contents of extra-framework K+, S4 and S52−. The framework contains liottite and Losod cages, as well as columns of cancrinite cages. The S3⦁−, S52−, S4 and S3⦁− extra-framework species are the main chromophores determining variations of the tounkite color.
Polysynthetic twinning is a specific feature of tounkite. The formation of a new 10-layer cage at the border between twin components was hypothesized based on structural data and confirmed by the IR spectrum.
Author Contributions
Conceptualization, N.V.C., N.B.B. and A.N.S.; methodology, N.V.C., R.Y.S., M.F.V. and N.V.Z.; investigation, R.Y.S., N.B.B., M.F.V., N.V.Z., I.V.P., F.D.S. and D.A.K.; original manuscript draft preparation, N.V.C. and R.Y.S.; manuscript review and editing, R.Y.S., A.N.S., N.V.C., I.V.P. and N.B.B.; figures, N.B.B., N.V.C. and R.Y.S. All authors have read and agreed to the published version of the manuscript.
Funding
All spectroscopic studies (except IR spectroscopy and assignment of Raman bands), electron microprobe and X-ray diffraction studies, and crystal chemical analysis were supported by the Russian Science Foundation, grant no. 22-17-00006 (for N.V.C., N.B.B., R.Y.S., N.V.Z., I.V.P., M.F.V. and F.D.S.). Conceptualization, IR spectroscopic investigation and assignment of Raman bands were carried out in accordance with the state task, state registration no. FFSG-2024-0009 (for N.V.C.).
Data Availability Statement
Data are contained within the article.
Acknowledgments
The authors are grateful to Ramiza A. Rastsvetaeva for a fruitful discussion.
Conflicts of Interest
The authors declare no conflict of interest.
References
- Chukanov, N.V.; Aksenov, S.M.; Rastsvetaeva, R.K. Structural chemistry, IR spectroscopy, properties, and genesis of natural and synthetic microporous cancrinite- and sodalite-related materials: A review. Microporous Mesoporous Mater. 2021, 323, 111098. [Google Scholar] [CrossRef]
- Ballirano, P.; Maras, A.; Buseck, P.R. Crystal chemistry and IR spectroscopy of Cl− and SO4-bearing cancrinite-like minerals. Am. Mineral. 1996, 81, 1003–1012. [Google Scholar] [CrossRef]
- Bonaccorsi, E.; Merlino, S. Modular microporous minerals: Cancrinite-davyne group and C-S-H phases. Rev. Mineral. Geochem. 2005, 57, 241–290. [Google Scholar] [CrossRef]
- Gatta, G.D.; Lotti, P. Cancrinite-group minerals: Crystal-chemical description and properties under nonambient conditions—A review. Am. Mineral. 2016, 101, 253–265. [Google Scholar] [CrossRef]
- Baerlocher, C.; McCusker, L.B. Database of Zeolite Structures. 2017. Available online: http://www.iza-structure.org/databases/ (accessed on 5 February 2024).
- Ivanov, V.G.; Sapozhnikov, A.N.; Piskunova, L.F.; Kashaev, A.A. Tounkite (Na,Ca,K)8[Al6Si6O24](SO4)2Cl·H2O, a new cancrinite-like mineral. Zap. Vsesyuznogo Mineral. Obs. (Proc. Soviet Mineral. Soc.) 1992, 114, 92–95. (In Russian) [Google Scholar]
- Rozenberg, K.A.; Sapozhnikov, A.N.; Rastsvetaeva, R.K.; Bolotina, N.B.; Kashaev, A.A. Crystal structure of a new representative of the cancrinite group with a 12-layer stacking sequence of tetrahedral rings. Crystallogr. Rep. 2004, 49, 635–642. [Google Scholar] [CrossRef]
- Krivovichev, S.V. Structural complexity of minerals: Information storage and processing in the mineral world. Mineral. Mag. 2013, 77, 275–326. [Google Scholar] [CrossRef]
- Rigaku Oxford Diffraction CrysAlisPro Software System, v. 1.171.39.46; Rigaku Corporation: Oxford, UK, 2018.
- Sheldrick, G.M. XPREP, Version 2008/2; Bruker-AXS: Madison, WI, USA, 2008. [Google Scholar]
- Petříček, V.; Dušek, M.; Palatinus, L. Crystallographic Computing System JANA2006: General features. Z. Krist.—Cryst. Mater. 2014, 229, 345–352. [Google Scholar] [CrossRef]
- Chukanov, N.V.; Vigasina, M.F.; Shendrik, R.Y.; Varlamov, D.A.; Pekov, I.V.; Zubkova, N.V. Nature and isomorphism of extra-framework components in cancrinite- and sodalite-related minerals: New data. Minerals 2022, 12, 729. [Google Scholar] [CrossRef]
- Chukanov, N.V.; Aksenov, S.M.; Pekov, I.V. Infrared spectroscopy as a tool for the analysis of framework topology and extraframework components in microporous cancrinite- and sodalite-related aluminosilicates. Spectrochim. Acta A Mol. Biomol. Spectrosc. 2023, 287, 121993. [Google Scholar] [CrossRef]
- Steudel, R.; Chivers, T. The role of polysulfide dianions and radical anions in the chemical, physical and biological sciences, including sulfur-based batteries. Chem. Soc. Rev. 2019, 48, 3279–3319. [Google Scholar] [CrossRef] [PubMed]
- Chukanov, N.V.; Sapozhnikov, A.N.; Kaneva, E.V.; Varlamov, D.A.; Vigasina, M.F. Bystrite, Na7Ca(Al6Si6O24)S52−Cl−: Formula redefinition and relationships with other four-layer cancrinite-group minerals. Mineral. Mag. 2023, 87, 455–464. [Google Scholar] [CrossRef]
- Sapozhnikov, A.N.; Bolotina, N.B.; Chukanov, N.V.; Shendrik, R.Y.; Kaneva, E.V.; Vigasina, M.F.; Ivanova, L.A.; Tauson, V.L.; Lipko, S.V. Slyudyankaite, Na28Ca4(Si24Al24O96)(SO4)6(S6)1/3(CO2)·2H2O, a new sodalite group mineral from the Malo-Bystrinskoe lazurite deposit, Baikal Lake area, Russia. Am. Mineral. 2023, 108, 1805–1817. [Google Scholar] [CrossRef]
- Chivers, T.; Oakley, R.T. Structures and spectroscopic properties of polysulfide radical anions: A theoretical perspective. Molecules 2023, 28, 5654. [Google Scholar] [CrossRef] [PubMed]
- Chukanov, N.V.; Sapozhnikov, A.N.; Shendrik, R.Y.; Zubkova, N.V.; Vigasina, M.F.; Potekhina, N.V.; Ksenofontov, D.A.; Pekov, I.V. Crystal Chemistry, Thermal and Radiation-Induced Conversions and Indicatory Significance of S-Bearing Groups in Balliranoite. Minerals 2023, 13, 822. [Google Scholar] [CrossRef]
- Rejmak, P. Computational refinement of the puzzling red tetrasulfur chromophore in ultramarine pigments. Phys. Chem. Chem. Phys. 2020, 22, 22684–22698. [Google Scholar] [CrossRef] [PubMed]
- Eckert, B.; Steudel, F. Molecular spectra of sulfur molecules and solid sulfur allotropes. Top. Curr. Chem. 2003, 231, 31–97. [Google Scholar] [CrossRef]
- Hettmann, K.; Wenzel, T.; Marks, M.; Markl, G. The sulfur speciation in S-bearing minerals: New constraints by a combination of electron microprobe analysis and DFT calculations with special reference to sodalite-group minerals. Am. Mineral. 2012, 97, 1653–1661. [Google Scholar] [CrossRef]
- Ling, Z.C.; Wang, A.; Jolliff, B.L. Mineralogy and geochemistry of four lunar soils by laser-Raman study. Icarus 2011, 211, 101–113. [Google Scholar] [CrossRef]
- Wong, M.W.; Steudel, R. Structure and spectra of tetrasulfur S4—An ab initio MO study. Chem. Phys. Lett. 2003, 379, 162–169. [Google Scholar] [CrossRef]
- Caggiani, M.C.; Mangone, A.; Aquafredda, P. Blue coloured haüyne from Mt. Vulture (Italy) volcanic rocks: SEM-EDS and Raman investigation of natural and heated crystals. J. Raman Spectrosc. 2022, 53, 956–968. [Google Scholar] [CrossRef]
- Bény, C.; Guilhaumou, N.; Touray, J.-C. Native-sulphur-bearing fluid inclusions in the CO2-H2S-H2O-S system—Microthermometry and Raman microprobe (MOLE) analysis—Thermochemical interpretations. Chem. Geol. 1982, 37, 113–127. [Google Scholar] [CrossRef]
- Dubessy, J.; Boiron, M.-C.; Moissette, A.; Monnion, C.; Sretenskaya, N. Determination of water, hydrates and pH in fluid inclusions by micro-Raman spectrometry. Eur. J. Mineral. 1992, 4, 885–894. [Google Scholar] [CrossRef]
- Chukanov, N.V.; Shendrik, R.Y.; Vigasina, M.F.; Pekov, I.V.; Sapozhnikov, A.N.; Shcherbakov, V.D.; Varlamov, D.A. Crystal Chemistry, Isomorphism, and Thermal Conversions of Extra-Framework Components in Sodalite-Group Minerals. Minerals 2022, 12, 887. [Google Scholar] [CrossRef]
- Debiemme-Chouvy, C.; Wartelle, C.; Sauvage, F.-X. First evidence of the oxidation and regeneration of polysulfides at a GaAs electrode, under anodic conditions. A study by in situ UV−visible spectroelectrochemistry. J. Phys. Chem. B 2004, 108, 18291–18296. [Google Scholar] [CrossRef]
| Disclaimer/Publisher’s Note: The statements, opinions and data contained in all publications are solely those of the individual author(s) and contributor(s) and not of MDPI and/or the editor(s). MDPI and/or the editor(s) disclaim responsibility for any injury to people or property resulting from any ideas, methods, instructions or products referred to in the content. |
© 2024 by the authors. Licensee MDPI, Basel, Switzerland. This article is an open access article distributed under the terms and conditions of the Creative Commons Attribution (CC BY) license (https://creativecommons.org/licenses/by/4.0/).


 ,
, 


