Article

Strategic Qualitative Risk Assessment of Thousands of Legacy Wells within the Area of Review (AoR) of a Potential CO2 Storage Site

Bob L. Herd Department of Petroleum Engineering, Texas Tech University, Lubbock, TX 79409, USA
*
Author to whom correspondence should be addressed.
Minerals 2024, 14(4), 383; https://doi.org/10.3390/min14040383
Submission received: 28 February 2024 / Revised: 27 March 2024 / Accepted: 3 April 2024 / Published: 6 April 2024
(This article belongs to the Special Issue Carbon Dioxide Storage, Utilization & Reduction)

Abstract

:
The subsurface confinement of anthropogenic carbon dioxide (CO2) demands robust risk assessment methodologies to identify potential leakage pathways. Legacy wells within the Area of Review (AoR) represent one potential leakage pathway. Robust methodologies require enormous amounts of data, which are not available for many old legacy wells. This study strategically categorizes 4386 legacy wells within the AoR of a potential CO2 storage site in the Illinois basin and identifies the high-risk wells by leveraging publicly available data—reports and well logs submitted to state regulatory agencies. Wells were categorized based on their proximity to the injection well location, depth, the mechanical integrity of well barriers, and the accessibility to these wells throughout the project lifecycle. Wells posing immediate risks were identified, guiding prioritized corrective actions and monitoring plans. Out of 4386 wells, 54 have high priority for corrective action, 10 have medium priority, and the remainder are of low priority. Case study results from the Illinois basin demonstrate the effectiveness and applicability of this approach, to assess the risk associated with legacy wells within the AoR of potential CO2 storage site, strategically categorizing over 4000 such wells despite data limitations.

1. Introduction

The escalating levels of greenhouse gases, primarily carbon dioxide (CO2), in the atmosphere are attributed to global climate changes. To mitigate this, Geological Carbon Sequestration (GCS) or Carbon Capture and Storage (CCS) methods have emerged, enabling the capture and permanent storage of CO2 underground [1]. Pilot CCS projects worldwide have capitalized on learnings from CO2-enhanced oil recovery initiatives, as highlighted in research [2]. The core aim of CCS projects is to securely store CO2 underground, preventing its escape to underground sources of drinking water (USDW) or surface leakage, which could contaminate water sources and alter their chemical composition [3,4]. Essential to safeguarding groundwater quality is a robust testing and monitoring regimen encompassing various parameters such as mechanical integrity, injection pressure, corrosion, and groundwater assessments [5,6]. Understanding CO2 leakage pathways, classified as artificial penetrations (wellbores) and geological features (faults and fractures), is critical for effective monitoring [7].
Legacy wellbores, or improperly plugged and abandoned oil and gas wells, act as a threat to the success of the CCS projects if they remain unidentified and/or if remedial actions are not taken. The standards for cement compositions and well-plugging procedures were set up in 1952 by the American Petroleum Institute (API); prior to that, mainly wood (logs), mud, animal carcasses, etc. were used as plugging materials. With the standardized plugging procedures and regulations set by the API, cement and mud became the most widely used plugging materials [8]. After the discovery of oil in 1859, several thousands of wells were drilled and left unplugged until the oil and gas divisions for each state were set up [4,9]. As of April 2022, there were 123,318 documented orphaned oil and gas wells (a sub-category of unplugged abandoned oil and gas wells) in the US that represent ~3% of the abandoned wells. This count does not take into account the undocumented orphaned wells or potential orphaned wells based on experts’ opinions [10]. Cahill and Samano [11] assessed the long-term integrity of onshore decommissioned oil and gas wells in the UK and differentiated them into groups based on their potential of integrity failure. There are several reasons for the improper plugging of wells which could be divided into two broad categories, regulations and operations. The regulations regarding the plugging and abandonment of oil and gas wells vary from country to country, as well as the year when these regulations were implemented [12]. The operational difficulties include the effects of mud–spacer–cement interactions and the reduction in the effective length of cement plugs due to mud contamination [13,14,15,16,17,18]. The way to mitigate improperly plugged wells is to re-enter the wells and re-plug them using appropriate sealant systems, which is a very costly operation depending upon the number of wells to be re-plugged [19,20]. If a large number of wells needs to be re-plugged then the operator has another option of geosteering the CO2 plume using active reservoir management techniques to avoid some of the risky wells within the predicted Area of Review (AoR) [21,22,23,24]. Thus, the density of improperly plugged and abandoned wells within the CCS sites is one of the components that will decide the success of the project.
The cement used to plug these abandoned wells was not CO2-resistant cement. Much of the research in the previous two decades focuses on the interactions of supercritical CO2, brine, and oil well cement. The reaction of supercritical CO2 with cement is referred to as the carbonation rate of cement. It is critical to know this rate, as it can be extrapolated to determine how many years the cement can resist the leakage of CO2, provided the experimental studies are carried out under field conditions [25,26,27,28,29,30]. Two studies in particular, Teodoriu and Bello (2020) and DePaolo and Cole (2013) [31,32], reviewed the experimental work performed by several research groups and summarized their findings related to interactions of supercritical CO2, brine, and oil well cement. The length of cement coverage across the casings was the main concern of the operators, but several other factors showing the integrity of legacy wells were also highlighted in the survey conducted by Iyer et al. [5,6]. It is, therefore, critical to evaluate if the well barriers reported in the well documents can resist the attacks of CO2 throughout the lifecycle of the CCS projects or whether the well barriers need to be repaired for wells within the AoR of the CCS projects.
Various qualitative and quantitative risk assessment methods exist for evaluating legacy wells, with quantitative methods offering a knowledgeable assessment of risks and solutions. The literature highlights methodologies utilizing regional well integrity testing programs, focusing on indicators such as sustained casing pressure (SCP) or casing vent flow (CVF) data [33,34,35,36,37,38,39,40,41]. However, SCP reports are scarce and are available for recently drilled wells where they are mandated by regulations. Other approaches include using Cement Bond Logs (CBLs) or cement coverage in the annulus as indicators of well integrity [42,43,44]. While some studies focus on currently producing or recently drilled wells, the highest-risk wells are those pre-dating standardized procedures and lacking SCP reports, CBL data, and cementing or casing details. In instances of missing or inconsistent data, qualitative assessments are preferred over quantitative methods. The qualitative risk assessment (QRA) methodology proposed in [45] offers a systematic approach to evaluate the risks associated with various types of legacy wells, addressing the challenges posed by limited information and diverse well types. By categorizing legacy wells based on geological penetrations, accessibility, and barrier integrity, this methodology lays the foundation for effective risk mitigation strategies and standardized comparisons across CCS projects globally.
Building upon the methodologies outlined in Arbad et al. [46] this study employs rigorous analysis techniques to evaluate over 4000 legacy wells within the AoR of a potential geological carbon sequestration site in southern Illinois. By integrating spatial analysis, geological characteristics, and well integrity assessments based on publicly available data, this study provides valuable insights into the potential risks associated with the storage site. The findings serve as a crucial foundation for future decision-making processes, offering stakeholders a comprehensive understanding of the environmental and safety implications surrounding the utilization of the site for storage purposes.

2. Materials and Methods

2.1. Categorization Methodology

The qualitative risk assessment (QRA) devised by Arbad et al. [45] centered on evaluating legacy wells within the Area of Review (AoR) using solely well construction details reported to state agencies, aiding in categorizing and pinpointing wells requiring attention. The authors delineated nine pre-defined well types based on construction (Figure 1) and five accessibility levels to these well types, contingent upon their status—Dry and Abandoned (DA), Plugged and Abandoned (PA), Injection wells (Inj), Producer (Prod.), and Observation wells (Obs.)—with detailed definitions provided in Arbad et al. [45]. Assessing the potential for CO2/brine migration, the methodology considered well integrity barriers and geologic penetration from publicly available well reports and logs, with well types and accessibility levels correlating inversely with risk and corrective action costs. A stepwise procedure to implement this methodology is discussed in Arbad et al. [46] and this study is the application of the same methodology.

2.2. Case Study Details

Southern Illinois is a historic coal mining area. The legacy of this area is that it is home to several coal-fired plants. These coal-fired plants act as point sources of CO2. A summary of subsurface evaluations for a Southern Illinois site is presented below in Table 1, which includes the information of the reservoir targets, primary confining units (seals), USDWs, and legacy wellbore information. The reservoir quality of the St. Peter Sandstone is well known for historic potable water production across the upper Midwest and successful natural gas storage operations in Illinois. In the Illinois natural gas storage fields, the St. Peter Sandstone has excellent reservoir quality with porosity values of 5% to over 25% (average 14–16%) and permeability from 10 mD to over 1000 mD (average 150–400 mD). Maquoketa shale acts as a primary confining seal with average porosity determined using mercury injection of 0.9% and permeabilities near 1.8 × 10⁻⁴ mD, indicating its effectiveness as a barrier to vertical migration of fluids [47].

2.3. Data Collection and Quality Control

Illinois State Geological Survey (ISGS) sent the existing database and the related well reports of legacy wells within a 15-mile radius of the LG1 well. The center of the 15-mile radius is the LG1 location, i.e., one of the 10-acre spots in the following quarter: SW quarter of T5W R2W Section #15 at approximately (38.353028, −89.644836) WGS84. The data package contained 6454 documents (well files in PDF format, and logs in either LAS, TIF, or pdf format). The existing database provided information on 4386 wellbores with a depth greater than 100 ft—well data mainly comprised latitude, longitude, proximity to proposed injection location, completion and plug dates, depths, target formations, formation tops, and other relative information. The quality and quantity of the data within the files varied greatly as the wells were drilled and reported during different years ranging from 1893 to 2018. The wellbores of interest for the qualitative risk assessment were shortlisted based on the following criteria:
  • Formation code filtering: All the 4386 wellbores in the existing database were filtered based on the formation codes, i.e., the deepest formation penetrated by the well. All the formation codes for formations below the primary confining seal were selected and all the wells penetrating those formations were shortlisted for evaluation. Table 2 provides the list of formations that are classified as primary confining seals, formations below the primary confining seals, and the storage reservoir complex for the target site.
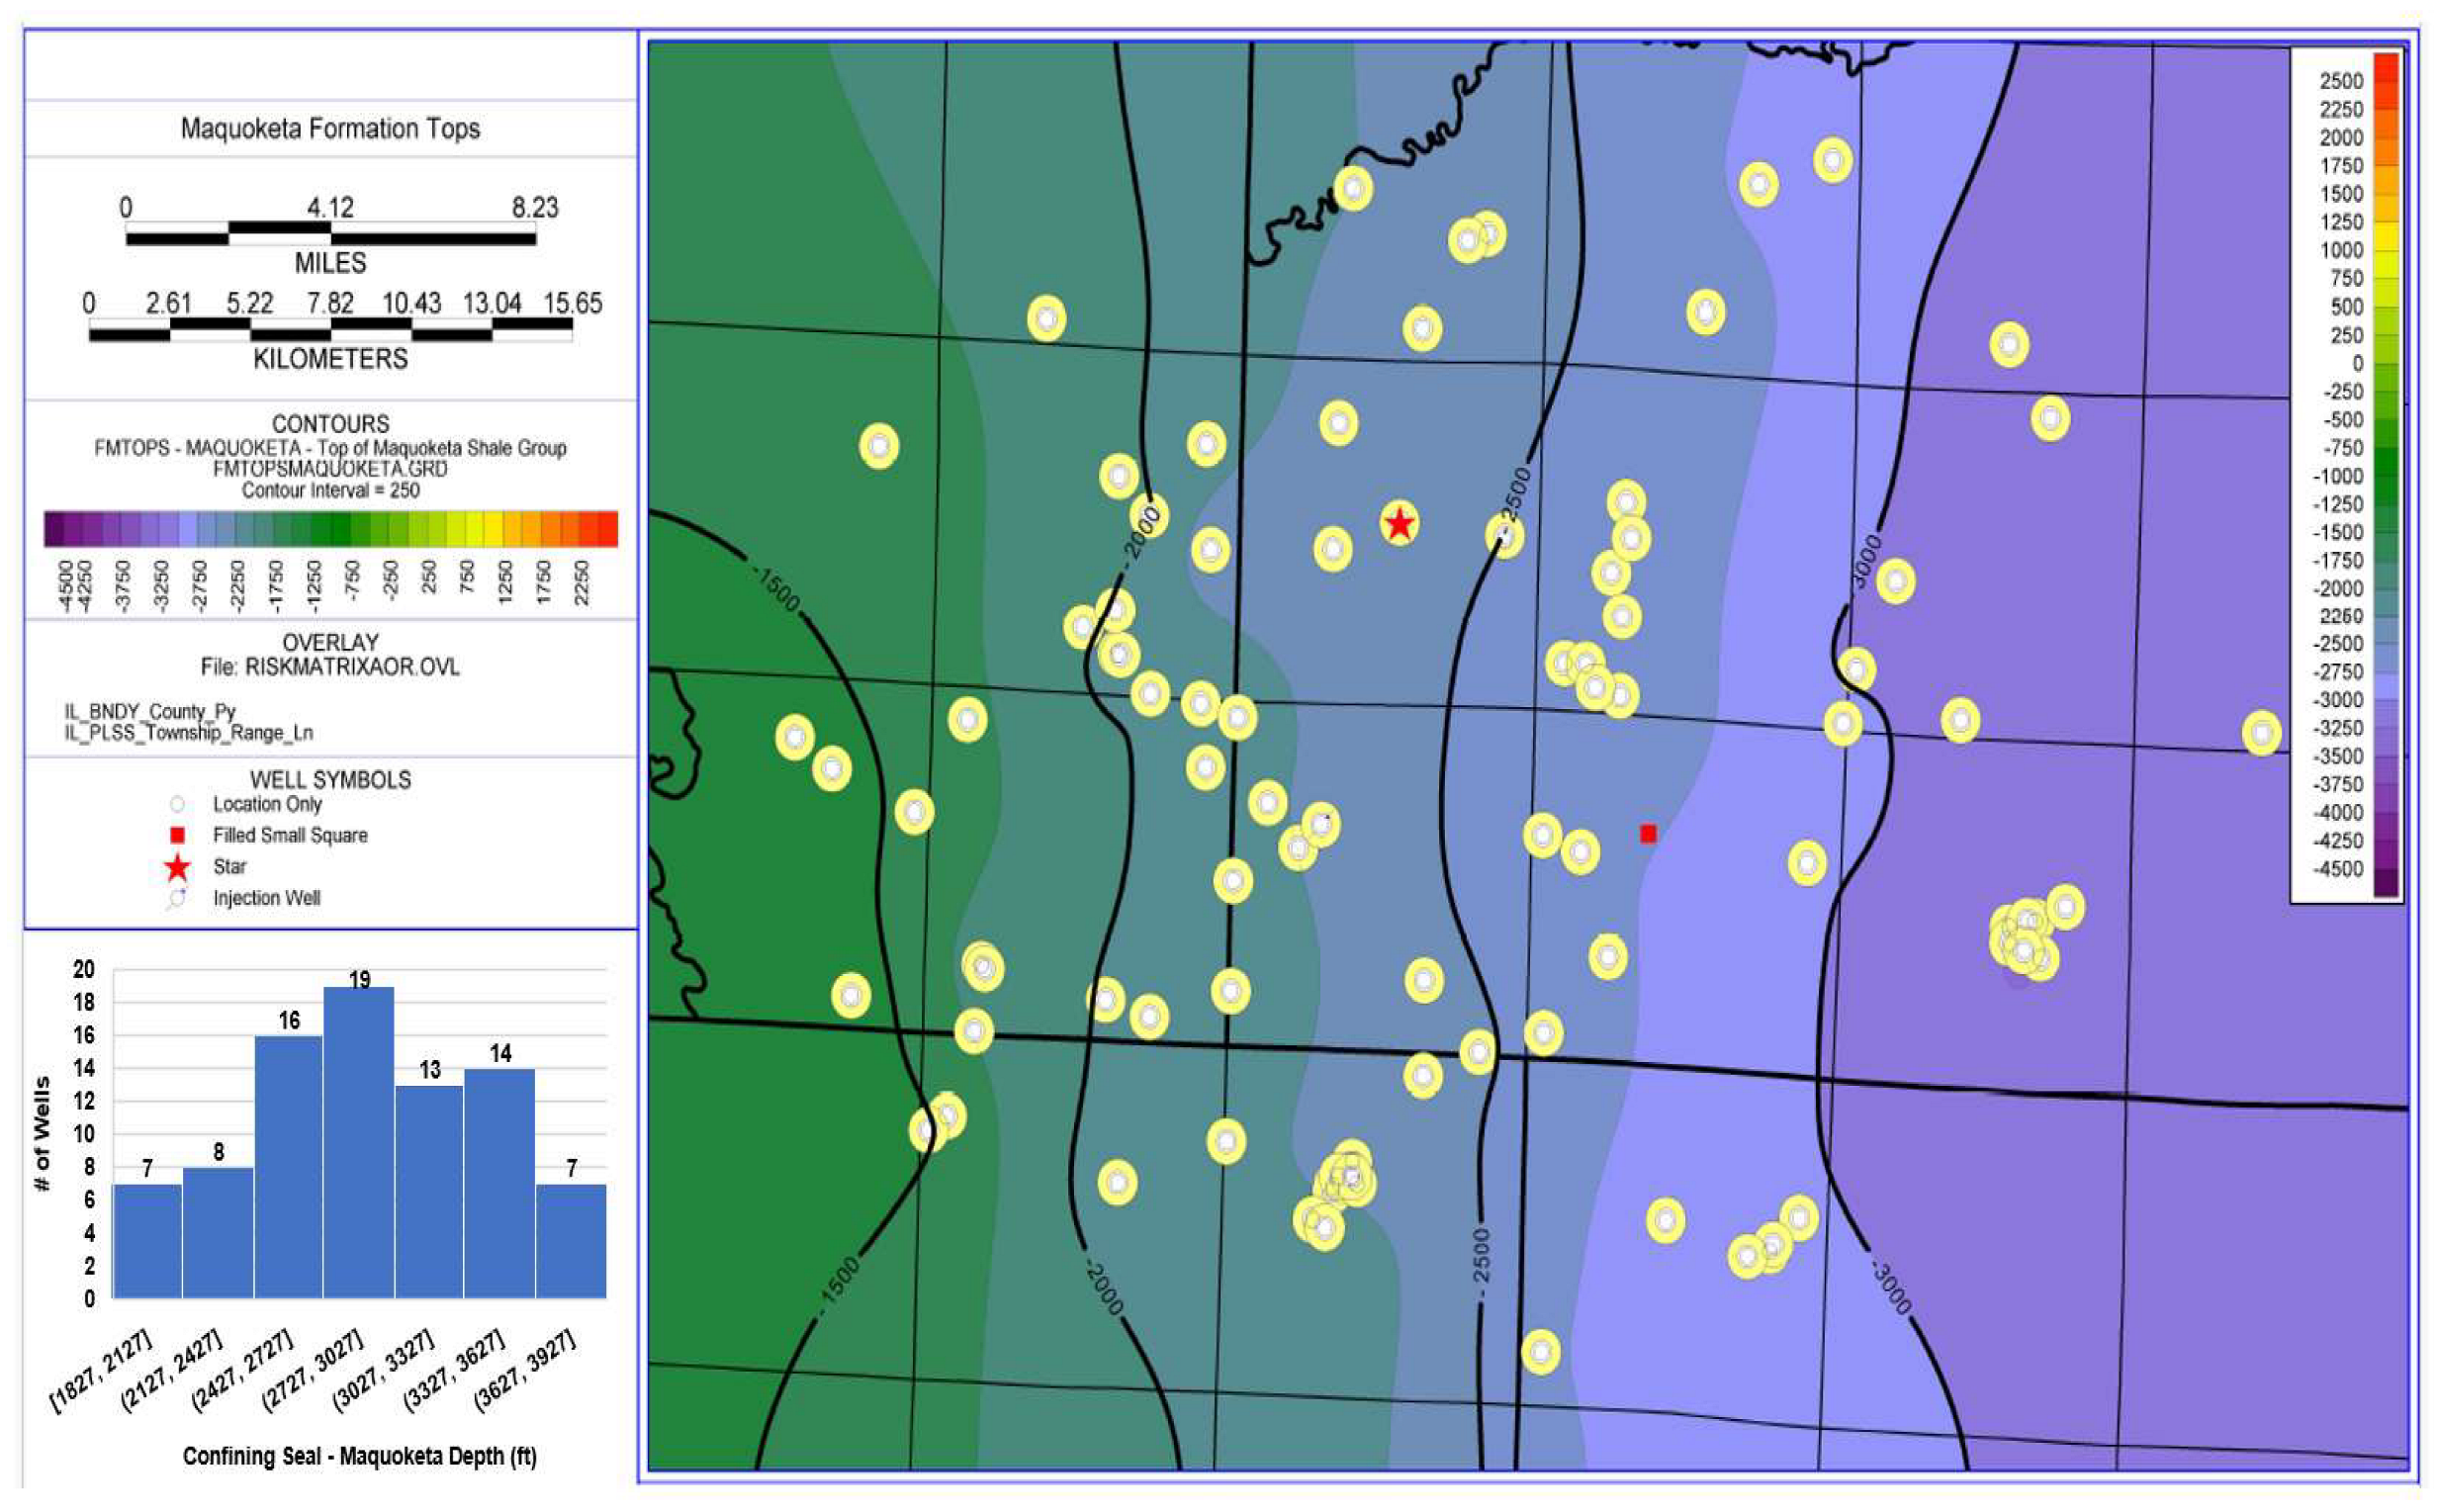
  • Depth filtering: As the approximate top of the Maquoketa seal near the LG1 is 2790 ft and its thickness is approximately 150 ft, wells with TD greater than 2470 ft were considered for preliminary risk assessment. This eliminated thousands of wells and only 521 wells with depths greater than 2470 ft were shortlisted.
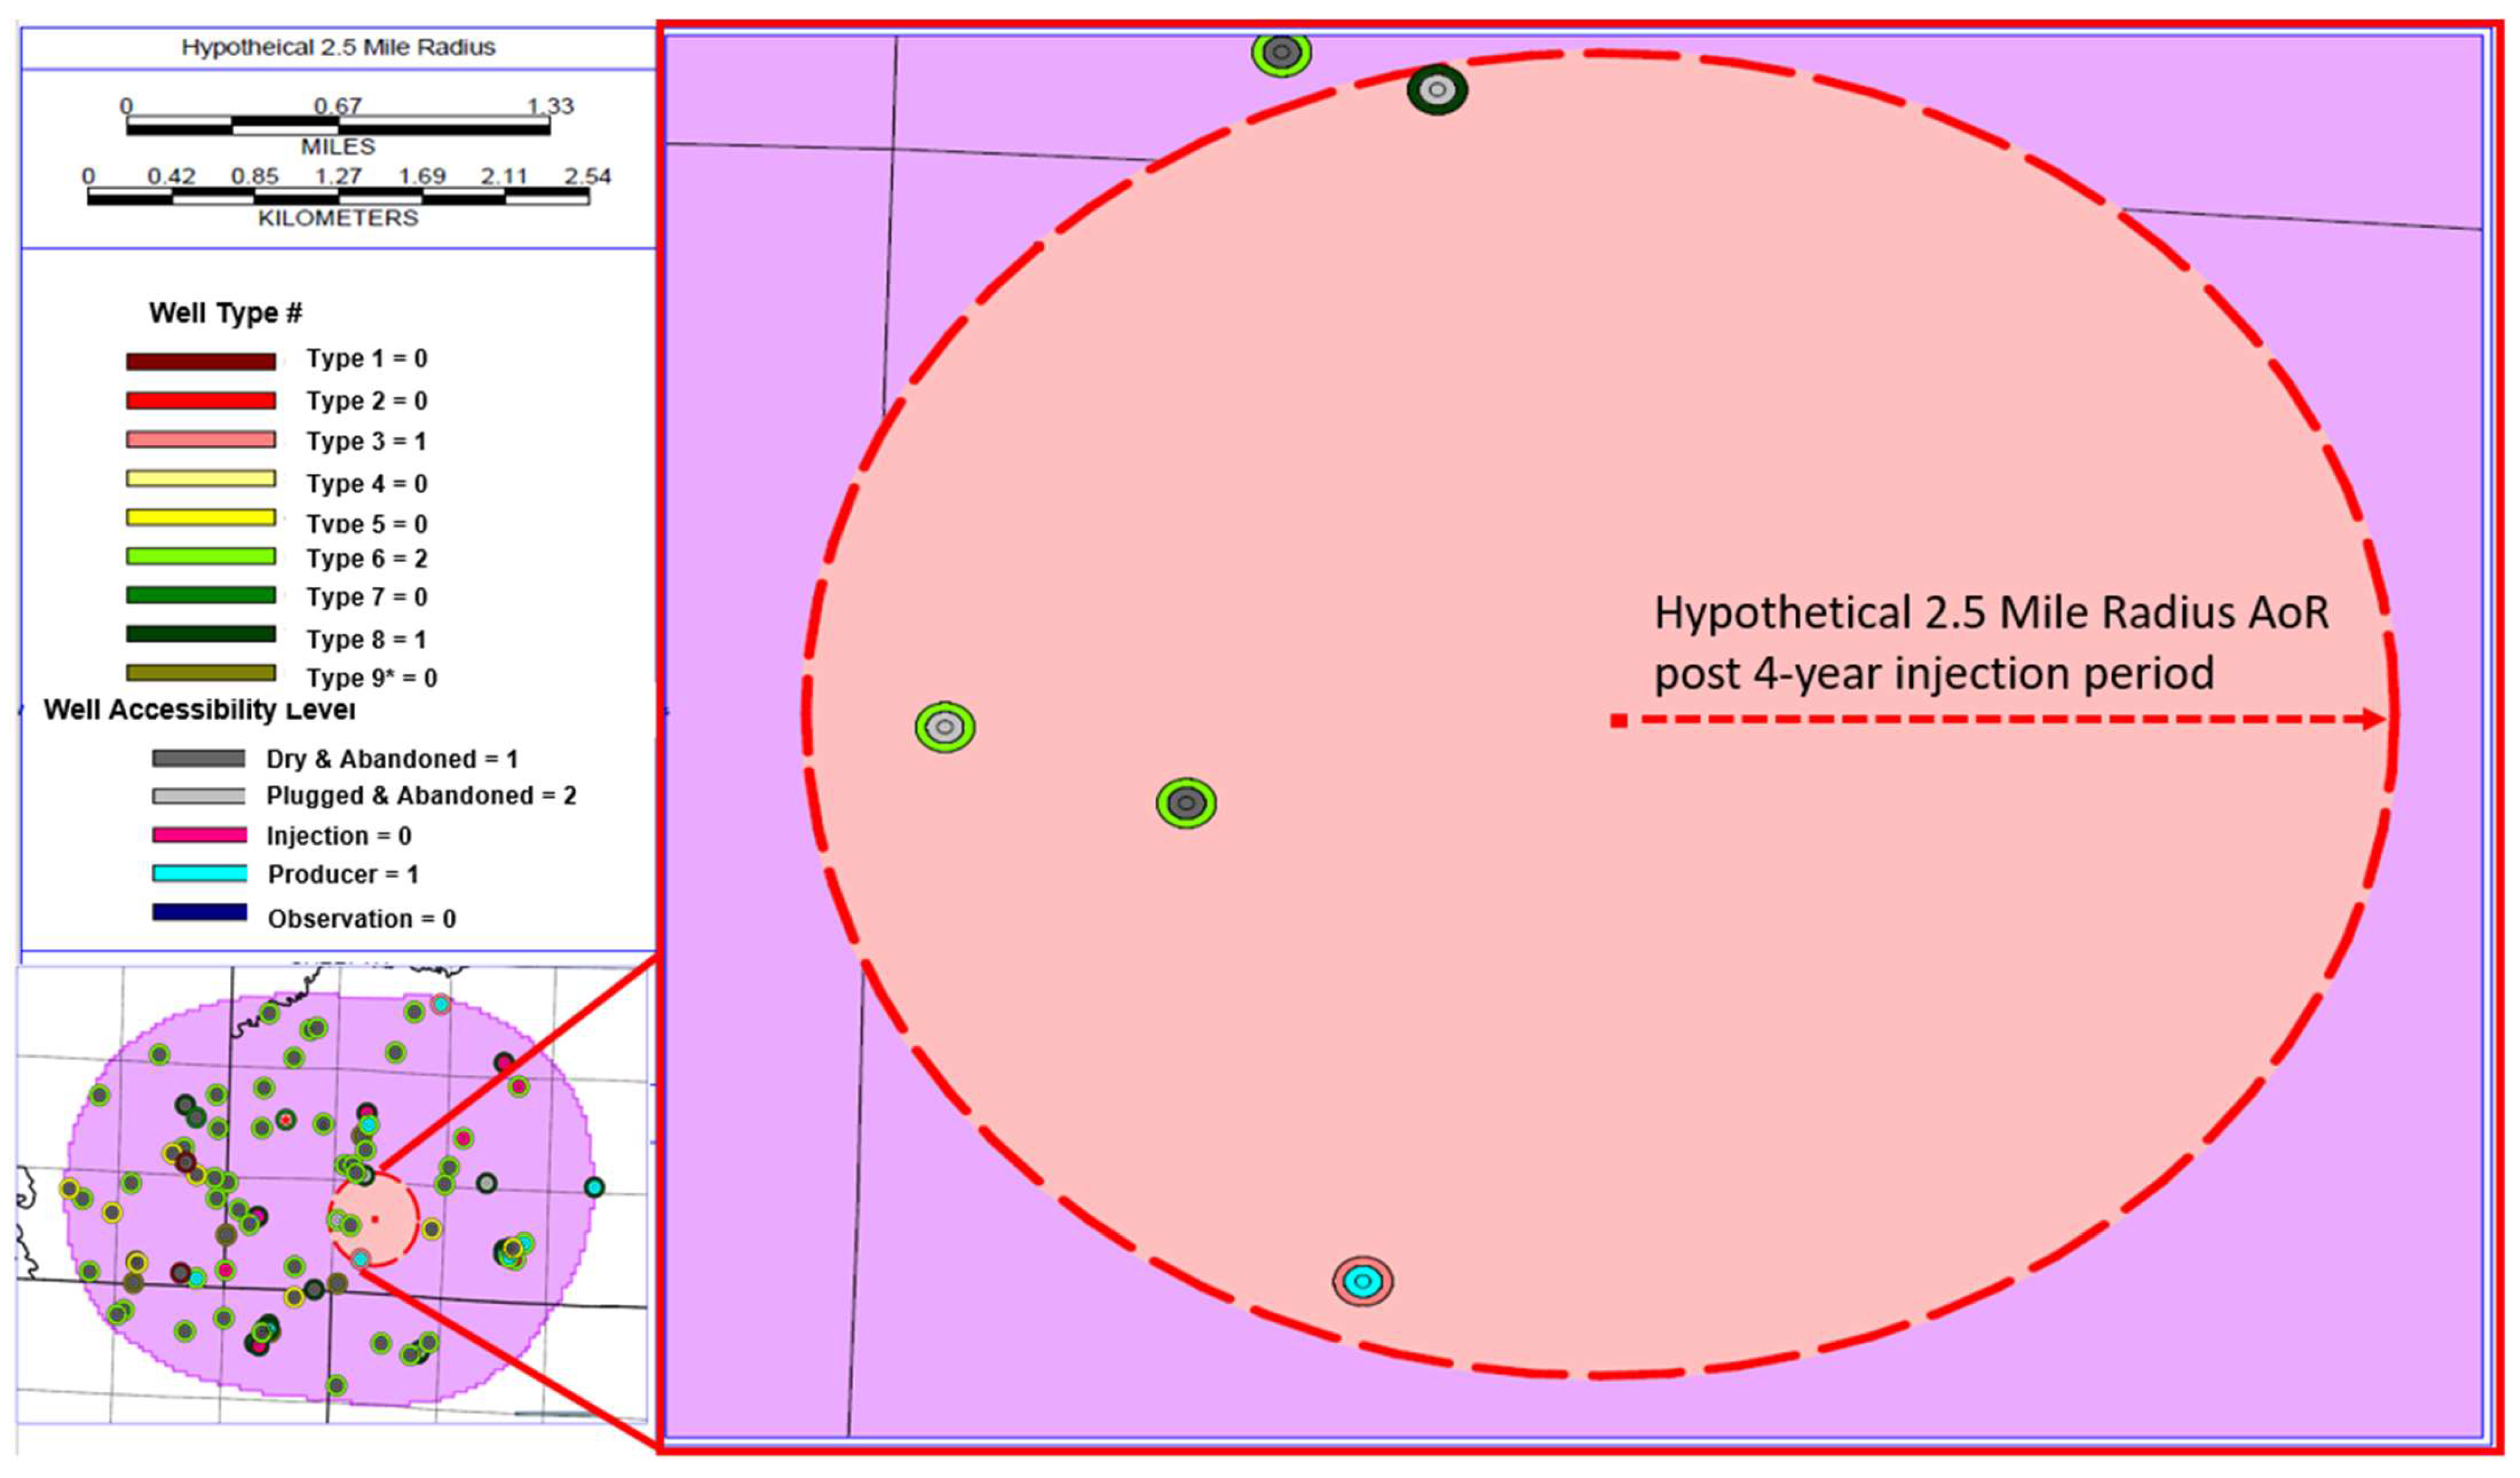
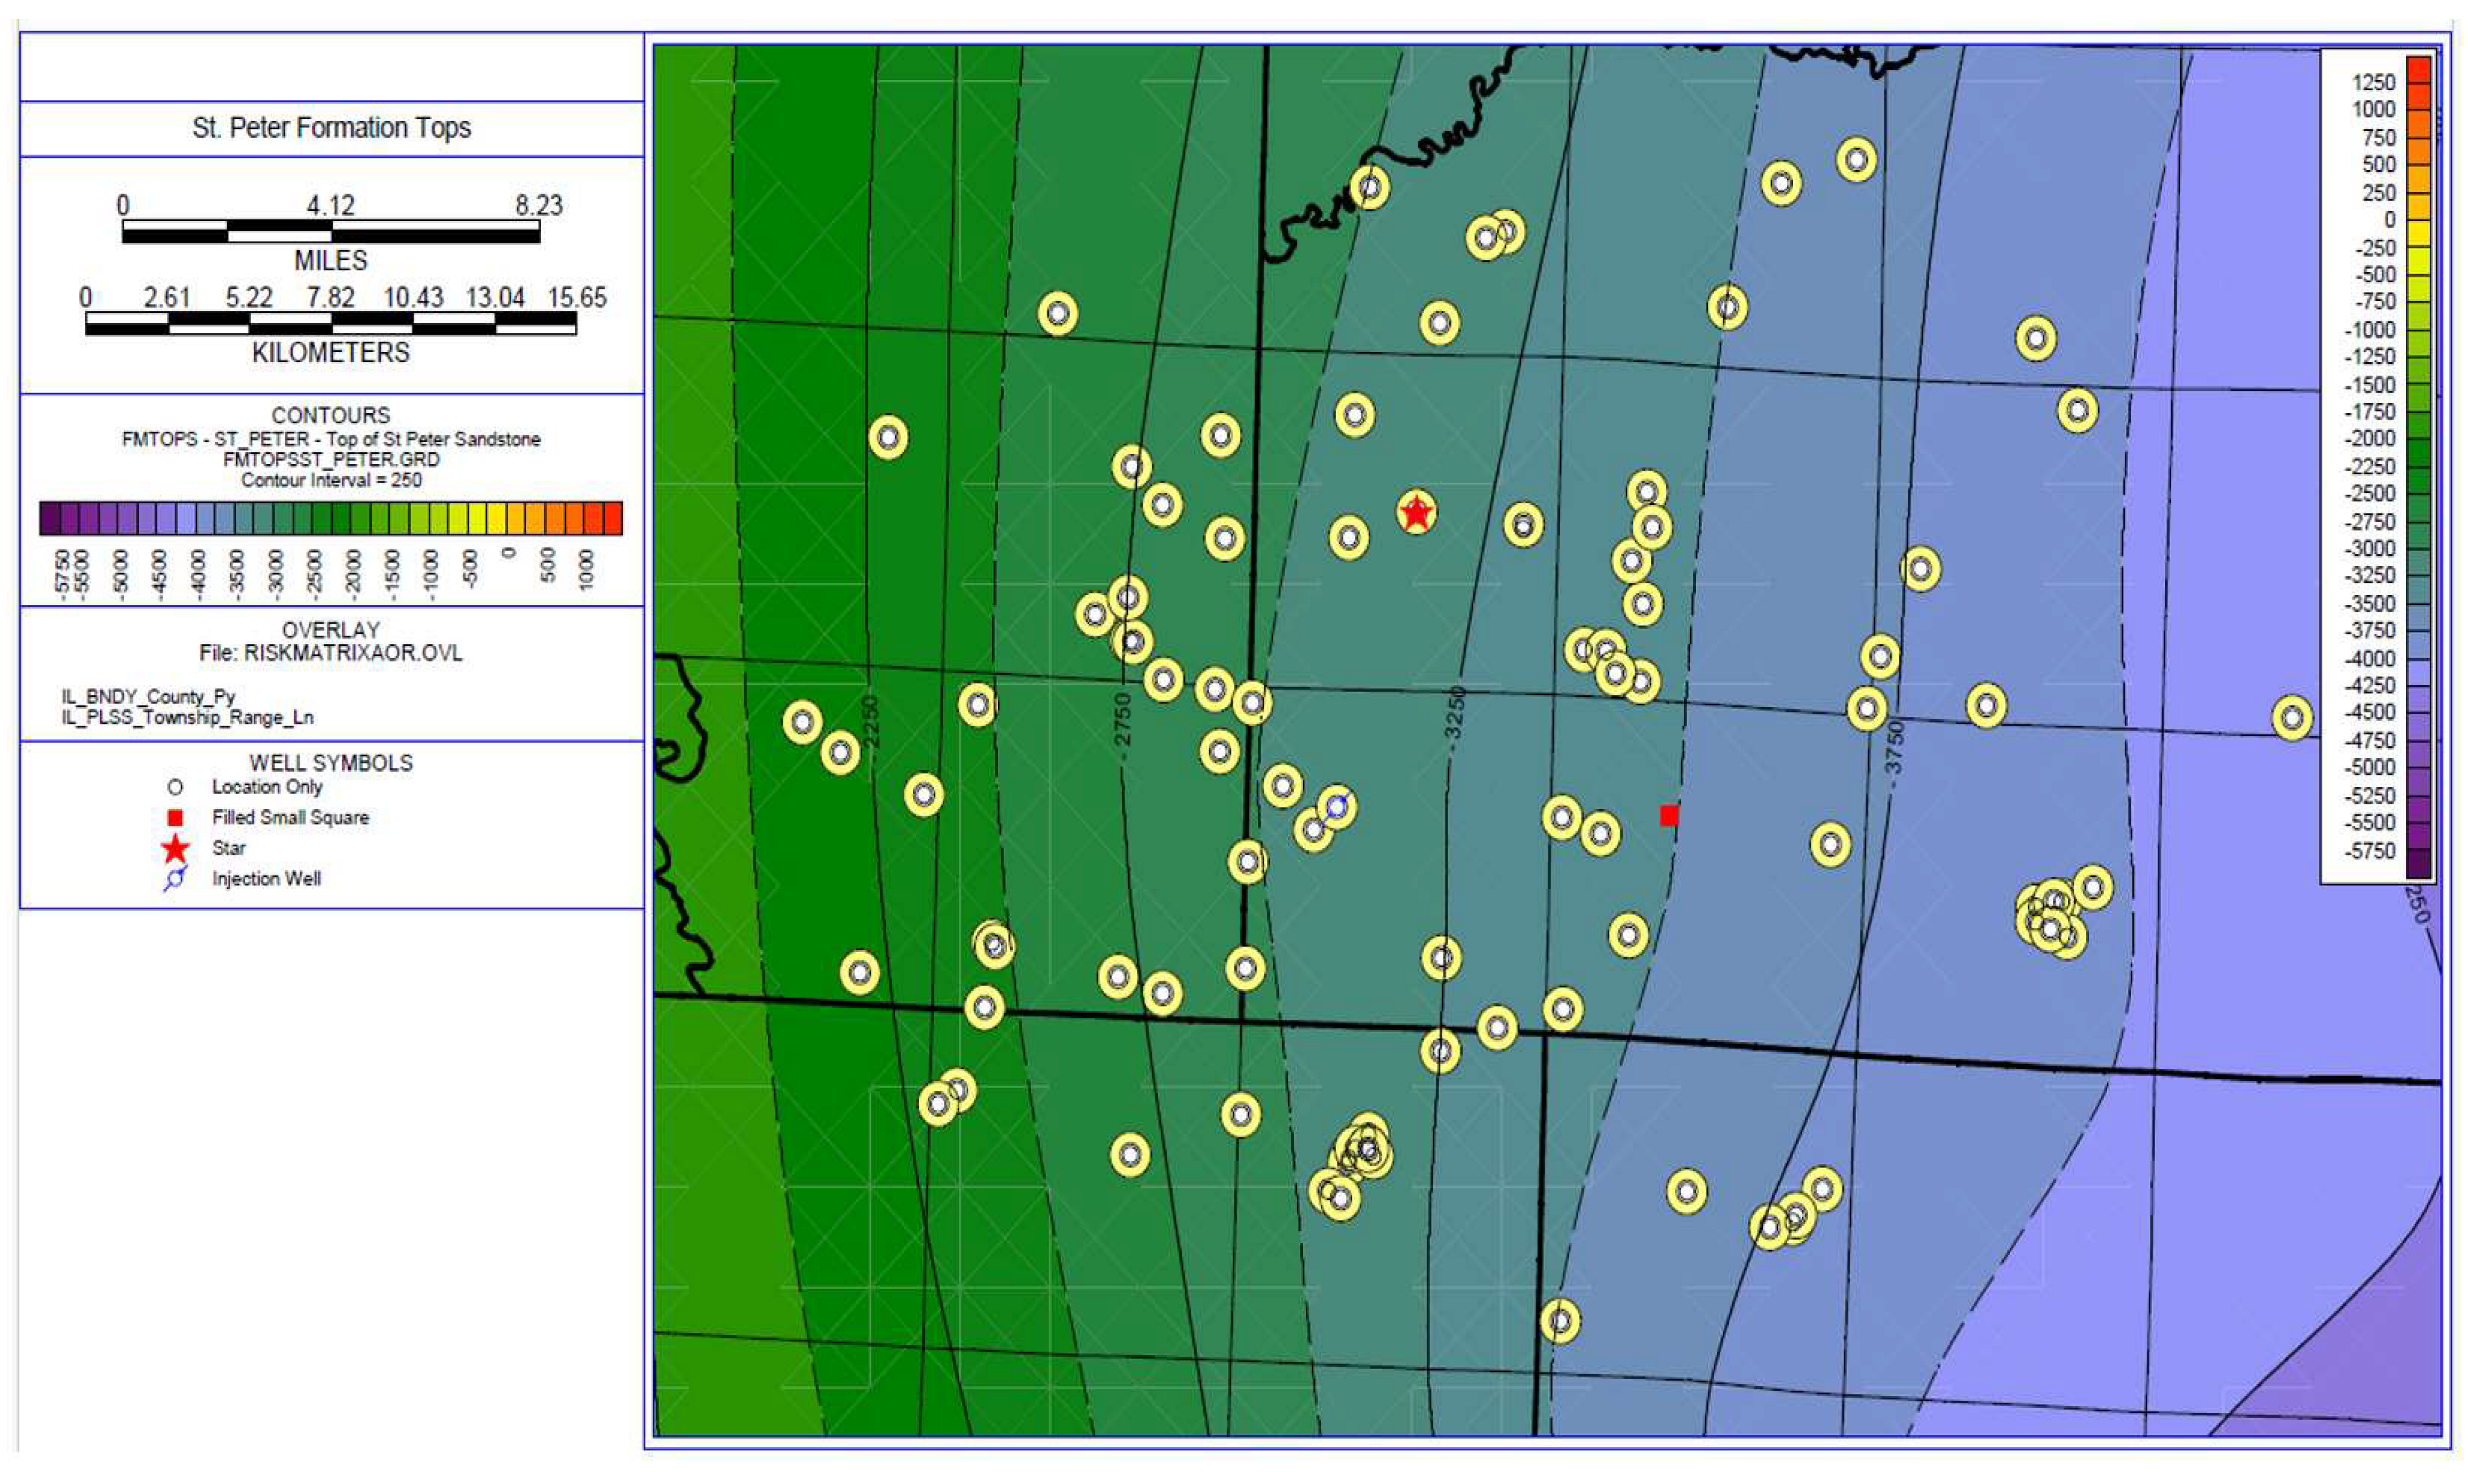
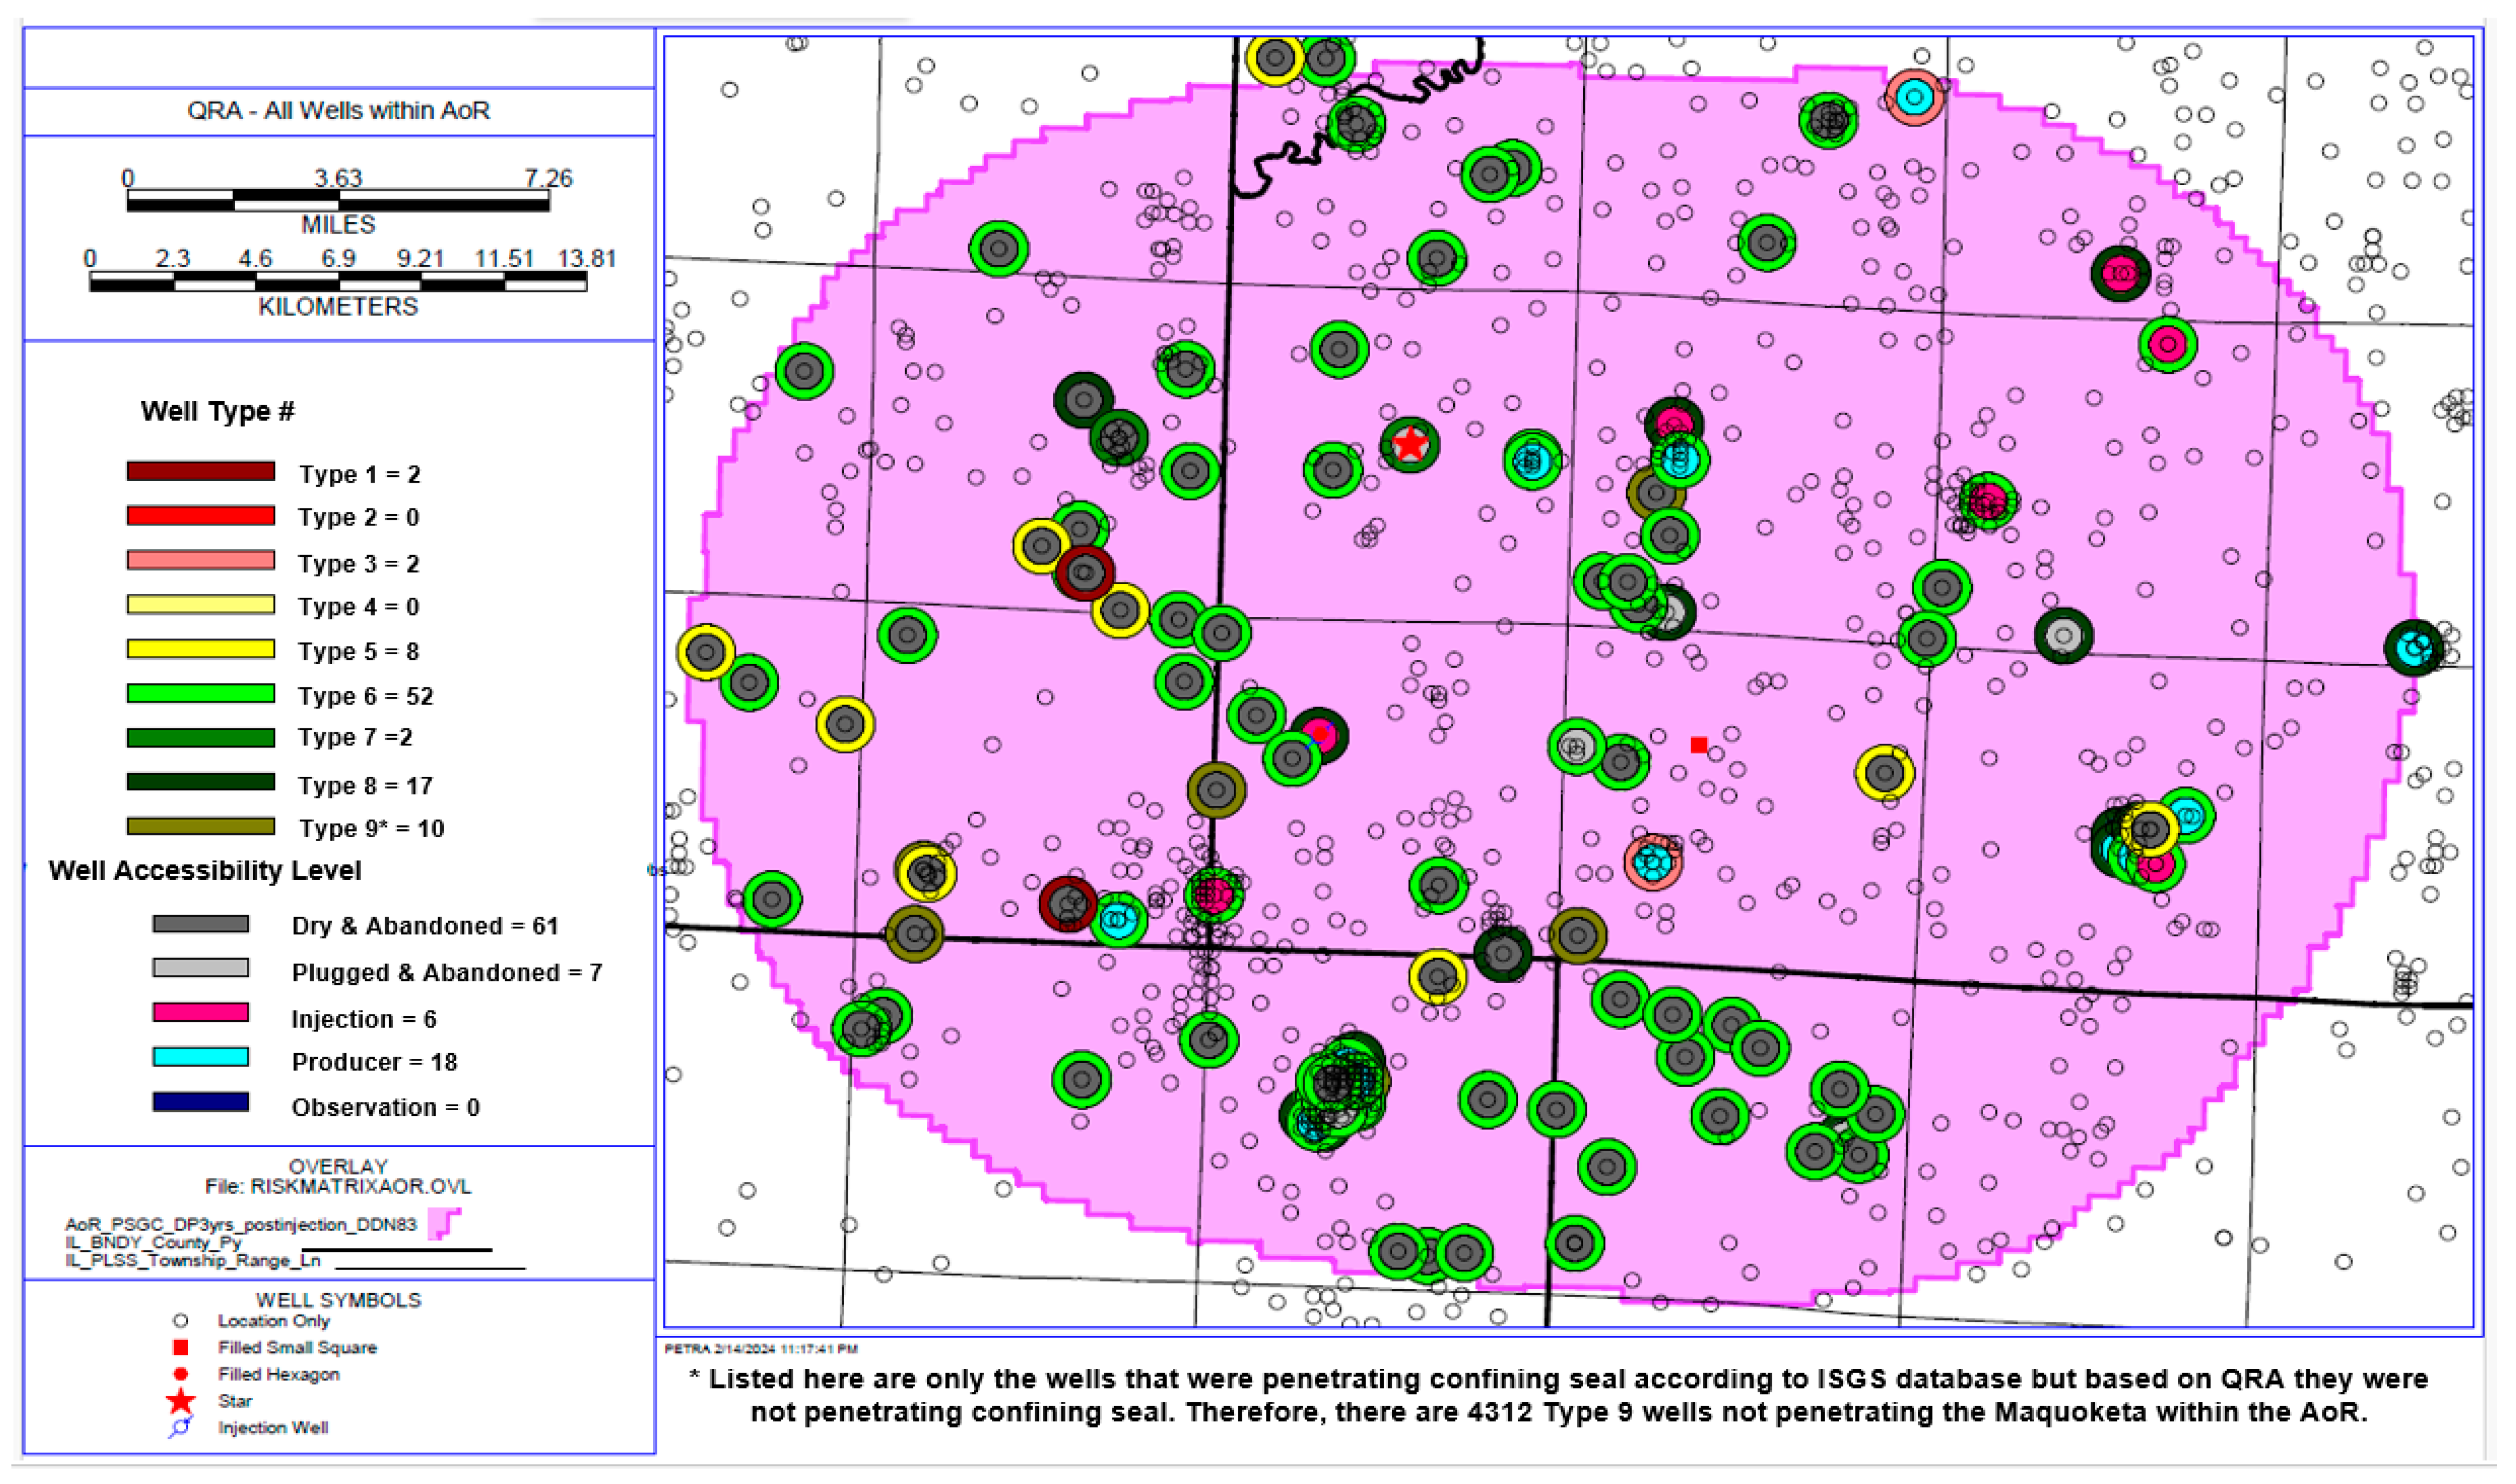
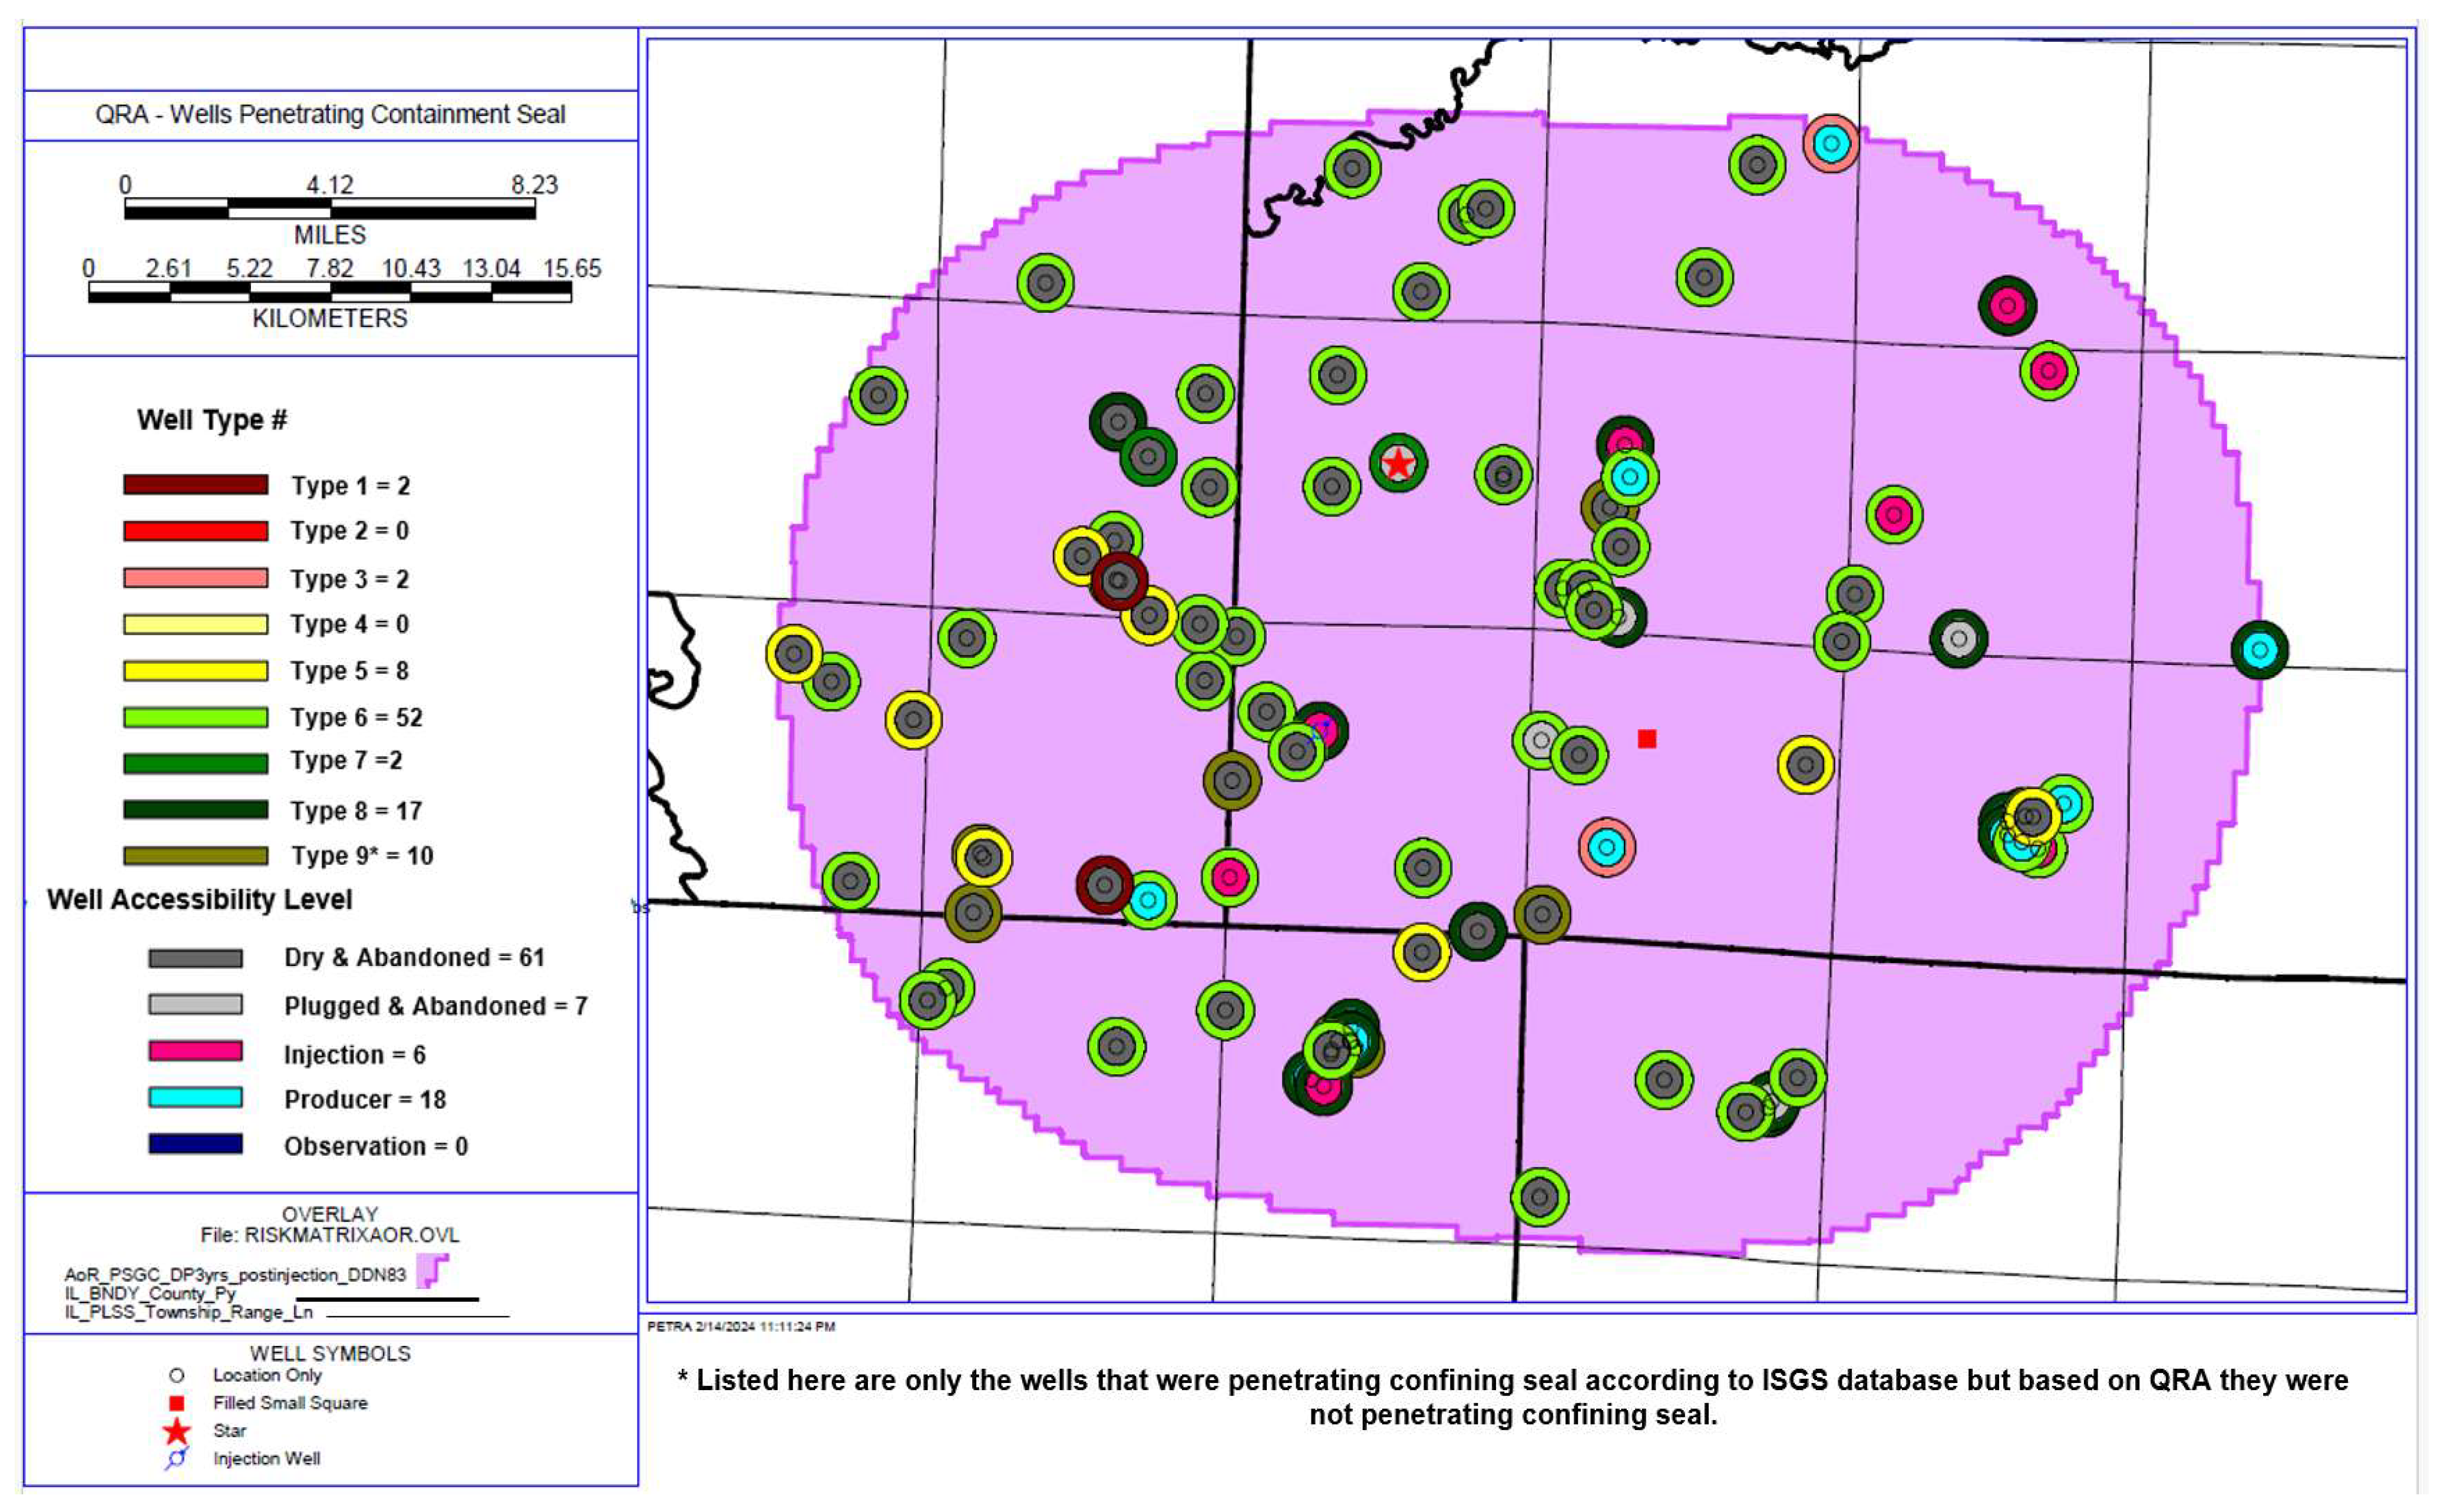
  • AoR filtering: Once the AoR was predicted for a 3-year post-injection differential pressure based on a 20-year injection period using ISGS, the shapefiles of AoR were imported into Petra to identify the wells within the predicted AoR. Once the above-mentioned filters were applied, 94 wells that were penetrating the primary confining seal (i.e., Maquoketa formation) were evaluated using the qualitative risk assessment (QRA) methodology developed by Arbad et al. [45,46].

2.4. Well Record Evaluation

The well reports of 521 wells were manually evaluated to extract the necessary information for QRA, such as casing details, cementing data, well depths, plugging information, etc. The log files were uploaded to IHS Markit Petra™ software (Version 3.13.2) for geospatial mapping, well log correlation, and for estimating formation tops for wells with missing information. The structural elevation of the Maquoketa formation, mapped with the 94 wells penetrating the primary confining seal as per the ISGS database, is shown in Figure 2. The yellow circles represent the wells evaluated using the proposed risk assessment methodology. These wells may serve as a potential leakage pathway for CO2 if their well integrity is compromised. Similarly, Figure 3 shows the structural elevation of the storage complex evaluated for this site, i.e., the St. Peter Sandstone. The red star on all the maps (Figure 2 and Figure 3) denotes the LG1 well, and the red solid box indicates the hypothetical injection well location.

3. Results

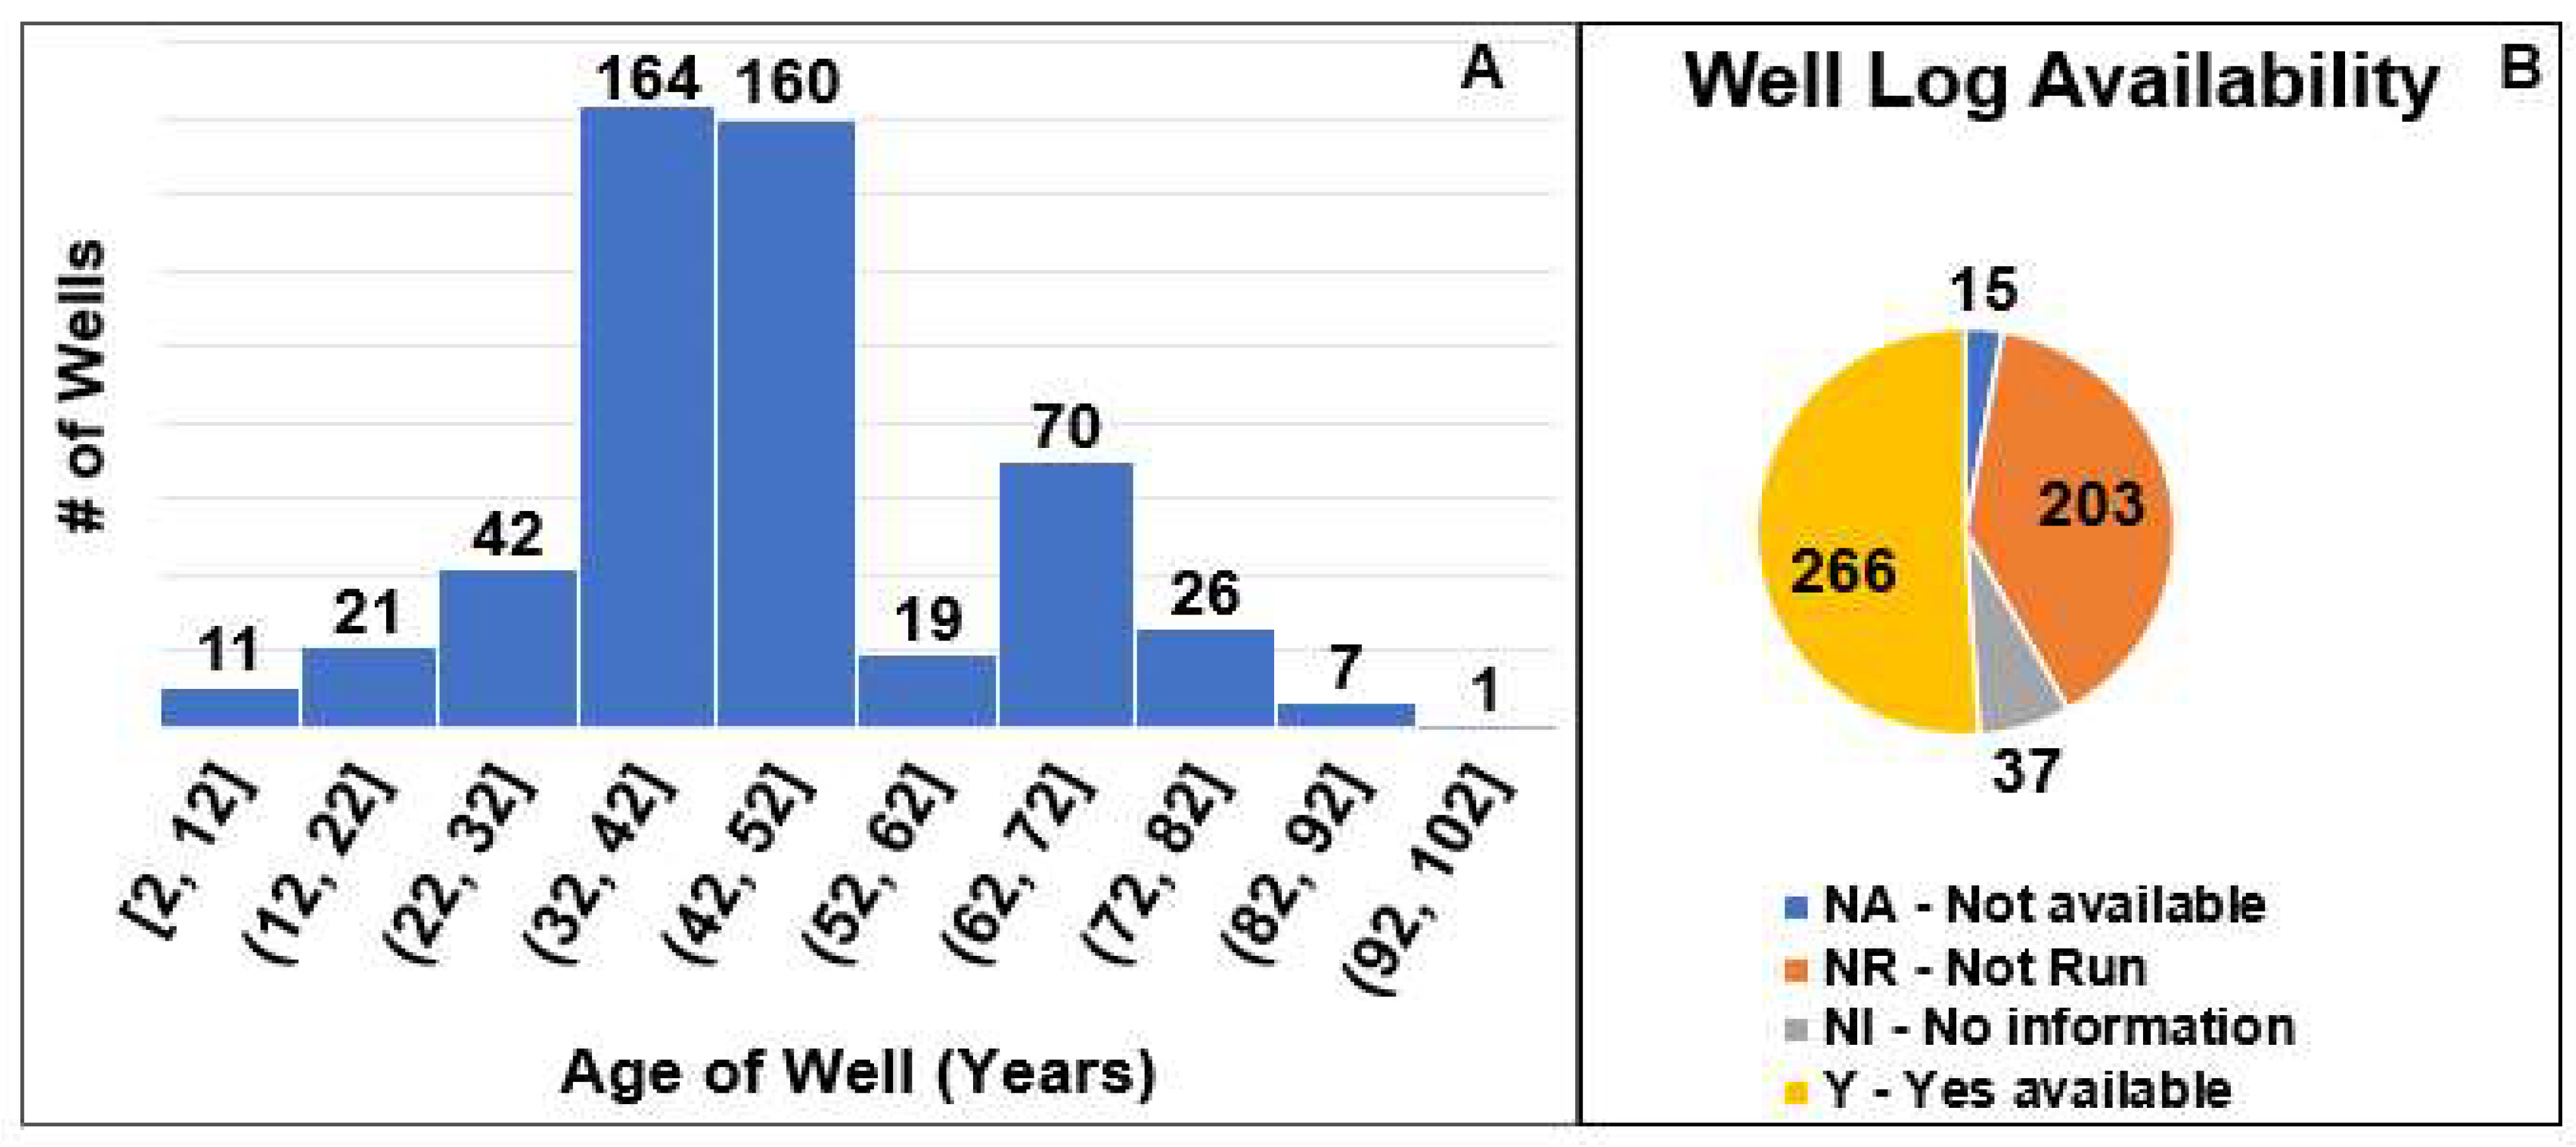
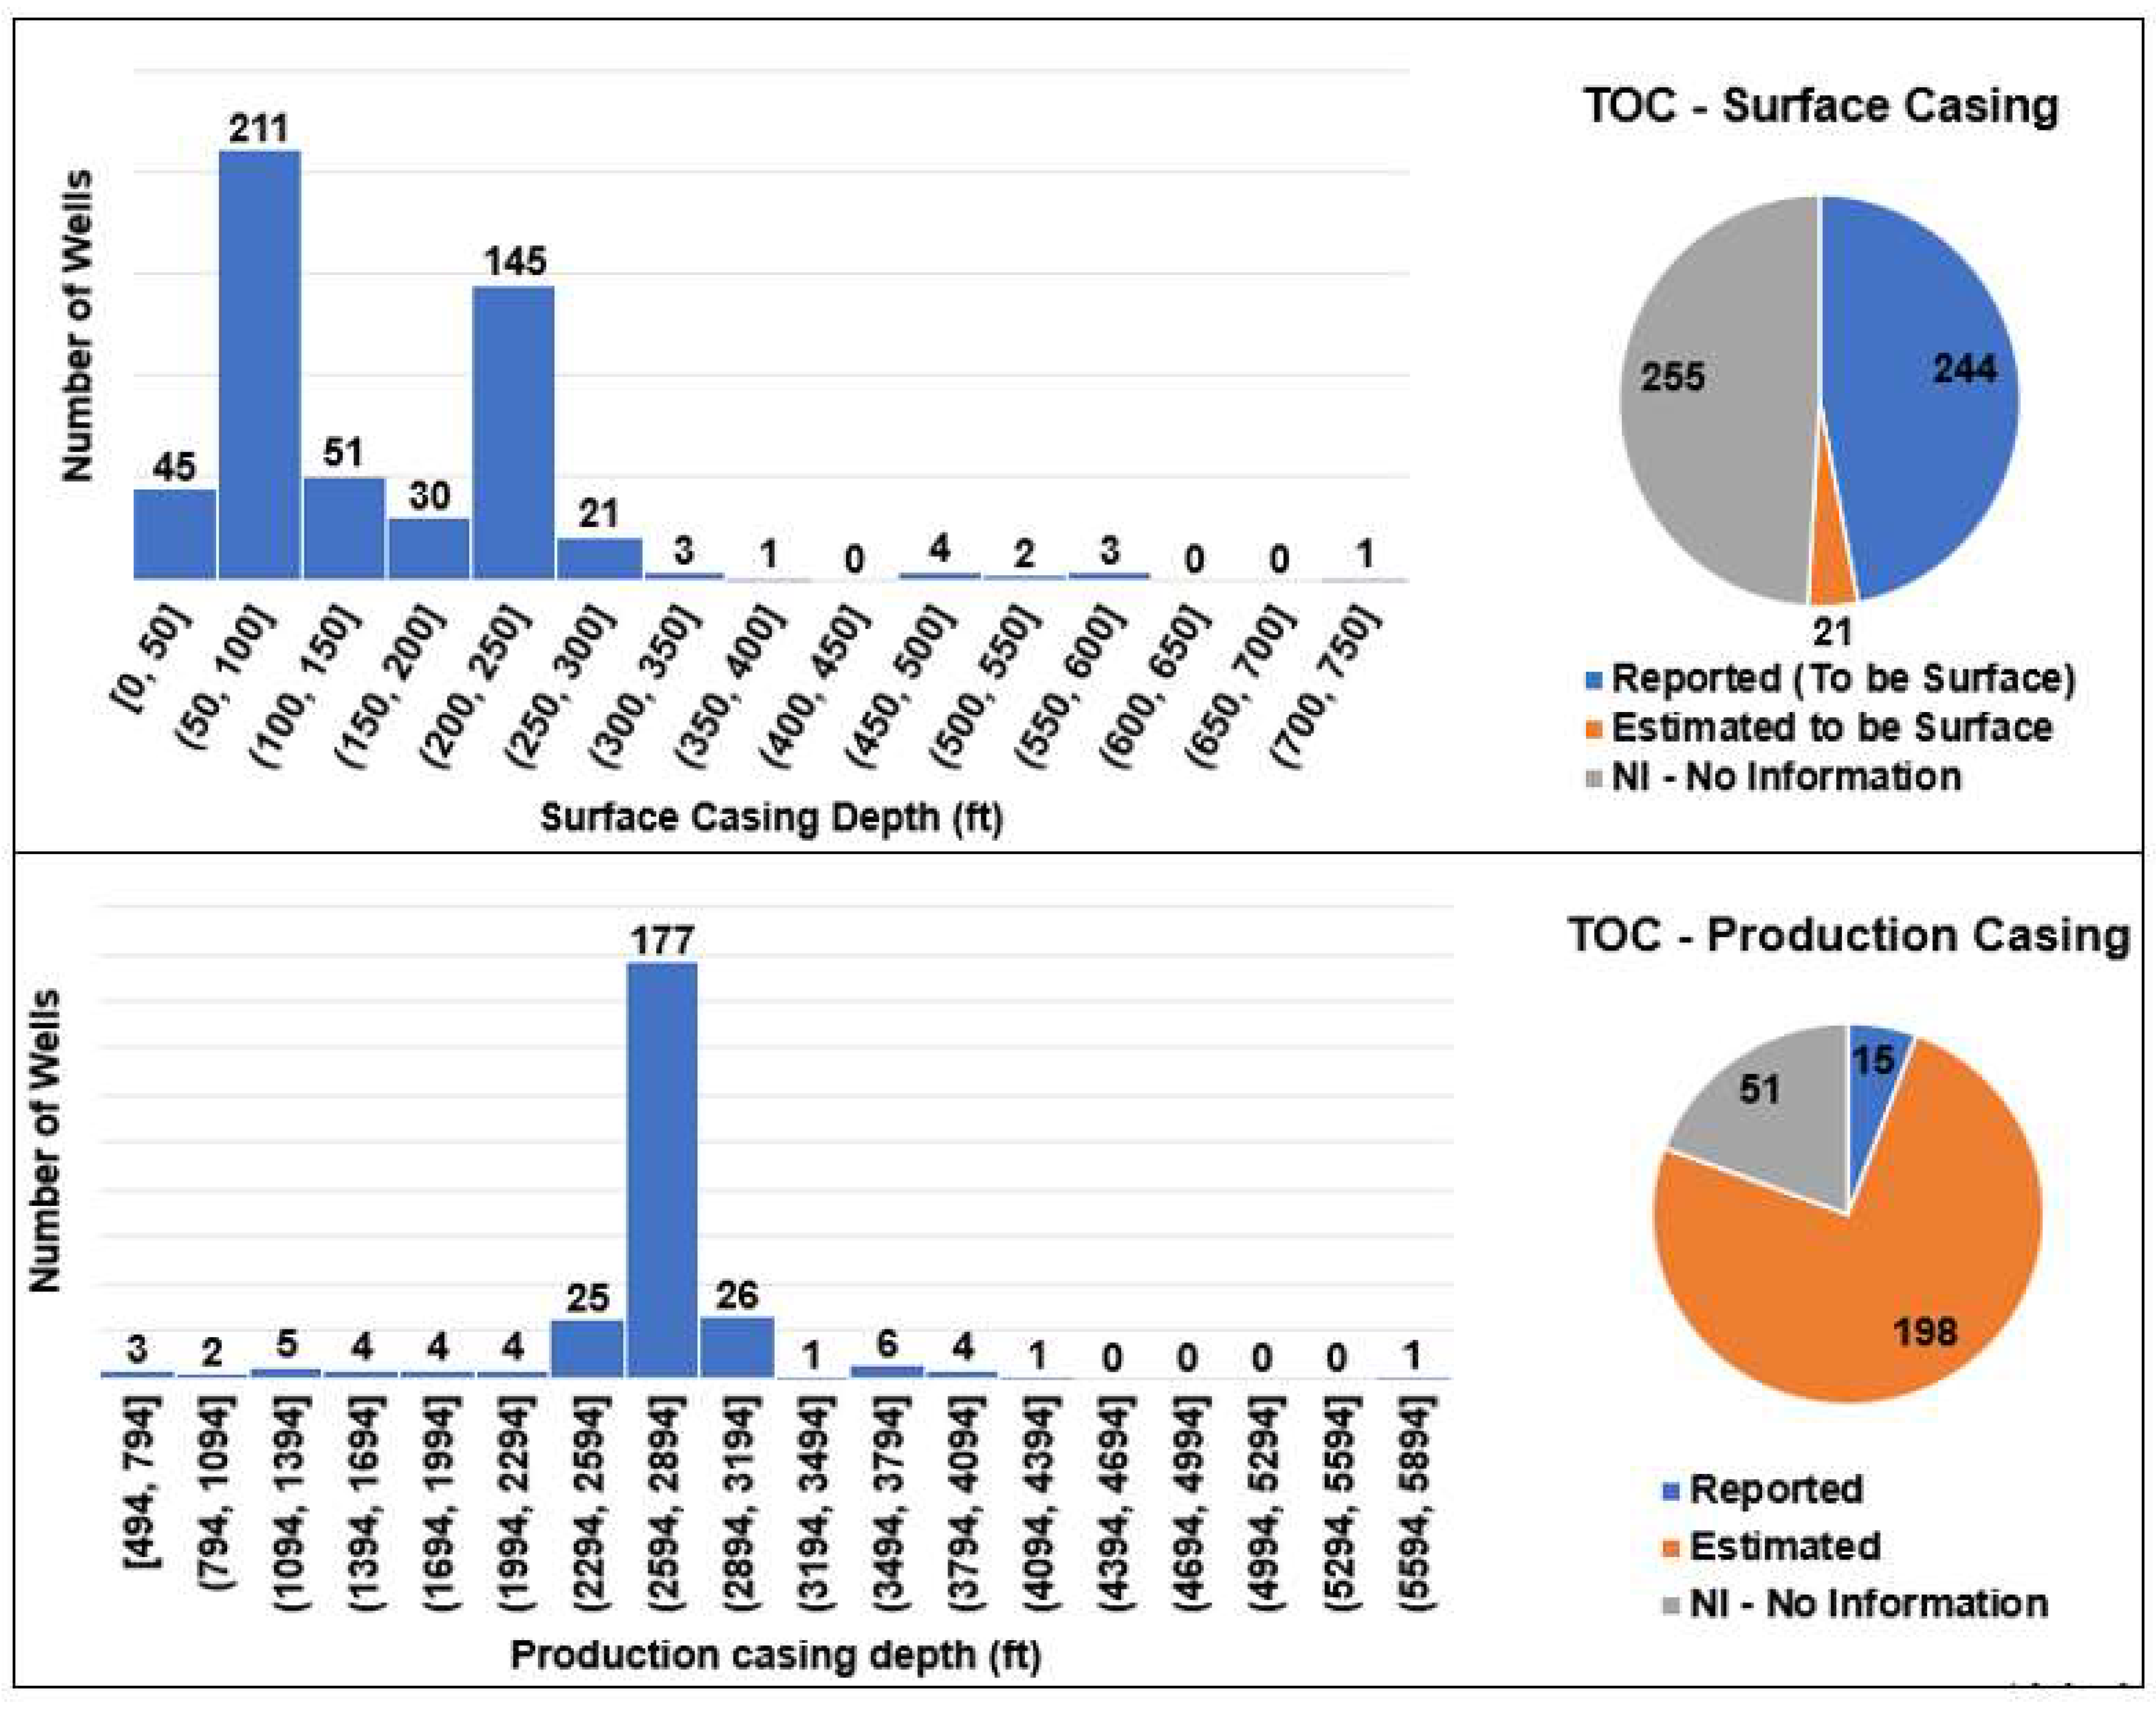
3.1. Summary of Wells Evaluated

Based on the depth and formation code filtering mentioned in the previous section, 521 wells were thoroughly evaluated, and a QRA was performed. Figure 4A shows the age distribution of these 521 wells, while Figure 4B shows the availability of well logs. Most of the wells were between 32 and 52 years old, with 70 wells aged between 62 and 72 years. These wells were drilled and/or plugged before the standardization of plugging practices. Approximately 266 wells had electric logs available on the ISGS website, and 203 wells did not run electric logs as mentioned in their well reports. Similarly, the logs of 15 wells were missing, and 37 wells did not mention anything about well logs. Out of the 521 wells, 8 wells had three-hole sections (surface, intermediate, and production), while the rest had just two-hole sections (surface and production). The statistics regarding the depths of hole sections and the top of cement (TOC) are presented in Figure 5. Cementing details were inconsistently reported for the wells under evaluation. The authors contacted a cementing service provider to gain additional insights into the cement slurries, such as Class A Portland cement, used to cement most wells (yield—1.18 ft3/sack). If the top of cement (TOC) was not reported in the well reports, then it was estimated by multiplying the yield with the number of cement sacks and dividing the product by the annular capacity.
Out of 521 wells, 327 were plugged and abandoned status or dry and abandoned status, and plugging reports were available for 311 wells. Since some of the wells were plugged before the establishment of plugging standards, the number of plugs within each well varied, as described in Table 3. The length of individual plugs for wells with one, two, and three plugs is depicted in Figure 6.

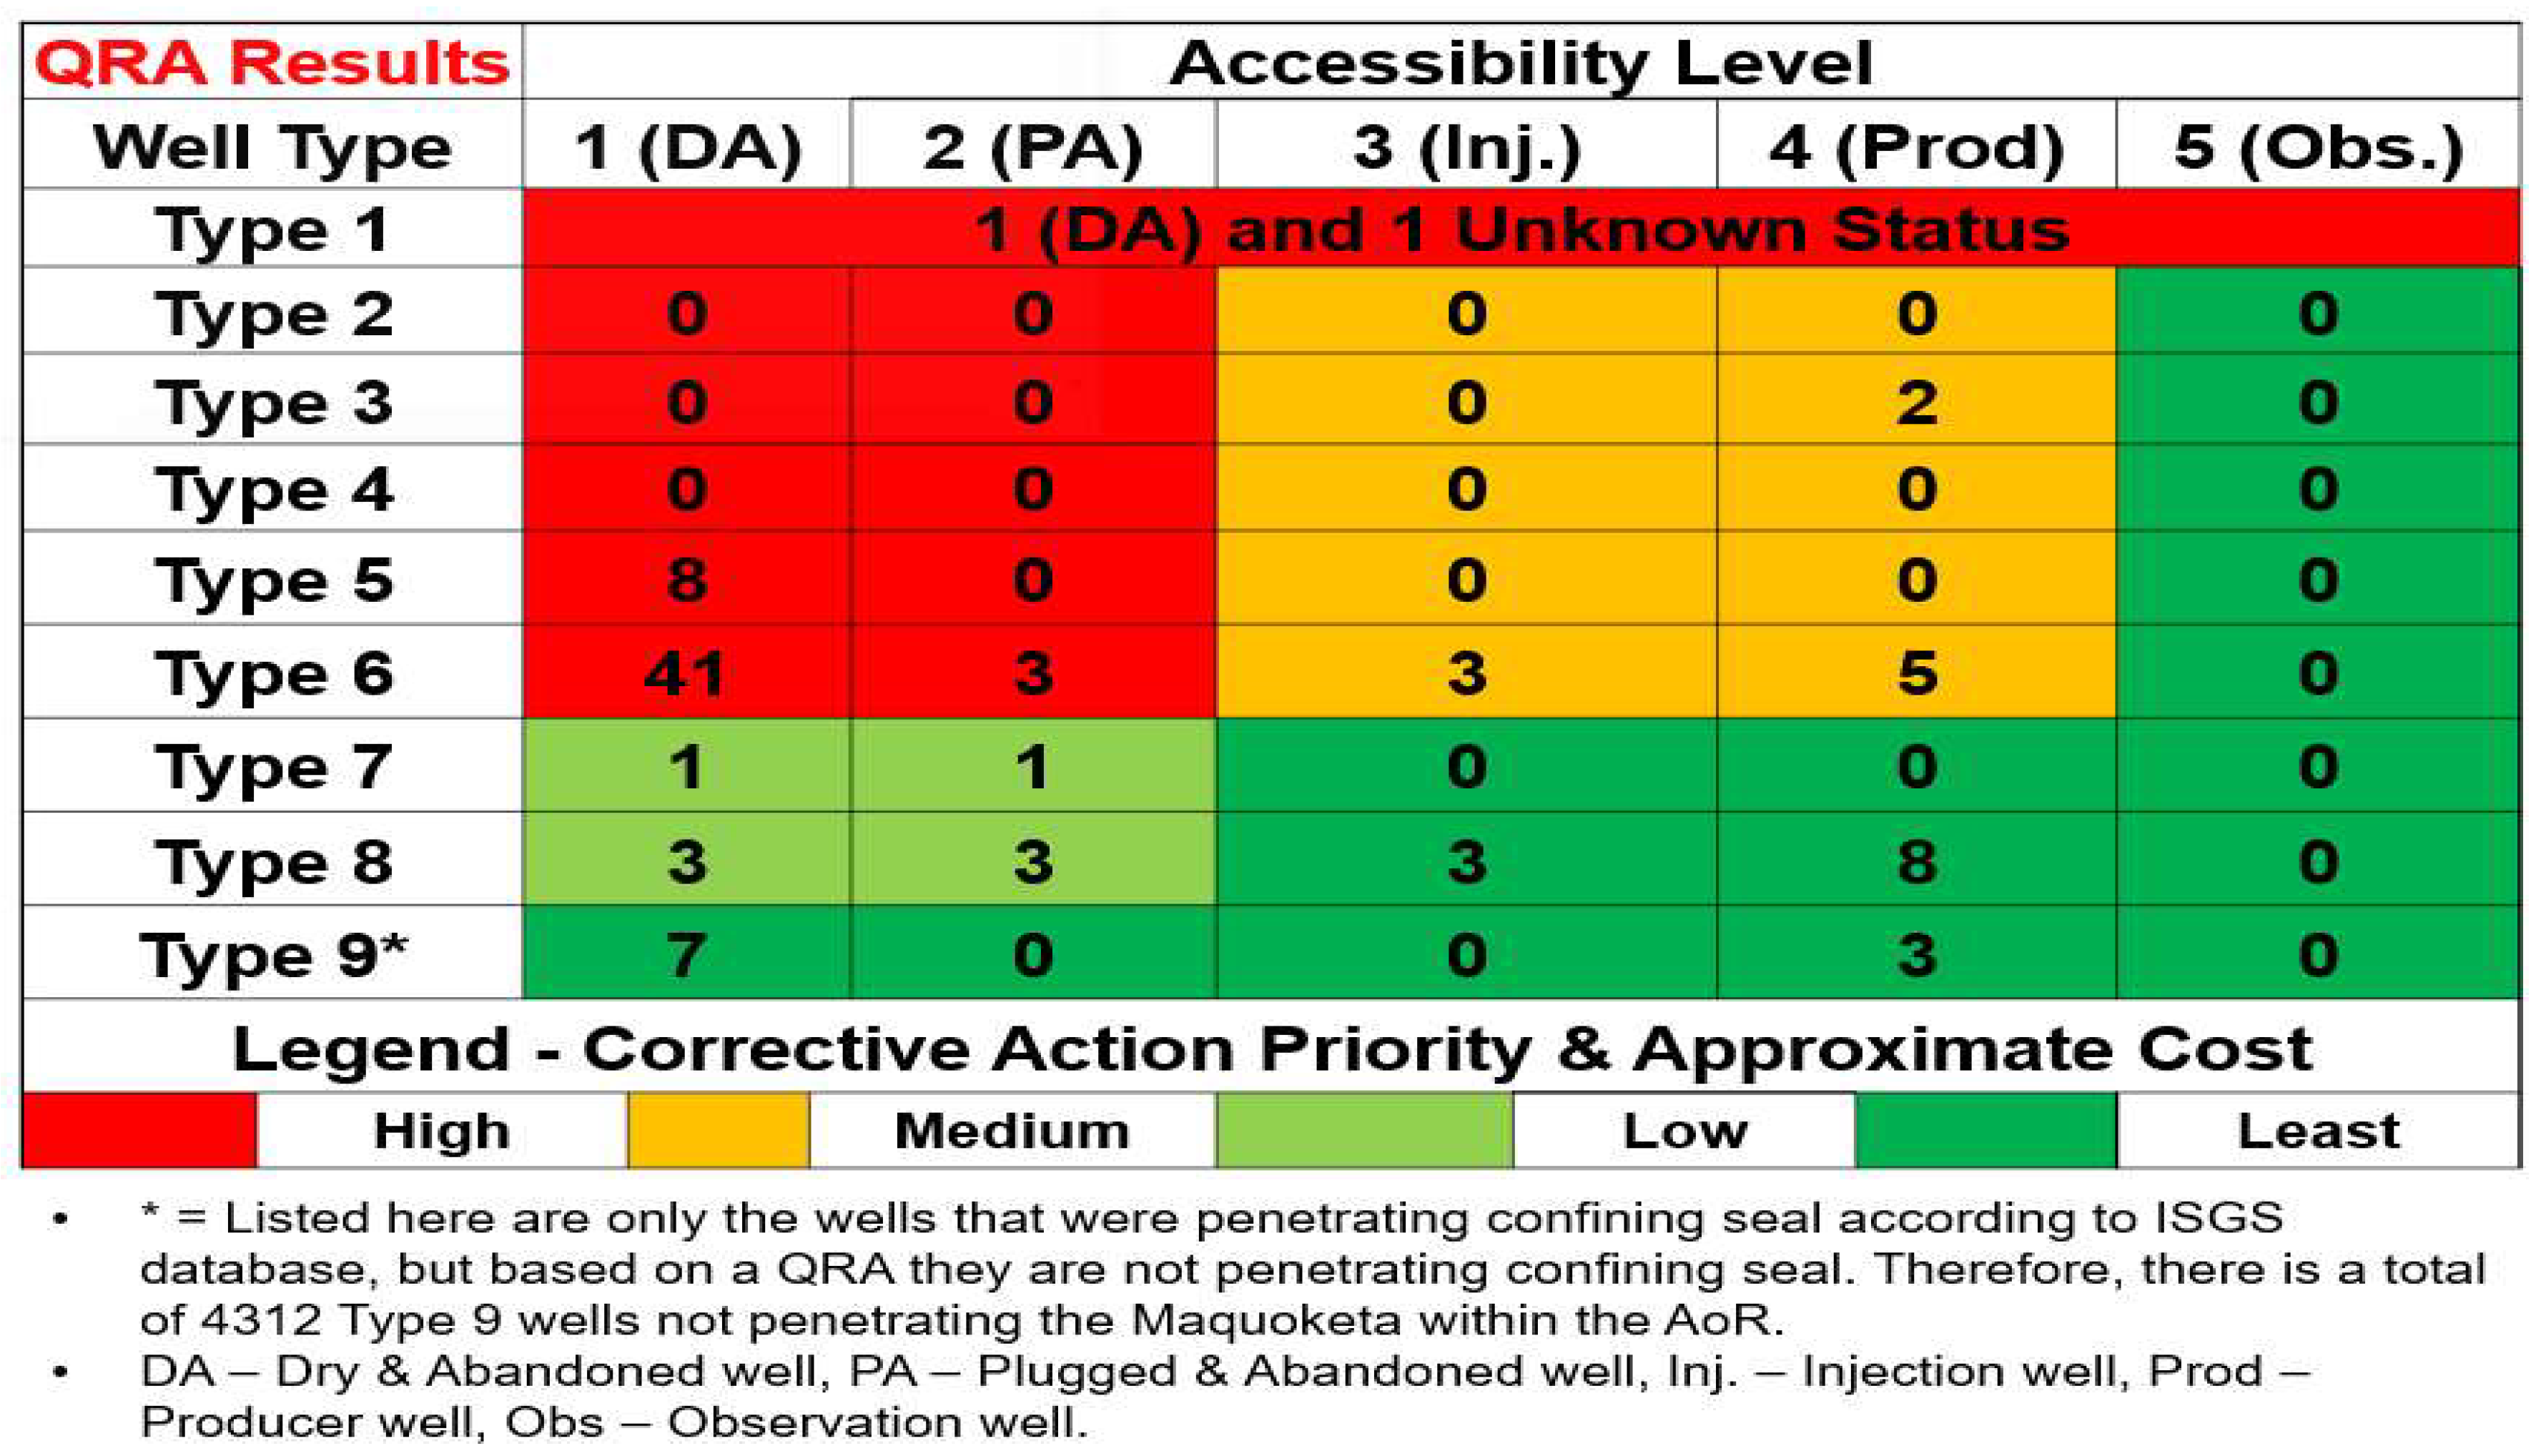
3.2. Qualitative Risk Assessment Summary

Out of 521 wells, only 94 wells within the AoR penetrated the primary confining seal, and their QRA results are presented in Figure 7. Upon detailed investigation, 85 wells penetrated the primary confining seal, and 4 wells reached the storage reservoir. There were two Type 1 wells, i.e., undocumented wells; zero Type 2 and Type 4 wells, two Type 3 wells, eight Type 5 wells, and fifty-two Type 6 wells. Fifty-four wells had a high priority for corrective action due to the lack of documentation and/or uncertainty of barriers across the primary confining seal, while ten wells had medium priority as their status was active. Twenty-nine wells had a low or the least priority for corrective action as they did not penetrate the primary confining seal. There was a total of 4312 Type 9 wells (not penetrating the primary confining seal) within the AoR, including the 10 listed in Figure 7. However, the 10 listed in Figure 7 were reported as penetrating the primary confining seal according to the ISGS database, but they were not actually penetrating the primary confining seal based on the authors’ evaluation of the well logs and regional stratigraphy.
The combined map with the risk assessment of all the wells within the AoR of the LG 1 site is displayed in Figure 8. The inner circles are color-coded according to their accessibility, and the outer circles are color-coded based on the well type. The hollow black circles represent shallow wells that did not penetrate the confining zones and were filtered out. Figure 9 illustrates the risk assessment of the 94 wells that penetrated the primary confining seal according to the ISGS database. The pink polygon in Figure 8 and Figure 9 represents the pressure front of the St. Peter Sandstone (storage reservoir) after 20 years of CO2 injection and a 3-year post-injection period, indicating the maximum size of the AoR. The red star denotes the LG1 well, and the red solid box indicates the hypothetical injection well location. This type of map facilitates the easy identification of high-risk wells and suggests phased corrective actions if there are numerous wells requiring remedial actions. Additional information, such as faults, surface bodies of water, springs, mines, quarries, water wells, territory boundaries, and roads, could also be displayed on the maps using their shapefiles and Geographic Information System (GIS) software. However, this information is not shown in Figure 8 and Figure 9 to avoid confusion and to highlight the identification of risky wells with respect to the hypothetical injection location. Presently, the map component of the UIC Class VI Permit application submitted to the US EPA merely conveys the surface location of all wellbores, faults, surface bodies of water, springs, mines, quarries, water wells, territory boundaries, and roads within the AoR. The proposed categorized mapping of risky legacy wells provides much more information about the geological penetrations and protections than solely the surface locations submitted to the US EPA.

4. Discussion

4.1. Salient Features of Wells within AoR

In Appendix A, one example of each well type is discussed in detail. However, the well schematics of all the wells penetrating the primary confining seal were drawn, and leakage pathways were identified. The absence of plugging reports for Type 5 wells suggests that had these reports been accessible, these wells could have either retained their Type 5 classification or potentially transitioned to less risky categories, such as Type 6 or 8, contingent upon their evaluations. Similarly, the well reports for both Type 3 wells mention that they were plugged back to the TD and produced from a shallower depth (Devonian formation), but they failed to report the plugging details. These Type 3 wells could transition to the less risky category of Type 7 contingent upon their evaluations.

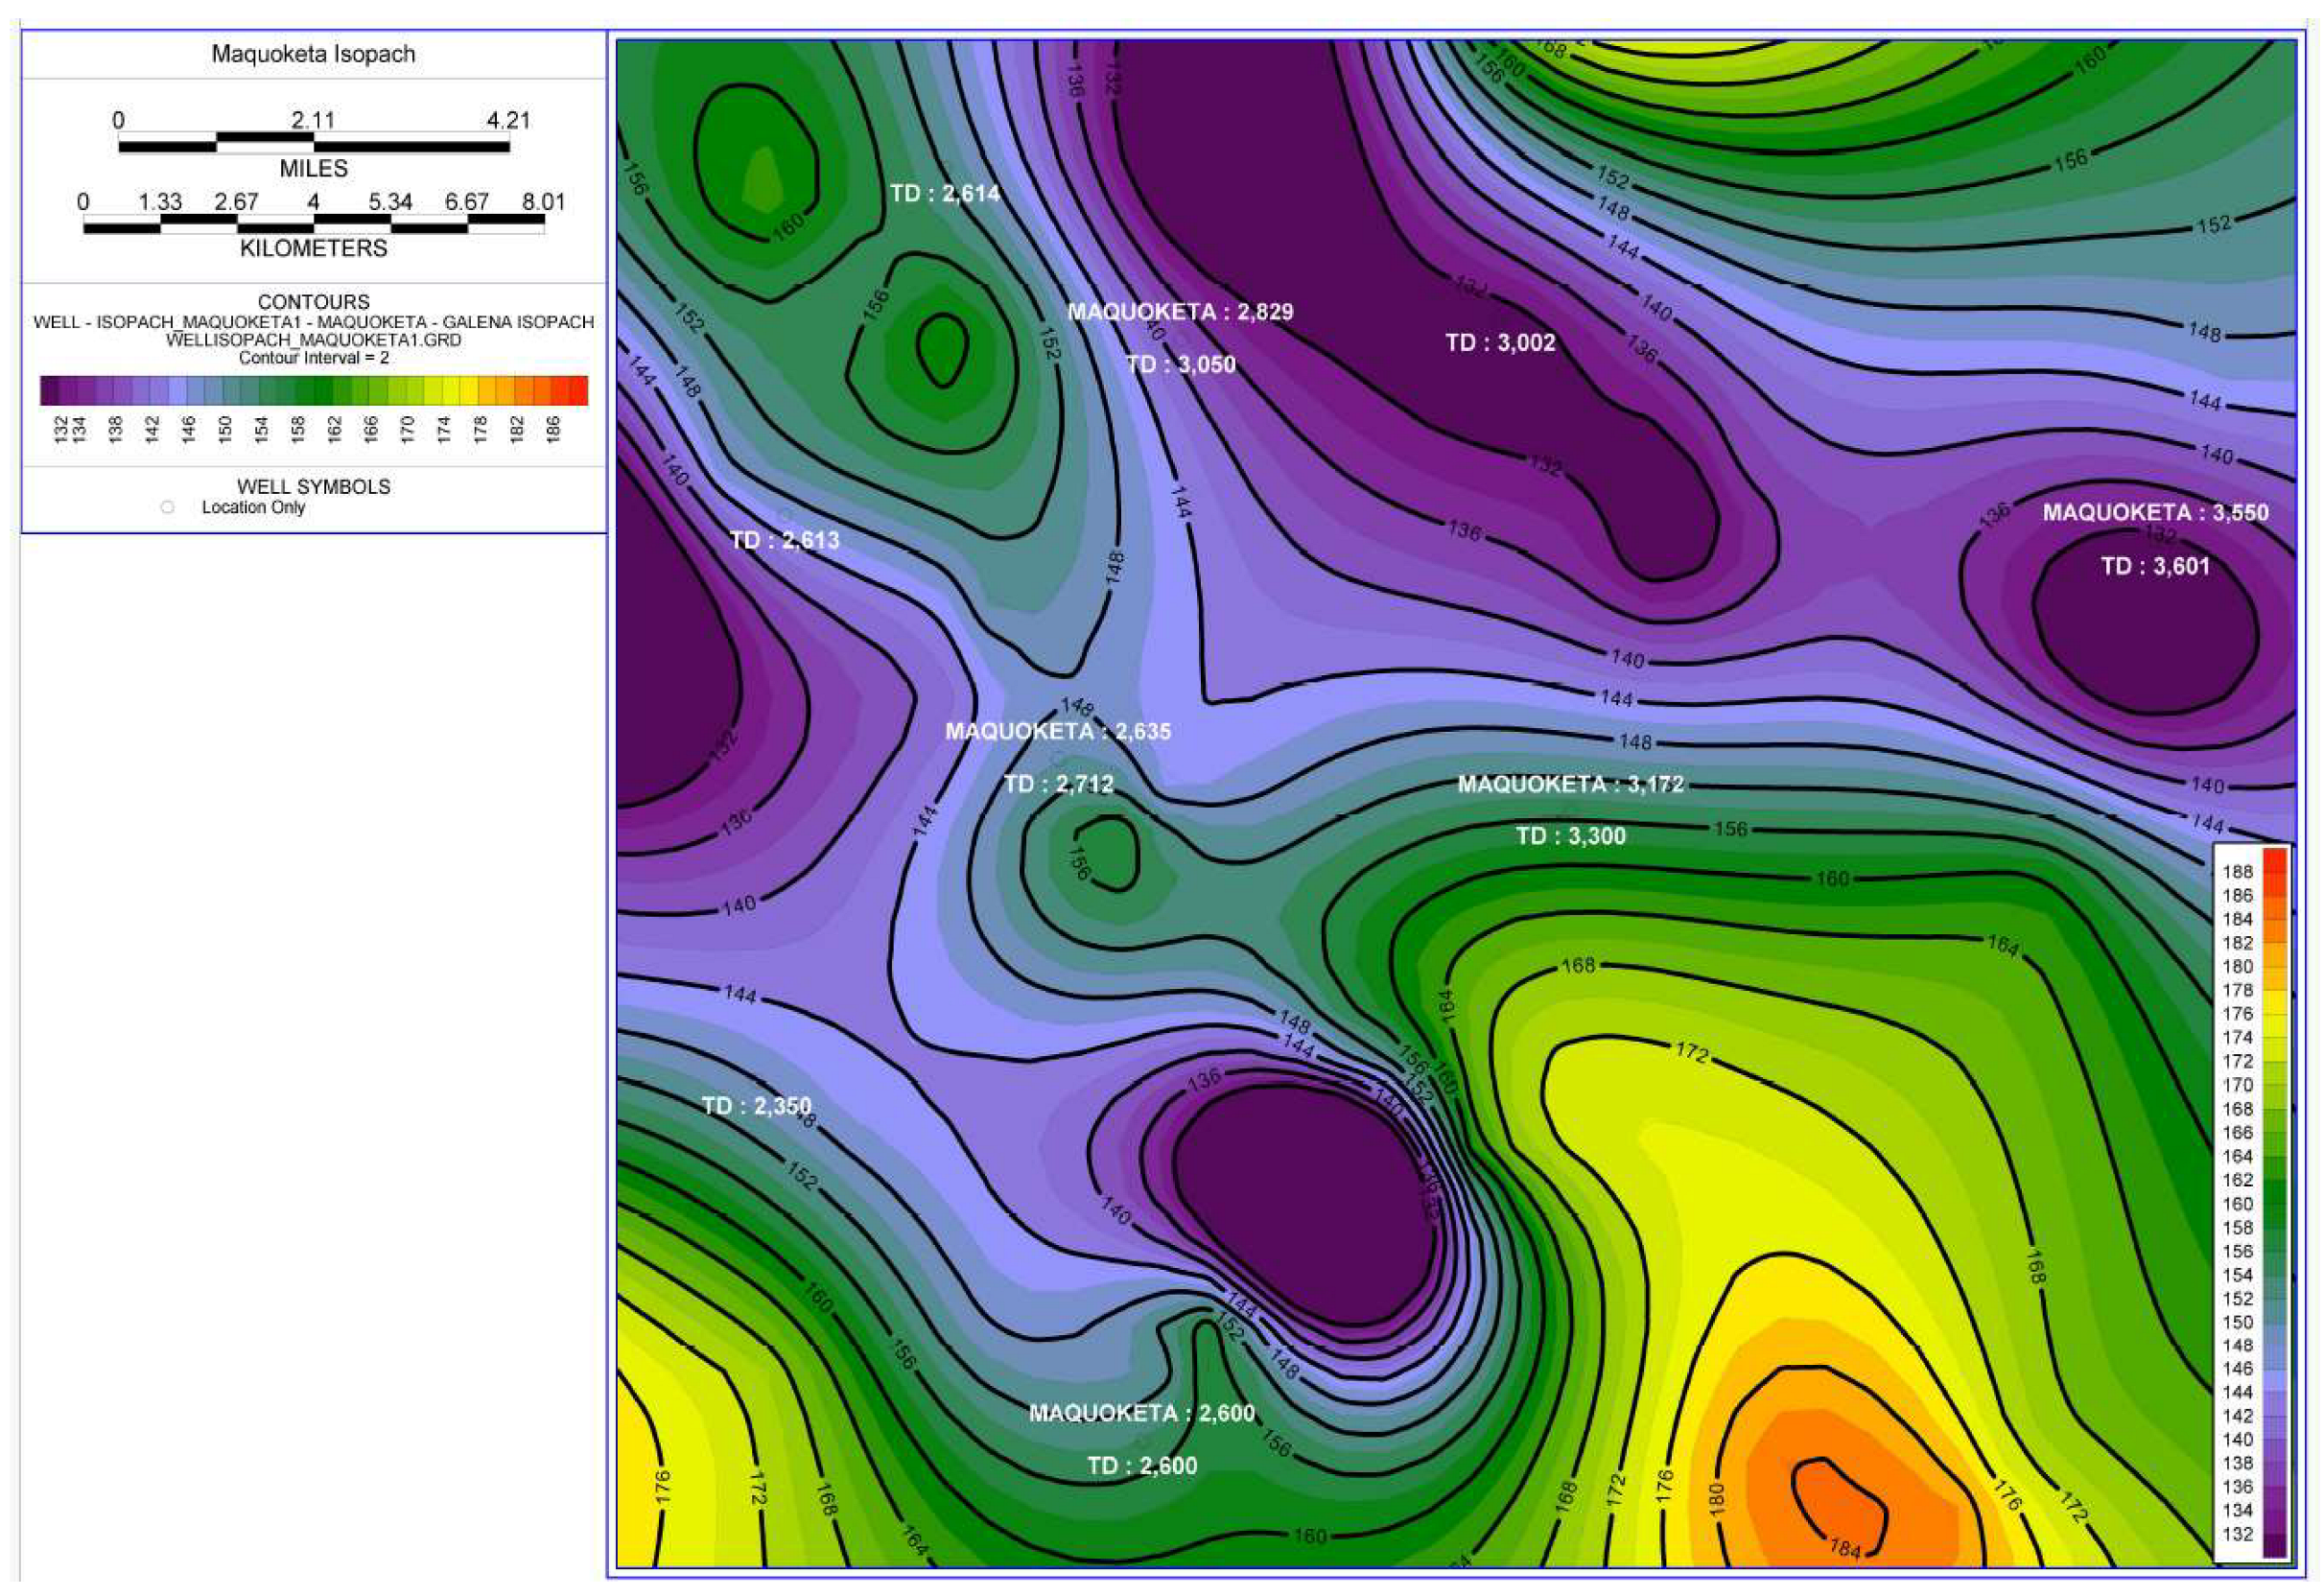
4.2. Wells with Target Depth (TD) Formation Code as 203MQKT

Table 4 lists the wells that had a TD formation code as Maquoketa seal (203MQKT). An investigation was conducted to check whether these wells penetrated through the Maquoketa shale and reached the Trenton formation, or if they partially penetrated the Maquoketa seal. These wells are currently listed as penetrating through the Maquoketa seal as the authors were unsure about how much Maquoketa seal below the TD is enough for confinement. An additional caprock integrity study needs to be performed to answer this uncertainty, and it was out of the scope of this study. Once an appropriate assumption was made for this, the well type of these wells changed to Type 9. Figure 10 shows the isopach map of Maquoketa along with these wells under consideration, which helped in estimating the approximate Maquoketa thicknesses below the TD of each well, as shown in Table 4.

4.3. Phased Corrective Action Plan

For the phased corrective action plan, it is recommended to overlay the CO2 plume for intervals of 3–4 years over the mapped risky wells. This approach prioritizes wells based on their proximity to the expanding CO2 plume over time. The AoR overlay in Figure 8 and Figure 9 spans a total of 23 years (20 years injection and 3 years post-injection), and 54 wells that have a high priority for corrective action fall within the same period. By overlaying AoR for different time intervals onto the mapped risky wells, it becomes easier to identify which wells require prioritized corrective action before each period. For instance, if the combined CO2 plume and pressure front radius is projected to reach a 2.5-mile radius (red circle) after 4 years of injection, as shown in Figure 11, then wells within the red circle should be prioritized. For this example, there is one Type 3 well that has producer status, two Type 6 wells each with D&A and P&A status, and one Type 8 well with P&A status. Thus, the priority for corrective action in this example would be as follows:
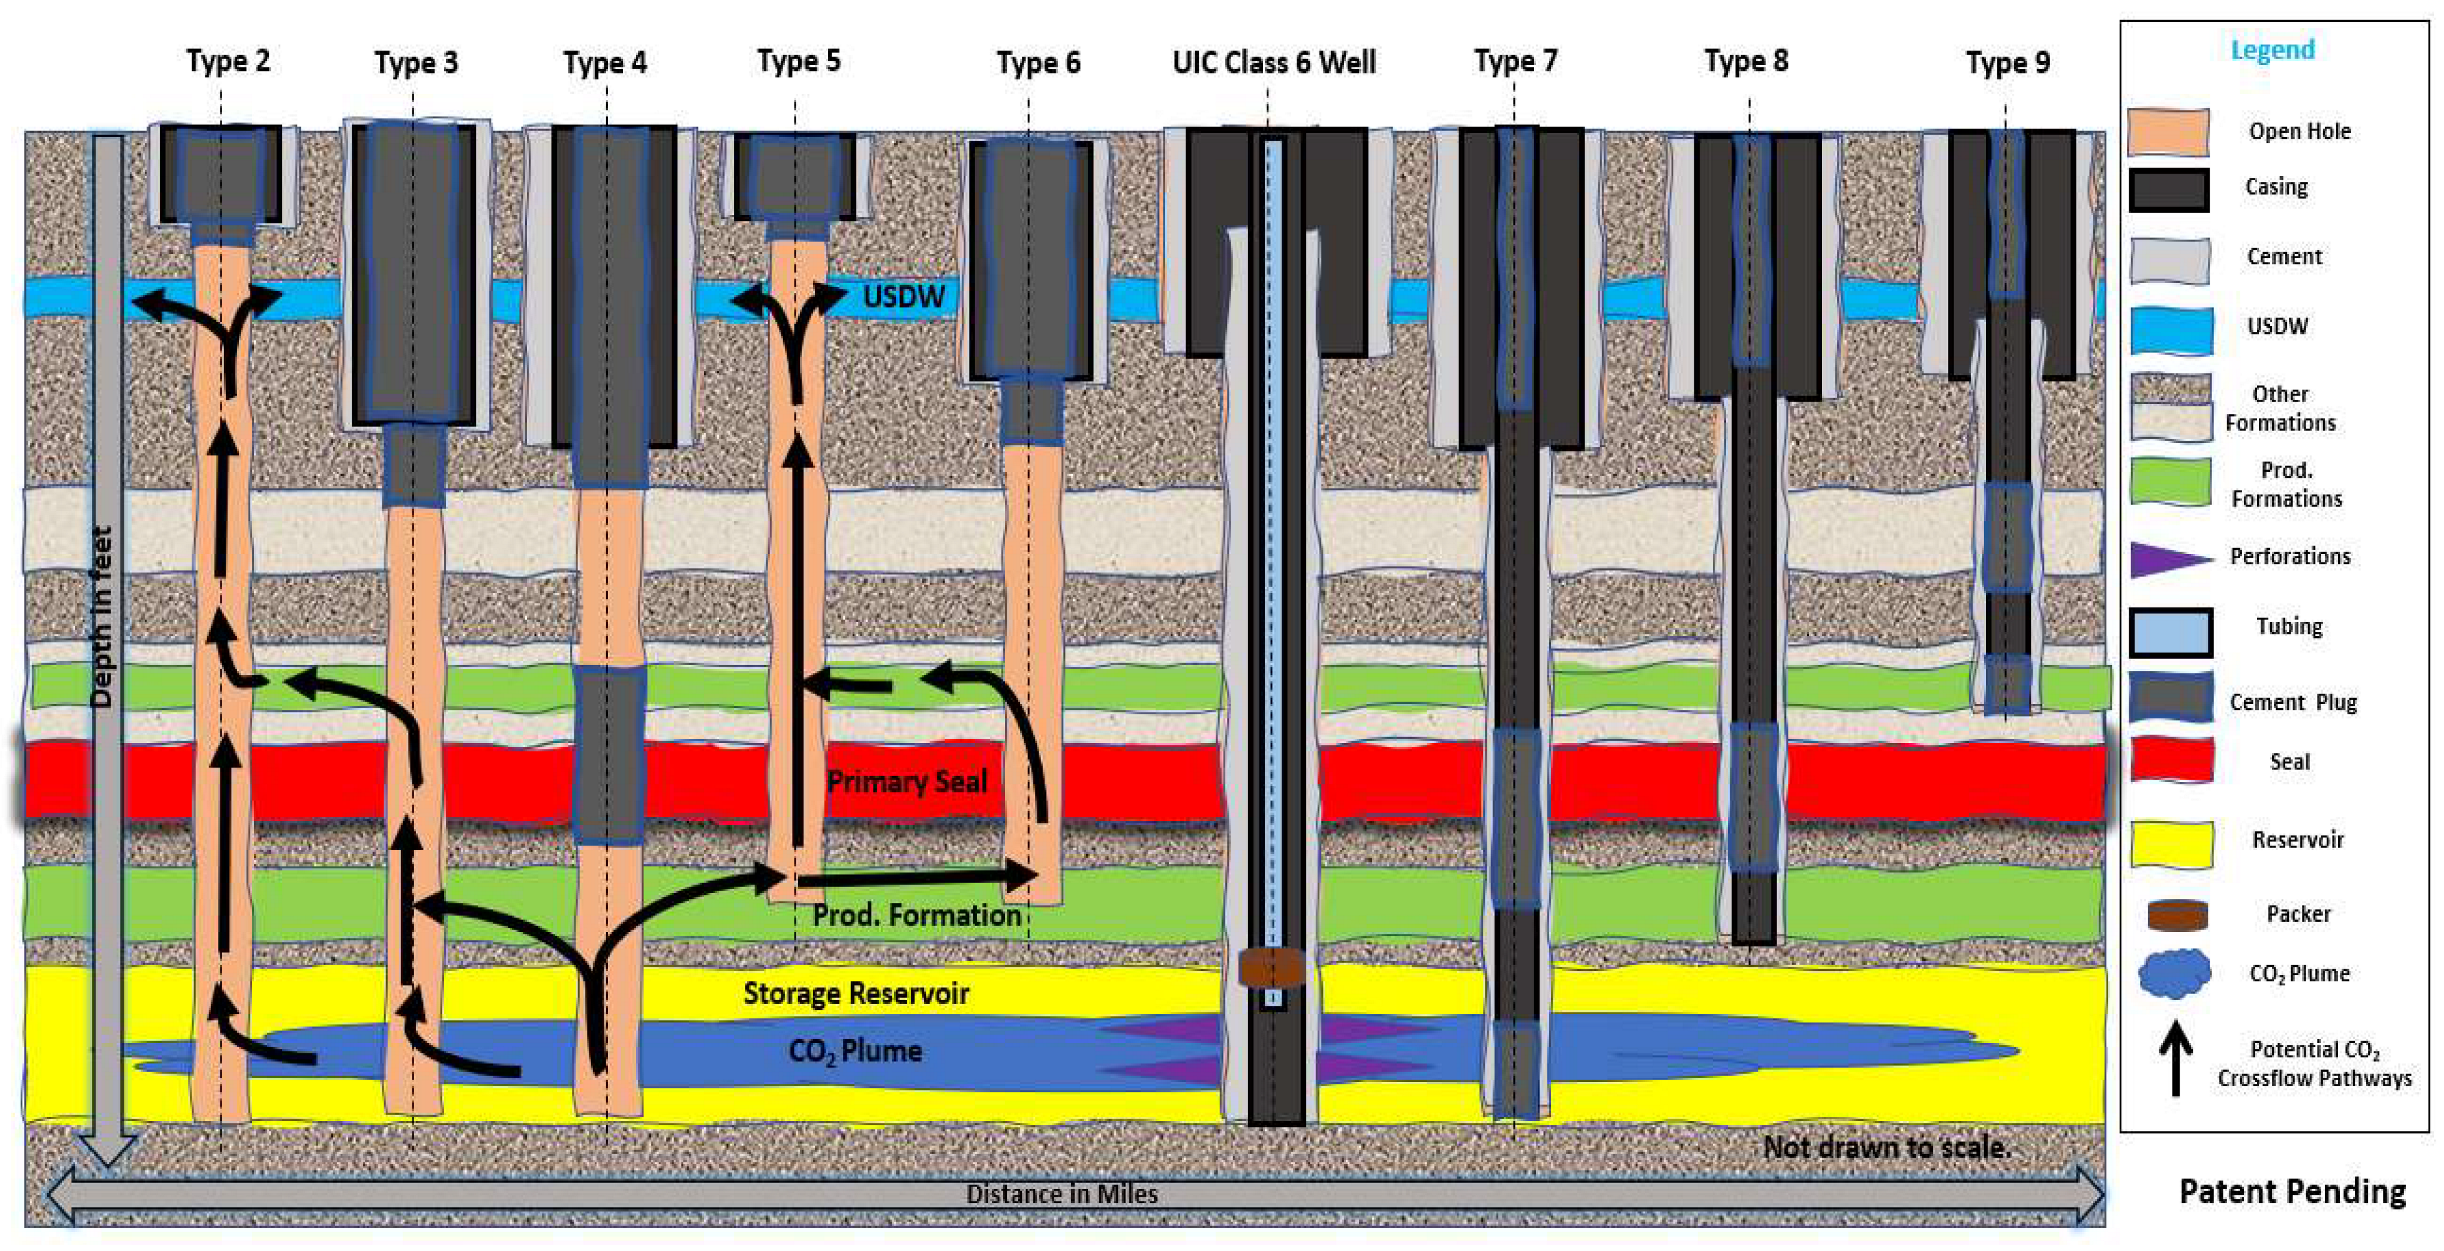
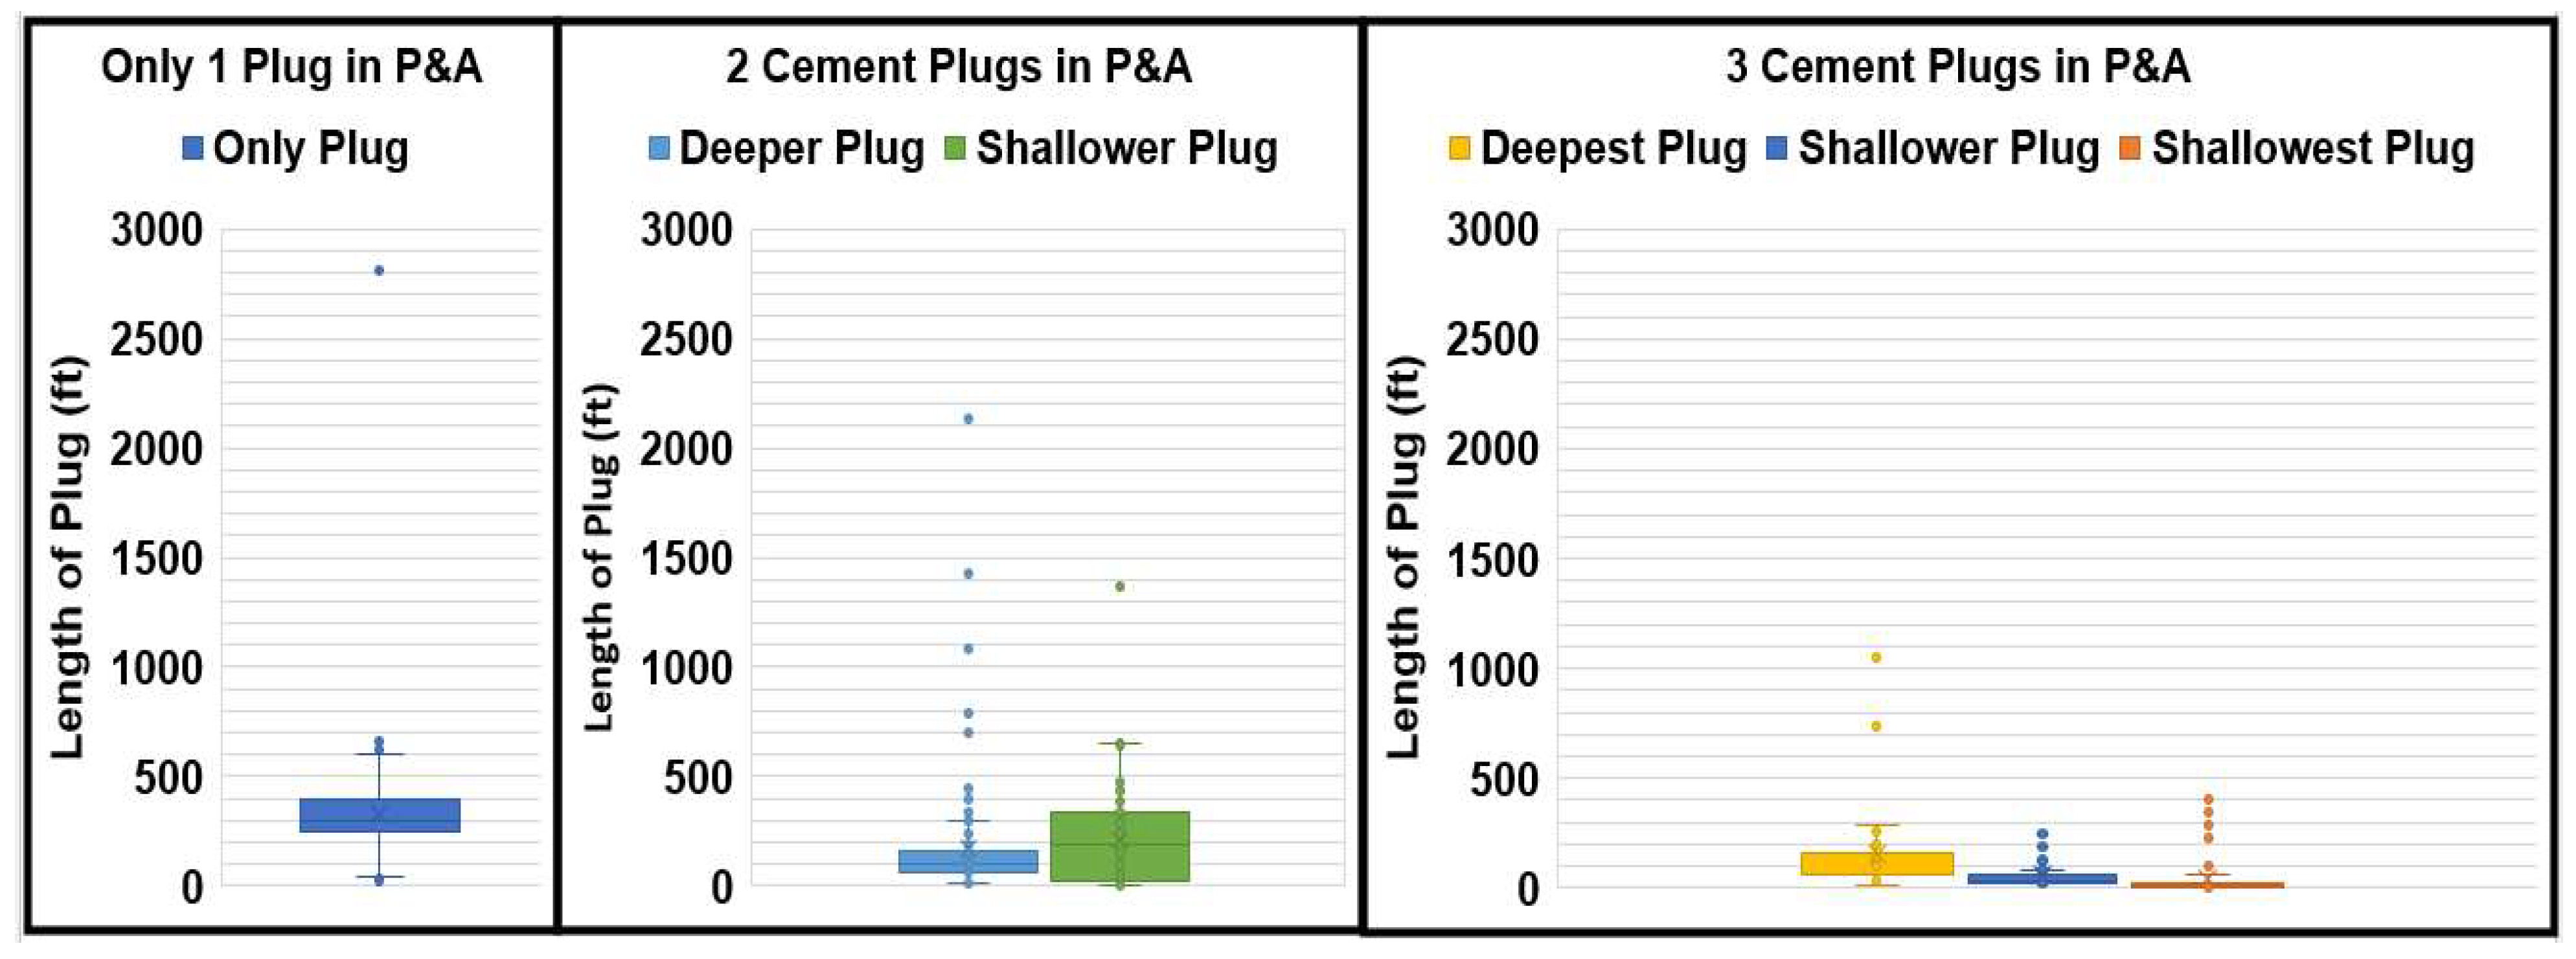
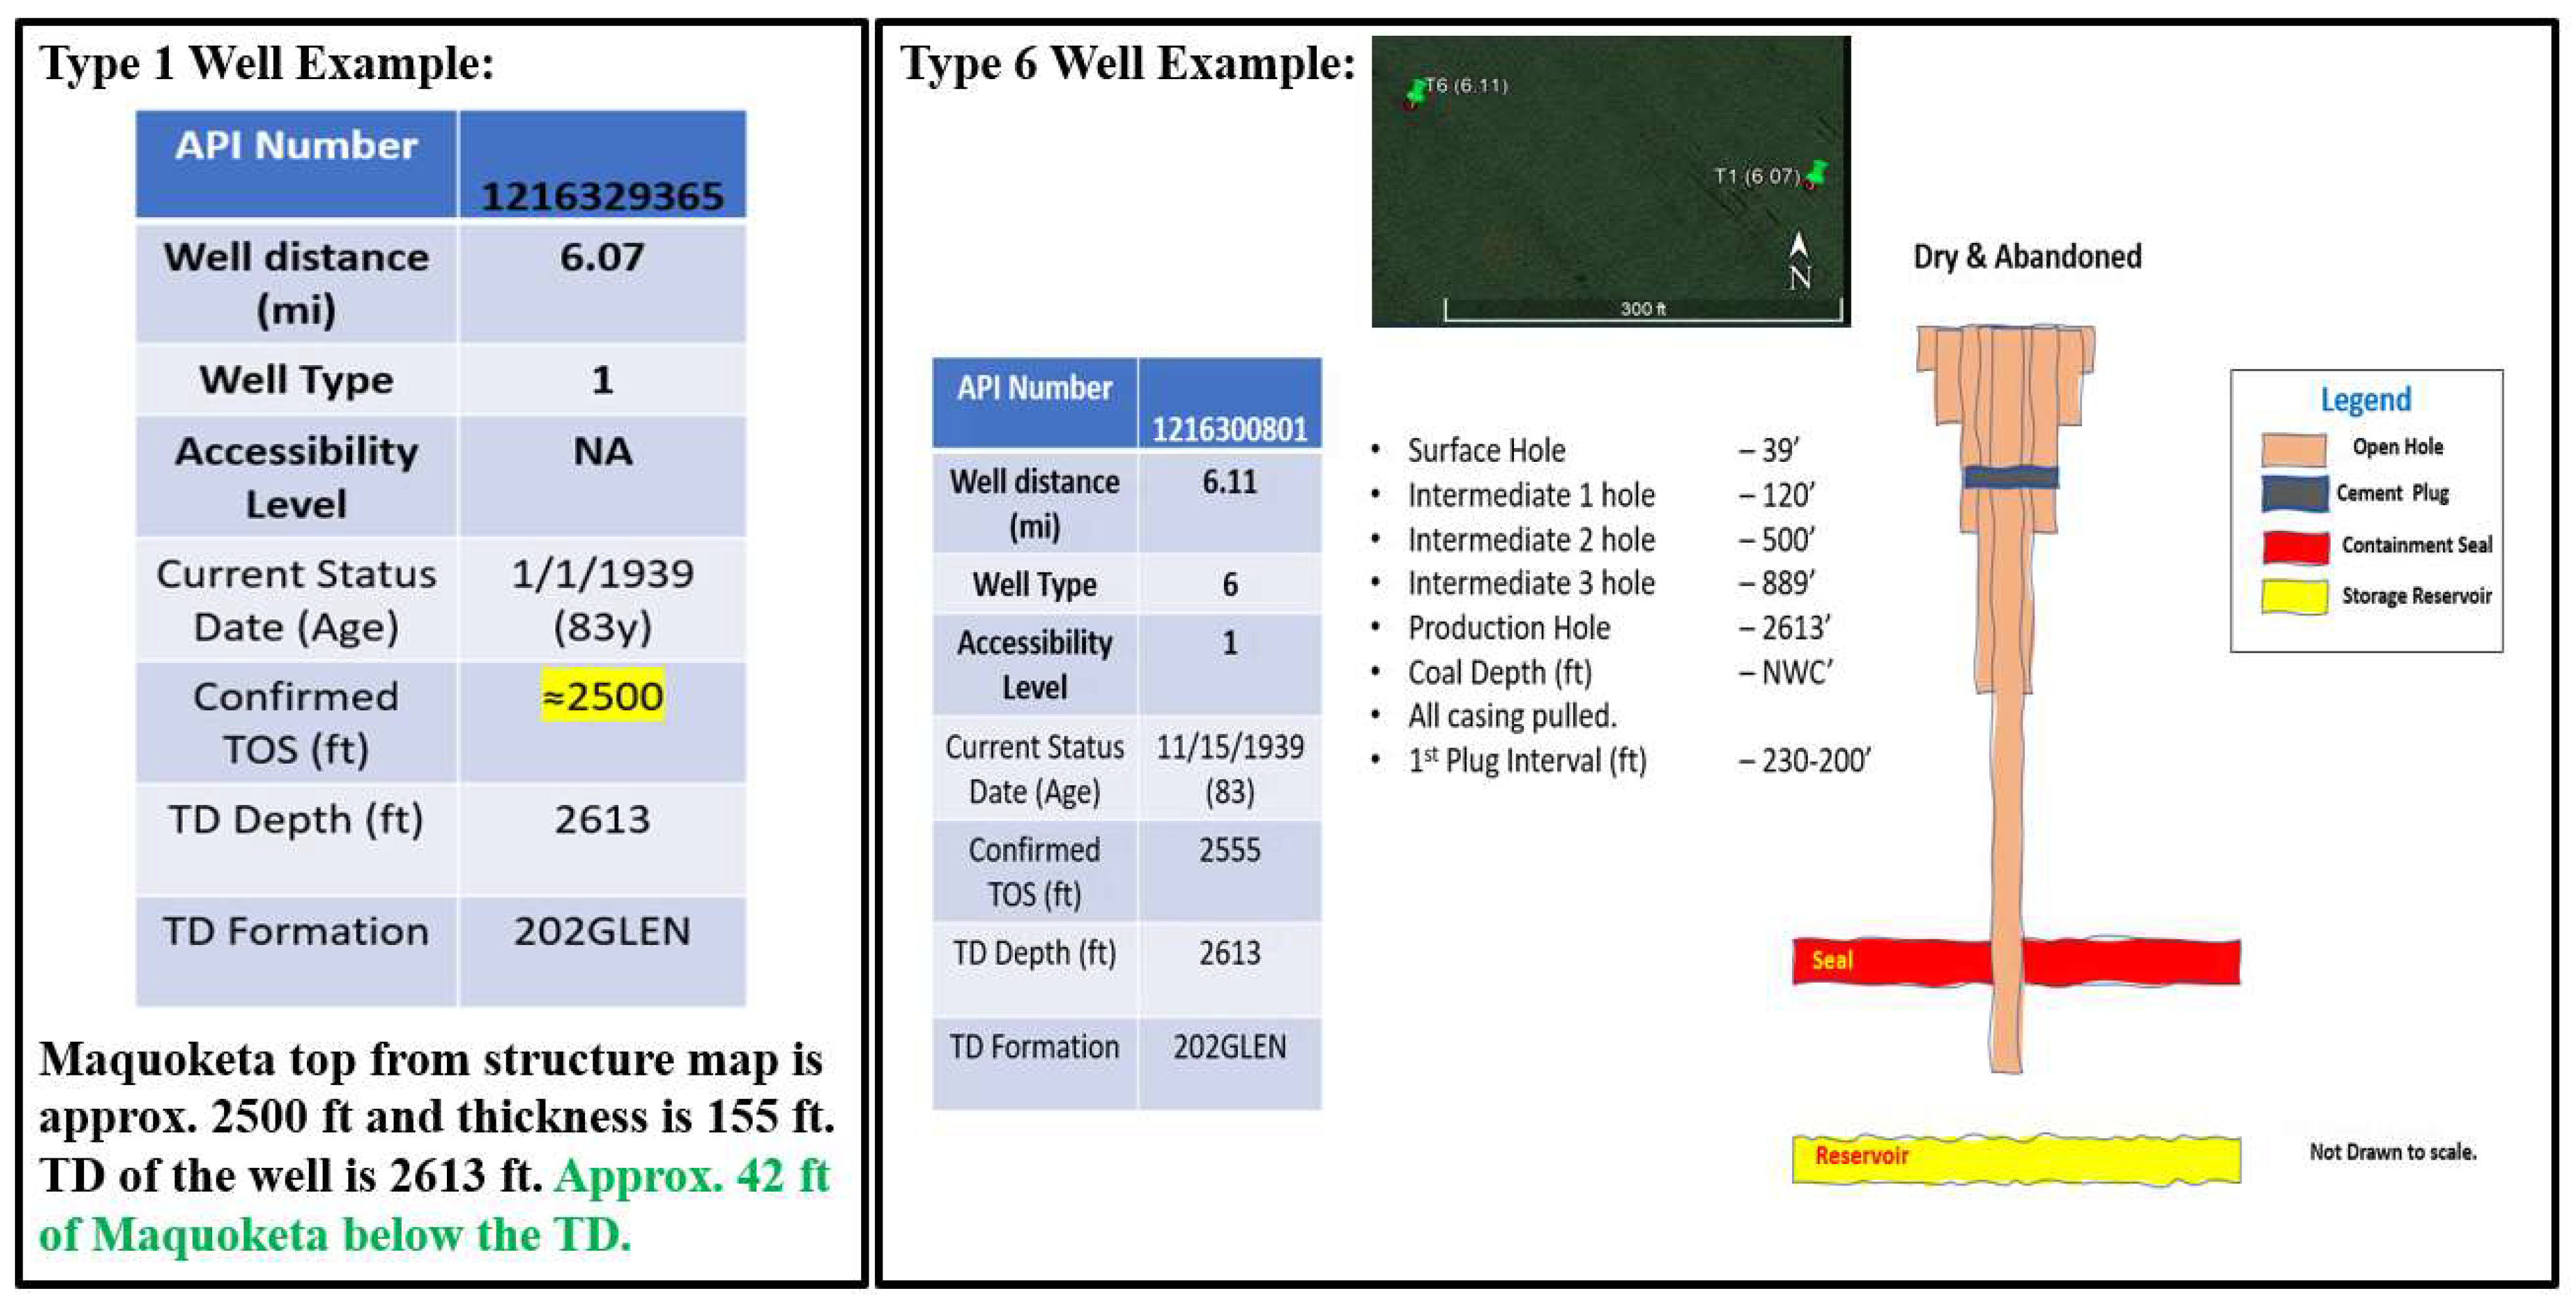
  • Type 6 with D&A status: This well just has surface casings and shallow plugs as barriers but no cement plugs across the confining seals.
  • Type 6 with P&A status: This well has a cast iron bridge plug set at a shallower depth within the production casing that is cut and retrieved above the TOC.
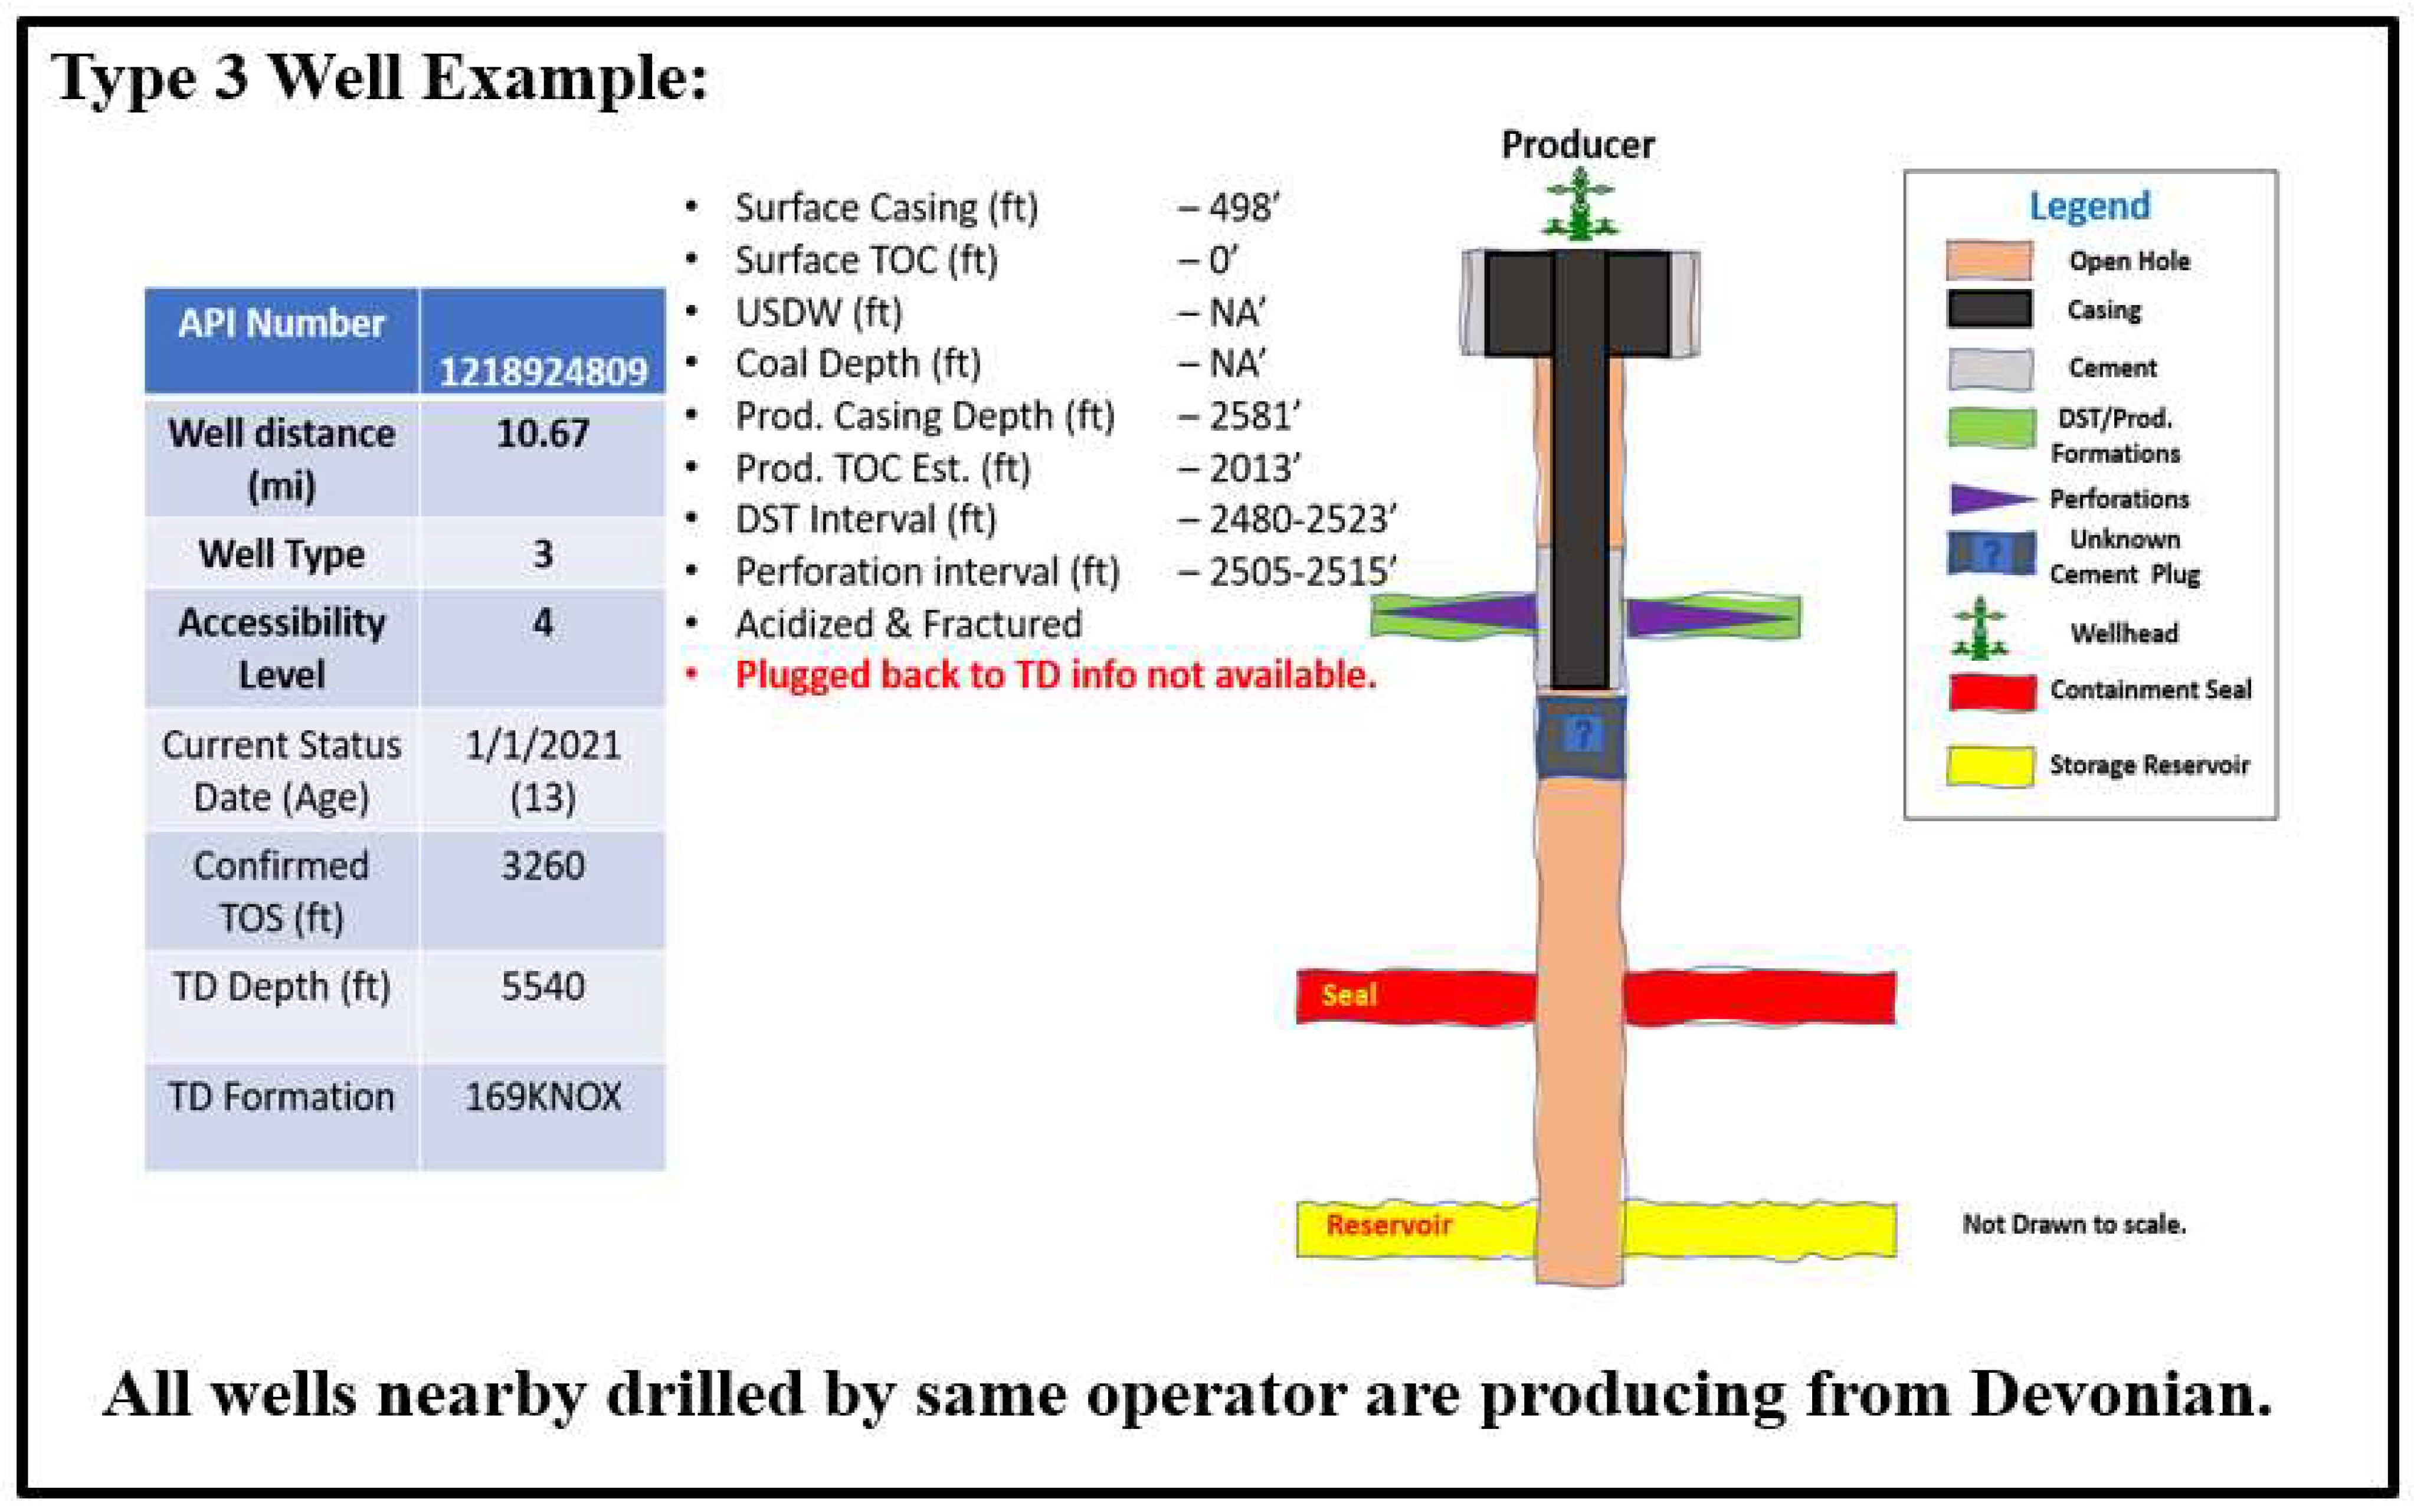
  • Type 3 with producer status: As this well is accessible due to its producer status, priority should be given to abandoned wells since locating them and re-entering would be challenging.
Figure 11. Hypothetical phased corrective action plan mapping.
Minerals 14 00383 g011

4.4. Uncertainty Reduction and Future Work

This study was purely based on publicly available data, and inconsistencies in data reporting to the state were observed for several reasons, such as changes in regulations, advancements in technology, and poor maintenance of the data. The lease operator changed for a many wells over the decades, and data were lost in the transition. The uncertainty discussed in this section could be reduced by reaching out to the current operators of these identified risky wells to gain additional insights. Furthermore, the National Risk Assessment Partnership–Open–Integrated Assessment Models (NRAP-Open-IAM) tool could be used to estimate the leak rates through these risky wells and reduce the uncertainty [48,49,50,51,52]. These tools help in quantitative risk assessment. The application of active reservoir management techniques for geosteering the CO2 plume and avoiding some of the risky wells should be evaluated [24,53]. If there were still numerous wells that required corrective action, then the deeper secondary storage reservoir (Potosi in this case study) should have been evaluated.

5. Conclusions

Robust risk assessment methodologies are essential for effectively containing anthropogenic CO2 within the subsurface, particularly when dealing with legacy wells within the Area of Review (AoR). Due to a lack of data for many old legacy wells, this study strategically categorized 4386 such wells within the AoR of a potential CO2 storage site. This study identified wells posing immediate risks, guiding prioritized corrective actions and monitoring plans.
  • Utilizing publicly available data, including reports and well logs submitted to state regulatory agencies, potential risky wells were identified based on criteria such as the proximity to the injection well location, depth, and mechanical integrity of well barriers.
  • Among the 4386 wells assessed, 54 were identified as having high priority for corrective action, while 10 had medium priority, and the remaining were of low priority.
  • Case study results from the Illinois basin demonstrated the effectiveness and applicability of this approach, showcasing its potential to enhance the safety and success of carbon capture and storage (CCS) projects globally.

6. Patent

Nachiket Arbad et al. has patent #SYSTEM AND METHOD FOR CATEGORIZING AND ASSESSING WELLS (Application Number 63340034) pending to Texas Tech University System—Office of Research Commercialization.

Author Contributions

Conceptualization, N.A. and M.W.; data curation, N.A.; formal analysis, N.A. and M.W.; funding acquisition, M.W. and H.E.; investigation, N.A. and S.E.; methodology, N.A. and M.W.; project administration, M.W. and H.E.; resources, N.A., H.E. and S.L.; software, M.W., H.E. and S.L.; supervision, M.W., H.E. and S.L.; validation, N.A., H.E. and S.E.; Visualization, N.A.; writing—original draft, N.A.; writing—review and editing, N.A., H.E., S.E. and S.L. All authors have read and agreed to the published version of the manuscript.

Funding

This material is based upon work supported by the Department of Energy Award Number DE-FE0031892 as part of the Illinois Storage Corridor CarbonSAFE project.

Data Availability Statement

Publicly available datasets were analyzed in this study. These data can be found at https://isgs.illinois.edu/data/geological-records/ (accessed on 30 January 2022).

Acknowledgments

The authors would like to thank the Illinois State Geological Survey (ISGS) for their continuous support.

Conflicts of Interest

The authors declare no conflicts of interest.

Appendix A

  • Type 1 and Type 6 Well examples: There were no well reports available for this Type 1 well (API#1216329365), but an offset well (Type 6 well—API#1216300801) that was drilled by the same operator and abandoned in the same year was located just 300 ft away from this Type 1 well. Figure A1 shows the well schematic of the offset well. Based on a detailed evaluation of both wells, the authors estimated approximately 42 ft of Maquoketa shale was not penetrated by the Type 1 well. As seen in Figure A1, the offset well had all casing pulled out of the hole (POOH) and was plugged with only one 30-foot cement plug. It was still difficult to speculate if a similar plugging strategy was applied by the operator for the Type 1 well in discussion. It is interesting to note that all Type 6 wells have USDW protection, but there are no barriers across the primary confining seals.
Figure A1. Example well schematic of the type 1 well (API#1216329365) and type 6 well (API#1216300801).
Minerals 14 00383 g0a1
  • Type 3 well example: Figure A2 shows the well schematic of the Type 3 well (API#1218924809). The plugback information was missing for this well, and all the nearby wells drilled by the same operator were completed and produced from the Devonian formation. This makes it difficult to understand the plugback strategy used by the operator and the uncertainty regarding the status of well barriers protecting the storage reservoir and primary confining seal remains for this Type 3 well.
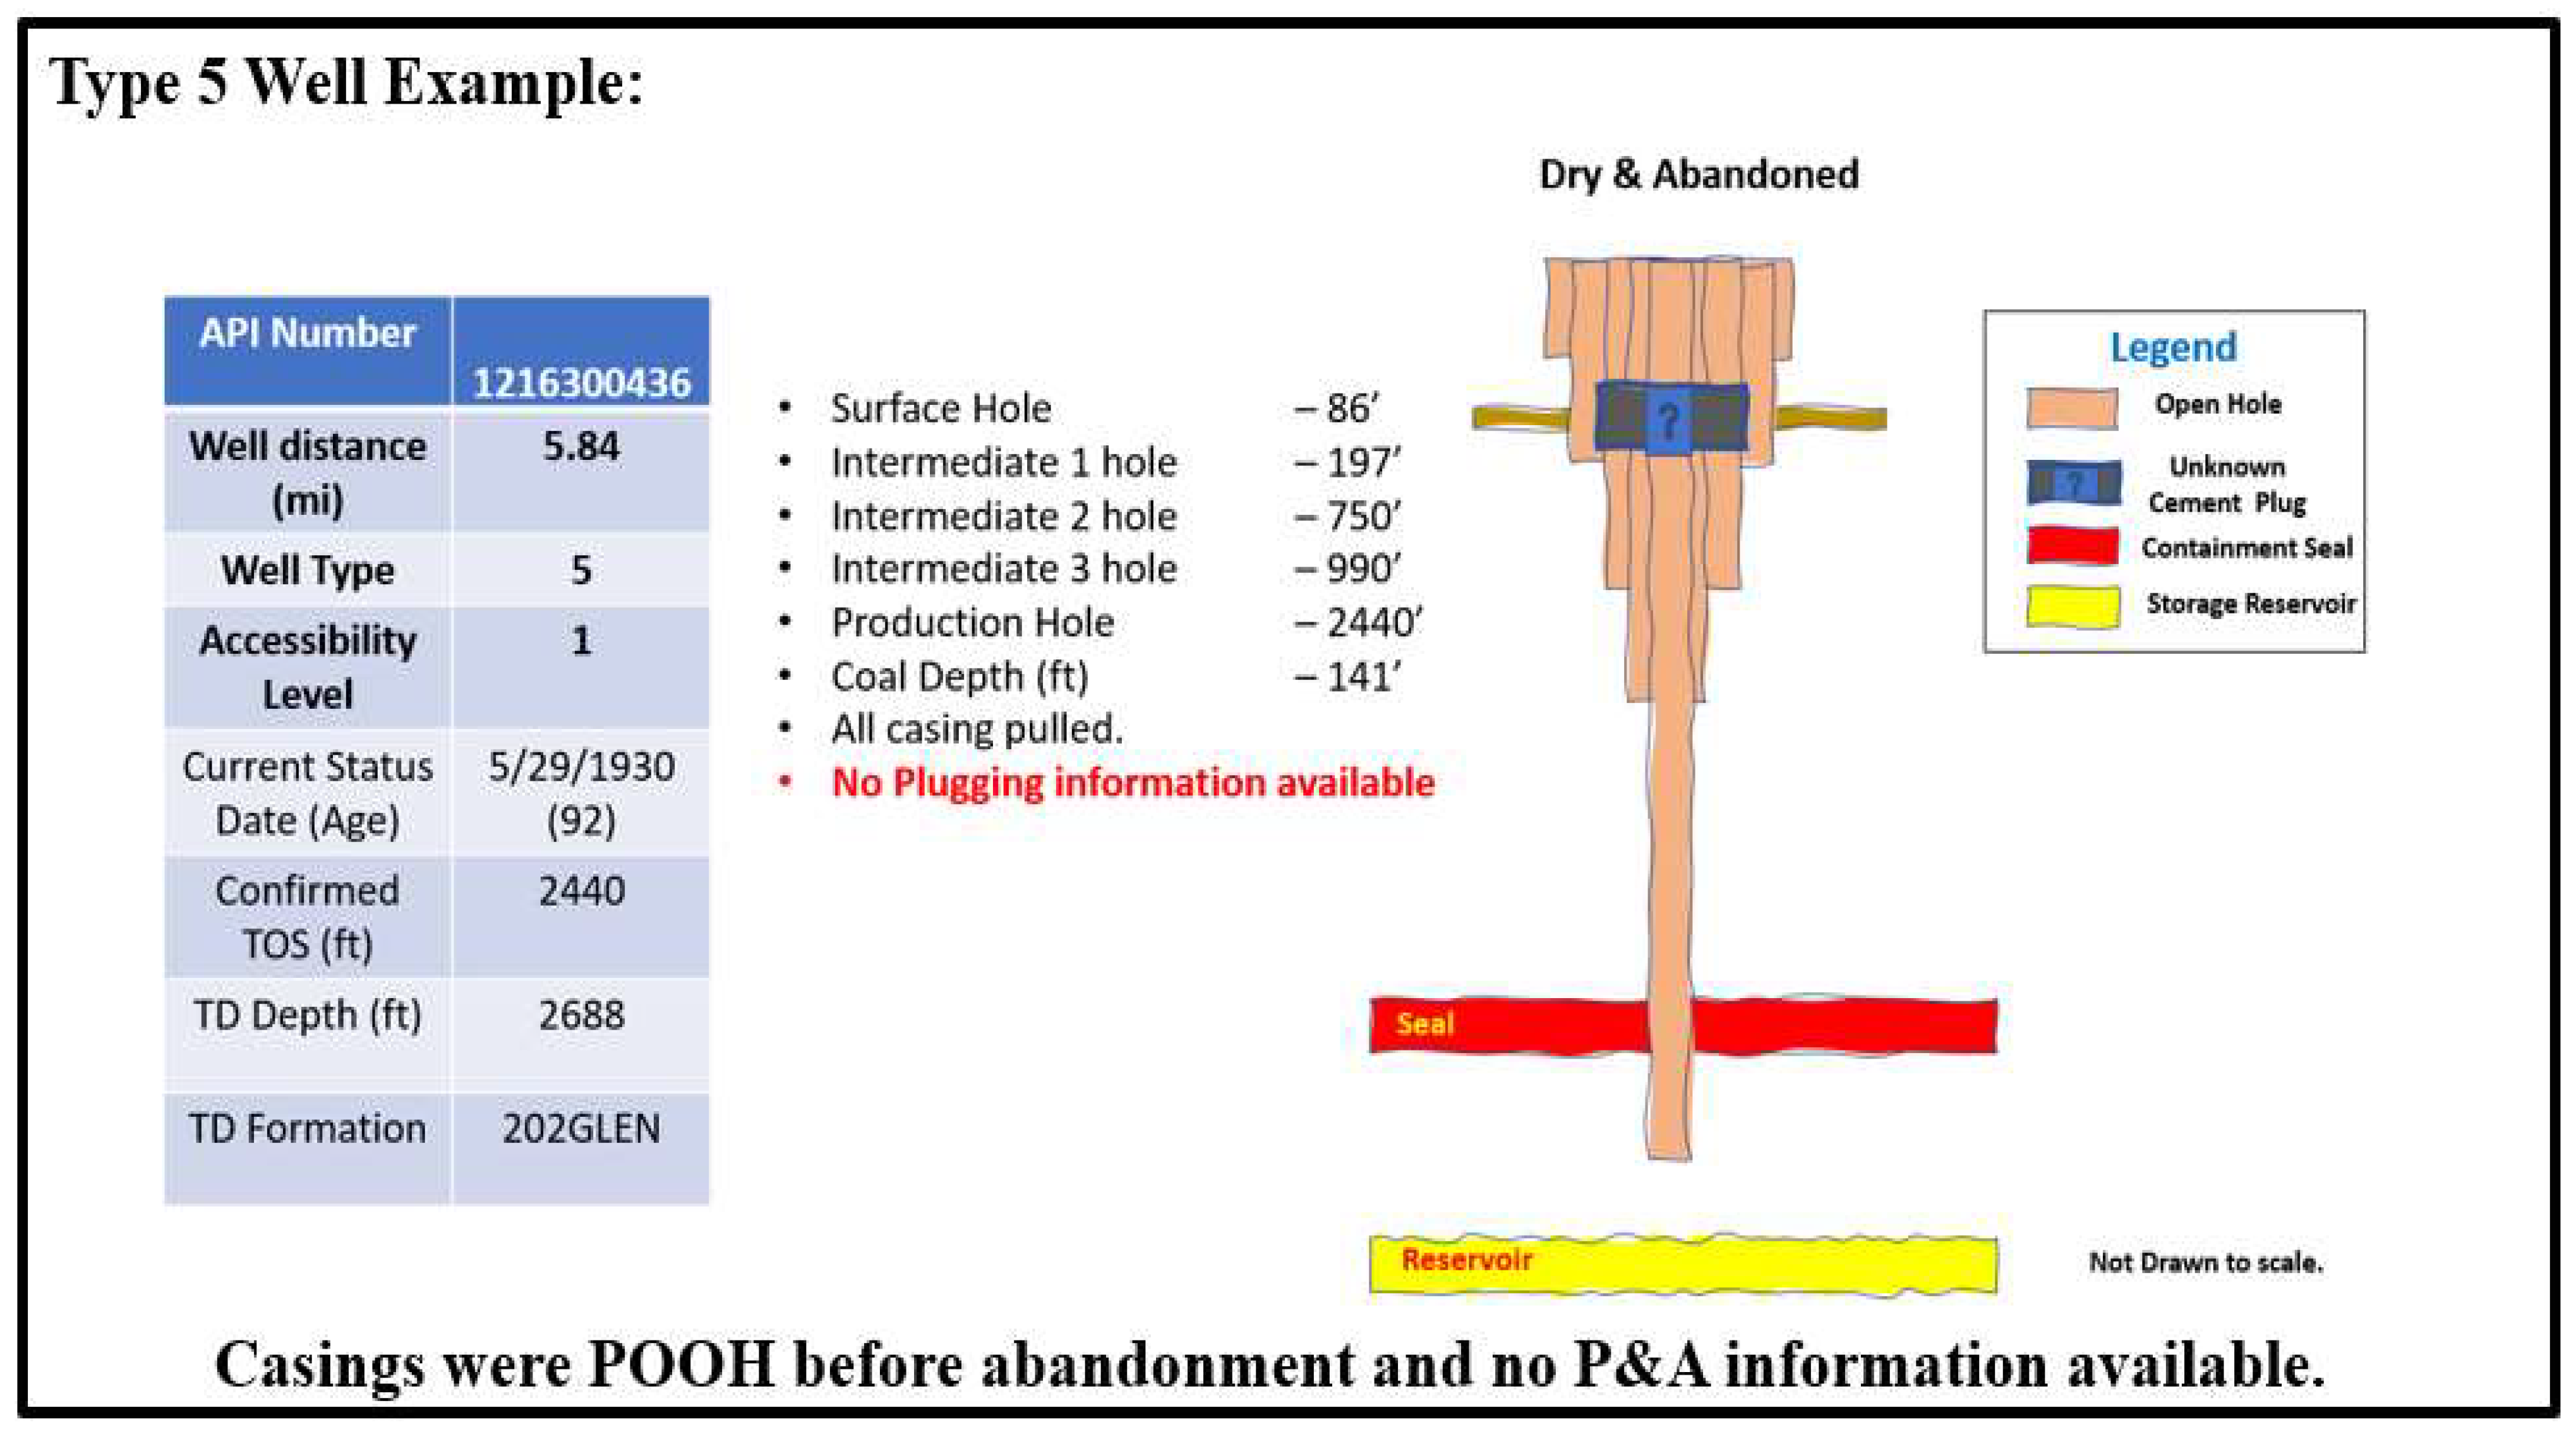
  • Type 5 well example: Figure A3 shows the well schematic of the Type 5 well (API#1216300436). All casings were POOH for this well, and plugging information was missing. All the Type 5 wells have dry and abandoned status and do not have plugging information. The well type for these wells would change if the plugging information was available.
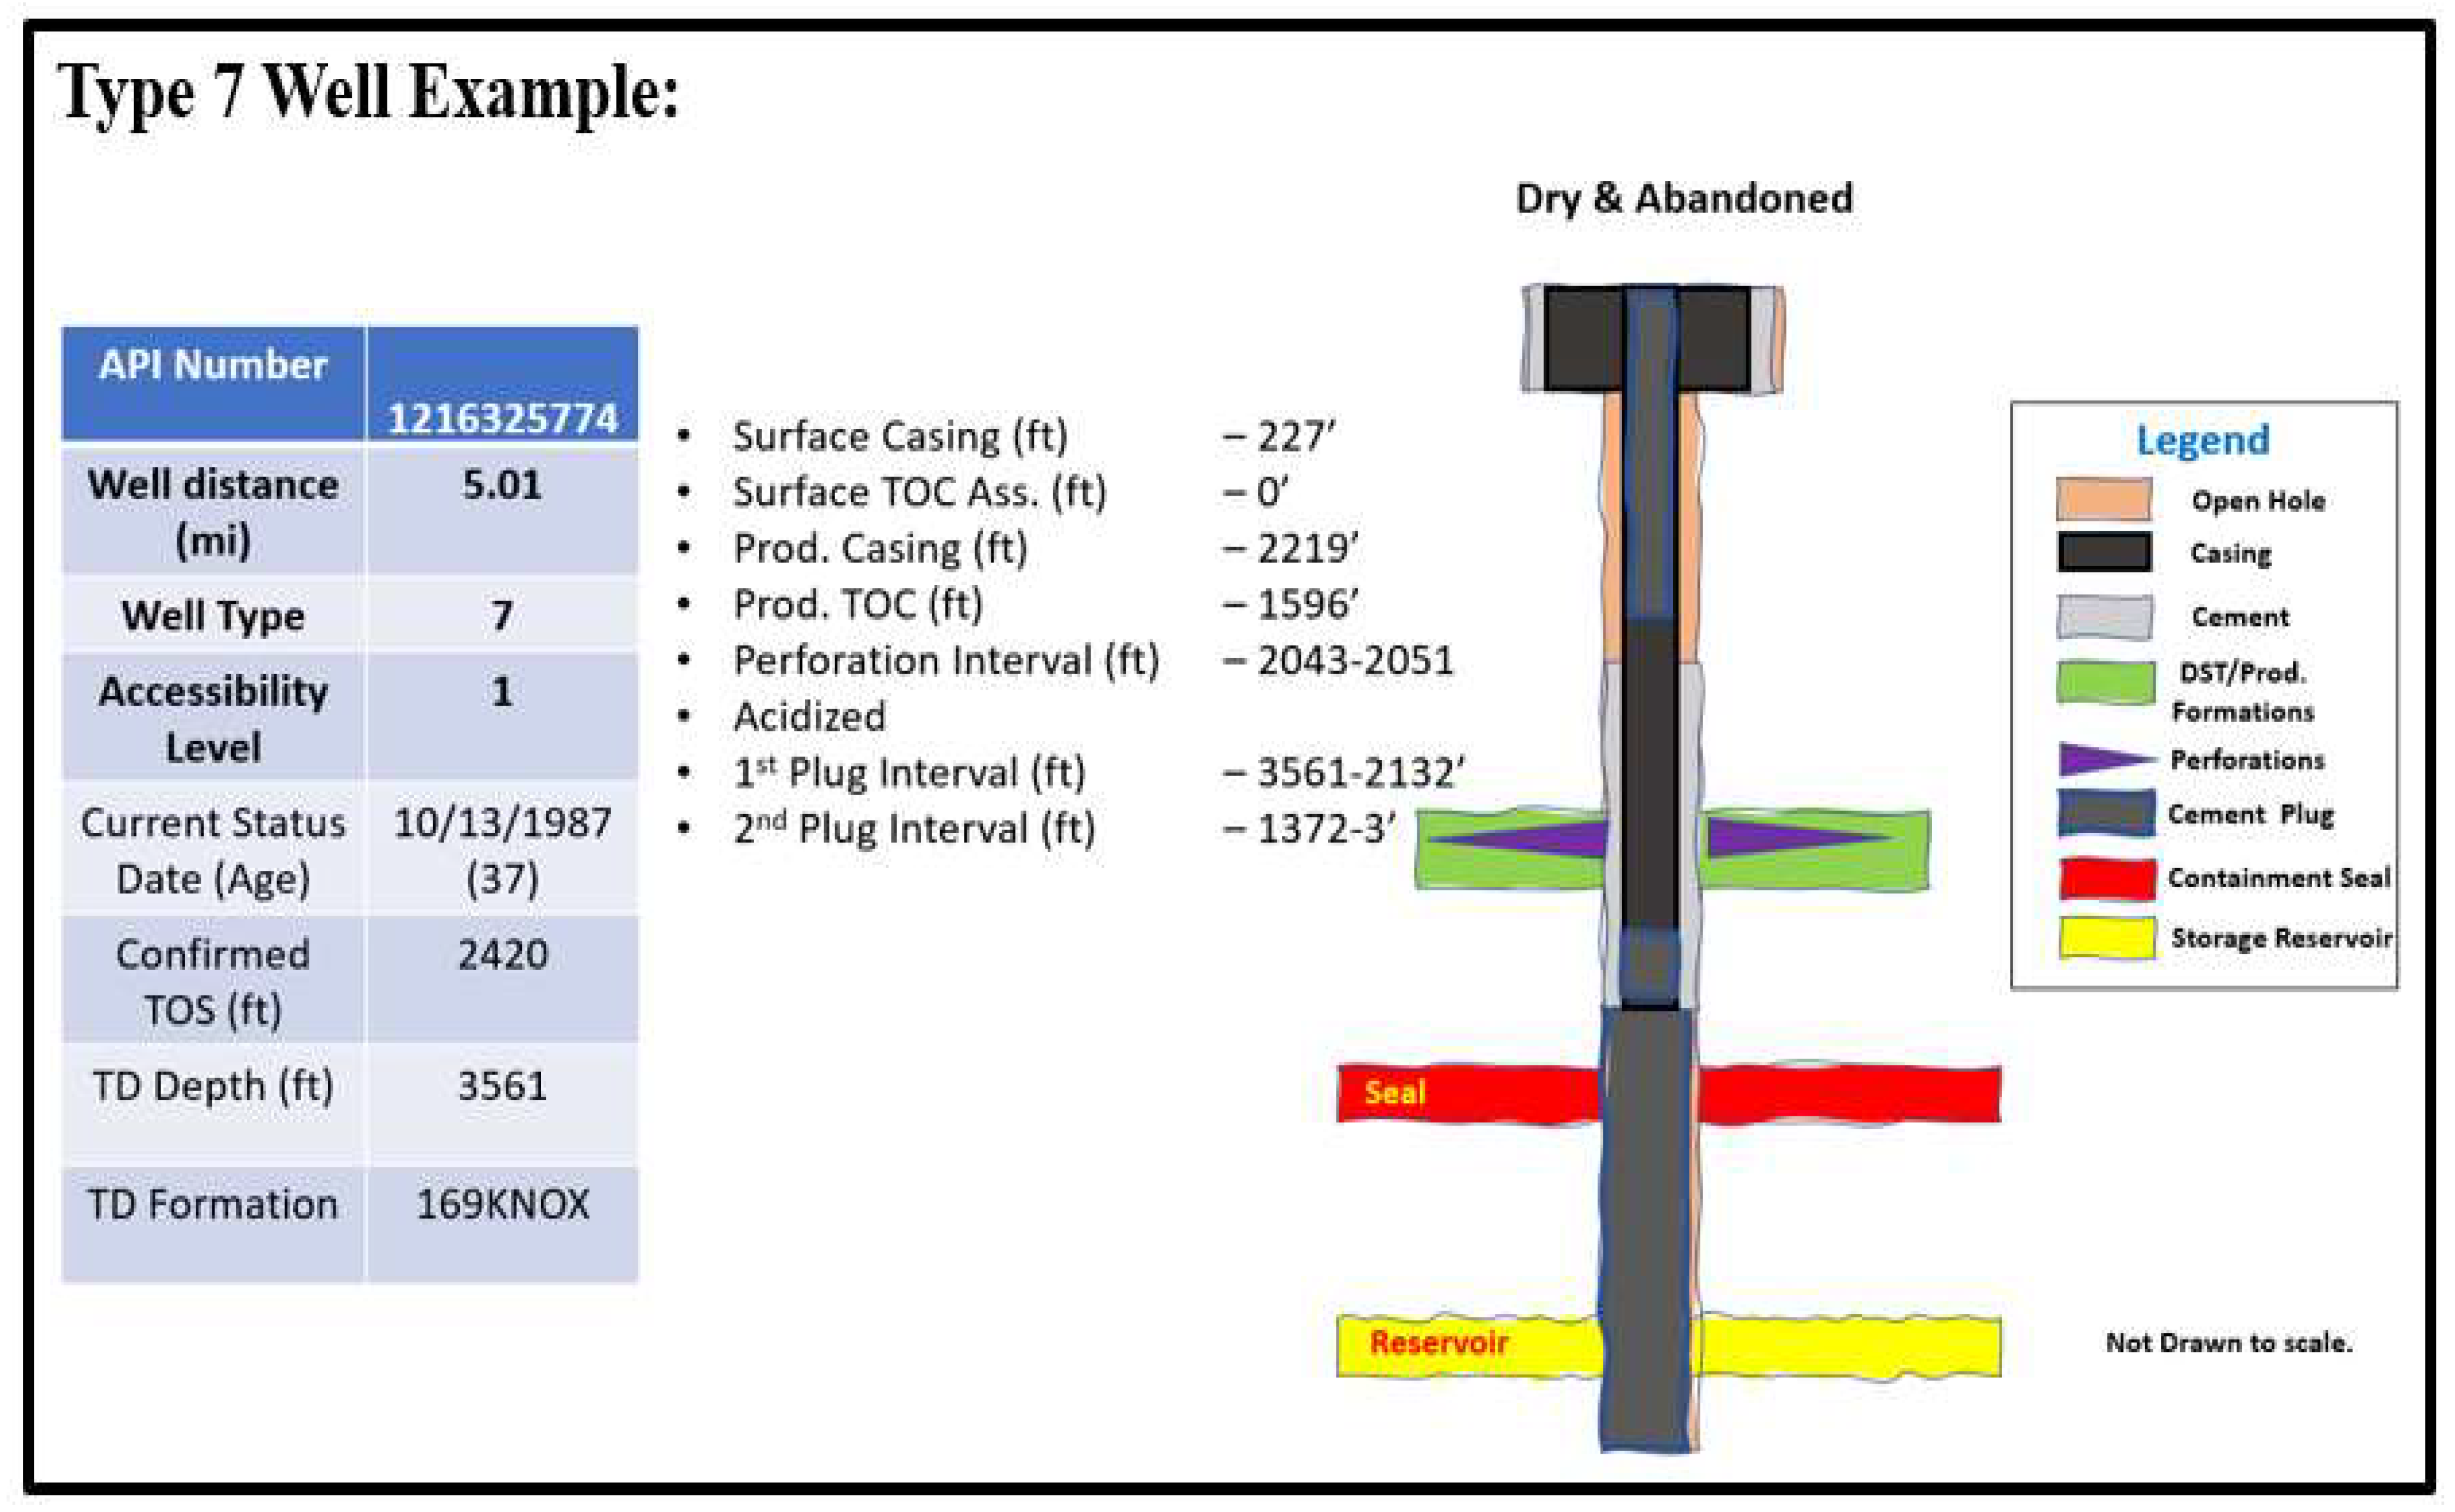
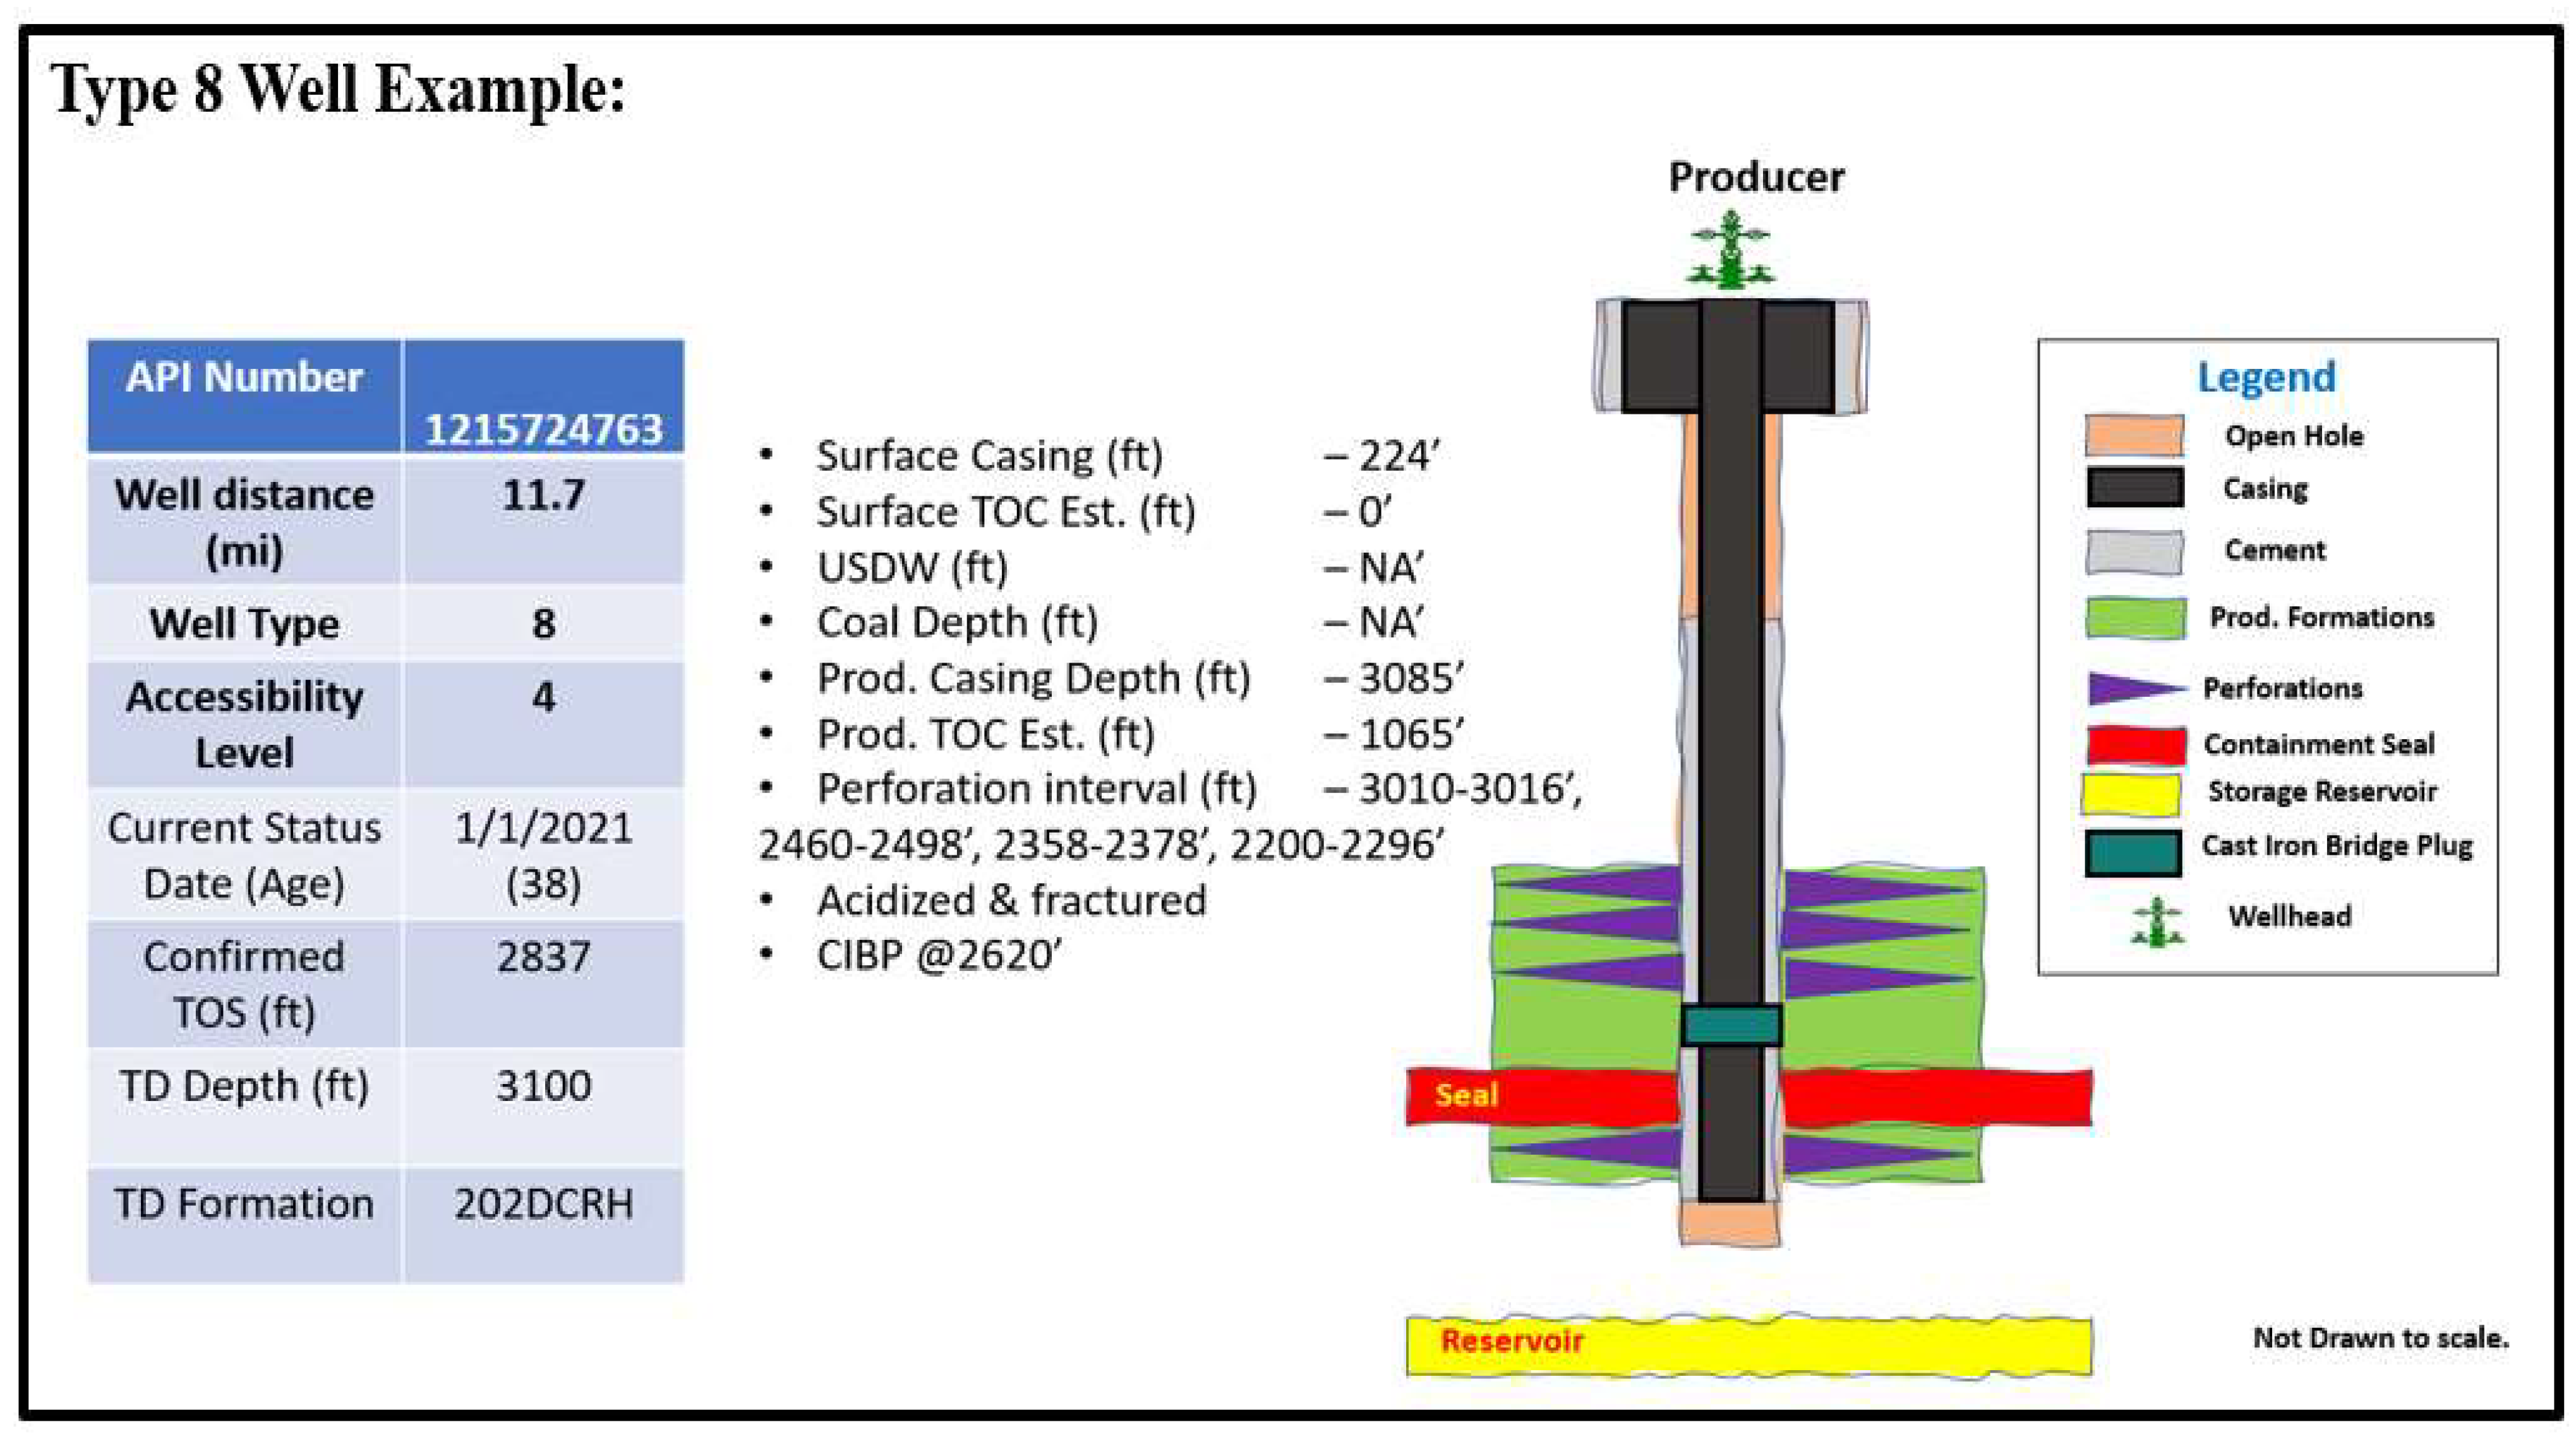
  • Type 7, 8, and 9 well examples: Figure A4 shows the well schematic of the Type 7 well (API#1216325774), and Figure A5 shows the well schematic of the Type 8 well (API#1215724763). These wells have the least risk as they have appropriate well barriers protecting the primary confining seal and the storage reservoir. Since Type 9 wells are of least risk, their well schematics are not presented in this section.
Figure A2. Example well schematic of the Type 3 well (API#1218924809).
Minerals 14 00383 g0a2
Figure A3. Example well schematic of the Type 5 well (API#1216300436).
Minerals 14 00383 g0a3
Figure A4. Example well schematic of the Type 7 well (API#1216325774).
Minerals 14 00383 g0a4
Figure A5. Example well schematic of the Type 8 well (API#1215724763).
Minerals 14 00383 g0a5

References

  1. Adu, E.; Zhang, Y.; Liu, D. Current Situation of Carbon Dioxide Capture, Storage, and Enhanced Oil Recovery in the Oil and Gas Industry. Can. J. Chem. Eng. 2019, 97, 1048–1076. [Google Scholar] [CrossRef]
  2. Loria, P.; Bright, M.B.H. Lessons Captured from 50 Years of CCS Projects. Electr. J. 2021, 34, 106998. [Google Scholar] [CrossRef]
  3. Li, Q.; Liu, G. Geologic Carbon Sequestration; Vishal, V., Singh, T.N., Eds.; Springer International Publishing: Heidelberg, Germany, 2016; ISBN 978-3-319-27017-3. [Google Scholar]
  4. Jackson, R.B. The Integrity of Oil and Gas Wells. Proc. Natl. Acad. Sci. USA 2014, 111, 10902–10903. [Google Scholar] [CrossRef] [PubMed]
  5. Iyer, J.; Lackey, G.; Edvardsen, L.; Bean, A.; Carroll, S.A.; Huerta, N.; Smith, M.M.; Torsæter, M.; Dilmore, R.M.; Cerasi, P. A Review of Well Integrity Based on Field Experience at Carbon Utilization and Storage Sites. Int. J. Greenh. Gas Control 2022, 113, 103533. [Google Scholar] [CrossRef]
  6. Iyer, J.; Lackey, G.; Edvardsen, L.; Bean, A.; Carroll, S.; Huerta, N.; Smith, M.; Torsæter, M.; Dilmore, R.; Cerasi, P. A Review of International Field Experience with Well Integrity at Carbon Utilization and Storage Sites; DOE.NETL-2021.2649; NETL Technical Report Series; U.S. Department of Energy, National Energy Technology Laboratory: Morgantown, WV, USA, 2020. [Google Scholar]
  7. US EPA Geologic Sequestration of Carbon Dioxide Underground Injection Control (UIC) Program Class VI Well Area of Review Evaluation and Corrective Action Guidance. 2013; Volume 96. Available online: http://water.epa.gov/type/groundwater/uic/class6/gsguidedoc.cfm (accessed on 2 June 2023).
  8. Ide, S.T.; Friedmann, S.J.; Herzog, H.J. CO2 Leakage through Existing Wells: Current Technology and Regulations. In Proceedings of the 8th International Conference on Greenhouse Gas Control Technologies, Trondheim, Norway, 19–22 June 2006; pp. 1–6. [Google Scholar]
  9. Nyland, C.A. 8th International Conference on Greenhouse Gas Control Technologies (GHGT-8), Trondheim, Norway, 19 th–22 nd June 2006. Environ. Sci. Pollut. Res. 2006, 13, 445–446. [Google Scholar] [CrossRef]
  10. Boutot, J.; Peltz, A.S.; McVay, R.; Kang, M. Documented Orphaned Oil and Gas Wells Across the United States. Environ. Sci. Technol. 2022, 56, 14228–14236. [Google Scholar] [CrossRef]
  11. Cahill, A.G.; Samano, P.S.G. Prioritizing Stewardship of Decommissioned Onshore Oil and Gas Wells in the United Kingdom Based on Risk Factors Associated with Potential Long-Term Integrity. Int. J. Greenh. Gas Control 2022, 114, 103560. [Google Scholar] [CrossRef]
  12. Van Der Kuip, M.D.C.; Benedictus, T.; Wildgust, N.; Aiken, T. High-Level Integrity Assessment of Abandoned Wells. Energy Procedia 2011, 4, 5320–5326. [Google Scholar] [CrossRef]
  13. Arbad, N.; Teodoriu, C. A Review of Recent Research on Contamination of Oil Well Cement with Oil-Based Drilling Fluid and the Need of New and Accurate Correlations. ChemEngineering 2020, 4, 28. [Google Scholar] [CrossRef]
  14. Arbad, N.; Teodoriu, C.; Amani, M. Effect of Low OBM Contamination on Long-Term Integrity of API Class H Cement Slurries—Experimental Study. J. Pet. Sci. Eng. 2023, 220, 111191. [Google Scholar] [CrossRef]
  15. Harder, C.; Carpenter, R.; Wilson, W.; Freeman, E.; Payne, H. Surfactant/Cement Blends Improve Plugging Operations in Oil-Base Muds. In Proceedings of the IADC/SPE Drilling Conference, New Orleans, LA, USA, 18–21 February 1992. [Google Scholar] [CrossRef]
  16. Morris, E.F.; Motley, H.R. SPE: 4610 Oil Base Spacer System for Use in Cementing Wells Containing Oil Base Drilling Muds. In Proceedings of the 48th Annual Fall Meeting of the Society of Petroleum Engineers of AIME, Las Vegas, NV, USA, 30 September–3 October 1973; American Institute of Mining, Metallurgical, and Petroleum Engineers, Inc.: San Ramon, CA, USA. [Google Scholar]
  17. Arbad, N.; Rincon, F.; Teodoriu, C.; Amani, M. Experimental Investigation of Deterioration in Mechanical Properties of Oil-Based Mud (OBM) Contaminated API Cement Slurries & Correlations for Ultrasonic Cement Analysis. J. Pet. Sci. Eng. 2021, 205, 108909. [Google Scholar] [CrossRef]
  18. Arbad, N. Experimental Investigations of the Effect of Oil Based Mud (OBM) Contamination on Long-Term Integrity of API Cements. Master’s Thesis, University of Oklahoma, Norman, OK, USA, 2020. [Google Scholar]
  19. Nagelhout, A.C.G.; Bosma, M.G.R.; Mul, P.J.J.; Krol, G.G.; van Velzen, J.F.G.; Joldersma, J.S.; James, S.G.; Dargaud, B.; Schreuder, G.J.R.; Théry, F. Laboratory and Field Validation of a Sealant System for Critical Plug-and-Abandon Situations. SPE Drill. Complet. 2010, 25, 314–321. [Google Scholar] [CrossRef]
  20. Wang, D.; Li, J.; Lian, W.; Yang, H.; Lu, Z.; Liu, P.; Liu, X. Simulation Study of Cement Plug Micro-Annulus in Milling Section of Abandoned Wells. Geoenergy Sci. Eng. 2023, 224, 211606. [Google Scholar] [CrossRef]
  21. Hunter, K.; Bielicki, J.M.; Middleton, R.; Stauffer, P.; Pawar, R.; Harp, D.; Martinez, D. Integrated CO2 Storage and Brine Extraction. Energy Procedia 2017, 114, 6331–6336. [Google Scholar] [CrossRef]
  22. Buscheck, T.A.; Bielicki, J.M.; White, J.A.; Sun, Y.; Hao, Y.; Bourcier, W.L.; Carroll, S.A.; Aines, R.D. Managing Geologic CO2 Storage with Pre-Injection Brine Production in Tandem Reservoirs. Energy Procedia 2017, 114, 4757–4764. [Google Scholar] [CrossRef]
  23. Heath, J.E.; McKenna, S.A.; Dewers, T.A.; Roach, J.D.; Kobos, P.H. Multiwell CO2 Injectivity: Impact of Boundary Conditions and Brine Extraction on Geologic CO2 Storage Efficiency and Pressure Buildup. Environ. Sci. Technol. 2014, 48, 1067–1074. [Google Scholar] [CrossRef] [PubMed]
  24. Hamling, J.; Klapperich, R. Brine Extraction and Storage Test (Best): Enhancing CO2 Storage through Active Reservoir Management. In Proceedings of the 16th International Conference on Greenhouse Gas Control Technologies, GHGT-16, Lyon, France, 23–27 October 2022. [Google Scholar]
  25. Carey, J.W. Geochemistry of Wellbore Integrity in CO2 Sequestration: Portland Cement-Steel-Brine-CO2 Interactions. Rev. Mineral. Geochemistry 2013, 77, 505–539. [Google Scholar] [CrossRef]
  26. Kutchko, B.G.; Strazisar, B.R.; Lowry, G.V.; Dzombak, D.A.; Thaulow, N. Rate of CO2 Attack on Hydrated Class H Well Cement under Geologic Sequestration Conditions. Environ. Sci. Technol. 2008, 42, 6237–6242. [Google Scholar] [CrossRef] [PubMed]
  27. Kutchko, B.G.; Strazisar, B.R.; Dzombak, D.A.; Lowry, G.V.; Thauiow, N. Degradation of Well Cement by CO2 under Geologic Sequestration Conditions. Environ. Sci. Technol. 2007, 41, 4787–4792. [Google Scholar] [CrossRef]
  28. Huerta, N.J.; Carey, J.W.; Carroll, S.; Dzombak, D.; Harp, D.; Li, L.; Richard, T.; Walsh, S.D.C.; Um, W.; Zhang, L. Well Integrity in CO2 Storage Operations: Current Understanding and Open Questions; NRAP-TRS-I- 007-2016; NRAP Technical Report Series; U.S. Department of Energy, National Energy Technology Laboratory: Albany, OR, USA, 2016; p. 48. [Google Scholar]
  29. Carroll, S.; Carey, J.W.; Dzombak, D.; Huerta, N.J.; Li, L.; Richard, T.; Um, W.; Walsh, S.D.C.; Zhang, L. Review: Role of Chemistry, Mechanics, and Transport on Well Integrity in CO2 Storage Environments. Int. J. Greenh. Gas Control 2016, 49, 149–160. [Google Scholar] [CrossRef]
  30. Duguid, A.; Carey, J.W.; Butsch, R. Well Integrity Assessment of a 68 Year Old Well at a CO2 Injection Project. Energy Procedia 2014, 63, 5691–5706. [Google Scholar] [CrossRef]
  31. Teodoriu, C.; Bello, O. A Review of Cement Testing Apparatus and Methods under CO2 Environment and Their Impact on Well Integrity Prediction – Where Do We Stand? J. Pet. Sci. Eng. 2020, 187, 106736. [Google Scholar] [CrossRef]
  32. DePaolo, D.J.; Cole, D.R. Geochemistry of Geologic Carbon Sequestration: An Overview. Rev. Mineral. Geochem. 2013, 77, 1–14. [Google Scholar] [CrossRef]
  33. Bachu, S. Analysis of Gas Leakage Occurrence along Wells in Alberta, Canada, from a GHG Perspective – Gas Migration Outside Well Casing. Int. J. Greenh. Gas Control 2017, 61, 146–154. [Google Scholar] [CrossRef]
  34. D’Alesio, P.; Poloni, R.; Valente, P.; Magarini, P.A. Well-Integrity Assessment and Assurance: The Operational Approach for Three CO2-Storage Fields in Italy. SPE Prod. Oper. 2011, 26, 140–148. [Google Scholar] [CrossRef]
  35. Haagsma, A.; Weber, S.; Moody, M.; Sminchak, J.; Gerst, J.; Gupta, N. Comparative Wellbore Integrity Evaluation across a Complex of Oil and Gas Fields within the Michigan Basin and Implications for CO2 Storage. Greenh. Gases Sci. Technol. 2016, 828–842. [Google Scholar] [CrossRef]
  36. Ingraffe, A.R.; Wells, M.T.; Santoro, R.L.; Shonkoff, S.B.C. Assessment and Risk Analysis of Casing and Cement Impairment in Oil and Gas Wells in Pennsylvania, 2000–2012. Proc. Natl. Acad. Sci. USA 2014, 111, 10955–10960. [Google Scholar] [CrossRef] [PubMed]
  37. Lackey, G.; Rajaram, H.; Sherwood, O.A.; Burke, T.L.; Ryan, J.N. Surface Casing Pressure as an Indicator of Well Integrity Loss and Stray Gas Migration in the Wattenberg Field, Colorado. Environ. Sci. Technol. 2017, 51, 3567–3574. [Google Scholar] [CrossRef] [PubMed]
  38. Lackey, G.; Rajaram, H.; Bolander, J.; Sherwood, O.A.; Ryan, J.N.; Shih, C.Y.; Bromhal, G.S.; Dilmore, R.M. Public Data from Three US States Provide New Insights into Well Integrity. Proc. Natl. Acad. Sci. USA 2021, 118, 1–12. [Google Scholar] [CrossRef]
  39. Sminchak, J.R. Final Technical Report Integrated Wellbore Integrity Analysis Program for CO2 Storage Applications; Battelle Memorial Inst.: Columbus, OH, USA, 2018. [Google Scholar]
  40. Sminchak, J.R.; Moody, M.; Theodos, A.; Larsen, G.; Gupta, N. Investigation of Wellbore Integrity Factors in Historical Oil and Gas Wells for CO2 Geosequestration in the Midwestern U.S. Energy Procedia 2014, 63, 5787–5797. [Google Scholar] [CrossRef]
  41. Watson, T.L.; Bachu, S. Evaluation of the Potential for Gas and CO2 Leakage along Wellbores. SPE Drill. Complet. 2009, 24, 115–126. [Google Scholar] [CrossRef]
  42. Zulqarnain, M.; Zeidouni, M.; Hughes, R.G. Risk Based Approach to Identify the Leakage Potential of Wells in Depleted Oil and Gas Fields for CO2 Geological Sequestration. In Proceedings of the Carbon Management Technology Conference, Houston, TX, USA, 17 July 2017. [Google Scholar]
  43. Zulqarnain, M.; Zeidouni, M.; Hughes, R.G. Field-Scale Well Leakage Risk Assessment Using Reduced-Order Models. Greenh. Gases Sci. Technol. 2019, 9, 567–581. [Google Scholar] [CrossRef]
  44. Watson, T.L.; Bachu, S. Identification of Wells with High CO2-Leakage Potential in Mature Oil Fields Developed for CO2-Enhanced Oil Recovery. In Proceedings of the SPE Symposium on Improved Oil Recovery, Tulsa, OK, USA, 19–23 April 2008; Volume 1, pp. 234–243. [Google Scholar]
  45. Arbad, N.; Watson, M.; Heinze, L. Risk Matrix for Legacy Wells within the Area of Review (AoR) of Carbon Capture & Storage (CCS) Projects. Int. J. Greenh. Gas Control 2022, 121, 103801. [Google Scholar] [CrossRef]
  46. Arbad, N.; Watson, M.; Heinze, L.; Emadi, H. Qualitative Risk Assessment of Legacy Wells Based on Publicly Available Data for Class Vi Well Permit Applications–Illinois Basin Case Study. Int. J. Greenh. Gas Control 2023, 133, 104106. [Google Scholar] [CrossRef]
  47. Finley, R. An Assessment of Geological Carbon Sequestration Options in the Illinois Basin; Midwest Geological Sequestration Consortium: Pittsburgh, PA, USA; Morgantown, WV, USA, 2005. [Google Scholar]
  48. Lackey, G.; Vasylkivska, V.S.; Huerta, N.J.; King, S.; Dilmore, R.M. Managing Well Leakage Risks at a Geologic Carbon Storage Site with Many Wells. Int. J. Greenh. Gas Control 2019, 88, 182–194. [Google Scholar] [CrossRef]
  49. Baek, S.; Bacon, D.H.; Huerta, N.J. Enabling Site-Specific Well Leakage Risk Estimation during Geologic Carbon Sequestration Using a Modular Deep-Learning-Based Wellbore Leakage Model. Int. J. Greenh. Gas Control 2023, 126, 103903. [Google Scholar] [CrossRef]
  50. Vasylkivska, V.; Dilmore, R.; Lackey, G.; Zhang, Y.; King, S.; Bacon, D.; Chen, B.; Mansoor, K.; Harp, D. NRAP-Open-IAM: A Flexible Open-Source Integrated-Assessment-Model for Geologic Carbon Storage Risk Assessment and Management. Environ. Model. Softw. 2021, 143, 105114. [Google Scholar] [CrossRef]
  51. Brown, C.F.; Lackey, G.; Mitchell, N.; Baek, S.; Schwartz, B.; Dean, M.; Dilmore, R.; Blanke, H.; O’Brien, S.; Rowe, C. Integrating Risk Assessment Methods for Carbon Storage: A Case Study for the Quest Carbon Capture and Storage Facility. Int. J. Greenh. Gas Control 2023, 129, 103972. [Google Scholar] [CrossRef]
  52. Bacon, D.H.; Demirkanli, D.I.; White, S.K. Probabilistic Risk-Based Area of Review (AoR) Determination for a Deep-Saline Carbon Storage Site. Int. J. Greenh. Gas Control 2020, 102, 103153. [Google Scholar] [CrossRef]
  53. Bandilla, K.; Court, B.; Elliot, T.R.; Celia, M.A. Comparison of Brine Production Scenarios for Geologic Carbon Sequestration Operations. In Proceedings of the Carbon Management Technology Conference, Orlando, FL, USA, 5 April 2012. [Google Scholar]
Figure 1. Nine pre-defined types of wells within AoR reprinted with permission from Elsevier [46].
Minerals 14 00383 g001
Figure 2. Structural elevation of primary confining seal—Maquoketa formation.
Minerals 14 00383 g002
Figure 3. Structural elevation of the storage complex—St. Peter Formation.
Minerals 14 00383 g003
Figure 4. (A) Age of wells and (B) availability of well logs.
Minerals 14 00383 g004
Figure 5. Hole section depths—surface and production casings.
Minerals 14 00383 g005
Figure 6. Length of individual plugs with 1, 2, and 3 plugs in P&A reports.
Minerals 14 00383 g006
Figure 7. LG 1 site risk assessment results.
Minerals 14 00383 g007
Figure 8. Risk assessment map of all wells within AoR.
Minerals 14 00383 g008
Figure 9. Qualitative risk assessment of 94 wells penetrating primary confining seal within the AoR.
Minerals 14 00383 g009
Figure 10. Maquoketa isopach along with wells of concern (partially penetrating Maquoketa).
Minerals 14 00383 g010
Table 1. Summary of Subsurface Evaluations—Lively Grove #1 well (LG1) Site.
Storage ReservoirNameSt. Peter Sandstone
Approx. Depth (ft)3570
Approx. thickness (ft)170
Primary Confining SealNameOrdovician Maquoketa Shale Group
Approx. Top (ft)2790
Approx. thickness (ft)150
Lowermost USDWFormation nameShallow Bedrock deposits
Approx. Top (ft)Within 500 ft
Legacy WellboresWell penetrating lowermost storage reservoir300 boring records within 25 miles area penetrating through Maquoketa Shale.
Table 2. Lively Grove 1 site formation code summary.
Southern IllinoisNorthern Illinois
Primary Confining Seal
SystemGroupFormationFormationGroupSystem
Ordovician
(209ODVC)
Maquoketa Fm
(203MQKT)
Brainard
(203BRRD)
Maquoketa Fm
(203MQKT)
Ordovician
(209ODVC)
Ft. Atkinson
(203FRAK)
Cape Ls
(352CRPR)
Scales Sh
(203SCLS)
Below Primary Confining Seal
Ordovician
(209ODVC)
Galena
(202GLEN)
Kimmswick Ls
(202KMCK)
Dubuque
(203DUBQ)
Galena
(202GLEN)
Ordovician
(209ODVC)
Wise Lake
(203WSLK)
Decorah
(202DCRH)
Dunleith
(202DNLT)
Decorah
(202DCRH)
Platteville
(202PLVL)
Plattin Ls
(202PLTN)
Quimbys Mill
(202QMBY)
Platteville
(202PLVL)
Nachusa
(202NCHS)
Grand Detour
(202GRDD)
Mifflin
(202MFLN)
Pecatonica
(202PCNC)
Pecatonica
(202PCNC)
Ancell
(202ANCL)
Joachim Dol
(202JCHM)
Joachim Dol
(202JCHM)
Ancell
(202ANCL)
Dutchtown Ls
Storage Reservoir
Ordovician
(209ODVC)
Ancell
(202ANCL)
St Peter
(202SPTR)
St Peter
(202SPTR)
Ancell
(202ANCL)
Middle Ordovician
(209ODVC)
Secondary Storage Reservoir
Cambrian
(159CMBR)
Knox
(169KNOX)
Potosi
(153POTS)
Potosi
(153POTS)
Knox
(169KNOX)
Cambrian
(159CMBR)
Table 3. Number of plugs in abandoned wells.
Number of Cement Plug (s)Number of Wells
1135
2115
356
43
51
61
Table 4. Wells with Maquoketa as TD formation code.
Sr. No Current Well Type API10PTD (ft)Estimated Maquoketa Thickness (ft)Trenton Tops
Estimated (ft)
Maquoketa Below TD (ft)
1Type 112163293652613155265542
2Type 112163237892350150243585
3Type 612163256312614145270288
4Type 612189245863300155332727
5Type 612189244853002122308078
6Type 612189017722712145278068
7Type 612189028663601105365554
8Type 8121572498426001162716116
Disclaimer/Publisher’s Note: The statements, opinions and data contained in all publications are solely those of the individual author(s) and contributor(s) and not of MDPI and/or the editor(s). MDPI and/or the editor(s) disclaim responsibility for any injury to people or property resulting from any ideas, methods, instructions or products referred to in the content.

