1. Introduction
As mine development and production activities continue, mining front stresses in drifts, ramps, and sill drives keep on changing. Such dynamic changes could significantly influence the stability of the mining front, leading to one of various forms of rock failure. Therefore, many research efforts have been focused on studying mining-induced stress, e.g., [
1,
2,
3,
4,
5]. Such studies, however, have primarily employed a single study approach, such as numerical simulation, theoretical analysis, or field testing. In this study, the estimation of mining-induced stress distribution and mining front stability is performed through a combination of field work, laboratory measurements, and numerical modelling. The significance of the proposed methodology lies in the use of actual in situ data that are precisely measured in laboratory. The measurements are then used as input parameters in a theoretical model for mining front stress estimation at the point of the in situ experiment. Finally, the estimated stress information obtained from this procedure is used to calibrate the numerical model of the mining front, enabling the prediction of the complete stress distribution and the assessment of the front stability.
The principal stresses in the plane parallel to the mining front can initiate face failure by triggering different failure mechanisms, such as spalling, slabbing, burst, bulking and out-of-plane shear failure [
6,
7]. In deep mining, these planar stresses could cause immediate failure, even rockburst, during mining, especially in brittle rock [
8]. Consequently, it is important to regularly assess the mining front stability.
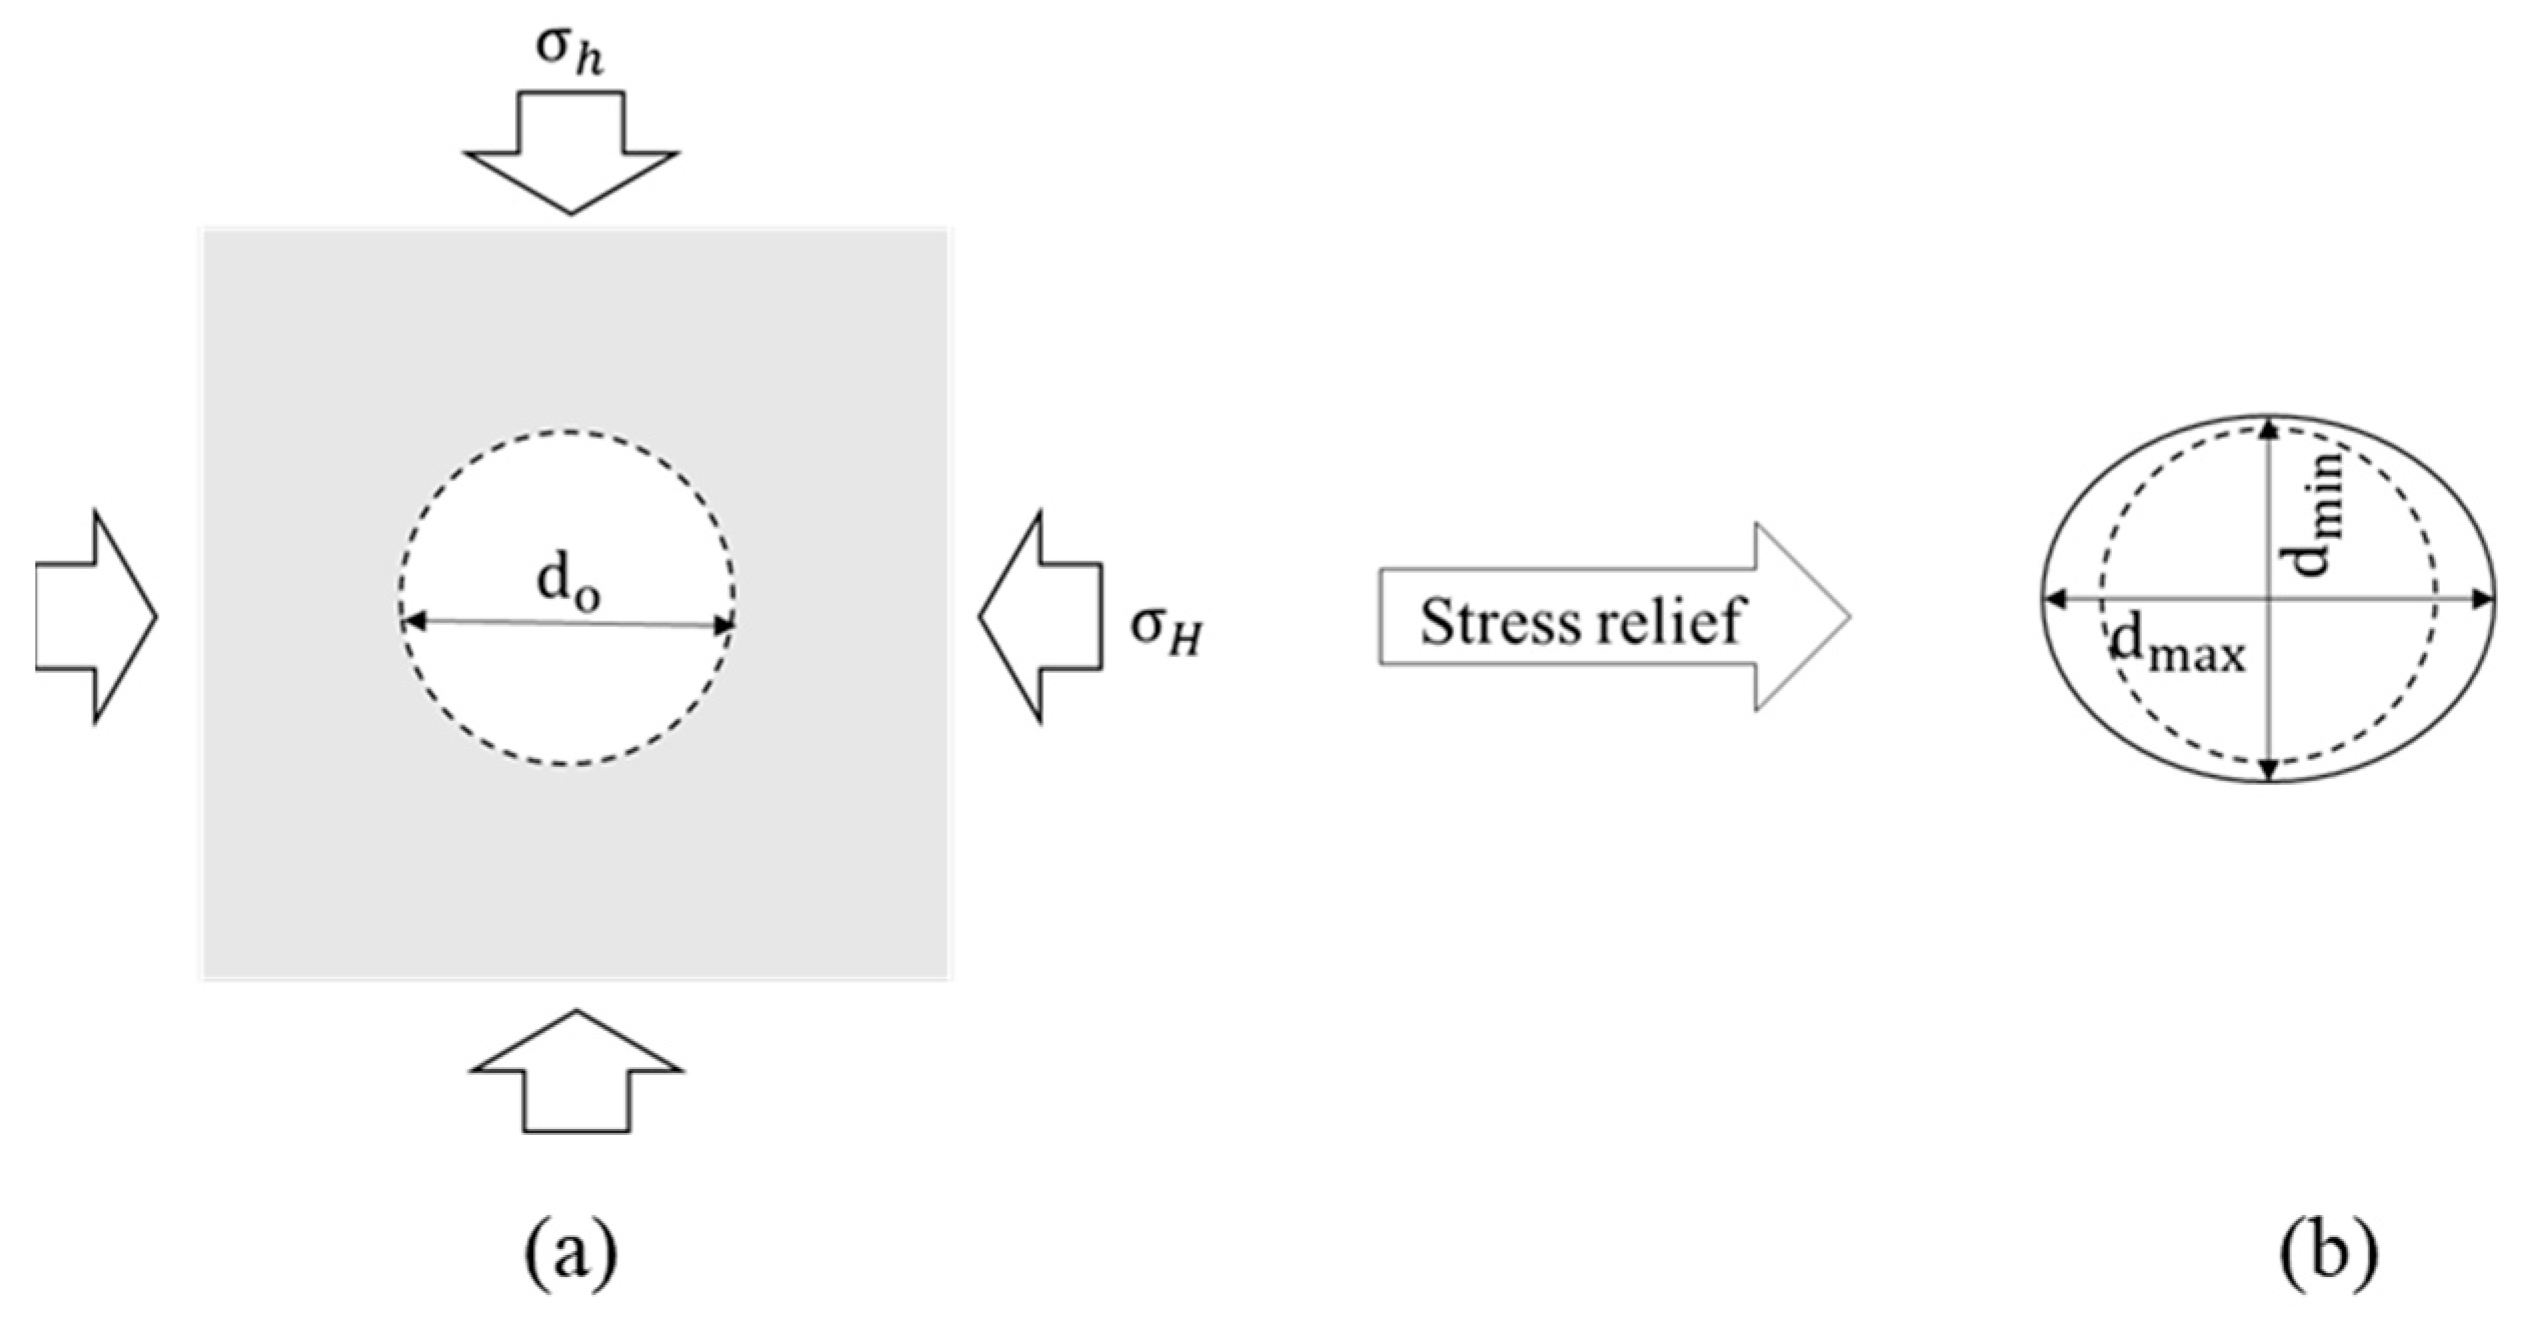
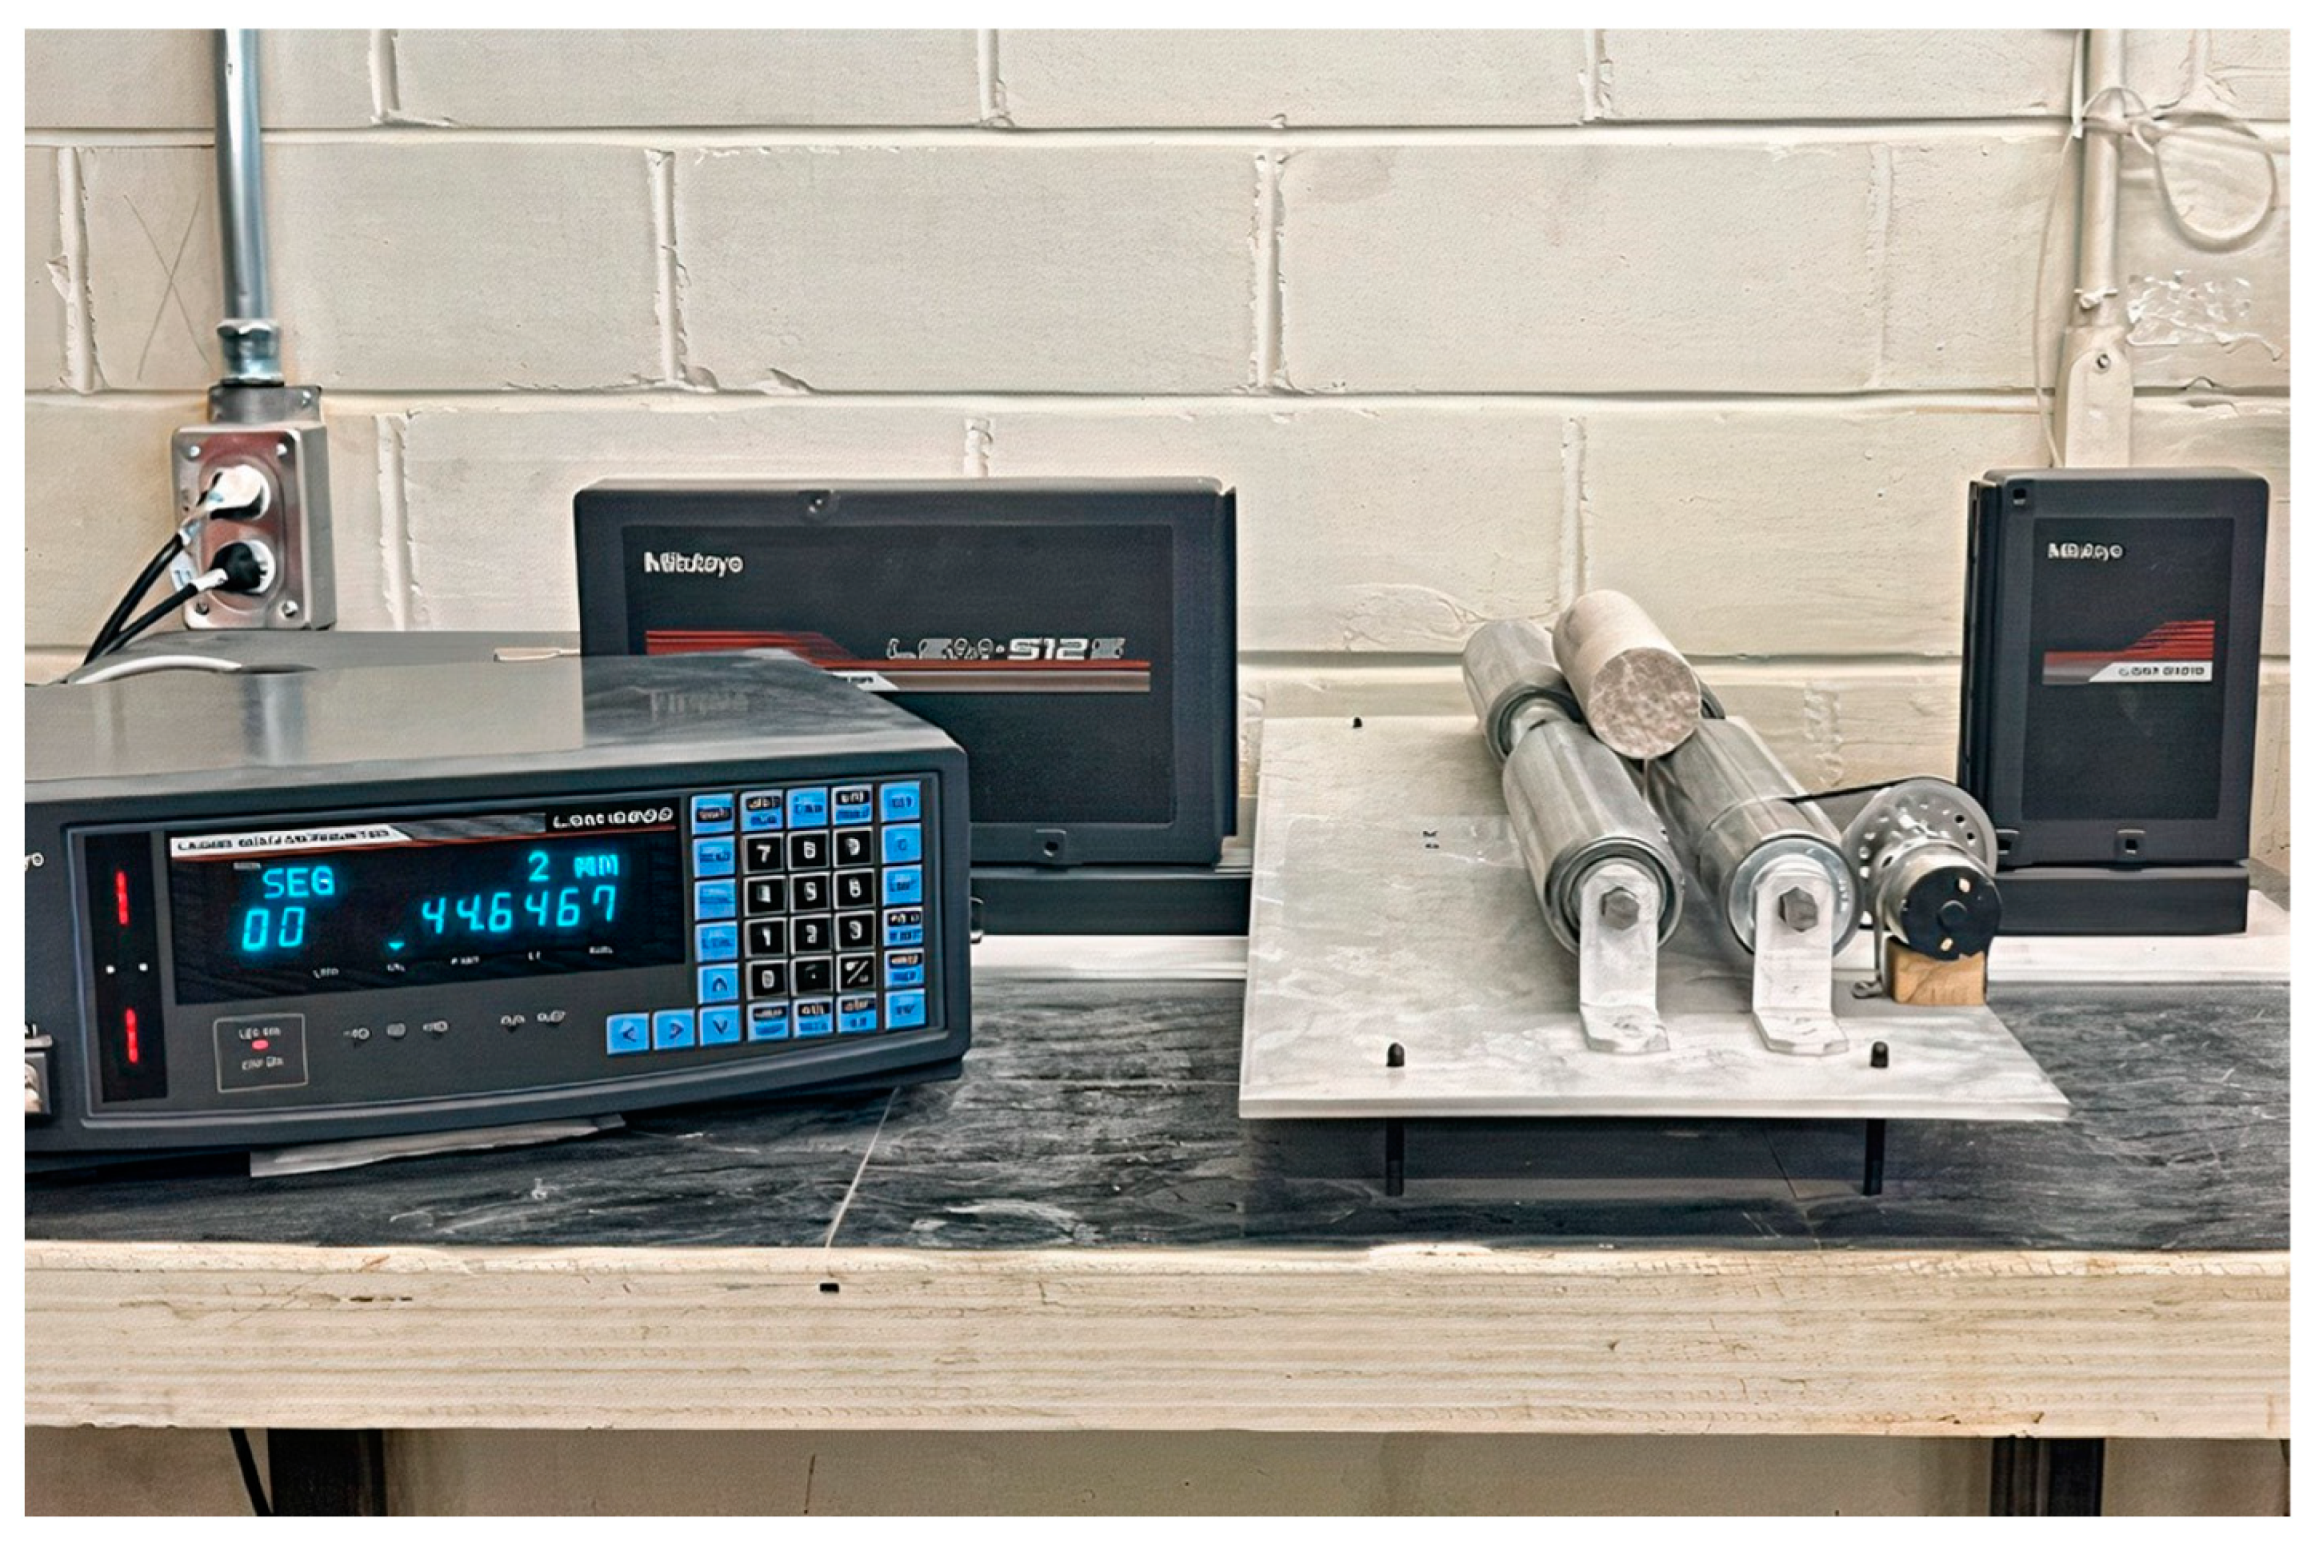
This research proposes a practical methodology for mining front stability evaluation using the diametrical core deformation technique (DCDT) and numerical modelling. DCDT, a recently developed technique by the authors for determining mining-induced planar stresses based on the diametrical core deformations [
9], relies on measuring the stress relief of rock cores to estimate the induced stress at the point of core extraction. Such relief can be captured in laboratory through a custom-designed core diameter measuring system [
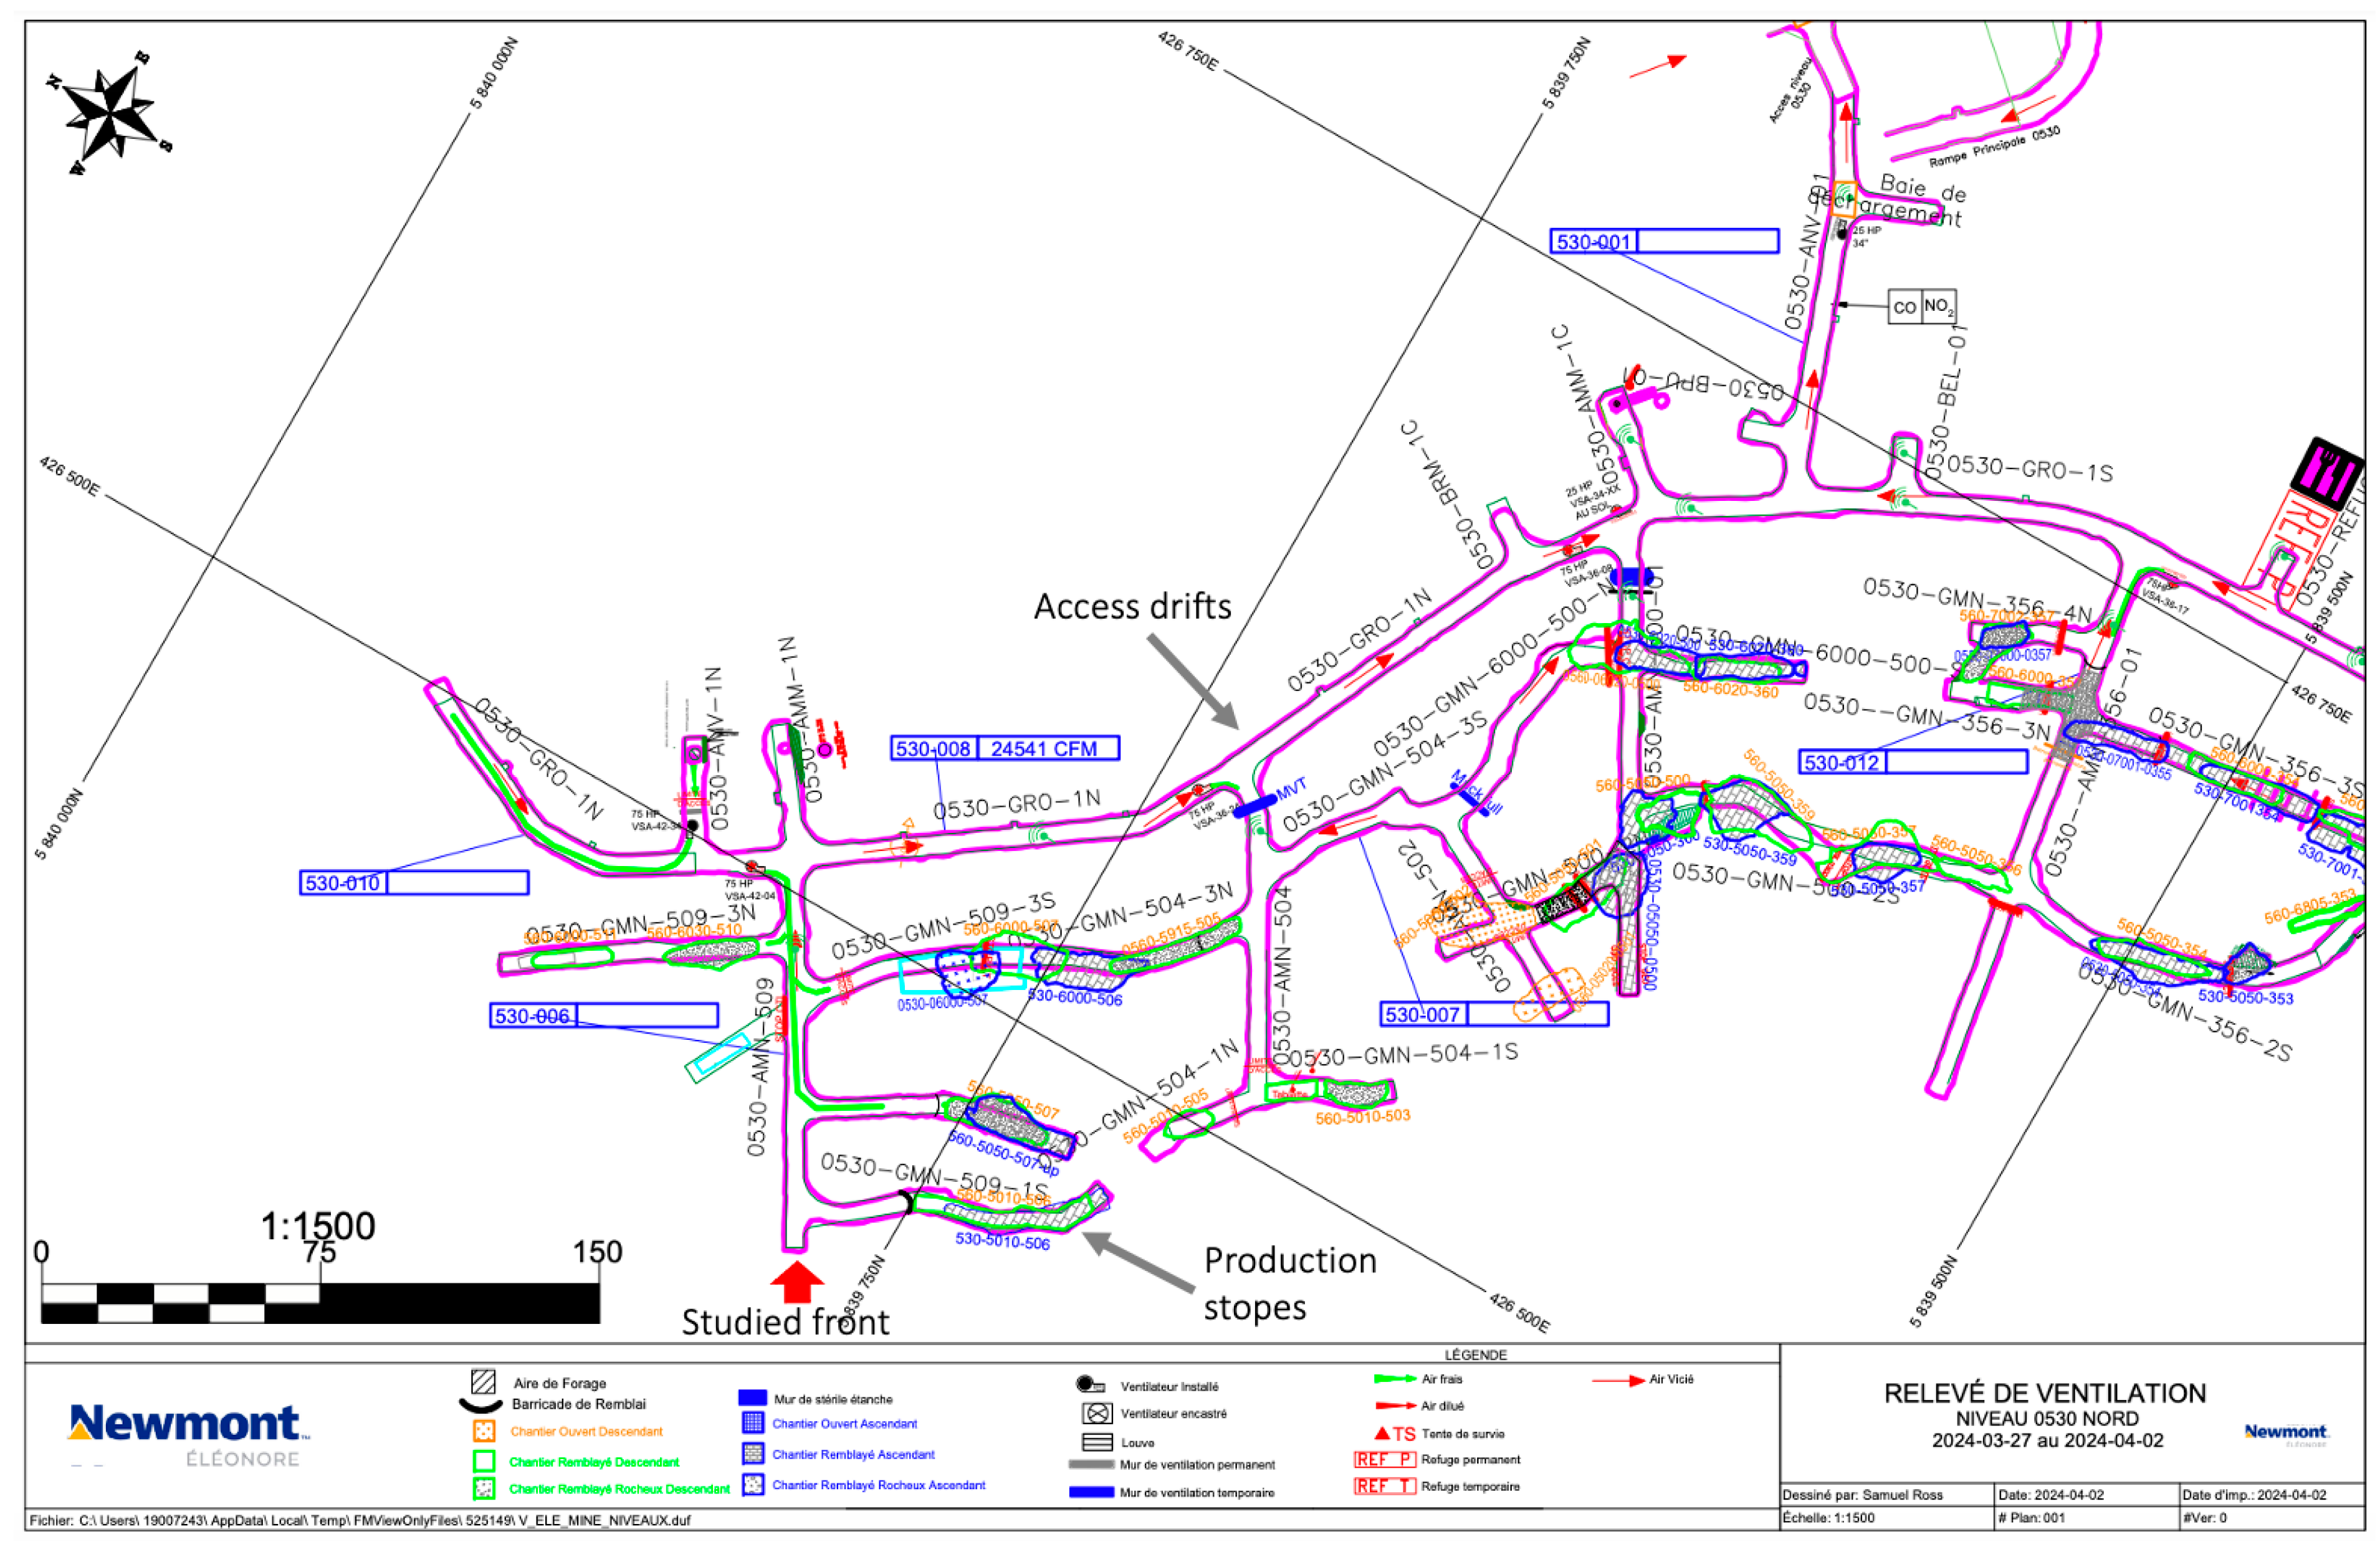
10]. Numerical modelling is employed to simulate the conditions near the access drift of the case study at the Elenore mine in northern Quebec, Canada.
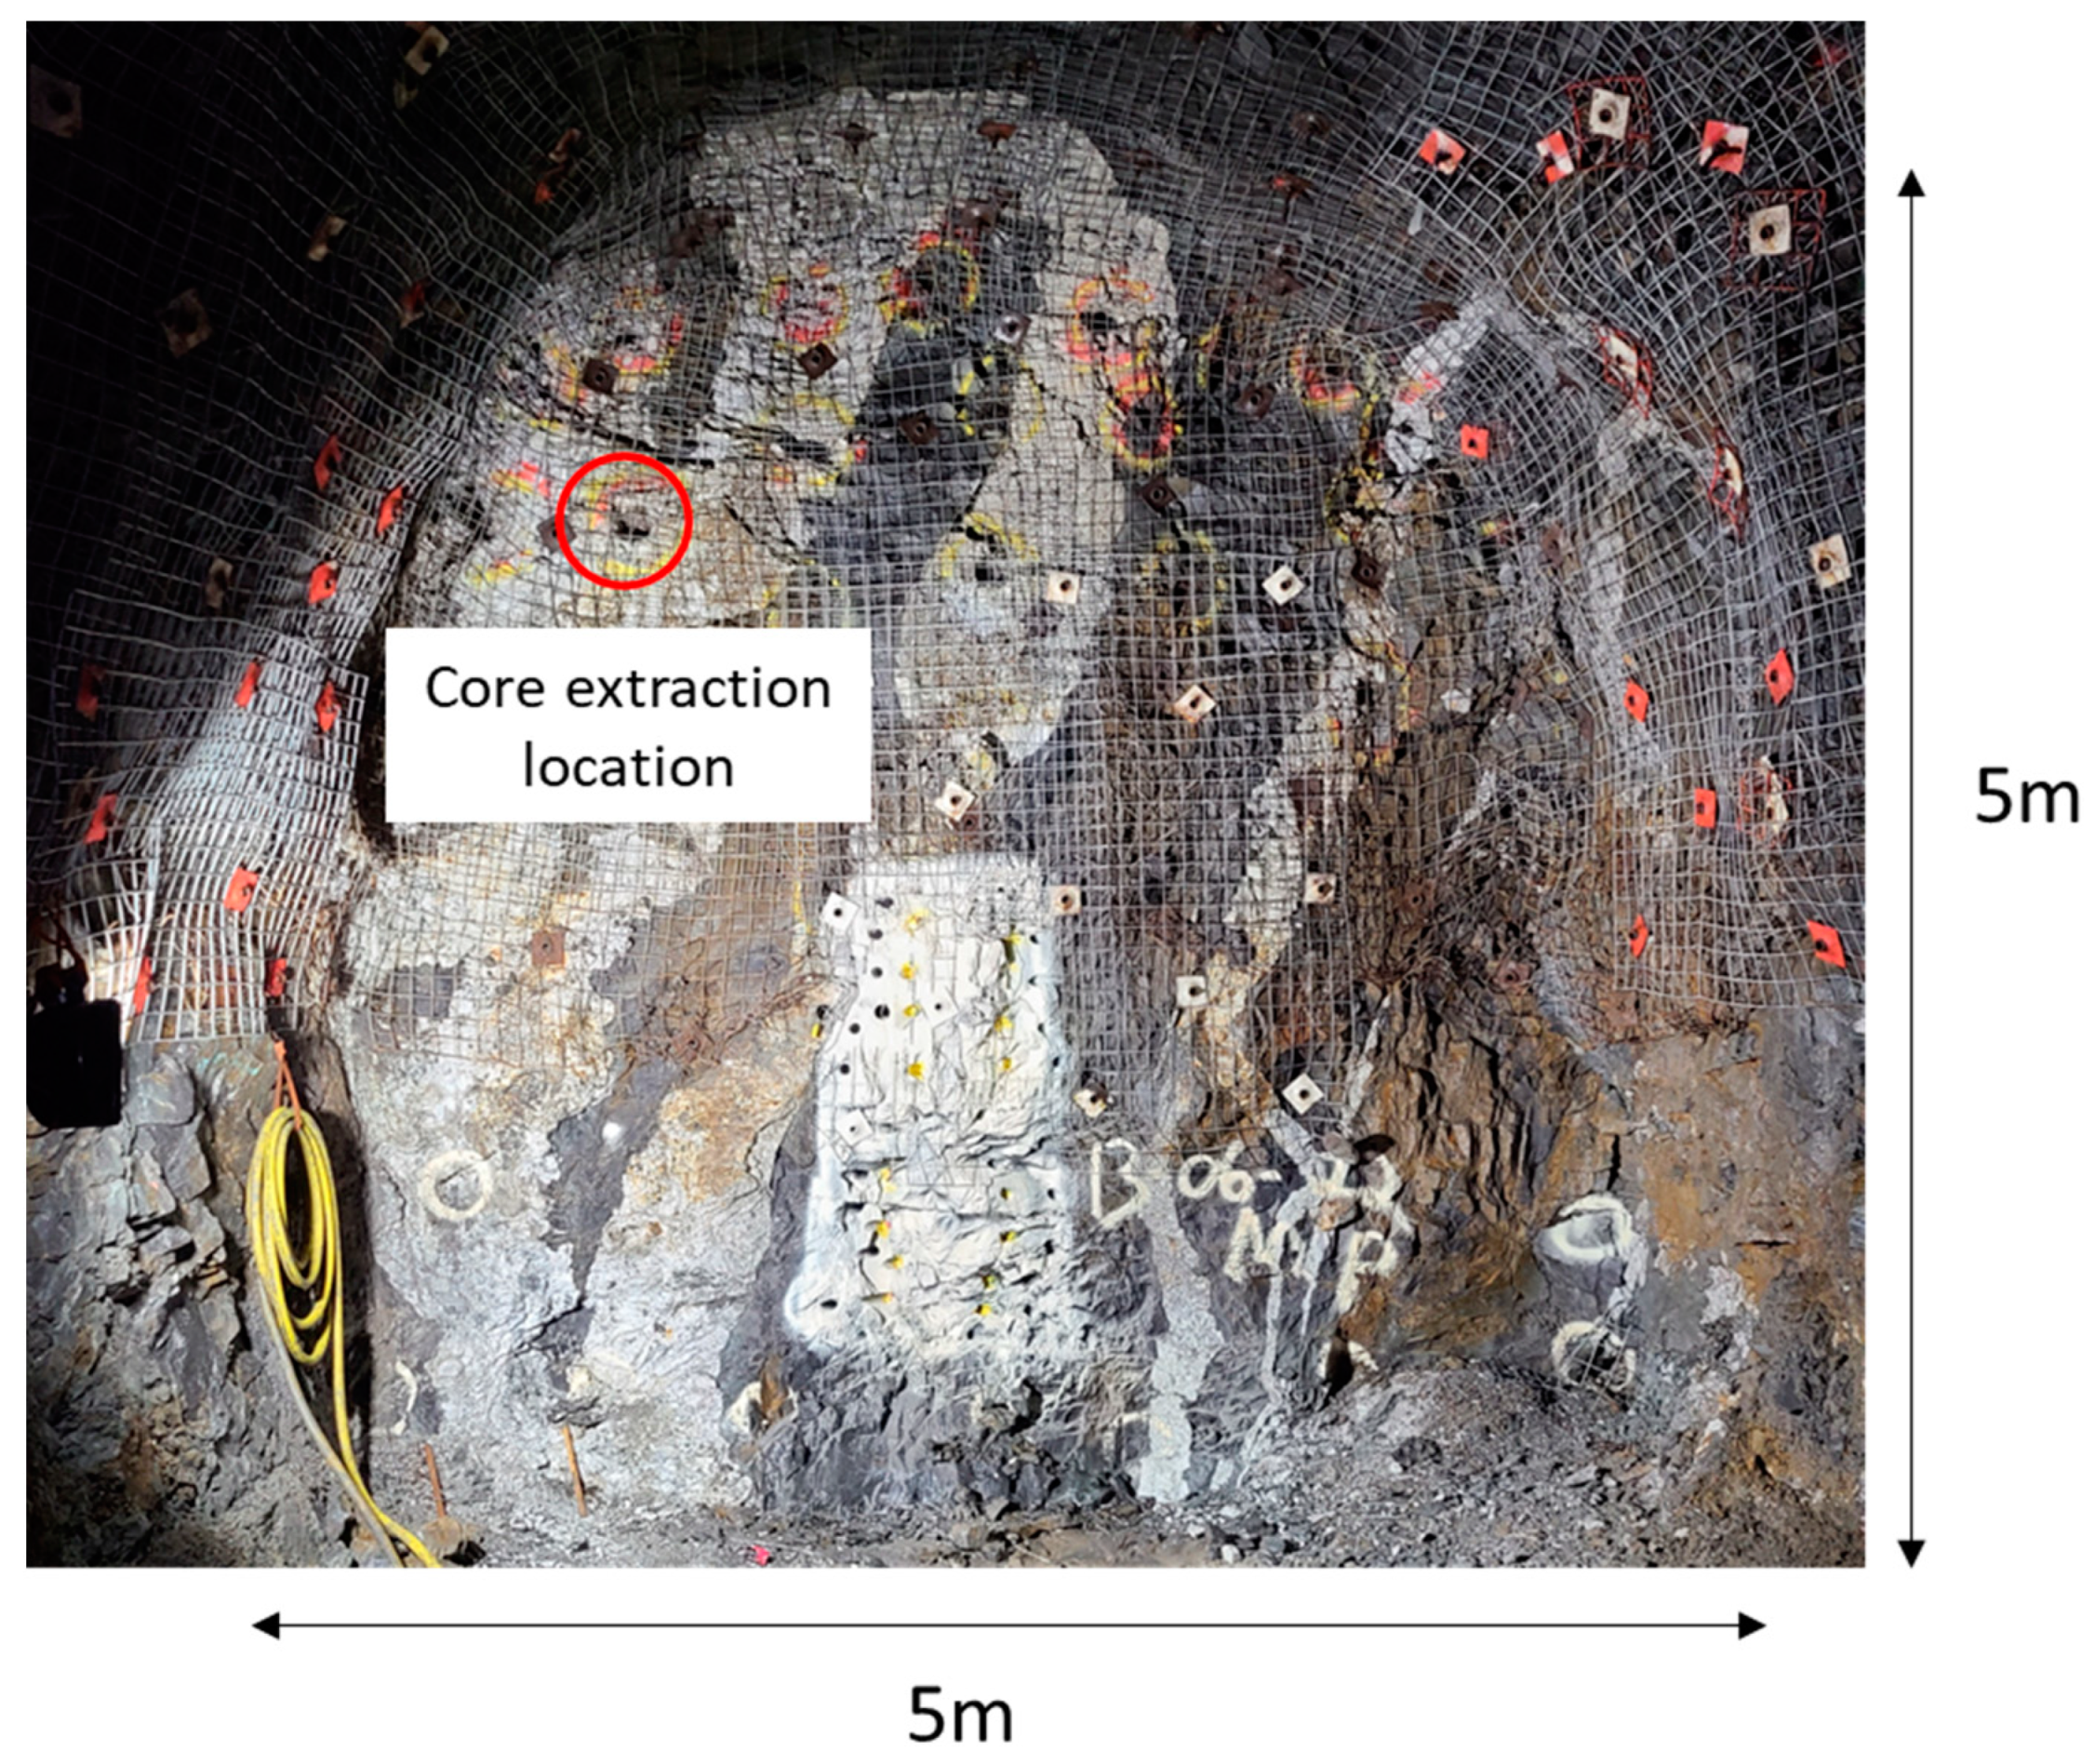
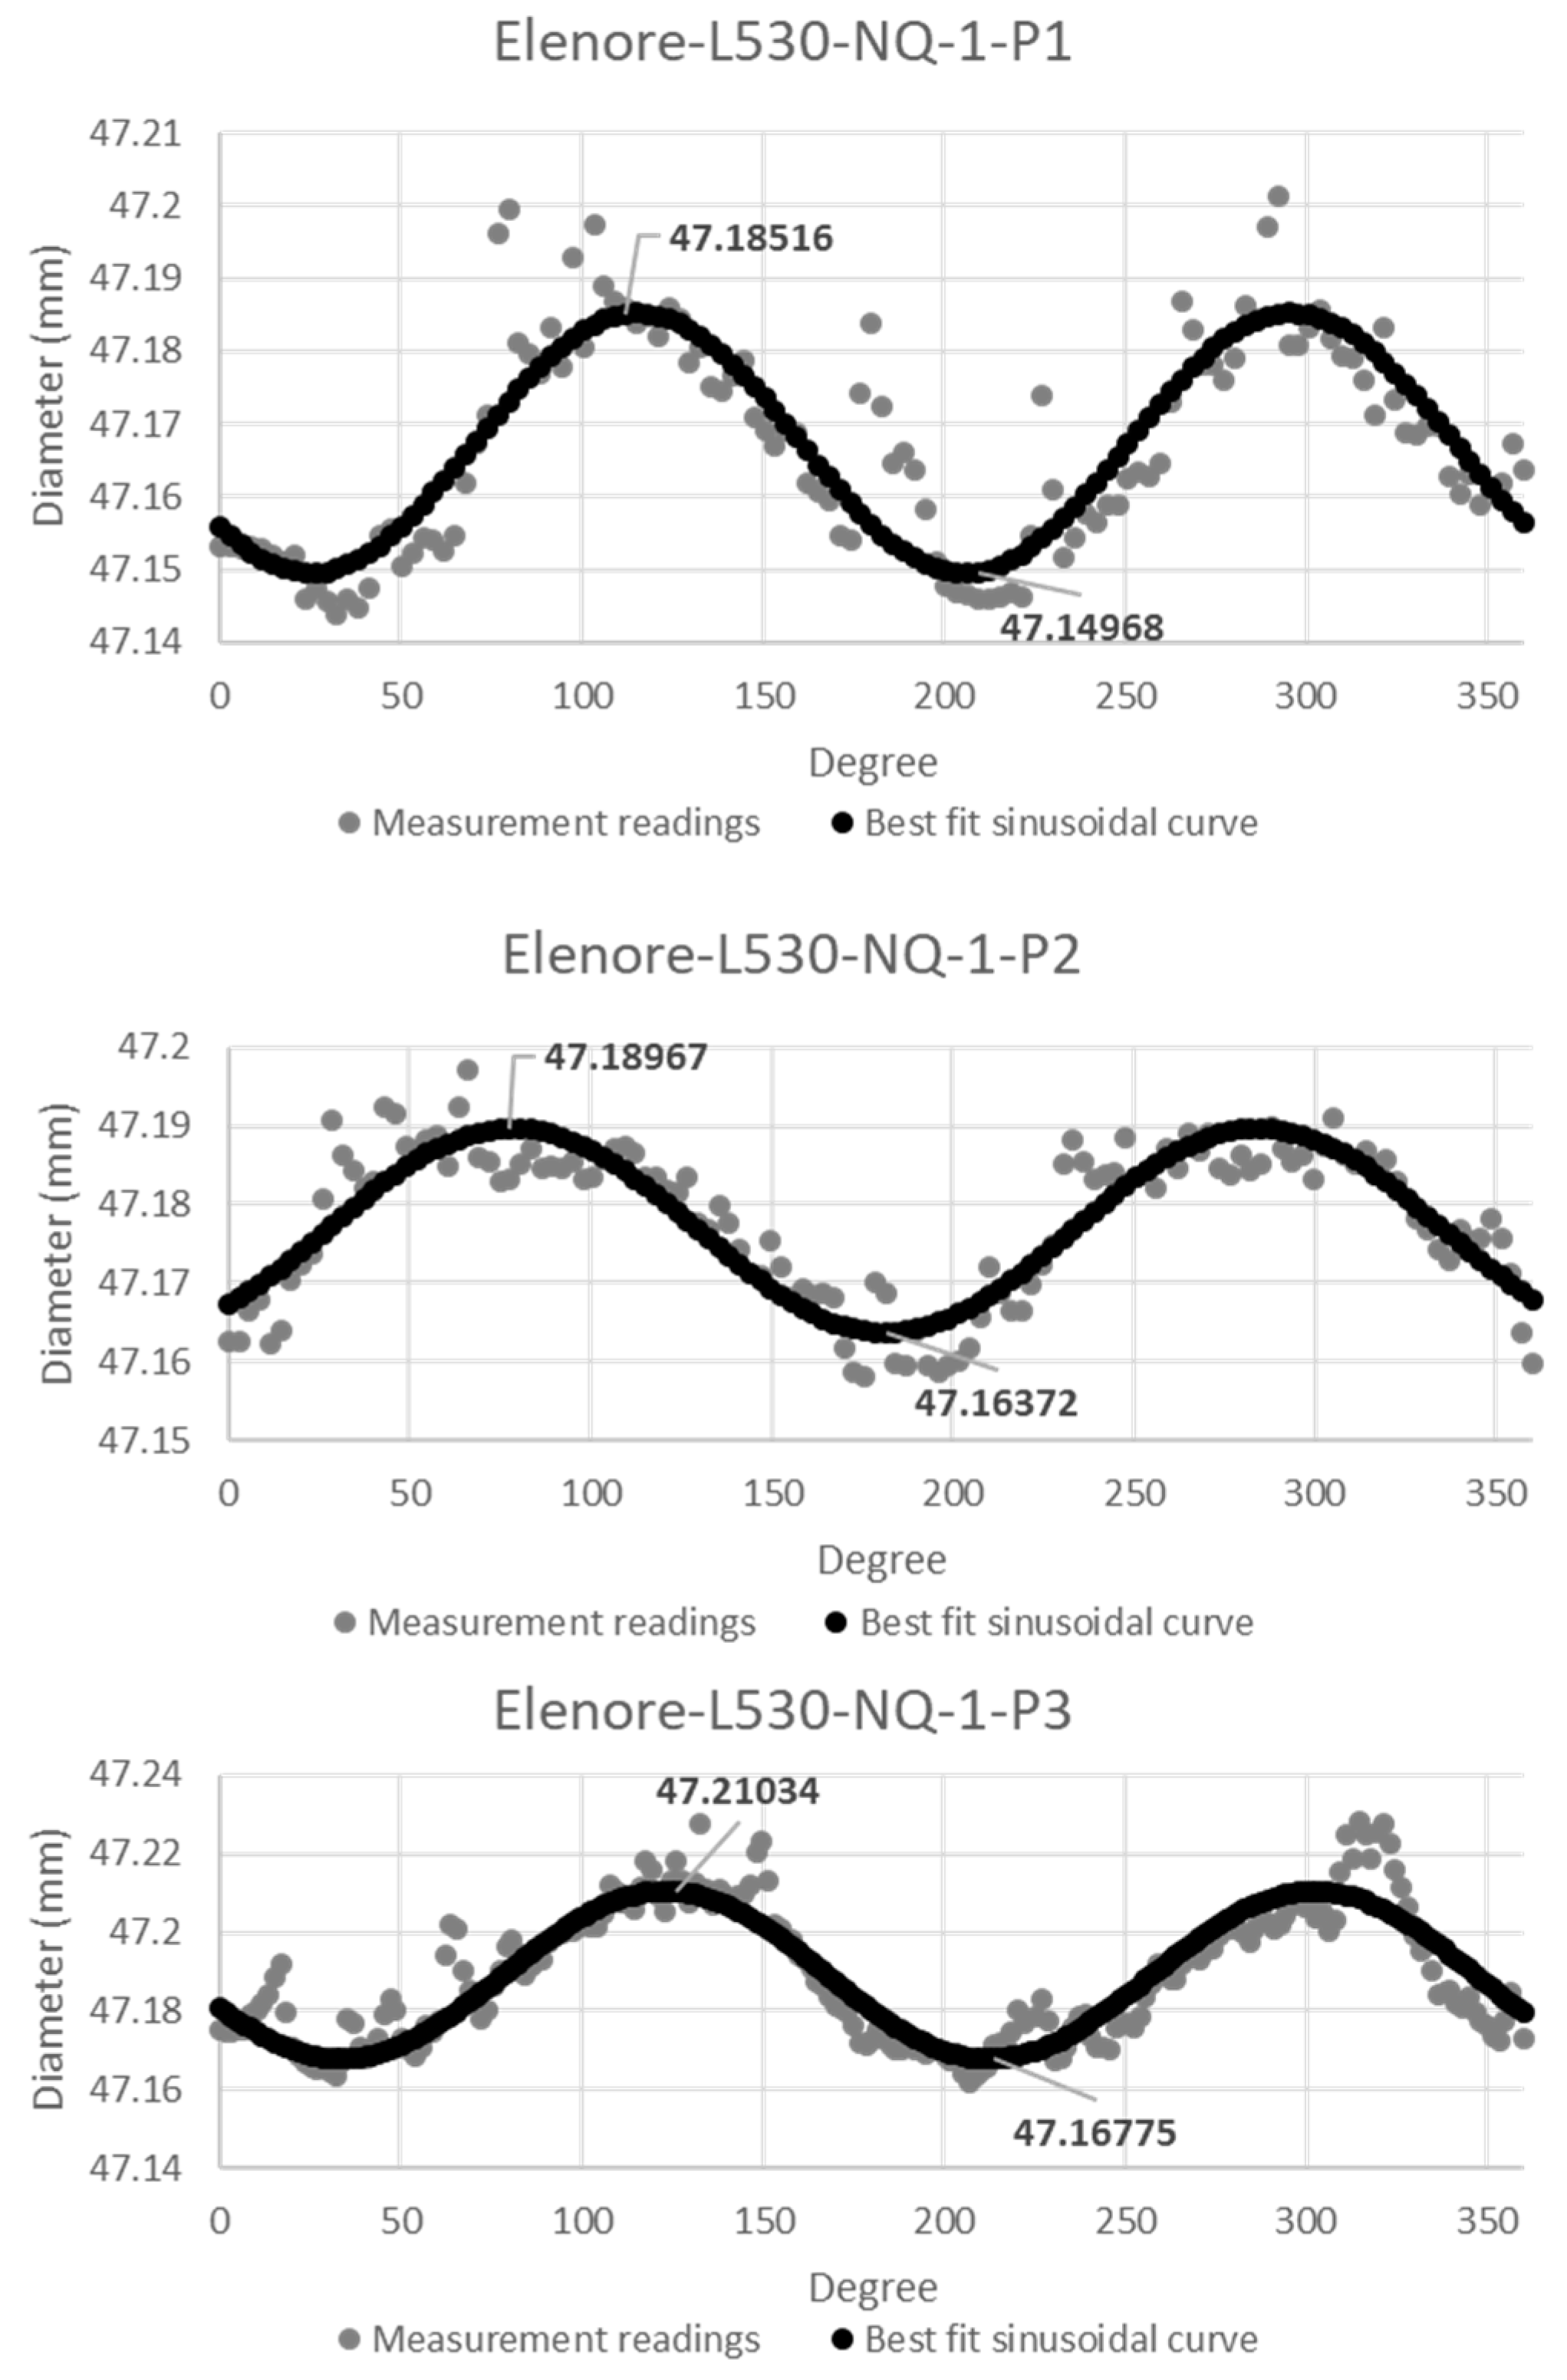
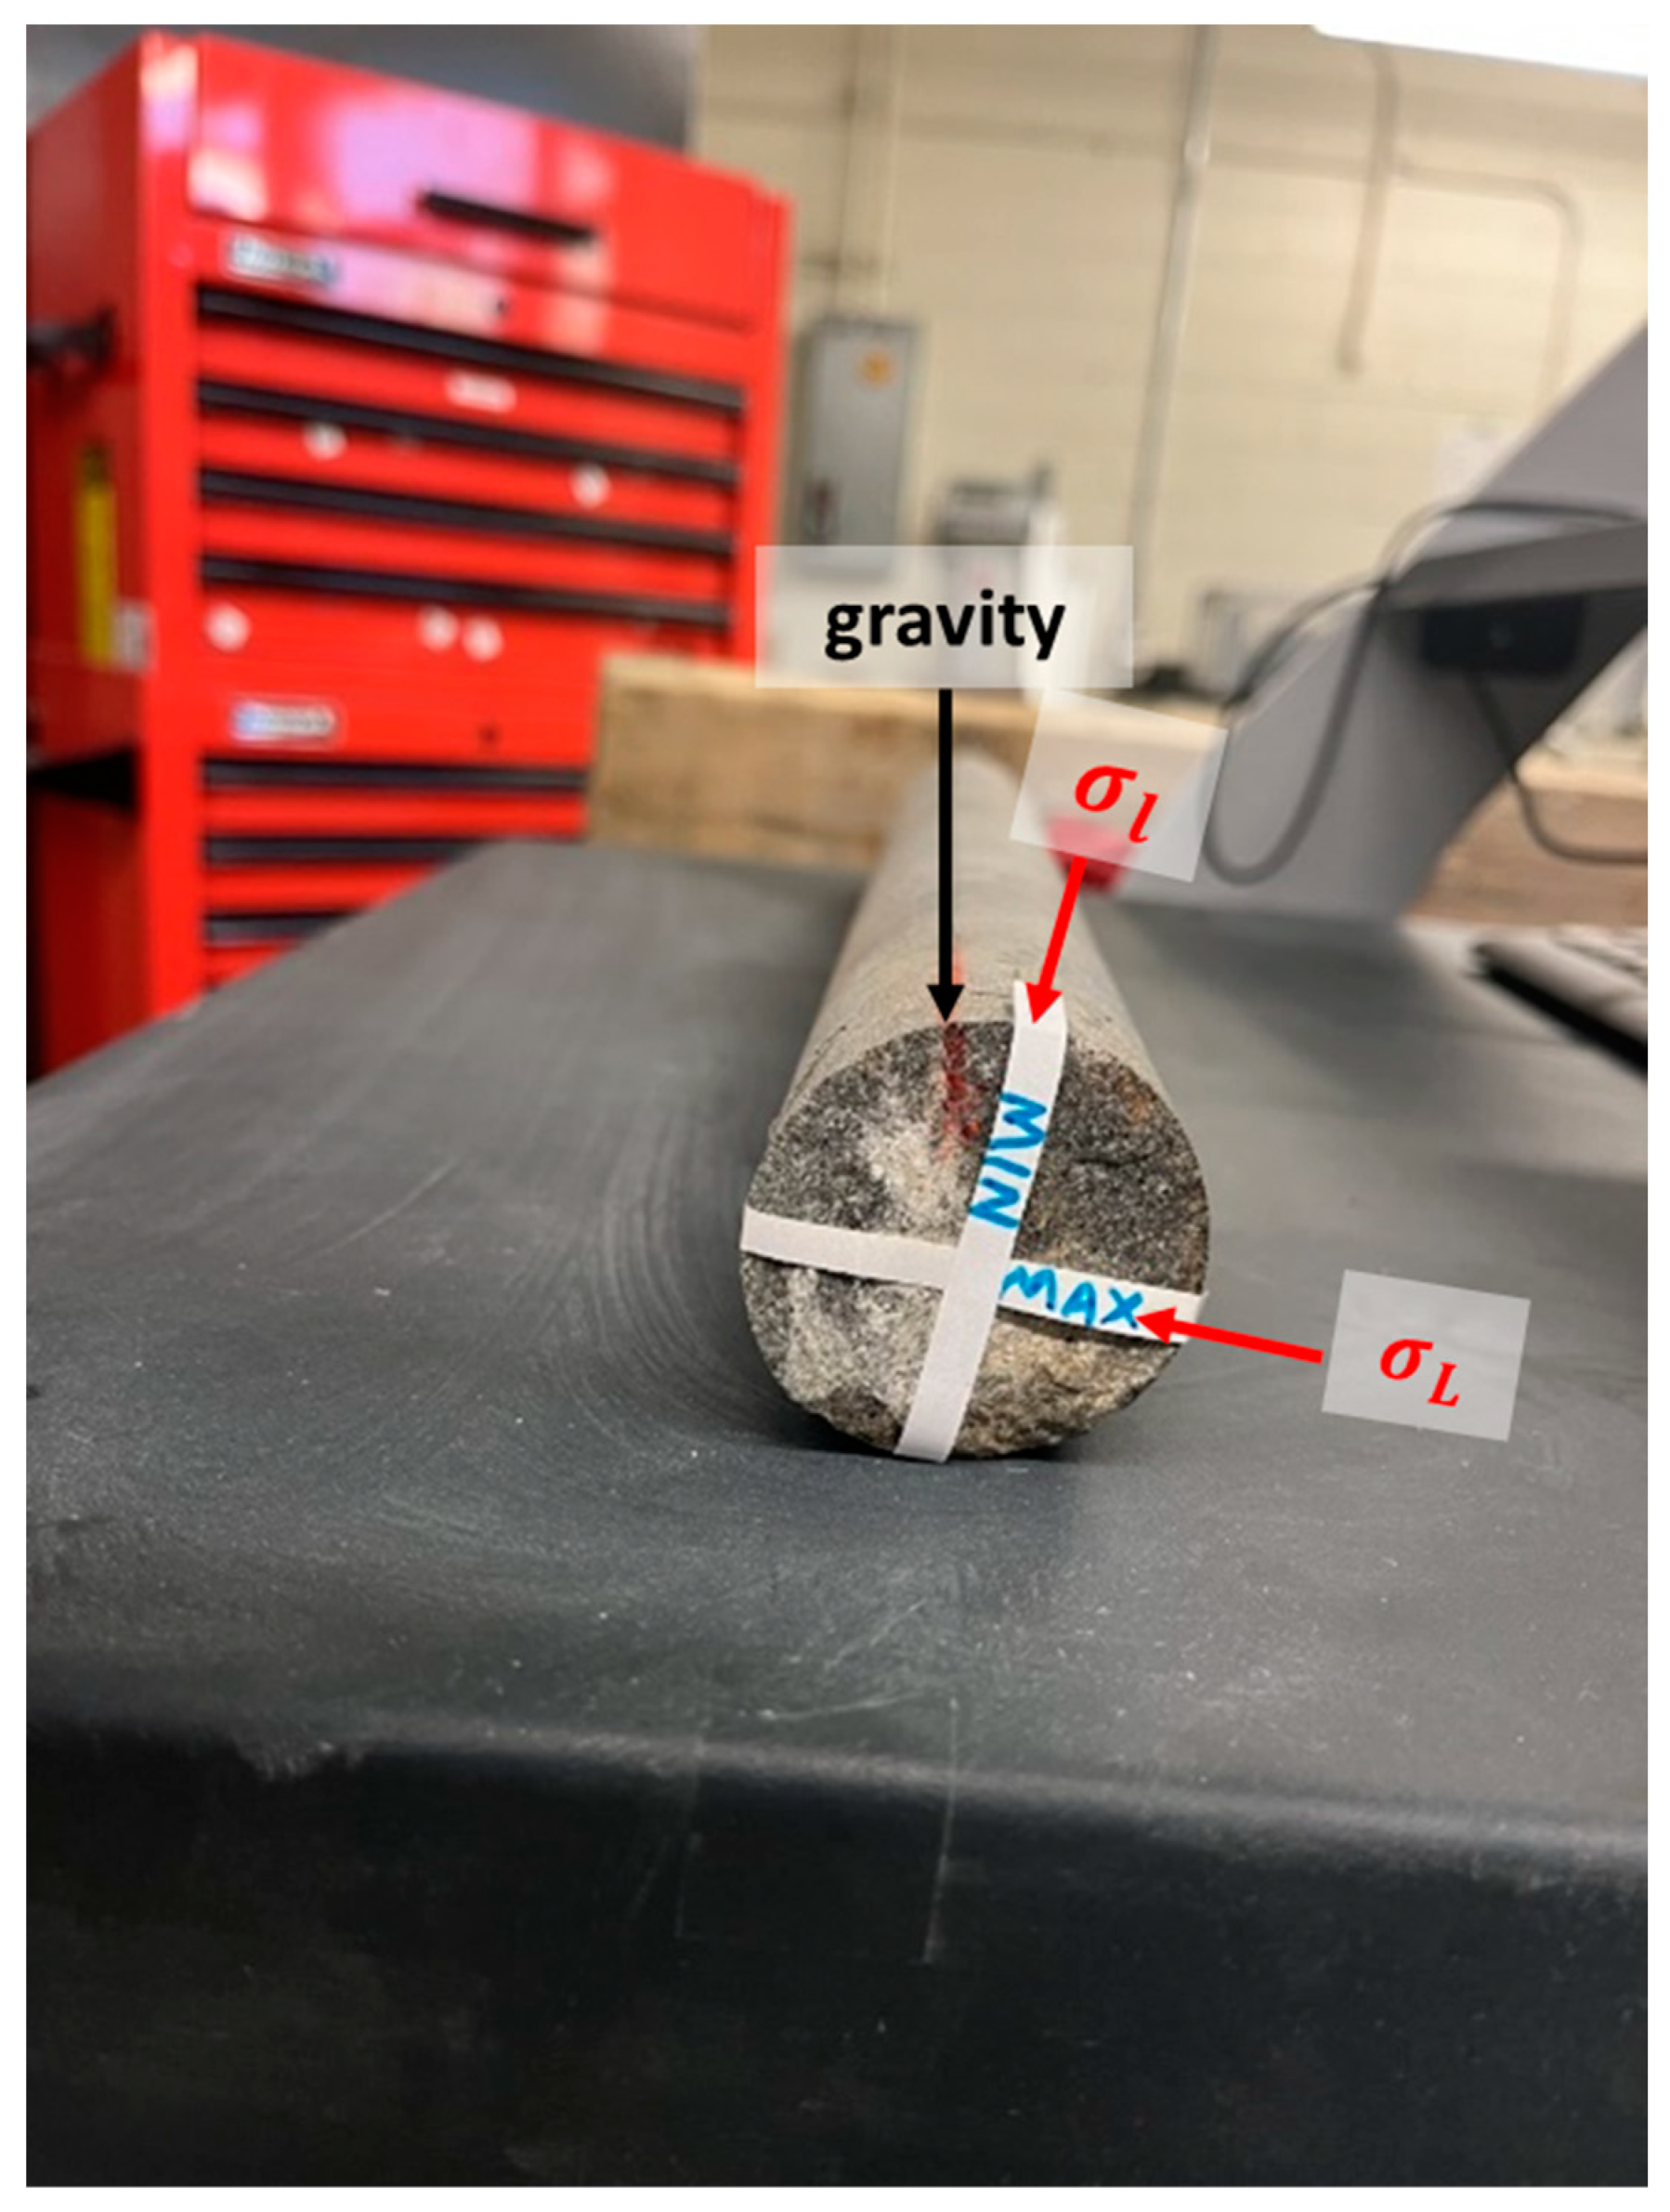
In this case study, a rock core was retrieved from the face of an access drift on the 530 level. A portion of the intact rock obtained at 2.5 m from the face was used to conduct the DCDT, facilitating the determination of planar principal stresses, both in terms of magnitude and orientation. Subsequently, the DCDT results were used to adjust the local stress orientation and magnitude in a 3D numerical model to obtain a complete stress distribution over the mining front. The Hoek–Brown failure criterion was then selected in the numerical model to complete the stability analysis of the mining face. The choice of the failure criterion is one that is made by the analyst and has no bearing on the validity of the proposed methodology.
2. Case Study Mine
Eleonore is a gold mining operation in northern Quebec, Canada, owned by Newmont Corporation. The Eleonore deposit is located under the Opinaca reservoir; it outcrops to surface in the Roberto area and extends 1.9 km along the strike and over at least 1400 m below surface. The projected production rate is 270,000 oz per year using a longhole open stoping mining method. The footwall developments are driven in thinly bedded wacke, sporadically traversed by pegmatite dykes and quartz veins and veinlets. The case study drift is situated 530 m below the surface.
Field and laboratory investigations of the mechanical properties of the rockmass were commissioned by Eleonore Mine in 2008. The results of the uniaxial compressive strength (UCS), tensile strength (
), Young’s modulus of elasticity for intact rock (
), Young’s modulus of elasticity for rockmass (
), Poisson’s ratio (
ν), and Hoek–Brown’s
parameter for intact rock, are listed in
Table 1. The mechanical properties of the intact rock (which were used for DCDT calculations) and the rockmass properties of the wacke rock, which were used for numerical modelling.
There are several in situ stress measurements that have been conducted at Eleonore; the maximum principal stress is generally in E-W and the local maximum stress varies to the direction that perpendicular to folds of the orebody [
11]. Stress conditions are given as follows:
where
is the maximum horizontal in situ stress and
is the minimum horizontal stress;
is the vertical in situ stress;
is the rock unit weight, equal to 0.0275 MN/
for the wacke formation; and
z is the depth.
4. Numerical Modelling
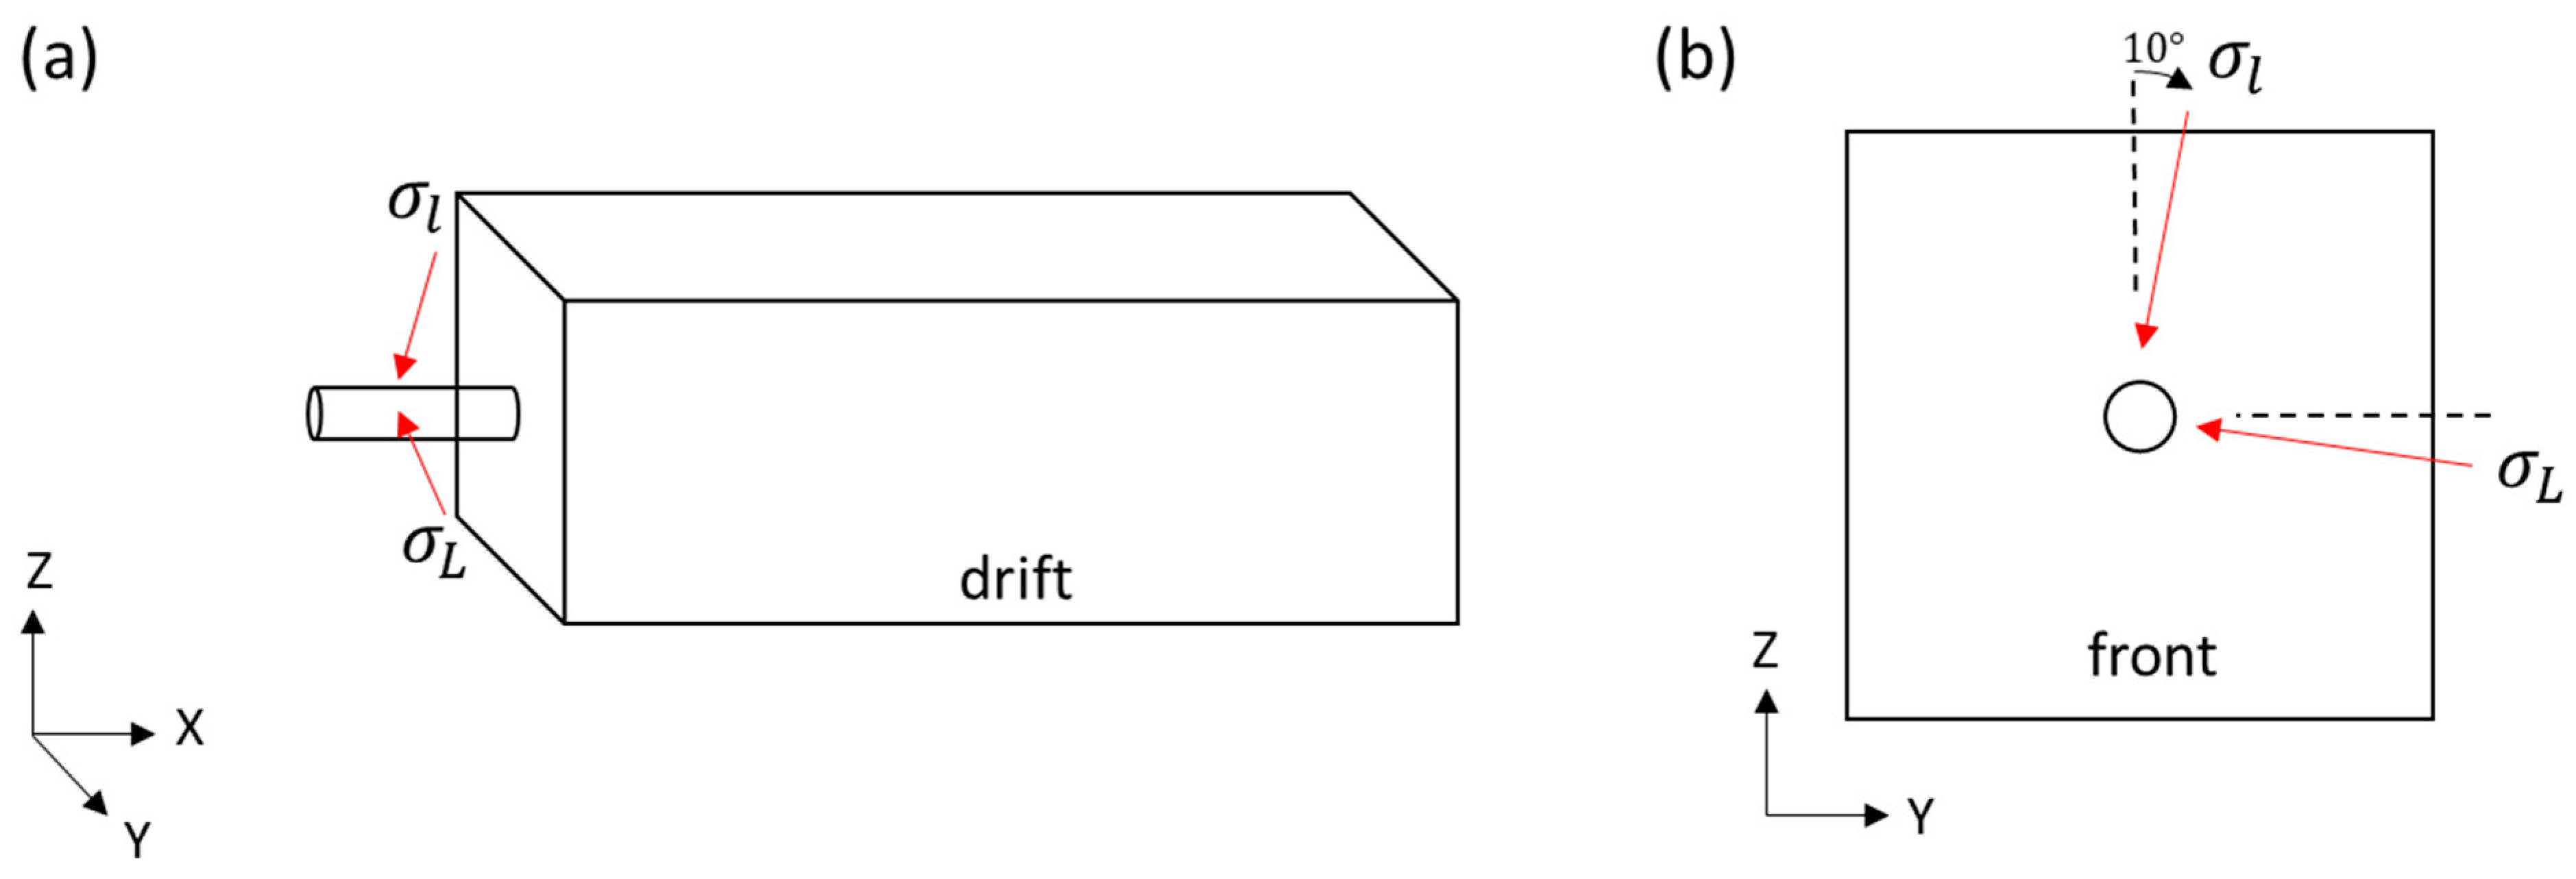
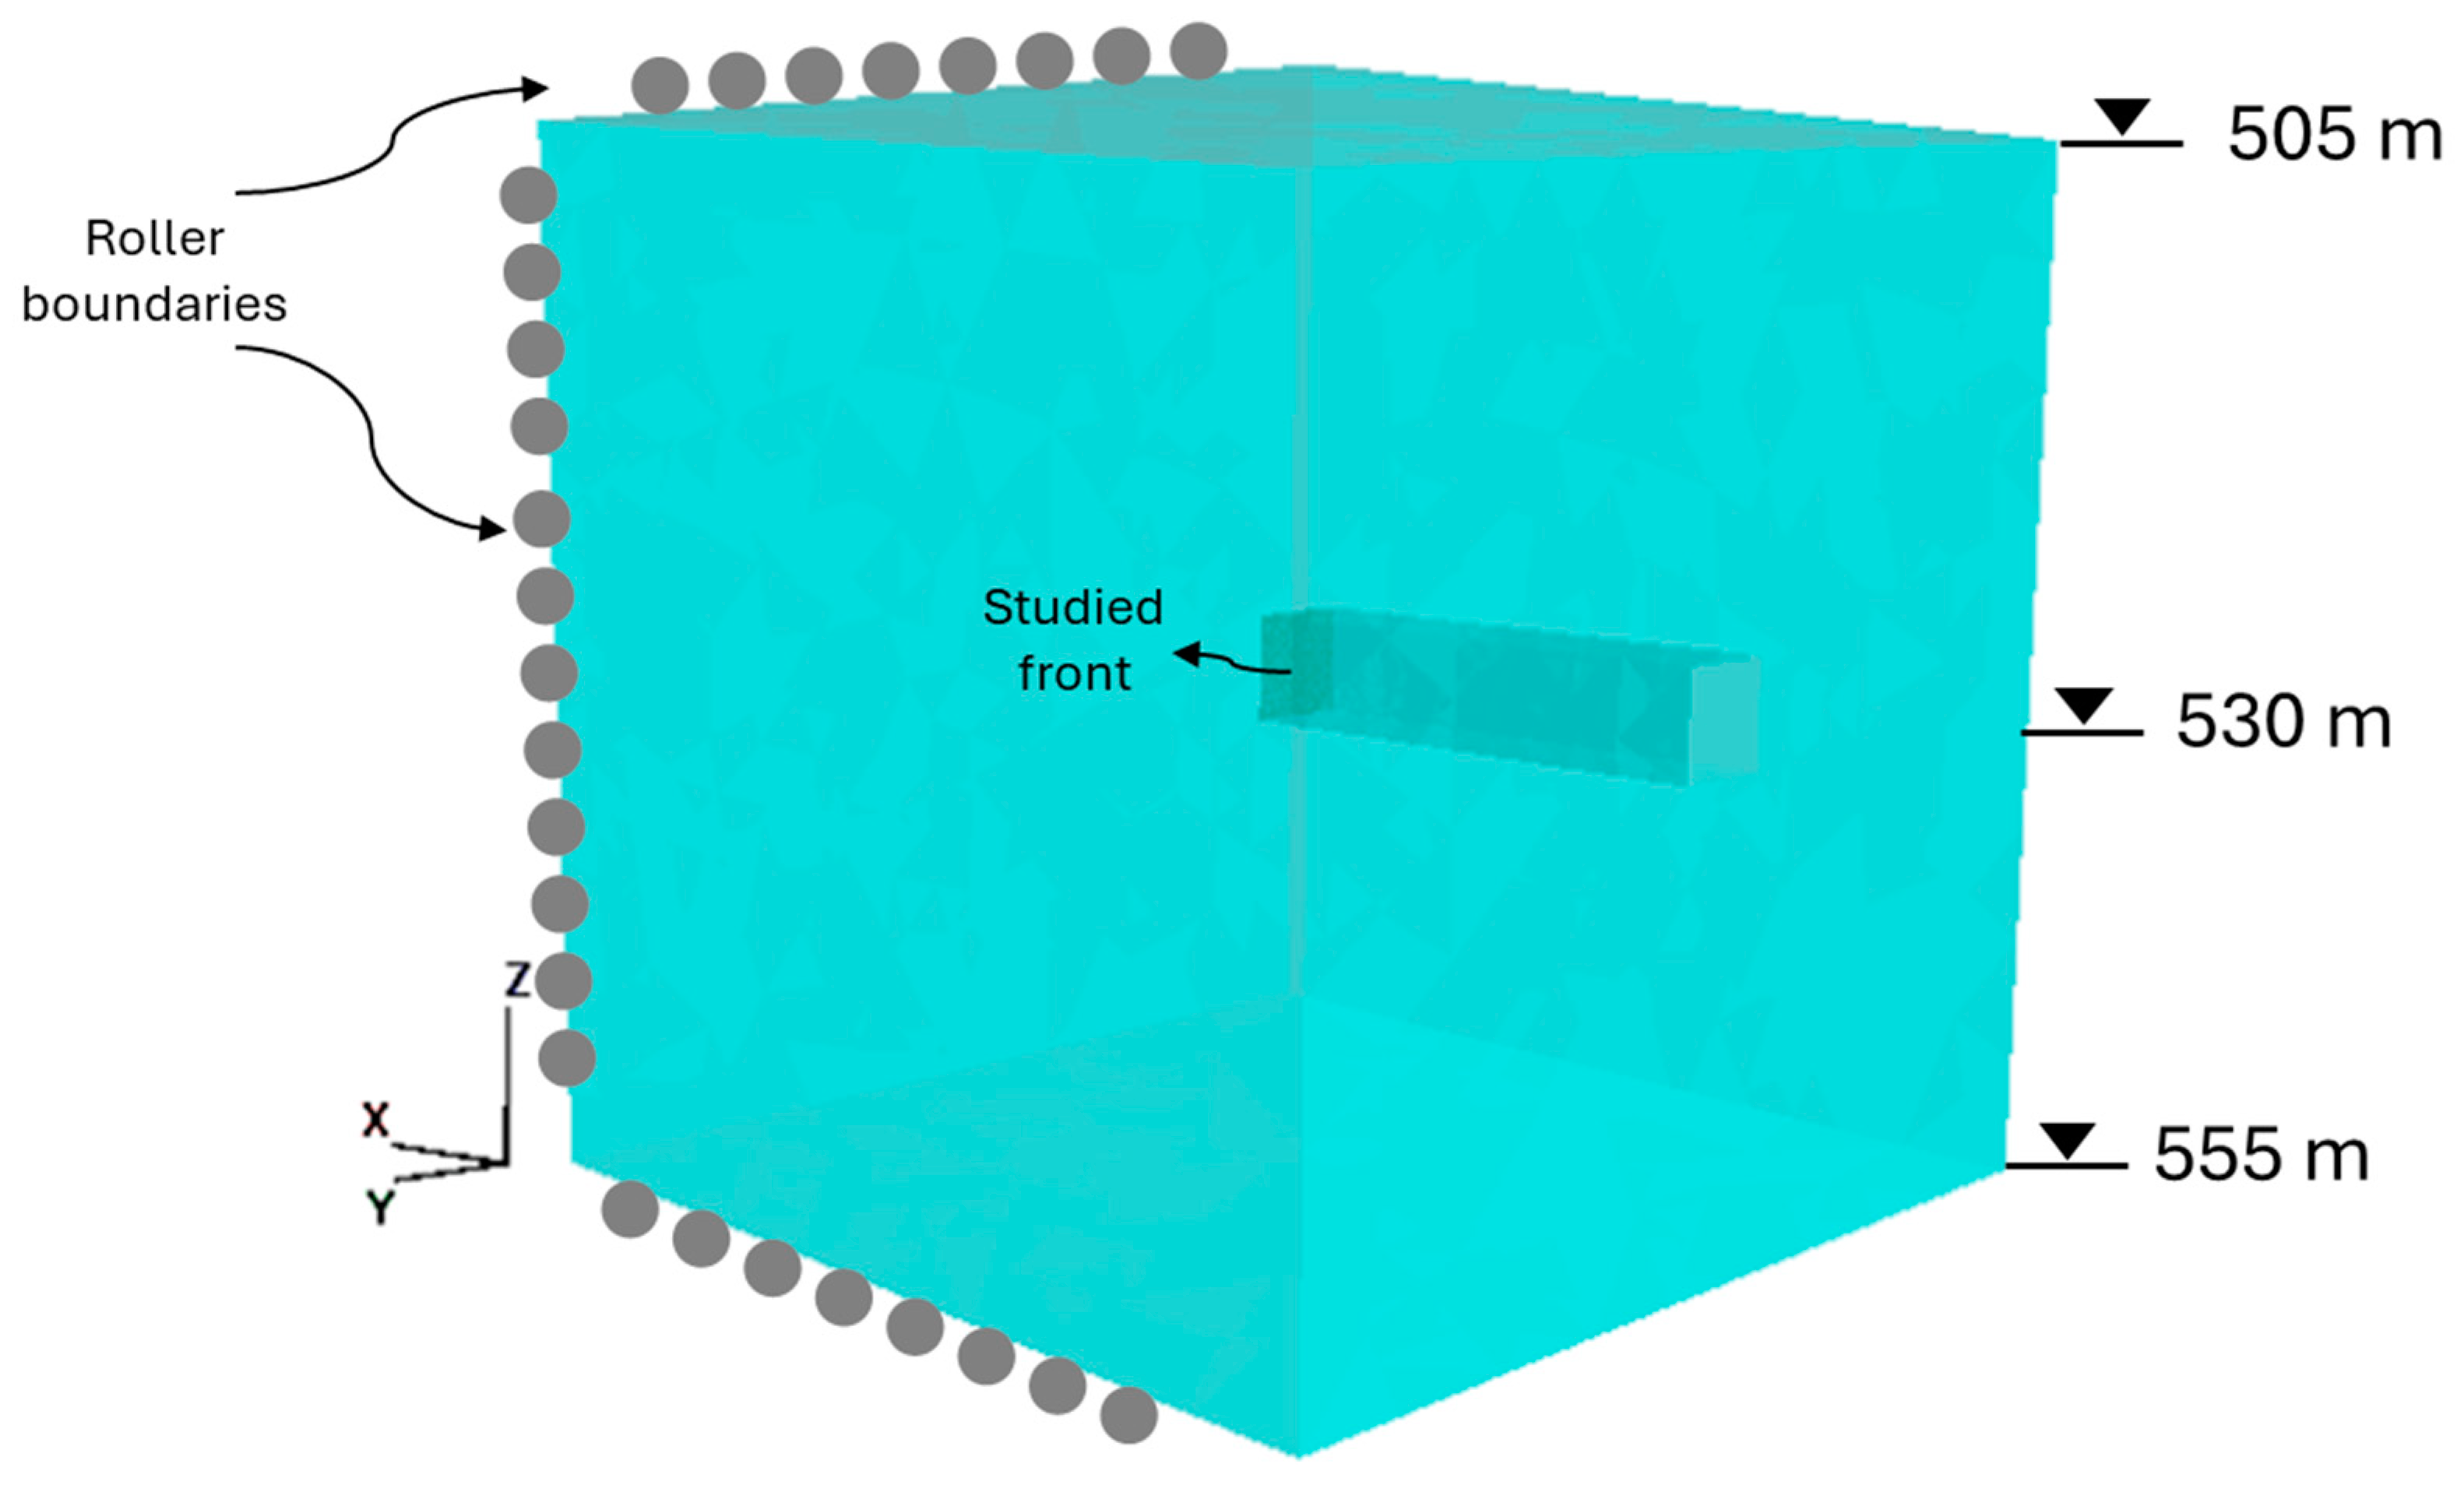
As core deformation measurements took place only at one point in the drift face, it is not sufficient to assess the overall stability of the face. Therefore, it is deemed necessary to create a 3D numerical model to simulate the access drift and its mining front. The model is 50 m × 50 m × 50 m, with a 5 m × 5 m drift that is 25 m long. Roller boundaries are applied to all six faces of the model, and the top boundary is 505 level and the drift is at 530 level as shown in
Figure 9. The model is built with Rhino CAD software and solved with finite difference code FLAC3D. The rockmass properties of the wacke formation are listed in
Table 1, and the in situ stress regime from the measurement is adopted from Equation (1). The model is run in linear elastic mode. Based on the core deformation results, the orientation of
in Equation (1) is rotated 10° clockwise from vertical in the numerical model (as shown in
Figure 8). Model sensitivity analysis of mesh sizes was carried out for more accurate computation of stress results around the drift opening. In the sensitivity analysis, the mesh density is increased in each model and the displacement in the X-direction at the center of the face is recorded. Displacement convergence is observed with a refined mesh size of 0.075 m near the mining front, resulting in a total number of 929,042 zones in the 3D model.
5. Modelling of Damage Zone
When a damage zone is identified in the rock core, as is in this study, damage properties should be estimated and simulated in the numerical model. The following is a proposed simple procedure to account for the damage zone. As fracturing of the rock core is attributed to blasting of the previous round, it is proposed to treat the damage zone using the constitutive model for panel destressing proposed by [
13]. In their work, the destress panel is modeled with a rock fragmentation factor,
, and a stress dissipation factor,
, whereby:
where
is the destressed modulus of elasticity, and the factor
ranges from 0 to 1.
The Poisson’s ratio (
) is modified as follows [
14]:
Finally, the stress dissipation factor
β is used to obtain the residual stress tensor (
in the destressed zone and is given by
where the factor
ranges from 0 to 1.
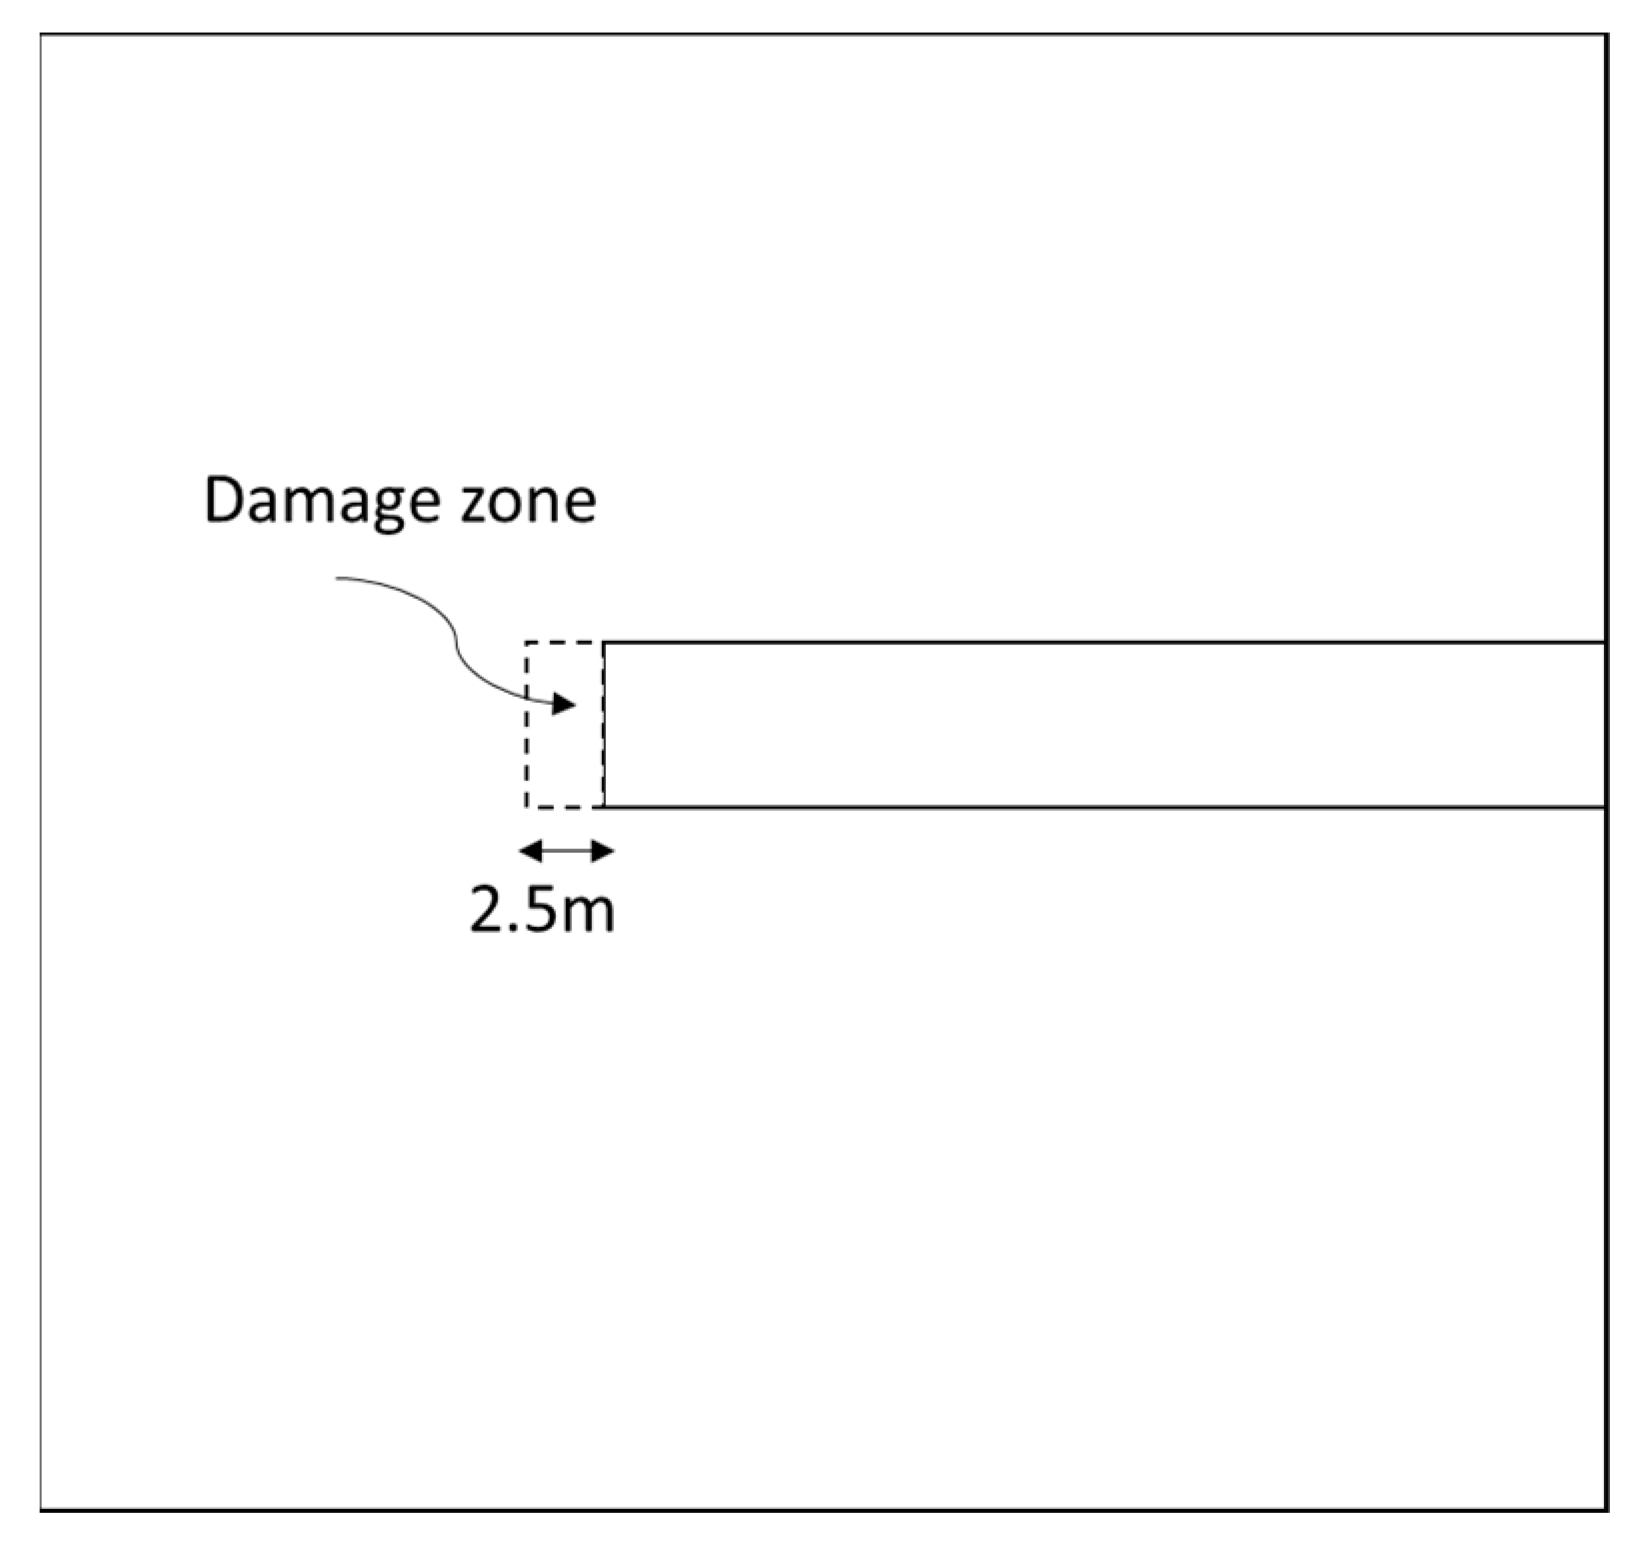
Based on [
13], the values of
are adopted in the damage zone. The numerical model can now be solved with the drift excavation and damage zone simulated as illustrated in
Figure 10.
6. Adjustment of In Situ Stress
The numerical model is first initialized with the rotated in situ stress field defined in Equation (1), and after equilibrium is reached, the drift excavation and damage zone are simulated. The computed stresses at four observation points along an axis passing through the extracted core location in the drift face are listed in
Table 2. The points are located on the drift face and 2 m, 2.5 m, and 3 m behind the face. As expected,
at the mining front is nearly zero, gradually increasing to 15.5 MPa behind the face. The remaining stress components
can be transformed to principal stresses
in the YZ plane. These are listed in
Table 2.
The DCDT stresses can now be updated with the stress = 12 MPa at 2.5 m where intact core was found and measured. Thus, according to Equations (2a)–(2c), the DCDT stresses (, ) become 33.6 MPa and 6 MPa, respectively.
To match the computed stresses (
,
) with those estimated from the DCDT (
,
), an iterative stress adjustment process is required. As the DCDT was applied at a depth of 2.5 m to 3 m due to rock core damage in the first 2.5 m, the results from FLAC3D at that depth are queried and considered for comparison with the DCDT results. The magnitudes of the initial in situ stresses
and
are varied iteratively until the results are within 10% of the DCDT values. Similarly, the iteration of orientation adjustment starts with the initialized directions of
and
, and finishes off when computed stress
at 2.5 m is in the same direction as
obtained from DCDT. The stress iteration results are listed in
Table 3. Note that the in situ stress field in the X-direction remains unchanged (Equation (1)).
By applying the iterative stress adjustment, the FLAC3D model results should closely match the stress components estimated from the core deformation measurements and the analytical model. The numerical model is re-solved iteratively with the updated in situ stress regime. The updated local stress regime is
= 26.3 MPa,
= 9.5 MPa, and along drift stress stays the same (
= 12 MPa). As can be seen from the comparison of stress results from FLAC3D and the DCDT, there is a difference of approximately 5% or less between the results (
Table 4) after five iterations were made. As the process is iterative, it must end with a margin of difference between the FLAC3D and DCDT results. An acceptable difference may be considered as one that will not significantly change the outcome of the analysis. In this study, a change of 5% in the local stress,
, did not influence the stress results in the mining front. Therefore, such margin of error is deemed acceptable for all practical reasons.
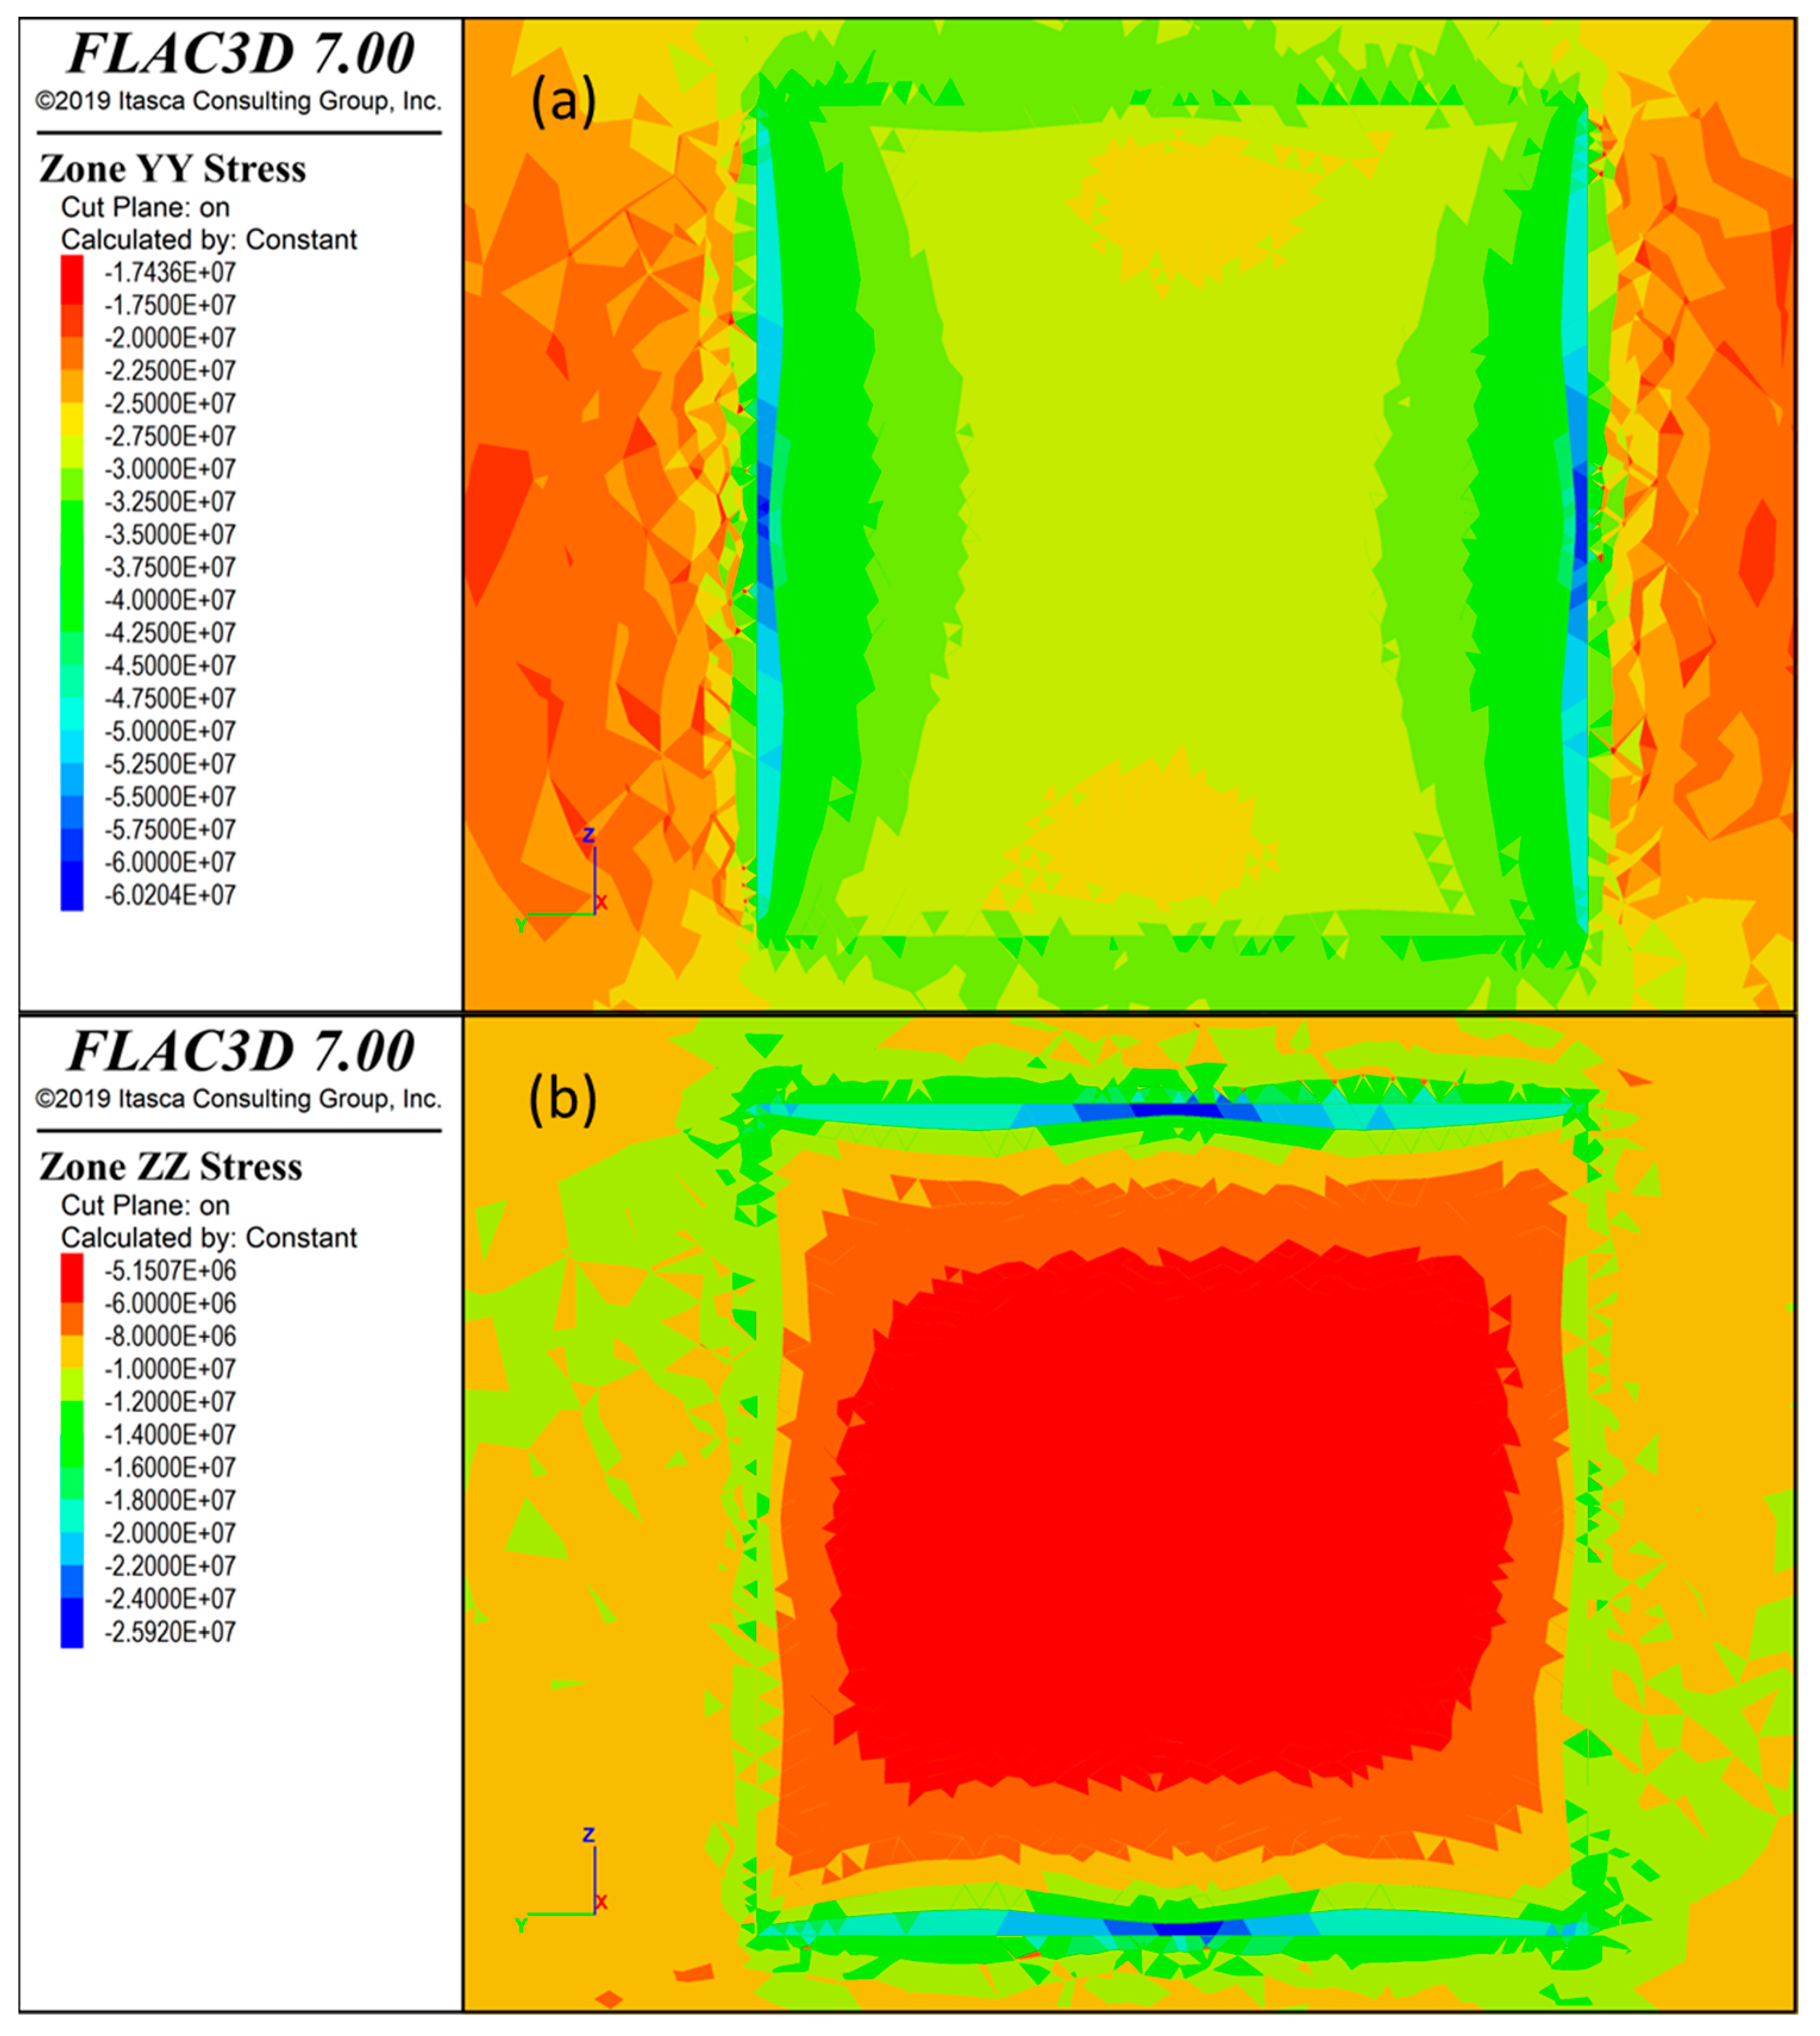
Now, the full-face state of stress behind the damage zone can be extracted from FLAC3D.
Figure 11 displays the normal stress distribution in the YZ plane behind the damage zone. The mining front stability is assessed by the Factor of Safety (FS) based on the [
15,
16]. In the present study, the FS is estimated by calculating the strength to the applied stress ratio measured from the hydrostatic line
as follows.
where
and
s are the material constants;
is the unconfined compressive strength. It is noteworthy that the calculation of the Factor of Safety (FS) in this study is simply the strength divided by the applied stress, whereby both quantities are measured from the hydrostatic line of
. While there is more than one method to estimate factors of safety (e.g., [
17,
18,
19]), the notion of measuring strength and applied stress from the hydrostatic line is not uncommon in practice. The choice of a threshold below which the FS is considered to indicate local failure is one that is decided by the analyst.
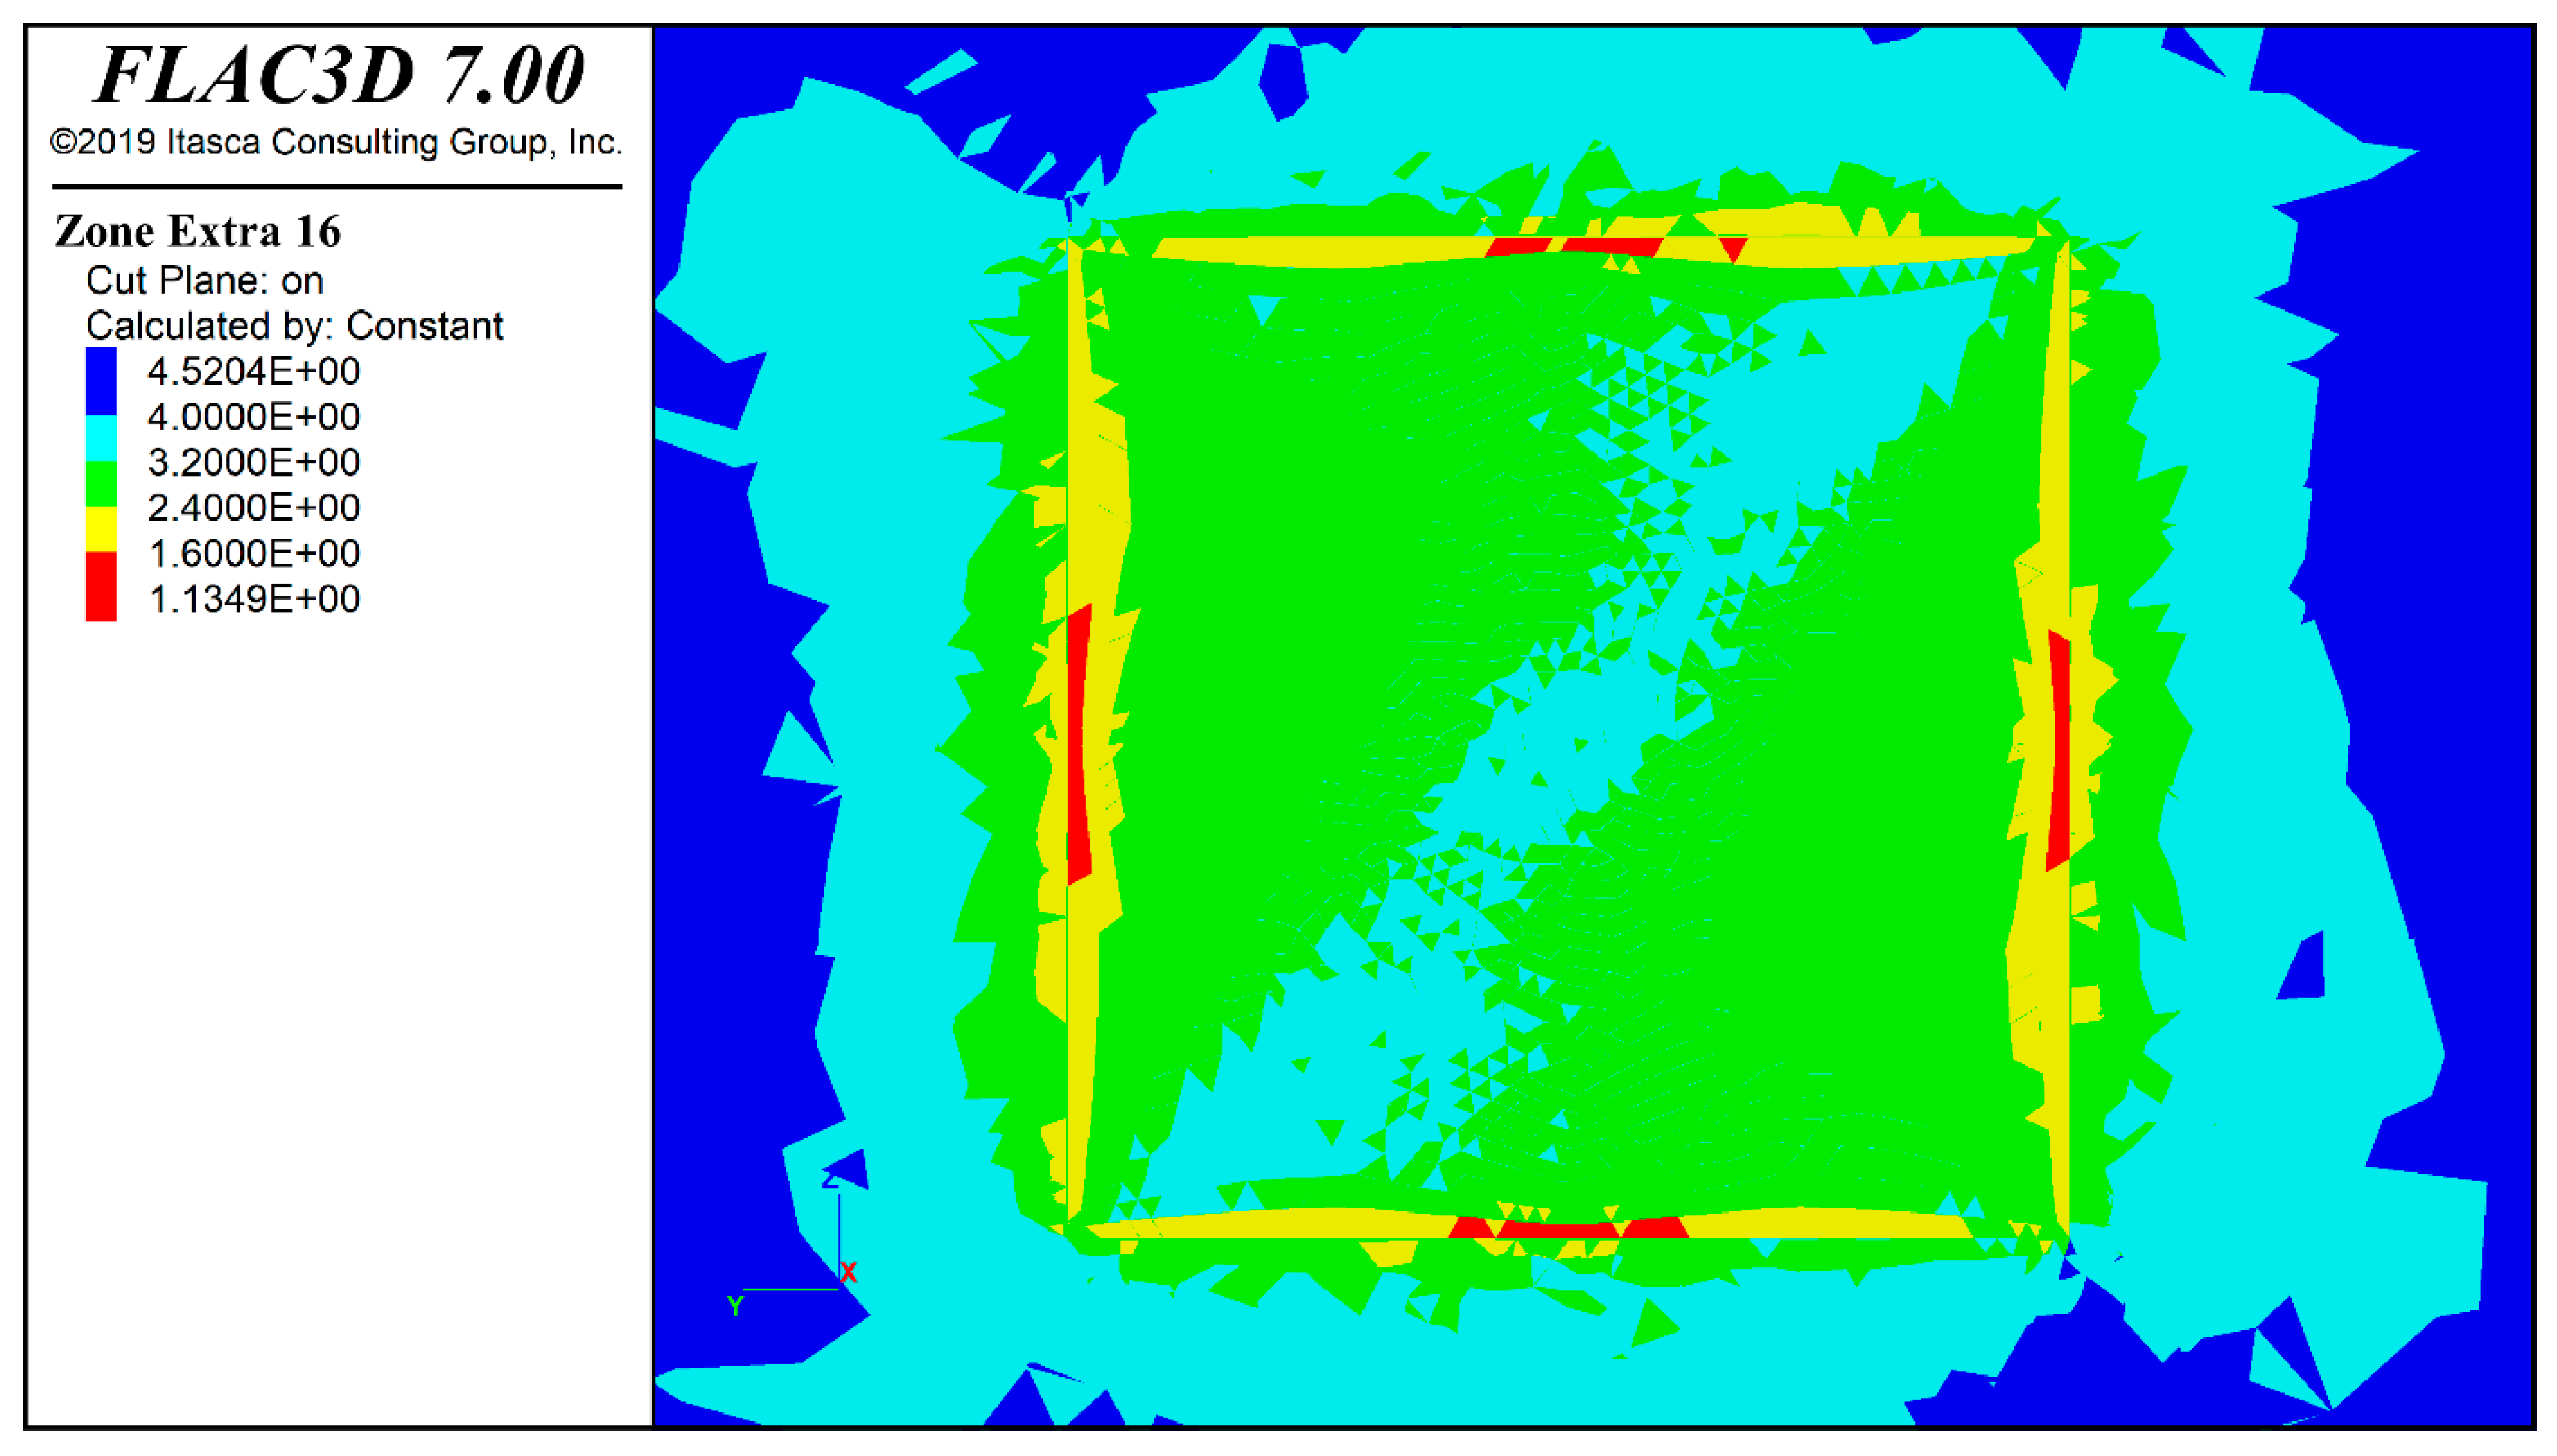
Figure 12 shows the FS results behind the face. In general, this mining front is considered stable, except for a few areas. It is also observed that the FS distribution is not symmetrical. This is due to the oblique orientation that the mining face makes with the rotated in situ stresses
and
, as discussed before.
7. Conclusions
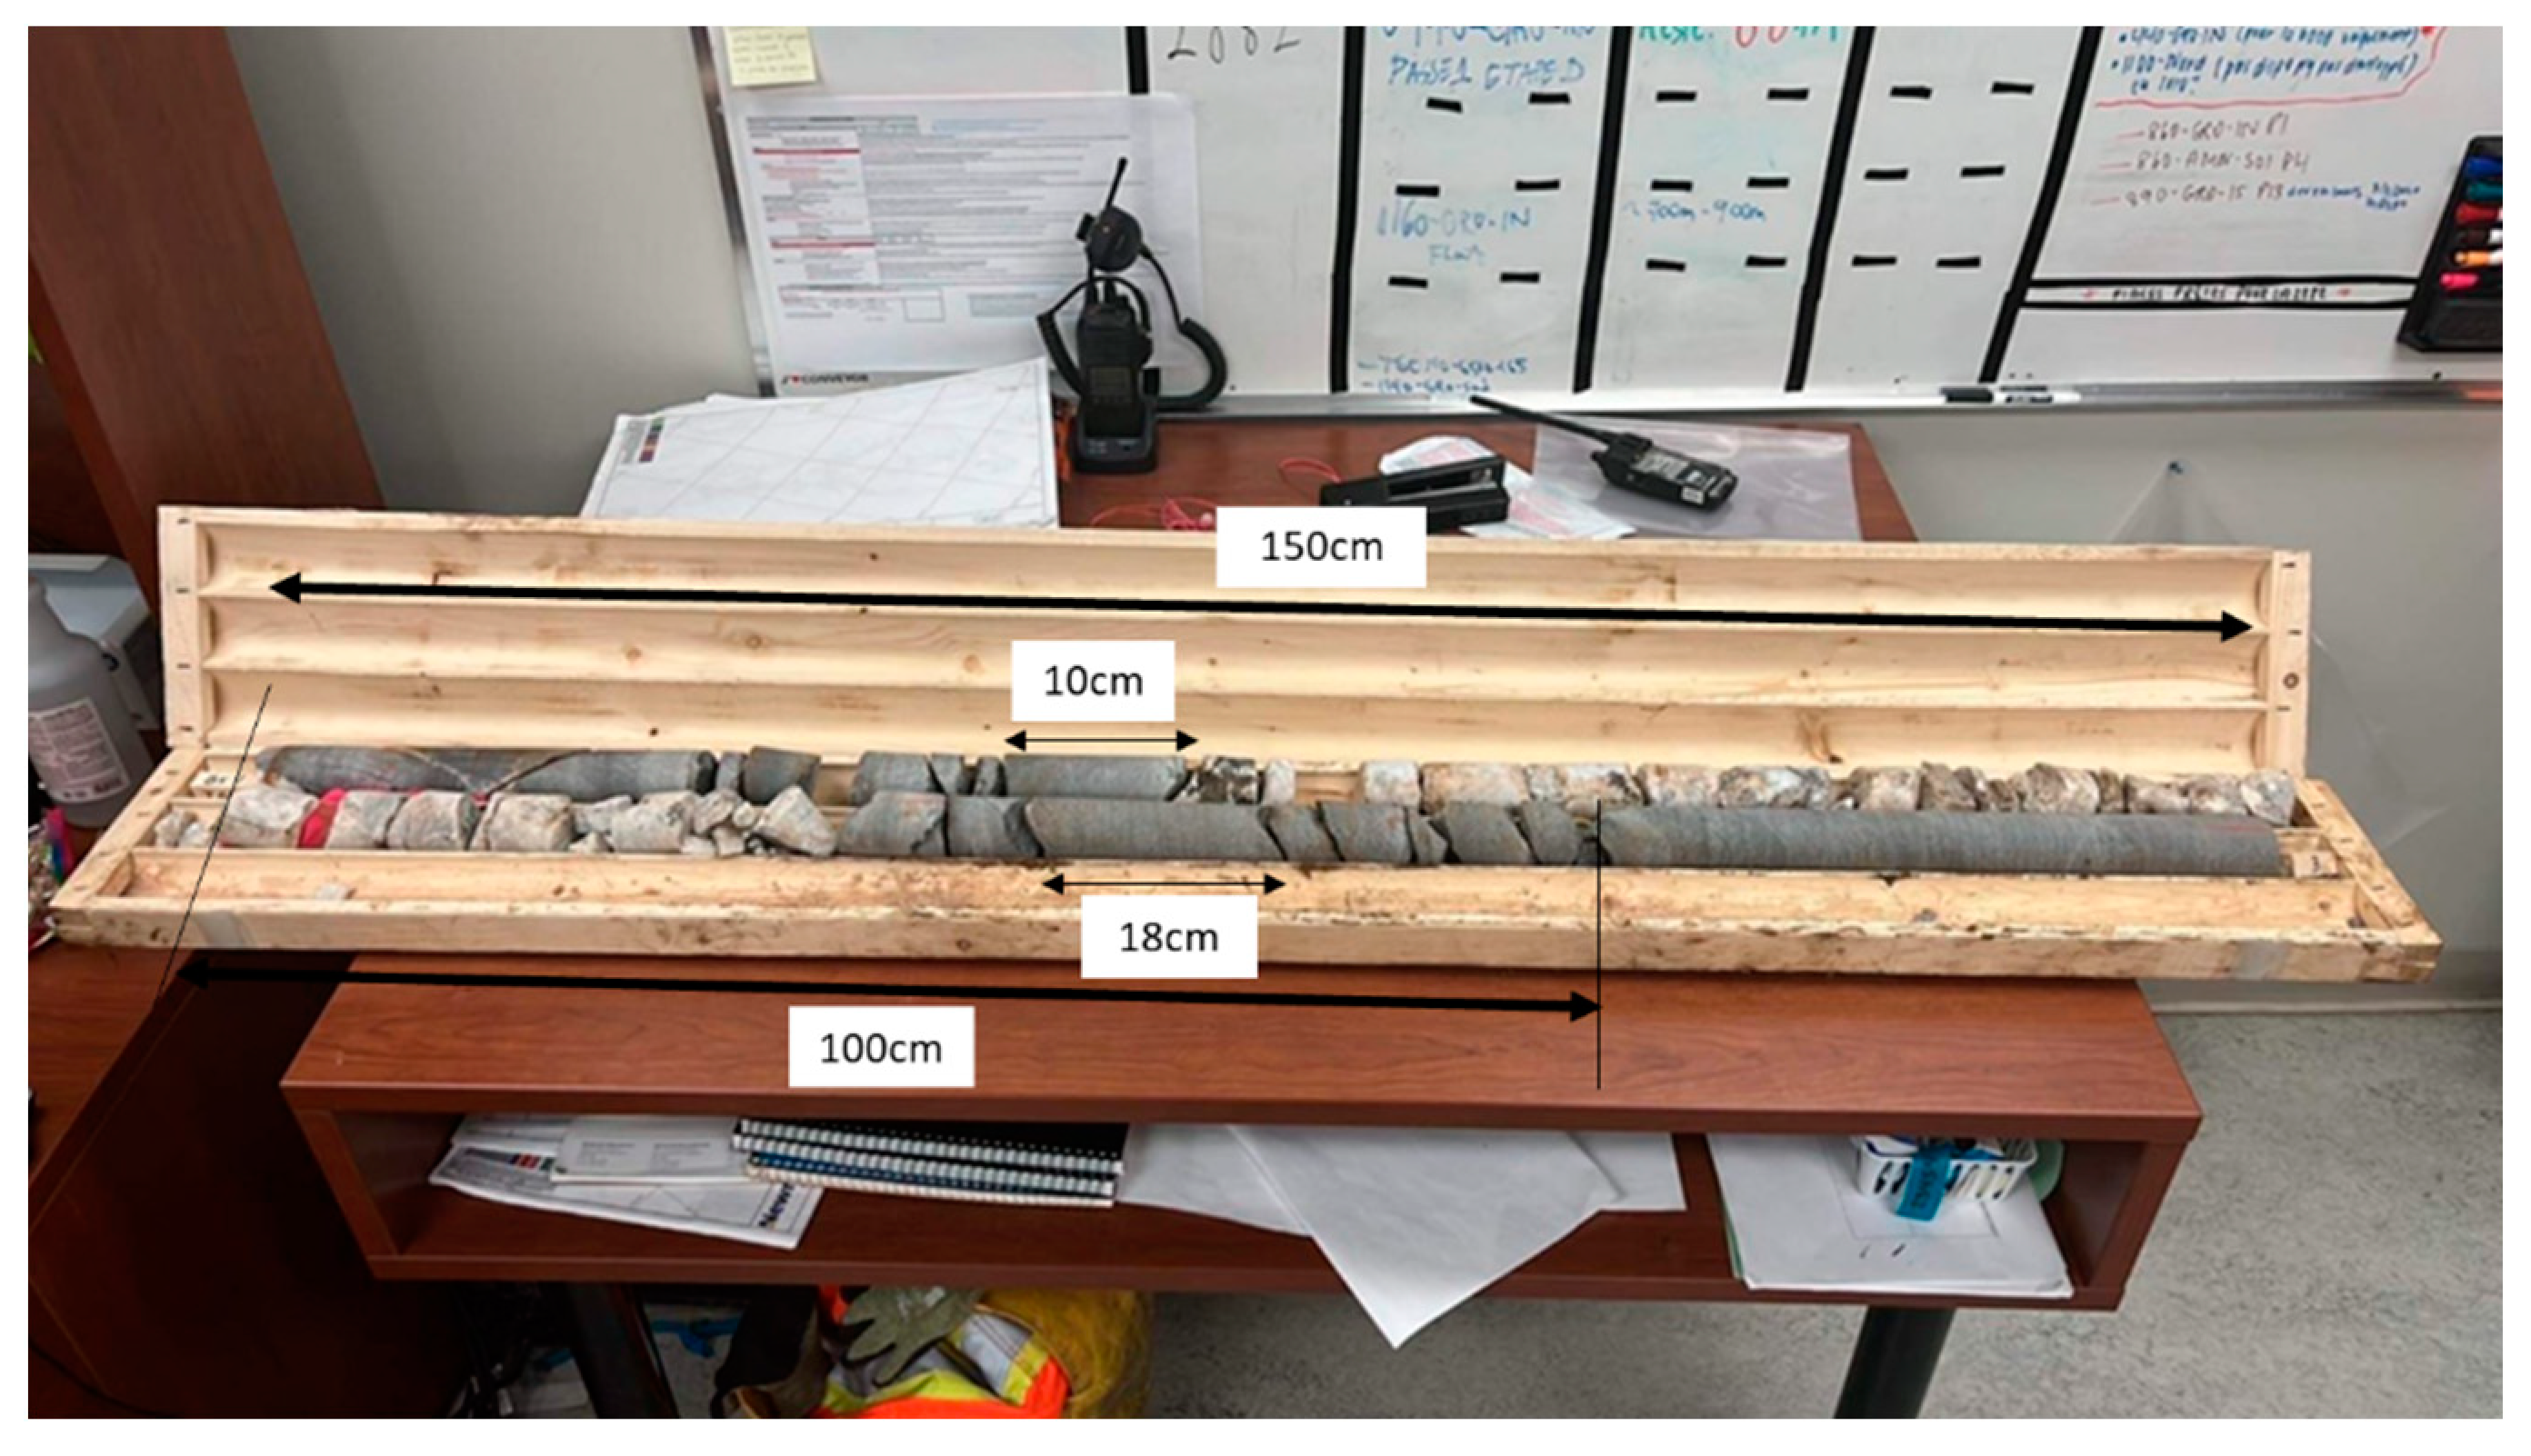
This study describes a practical methodology for assessing mining face stability. It involves the retrieval of one or more rock cores from the mining face and measuring their diametrical deformations using a high precision laser measurement apparatus with a resolution of 0.1 micrometer. The state of local principal stresses in a plane perpendicular to the core axis can then be estimated using the DCDT. The state of stress is naturally plane stress at the free facer (σx = 0). In this case, the DCDT equations will directly calculate the principal stress components at the free face. However, behind the mining face (x > 0), the stress component in which case the state of stress is three-dimensional, and there is a need to estimate at the point of interest to estimate from Equation (2). A local 3D numerical model is built and adjusted to match the stress components estimated by the DCDT and their orientation. The adjustments allow the numerical model to produce full-face stress distribution for stability assessment. The methodology used a case study mine in northern Quebec, where a wacke rock core was extracted from an access drift situated 530 m below surface. As blast-induced damage was observed in the rock core, a destress blasting constitutive model from previous studies was adopted to model the damage zone using two model parameters, namely the rock fragmentation factor α and stress dissipation factor β. The depth of the damage zone is determined by the observation that the rock core is fragmented within the first 2.5 m. Thus, the extent of the damage zone is approximated to the length of 2.5 m for the drift face. The Hoek–Brown failure criterion is selected to demonstrate face stability assessment with a factor of safety calculation after the linear elastic analysis. The calculation of the FS in this study is simply estimated by the strength divided by the applied stress, whereby both quantities are measured from the hydrostatic line of . While there is more than one method to estimate factors of safety for criteria such as Mohr–Coulomb and Hoek–Brown, the notion of measuring strength and applied stress from the hydrostatic line is not uncommon in practice. The choice of a threshold below which the FS is considered to indicate local failure is one that is decided by the analyst. The findings of this study indicate that DCDT can be a practical tool for the assessment of mining face stability especially when coupled with numerical modelling. For future studies, it is recommended that more rock cores be drilled in the mining front and used in the DCDT. For example, by drilling four rock cores from the drift face, a richer dataset of stress information can be generated from the DCDT, potentially enhancing the reliability of the numerical model capability of predicting the mining front stress distribution and stability.


