Abstract
Croatia has both significant CO2 emissions from the point sources and a history of oil and gas exploration, and this is why the CCS technology surfaced as a viable solution for curbing CO2 emissions on a national level. Since approximately half of emissions from the stationary industrial sources occur along the Adriatic coastline, the entire offshore area became an exploration target. Regional studies revealed the potential storage plays, one of which is in the aquifer of the Mesozoic carbonate complex with dual porosity extending all along the Croatian offshore area. Three structures were chosen in its central part–Klara, Kate and Perina. For the first two, the models were constructed based on the data from old exploration wells and a regional structural map, while for the Perina structure, a new seismic interpretation was added to better characterise its properties. It came out that the Kate structure appears to be the most prospective in general (45 Mt), with neighbouring Klara as the second (39 Mt), while the initially promising Perina (7 Mt) turned out to be of far lesser importance. The Perina structure case is an example that new seismic interpretation can reduce the capacity estimate if it reveals certain limiting factors, in this case, the limitation of structural closure.
1. Introduction
This paper deals with the three locations in the Croatian part of the Adriatic offshore that represent the potential structurally defined aquifers for geological storage of CO2. They are the closest locations for the geological storage of CO2 emitted from the cement industry, with the two sources in the Istrian peninsula and one in central Dalmatia (for locations, see Figure 1 in [1]). In detail, it is presently an important challenge for cement operations of the “St. Juraj“ plant owned by Cemex Hrvatska d.d., and the three locations mentioned here are studied as the best possible storage options for this last source because it is the closest one. The results of this applied research can be interpreted as an upgrade of the regional analysis published in the article [1], wherein the authors provided a broader picture of potential options for CO2 storage in the Croatian part of the Adriatic offshore.
On the global scale, cement production in 2022 was estimated at 4.1 billion tonnes [2] accounting for about 7% of global CO2 emissions [3,4], or according to other sources, it is 8 to 10% of global CO2 emissions [5,6]. Paris Agreement Goals to limit global warming to 1.5 °C means that the world will need to reach net-zero CO2 emission by 2050 [7]. This presents great challenges to the cement industry.
Cement manufacturing is a technological process in which CO2 is emitted from different parts of the process, which is why different approaches have been developed to reduce CO2 emissions (e.g., [8,9,10]). In general, the different CO2 emission sources can be divided into 50% of CO2 emitted by the calcination of limestone (CaCO3) into CaO and CO2 (e.g., [11]); 40% from burning fossil fuels to produce thermal energy (e.g., [12]); and 10% CO2 is emitted from transportation and electricity usage (e.g., [13,14]).
The Cement Sustainability Initiative [15] presented calculation methods for the estimation of CO2 emissions in the Cement CO2 and Energy Protocol, wherein emission sources were divided into direct emissions from raw material calcination, organic carbon in raw material, conventional kiln fuel, alternative kiln fuel, non-kiln fuels, transport, wastewater and indirect emissions from external electricity production, clinker bought. The Intergovernmental Panel on Climate Change (IPCC) provided the guidelines and methodologies for estimating national inventories of anthropogenic emissions by sources and removals by sinks of greenhouse gases [16]. This allows cement companies to uniformly report their CO2 emissions to national governments. Environmental and annual reports of major cement companies (Cemex, Heidelberg Cement and LafargeHolcim) had shown emissions of 561–622 kg of CO2 per tonne of produced cement [17].
One of the options for reducing CO2 emissions from cement production, which is in focus of this work, is carbon capture and storage (CCS), particularly the effective estimation of the capacity of potential geological storage sites.
CO2 capture and storage (CCS) is a technology that: (1) is practically already applicable because of the experience gained mainly in oil and gas exploration and production, deep waste disposal and groundwater protection; (2) has a large capacity, although unevenly distributed around the globe; and (3) has retention times of centuries to millions of years [18]. The Carbon Sequestration Leadership Forum (CSLF) recognised the need to provide consistent methodologies for estimating CO2 storage capacity and established, in 2004, deterministic methods that could be applied everywhere [19]. The quality assessment of the capacity is affected by the reliability and accuracy of the data, namely the characteristics of the CO2 that is injected, the characteristics of the geological structure that represents the storage space for CO2 injection, the capture mechanisms, the data processing methodology and the scale in which the data is processed.
Possible geological structures, i.e., geological subsurface formations that represent storage space for CO2 injection, are deep saline formations, depleted gas reservoirs, oil reservoirs (with and without enhanced oil recovery) and unmineable coal beds. The types of trapping mechanisms that are possible at each site depend on different geological constraints on each mechanism and the fact that different trapping mechanisms operate on different time ranges [19]. It can be a combination of physical and chemical trapping mechanisms that are effective over different times and scales [18,20]. Data sets of variable size and quality have produced widely varying estimates of inconsistent quality and reliability worldwide [18,19].
In addition to the reliability of input data, economically or technically suitable CO2 geological storage sites are equally important for assessment. The background of each assessment must be legally regulated, which is why the legal and political aspects in the assessment of potential CO2 geological storage sites are also as important as the previously mentioned technical/natural constraints. Based on the described aspects that influence the storage assessment, there are different storage capacity assessments in the sense of the techno-economic pyramid [20,21].
Croatia participated in the two relevant EU projects: Assessing European Capacity for Geological Storage of Carbon Dioxide (EUGeoCapacity) from 2006 to 2008 [22] and CO2 Storage Potential in Europe (CO2StoP) from 2012 to 2013 [23]. The main objective of the first project was to assess the European capacity for geological storage of CO2, while the second project provided a database of CO2 storage locations throughout Europe. A brief overview of the history of cement production in Croatia was presented by [11].
Data of the subsurface geological structure and lithology of rock formations in the Croatian section of the Adriatic offshore necessary for the purpose of CO2 geological storage investigations today are available thanks to almost seventy years of research by the petroleum company INA-Naftaplin (today INA d.d., Zagreb) covering all parts of Croatia [1].
The history of hydrocarbon exploration in Croatian offshore started in 1968 with the first well Jadran-1 as briefly described in [24]. Between 1978 and 1993, a total of six gas fields were discovered in the Northern Adriatic. The next phase of exploration resulted in the discovery of an additional seven fields. In the last ten years, the Northern Adriatic has been divided into three large exploration fields named Izabela, Ivana and Marica, and this area is covered with approximately 45,000 km of 2D seismic lines (e.g., [25]) and 6200 km2 of 3D seismic lines as well. There are altogether 135 exploration, appraisal and production wells (e.g., [26]), which is actually relatively scarce [1], meaning that the entire region remains an active oil and gas exploration area. Important for the studies of CO2 geological storage, the data from deep exploration wells and a regional seismic grid can be obtained from the Croatian Hydrocarbon Agency, provided that all legal and financial requirements are met.
2. Geological Setting
The Croatian part of the Adriatic offshore is a part of the Adriatic basin located in the central Mediterranean region (Figure 1). In the Middle Triassic, due to the rifting of the epeiric platform along the northern edge of Gondwana during which the Adria plate broke up and the huge, isolated carbonate megaplatform (Southern Tethyan Megaplatform—STM) occurred in this area. In the Middle Jurassic (Toarcian), STM disintegrated, which resulted in the formation of the Adriatic Carbonate Platform (AdCP) and Apulian Carbonate Platform (ApCP) between which the Adriatic Basin (AB) was formed [27]. Contributions to the understanding of the regional geological relations of the researched area were made by many authors [27,28,29,30,31,32,33].
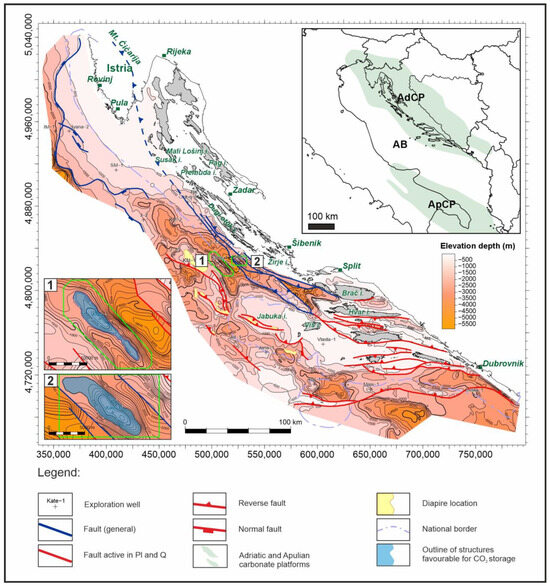
Figure 1.
Structural map of the top of carbonate complex with marked prospective storage objects “Klara” and “Kate” (numbers “1” and “2”) modified from [1]. Insert map shows the spatial distribution of the Adriatic carbonate platform (AdCP) and Apulian carbonate platform (ApCP) and the Adriatic Basin (AB) between them, adopted from [27].
The oldest rocks in the study area are of Permian age, with heterogeneous lithologic composition, comprising clastics, carbonates and evaporites [1,34]. This formation is followed by rocks of intra-oceanic, isolated Southern Tethyan Megaplatform (STM) from the late Middle Triassic (Ladinian) to late Early Jurassic (Toarcian) [35]. The Lower Triassic unit is also comprised of clastics and carbonates [36], while the Middle Triassic is characterised by shallow-water carbonates with widespread occurrences of andesite and pyroclastics [27,37,38]. During the Middle Triassic, strong tectonic displacements were recorded along deep faults through the entire lithosphere, and from Toarcian to the end of Cretaceous, large AdCP had been gradually disintegrated and uplifted [35] with the development of both the pelagic and platform carbonate sedimentation throughout Jurassic and Cretaceous, respectively [27]. The total thickness of the AdCP succession exceeds 8000 m [27].
Disintegration of the AdCP and its neighbouring areas resulted in the formation of the Dinaric mountain belt. During the Early to Middle Eocene, the carbonate platform sedimentation on the AdCP was locally restored by Paleogene transgression with the Foraminiferal limestones [27], and uplifting was accompanied by clastic sedimentation that lasted through Miocene, Pliocene, Pleistocene and Holocene but with different detritus sources [35].
Miocene deposits are represented by hemipelagic marls and turbidites composed of alternating marls and calcareous and marly siltstones interbedded with sandy limestones and sandstones deposited on the top of the Eocene–Oligocene turbidites [1]. The transition from Miocene to Pliocene sediments in the Adriatic offshore is characterised by a regional Messinian unconformity, which is regionally observable in reflection seismic sections [39,40]. Pliocene sediments include clays, marls and sands, while Pleistocene deposits are composed of sands, silts and clays with lignite interbeds [41]. In the central Adriatic offshore, Pleistocene and Holocene deposits can, in places, reach the thickness of 2000 m, with the total thickness of the Eocene to Holocene deposits being up to 6000 m in the deepest sub-basins [1]. The top of the carbonate complex horizon was mapped throughout the Adriatic offshore in Croatia based on the published data (Figure 1, constructed and published by [1], who compiled the regional map based on previous works of [42,43,44,45,46,47,48]).
Based on the petroleum exploration of the Adriatic offshore in Croatia, there is a generally accepted term “carbonate complex” for an informal lithostratigraphic unit. That informal lithostratigraphic unit includes three successions, which differ according to the depositional environment as follows: (a) the Lower Jurassic to Middle Eocene carbonate platform succession (the AdCP succession, sensu Vlahović et al., 2005 [27]); (b) the Lower Jurassic to Middle Eocene pelagic carbonate succession of the Adriatic Basin; and (c) the underlying Upper Triassic to Lower Jurassic shallow marine carbonate and clastic succession assigned by Vlahović et al. (2005) [27] to the AdCP basement or the STM.
On the structural map presented in [1], two structural traps (numbers “3” and “4”) were selected as the prospective storage objects, mainly due to their relatively smaller distance from the “St. Juraj” cement plant. These objects are renumbered in this paper and also named after the vintage exploration wells; 1 is the Klara structure, and 2 is the Kate structure (see Figure 1). The third prospective storage object that was chosen for this study was the Perina structure located 150 km to the SE (Figure 2). Klara is located 140 km west of the cement plant and Kate 130 km in the same direction, while Perina lies 170 km south.
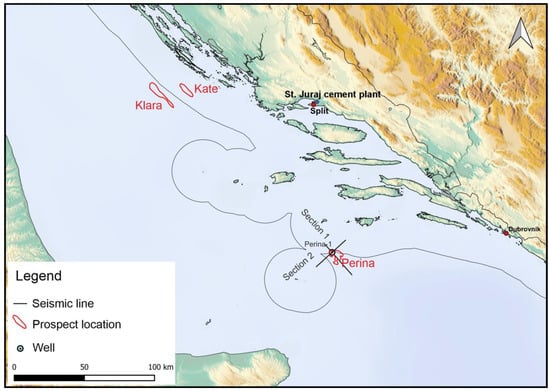
Figure 2.
Locations of the three prospective storage objects, Klara, Kate and Perina, with the two interpreted seismic lines of Perina.
3. Methods and Data
To establish uniform assessments of geological storage capacity, the Carbon Sequestration Leadership Forum (CSLF) presented concepts and methodologies for estimating CO2 storage capacity in deep saline aquifers, hydrocarbon fields and coal beds [20]. The first step in the storage capacity assessment is identifying sedimentary basins. The next step is to identify the potential reservoir and sealing units for CO2 storage through the characterisation of their geological and physical properties. The third step would be regional CO2 storage estimates based on the calculation of the bulk volume of aquifers. If stratigraphic or structural traps with suitable reservoir and sealing properties are identified within the aquifers, the storage potential of the individual trap can be calculated. Regional estimates can then be calculated as the sum of the storage potential of all identified traps [22]. This way, the obtained regional assessments are there for planning further investments, with the only way forward being the more reliable and precise estimation based on the new data acquired by targeted exploration of the most prospective sites.
Bachu et al. (2007) [20] distinguished between the theoretical and effective storage capacity by applying a storage efficiency factor [22]. The authors agree that the efficiency factor includes the cumulative effects of trap heterogeneity, CO2 buoyancy and sweep efficiency, but no values or range of values were given as the factor, which is understood to be site-specific and needs to be determined through numerical simulations and/or fieldwork. In other words, it can be better defined only when based on the new site-specific data.
The estimation of CO2 storage capacity is constrained by various influences—techno-economic parameters, interpretation level, technology, policy, regulatory framework and economics of geological storage [19]. This is usually presented in the techno-economic pyramid based on the concept of the energy resource pyramid introduced by [21]. At the bottom of the pyramid is the estimation of the theoretical storage capacity, which means to obtain a numerical estimate of the total resource. Once the uncertainties are reduced through additional exploration, it becomes effective capacity, and when the economic aspects are eventually included, it becomes the viable capacity.
Saftić et al. (2019) [1] performed the estimation of theoretical CO2 geological storage capacity in deep saline aquifers based on the publicly available data on a basin scale. The authors conducted regional-scale mapping of the top of the carbonate complex and delineated the most favourable areas/structures. The main limitation in this work was associated with the use of the reservoir data from just one vintage exploration well, which limited the distribution of parameters and hence affected the estimates. Data from the two wells and two seismic lines were later provided by the Croatian Hydrocarbon Agency (CHA), giving the basis for a more substantiated reconstruction of subsurface geology.
3.1. Methods
Storage capacity estimation in deep saline aquifers was made by using the approach from [20], also used by [22]. Both papers refer to the equation for the calculation of geological storage capacity (1) as established by the US DOE (United States Department of Energy):
where MCO2 is mass of CO2; V is volume of the saline aquifer; Φ is porosity of the saline aquifer; ρCO2 is density of CO2 in saline aquifer conditions; and E is storage efficiency factor of the saline aquifer.
The volume of the saline aquifer, obtained from the structure maps of the top of the carbonate complex, represents the calculation of the volume of the analysed object under a function f (x, y) defined by a double definite integral [49]. The approximation of definite integral is obtained using the extended trapezoidal rule formula available in Surfer® [50] volume reports. In this work, the structure maps were taken from the paper of [1] for the Klara and Kate structures, while the Perina structure is mostly based on seismic interpretation.
Porosity was determined from core samples or well logs, as given in the well reports. A weighted porosity value was determined for each chronostratigraphic unit of the saline aquifer.
Density of CO2 was determined by a diagram of carbon dioxide density versus pressure and temperature ([51] according to [52]). Due to the lack of pressure and temperature data in the Klara-1 well, data from the Kate-1 well were used to determine the density.
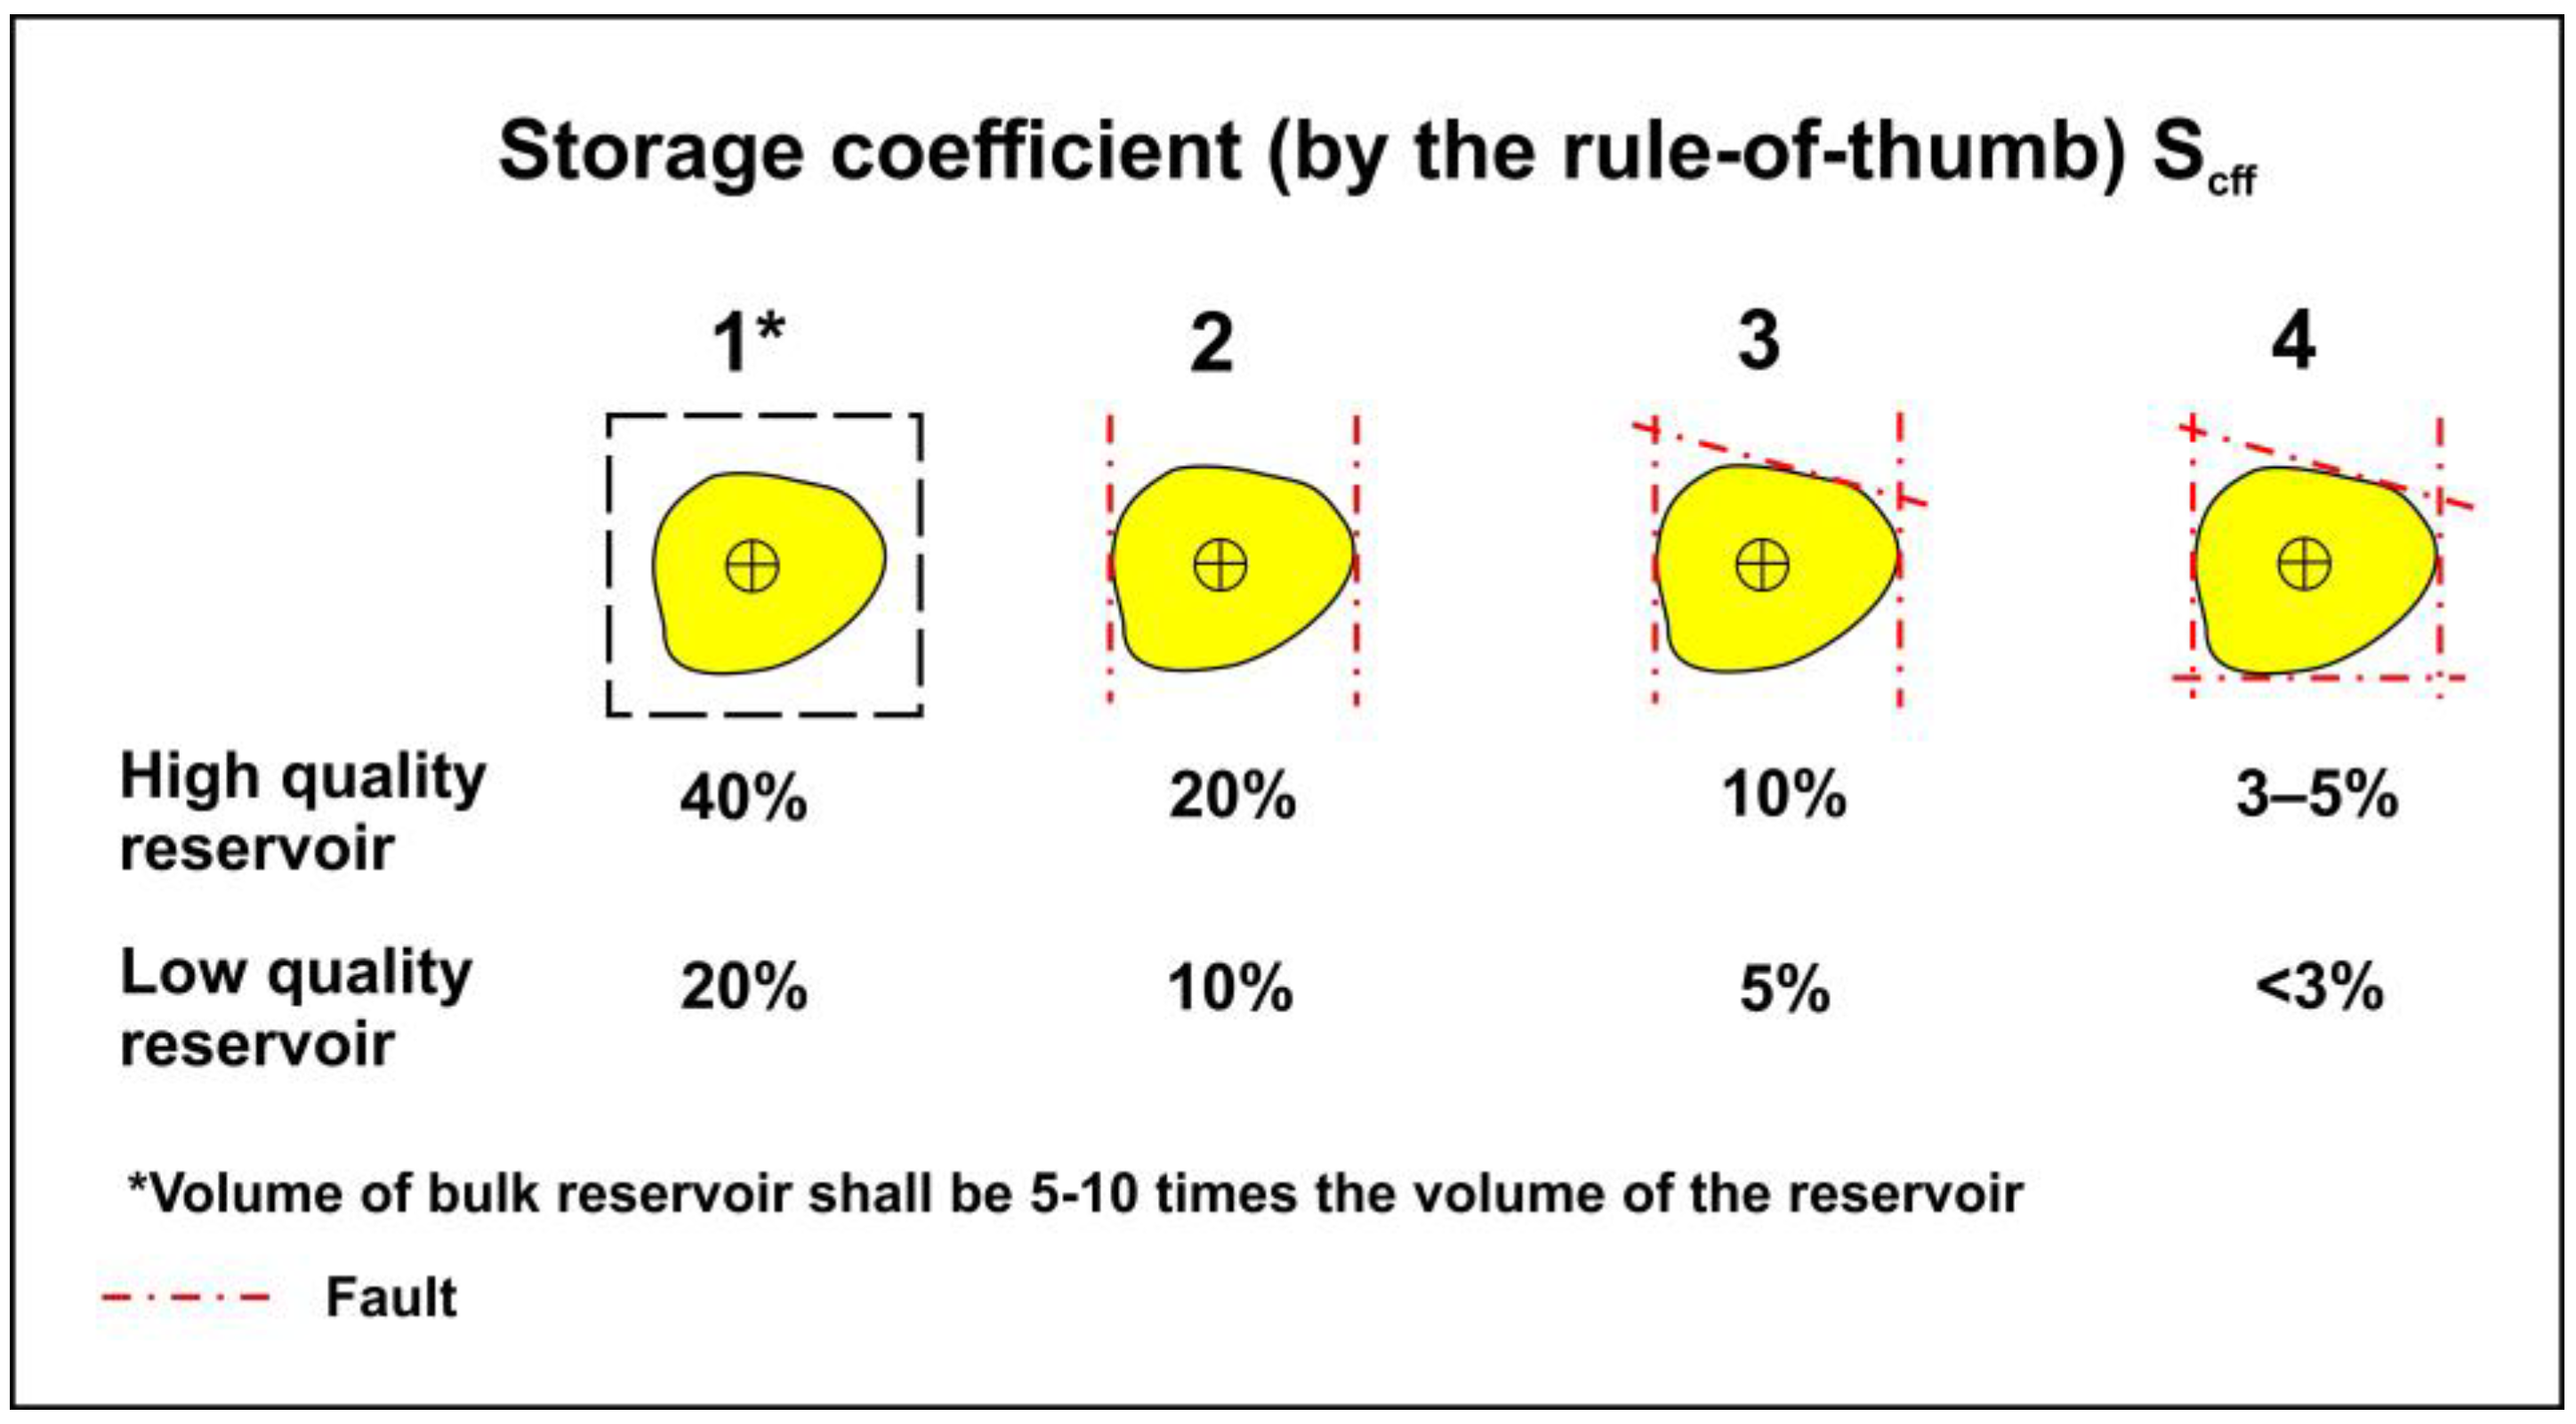
Efficiency factor was estimated according to the “cartoon approach” presented in the EU GeoCapacity project, based on experience by a numerical simulation of CO2 injection in the North Sea [53] and in the onshore Denmark [22,54] (Figure 3).
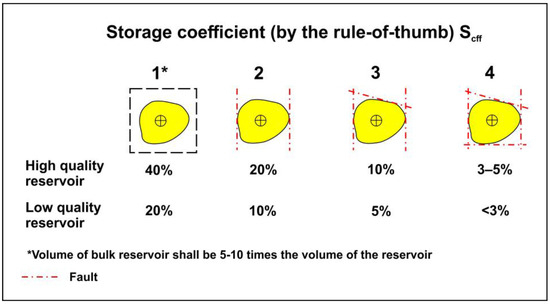
Figure 3.
The “cartoon approach” for efficiency factor estimation [22].
According to [22], the quality of the reservoir is determined by its porosity and permeability. The red lines in Figure 3 indicate bounding faults or could symbolise any feature limiting the connectivity between the trapped aquifer volume and the bulk aquifer volume. The storage efficiency factor is assumed to decrease correspondingly with decreasing connectivity to the surrounding aquifer. This approach principle is very simplistic and should be used only as a rule of thumb. It works for regional estimates and not for the real detailed site-specific estimates of storage capacity. This means that it can be used for screening objects but not for their detailed static models. The reservoirs described in this work were mostly categorised as low-quality reservoirs, and storage efficiency factors used in this work were from 5 to 20%.
3.2. Data and Interpretation
Two of the potential offshore storage structures were first mapped in [1]. Based on the structure map of the top of the carbonate complex and the available data of the vintage exploration wells, the paleogeographic position of the structures and their type in relation to the surrounding structural features were interpreted. Based on the vintage reports of exploration wells, the lithology and porosity of the potential reservoirs and seal rocks were described. Porosity values taken were either from core measurements and/or well log interpretation. The descriptive data from well reports included the type of porosity—intergranular, intercrystalline, moldic, vuggy, fracture and chalky porosity. This was used as guiding information to constrain some numerical estimates.
Three geological structures were selected, each tested by one exploration well—Klara-1, Kate-1 and Perina-1—and so were named accordingly.
3.2.1. Klara Structure
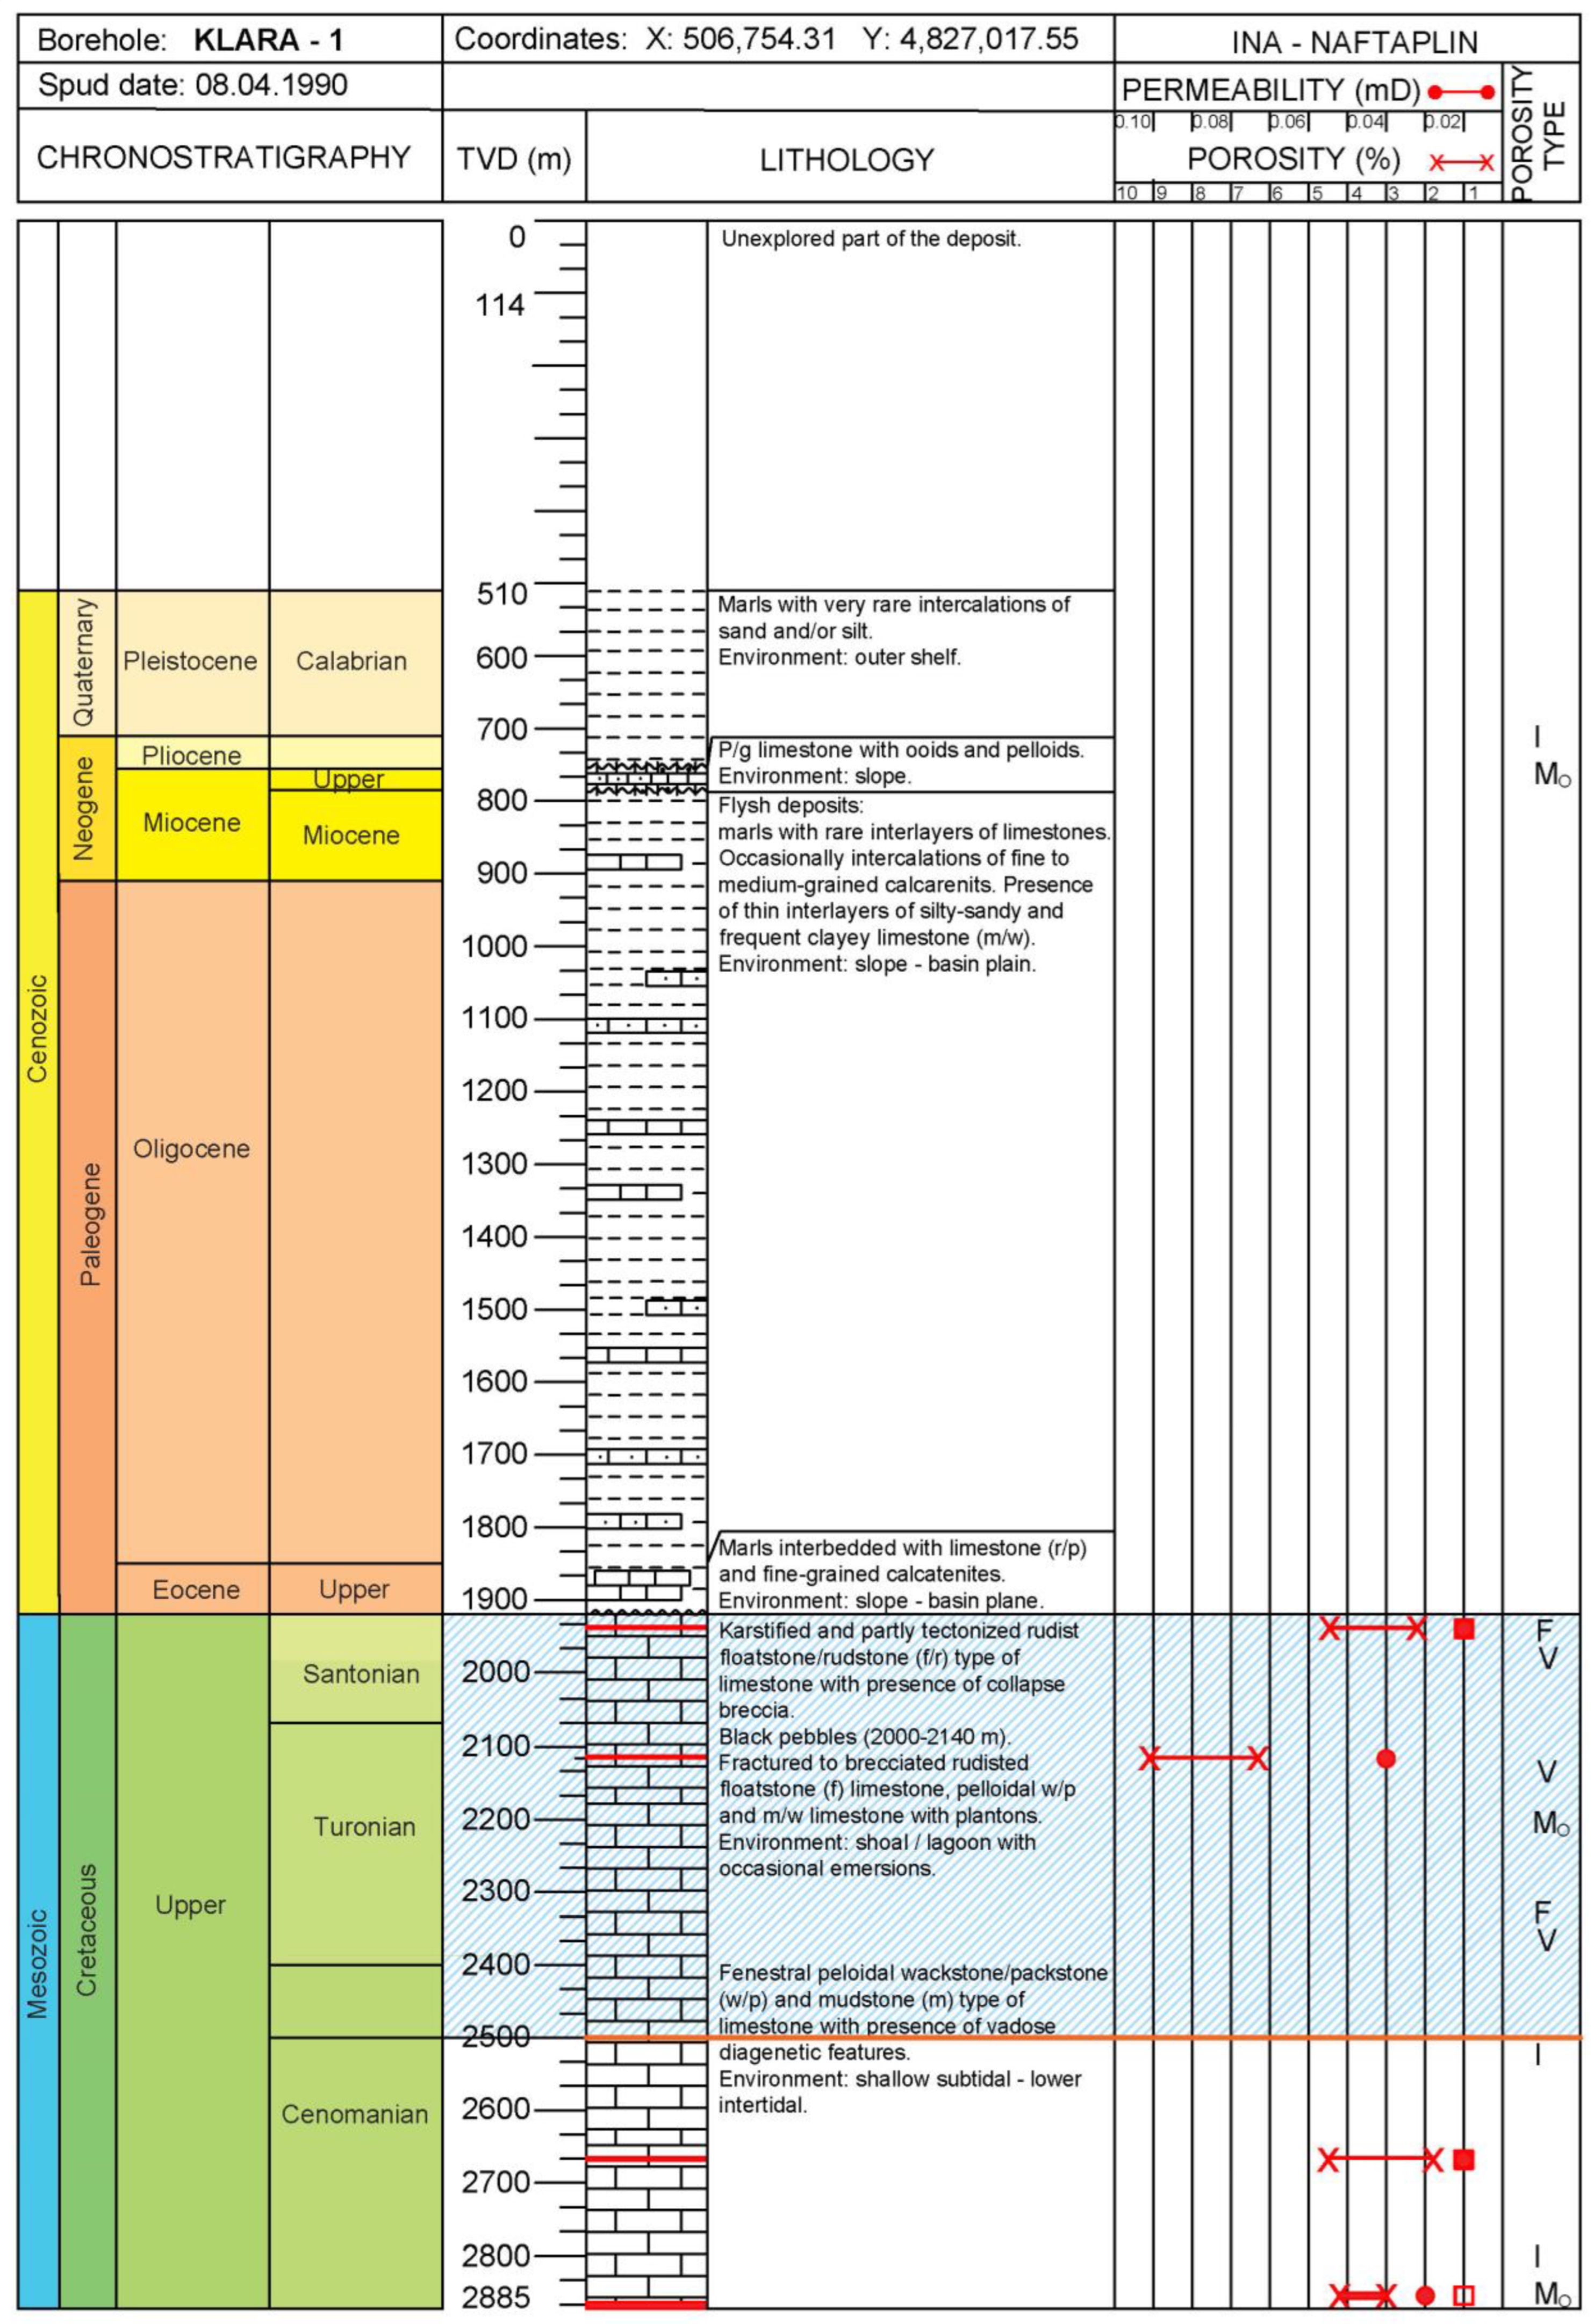
In the Klara-1 well, located 30 km SW from the central part of the island of Kornat, the two main sedimentary complexes separated by an unconformity can be distinguished: the Tertiary siliciclastic–carbonate complex (flysch-type deposits) and the Cretaceous carbonate complex (mainly rudist limestone, Figure 4). According to earlier petroleum exploration studies, the reservoir rocks were represented by rudists limestone of the Cenomianian–Turonian–Santonian age, while the seal rocks were represented by Late Eocene and mostly Oligocene siliciclastic rocks that are over 1500 m thick. Out of a total of four core samples, the two are located in the Turonian–Santonian limestone with porosity values 2.1%–5.5% in the interval from −1936 m to −1939 m and 6.3%–9.1% in the interval from −2116 to −2120 m. The whole unit is described with fracture and vuggy porosity with occasional occurrence of moldic porosity.
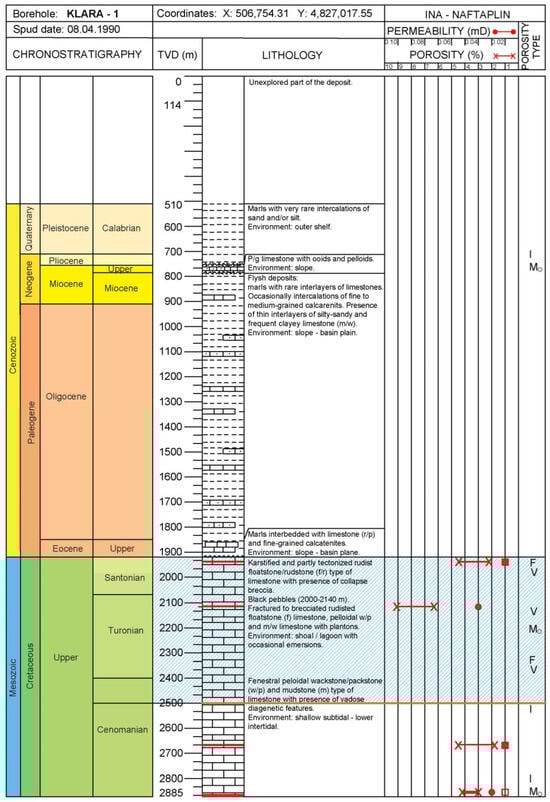
Figure 4.
Reservoir rocks in the Klara-1 exploration well represented by rudist limestone of the Cenomanian–Turonian–Santonian age (blue marked interval). Orange line is the bottom of the storage interval and black line marks the top of the structure.
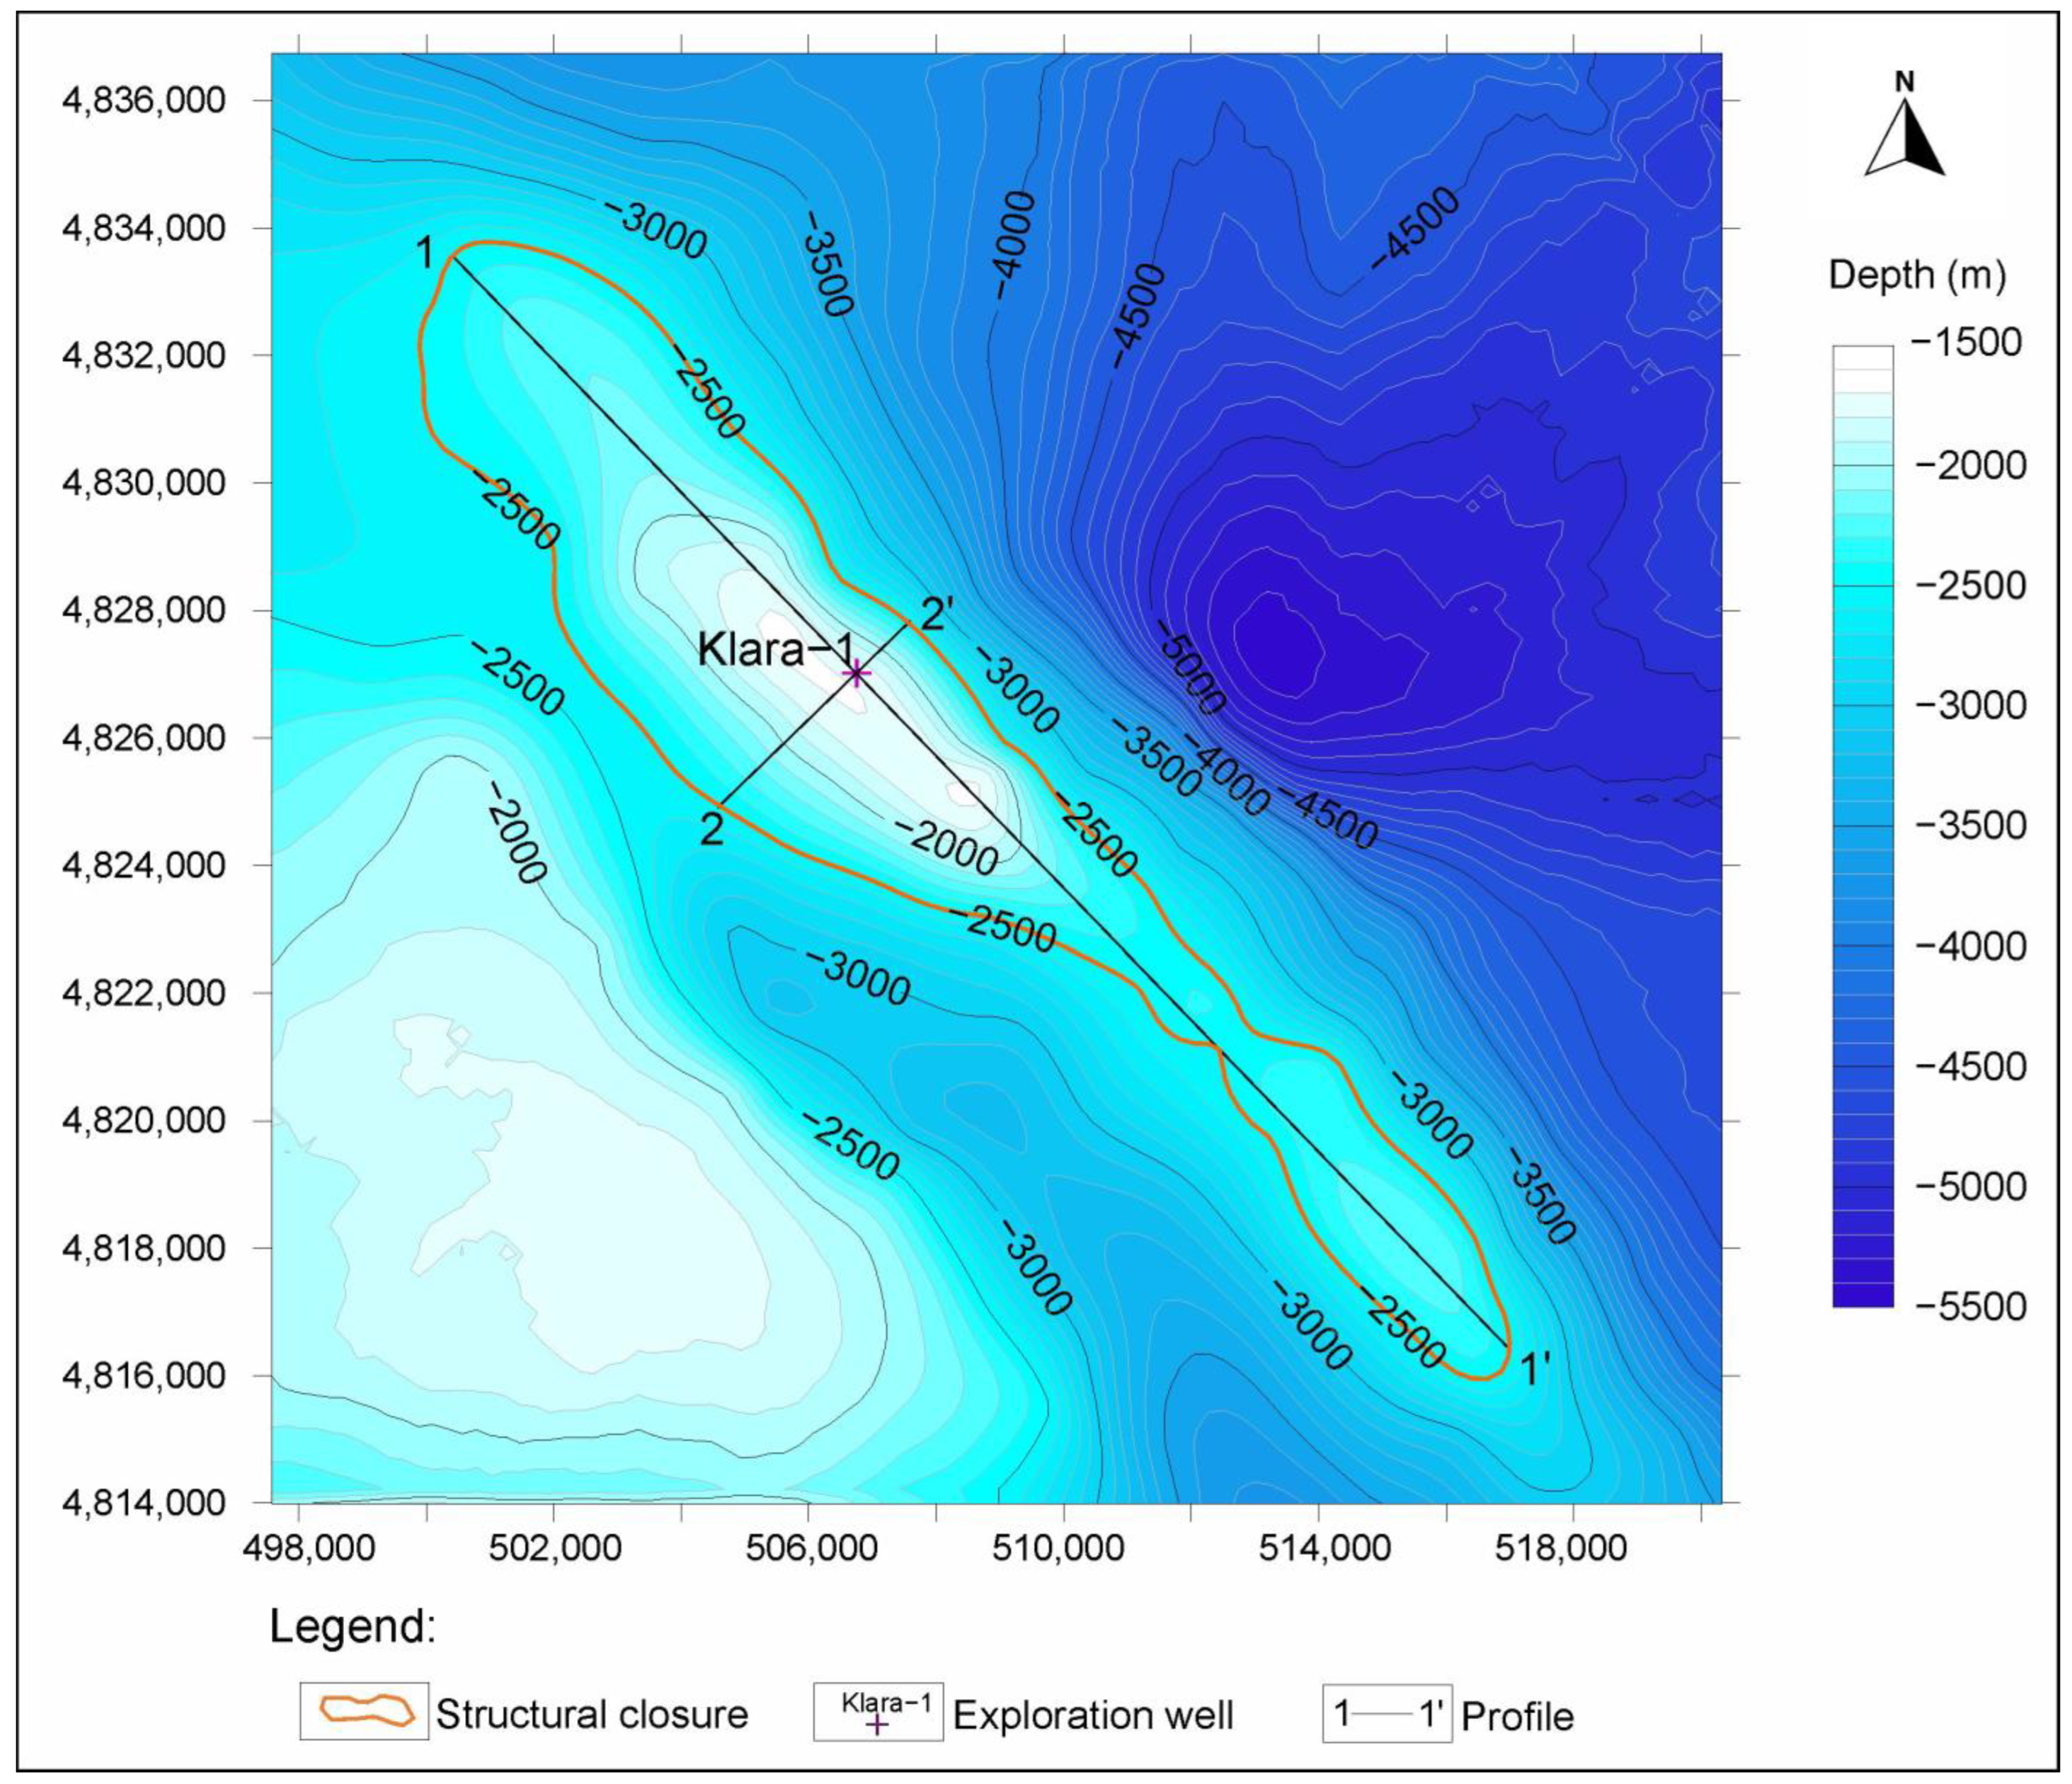
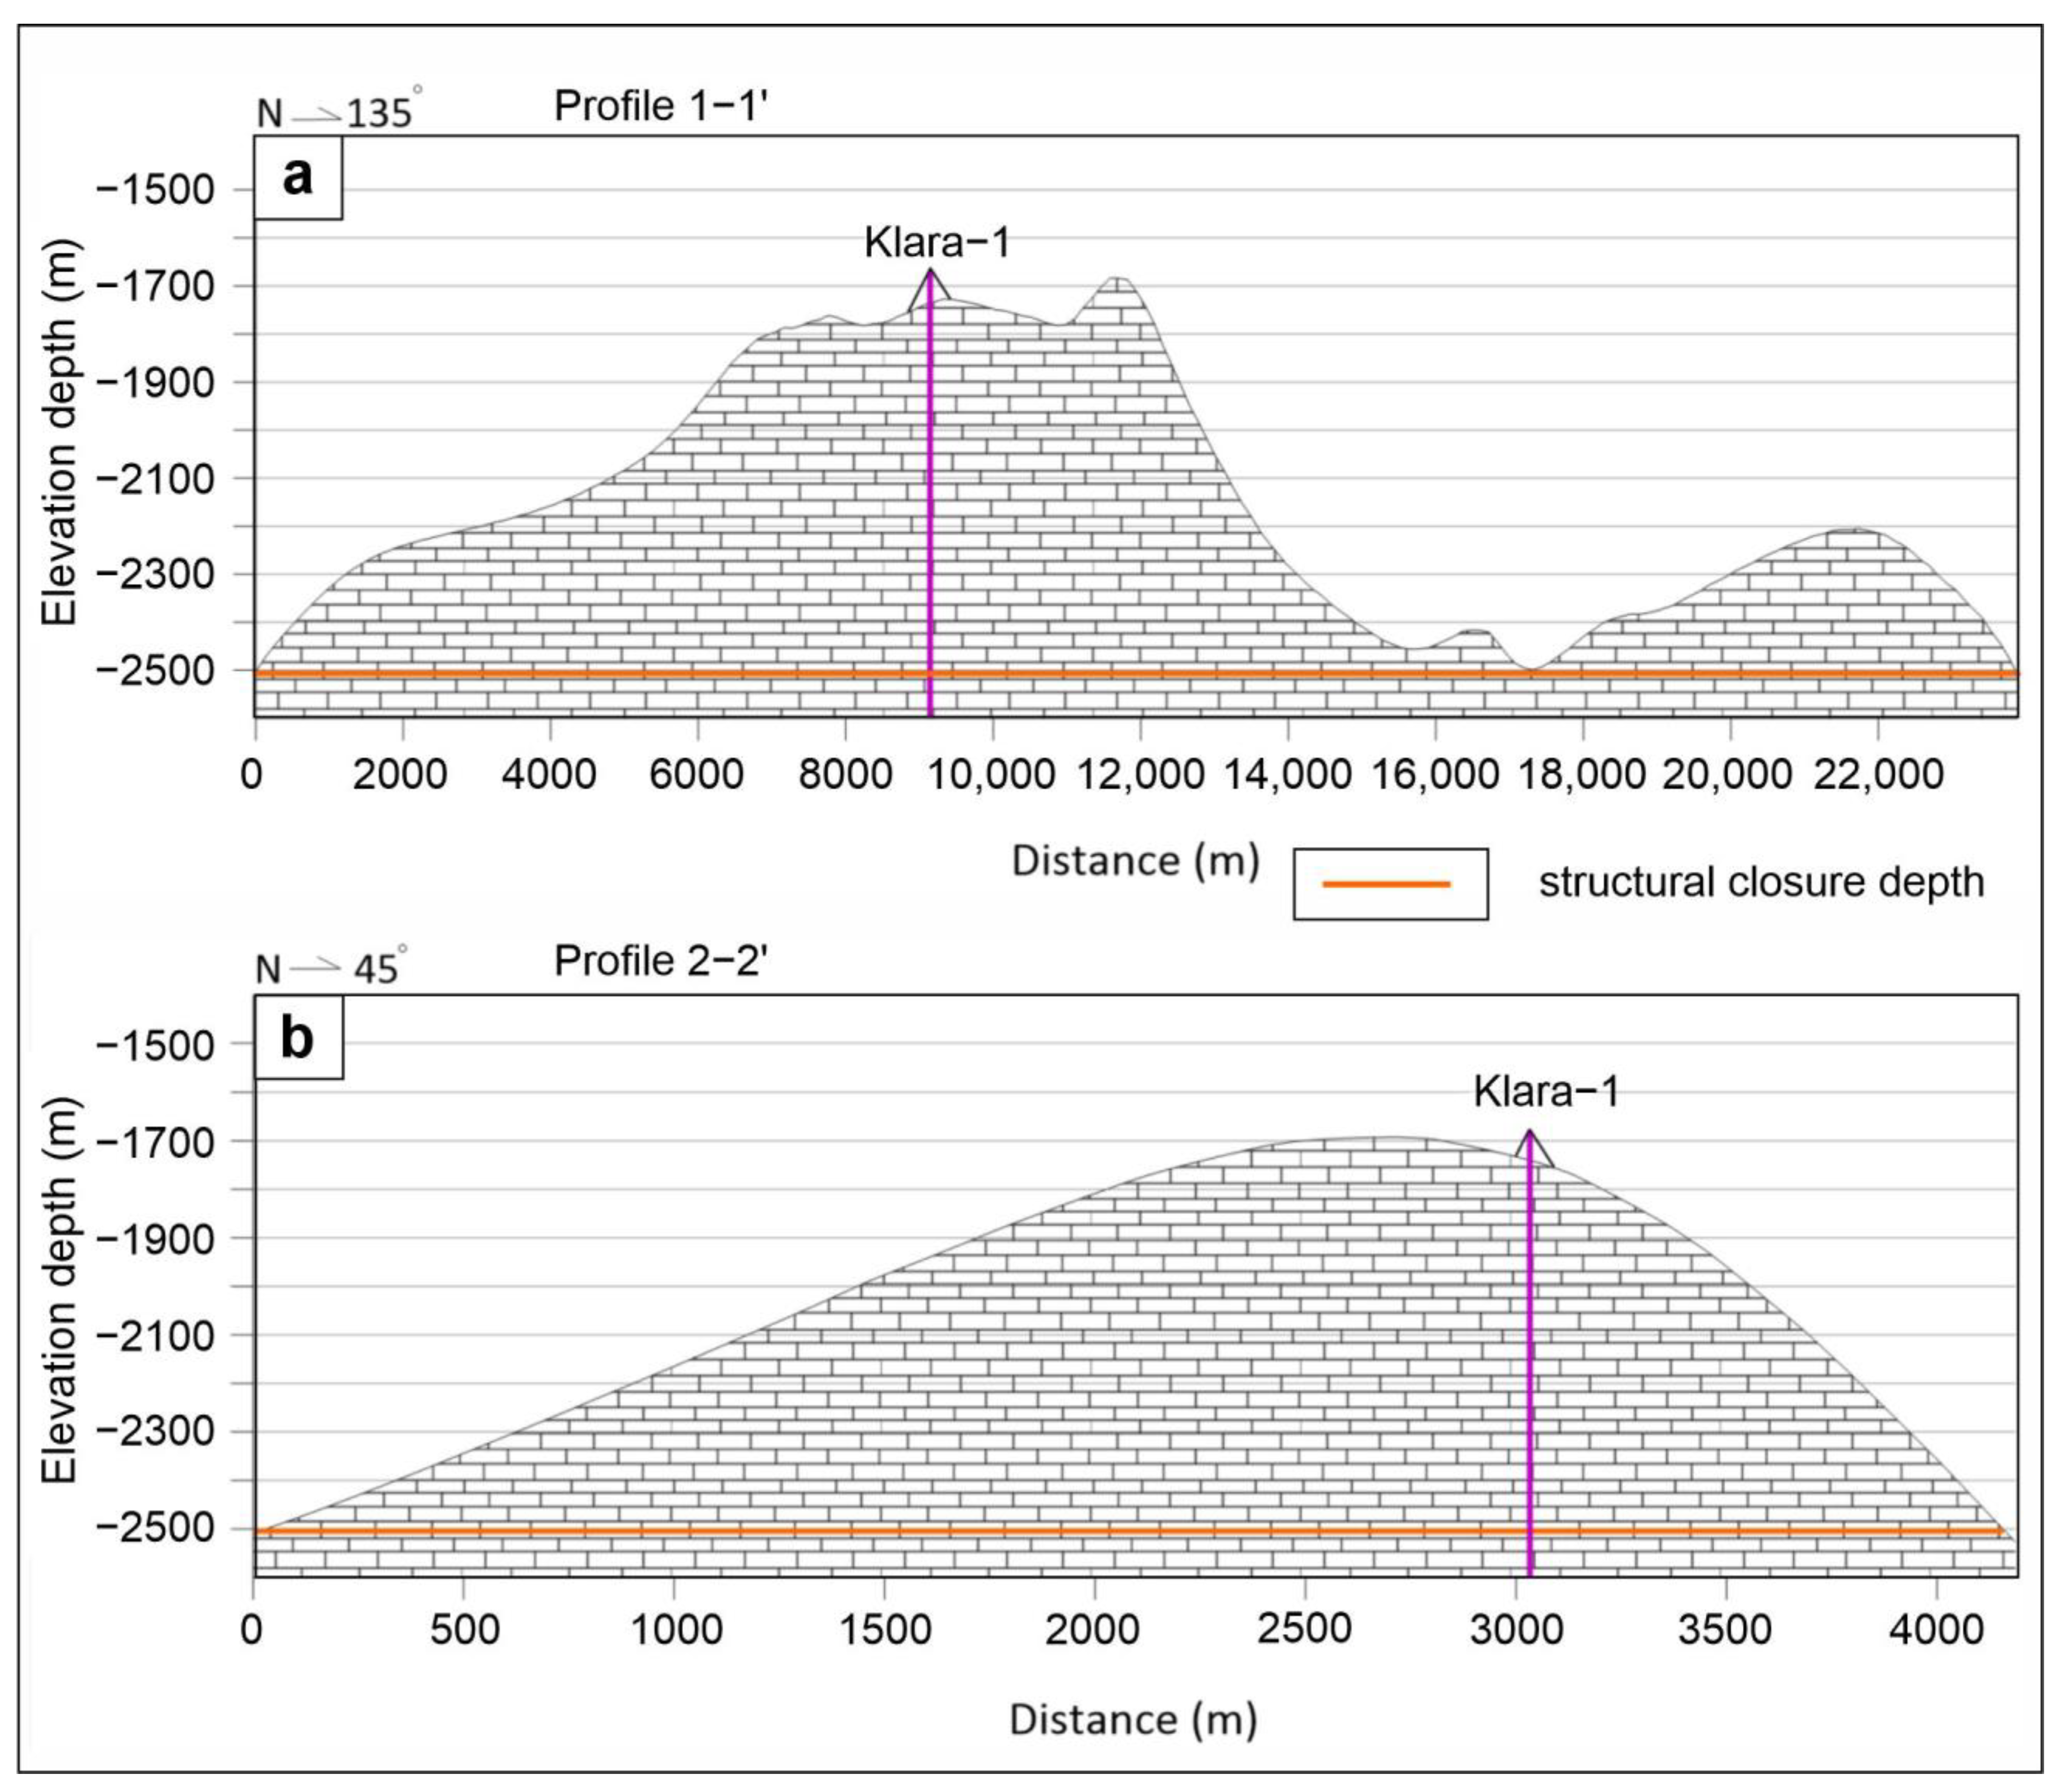
The Klara structure is an anticline of the Mesozoic carbonate complex located on the SW edge of the Upper Cretaceous intraplatform basin called “Dugi otok basin” [1] and belongs to its structural reef uplift (Figure 5). Although the wider area around the structure is characterised by reverse faulting, there are no significant recorded faults in the vicinity of the structure itself. The structure is elongated in NW-SE direction with a length of 22 km (Figure 6a) and a width of up to 4 km (Figure 6b). The total area of the structure is 61.8 km2, and the maximal structural closure is approximately 900 m. Structural closure is defined by a spill point at a depth of −2500 m (Figure 5 and Figure 6).
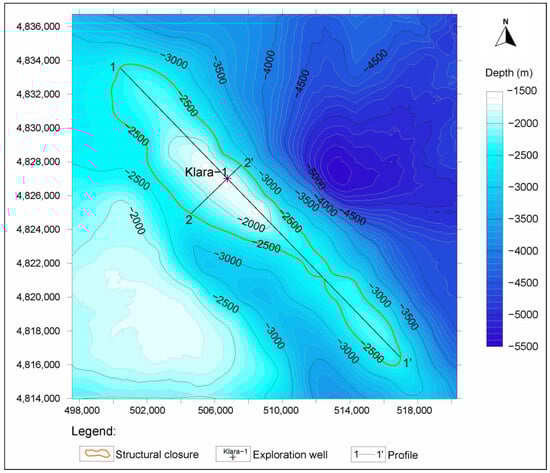
Figure 5.
Top of the carbonate complex of the Klara structure.
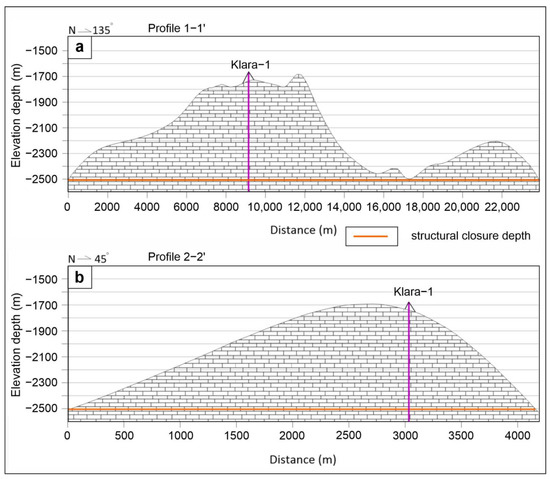
Figure 6.
Klara structure: (a) longitudinal cross-section 1-1′; (b) transversal cross-section 2-2′.
3.2.2. Kate Structure
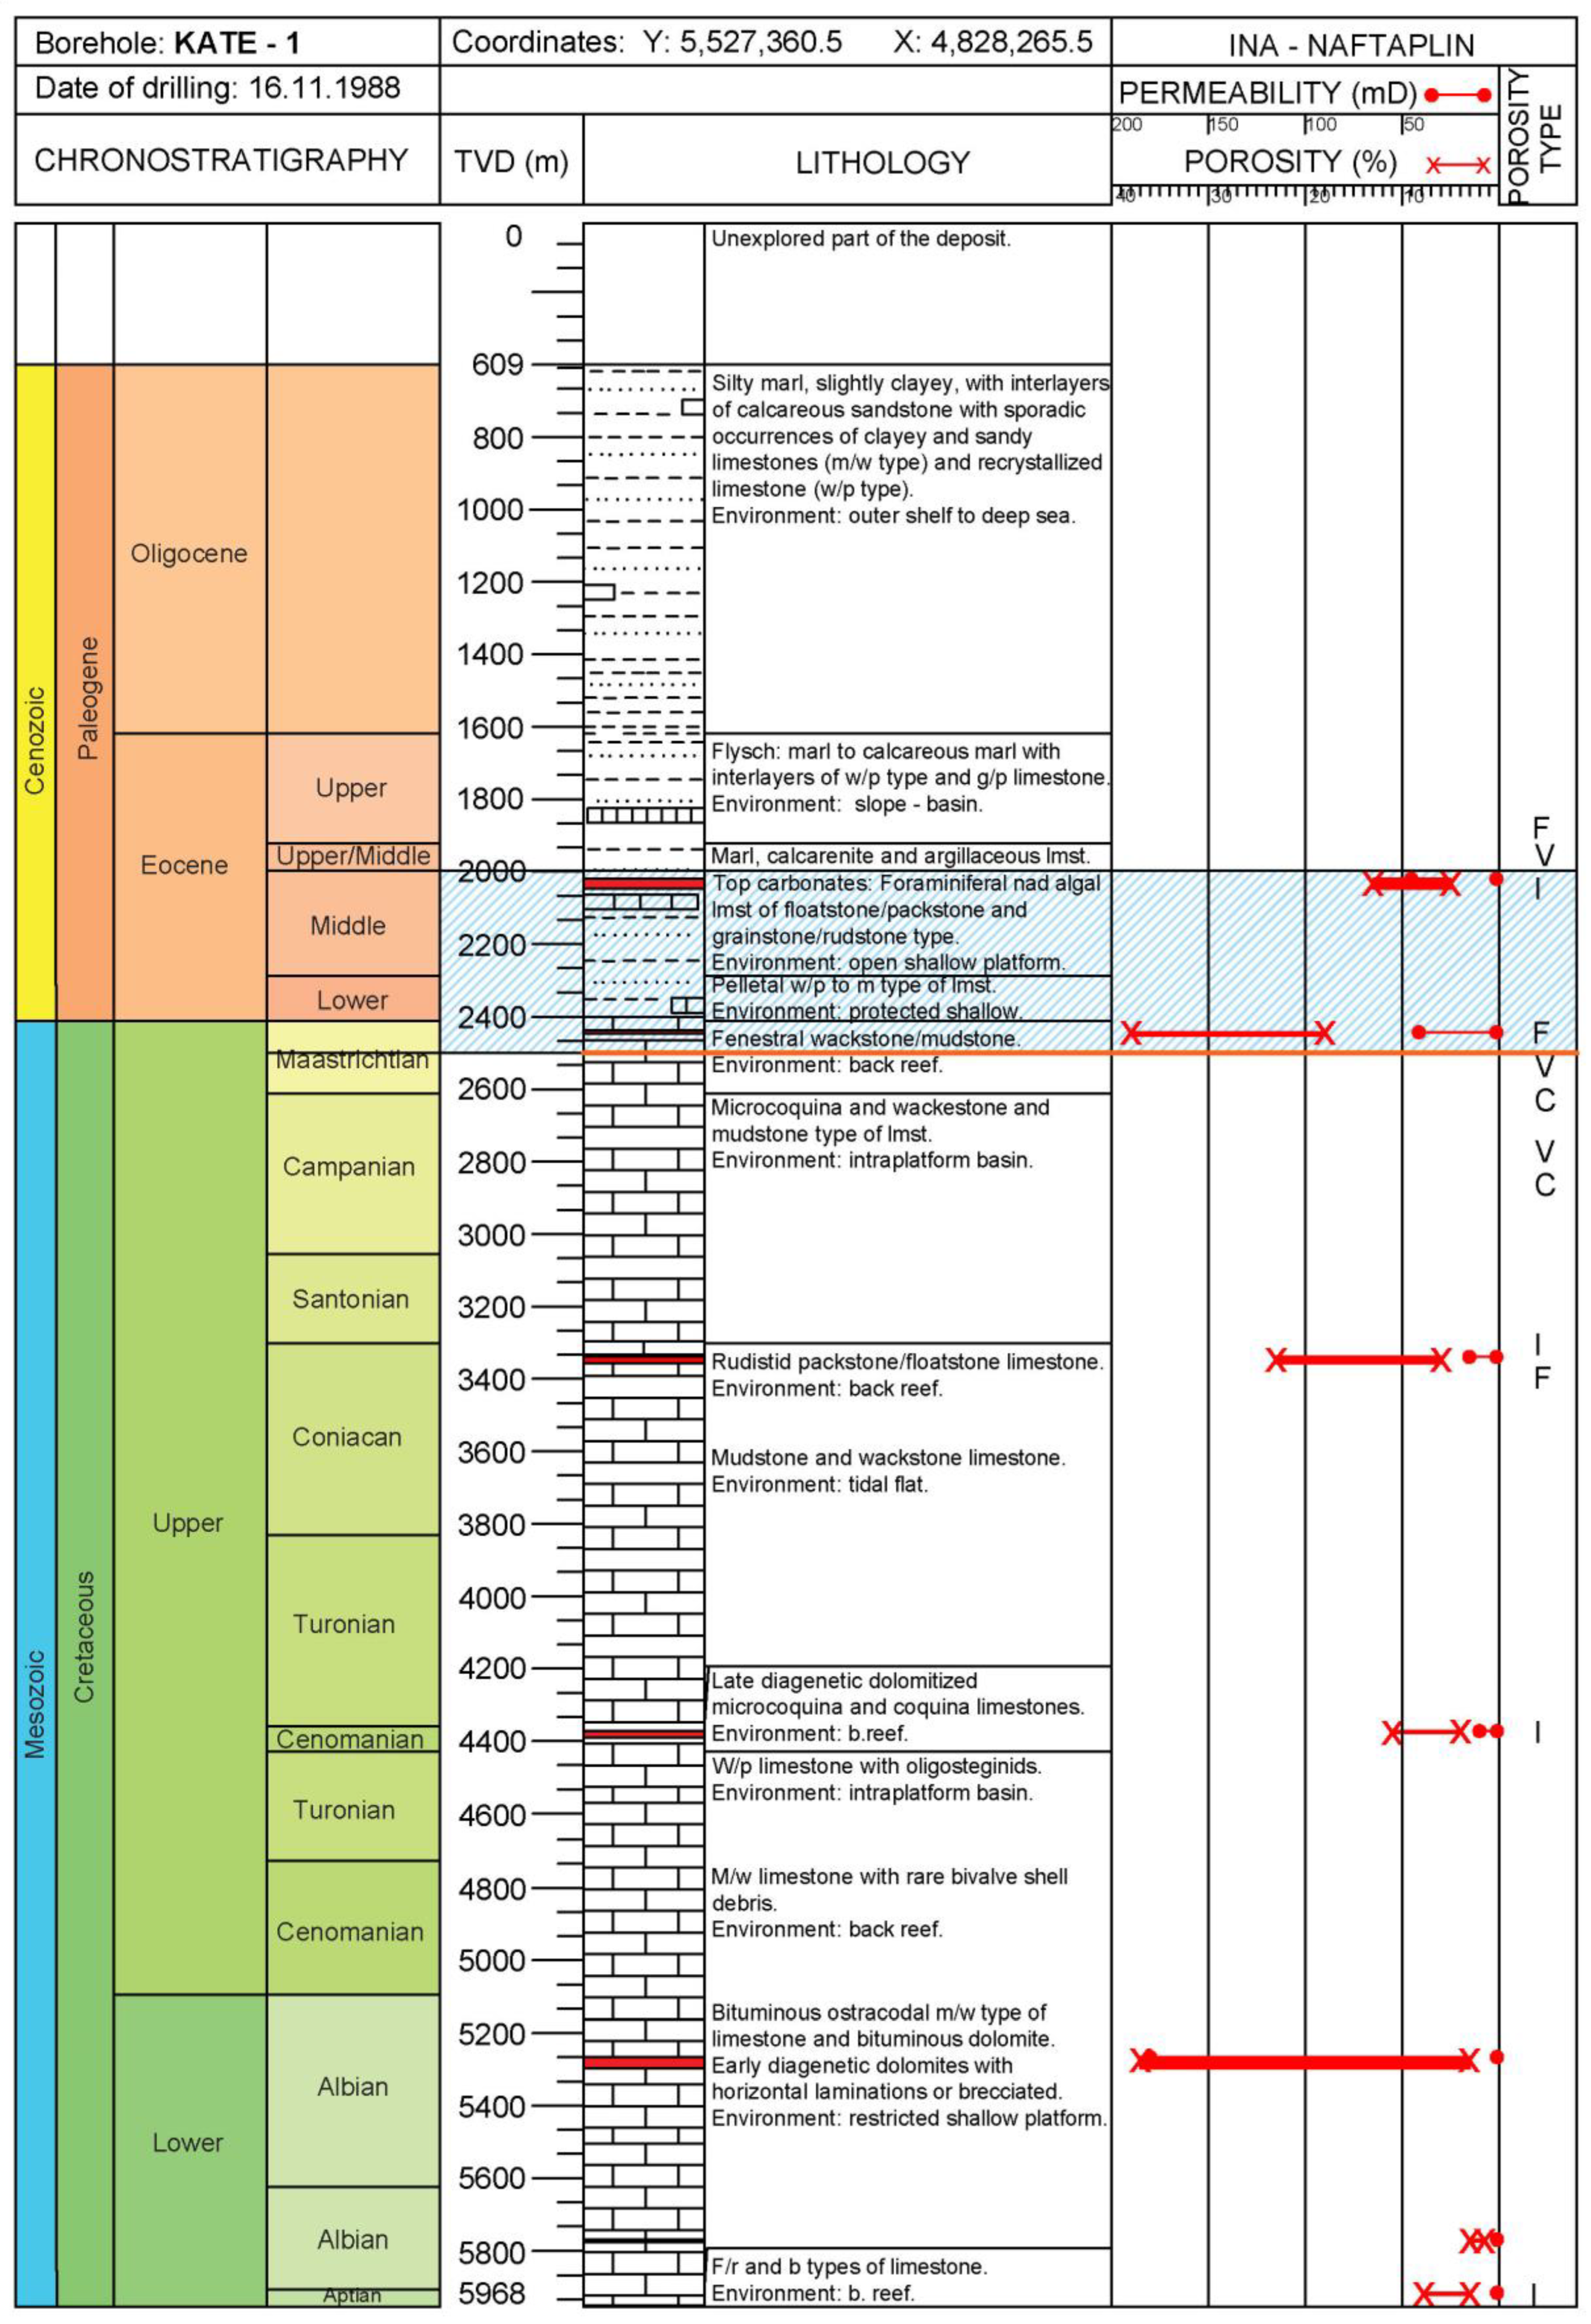
This structure is in the eastern part of the Dugi otok basin, some 60 km S of the Zadar city and 10 km E of the Klara-1 well. The Kate-1 well was drilled through the two main sedimentary complexes separated by an unconformity: the Tertiary siliciclastic–carbonate complex (flysch-type deposits) and the Cretaceous carbonate complex, mainly rudist limestone. Two types of reservoir rocks were found–Eocene foraminiferal limestone and rudist limestone of the Upper Cretaceous (Figure 7). The seal rocks were represented by Middle to Upper Eocene and mostly Oligocene siliciclastic rocks that are over 1500 m thick. Out of a total of seven core samples, one is in the Upper Cretaceous limestone and shows porosity values of 18%–38% in the interval from −2412 m to −2500 m, and one in the Middle Eocene with porosity value of 5%–13% in the interval from −1998 m to −2301 m. The Paleogene unit is described with intergranular porosity, while the Mesozoic unit is described as fractured, vuggy and intercrystalline porosity. To determine the storage capacity estimates, their petrophysical properties are averaged as if this were one single storage unit.
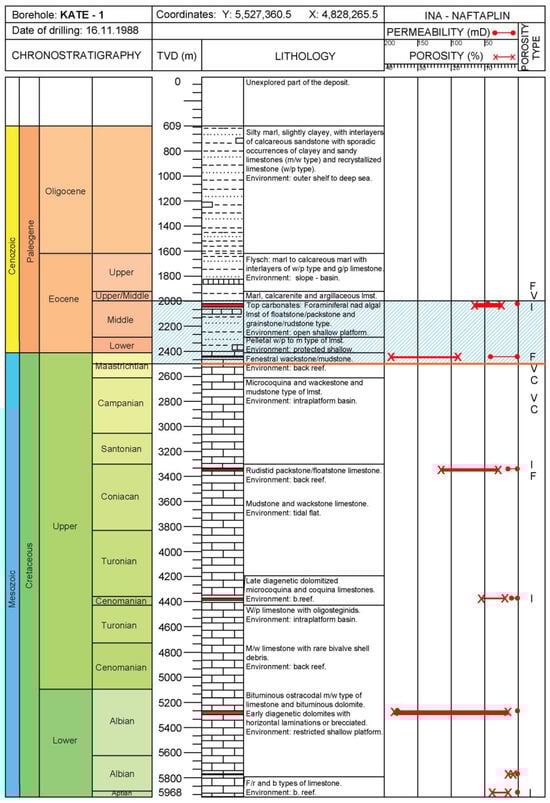
Figure 7.
Reservoir rocks in the Kate-1 well represented by Eocene foraminiferal limestone and Upper Cretaceous rudist limestone (blue marked interval). Orange line is the bottom of the storage interval and black line marks the top of the structure.
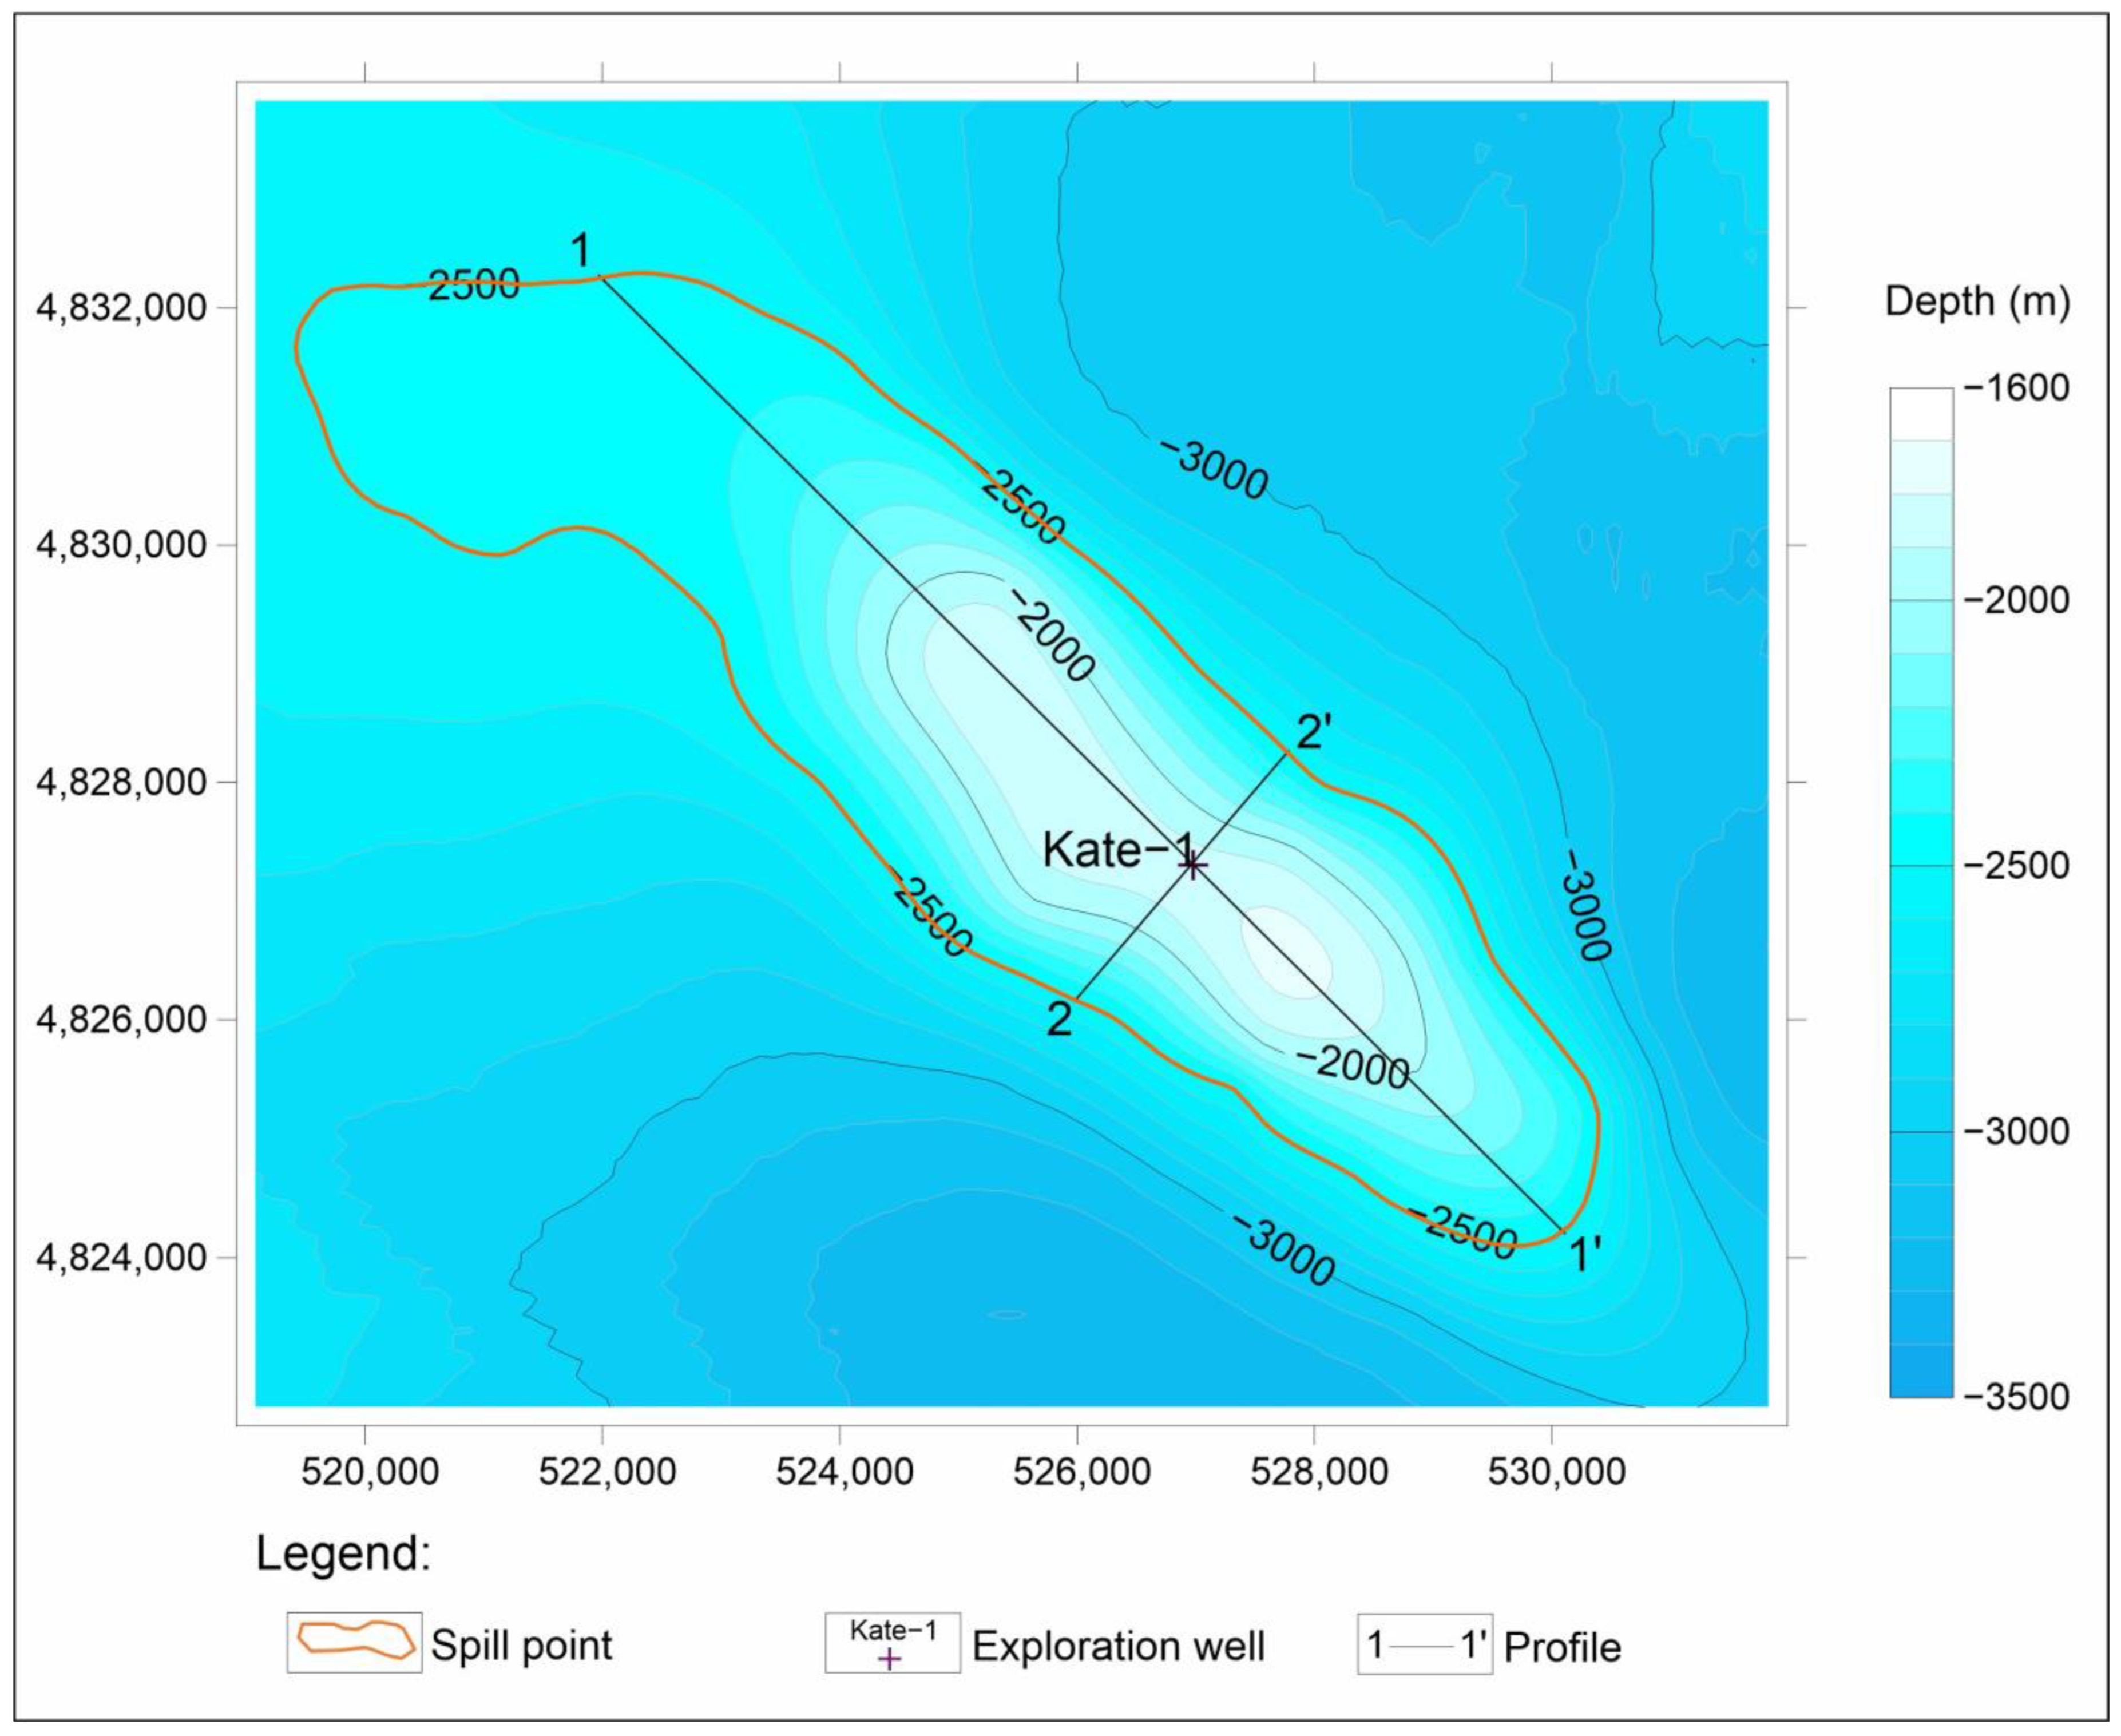
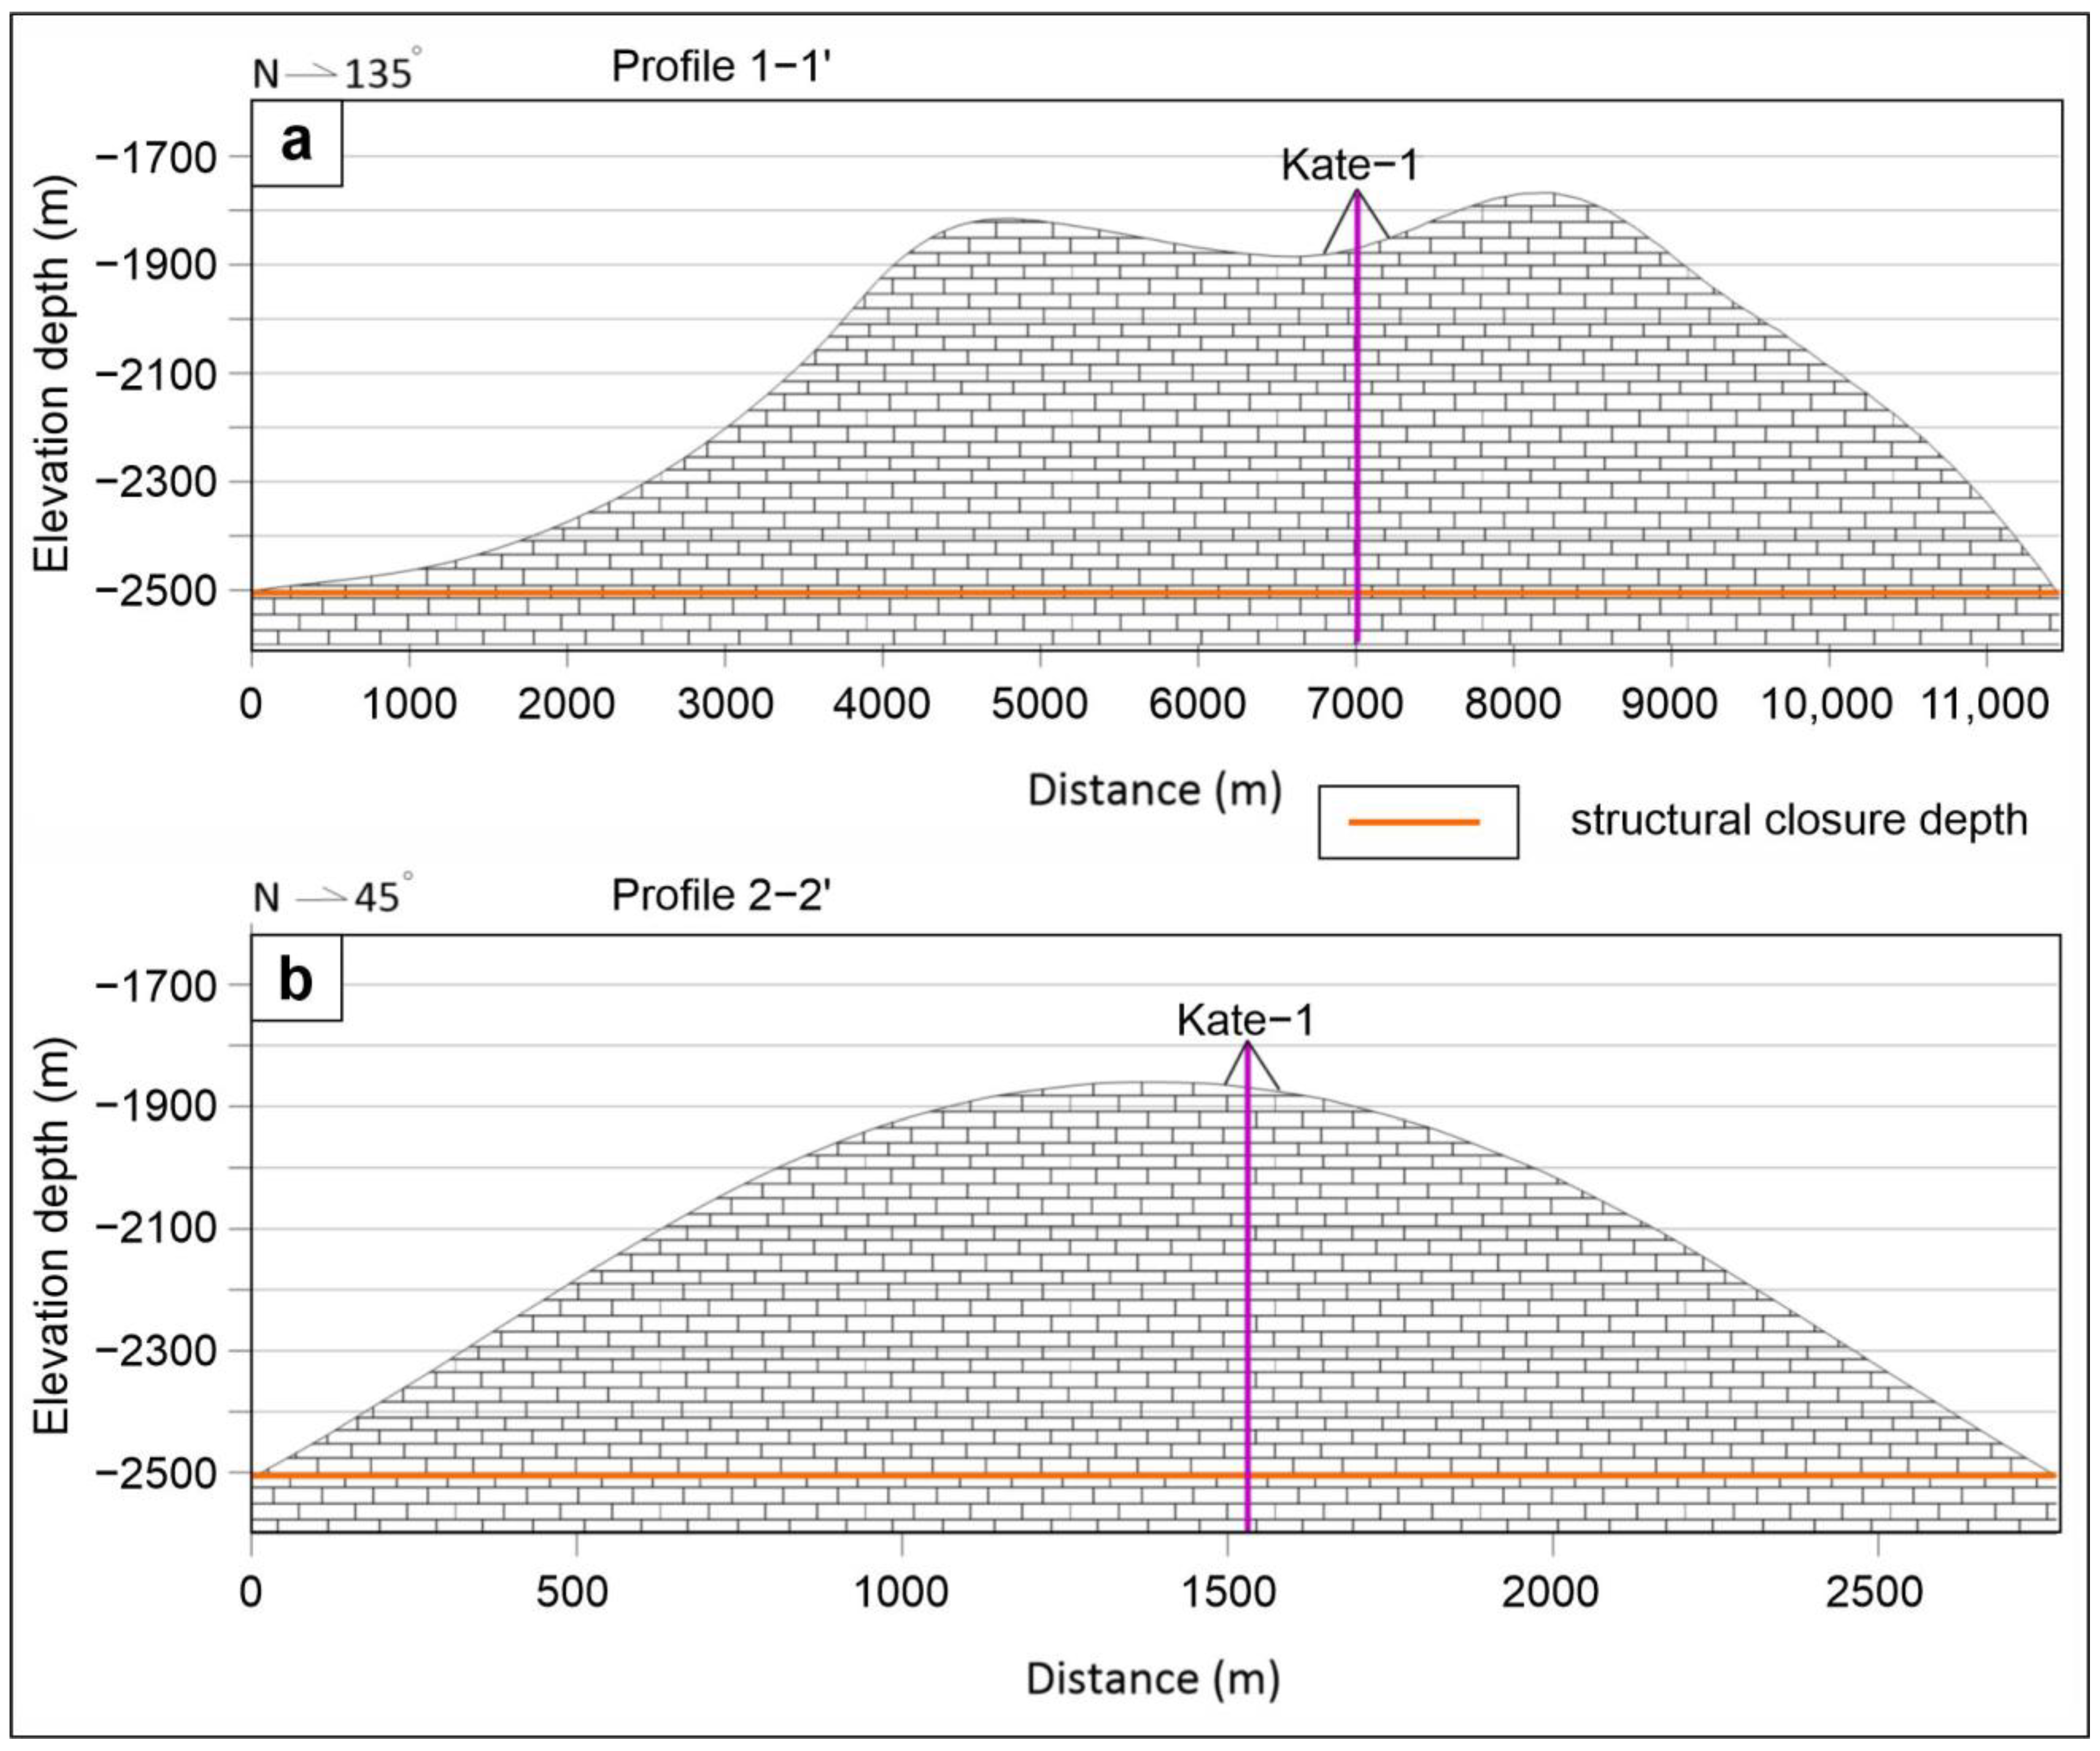
The Kate structure is an anticline trending NW to SE, formed as the result of compressional Dinaric tectonics (Figure 8). The structure is elongated in the NW-SE direction with a length of 11 km and width of up to 3 km (Figure 9a,b). The total area of the structure is 32.1 km2, and the maximal structural closure is approximately 500 m. Structure closure is defined by a spill point at a depth of −2500 m (Figure 8 and Figure 9).

Figure 8.
Top of the carbonate complex of the Kate structure.
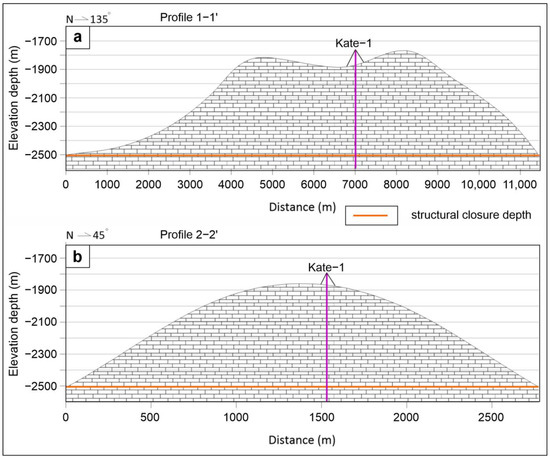
Figure 9.
Kate structure: (a) longitudinal cross-section 1-1′; (b) transversal cross-section 2-2′.
3.2.3. Perina Structure
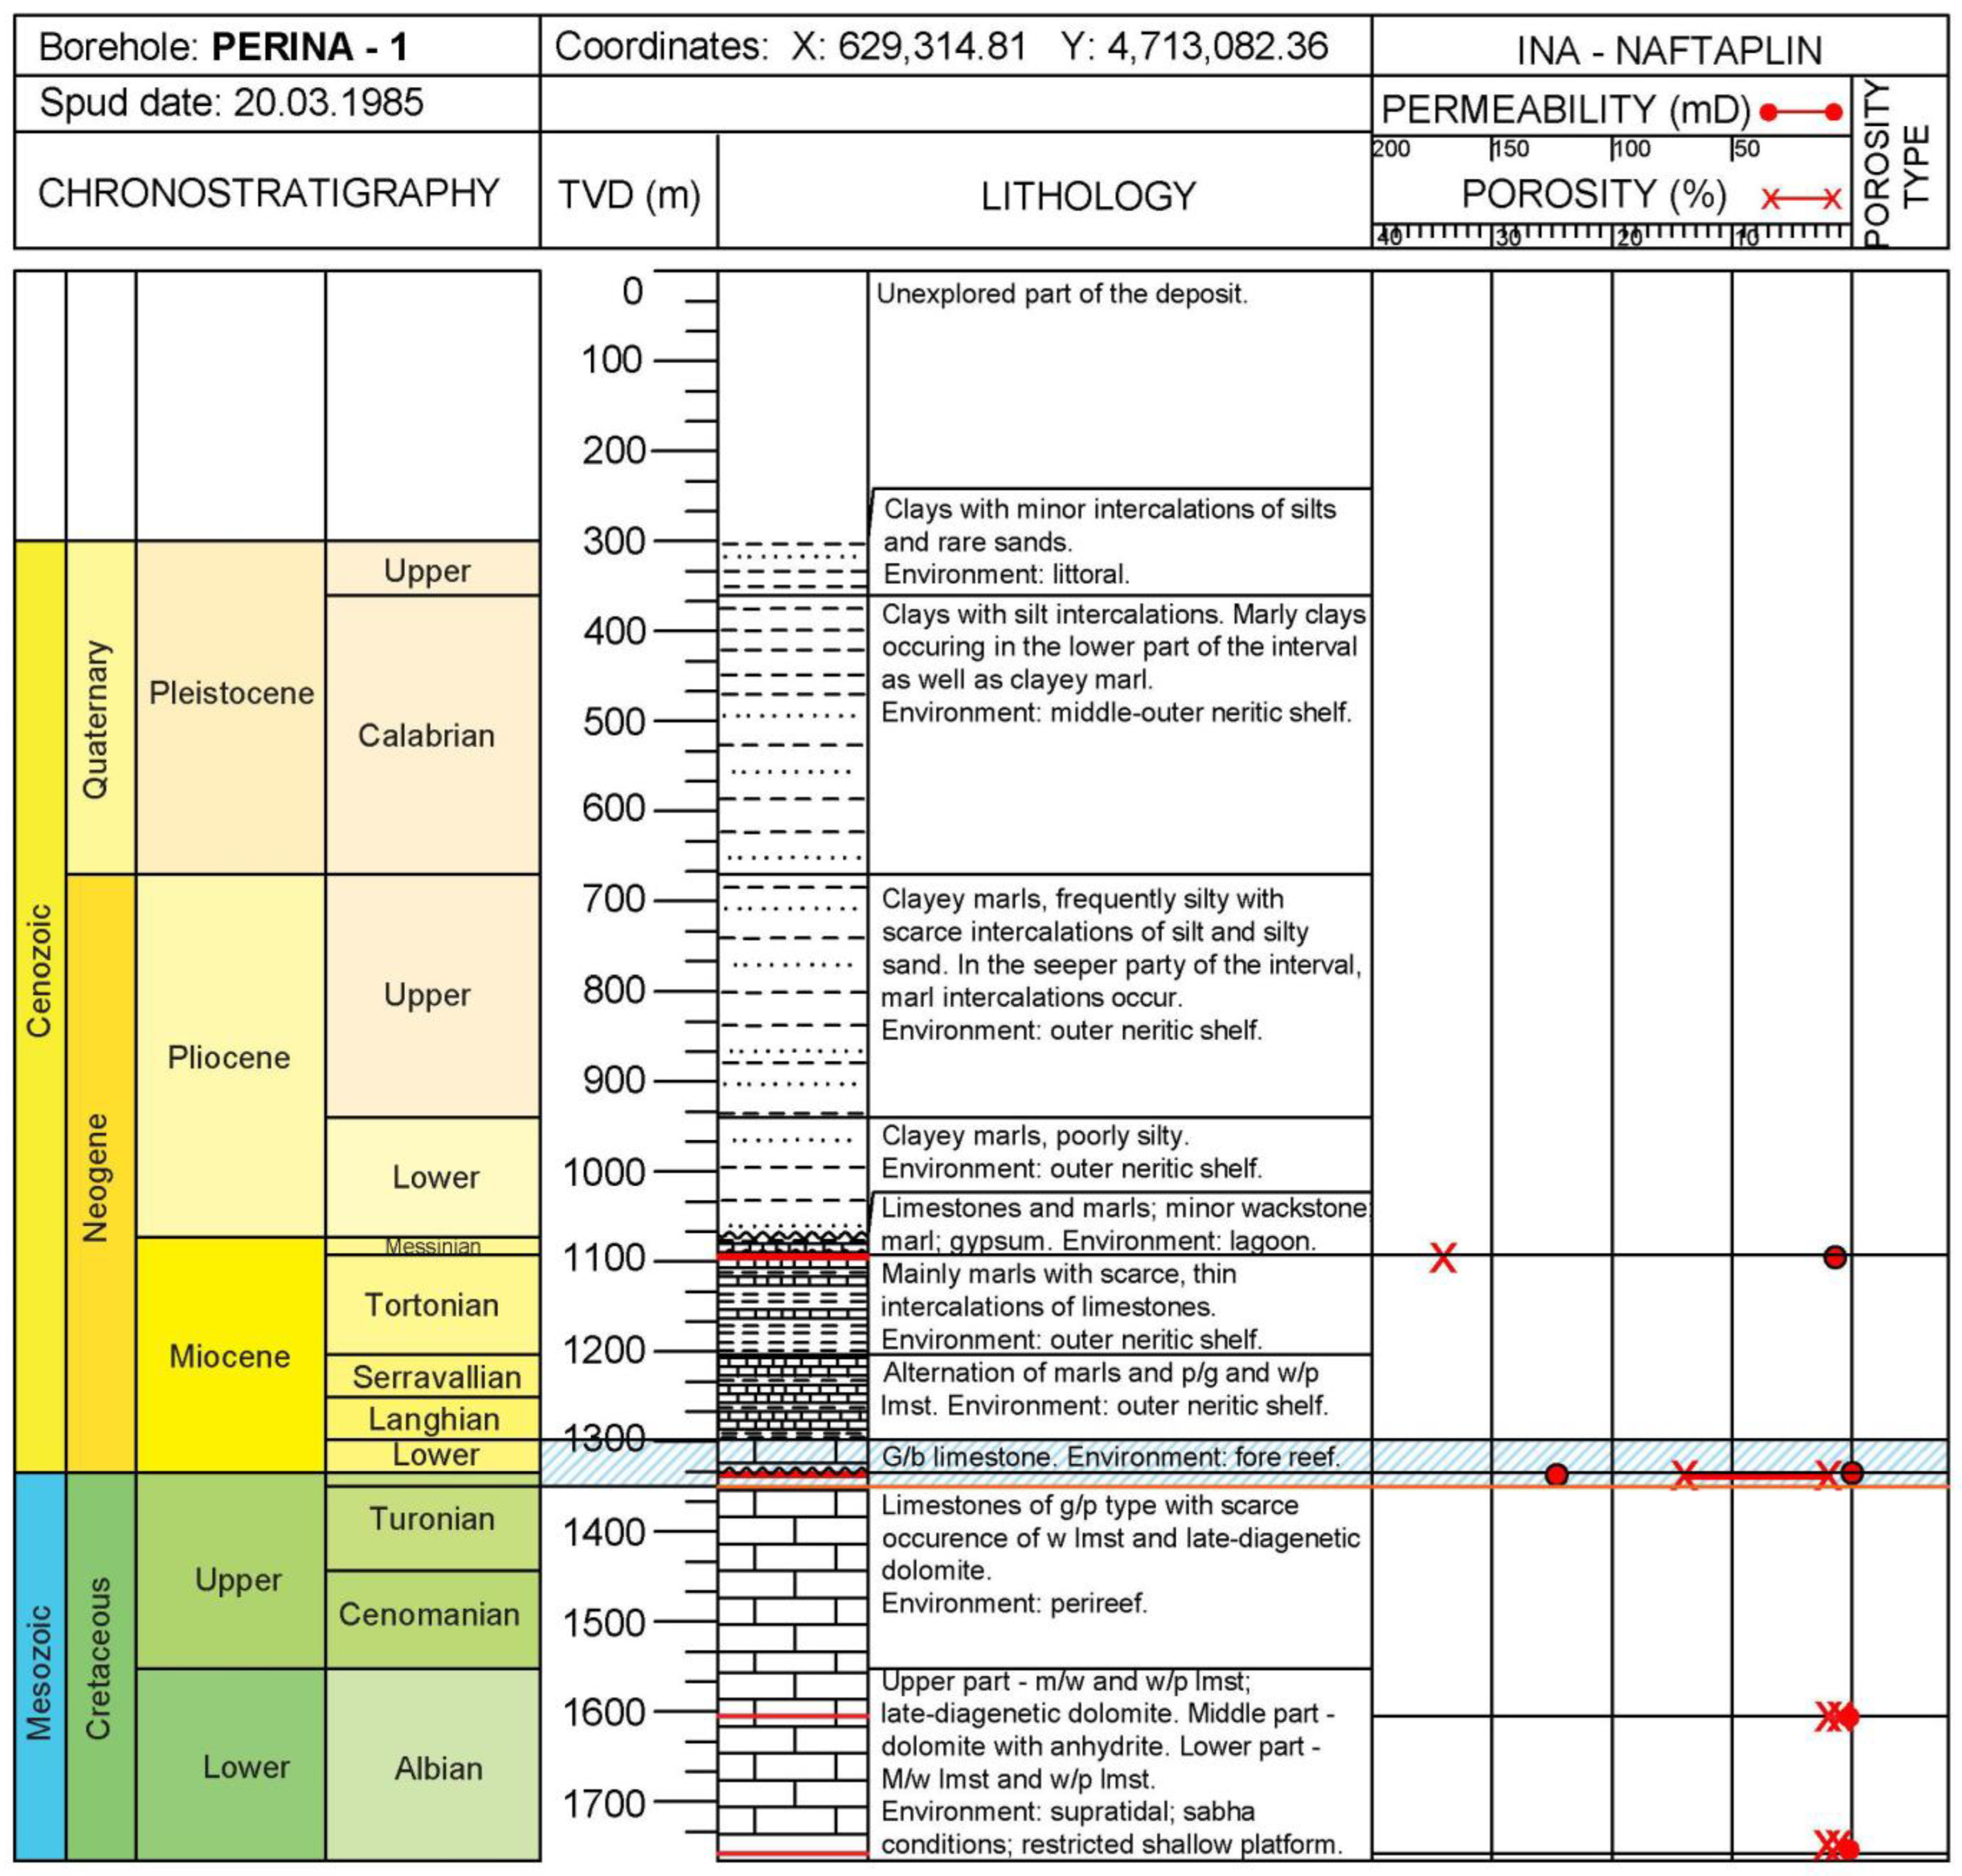
The Perina-1 well was drilled on the Perina High, 180 km SE from the Klara-1 and Kate-1 wells. The drilled-through formations in the area of the Perina-1 well showed a sedimentation gap that occurred in the Upper Cretaceous, extending all the way to the Lower Miocene (Figure 10). The reservoir/storage interval of the Perina structure consists of two chronostratigraphic units—the Upper Cretaceous prospect (from −1333 m to −1350 m) and the Lower Miocene prospect (from −1298 m to −1333 m). The seal rocks are also found in two intervals—Miocene marls, limestones and evaporites that are approximately 200 m thick—and Pliocene and Pleistocene siliciclastic rocks with a thickness of almost 800 m.
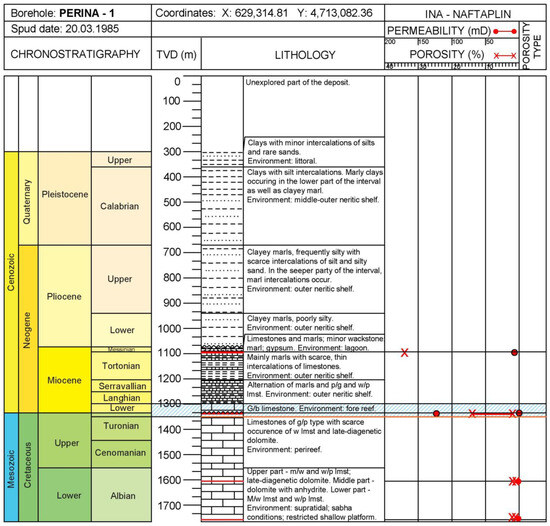
Figure 10.
The reservoir rocks in the Perina-1 exploration well represented by the Lower Miocene carbonates and the Upper Cretaceous limestones (marked blue). Orange line is the bottom of the storage interval and black line marks the top of the structure.
Data obtained from cores, well logs and drilling indicate that the Lower Miocene carbonates are porous, while the Upper Cretaceous limestones were subjected to karstification. All data sources indicate vuggy and cavernous porosity. Out of a total of four core samples, one was located at the boundary between the Upper Cretaceous/Lower Miocene limestones with a porosity value of 1.8%–14.3%. Evaluation of reservoir properties through well log measurements rendered the congruent 2%–17.5% range.
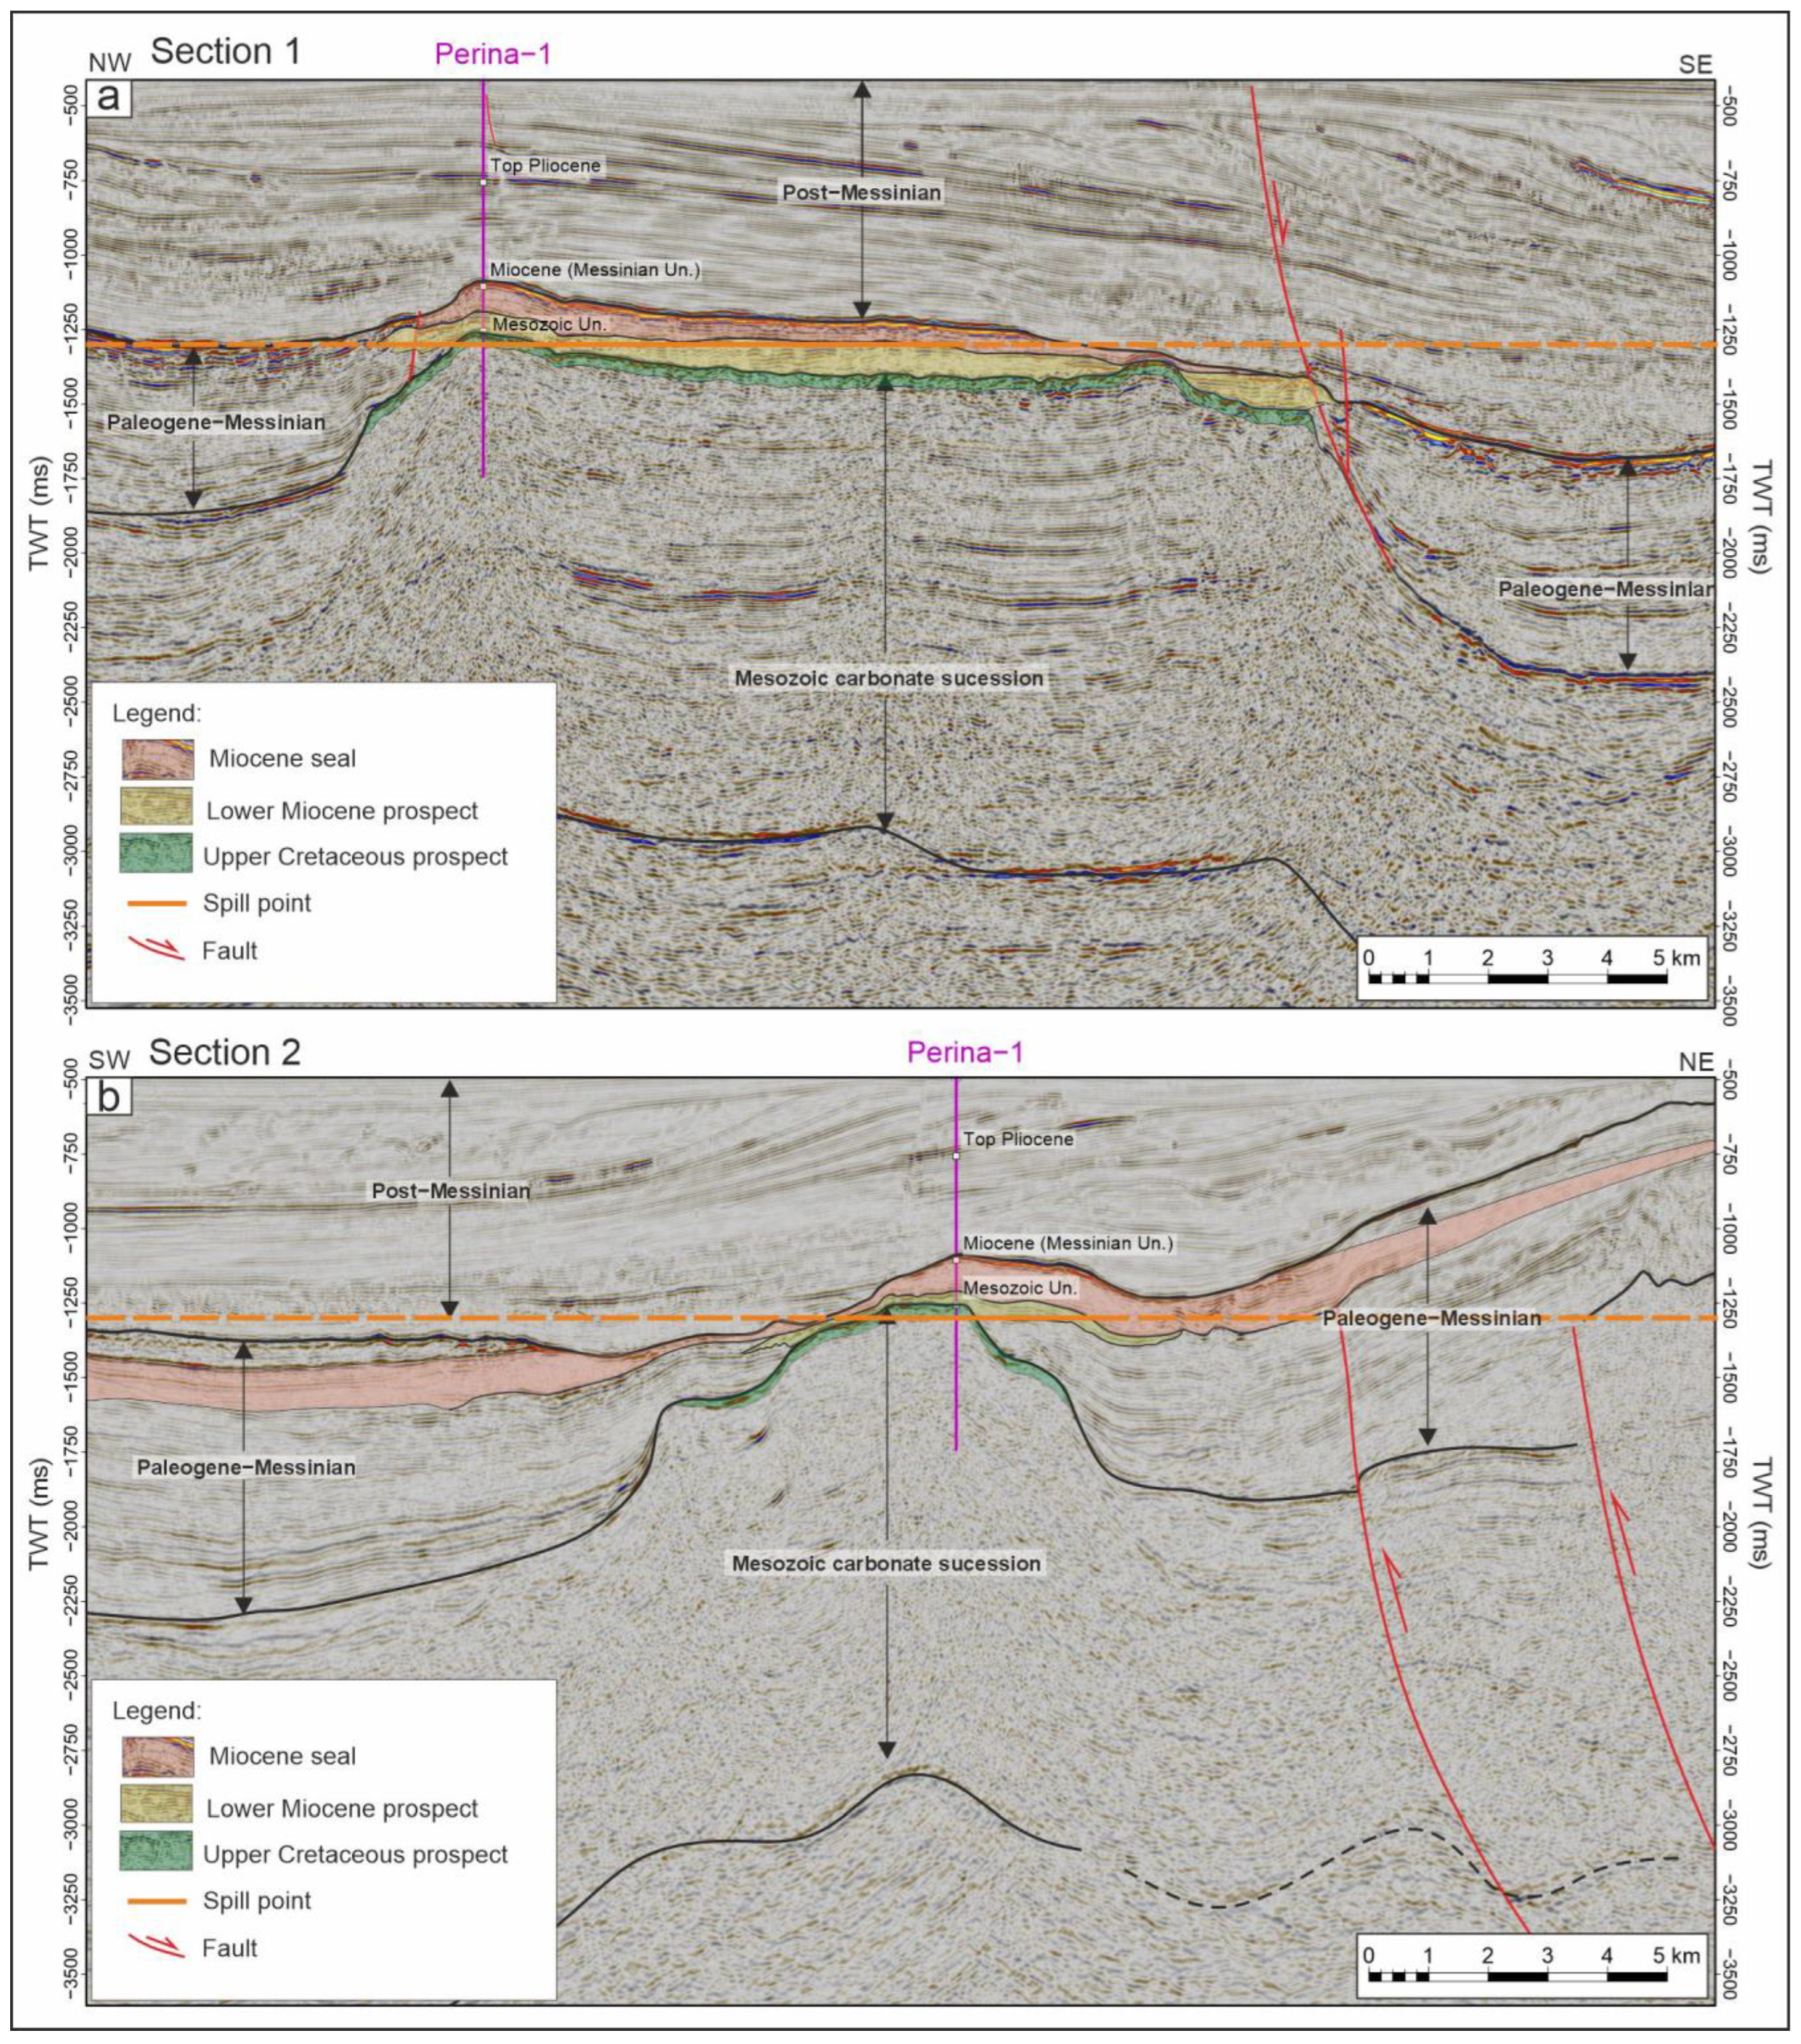
Seismic data were used to define the geometry of two reservoirs on the Perina structure. This was possible only because the karstified zone of the Upper Cretaceous carbonates is characterised by high amplitudes in the uppermost zone of the Perina High, and it represents the Upper Cretaceous reservoir. It is visible all over the Perina structure (Figure 11a) with around 15 ms in thickness. This reservoir is distinguished from the rest of the Mesozoic carbonate succession within the Perina High, which is presented with low-amplitude chaotic seismic reflexes. On top of the Upper Cretaceous karstified reservoir, the Lower Miocene limestone reservoir is interpreted. It is characterised by the continuous and high amplitudes of seismic reflexes, which laterally change into a low-amplitude seismic reflection of a more basinal Paleogene to Messinian strata. On top of this reservoir and below the Messinian unconformity, low to middle amplitude seismic reflexes are interpreted as Tortonian to Messinian marls, limestones and evaporites that represent the Miocene seal (Figure 11a,b). The location of the two seismic sections is shown in Figure 2 and partly in Figure 12a,b.
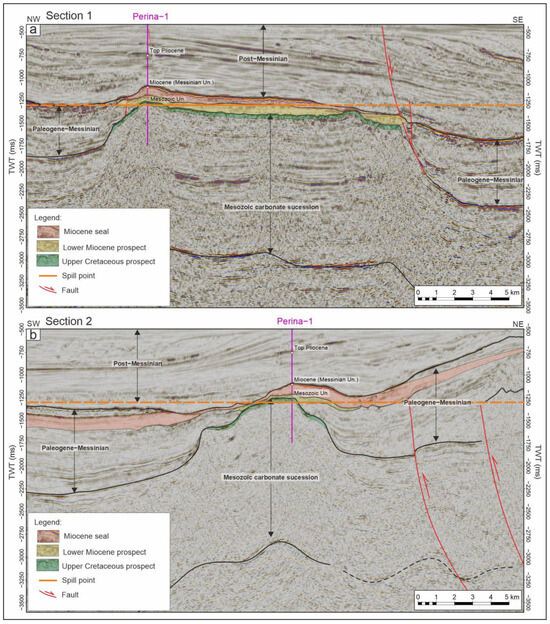

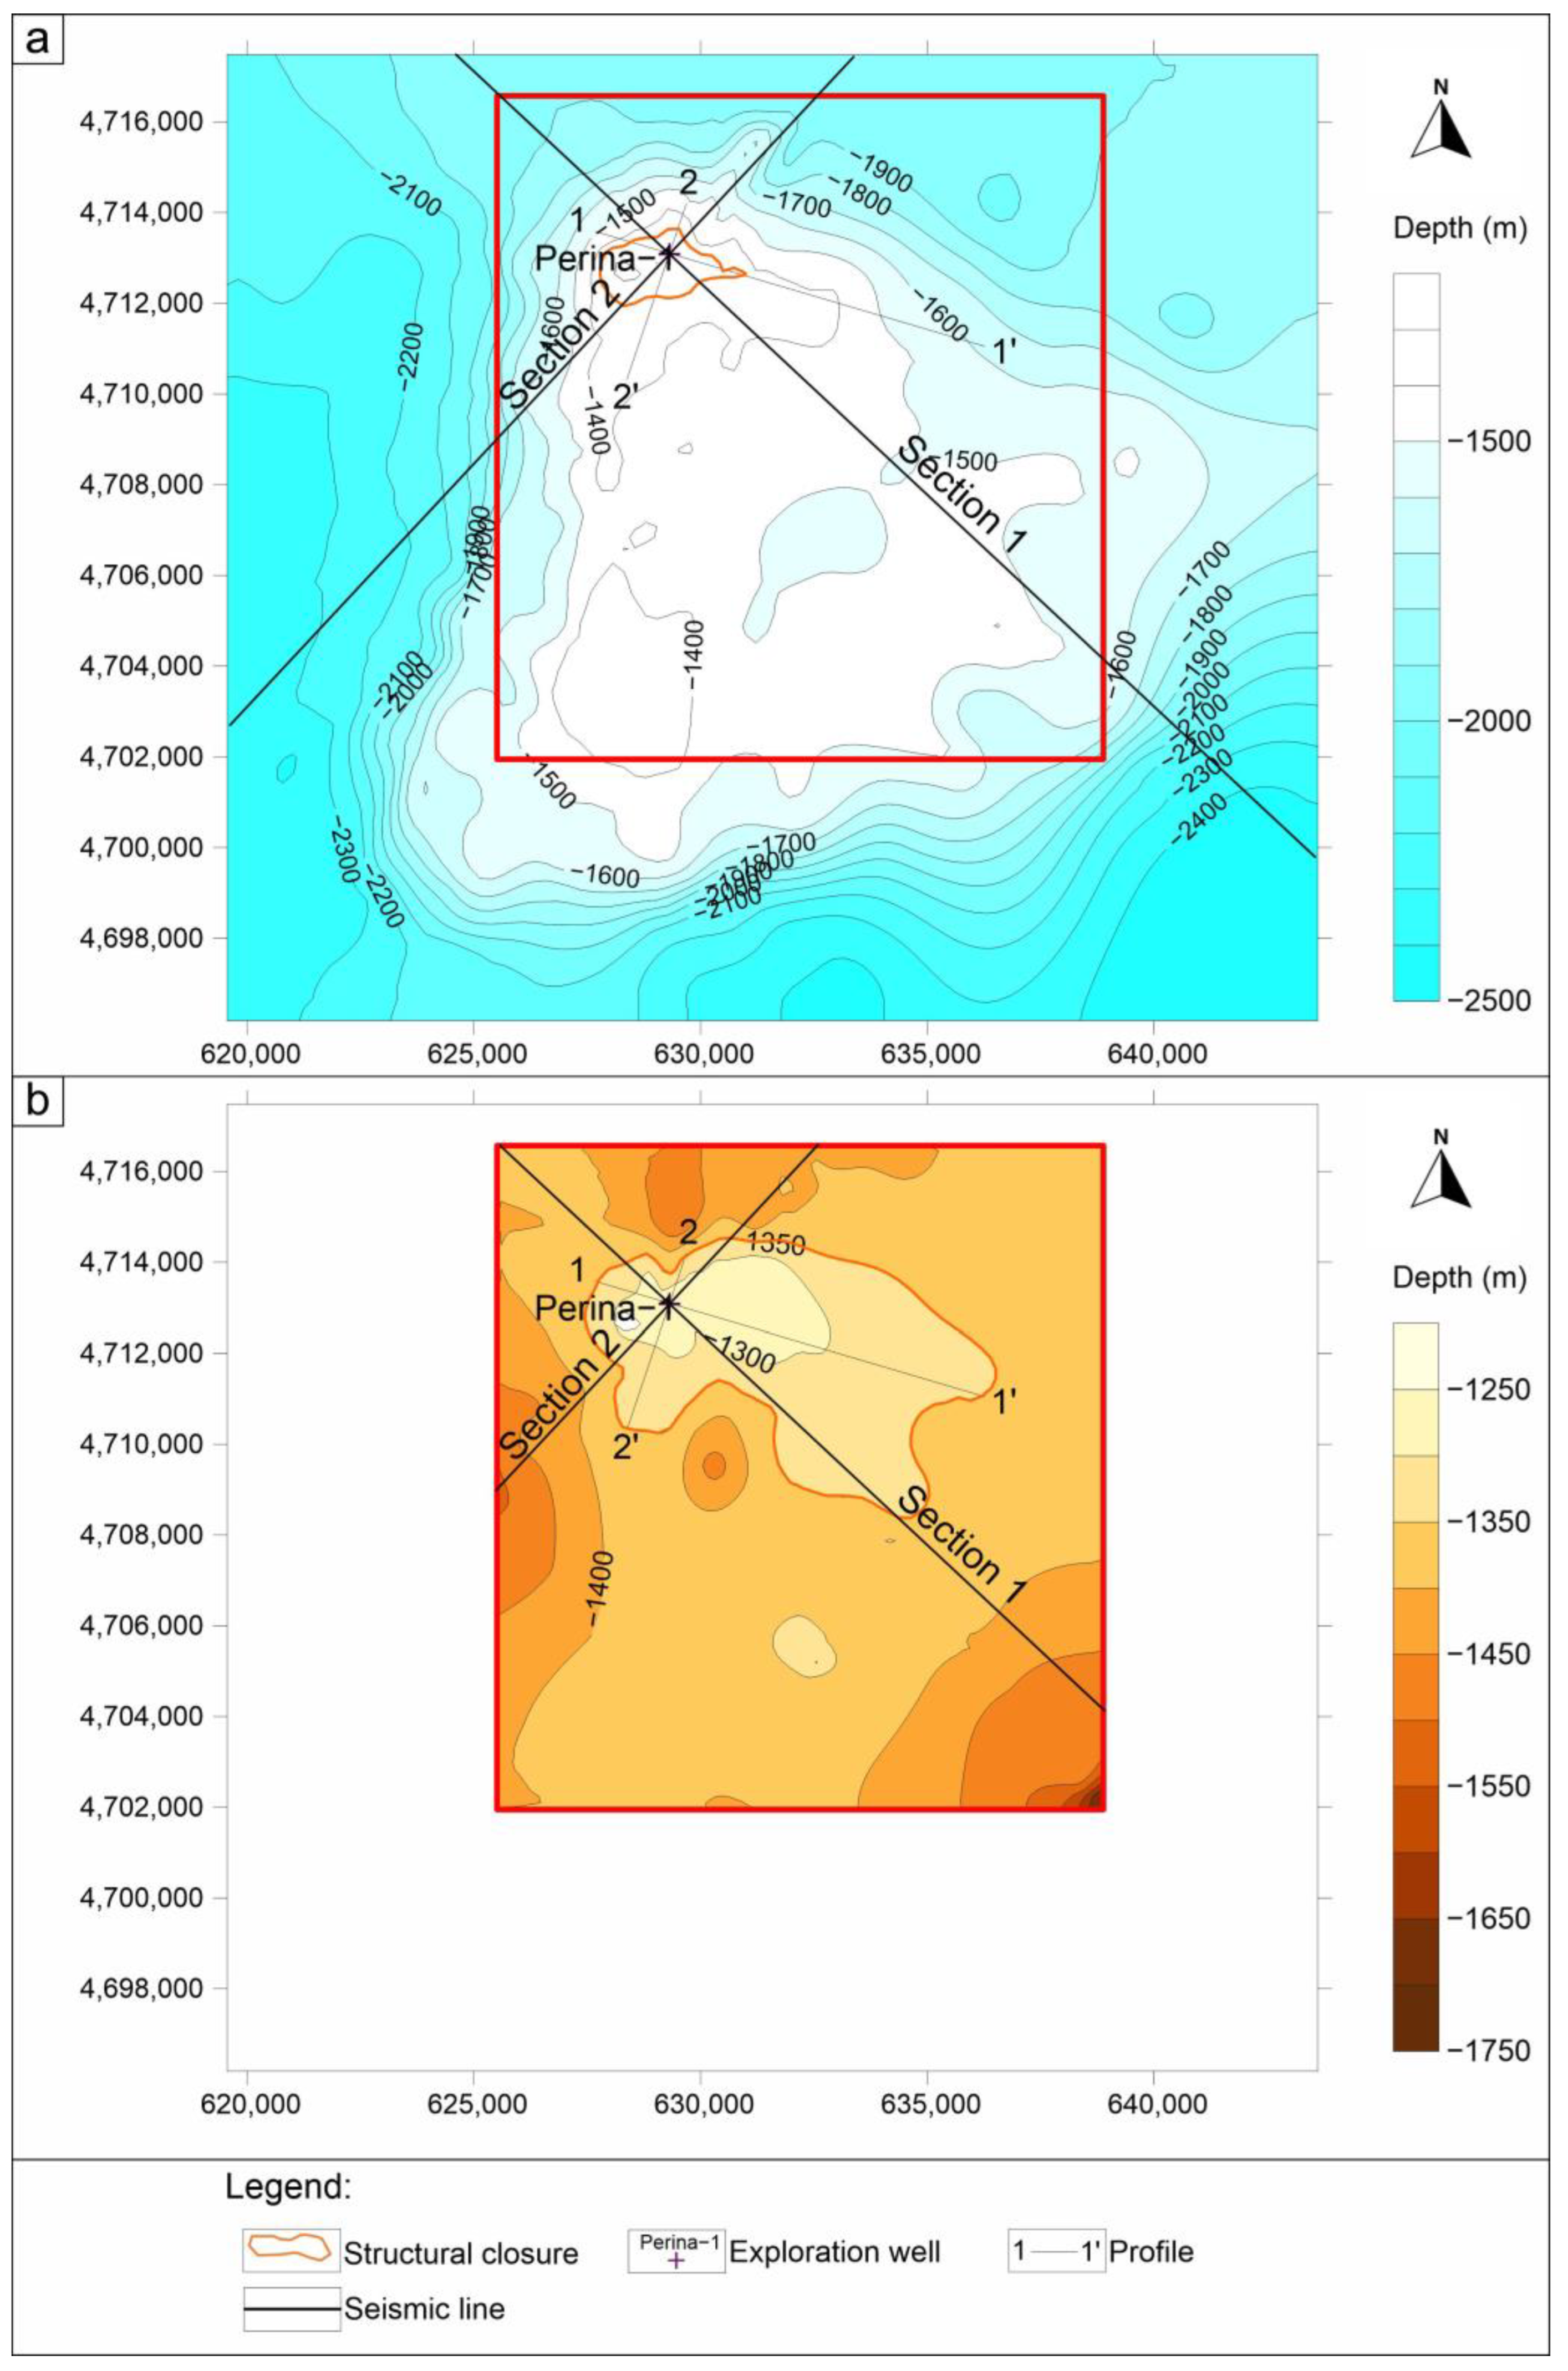
Figure 12.
Perina structure: (a) Top of the Upper Cretaceous prospect; (b) Top of the Lower Miocene prospect.
By overlapping the structural map of the Upper Cretaceous prospect (Figure 12a) and the structural map of the Lower Miocene prospect (Figure 12b), the total area of the Perina structure closure is 26.3 km2. The spill point is at a depth of −1350 m, which gives a length of 2.5 km for the Upper Cretaceous prospect on the Perina structure, while the Lower Miocene prospect extends to 9 km (Figure 13a). The width of the Upper Cretaceous prospect is up to 1.5 km, and 4 km for the Lower Miocene prospect (Figure 13b).

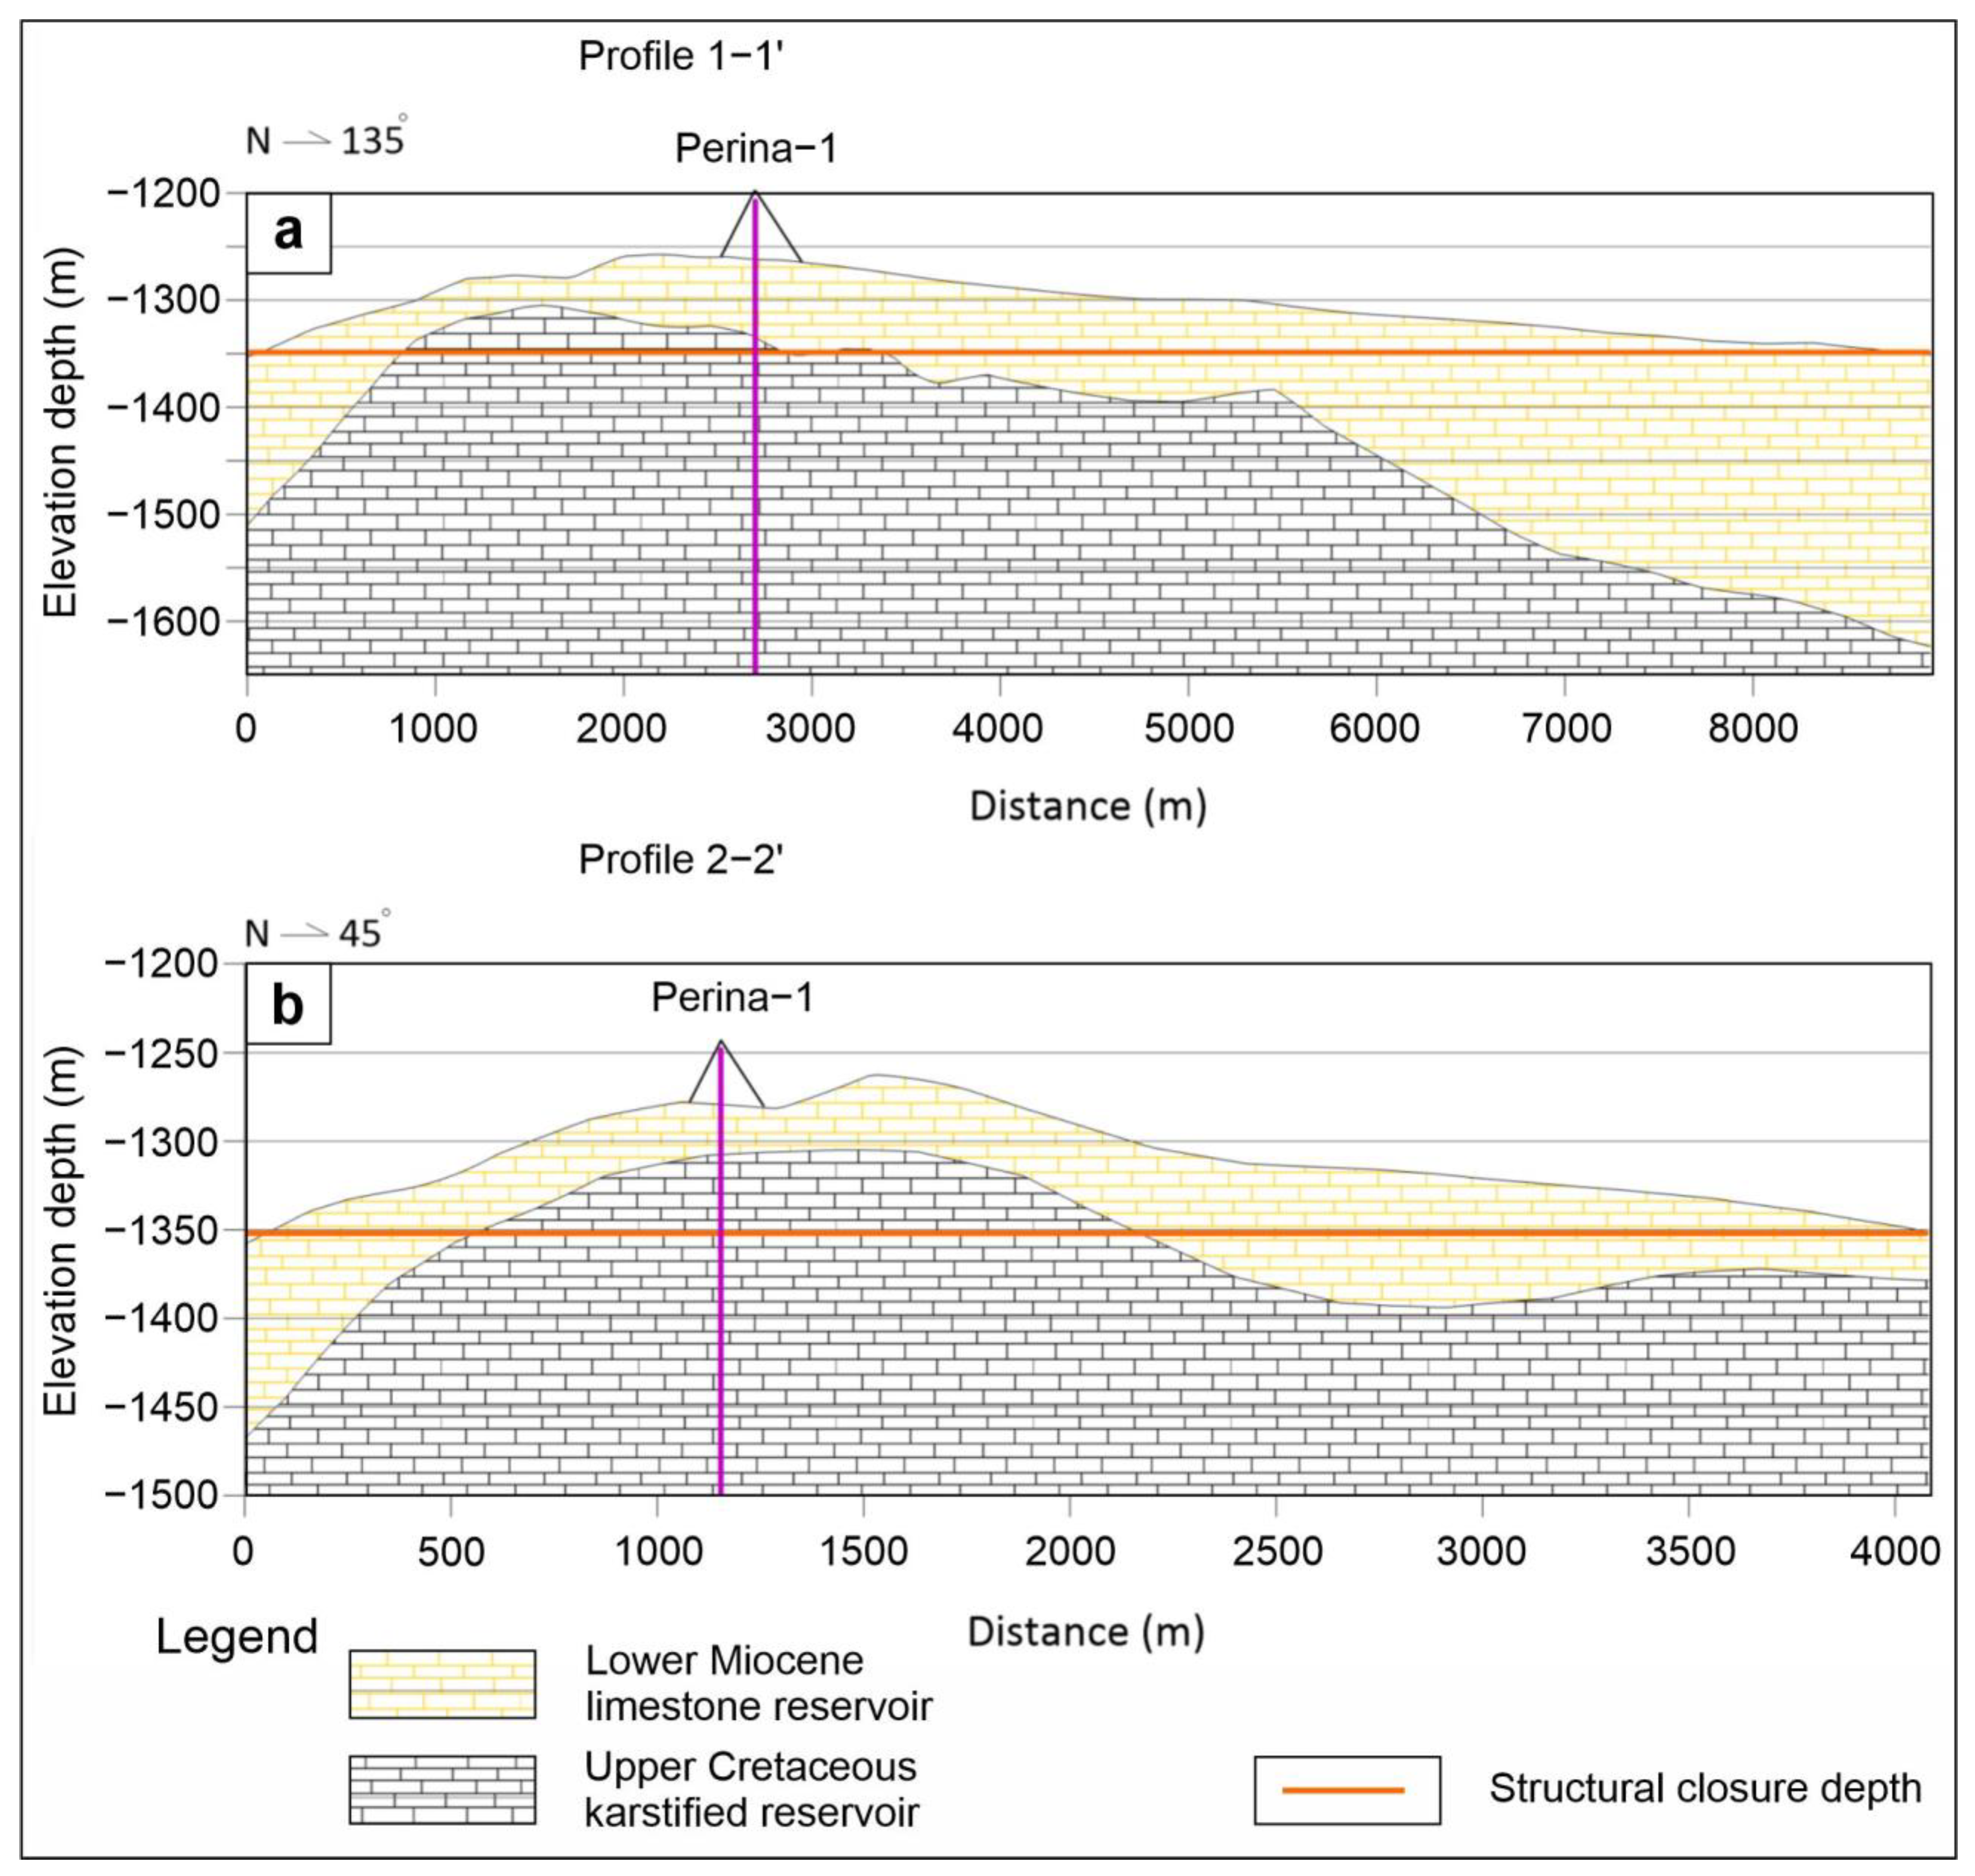
Figure 13.
Perina structure: (a) longitudinal cross-section 1-1′; (b) transversal cross-section 2-2′. Locations in Figure 12.
4. Results and Discussion
Reservoir volume of the Klara structure was defined using the regional structural map of the Mesozoic carbonate complex [1], adding the real data from the exploration well and putting the spill point at a depth of −2500 m. Individual volumes were determined at the intersections of the carbonate complex and every 100 m from the spill point. According to well data, the Mesozoic carbonate complex of the Klara structure is made of three chronostratigraphic units—Senonian (from −1930 m to −2100 m), Turonian (from −2100 m to −2400 m) and Cenomanian (from −2400 m to −2500 m). The limestones of all units were lithologically described as karstified and partially tectonised rudist floatstone/rudstone type of limestone. Porosity for chronostratigraphic units was calculated as the weighted average value from the two well cores (Table 1a). Due to the lack of pressure and temperature data in the Klara-1 well, data from the Kate-1 well were used to calculate the density of CO2. In order not to exaggerate the storage capacity, the efficiency factor was estimated according to the “cartoon approach” as a low-quality reservoir, and values from 5 to 20% were taken. Results of the calculation of CO2 geological storage capacity for the Klara structure are shown in Table 1b.

Table 1.
(a) Interval porosity estimates based on the Klara-1 well cores. (b) CO2 geological storage capacity estimates for the Klara structure.
Numerical estimate for the Kate structure was performed in a similar way from the top of the reservoir based on the regional structural map [1] and by taking the spill point at the depth of −2500 m. Individual volumes were the subsets defined by the intersections of the top carbonate complex surface every 100 m from the spill point towards the top of the structure. According to the well data, the Mesozoic carbonate complex of the Kate structure is also made of three chronostratigraphic units but different ones—Middle Eocene (from −1998 m to −2289 m), Lower Eocene (from −2289 m to −2412 m) and Upper Cretaceous (from −2412 m to −2500 m). The Eocene limestones are foraminiferal limestones, while the Upper Cretaceous limestones were determined as fenestral wackstone to mudstone type. Porosity for both chronostratigraphic units was calculated as the weighted average value from the two well cores (Table 2a). Pressure and temperature values from the DST measurement were used to calculate the density of CO2. Efficiency factor was again estimated by the “cartoon approach” as a low-quality reservoir, and values from 5 to 20% were taken. Results of the calculation of the CO2 geological storage capacity for the Kate structure are shown in Table 2b.
Table 2.
(a) Interval porosity estimates based on the Kate-1 well cores. (b) CO2 geological storage capacity estimates for the Kate structure.
Analysis of the Perina structure was based on local mapping using seismic interpretation plus the data from the Perina-1 exploration well. This led to interesting differences. Reservoir volume was obtained by the more detailed structural mapping of the two different reservoir units. Here, they are termed the storage units and are both carbonate but of different geological ages. Two structural maps were constructed—Top of Upper Cretaceous carbonate complex and the Top of Lower Miocene carbonate complex with the joint spill point at the depth of −1350 m. According to the well data, the limestone of the Upper Cretaceous unit was described as grainstone/packstone type, while the Lower Miocene was lithologically described as grainstone/boundstone type of limestone. Porosity for both units was calculated as the weighted average value from the log data; 35 m thickness of the Upper Cretaceous interval, ranging between 2% and 17.5%, and of the Lower Miocene interval, ranging between 10% and 14% (Table 3a). Efficiency factor was again estimated with the “cartoon approach” as a low-quality reservoir, so 5 to 10% were taken. Results of the calculation of CO2 geological storage capacity for the Perina structure are shown in Table 3b.
Table 3.
(a) Storage unit porosity estimates based on the Perina-1 well log interpretation. (b) CO2 geological storage capacity estimates for the Perina structure.
4.1. Comparison of CO2 Storage Capacity Estimates
Klara structure has a maximal closed surface of 61.8 km2 with a maximum thickness of the Mesozoic carbonate complex in its structural closure of 570 m, which gives the volume of the reservoir (Figure 14) of more than 18 billion m3. The minimum thickness of the complex was chosen as 170 m at a depth of −2000 m, where the volume of the reservoir was approximately 2 billion m3 (Figure 14). The mean value of porosity is generally low, around 5%, and increases slightly with depth. According to the cartoon approach, the quality of the reservoir for storage is taken to be low, mainly due to the small amounts of input data that are up to over 30 years old. The efficiency factor decreases with depth; 20% was taken as the largest factor (Table 1b) because there are no significant faults or any feature limiting the connectivity between the reservoir volume in the immediate vicinity of the structure. The available storage space for CO2 grows up to −2300 m, after which it starts to fall then grows again, and finally reaches its maximum and −2500 m. This is explained by the fact that if we take more of the pore space for storage, there is less of the aquifer beneath it. In this case, there might be a far larger aquifer (it is even likely!), but only this part of the potential storage object has been drilled through. For this reason, the maximum amount for CO2 storage capacity in the Klara structure is estimated to be 38 million tonnes at a depth of −2300 m, leaving an ample volume of explored and structurally defined aquifer beneath. Pondered porosity value was 8.5%, and efficiency factor was between 5 and 20%, reflecting the level of confidence one can have in the estimated storage capacity based on the given data.
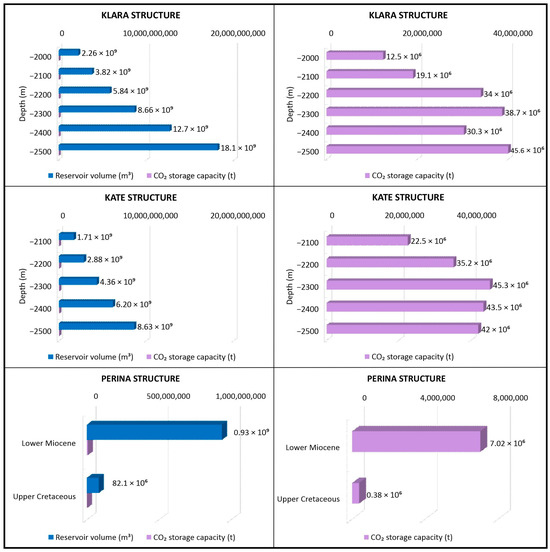
Figure 14.
Graphic representation of the total reservoir volume of structures (m3) and available CO2 storage capacity (t) in the three analysed structures—Klara, Kate and Perina.
The same approach to numerical estimation described above was also applied to the Kate structure. With the surface of 32.1 km2 and the maximum thickness of the Mesozoic carbonate complex of 502 m, it has the maximal volume of the reservoir (Table 2b) of more than 8 billion m3 (Figure 14). The minimum thickness of the conceived storage complex was taken to be 291 m with a planned CO2/water contact at −2100 m, and the volume of the reservoir is approximately 1.7 billion m3. The average porosity of 9% was constant until a slight increase in the bottom 100 m of the structural closure. The quality of the reservoir, using again the cartoon approach, is also determined as low. It might prove, in the end, to actually be (much) better, but we wanted to be on the safe side given the fact that the model was constructed based on the small amounts of regional input data that are up to over 30 years old. The efficiency factor also decreases with depth, with 20% taken as the largest factor for the top section because there are no significant limiting features in the immediate vicinity of the structure; the lowest 5% was taken for the deepest 100 m of the structural closure because there is also the largest risk for inadequate performance of the interpreted storage site. That is how the available space for CO2 storage grows up to −2300 m, after which it starts to fall (Figure 14). This has the same reasoning as for the firstly described structure above—it is better to possess a smaller volume of the structurally defined aquifer and a “cushion zone” beneath it. This leaves a large storage capacity and a 200 m thick interval of water beneath the storage complex as a contingency in the case some important geological features have been missed in this level of exploration. For this reason, the maximum amount for CO2 storage in the Kate structure is estimated as 45 million tonnes at a depth of −2300 m (Figure 14). Pondered porosity value was 12.3%, and efficiency factor was between 5 and 20% (Table 2a,b).
The third example is the large Perina structure. Different principles of calculating the available CO2 storage space had to be used here because of the introduction of the real seismic interpretation (Figure 11). One would expect that a more detailed interpretation of the subsurface geology would automatically result in a larger confidence level and more optimistic storage capacity estimates, but this is not what happened. The more precise model revealed that the older unit of the Upper Cretaceous limestones is not only hydraulically connected with the younger unit of the Lower Miocene limestone, but it affects the contact with the Miocene seal as well (Figure 11). This prevented any “what-ifs” regarding the volume of the reservoir because the spill point for both units had to be fixed at the depth of −1350 m, much shallower than originally expected when looking only at the regional map. Within the closed surface of 26.3 km2 of the Perina structure, the maximum thickness of the Mesozoic complex is 17 m (Table 3a), which gives, in Figure 14, the reservoir volume of approximately 82 million m3, while the maximum thickness of the Cenozoic complex is 35 m, which results in a reservoir volume of approx. 935 million m3 (Figure 14). There is no significant difference in porosity for Upper Cretaceous 12% and Lower Miocene 9.8%, resulting in the pondered porosity value of 10.5% (Table 3a). Despite the “introduced” seismic interpretation, the quality of the reservoir was still determined as low due to the observed situation that a moderate augmentation of input data still does not cover the complexity of subsurface geology. The efficiency factor for the Mesozoic prospect was taken to be 10%, and it was 5% for the Cenozoic because there are no significant faults or other features in the vicinity of the structure, while at the same time, the Cenozoic formation has variable thickness—see the seismic sections (Figure 11). Finally, the estimated CO2 storage capacity of the Perina structure is 7.4 million tonnes at a depth of −1350 m.
4.2. Transport System Options
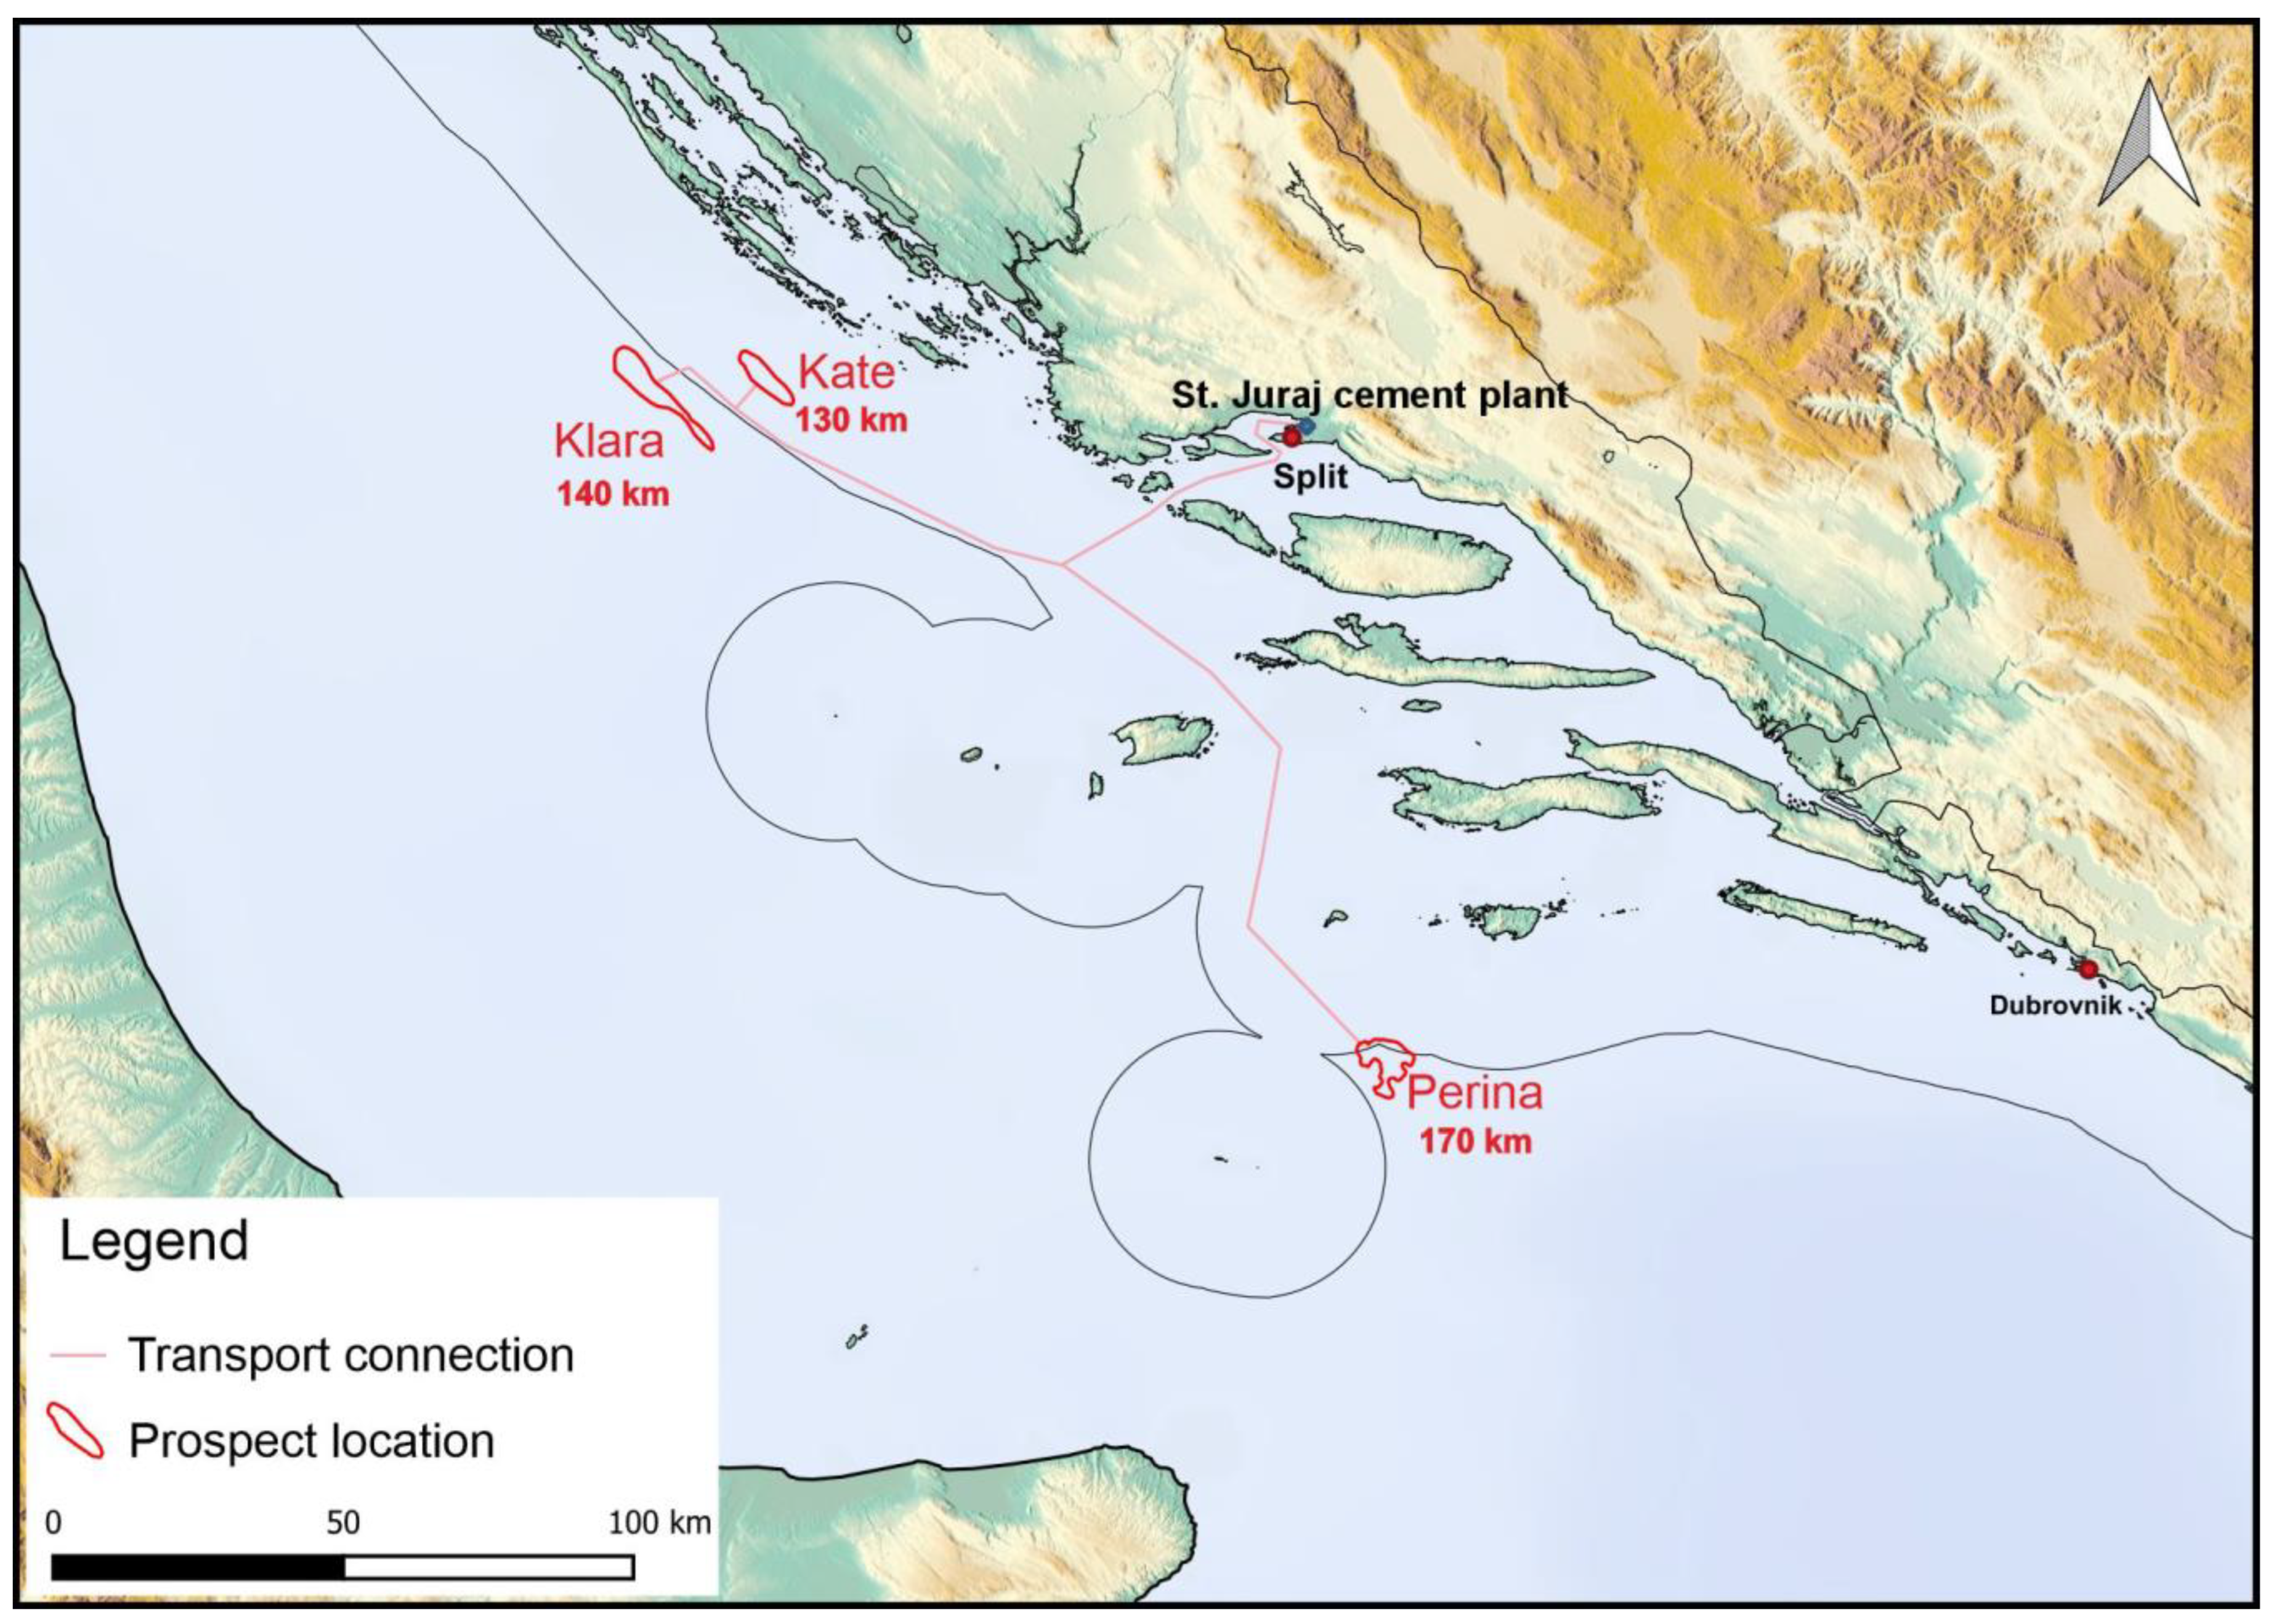
Offshore transport of CO2 can be performed by ships or pipelines. These systems are usually optimised in scenarios where quantities and routes/locations are known. In a tentative scenario where there is a single CO2 source, the cement plant on the coastline and one or more storage sites, this is most likely going to be a pipeline transport system that must be constructed. CO2 must be cleaned of all impurities, dehydrated and compressed. Transport is a topic that will not be covered in detail in this work. The only thing shown is the distance along an arbitrary sea line from the cement plant on the coastline to the three structures: 140 km to the Klara structure, 130 km to the Kate structure and 170 km to the Perina structure (Figure 15).
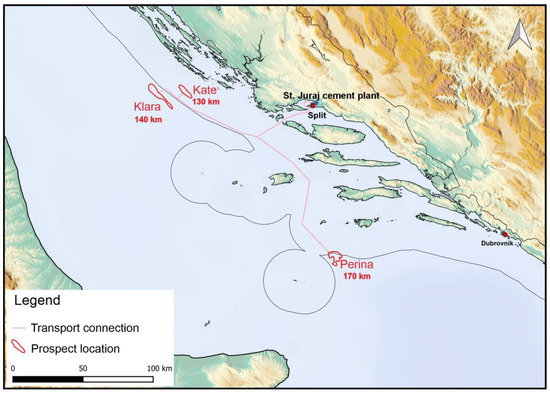
Figure 15.
Distance between the cement plant and the three prospective storage objects.
Based on the distance, location and estimated storage capacity, the Kate and Klara structures clearly have an advantage, even more so if we consider them together in a scenario where they can share a large part of the same pipeline. A plausible plan would be to start thinking of a single transport system to the Klara and Kate structures that might be used intermittently or parallel, depending on the injectivity encountered, CO2 plume migration or possible pressure increase (pressure front migration) and on the total storage capacity needed. These are just a few of a number of things that have to be studied once detailed geological models (static models) of both sites are completed and used to make dynamic models with different injection rates and injection scenarios.
5. Conclusions
Large CO2 emissions from industrial sources could be curbed in the short term, but this requires large initial investments in carbon capture and geological storage (CCS). These investments are future costs of capture, transport and storage, and they must be optimised to retain the economics of future production. In this work, we tried to analyse how the present knowledge of subsurface geology can influence the description and estimation of the three geological structures, Klara, Kate and Perina.
If one is to rank the three structures based on the extension of the structural closure area, the Kate structure is the largest (61.8 km2), Klara has 45% of this (32.1 km2), while Perina has only 20% of this (26.3 km2). Much more relevant is the depth of structural closure, which is both for Kate and Klara structures at −2500 m, while the Perina structure has it at a depth of −1350 m. Porosity values of all structures were relatively low and similar; pondered value for Klara is 9%, 12% for Kate, and Perina’s average value is 11%. The efficiency factor for the Kate structure was taken in the range between 15 and 20%, as well as for the Klara structure, while for Perina, it was lower, between 5 and 10%. The numerical estimates of the (still theoretical) capacity of CO2 storage are 45.30 Mt in the Kate structure, 38.66 Mt in the Klara structure and 7.40 Mt in the Perina structure. In terms of distance from the cement plant, Kate was the closest one with 130 km, followed by Klara at 140 km and Perina at 170 km. Naturally, any of these sets of values cannot be the single and exclusive screening criterion, but the ones of storage capacity, distance, depth and porosity are valuable for consideration. This is just as much as can be discerned from the regional geological exploration. It can be useful for planning the targeted exploration in the most prospective areas of the Adriatic offshore.
Because of the available storage space and partly because of the distance, the Kate structure appears to be the most favourable of the three studied potential storage sites. It is very important to note that due to the still very limited data set on the basis of which this research was made (three exploration wells from the 1980s and 1990s, regional seismic of the same vintage and two modern regional seismic sections), the accuracy and simply the coverage of the data leave much to be desired. Despite the frequently repeated claims that in the explored sedimentary basins enough knowledge of subsurface geology has accumulated to help the development of CCS, this is only so in principle. It is a fact indeed that it might be adequate for regional capacity estimates but is still largely insufficient for the storage site assessments, even if the original data from the archive are taken and reinterpreted. If anything, this exercise served well to show that the pure existence of vintage data is just a facilitator, an opportunity to screen for the more prospective sites that should come first in line to be more thoroughly investigated and characterised. Targeted exploration is needed, including, if not the new wells, then at least the new measurements and sidewall cores from the existing ones provided this can be done.
Nevertheless, with this, the general CO2 geological storage potential of the Adriatic offshore area is proven, which is good news for the Croatian cement industry that has large point sources located on the coastline. In fact, not exclusively for the cement industry because half of the national CO2 emissions from stationary industrial sources happen along the Adriatic coastline.
Author Contributions
Conceptualization, B.S. and D.R.; methodology, B.S., N.B. and D.R.; software, N.B. and D.R.; validation and investigation, N.B. and D.R.; resources, B.S.; data curation, B.S. and D.R.; writing—original draft preparation, N.B. and B.S.; writing—review and editing, B.S., I.K.M. and M.C.; visualization, N.B., D.R., I.K.M. and M.C.; supervision, B.S.; funding acquisition, M.C. All authors have read and agreed to the published version of the manuscript.
Funding
This research has been in part supported by University of Zagreb Financial Support for Scientific Research 2024—Project PEPOTE (113400111).
Data Availability Statement
Data were obtained, for scientific and educational purposes, from the Croatian Hydrocarbon Agency (CHA). They can be made available by CHA upon the written request to the CHA.
Acknowledgments
The authors are greatly indebted to the Croatian Hydrocarbon Agency (CHA) for making available all the subsurface data needed for this study. Secondly, we would like to acknowledge the Schlumberger Co. that donated the Petrel software licences to the UNIZG-RGNF for scientific and educational purposes.
Conflicts of Interest
The authors have no conflicts of interest to declare regarding the publication of this article.
References
- Saftić, B.; Močilac, I.K.; Cvetković, M.; Vulin, D.; Velić, J.; Tomljenović, B. Potential for the Geological Storage of CO2 in the Croatian Part of the Adriatic Offshore. Minerals 2019, 9, 577. [Google Scholar] [CrossRef]
- Cembureau. Activity Report 2022 Light; Cembureau: Brussels, Belgium, 2022. [Google Scholar]
- GCCA 2050 Net Zero Roadmap Accelerator Program. Available online: https://gccassociation.org/netzeroaccelerator/ (accessed on 6 September 2023).
- Korczak, K.; Kochański, M.; Skoczkowski, T. Mitigation Options for Decarbonization of the Non-Metallic Minerals Industry and Their Impacts on Costs, Energy Consumption and GHG Emissions in the EU—Systematic Literature Review. J. Clean. Prod. 2022, 358, 132006. [Google Scholar] [CrossRef]
- Poudyal, L.; Adhikari, K. Environmental Sustainability in Cement Industry: An Integrated Approach for Green and Economical Cement Production. Resour. Environ. Sustain. 2021, 4, 100024. [Google Scholar] [CrossRef]
- Nie, S.; Zhou, J.; Yang, F.; Lan, M.; Li, J.; Zhang, Z.; Chen, Z.; Xu, M.; Li, H.; Sanjayan, J.G. Analysis of Theoretical Carbon Dioxide Emissions from Cement Production: Methodology and Application. J. Clean. Prod. 2022, 334, 130270. [Google Scholar] [CrossRef]
- Paris Agreement. 2015. Available online: https://eur-lex.europa.eu/legal-content/EN/TXT/HTML/?uri=CELEX:22016A1019(01) (accessed on 17 November 2023).
- Worrell, E.; Price, L.; Martin, N.; Hendriks, C.; Meida, L.O. Carbon Dioxide Emission from the Global Cement Industry. Annu. Rev. Energy Environ. 2001, 26, 303–329. [Google Scholar] [CrossRef]
- Imbabi, M.S.; Carrigan, C.; McKenna, S. Trends and Developments in Green Cement and Concrete Technology. Int. J. Sustain. Built Environ. 2012, 1, 194–216. [Google Scholar] [CrossRef]
- Benhelal, E.; Shamsaei, E.; Rashid, M.I. Challenges against CO2 Abatement Strategies in Cement Industry: A Review. J. Environ. Sci. 2021, 104, 84–101. [Google Scholar] [CrossRef] [PubMed]
- Mikulčić, H.; Vujanović, M.; Duić, N. Improving the Sustainability of Cement Production by Using Numerical Simulation of Limestone Thermal Degradation and Pulverized Coal Combustion in a Cement Calciner. J. Clean. Prod. 2015, 88, 262–271. [Google Scholar] [CrossRef]
- Pardo, N.; Moya, J.A.; Mercier, A. Prospective on the Energy Efficiency and CO2 Emissions in the EU Cement Industry. Energy 2011, 36, 3244–3254. [Google Scholar] [CrossRef]
- Supriya; Chaudhury, R.; Sharma, U.; Thapliyal, P.C.; Singh, L.P. Low-CO2 Emission Strategies to Achieve Net Zero Target in Cement Sector. J. Clean. Prod. 2023, 417, 137466. [Google Scholar] [CrossRef]
- Zhou, C.; Xuan, D.; Miao, Y.; Luo, X.; Liu, W.; Zhang, Y. Accounting CO2 Emissions of the Cement Industry: Based on an Electricity–Carbon Coupling Analysis. Energies 2023, 16, 4453. [Google Scholar] [CrossRef]
- CSI. CO2 Accounting and Reporting Standard for the Cement Industry. The Cement CO2 and Energy Protocol; World Business Council for Sustainable Development: Geneva, Switzerland, 2011. [Google Scholar]
- IPCC. Refinement to the 2006 IPCC Guidelines for National Greenhouse Gas Inventories; IPCC: Geneva, Switzerland, 2019. [Google Scholar]
- Fennell, P.S.; Davis, S.J.; Mohammed, A. Decarbonizing Cement Production. Joule 2021, 5, 1305–1311. [Google Scholar] [CrossRef]
- IPCC. Carbon Dioxide Capture and Storage; Metz, B., Davidson, O., de Coninck, H., Loos, M., Meyer, L., Eds.; Cambridge University Press: Cambridge, UK, 2005. [Google Scholar]
- Bradshaw, J.; Bachu, S.; Bonijoly, D.; Burruss, R.; Holloway, S.; Christensen, N.P.; Mathiassen, O.M. CO2 Storage Capacity Estimation: Issues and Development of Standards. Int. J. Greenh. Gas Control 2007, 1, 62–68. [Google Scholar] [CrossRef]
- Bachu, S.; Bonijoly, D.; Bradshaw, J.; Burruss, R.; Holloway, S.; Christensen, N.P.; Mathiassen, O.M. CO2 Storage Capacity Estimation: Methodology and Gaps. Int. J. Greenh. Gas Control 2007, 1, 430–443. [Google Scholar] [CrossRef]
- McCabe, P.J. Energy Resources—Cornucopia or Empty Barrel? Am. Assoc. Pet. Geol. Bull. 1998, 82, 2110–2134. [Google Scholar]
- Vangkilde-Pedersen, T.; Anthonsen, K.L.; Smith, N.; Kirk, K.; Neele, F.; van der Meer, B.; Le Gallo, Y.; Bossie-Codreanu, D.; Wojcicki, A.; Le Nindre, Y.-M.; et al. Assessing European Capacity for Geological Storage of Carbon Dioxide—The EU GeoCapacity Project. Energy Procedia 2009, 1, 2663–2670. [Google Scholar] [CrossRef]
- Poulsen, N.; Holloway, S.; Neele, F.; Smith, N.A.; Kirk, K. CO2StoP Final Report; GEUS: Copenhagen, Denmark, 2014. [Google Scholar]
- Malvić, T.; Đureković, M.; Čogelja, Z.; Šikonja, Ž.; Ilijaš, T.; Kruljac, I. Exploration and Production Activities in Northern Adriatic Sea (Croatia), Successful Joint Venture INA (Croatia) and ENI (Italy). Nafta 2011, 62, 287–292. [Google Scholar]
- Grandić, S. Periplatform Clastics of Croatian Offshore and Their Petroleum Geological Significance. Nafta 2009, 60, 503–511. [Google Scholar]
- Tari-Kovačić, V. Geodynamics of the Middle Adriatic Offshore Area, Croatia, Based on Stratigraphic and Seismic Analysis of Paleogene Beds. Acta Geol. Hung. 1998, 41, 313–326. [Google Scholar]
- Vlahović, I.; Tišljar, J.; Velić, I.; Matičec, D. Evolution of the Adriatic Carbonate Platform: Palaeogeography, Main Events and Depositional Dynamics. Palaeogeogr. Palaeoclimatol. Palaeoecol. 2005, 220, 333–360. [Google Scholar] [CrossRef]
- Prelogović, E.; Kranjec, V. Geological Development of the Adriatic Area (Geološki Razvitak Područja Jadranskog Mora—In Croatian). Pomor. Zb. 1983, 21, 387–405. [Google Scholar]
- Herak, M. A New Concept of Geotectonics of the Dinarides. Acta Geol. 1986, 16, 1–42. [Google Scholar]
- Lawrence, S.; Tari-Kovačić, V.; Gjukic, B. Geological Evolution Model of the Dinarides. Nafta 2011, 62, 293–296. [Google Scholar]
- Pamić, J.; Gušić, I.; Jelaska, V. Geodynamic Evolution of the Central Dinarides. Tectonophysics 1998, 297, 251–268. [Google Scholar] [CrossRef]
- Korbar, T. Orogenic Evolution of the External Dinarides in the NE Adriatic Region: A Model Constrained by Tectonostratigraphy of Upper Cretaceous to Paleogene Carbonates. Earth Sci. Rev. 2009, 96, 296–312. [Google Scholar] [CrossRef]
- Croatian Geological Survey (CGS). Supplementary Text for Basic Geological Map of the Republic of Croatia 1:300,000 (In Croatian); Velić, I., Vlahović, I., Eds.; Croatian Geological Survey (CGS): Zagreb, Croatia, 2008. [Google Scholar]
- Tišljar, J. Origin and Depositional Environments of the Evaporite and Carbonate Complex (Upper Permian) from the Central Part of the Dinarides (Southern Croatia and Western Bosnia). Geol. Croat. 1992, 45, 116–126. [Google Scholar]
- Velić, J.; Malvić, T. Depositional Conditions during Pliocene and Pleistocene in Northern Adriatic and Possible Lithostratigraphic Division of These Rocks. Nafta 2011, 62, 33–38. [Google Scholar]
- Aljinović, D.; Kolar-Jurkovšek, T.; Jurkovšek, B.; Hrvatović, H. Conodont Dating of the Lower Triassic Sedimentary Rocks in the External Dinarides (Croatia, and Bosnia and Herzegovina). Riv. Ital. Paleontol. Stratigr. 2011, 117, 135–148. [Google Scholar]
- Pamić, J. Triassic Magmatism of the Dinarides in Yugoslavia. Tectonophysics 1984, 109, 273–307. [Google Scholar] [CrossRef]
- Smirčić, D.; Kolar-Jurkovšek, T.; Aljinović, D.; Barudžija, U.; Jurkovšek, B.; Hrvatović, H. Stratigraphic Definition and Correlation of Middle Triassic Volcaniclastic Facies in the External Dinarides: Croatia and Bosnia and Herzegovina. J. Earth Sci. 2018, 29, 864–878. [Google Scholar] [CrossRef]
- Grandić, S.; Krakatović, I.; Rusan, I. Hydrocarbon Potential Assesment of the Slope Deposits along the SW Dinarides Carbonate Platform Edge. Nafta 2010, 61, 325–338. [Google Scholar]
- Amadori, C.; Garcia-Castellanos, D.; Toscani, G.; Sternai, P.; Fantoni, R.; Ghielmi, M.; Di Giulio, A. Restored Topography of the Po Plain-Northern Adriatic Region during the Messinian Base-Level Drop—Implications for the Physiography and Compartmentalization of the Palaeo-Mediterranean Basin. Basin Res. 2018, 30, 1247–1263. [Google Scholar] [CrossRef]
- Ghielmi, M.; Minervini, M.; Nini, C.; Rogledi, S.; Rossi, M. Late Miocene-Middle Pleistocene Sequences in the Po Plain—Northern Adriatic Sea (Italy): The Stratigraphic Record of Modification Phases Affecting a Complex Foreland Basin. Mar. Pet. Geol. 2013, 42, 50–81. [Google Scholar] [CrossRef]
- Babić, K. Tektonska Kretanja i Solne Strukture u Području Vis-Biševo-Sušac [Tectonic Momvements and Salt Structures in Vis-Biševo-Sušac Area]. Master’s Thesis, University of Zagreb, Faculty of Natural Sciences, Zagreb, Croatia, 1990. (In Croatian). [Google Scholar]
- Bakić, H. Strukturne Značajke Jadranskog Podmorja Jugozapadno Od Istarskog Poluotoka [Structural Features of Adriatic Offshore Southeast of Istira Peninsula]. Graduate Thesis, University of Zagreb, Faculty of Natural Sciences, Zagreb, Croatia, 2007. (In Croatian). [Google Scholar]
- Križanić, D. Strukturno-Stratigrafski Odnosi i “bright-Spot” Anomalije u Ležištima Sjeverno Od Polja Ivana [Structural-Strtigraphic Relations and Bright Spor Anomalies North of Ivana Gas Field]. Graduate Thesis, University of Zagreb, Faculty of Mining, Geology and Petroleum Engineering, Zagreb, Croatia, 1999. [Google Scholar]
- Grandić, S.; Boromisa-Balaš, E.; Šušterić, M.; Kolbah, S. Hydrocarbon Possibilites in the Eastern Offshore Adriatic Slope Zone of Croatian Area. Nafta 1999, 50, 51–73. [Google Scholar]
- Prelogović, E.; Pribičević, B.; Ivković, Ž.; Dragičević, I.; Buljan, R.; Tomljenovic, B. Recent Structural Fabric of the Dinarides and Tectonically Active Zones Important for Petroleum-Geological Exploration. Nafta 2004, 55, 155–161. [Google Scholar]
- Veseli, V. Facijesi Karbonatnih Sedimenata Mlađeg Mezozoika i Paleogena u Pučinskim Bušotinama Sjevernoga Jadrana [Late Mesosoic and Paleogene Carbonate Facies in the off-Shore Wells in the Northen Adria]. Ph.D Thesis, University of Zagreb, Faculty of Mining, Geology and Petroleum Engineering, Zagreb, Croatia, 1999. [Google Scholar]
- Tomljenović, B.; Herak, M.; Kralj, K.; Prelogović, E.; Bostjančić, I.; Matoš, B. Active Tectonics, Sismicity and Seismogenic Sources of the Adriatic Coastal and Offshore Region of Croatia. In Proceedings of the Riassunti Estesi delle Comunicazioni, 28 Convegno Nazionale, Trieste, Italy, 16–18 November 2009; Slejko, D., Rebez, A., Eds.; Stella Arti Grafice: Trieste, Italy, 2009; pp. 133–136. [Google Scholar]
- Bralić, N.; Malvić, T. Cement Raw Material Reserve Calculation—Geological Sections vs. Structural Maps Approaches, Case Study from Southern Croatia. Minerals 2022, 12, 1056. [Google Scholar] [CrossRef]
- Golden Software, LLC. Surfer; Golden Software: Golden, CO, USA, 2022. [Google Scholar]
- Vulin, D. Modeliranje Termodinamičkih i Petrofizičkih Parametara Za Geološko Skladištenje Ugljičnog Dioksida (Modeling Termodynamic and Petrophysical Parameters for Geological Storage of Carbon Dioxide). Ph.D. Thesis, University of Zagreb, Faculty of Mining, Geology and Petroleum Engineering, Zagreb, Croatia, 2010. (In Croatian). [Google Scholar]
- Span, R.; Wagner, W. A New Equation of State for Carbon Dioxide Covering the Fluid Region from the Triple-Point Temperature to 1100 K at Pressures up to 800 MPa. J. Phys. Chem. Ref. Data 1996, 25, 1509–1596. [Google Scholar] [CrossRef]
- Brook, M.; Shaw, K.; Vincent, C.; Halloway, S. Gestco Case Study 2a-1: Storage Potential of the Bunter Sandstone in the UK Sector of the Southern North Sea and Adjacent Onshore Area of Eastern England 2003; British Geological Survey: Keyworth, UK, 2003. [Google Scholar]
- Bech, N.; Larsen, M. Storage of CO2 in the Havnso Aquifer—A Simulation Study. A CO2STORE Contribution; GEUS: Copenhagen, Denmark, 2005. [Google Scholar]


Disclaimer/Publisher’s Note: The statements, opinions and data contained in all publications are solely those of the individual author(s) and contributor(s) and not of MDPI and/or the editor(s). MDPI and/or the editor(s) disclaim responsibility for any injury to people or property resulting from any ideas, methods, instructions or products referred to in the content. |
© 2024 by the authors. Licensee MDPI, Basel, Switzerland. This article is an open access article distributed under the terms and conditions of the Creative Commons Attribution (CC BY) license (https://creativecommons.org/licenses/by/4.0/).