
Petrogenesis of the Newly Discovered Neoproterozoic Adakitic Rock in Bure Area, Western Ethiopia Shield: Implication for the Pan-African Tectonic Evolution

 , ,
, ,
Abstract
1. Introduction
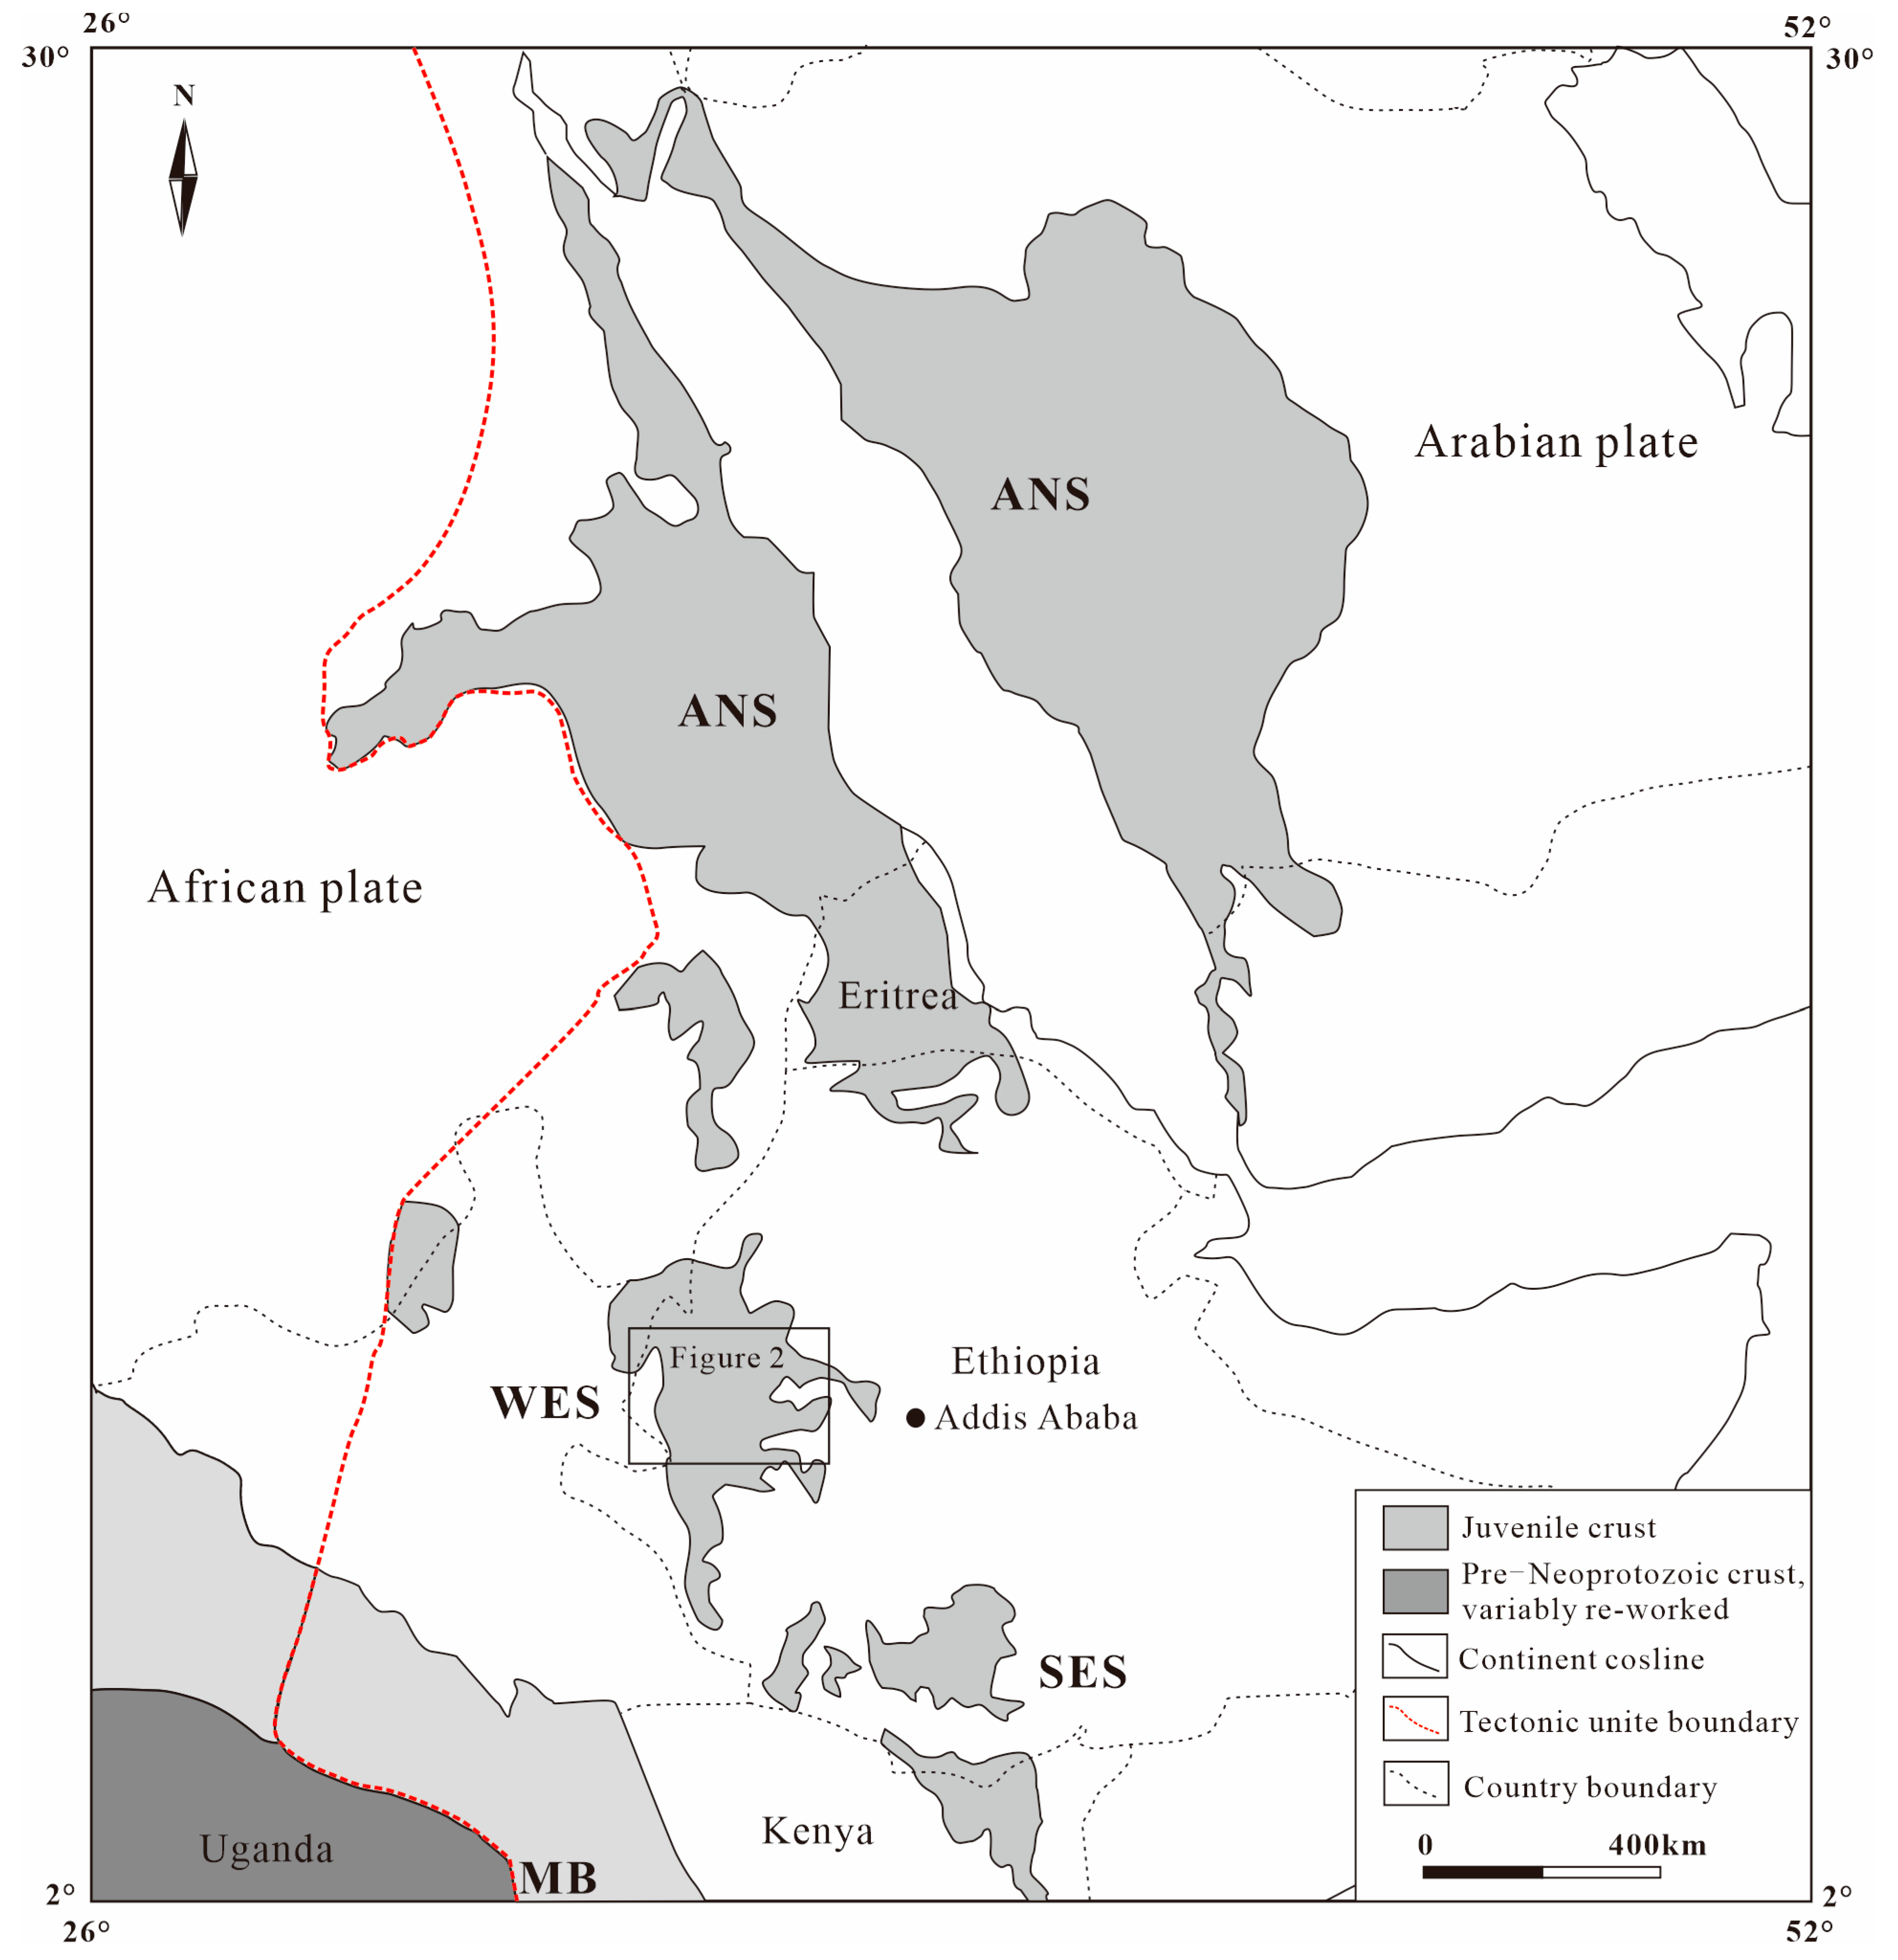
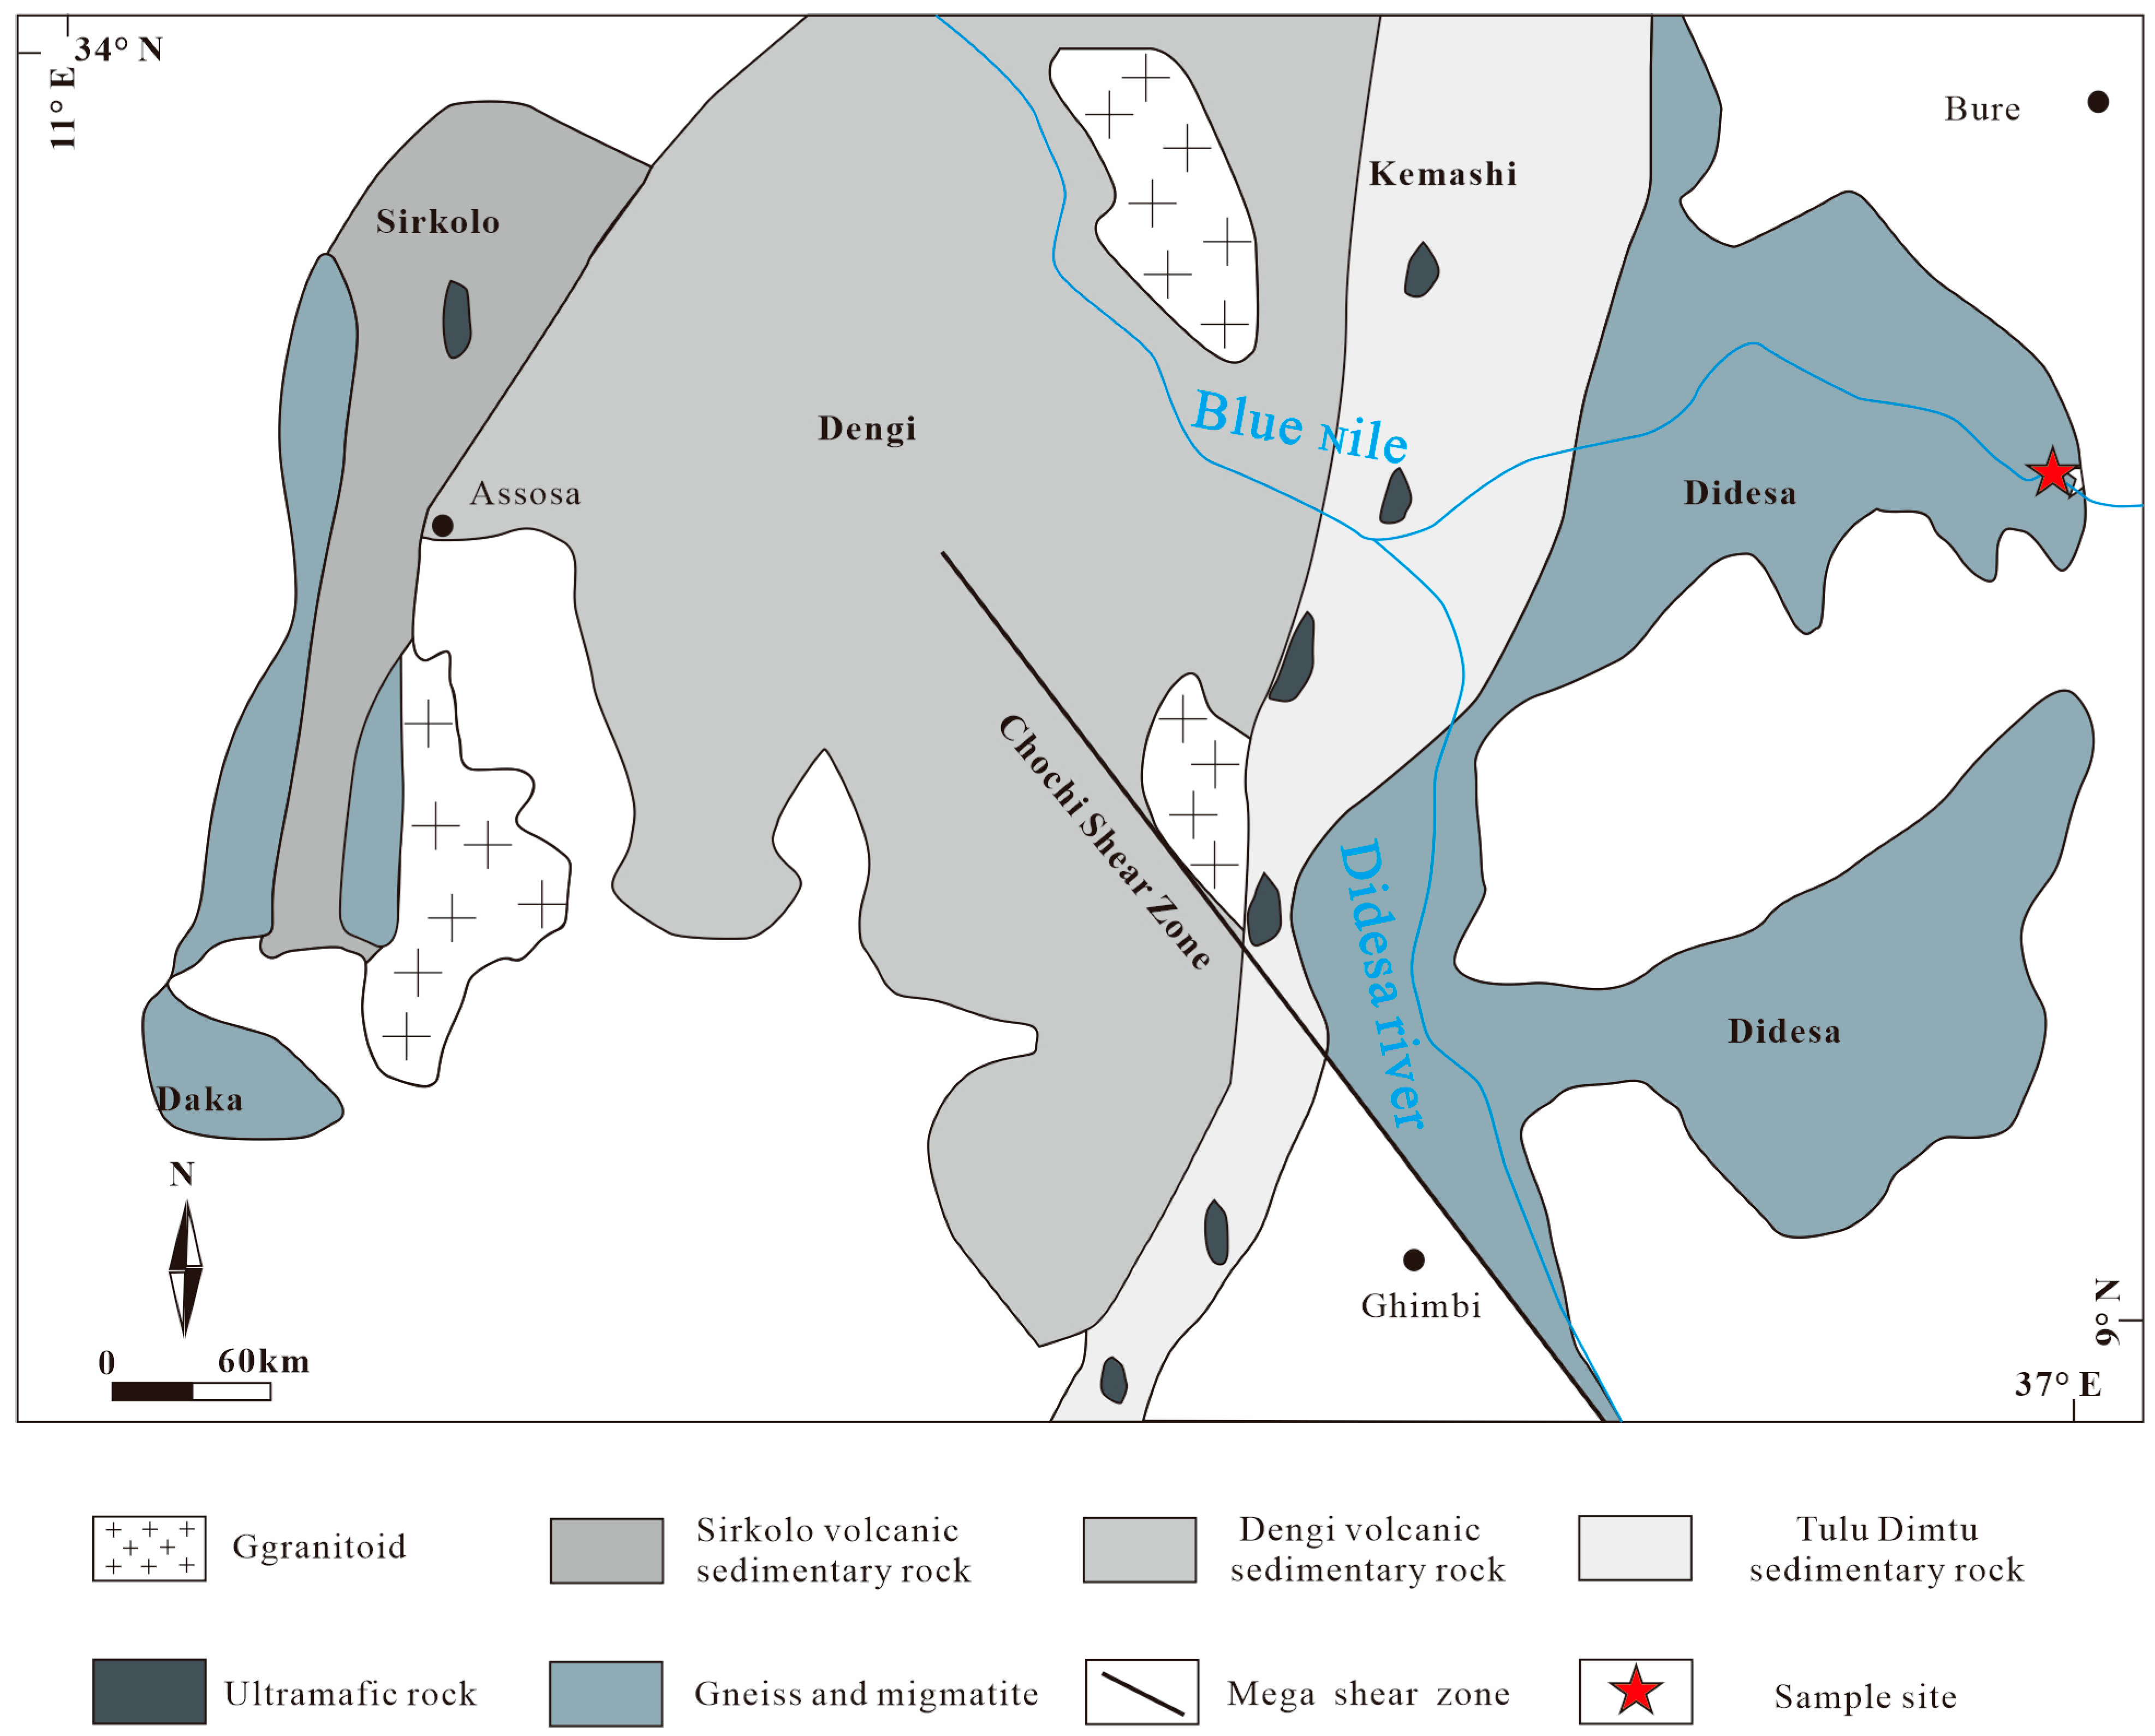
2. Geological Setting
3. Samples and Analytical Methods
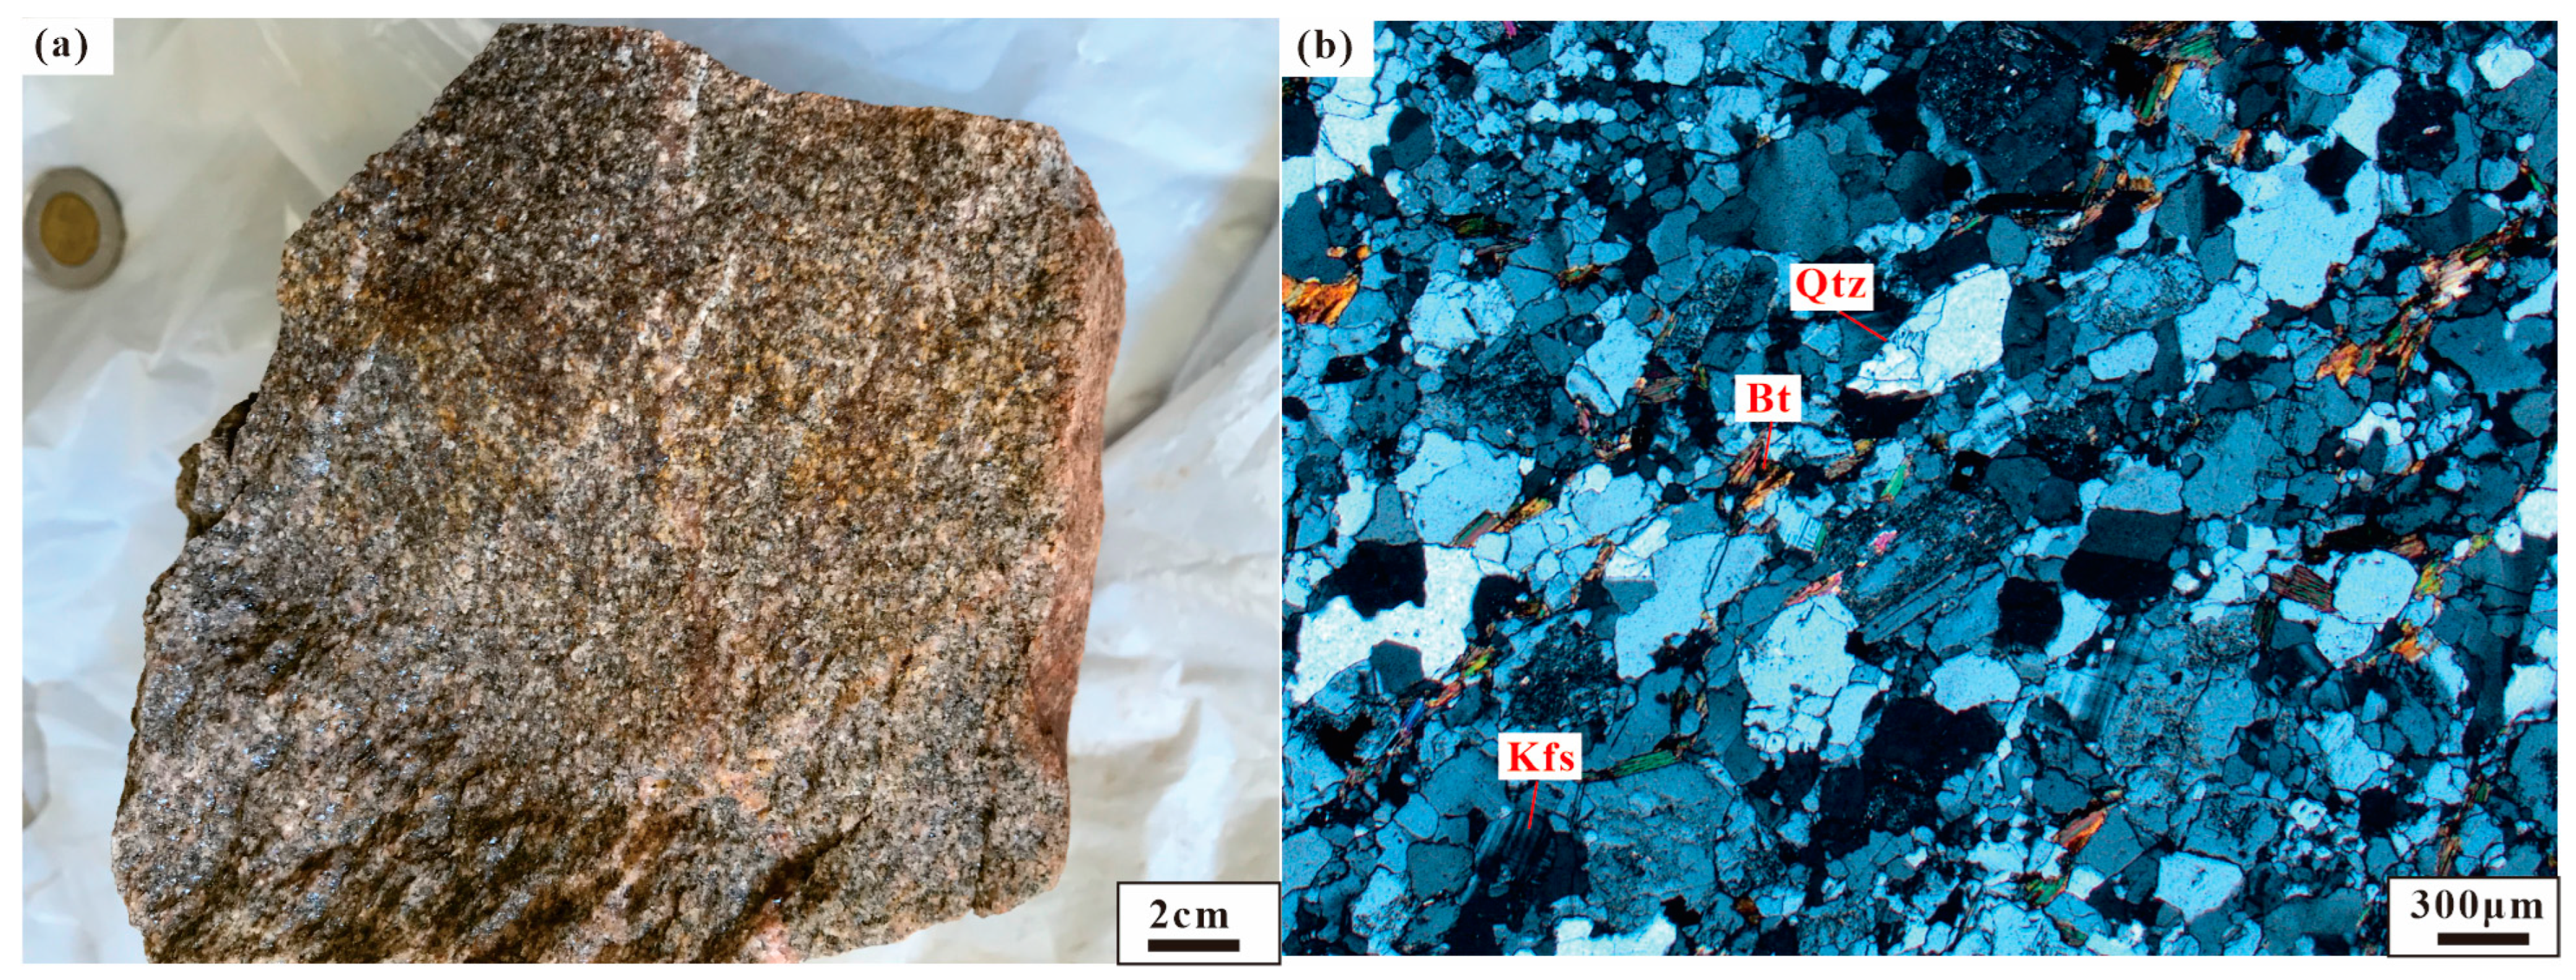
3.1. Petrography
3.2. Analytical Methods
4. Results
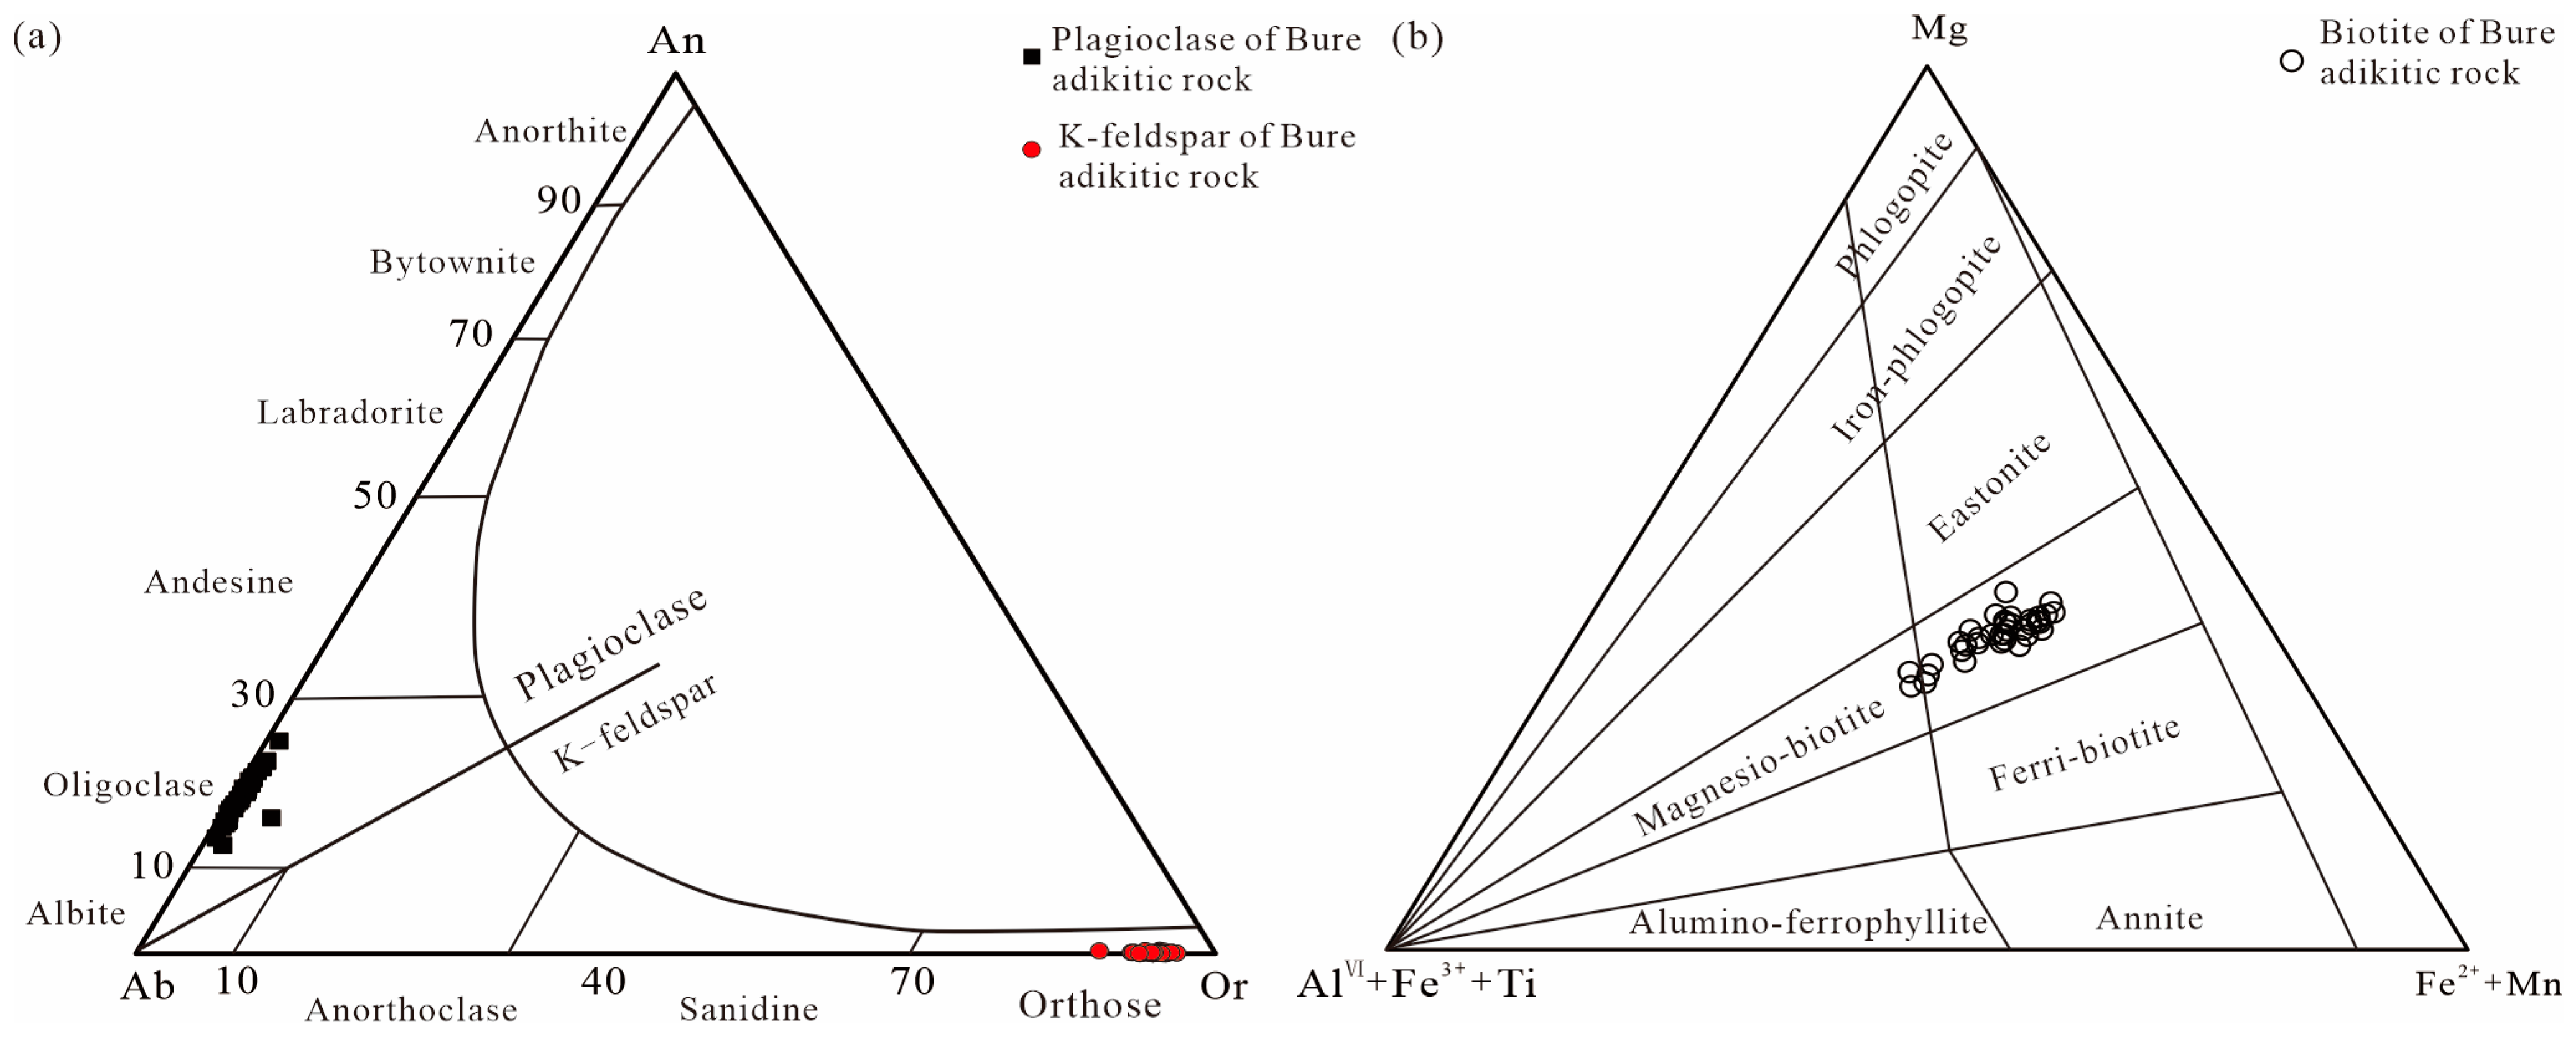
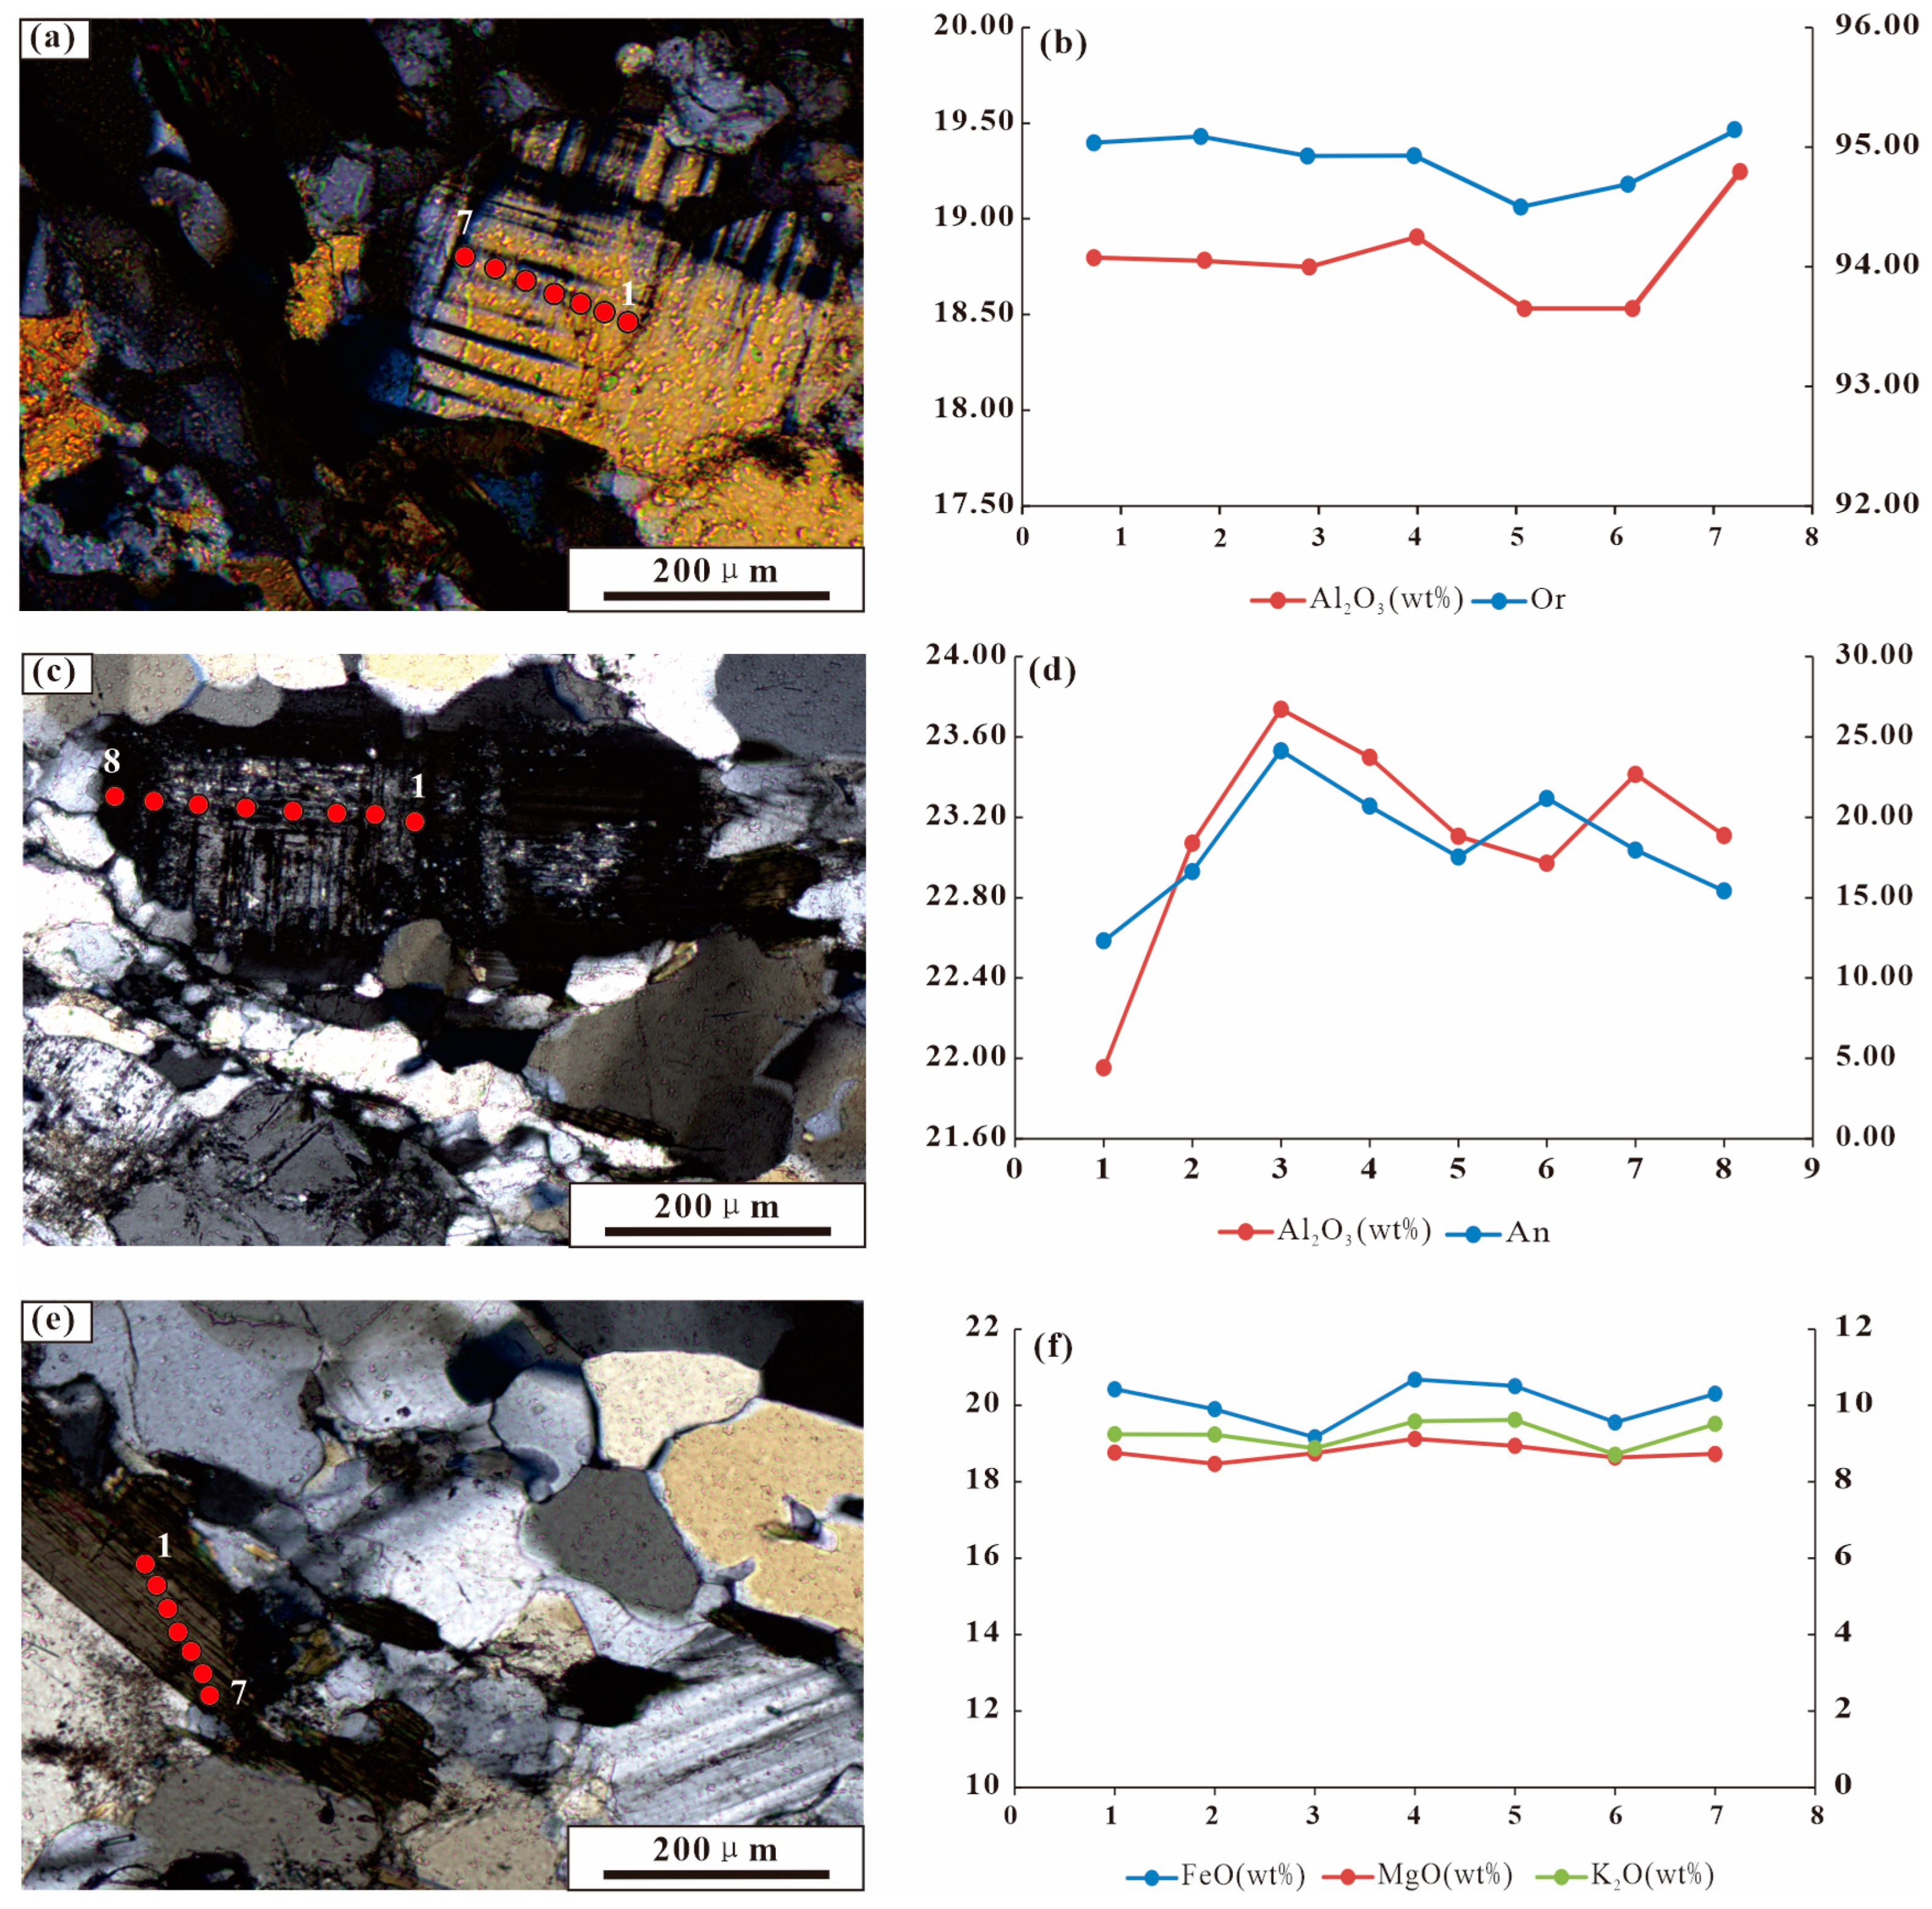
4.1. Mineral Compositions
4.1.1. K-Feldspar
4.1.2. Plagioclase
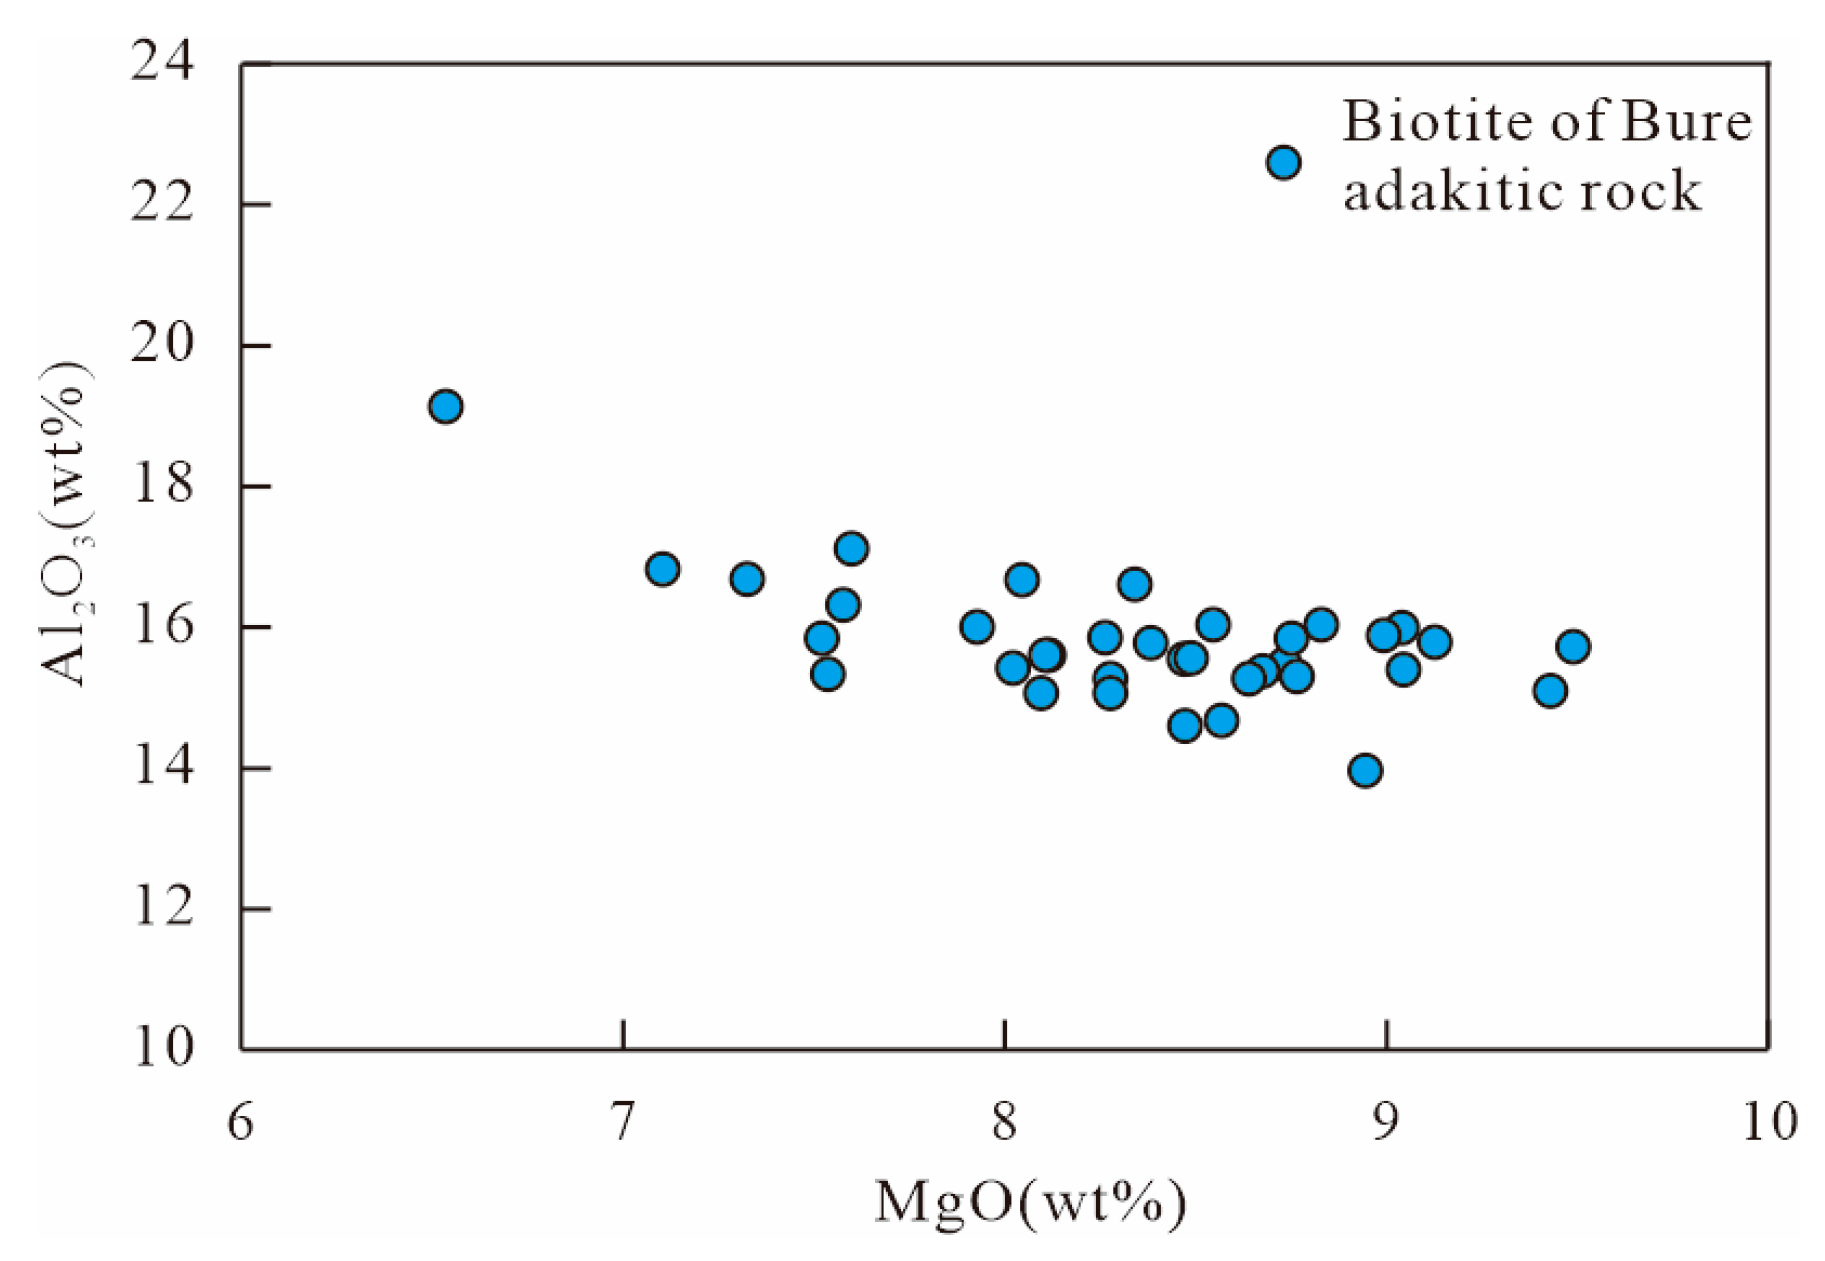
4.1.3. Biotite
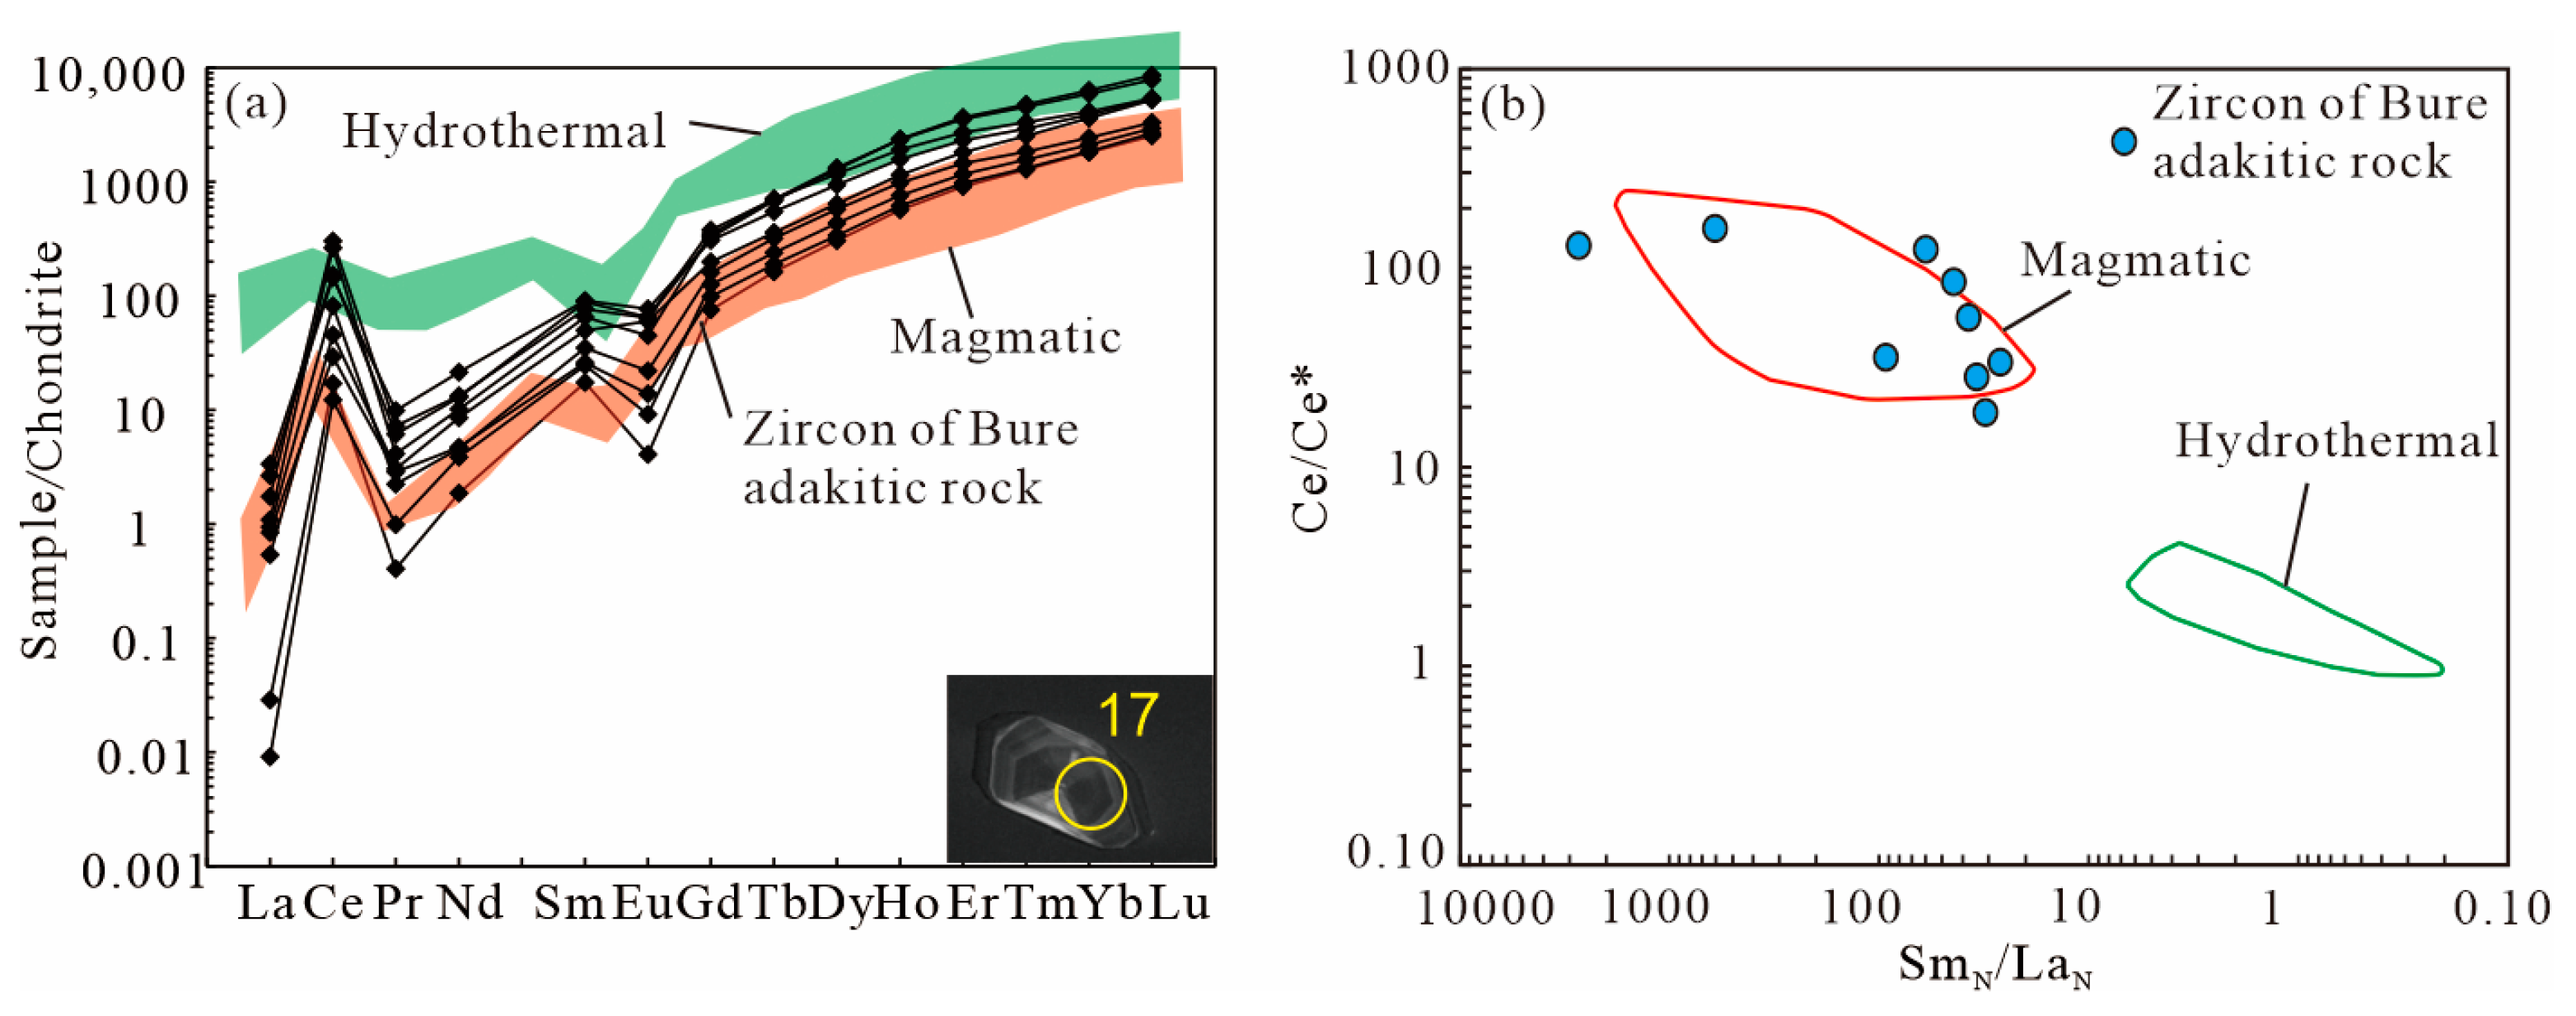
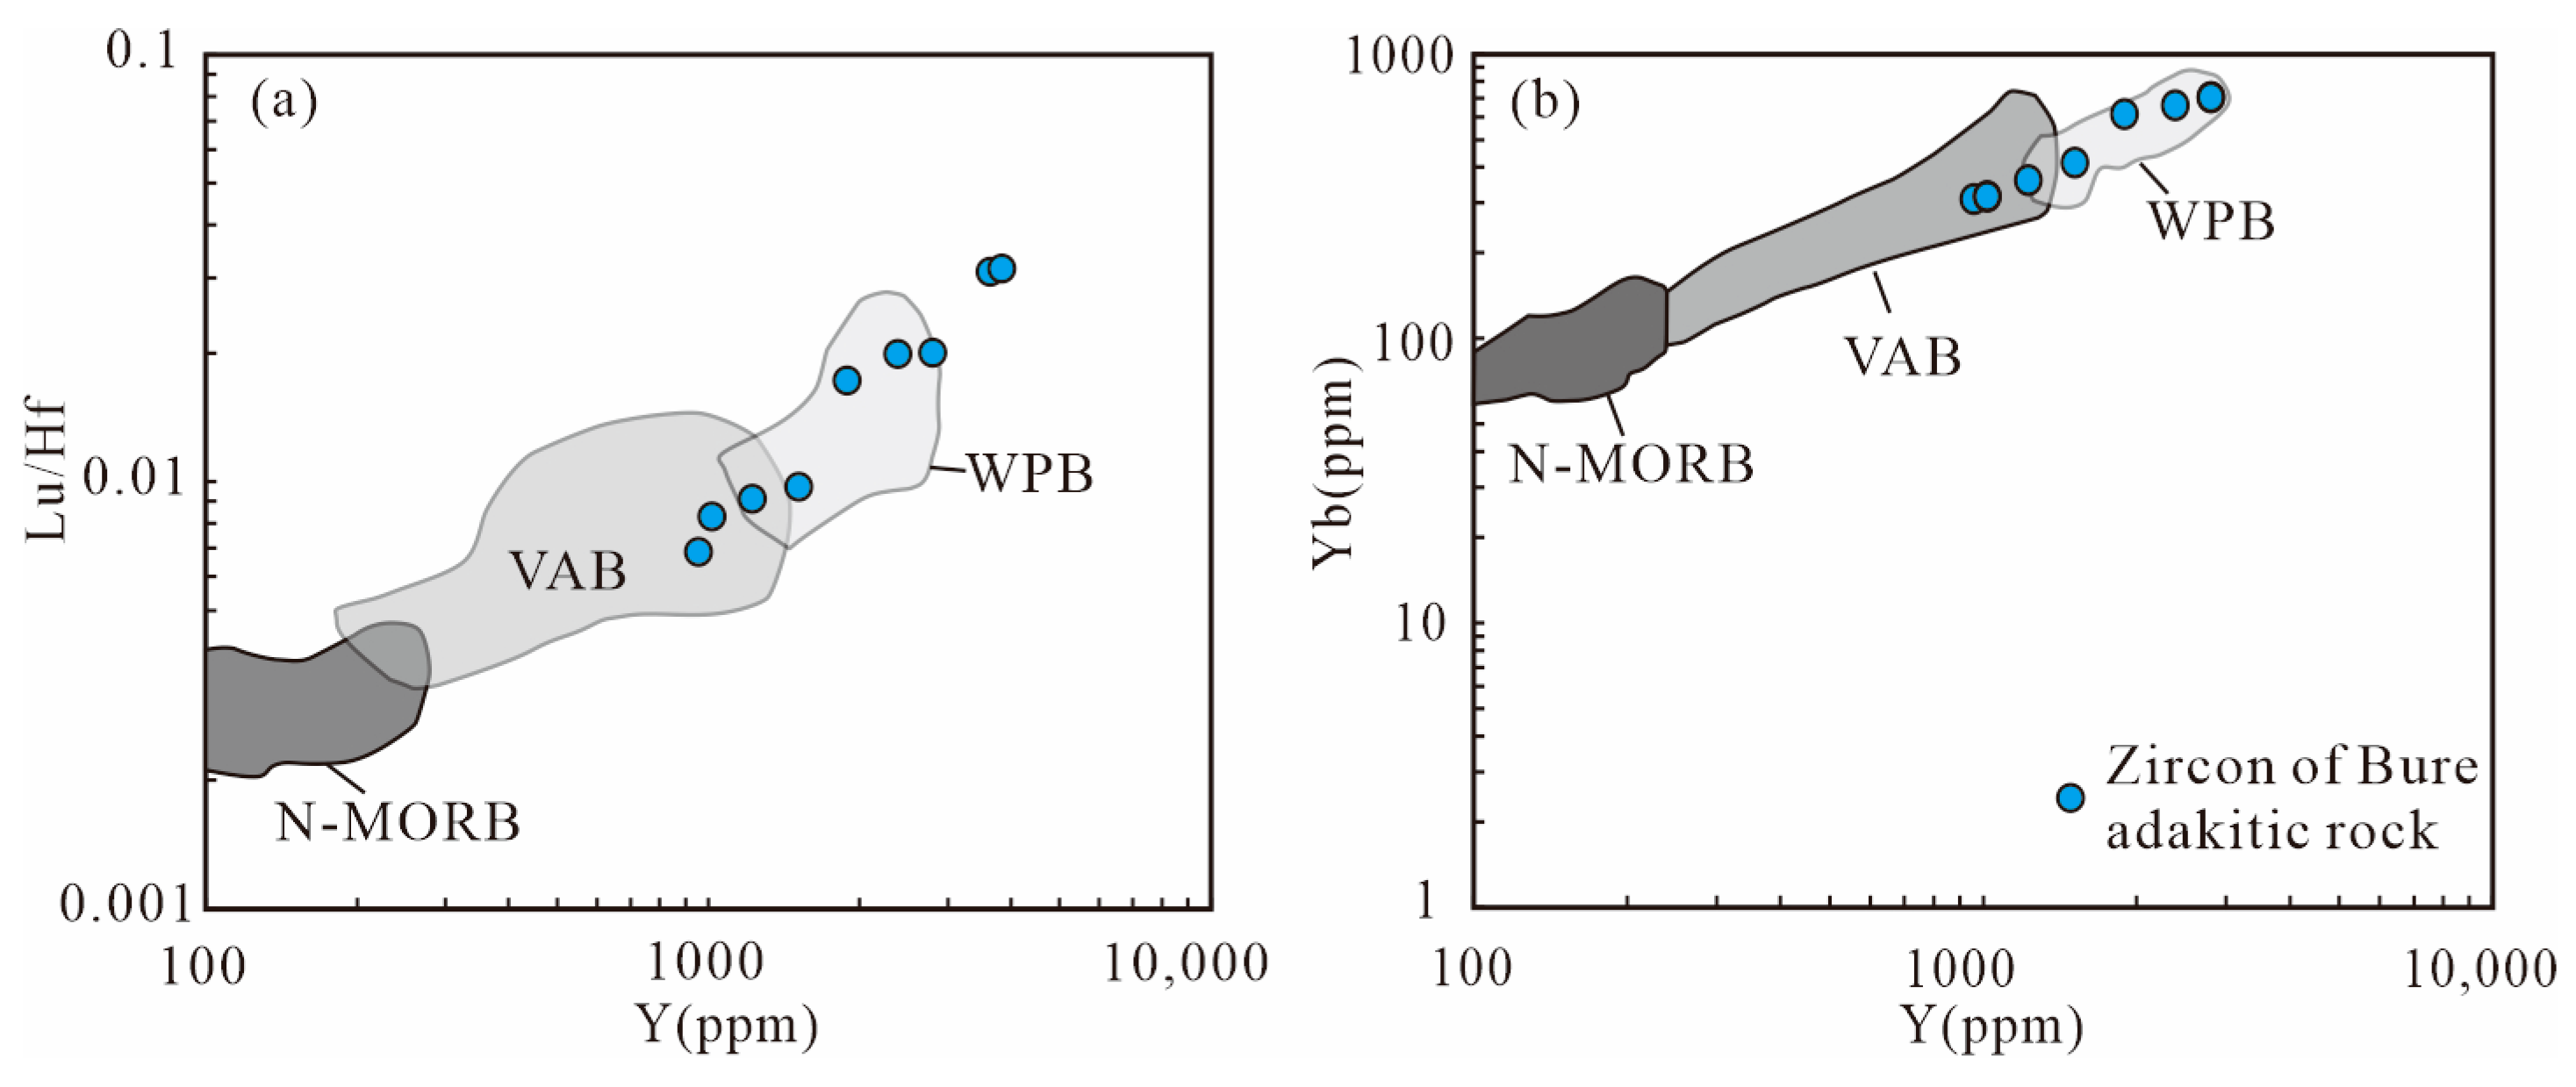
4.2. Trace Element Compositions of Zircon
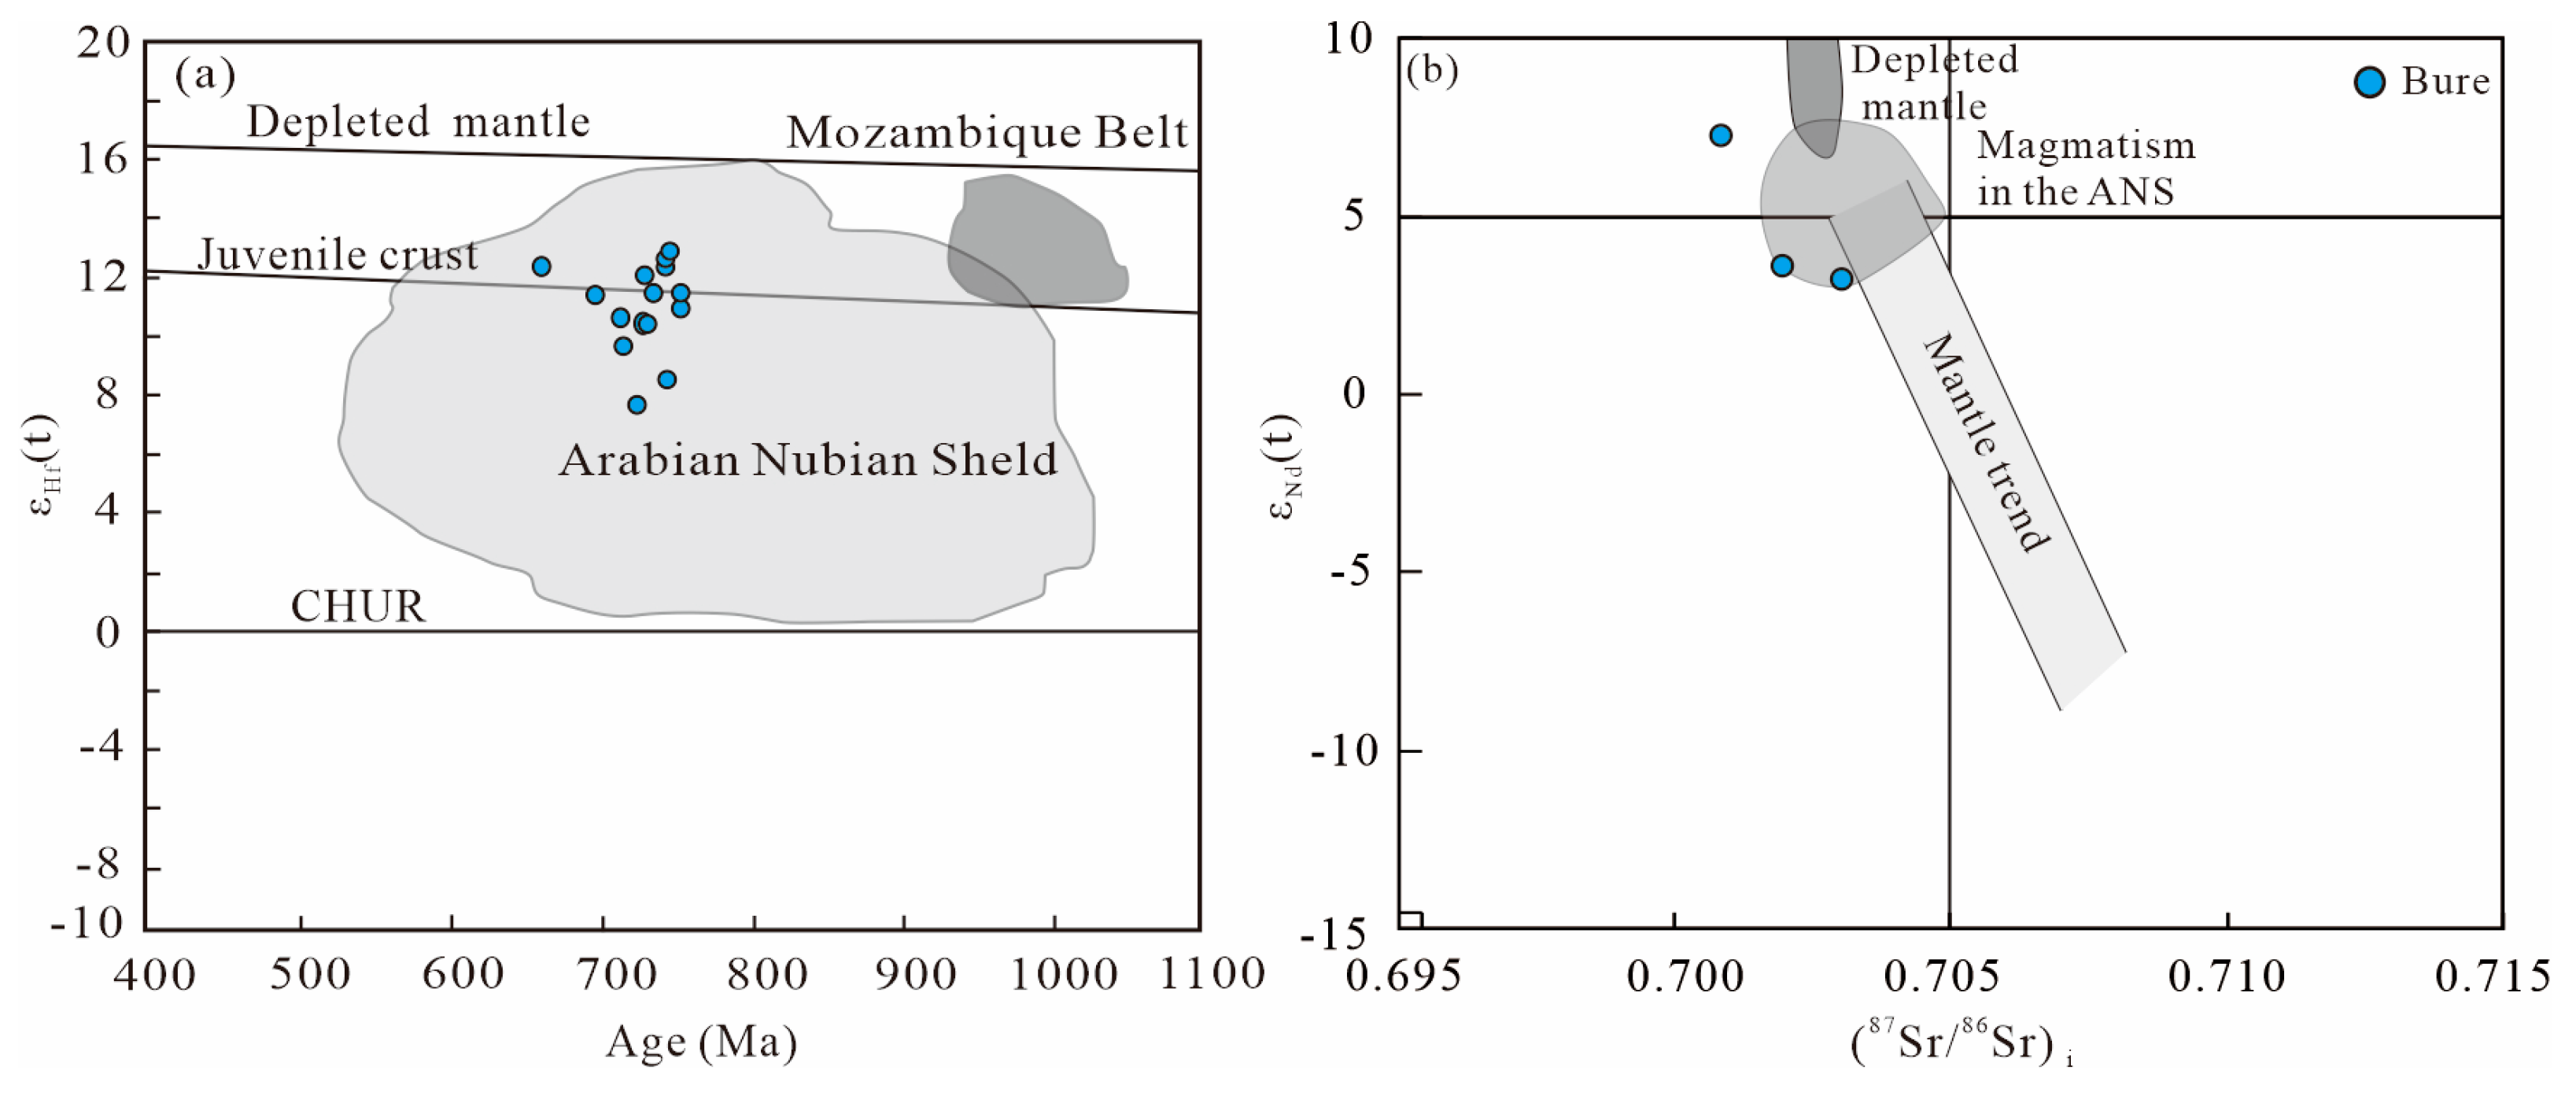
4.3. Zircon Lu-Hf Isotopes and Whole-Rock Sr-Nd Isotopes

| No. | 176Hf/177Hf | 1σ | 176Lu/177Hf | 1σ | 176Yb/177Hf | 1σ | Age (Ma) [7] | εHf(t) [47] | TDM2 (Ma) |
|---|---|---|---|---|---|---|---|---|---|
| BR0101Grt1-02 | 0.282734 | 0.000020 | 0.001766 | 0.000051 | 0.064510 | 0.001820 | 660 | 12.44 | 803 |
| BR0101Grt1-05 | 0.282623 | 0.000013 | 0.000892 | 0.000018 | 0.029611 | 0.000544 | 753 | 10.91 | 974 |
| BR0101Grt1-07 | 0.282680 | 0.000021 | 0.001743 | 0.000019 | 0.055813 | 0.000457 | 743 | 12.29 | 877 |
| BR0101Grt1-12 | 0.282702 | 0.000017 | 0.002429 | 0.000022 | 0.070191 | 0.000389 | 743 | 12.73 | 849 |
| BR0101Grt1-17 | 0.282599 | 0.000020 | 0.003626 | 0.000051 | 0.129672 | 0.002161 | 744 | 8.50 | 1122 |
| BR0101Grt1-21 | 0.282689 | 0.000022 | 0.002049 | 0.000063 | 0.067411 | 0.002036 | 696 | 11.48 | 893 |
| BR0101Grt1-26 | 0.282718 | 0.000021 | 0.003151 | 0.000071 | 0.109087 | 0.002564 | 746 | 12.99 | 834 |
| BR0101GRT1-10 | 0.282631 | 0.000019 | 0.002470 | 0.000074 | 0.056882 | 0.001625 | 715 | 9.63 | 1027 |
| BR0101GRT1-15 | 0.282645 | 0.000020 | 0.002279 | 0.000038 | 0.060088 | 0.001038 | 728 | 10.46 | 983 |
| BR0101GRT1-22 | 0.282667 | 0.000017 | 0.000706 | 0.000009 | 0.017882 | 0.000247 | 729 | 12.02 | 883 |
| BR0101GRT1-28 | 0.282657 | 0.000022 | 0.001282 | 0.000020 | 0.033778 | 0.000571 | 735 | 11.54 | 919 |
| BR0101GRT1-31 | 0.282644 | 0.000021 | 0.001278 | 0.000002 | 0.034658 | 0.000082 | 713 | 10.61 | 962 |
| BR0101GRT1-32 | 0.282620 | 0.000023 | 0.000766 | 0.000016 | 0.020989 | 0.000557 | 731 | 10.38 | 991 |
| BR0101GRT1-35 | 0.282644 | 0.000020 | 0.001313 | 0.000004 | 0.033838 | 0.000049 | 753 | 11.44 | 940 |
| BR0101GRT1-39 | 0.282572 | 0.000029 | 0.002650 | 0.000025 | 0.072997 | 0.000613 | 724 | 7.64 | 1161 |
| Sample No. | 87Rb/86Sr | 87Sr/86Sr | ±2σ | (87Sr/86Sr)i | 147Sm/144Nd | 143Nd/144Nd | ±2σ | εNd(t) | TDM2 (Ma) |
|---|---|---|---|---|---|---|---|---|---|
| BR0101Grt1 | 0.523 | 0.707381 | 0.000006 | 0.701898 | 0.122 | 0.512463 | 0.000009 | 3.62 | 1140 |
| BR0101Grt2 | 0.623 | 0.707409 | 0.000006 | 0.700880 | 0.115 | 0.512618 | 0.000007 | 7.28 | 820 |
| BR0101Grt3 | 0.449 | 0.707450 | 0.000010 | 0.702746 | 0.130 | 0.512485 | 0.000007 | 3.26 | 1210 |

5. Discussion
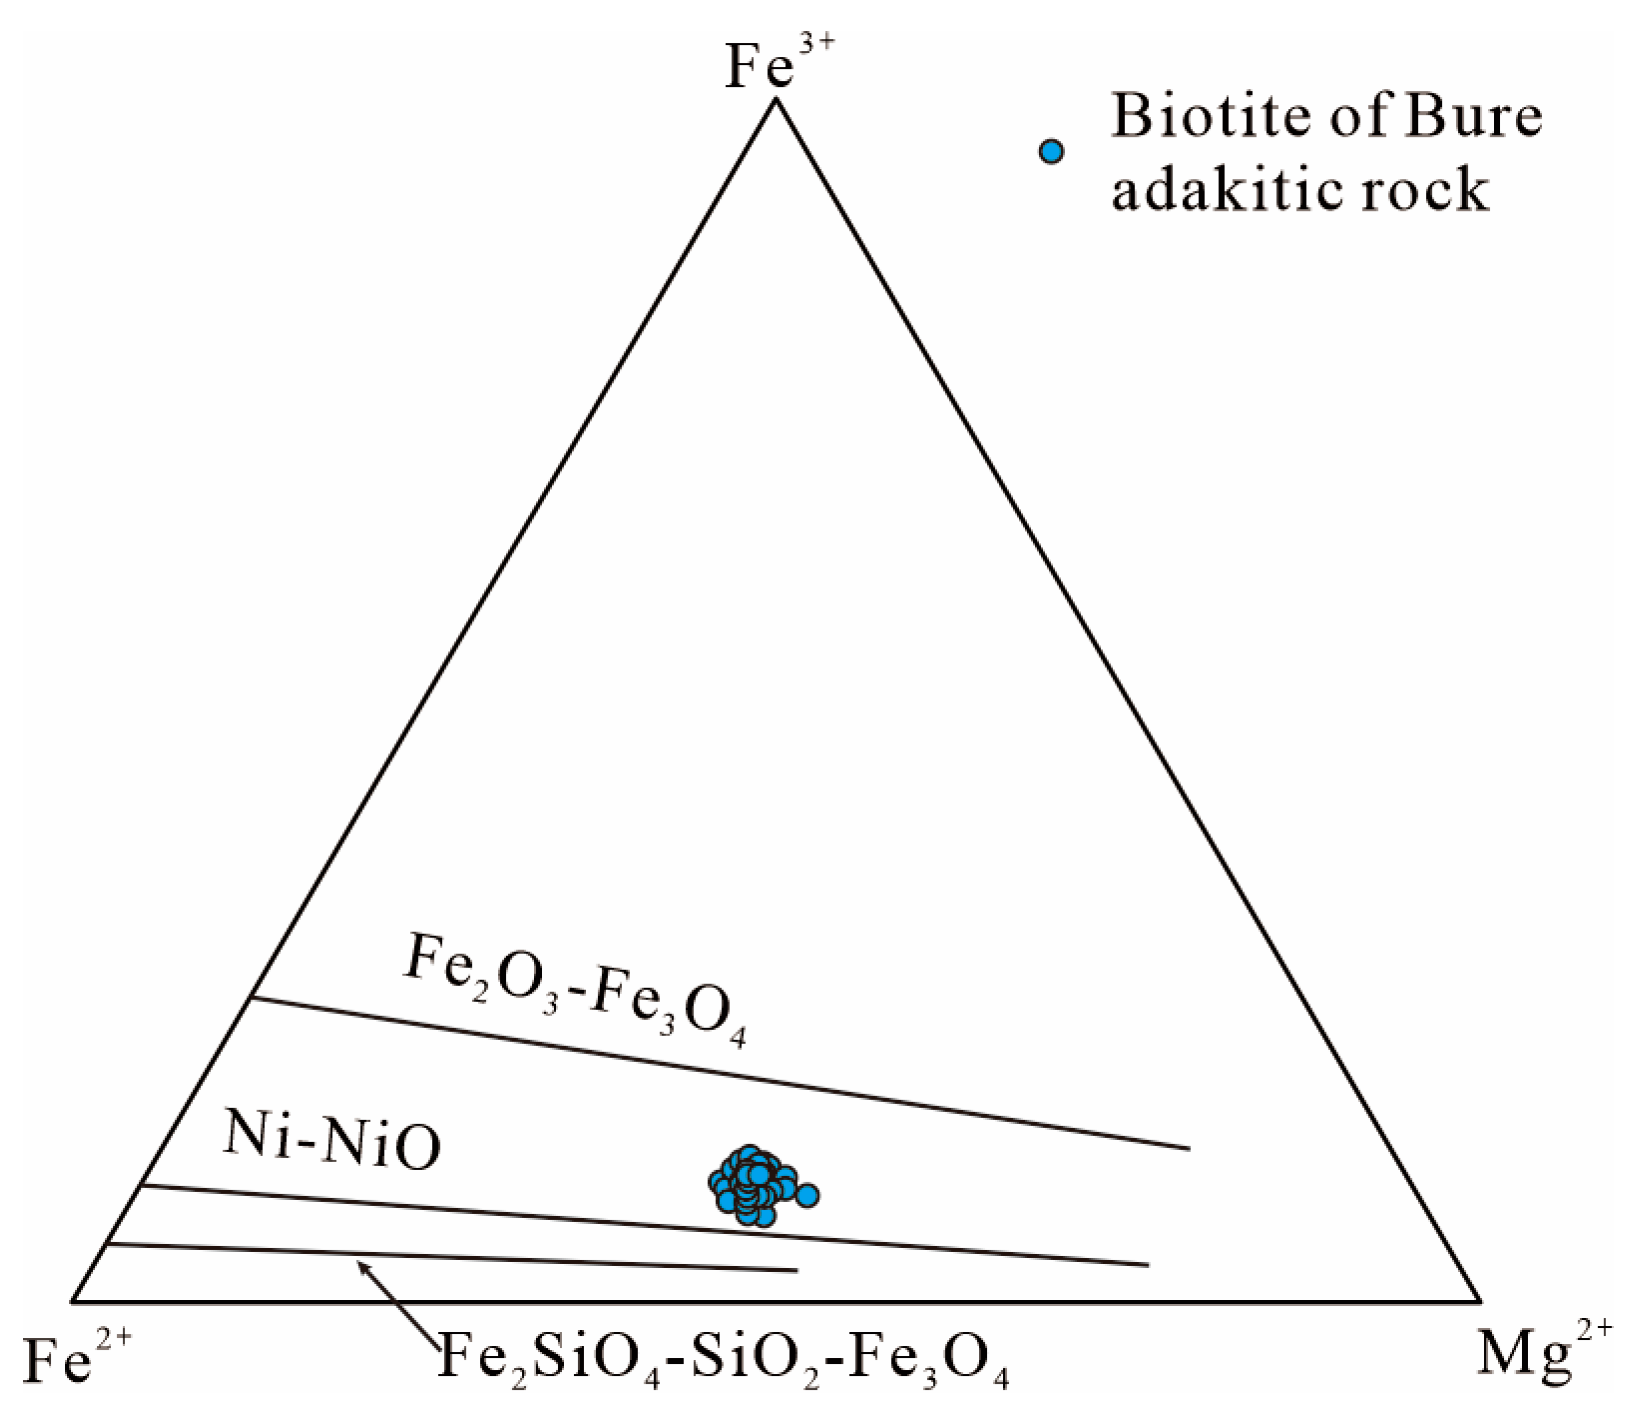
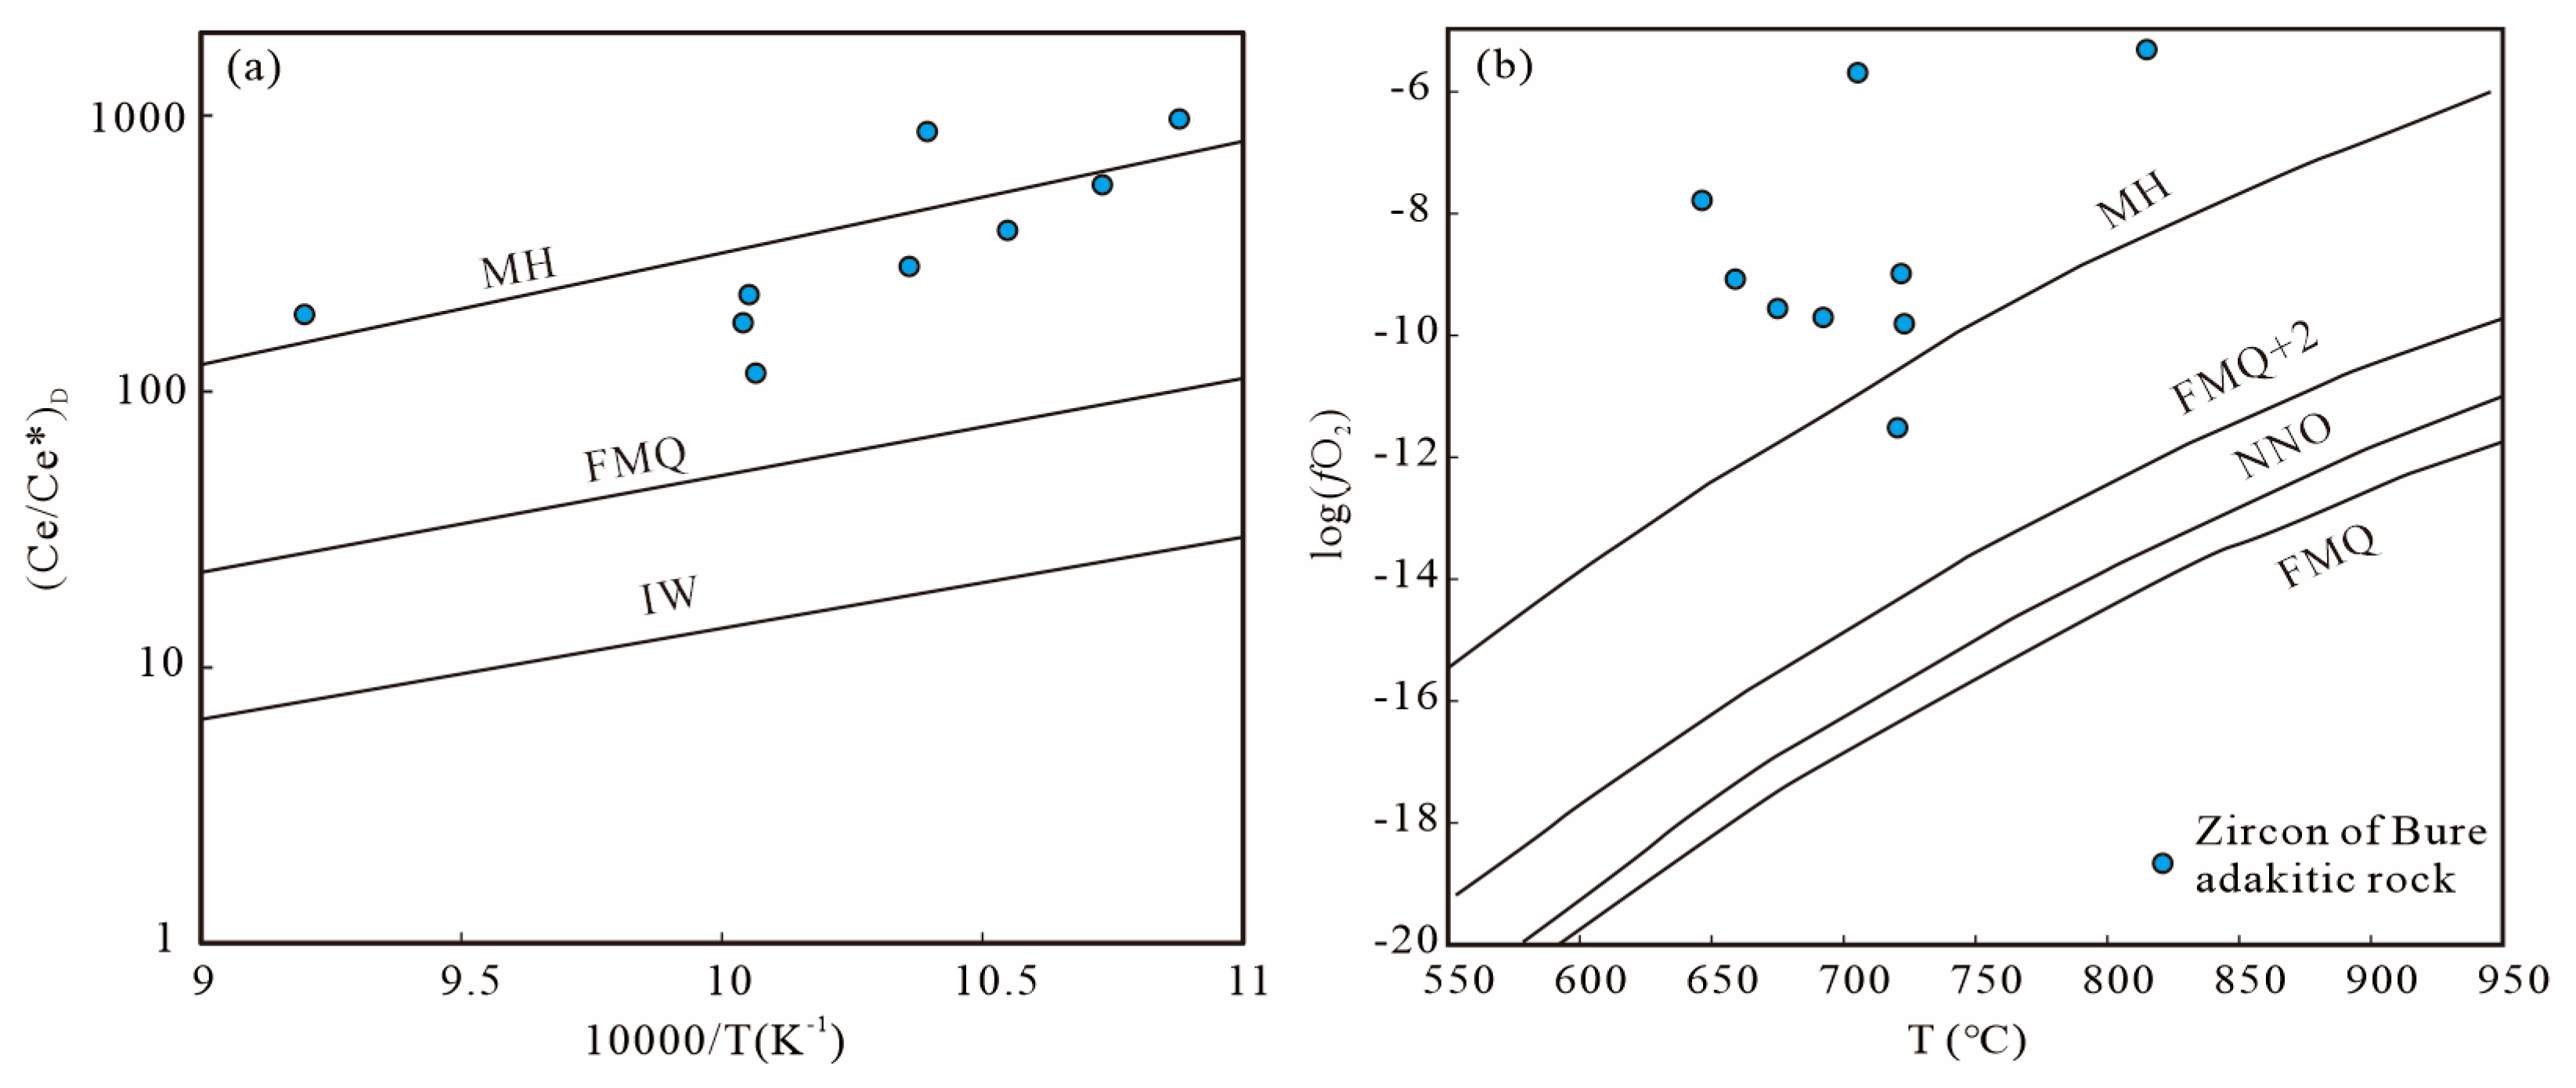
5.1. Physicochemical Condition of Magma Crystallization
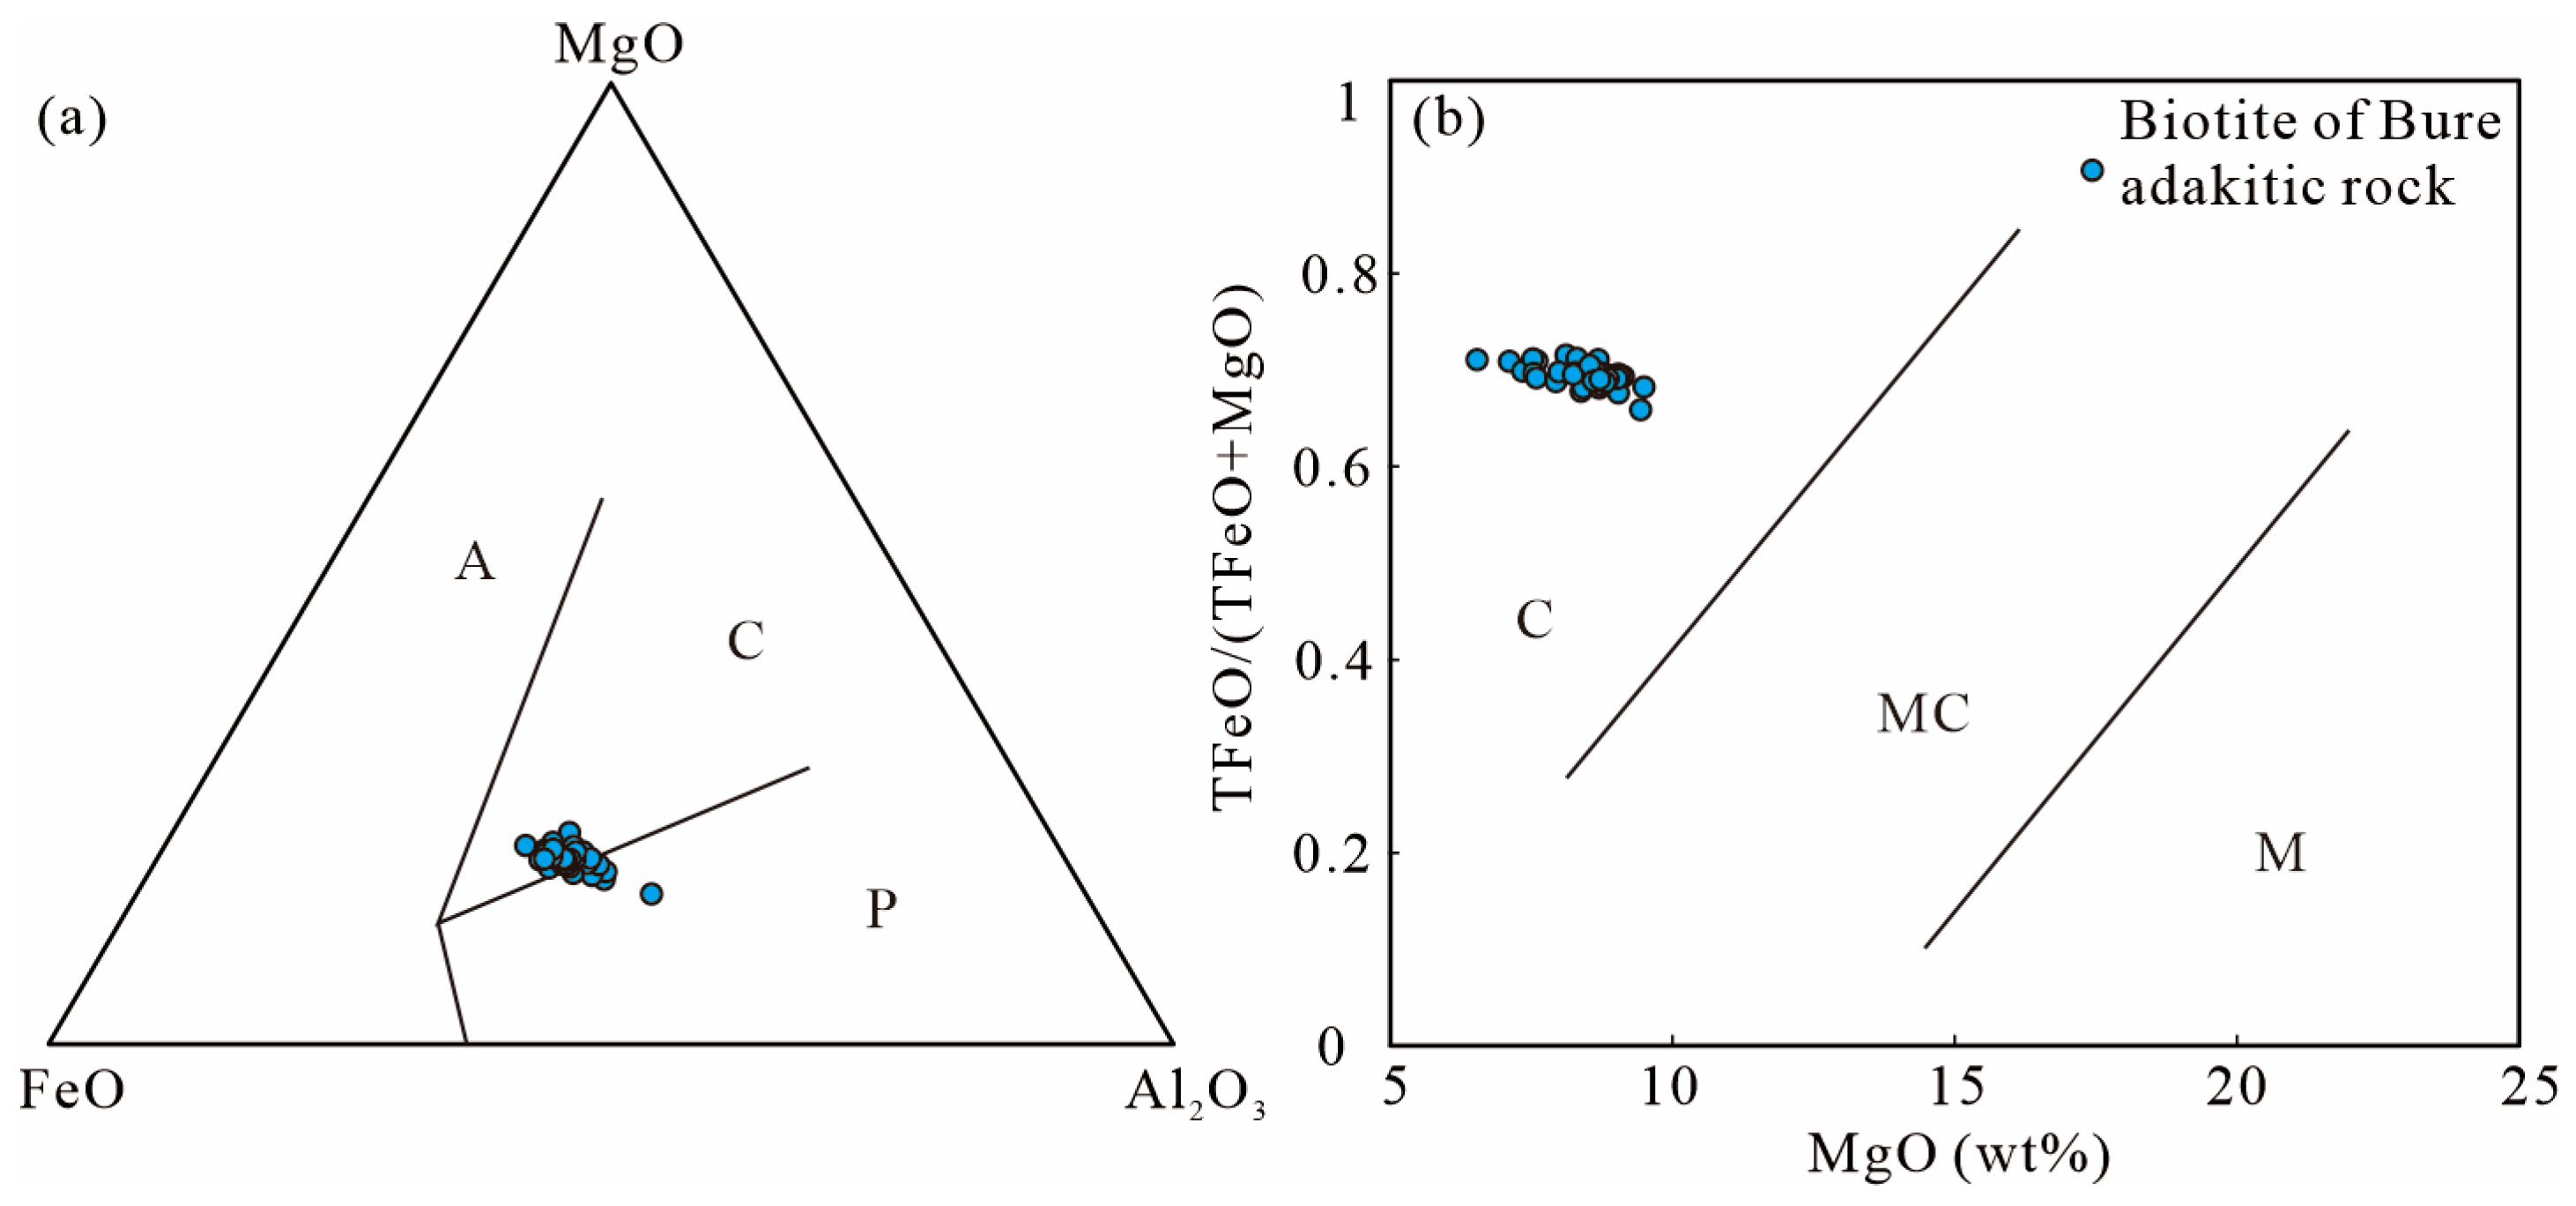
5.2. Magma Source and Genesis
5.3. Tectonic Environment
6. Conclusions
- (1)
- The crystallization temperature of the Bure adakitic rock ranges from 659 to 814 °C, and its calculated emplacement depth was 6.39~10.2 km (average of 7.60 km). The Fe3+, Fe2+, and Mg2+ values of biotite, and the positive Ce anomaly and calculated magmatic oxygen fugacity values of zircon reveal a high oxygen fugacity of the magma.
- (2)
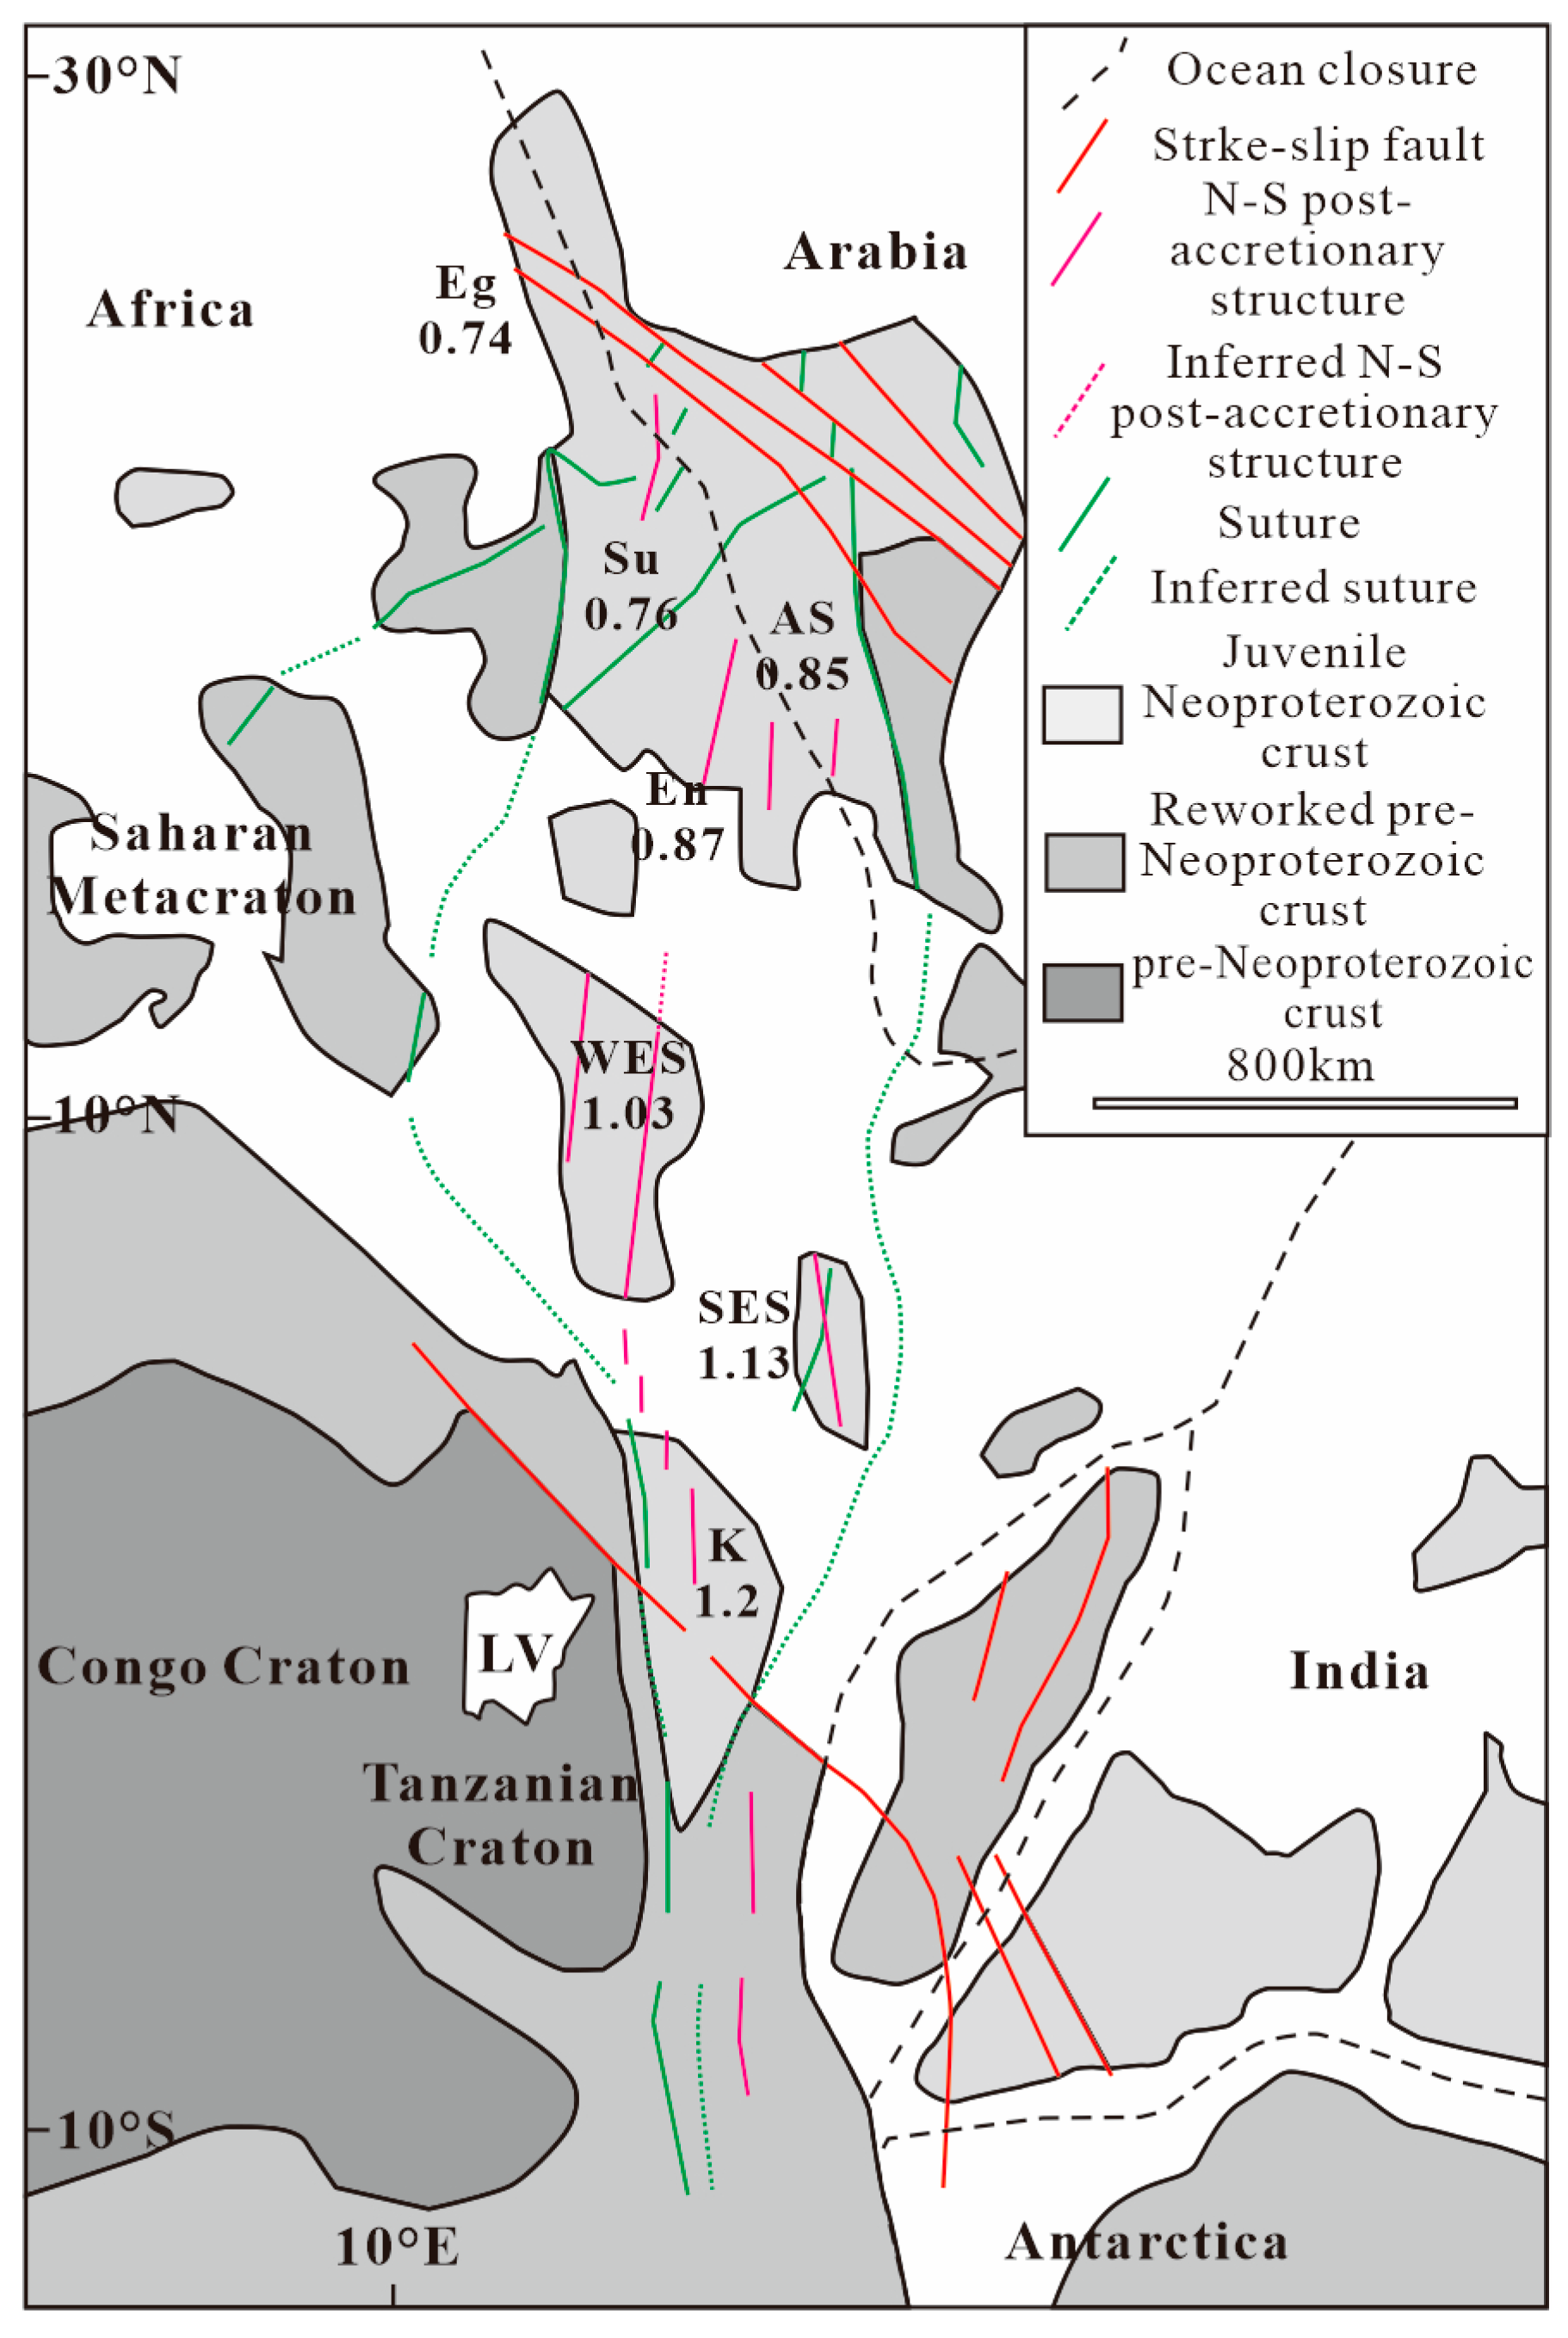
- The major elements of biotite and the Sr-Nd-Hf isotopes indicate that the Bure adakitic rock was derived from juvenile crustal materials. Additionally, the mean Nd model ages progressively increase from the northern to the central and southern parts of the EAO, which indicates an increasing contribution of the pre-Pan-African crust towards the southern part of the EAO.
- (3)
- The Bure adakitic rock is the product of thickened juvenile crust melting triggered by the Pan-African Orogeny during the Neoproterozoic.
Author Contributions
Funding
Data Availability Statement
Acknowledgments
Conflicts of Interest
References
- Collins, A.S.; Pisarevsky, S.A. Amalgamating eastern Gondwana: The evolution of the Circum-Indian Orogens. Earth-Sci. Rev. 2005, 71, 229–270. [Google Scholar] [CrossRef]
- Fritz, H.; Abdelsalam, M.; Ali, K.A.; Bingen, B.; Collins, A.S.; Fowler, A.R.; Ghebreab, W.; Hauzenberger, C.A.; Johnson, P.R.; Kusky, T.M.; et al. Orogen styles in the East African Orogen: A review of the Neoproterozoic to Cambrian tectonic evolution. J. Afr. Earth Sci. 2013, 86, 65–106. [Google Scholar] [CrossRef] [PubMed]
- Stern, R.J. Arc-assembly and continental collision in the Neoproterozoic African Orogen: Implications for the consolidation of Gondwanaland. Annu. Rev. Earth Planet. Sci. 1994, 22, 319–351. [Google Scholar] [CrossRef]
- Abdelsalam, M.; Stern, R. Sutures and shear zones in the Arabian-Nubian Shield. J. Afr. Earth Sci. 1996, 23, 289–310. [Google Scholar] [CrossRef]
- Ayalew, T.; Peccerillo, A. Petrology and geochemistry of the Gore-Gambella plutonic rocks: Implications for magma genesis and the tectonic setting of the Pan-African Orogenic Belt of western Ethiopia. J. Afr. Earth Sci. 1998, 27, 397–416. [Google Scholar] [CrossRef]
- Bowden, S.; Gani, N.D.; Alemu, T.; O’Sullivan, P.; Abebe, B.; Tadesse, K. Evolution of the Western Ethiopian Shield revealed through U-Pb geochronology, petrogenesis, and geochemistry of syn- and post-tectonic intrusive rocks. Precambrian Res. 2020, 338, 105588. [Google Scholar] [CrossRef]
- Jiang, J.S.; Hu, P.; Xiang, W.S.; Wang, J.X.; Lei, Y.J.; Zhao, K.; Zeng, G.P.; Wu, F.F.; Xiang, P. Geochronology, geochemistry and its implication for regional tectonic evolution of adakite-like rock in the Bure area, western Ethiopia. Acta Geol. Sin.-Engl. 2021, 95, 1260–1272, (In Chinese with English Abstract). [Google Scholar]
- Kebede, T.; Koeberl, C.; Koller, F. Geology, geochemistry and petrogenesis of intrusive rocks of the Wallagga area, western Ethiopia. J. Afr. Earth Sci. 1999, 29, 715–734. [Google Scholar] [CrossRef]
- Kebede, T.; Koeberl, C.; Koller, F. Magmatic evolution of the suqii-wagga garnet-bearing two-mica granite, wallagga area, western Ethiopia. J. Afr. Earth Sci. 2001, 32, 193–221. [Google Scholar] [CrossRef]
- Woldemichael, B.W.; Kimura, J.; Dunkley, D.J.; Tani, K.; Ohira, H. SHRIMP U–Pb zircon geochronology and Sr–Nd isotopic systematic of the Neoproterozoic Ghimbi-Nedjo mafic to intermediate intrusions of Western Ethiopia: A record of passive margin magmatism at 855 Ma? Int. J. Earth Sci. 2010, 99, 1773–1790. [Google Scholar] [CrossRef]
- Xiang, W.S.; Jiang, J.S.; Lei, Y.J.; Zhao, K. Petrogenesis of A-type granite and geological significance of Bure area, western Ethiopia. Earth Sci. 2021, 46, 2299–2310, (In Chinese with English Abstract). [Google Scholar]
- Xu, J.F.; Shinji, R.; Defant, M.J.; Wang, Q.; Rapp, R.P. Origin of Mesozoic adakitic intrusive rocks in the Ningzhen area of east China: Partial melting of delaminated lower continental crust? Geology 2002, 30, 1111–1114. [Google Scholar] [CrossRef]
- Jacobs, J.; Thomas, R.J. Himalayan-type indenter-escape tectonics model for the southern part of the late Neoproterozoic-early Palaeozoic East African Antarctic orogen. Geology 2004, 32, 721–724. [Google Scholar] [CrossRef]
- Johnson, P.; Andresen, A.; Collins, A.S.; Fowler, A.; Fritz, H.; Ghebreab, W.; Kusky, T.; Stern, R. Late Cryogenian–Ediacaran history of the Arabian-Nubian Shield: A review of depositional, plutonic, structural, and tectonic events in the closing stages of the northern East African Orogen. J. Afr. Earth Sci. 2011, 61, 167–232. [Google Scholar] [CrossRef]
- Allen, A.; Tadesse, G. Geological setting and tectonic subdivision of the Neoproterozoic orogenic belt of Tuludimtu, western Ethiopia. J. Afr. Earth Sci. 2003, 36, 329–343. [Google Scholar] [CrossRef]
- Cox, G.M.; Lewis, C.J.; Collins, A.S.; Halverson, G.P.; Jourdan, F.; Foden, J.; Nettle, D.; Kattan, F. Ediacaran terrane accretion within the Arabian–Nubian Shield. Gondwana Res. 2012, 21, 341–352. [Google Scholar] [CrossRef]
- Kröner, A.; Linnebacher, P.; Stern, R.; Reischmann, T.; Manton, W.; Hussein, I. Evolution of Pan-African island arc assemblages in the southern Red Sea Hills, Sudan, and in southwestern Arabia as exemplified by geochemistry and geochronology. Precambrian Res. 1991, 53, 99–118. [Google Scholar] [CrossRef]
- Robinson, F.; Foden, J.; Collins, A.; Payne, J. Arabian Shield magmatic cycles and their relationship with Gondwana assembly: Insights from zircon U–Pb and Hf isotopes. Earth Planet. Sci. Lett. 2014, 408, 207–225. [Google Scholar] [CrossRef]
- Shackleton, R. The final collision zone between East and West Gondwana: Where is it? J. Afr. Earth Sci. 1996, 23, 271–287. [Google Scholar] [CrossRef]
- Meert, J.G. A synopsis of events related to the assembly of eastern Gondwana. Tectonophysics 2003, 362, 1–40. [Google Scholar] [CrossRef]
- Woldemichael, B.W.; Kimura, J.I. Petrogenesis of the Neoproterozoic Bikilal Ghimbi gabbro, western Ethiopia. J. Mineral. Petrol. Sci. 2008, 103, 23–46. [Google Scholar] [CrossRef][Green Version]
- Stern, R.J. Crustal evolution in the East African Orogen: A neodymium isotopic perspective. J. Afr. Earth Sci. 2002, 34, 109–117. [Google Scholar] [CrossRef]
- Tadesse, G.; Allen, A. Geology and geochemistry of the Neoproterozoic Tuludimtu Ophiolite suite, western Ethiopia. J. Afr. Earth Sci. 2005, 41, 192–211. [Google Scholar] [CrossRef]
- Braathen, A.; Grenne, T.; Selassie, M.; Worku, T. Juxtaposition of Neoproterozoic units along the Baruda–Tulu Dimtu shear-belt in the East African Orogen of western Ethiopia. Precambrian Res. 2001, 107, 215–234. [Google Scholar] [CrossRef]
- Grenne, T.; Pedersen, R.B.; Bjerkgård, T.; Braathen, A.; Selassie, M.G.; Worku, T. Neoproterozoic evolution of Western Ethiopia: Igneous geochemistry, isotope systematics and U–Pb ages. Geol. Mag. 2003, 140, 373–395. [Google Scholar] [CrossRef]
- Mogessie, A.; Belete, K.; Hoinkes, G. Yubdo-Tulu Dimtu mafic-ultramafic belt, Alaskan-type intrusions in western Ethiopia: Its implication to the ArabianNubian Shield and tectonics of the Mozambique Belt. J. Afr. Earth Sci. 2000, 30, 62. [Google Scholar]
- Blades, M.L.; Collins, A.S.; Foden, J.; Payne, J.L.; Xu, X.; Alemu, T.; Woldetinsae, G.; Clark, C.; Taylor, R.J.M. Age and hafnium isotopic evolution of the Didesa and Kemashi Domains, western Ethiopia. Precambrian Res. 2015, 270, 267–284. [Google Scholar] [CrossRef]
- Kebede, T.; Koeberl, C. Petrogenesis of A-type granitoids from the Wallagga area, western Ethiopia: Constraints from mineralogy, bulk-rock chemistry, Nd and Sr isotopic compositions. Precambrian Res. 2003, 121, 1–24. [Google Scholar] [CrossRef]
- Liu, Y.S.; Hu, Z.C.; Gao, S.; Günther, D.; Xu, J.; Gao, C.G.; Chen, H.H. In situ analysis of major and trace elements of anhydrous minerals by LA-ICP-MS without applying an internal standard. Chem. Geol. 2008, 257, 34–43. [Google Scholar] [CrossRef]
- Qiu, X.-F.; Ling, W.-L.; Liu, X.-M.; Kusky, T.; Berkana, W.; Zhang, Y.-H.; Gao, Y.-J.; Lu, S.-S.; Kuang, H.; Liu, C.-X. Recognition of Grenvillian volcanic suite in the Shennongjia region and its tectonic significance for the South China Craton. Precambrian Res. 2011, 191, 101–119. [Google Scholar] [CrossRef]
- Hu, Z.C.; Liu, Y.S.; Gao, S.; Liu, W.; Yang, L.; Zhang, W.; Tong, X.; Lin, L.; Zong, K.Q.; Li, M.; et al. Improved in situ Hf isotope ratio analysis of zircon using newly designed X skimmer cone and jet sample cone in combination with the addition of nitrogen by laser ablation multiple collector ICP-MS. J. Anal. At. Spectrom. 2012, 27, 1391–1399. [Google Scholar] [CrossRef]
- Fisher, C.M.; Vervoort, J.D.; Hanchar, J.M. Guidelines for reporting zircon Hf isotopic data by LA-MC-ICPMS and potential pitfalls in the interpretation of these data. Chem. Geol. 2014, 363, 125–133. [Google Scholar] [CrossRef]
- Liu, Y.S.; Gao, S.; Hu, Z.C.; Gao, C.G.; Zong, K.Q.; Wang, D.B. Continental and oceanic crust recycling-induced melt-peridotite interactions in the Trans-North China Orogen: U–Pb dating, Hf isotopes and trace elements in zircons of mantle xenoliths. J. Petrol. 2010, 51, 537–571. [Google Scholar] [CrossRef]
- Zhang, W.; Hu, Z. Estimation of Isotopic Reference Values for Pure Materials and Geological Reference Materials. At. Spectrosc. 2020, 41, 93–102. [Google Scholar] [CrossRef]
- Chen, G.Y.; Sun, D.S.; Zhou, X.R.; Shao, W.; Gong, R.T.; Shao, Y. Mineralogy of Guojialing Granodiorite and Its Relationship to Gold Mineralization in the Jiaodong Peninsula; Chinese University of Geosciences: Beijing, China, 1993; pp. 1–230. [Google Scholar]
- Deer, W.A.; Howie, R.A.; Zussman, J. An Introduction to the Rock Forming Minerals, 2nd ed.; Longman Group: Harlow, UK, 1992; pp. 1–232. [Google Scholar]
- Foster, M.D. Interpretation of the Composition of Trioctahedral Mica; U.S. Geological Survey Professional Paper 354-B; U.S. Government Printing Office: Washington, DC, USA, 1960; pp. 11–48. [Google Scholar]
- Lin, W.W.; Peng, L.J. Estimation of Fe3+ and Fe2+ in hornblende and biotite by electron probe analysis data. J. Chang. Coll. Geol. 1994, 24, 155–162. [Google Scholar]
- Kumar, S.; Pathak, M. Mineralogy and geochemistry of biotites from Proterozoic granitoids of western Arunachal Himalaya: Evidence of bimodal granitogeny and tectonic affinity. J. Geol. Soc. India 2010, 75, 715–730. [Google Scholar] [CrossRef]
- Guo, Y.Y.; He, W.Y.; Li, Z.C.; Ji, X.Z.; Han, Y.; Fang, W.K.; Yin, C. Petrogenesis of Ge’erkuohe porphyry granitoid, western Qinling: Constraints from mineral chemical characteristics of biotites. Acta Petrol. Sin. 2015, 31, 3380–3390, (In Chinese with English Abstract). [Google Scholar]
- Hoskin, P.W. Trace-element composition of hydrothermal zircon and the alteration of Hadean zircon from the Jack Hills, Australia. Geochim. Cosmochim. Acta 2005, 69, 637–648. [Google Scholar] [CrossRef]
- Watson, E.B.; Harrison, T.M. Zircon Thermometer Reveals Minimum Melting Conditions on Earliest Earth. Science 2005, 308, 841–844. [Google Scholar] [CrossRef]
- Ballard, J.R.; Palin, M.J.; Campbell, I.H. Relative oxidation states of magmas inferred from Ce (IV)/Ce (III) in zircon: Application to porphyry copper deposits of northern Chile. Contrib. Mineral. Petrol. 2002, 144, 347–364. [Google Scholar] [CrossRef]
- Trail, D.; Watson, E.B.; Tailby, N.D. Ce and Eu anomalies in zircon as proxies for the oxidation state of magmas. Geochim. Cosmochim. Acta 2012, 97, 70–87. [Google Scholar] [CrossRef]
- Li, W.K.; Cheng, Y.Q.; Yang, Z.M. Geo-fO2: Integrated software for analysis of magmatic oxygen fugacity. Geochem. Geophy. Geosy. 2019, 20, 2542–2555. [Google Scholar] [CrossRef]
- Sun, S.S.; McDonough, W.F. Chemical and isotopic systematics of oceanic basalts: Implications for mantle composition and processes. Geol. Soc. Lond. Spec. Publ. 1989, 42, 313–345. [Google Scholar] [CrossRef]
- Bouvier, A.; Blichert-Toft, J.; Vervoort, J.D.; Gillet, P.; Albarède, F. The case for old basaltic shergottites. Earth Planet. Sci. Lett. 2008, 266, 105–124. [Google Scholar] [CrossRef]
- Wasserburg, G.J.; Jacobsen, S.B.; DePaolo, D.J.; McCulloch, M.T.; Wen, T. Precise determination of SmNd ratios, Sm and Nd isotopic abundances in standard solutions. Geochim. Cosmochim. Acta 1981, 45, 2311–2323. [Google Scholar] [CrossRef]
- Liew, T.C.; Hofmann, A.W. Precambrian crustal components, plutonic associations, plate environment of the Hercynian Fold Belt of central Europe: Indications from a Nd and Sr isotopic study. Contrib. Mineral. Petrol. 1988, 98, 129–138. [Google Scholar] [CrossRef]
- Jahn, B.-M.; Condie, K.C. Evolution of the Kaapvaal Craton as viewed from geochemical and Sm-Nd isotopic analyses of intracratonic pelites. Geochim. Cosmochim. Acta 1995, 59, 2239–2258. [Google Scholar] [CrossRef]
- Khan, J.; Yao, H.-Z.; Zhao, J.-H.; Tahir, A.; Chen, K.-X.; Wang, J.-X.; Song, F.; Xu, J.-Y.; Shah, I. Geochronology, geochemistry, and tectonic setting of the Neoproterozoic magmatic rocks in Pan-African basement, West Ethiopia. Ore Geol. Rev. 2024, 164, 105858. [Google Scholar] [CrossRef]
- Manda, B.W.; Cawood, P.A.; Spencer, C.J.; Prave, T.; Robinson, R.; Roberts, N.M.W. Evolution of the Mozambique Belt in Malawi constrained by granitoid U-Pb, Sm-Nd and Lu-Hf isotopic data. Gondwana Res. 2018, 68, 93–107. [Google Scholar] [CrossRef]
- Griffin, W.; Graham, S.; O’Reilly, S.Y.; Pearson, N. Lithosphere evolution beneath the Kaapvaal Craton: Re–Os systematics of sulfides in mantle-derived peridotites. Chem. Geol. 2004, 208, 89–118. [Google Scholar] [CrossRef]
- Pearce, J.A.; Harris, N.B.W.; Tindle, A.G. Trace Element Discrimination Diagrams for the Tectonic Interpretation of Granitic Rocks. J. Petrol. 1984, 25, 956–983. [Google Scholar] [CrossRef]
- Zeng, G.P.; Wang, J.X.; Xiang, W.S.; Zhang, Z.C.; Jiang, J.S.; Xiang, P. The Augaro Arc-type Granite in the Nubia Shield, Western Eritrea: Petrogenesis and Implications for Neoproterozoic Geodynamic Evolution of the East African Orogen. Northwestern Geol. 2024, 57, 159–173, (In Chinese with English abstract). [Google Scholar]
- Uchida, E.; Endo, S.; Makino, M. Relationship Between Solidification Depth of Granitic Rocks and Formation of Hydrothermal Ore Deposits. Resour. Geol. 2007, 57, 47–56. [Google Scholar] [CrossRef]
- Wones, D.R.; Eugster, H.P. Stability of biotite: Experiment, theory, and application. Am. Mineral. 1965, 50, 1228–1272. [Google Scholar]
- Jiang, J.-S.; Zheng, Y.-Y.; Gao, S.-B.; Zhang, Y.-C.; Huang, J.; Liu, J.; Wu, S.; Xu, J.; Huang, L.-L. The newly-discovered Late Cretaceous igneous rocks in the Nuocang district: Products of ancient crust melting trigged by Neo–Tethyan slab rollback in the western Gangdese. Lithos 2018, 308–309, 294–315. [Google Scholar] [CrossRef]
- Loader, M.A.; Nathwani, C.L.; Wilkinson, J.J.; Armstrong, R.N. Controls on the magnitude of Ce anomalies in zircon. Geochim. Cosmochim. Acta 2022, 328, 242–257. [Google Scholar] [CrossRef]
- Teklay, M.; Kröner, A.; Mezger, K.; Oberhänsli, R. Geochemistry, Pb Pb single zircon ages and Nd Sr isotope composition of Precambrian rocks from southern and eastern Ethiopia: Implications for crustal evolution in East Africa. J. Afr. Earth Sci. 1998, 26, 207–227. [Google Scholar] [CrossRef]
- Kröner, A.; Sassi, F.P. Evolution of the northern Somali basement: New constraints from zircon ages. J. Afr. Earth Sci. 1996, 22, 1–15. [Google Scholar] [CrossRef]
- Harris, N.B.W.; Marzouki, F.M.H.; Ali, S. The Jabel Sayid complex, Arabian Shield: Geochemical constraints on the origin of peralkaline and related granites. J. Geol. Soc. 1986, 143, 287–295. [Google Scholar] [CrossRef]
- Stern, R.J.; Kröner, A. Late Precambrian Crustal Evolution in NE Sudan: Isotopic and Geochronologic Constraints. J. Geol. 1993, 101, 555–574. [Google Scholar] [CrossRef]
- Stern, R.J.; Abdelsalam, M.G. Formation of juvenile continental crust in the Arabian-Nubian Shield, evidence from granitic rocks of the Nakasib suture, NE Sudan. Geol. Rundsch. 1998, 87, 150–160. [Google Scholar] [CrossRef]
- Zeng, G.P.; Wang, J.X.; Xiang, W.S.; Tong, X.R.; Shao, X.; Hu, P.; Wu, F.F.; Jiang, J.S.; Xiang, P. Petrogenesis and Geological Significance of the Adi Keyh A-type Rhyolite in Central Eritrea. South China Geol. 2022, 38, 157–173, (In Chinese with English). [Google Scholar]
- Abdel-Rahman, A.F.M. Nature of biotites from alkaline, calcalkaline, and peraluminous magmas. J. Petrol. 1994, 35, 525–541. [Google Scholar] [CrossRef]
- Zhou, Z.X. The origin of intrusive mass in Fengshandong, Hubei Province. Acta Petrol. Sin. 1986, 2, 59–70, (In Chinese with English). [Google Scholar]
- Defant, M.J.; Drummond, M.S. Derivation of some modern arc magmas by melting of young subducted lithosphere. Nature 1990, 347, 662–665. [Google Scholar] [CrossRef]
- Schulz, B.; Klemd, R.; Brätz, H. Host rock compositional controls on zircon trace element signatures in metabasites from the Au-stroalpine basement. Geochim. Cosmochim. Acta 2006, 70, 697–710. [Google Scholar] [CrossRef]


| Ele. | Grt8-3 -fs01 | Grt8-3 -fs02 | Grt8-3 -fs04 | Grt8-5 -fs01 | Grt8-5 -fs02 | Grt8-5 -fs04 | Grt8-5 -fs05 | Grt8-5 -fs06 | Grt8-5 -fs07 | Grt8-5 -fs08 | Grt8-5 -fs09 | Grt3-1 -fs01 | Grt3-1 -fs02 | Grt3-1 -fs03 | Grt3-1 -fs04 | Grt3-1 -fs05 | Grt3-1 -fs06 | Grt3-5 -fs07 | Grt3-5 -fs08 | |
|---|---|---|---|---|---|---|---|---|---|---|---|---|---|---|---|---|---|---|---|---|
| CaO | 0.042 | 0.022 | 0.016 | 0.041 | 0.042 | 0.035 | 0.012 | 0.011 | 0.01 | 0.02 | 0.03 | 0.03 | 0.03 | 0.03 | 0.01 | |||||
| Na2O | 0.648 | 0.629 | 0.858 | 0.555 | 0.462 | 0.658 | 0.586 | 0.537 | 0.607 | 0.387 | 0.507 | 0.70 | 0.74 | 0.68 | 0.60 | 0.79 | 0.84 | 0.66 | 0.75 | |
| K2O | 16.085 | 15.769 | 15.465 | 16.152 | 16.66 | 16.136 | 15.93 | 16.026 | 14.227 | 15.874 | 15.892 | 16.28 | 16.07 | 15.74 | 16.34 | 15.91 | 15.61 | 16.10 | 15.02 | |
| SrO | ||||||||||||||||||||
| TFeO | ||||||||||||||||||||
| MgO | ||||||||||||||||||||
| SiO2 | 64.565 | 63.241 | 64.184 | 65.094 | 63.424 | 63.986 | 63.244 | 63.48 | 67.125 | 63.714 | 66.579 | 64.10 | 64.08 | 63.72 | 63.11 | 64.49 | 65.81 | 65.34 | 64.98 | |
| MnO | ||||||||||||||||||||
| Al2O3 | 19.002 | 18.788 | 18.486 | 19.02 | 19.106 | 19.144 | 18.528 | 19.086 | 19.045 | 19.023 | 17.944 | 18.65 | 17.95 | 18.16 | 18.24 | 18.43 | 18.65 | 18.83 | 18.55 | |
| BaO | ||||||||||||||||||||
| Total | 100.30 | 98.47 | 99.02 | 100.84 | 99.69 | 99.92 | 98.33 | 99.16 | 101.02 | 99.01 | 100.92 | 99.74 | 98.87 | 98.34 | 98.32 | 99.61 | 100.94 | 100.95 | 99.30 | |
| Number of cation on basis of 8 oxygens | ||||||||||||||||||||
| Si | 5.950 | 5.938 | 5.979 | 5.963 | 5.909 | 5.926 | 5.952 | 5.923 | 6.047 | 5.942 | 6.070 | 5.954 | 6.000 | 5.987 | 5.957 | 5.983 | 6.003 | 5.977 | 6.008 | |
| Al | 1.548 | 1.559 | 1.522 | 1.540 | 1.573 | 1.567 | 1.541 | 1.574 | 1.517 | 1.568 | 1.446 | 1.531 | 1.486 | 1.509 | 1.522 | 1.511 | 1.504 | 1.523 | 1.516 | |
| Mg | 0.000 | 0.000 | 0.000 | 0.000 | 0.000 | 0.000 | 0.000 | 0.000 | 0.000 | 0.000 | 0.000 | 0.000 | 0.000 | 0.000 | 0.000 | 0.000 | 0.000 | 0.000 | 0.000 | |
| Fe | 0.000 | 0.000 | 0.000 | 0.000 | 0.000 | 0.000 | 0.000 | 0.000 | 0.000 | 0.000 | 0.000 | 0.000 | 0.000 | 0.000 | 0.000 | 0.000 | 0.000 | 0.000 | 0.000 | |
| Mn | 0.000 | 0.000 | 0.000 | 0.000 | 0.000 | 0.000 | 0.000 | 0.000 | 0.000 | 0.000 | 0.000 | 0.000 | 0.000 | 0.000 | 0.000 | 0.000 | 0.000 | 0.000 | 0.000 | |
| Ca | 0.000 | 0.002 | 0.001 | 0.001 | 0.002 | 0.000 | 0.002 | 0.002 | 0.001 | 0.001 | 0.000 | 0.000 | 0.001 | 0.002 | 0.001 | 0.000 | 0.001 | 0.001 | 0.000 | |
| Na | 0.029 | 0.029 | 0.039 | 0.025 | 0.021 | 0.030 | 0.027 | 0.024 | 0.027 | 0.017 | 0.022 | 0.031 | 0.034 | 0.031 | 0.028 | 0.035 | 0.037 | 0.029 | 0.034 | |
| K | 0.473 | 0.472 | 0.459 | 0.472 | 0.495 | 0.477 | 0.478 | 0.477 | 0.409 | 0.472 | 0.462 | 0.482 | 0.480 | 0.472 | 0.492 | 0.471 | 0.454 | 0.470 | 0.443 | |
| Sr | 0.000 | 0.000 | 0.000 | 0.000 | 0.000 | 0.000 | 0.000 | 0.000 | 0.000 | 0.000 | 0.000 | 0.000 | 0.000 | 0.000 | 0.000 | 0.000 | 0.000 | 0.000 | 0.000 | |
| Ba | 0.000 | 0.000 | 0.000 | 0.000 | 0.000 | 0.000 | 0.000 | 0.000 | 0.000 | 0.000 | 0.000 | 0.000 | 0.000 | 0.000 | 0.000 | 0.000 | 0.000 | 0.000 | 0.000 | |
| An | 0.0 | 0.2 | 0.1 | 0.1 | 0.2 | 0.0 | 0.2 | 0.2 | 0.1 | 0.1 | 0.0 | 0.0 | 0.1 | 0.2 | 0.1 | 0.0 | 0.1 | 0.1 | 0.0 | |
| Ab | 5.8 | 5.7 | 7.8 | 5.0 | 4.0 | 5.8 | 5.3 | 4.8 | 6.1 | 3.6 | 4.6 | 6.1 | 6.5 | 6.2 | 5.3 | 7.0 | 7.5 | 5.8 | 7.0 | |
| Or | 94.2 | 94.1 | 92.1 | 95.0 | 95.8 | 94.2 | 94.5 | 95.0 | 93.8 | 96.4 | 95.4 | 93.9 | 93.4 | 93.7 | 94.6 | 93.0 | 92.3 | 94.0 | 92.9 | |
| Ele. | Grt3-4 -fs01 | Grt3-4 -fs02 | Grt3-4 -fs03 | Grt3-4 -fs04 | Grt3-4 -fs05 | Grt3-4 -fs06 | Grt3-4 -fs07 | Grt3-3 -fs05 | Grt3-3 -fs06 | Grt3-3 -fs07 | Grt3-3 -fs08 | Grt3-3 -fs09 | Grt3-5 -fs01 | Grt3-5 -fs02 | Grt3-5 -fs03 | Grt3-5 -fs04 | Grt3-5 -fs05 | Grt3-5 -fs06 | Grt3-5 -fs07 | Grt3-5 -fs08 |
| CaO | 0.01 | 0.03 | 0.01 | 0.01 | 0.02 | 0.02 | 0.02 | 0.02 | 0.03 | 0.01 | 0.03 | 0.07 | 0.03 | 0.01 | 0.03 | 0.03 | 0.07 | 0.03 | 0.01 | |
| Na2O | 0.55 | 0.51 | 0.58 | 0.57 | 0.61 | 0.60 | 0.55 | 0.52 | 0.61 | 0.68 | 0.51 | 0.46 | 1.20 | 0.70 | 0.56 | 0.62 | 0.84 | 0.70 | 0.66 | 0.75 |
| K2O | 16.19 | 15.61 | 16.46 | 16.29 | 16.16 | 16.55 | 16.19 | 15.96 | 16.44 | 15.78 | 16.43 | 16.35 | 15.37 | 15.88 | 16.02 | 15.91 | 15.44 | 15.75 | 16.10 | 15.02 |
| SrO | ||||||||||||||||||||
| TFeO | ||||||||||||||||||||
| MgO | ||||||||||||||||||||
| SiO2 | 64.79 | 62.78 | 64.62 | 65.35 | 66.01 | 65.06 | 65.05 | 65.06 | 65.78 | 64.51 | 64.68 | 64.55 | 62.67 | 64.95 | 64.78 | 65.80 | 63.77 | 62.82 | 65.34 | 64.98 |
| MnO | ||||||||||||||||||||
| Al2O3 | 18.80 | 18.78 | 18.75 | 18.91 | 18.53 | 18.53 | 19.25 | 18.81 | 18.81 | 18.31 | 18.43 | 18.55 | 18.99 | 19.05 | 19.08 | 19.07 | 18.33 | 18.93 | 18.83 | 18.55 |
| BaO | ||||||||||||||||||||
| Total | 100.34 | 97.71 | 100.40 | 101.13 | 101.33 | 100.76 | 101.04 | 100.36 | 101.67 | 99.31 | 100.06 | 99.93 | 98.30 | 100.61 | 100.44 | 101.43 | 98.40 | 98.27 | 100.95 | 99.30 |
| Number of cation on basis of 8 oxygens | ||||||||||||||||||||
| Si | 5.969 | 5.935 | 5.961 | 5.972 | 6.011 | 5.981 | 5.948 | 5.980 | 5.983 | 5.996 | 5.985 | 5.977 | 5.900 | 5.958 | 5.955 | 5.979 | 5.980 | 5.916 | 5.977 | 6.008 |
| Al | 1.531 | 1.570 | 1.529 | 1.527 | 1.492 | 1.506 | 1.556 | 1.528 | 1.513 | 1.504 | 1.507 | 1.518 | 1.580 | 1.545 | 1.550 | 1.531 | 1.519 | 1.575 | 1.523 | 1.516 |
| Mg | 0.000 | 0.000 | 0.000 | 0.000 | 0.000 | 0.000 | 0.000 | 0.000 | 0.000 | 0.000 | 0.000 | 0.000 | 0.000 | 0.000 | 0.000 | 0.000 | 0.000 | 0.000 | 0.000 | 0.000 |
| Fe | 0.000 | 0.000 | 0.000 | 0.000 | 0.000 | 0.000 | 0.000 | 0.000 | 0.000 | 0.000 | 0.000 | 0.000 | 0.000 | 0.000 | 0.000 | 0.000 | 0.000 | 0.000 | 0.000 | 0.000 |
| Mn | 0.000 | 0.000 | 0.000 | 0.000 | 0.000 | 0.000 | 0.000 | 0.000 | 0.000 | 0.000 | 0.000 | 0.000 | 0.000 | 0.000 | 0.000 | 0.000 | 0.000 | 0.000 | 0.000 | 0.000 |
| Ca | 0.000 | 0.002 | 0.000 | 0.001 | 0.001 | 0.001 | 0.000 | 0.001 | 0.001 | 0.001 | 0.001 | 0.001 | 0.003 | 0.001 | 0.000 | 0.001 | 0.001 | 0.004 | 0.001 | 0.000 |
| Na | 0.025 | 0.024 | 0.026 | 0.025 | 0.027 | 0.027 | 0.024 | 0.023 | 0.027 | 0.031 | 0.023 | 0.020 | 0.055 | 0.031 | 0.025 | 0.027 | 0.038 | 0.032 | 0.029 | 0.034 |
| K | 0.476 | 0.470 | 0.484 | 0.475 | 0.469 | 0.485 | 0.472 | 0.468 | 0.477 | 0.468 | 0.485 | 0.483 | 0.461 | 0.465 | 0.470 | 0.461 | 0.462 | 0.473 | 0.470 | 0.443 |
| Sr | 0.000 | 0.000 | 0.000 | 0.000 | 0.000 | 0.000 | 0.000 | 0.000 | 0.000 | 0.000 | 0.000 | 0.000 | 0.000 | 0.000 | 0.000 | 0.000 | 0.000 | 0.000 | 0.000 | 0.000 |
| Ba | 0.000 | 0.000 | 0.000 | 0.000 | 0.000 | 0.000 | 0.000 | 0.000 | 0.000 | 0.000 | 0.000 | 0.000 | 0.000 | 0.000 | 0.000 | 0.000 | 0.000 | 0.000 | 0.000 | 0.000 |
| An | 0.0 | 0.2 | 0.0 | 0.1 | 0.1 | 0.1 | 0.0 | 0.1 | 0.1 | 0.1 | 0.1 | 0.1 | 0.3 | 0.1 | 0.0 | 0.1 | 0.1 | 0.3 | 0.1 | 0.0 |
| Ab | 4.9 | 4.8 | 5.0 | 5.0 | 5.4 | 5.2 | 4.9 | 4.7 | 5.3 | 6.2 | 4.5 | 4.1 | 10.6 | 6.3 | 5.0 | 5.6 | 7.6 | 6.3 | 5.8 | 7.0 |
| Or | 95.0 | 95.1 | 94.9 | 94.9 | 94.5 | 94.7 | 95.1 | 95.2 | 94.6 | 93.7 | 95.4 | 95.8 | 89.1 | 93.6 | 95.0 | 94.3 | 92.3 | 93.3 | 94.0 | 92.9 |
| Grt8-1 -fs02 | Grt8-1 -fs03 | Grt8-1 -fs04 | Grt8-1 -fs05 | Grt8-1 -fs06 | Grt8-1 -fs07 | Grt8-1 -fs08 | Grt8-1 -fs09 | Grt8-2 -fs01 | Grt8-2 -fs02 | Grt8-2 -fs03 | Grt8-2 -fs04 | Grt8-2 -fs06 | Grt3-2 -fs01 | Grt3-2 -fs02 | Grt3-2 -fs03 | Grt3-2 -fs04 | Grt3-2 -fs05 | Grt3-2 -fs06 | Grt3-2 -fs07 | Grt3-2 -fs08 | |
|---|---|---|---|---|---|---|---|---|---|---|---|---|---|---|---|---|---|---|---|---|---|
| CaO | 3.13 | 3.07 | 3.28 | 3.39 | 3.65 | 2.68 | 2.99 | 2.92 | 3.65 | 3.65 | 3.61 | 3.26 | 3.62 | 2.52 | 3.54 | 3.93 | 4.00 | 3.75 | 3.94 | 3.42 | 2.78 |
| Na2O | 9.68 | 9.50 | 10.02 | 9.80 | 7.11 | 9.69 | 9.49 | 9.55 | 9.52 | 9.44 | 9.66 | 8.40 | 8.60 | 9.69 | 9.72 | 6.71 | 8.37 | 9.63 | 7.98 | 8.56 | 7.96 |
| K2O | 0.12 | 0.18 | 0.19 | 0.10 | 0.16 | 0.15 | 0.17 | 0.14 | 0.16 | 0.13 | 0.14 | 0.13 | 0.09 | 0.33 | 0.13 | 0.17 | 0.15 | 0.17 | 0.18 | 0.13 | 0.74 |
| SrO | |||||||||||||||||||||
| TFeO | |||||||||||||||||||||
| MgO | |||||||||||||||||||||
| SiO2 | 64.99 | 64.61 | 65.70 | 64.23 | 65.06 | 65.05 | 65.12 | 64.05 | 64.36 | 64.72 | 64.10 | 65.01 | 65.56 | 64.62 | 65.70 | 66.41 | 66.00 | 65.07 | 66.07 | 65.81 | 64.70 |
| MnO | |||||||||||||||||||||
| Al2O3 | 22.68 | 22.89 | 23.32 | 23.55 | 24.11 | 22.59 | 23.24 | 22.46 | 23.25 | 23.66 | 22.67 | 23.58 | 24.13 | 21.95 | 23.07 | 23.74 | 23.50 | 23.11 | 22.97 | 23.41 | 23.11 |
| BaO | |||||||||||||||||||||
| Total | 100.59 | 100.25 | 102.52 | 101.07 | 100.10 | 100.16 | 101.00 | 99.13 | 100.94 | 101.62 | 100.17 | 100.38 | 102.01 | 99.10 | 102.15 | 100.95 | 102.01 | 101.72 | 101.13 | 101.33 | 99.29 |
| Number of cation on basis of 8 oxygens | |||||||||||||||||||||
| Si | 5.686 | 5.671 | 5.652 | 5.607 | 5.668 | 5.706 | 5.668 | 5.684 | 5.625 | 5.615 | 5.648 | 5.671 | 5.638 | 5.733 | 5.668 | 5.725 | 5.676 | 5.645 | 5.720 | 5.690 | 5.706 |
| Al | 1.754 | 1.776 | 1.774 | 1.817 | 1.857 | 1.752 | 1.788 | 1.762 | 1.796 | 1.815 | 1.765 | 1.818 | 1.834 | 1.722 | 1.759 | 1.809 | 1.787 | 1.772 | 1.758 | 1.789 | 1.802 |
| Mg | 0.000 | 0.000 | 0.000 | 0.000 | 0.000 | 0.000 | 0.000 | 0.000 | 0.000 | 0.000 | 0.000 | 0.000 | 0.000 | 0.000 | 0.000 | 0.000 | 0.000 | 0.000 | 0.000 | 0.000 | 0.000 |
| Fe | 0.000 | 0.000 | 0.000 | 0.000 | 0.000 | 0.000 | 0.000 | 0.000 | 0.000 | 0.000 | 0.000 | 0.000 | 0.000 | 0.000 | 0.000 | 0.000 | 0.000 | 0.000 | 0.000 | 0.000 | 0.000 |
| Mn | 0.000 | 0.000 | 0.000 | 0.000 | 0.000 | 0.000 | 0.000 | 0.000 | 0.000 | 0.000 | 0.000 | 0.000 | 0.000 | 0.000 | 0.000 | 0.000 | 0.000 | 0.000 | 0.000 | 0.000 | 0.000 |
| Ca | 0.147 | 0.144 | 0.151 | 0.158 | 0.170 | 0.126 | 0.139 | 0.139 | 0.171 | 0.170 | 0.170 | 0.152 | 0.167 | 0.120 | 0.163 | 0.181 | 0.184 | 0.174 | 0.182 | 0.159 | 0.132 |
| Na | 0.410 | 0.404 | 0.418 | 0.415 | 0.300 | 0.412 | 0.400 | 0.411 | 0.403 | 0.397 | 0.412 | 0.355 | 0.358 | 0.417 | 0.406 | 0.280 | 0.349 | 0.405 | 0.335 | 0.359 | 0.340 |
| K | 0.003 | 0.005 | 0.005 | 0.003 | 0.005 | 0.004 | 0.005 | 0.004 | 0.004 | 0.004 | 0.004 | 0.004 | 0.003 | 0.009 | 0.003 | 0.005 | 0.004 | 0.005 | 0.005 | 0.003 | 0.021 |
| Sr | 0.000 | 0.000 | 0.000 | 0.000 | 0.000 | 0.000 | 0.000 | 0.000 | 0.000 | 0.000 | 0.000 | 0.000 | 0.000 | 0.000 | 0.000 | 0.000 | 0.000 | 0.000 | 0.000 | 0.000 | 0.000 |
| Ba | 0.000 | 0.000 | 0.000 | 0.000 | 0.000 | 0.000 | 0.000 | 0.000 | 0.000 | 0.000 | 0.000 | 0.000 | 0.000 | 0.000 | 0.000 | 0.000 | 0.000 | 0.000 | 0.000 | 0.000 | 0.000 |
| An | 15.0 | 15.0 | 15.2 | 15.9 | 21.9 | 13.1 | 14.7 | 14.3 | 17.3 | 17.5 | 17.0 | 17.5 | 18.8 | 12.3 | 16.6 | 24.1 | 20.7 | 17.5 | 21.2 | 18.0 | 15.4 |
| Ab | 84.2 | 84.0 | 83.8 | 83.5 | 77.0 | 86.0 | 84.3 | 84.8 | 81.8 | 81.8 | 82.3 | 81.6 | 80.6 | 85.8 | 82.7 | 74.6 | 78.4 | 81.5 | 77.7 | 81.3 | 79.7 |
| Or | 0.7 | 1.0 | 1.0 | 0.6 | 1.2 | 0.9 | 1.0 | 0.8 | 0.9 | 0.8 | 0.8 | 0.9 | 0.6 | 1.9 | 0.7 | 1.2 | 0.9 | 0.9 | 1.1 | 0.8 | 4.9 |
| Grt3-3 -fs01 | Grt3-3 -fs02 | Grt3-3 -fs03 | Grt3-3 -fs04 | Grt3-6 -fs01 | Grt3-6 -fs02 | Grt3-6 -fs03 | Grt3-6 -fs04 | Grt3-6 -fs06 | Grt3-8 -fs01 | Grt3-8 -fs02 | Grt3-8 -fs03 | Grt3-8 -fs04 | Grt3-8 -fs05 | Grt3-8 -fs06 | Grt3-8 -fs07 | ||||||
| CaO | 3.58 | 3.54 | 3.33 | 3.17 | 3.69 | 3.52 | 3.60 | 3.62 | 3.59 | 4.00 | 3.79 | 3.88 | 4.28 | 3.97 | 3.87 | 3.91 | |||||
| Na2O | 8.47 | 7.73 | 8.91 | 9.19 | 8.83 | 9.85 | 7.93 | 8.26 | 8.90 | 8.16 | 8.89 | 7.54 | 9.31 | 8.90 | 8.83 | 9.52 | |||||
| K2O | 0.15 | 0.12 | 0.12 | 0.12 | 0.18 | 0.10 | 0.14 | 0.16 | 0.13 | 0.18 | 0.16 | 0.18 | 0.15 | 0.12 | 0.16 | 0.20 | |||||
| SrO | |||||||||||||||||||||
| TFeO | |||||||||||||||||||||
| MgO | |||||||||||||||||||||
| SiO2 | 66.55 | 66.89 | 67.75 | 66.29 | 65.18 | 64.62 | 65.97 | 65.88 | 66.04 | 65.32 | 64.39 | 65.27 | 63.68 | 63.52 | 63.94 | 63.39 | |||||
| MnO | |||||||||||||||||||||
| Al2O3 | 23.09 | 23.42 | 22.32 | 22.36 | 22.92 | 23.03 | 23.15 | 23.14 | 23.20 | 23.31 | 23.22 | 23.57 | 23.63 | 23.21 | 23.13 | 23.37 | |||||
| BaO | |||||||||||||||||||||
| Total | 101.84 | 101.70 | 102.42 | 101.14 | 100.79 | 101.12 | 100.78 | 101.07 | 101.84 | 100.97 | 100.46 | 100.44 | 101.05 | 99.72 | 99.92 | 100.39 | |||||
| Number of cation on basis of 8 oxygens | |||||||||||||||||||||
| Si | 5.723 | 5.737 | 5.789 | 5.749 | 5.683 | 5.639 | 5.721 | 5.708 | 5.692 | 5.675 | 5.642 | 5.682 | 5.573 | 5.614 | 5.634 | 5.584 | |||||
| Al | 1.755 | 1.776 | 1.686 | 1.714 | 1.766 | 1.777 | 1.774 | 1.772 | 1.768 | 1.790 | 1.798 | 1.814 | 1.828 | 1.814 | 1.802 | 1.820 | |||||
| Mg | 0.000 | 0.000 | 0.000 | 0.000 | 0.000 | 0.000 | 0.000 | 0.000 | 0.000 | 0.000 | 0.000 | 0.000 | 0.000 | 0.000 | 0.000 | 0.000 | |||||
| Fe | 0.000 | 0.000 | 0.000 | 0.000 | 0.000 | 0.000 | 0.000 | 0.000 | 0.000 | 0.000 | 0.000 | 0.000 | 0.000 | 0.000 | 0.000 | 0.000 | |||||
| Mn | 0.000 | 0.000 | 0.000 | 0.000 | 0.000 | 0.000 | 0.000 | 0.000 | 0.000 | 0.000 | 0.000 | 0.000 | 0.000 | 0.000 | 0.000 | 0.000 | |||||
| Ca | 0.165 | 0.162 | 0.152 | 0.147 | 0.172 | 0.164 | 0.167 | 0.168 | 0.166 | 0.186 | 0.178 | 0.181 | 0.200 | 0.188 | 0.182 | 0.185 | |||||
| Na | 0.353 | 0.321 | 0.369 | 0.386 | 0.373 | 0.417 | 0.333 | 0.347 | 0.372 | 0.344 | 0.378 | 0.318 | 0.395 | 0.381 | 0.377 | 0.406 | |||||
| K | 0.004 | 0.003 | 0.003 | 0.003 | 0.005 | 0.003 | 0.004 | 0.005 | 0.003 | 0.005 | 0.004 | 0.005 | 0.004 | 0.003 | 0.004 | 0.005 | |||||
| Sr | 0.000 | 0.000 | 0.000 | 0.000 | 0.000 | 0.000 | 0.000 | 0.000 | 0.000 | 0.000 | 0.000 | 0.000 | 0.000 | 0.000 | 0.000 | 0.000 | |||||
| Ba | 0.000 | 0.000 | 0.000 | 0.000 | 0.000 | 0.000 | 0.000 | 0.000 | 0.000 | 0.000 | 0.000 | 0.000 | 0.000 | 0.000 | 0.000 | 0.000 | |||||
| An | 18.8 | 20.0 | 17.0 | 15.9 | 18.6 | 16.4 | 19.9 | 19.3 | 18.1 | 21.1 | 18.9 | 21.9 | 20.1 | 19.7 | 19.3 | 18.3 | |||||
| Ab | 80.3 | 79.2 | 82.3 | 83.4 | 80.4 | 83.1 | 79.2 | 79.7 | 81.2 | 77.8 | 80.2 | 77.0 | 79.1 | 79.7 | 79.8 | 80.6 | |||||
| Or | 0.9 | 0.8 | 0.8 | 0.7 | 1.1 | 0.6 | 0.9 | 1.0 | 0.8 | 1.1 | 0.9 | 1.2 | 0.8 | 0.7 | 0.9 | 1.1 | |||||
| Grt3-1 -ms01 | Grt3-1 -ms02 | Grt3-1 -ms03 | Grt3-1 -ms04 | Grt3-1 -ms05 | Grt3-1 -ms06 | Grt3-1 -ms07 | Grt3-3 -ms01 | Grt3-3 -ms02 | Grt3-3 -ms04 | Grt3-3 -ms06 | Grt3-3 -ms07 | Grt3-3 -ms08 | Grt3-3 -ms09 | Grt3-3 -ms10 | Grt3-3 -ms11 | Grt3-3 -ms12 | Grt3-3 -ms13 | Grt3-6 -ms01 | Grt3-6 -ms02 | Grt3-6 -ms03 | Grt3-6 -ms04 | |
|---|---|---|---|---|---|---|---|---|---|---|---|---|---|---|---|---|---|---|---|---|---|---|
| SiO2 | 37.512 | 36.417 | 37.188 | 36.342 | 37.424 | 37.667 | 36.166 | 36.344 | 38.646 | 37.178 | 37.884 | 37.184 | 38.548 | 35.189 | 37.295 | 36.984 | 35.891 | 37.385 | 38.104 | 38.663 | 37.11 | 37.509 |
| TiO2 | 2.547 | 2.994 | 2.657 | 2.731 | 2.663 | 2.574 | 2.866 | 2.399 | 2.314 | 2.645 | 3.06 | 3.024 | 2.596 | 2.058 | 2.673 | 2.73 | 2.919 | 2.736 | 3.586 | 3.817 | 3.479 | 3.536 |
| Al2O3 | 15.299 | 15.548 | 15.843 | 15.789 | 13.959 | 15.272 | 15.474 | 15.725 | 15.99 | 15.1 | 15.565 | 15.06 | 16.669 | 19.128 | 16.605 | 15.403 | 14.672 | 15.376 | 16.037 | 15.856 | 15.883 | 16.038 |
| FeO | 20.427 | 19.903 | 19.169 | 20.682 | 20.507 | 19.56 | 20.307 | 20.457 | 18.94 | 18.25 | 19.449 | 20.196 | 18.327 | 16.111 | 19.864 | 20.587 | 19.835 | 20.987 | 19.921 | 18.693 | 20.427 | 19.627 |
| MnO | 0.226 | 0.218 | 0.214 | 0.213 | 0.28 | 0.222 | 0.252 | 0.224 | 0.233 | 0.19 | 0.251 | 0.267 | 0.218 | 0.181 | 0.27 | 0.249 | 0.283 | 0.262 | 0.252 | 0.211 | 0.198 | 0.162 |
| MgO | 8.765 | 8.47 | 8.752 | 9.126 | 8.945 | 8.639 | 8.734 | 9.49 | 9.04 | 9.43 | 8.488 | 8.277 | 8.045 | 6.535 | 8.341 | 9.045 | 8.568 | 8.675 | 8.546 | 8.262 | 8.993 | 8.829 |
| CaO | 0.118 | 0.18 | 0.182 | 0.143 | 0.139 | 0.265 | 0.1 | 0.193 | 0.31 | 0.332 | 0.129 | 0.316 | 0.273 | 0.18 | 0.082 | 0.142 | 0.29 | 0.202 | 0.276 | 0.081 | 0.135 | 0.081 |
| Na2O | 0.097 | 0.054 | 0.085 | 0.096 | 0.089 | 0.065 | 0.089 | 0.065 | 0.078 | 0.089 | 0.095 | 0.081 | 0.108 | 0.033 | 0.076 | 0.11 | 0.159 | 0.121 | 0.104 | 0.073 | 0.078 | 0.078 |
| K2O | 9.25 | 9.239 | 8.879 | 9.583 | 9.627 | 8.713 | 9.516 | 9.699 | 9.025 | 8.992 | 9.404 | 9.195 | 8.297 | 7.696 | 9.059 | 9.231 | 8.835 | 9.448 | 9.141 | 9.302 | 9.852 | 9.425 |
| Total | 94.241 | 93.023 | 92.969 | 94.705 | 93.633 | 92.977 | 93.504 | 94.596 | 94.576 | 92.206 | 94.325 | 93.6 | 93.081 | 87.111 | 94.265 | 94.481 | 91.452 | 95.192 | 95.967 | 94.958 | 96.155 | 95.285 |
| Number of cation on basis of 22 oxygens | ||||||||||||||||||||||
| Si | 2.833 | 3.458 | 2.898 | 2.853 | 2.889 | 2.812 | 2.927 | 2.927 | 2.832 | 2.815 | 2.937 | 2.907 | 2.909 | 2.895 | 2.952 | 2.851 | 2.865 | 2.858 | 2.865 | 2.873 | 2.875 | 2.927 |
| AlⅣ | 1.167 | 0.542 | 1.102 | 1.147 | 1.111 | 1.188 | 1.073 | 1.073 | 1.168 | 1.185 | 1.063 | 1.093 | 1.091 | 1.105 | 1.048 | 1.149 | 1.135 | 1.142 | 1.135 | 1.127 | 1.125 | 1.073 |
| AlⅥ | 0.028 | 1.648 | 0.292 | 0.288 | 0.340 | 0.252 | 0.214 | 0.326 | 0.260 | 0.251 | 0.370 | 0.298 | 0.318 | 0.277 | 0.456 | 0.677 | 0.369 | 0.260 | 0.245 | 0.266 | 0.301 | 0.341 |
| Ti | 0.129 | 0.000 | 0.148 | 0.176 | 0.155 | 0.159 | 0.157 | 0.151 | 0.169 | 0.140 | 0.132 | 0.156 | 0.177 | 0.177 | 0.150 | 0.125 | 0.154 | 0.159 | 0.175 | 0.158 | 0.204 | 0.217 |
| Fe3+ | 0.129 | 0.124 | 0.280 | 0.281 | 0.323 | 0.211 | 0.240 | 0.341 | 0.233 | 0.189 | 0.343 | 0.303 | 0.322 | 0.300 | 0.440 | 0.489 | 0.322 | 0.254 | 0.268 | 0.255 | 0.344 | 0.397 |
| Fe2+ | 0.638 | 0.000 | 1.040 | 1.023 | 0.922 | 1.127 | 1.101 | 0.931 | 1.097 | 1.136 | 0.861 | 0.890 | 0.927 | 1.015 | 0.734 | 0.603 | 0.954 | 1.076 | 1.056 | 1.093 | 0.913 | 0.787 |
| Mn | 0.003 | 0.000 | 0.015 | 0.014 | 0.014 | 0.014 | 0.019 | 0.015 | 0.017 | 0.015 | 0.015 | 0.013 | 0.016 | 0.018 | 0.014 | 0.012 | 0.018 | 0.016 | 0.019 | 0.017 | 0.016 | 0.014 |
| Mg | 1.841 | 0.211 | 1.010 | 0.989 | 1.014 | 1.053 | 1.043 | 1.001 | 1.020 | 1.096 | 1.024 | 1.099 | 0.972 | 0.961 | 0.918 | 0.789 | 0.955 | 1.042 | 1.020 | 0.994 | 0.961 | 0.932 |
| Ca | 0.025 | 0.000 | 0.010 | 0.015 | 0.015 | 0.012 | 0.012 | 0.022 | 0.008 | 0.016 | 0.025 | 0.028 | 0.011 | 0.026 | 0.022 | 0.016 | 0.007 | 0.012 | 0.025 | 0.017 | 0.022 | 0.007 |
| Na | 0.032 | 0.039 | 0.015 | 0.008 | 0.013 | 0.014 | 0.013 | 0.010 | 0.014 | 0.010 | 0.011 | 0.013 | 0.014 | 0.012 | 0.016 | 0.005 | 0.011 | 0.016 | 0.025 | 0.018 | 0.015 | 0.011 |
| K | 0.913 | 0.888 | 0.912 | 0.923 | 0.880 | 0.946 | 0.961 | 0.864 | 0.951 | 0.959 | 0.875 | 0.897 | 0.921 | 0.913 | 0.810 | 0.795 | 0.888 | 0.910 | 0.900 | 0.926 | 0.880 | 0.898 |
| Grt8-1 -ms01 | Grt8-1 -ms02 | Grt8-1 -ms03 | Grt8-1 -ms04 | Grt8-1 -ms05 | Grt8-1 -ms06 | Grt8-1 -ms07 | Grt8-1 -ms08 | Grt8-3 -ms01 | Grt8-3 -ms02 | Grt8-3 -ms03 | Grt8-3 -ms04 | Grt8-3 -ms05 | Grt8-3 -ms06 | Grt8-5 -ms01 | Grt8-5 -ms02 | Grt8-5 -ms03 | Grt8-5 -ms04 | Grt8-5 -ms05 | Grt8-5 -ms06 | Grt8-5 -ms07 | Grt8-5 -ms08 | |
| SiO2 | 46.568 | 47.913 | 45.736 | 46.328 | 45.586 | 46.436 | 47.622 | 47.476 | 36.007 | 37.312 | 38.717 | 39.669 | 38.79 | 39.312 | 38.683 | 37.77 | 37.651 | 39.147 | 38.832 | 38.474 | 38.011 | 38.31 |
| TiO2 | 1.106 | 1.021 | 1.089 | 0.988 | 1.444 | 0.712 | 0.435 | 0.41 | 2.567 | 2.603 | 2.652 | 2.43 | 2.555 | 2.708 | 2.49 | 3.608 | 2.887 | 3.377 | 3.615 | 2.806 | 3.821 | 3.836 |
| Al2O3 | 29.682 | 29.113 | 29.725 | 29.342 | 29.037 | 29.447 | 30.081 | 30.942 | 14.599 | 15.062 | 15.274 | 16.682 | 15.338 | 16.827 | 17.12 | 15.606 | 15.604 | 15.778 | 15.419 | 16 | 16.315 | 15.844 |
| FeO | 4.451 | 5.048 | 4.95 | 5.009 | 4.875 | 5.623 | 5.254 | 5.515 | 18.37 | 18.689 | 18.977 | 17.017 | 17.374 | 17.353 | 18.587 | 19.489 | 20.461 | 17.878 | 18.553 | 17.535 | 17.189 | 18.617 |
| MnO | 0.046 | 0.016 | 0.072 | 0.036 | 0.038 | 0.048 | 0.019 | 0.064 | 0.299 | 0.314 | 0.234 | 0.228 | 0.305 | 0.223 | 0.301 | 0.306 | 0.283 | 0.266 | 0.287 | 0.236 | 0.2 | 0.217 |
| MgO | 1.586 | 1.746 | 1.411 | 1.418 | 1.519 | 1.659 | 1.582 | 1.662 | 8.473 | 8.096 | 8.276 | 7.325 | 7.537 | 7.104 | 7.598 | 8.116 | 8.108 | 8.382 | 8.021 | 7.928 | 7.576 | 7.522 |
| CaO | 0.005 | 0.008 | 0.023 | 0.019 | 0.005 | 0.128 | 0.13 | 0.081 | 0.105 | 0.076 | 0.133 | 0.118 | 0.086 | 0.168 | 0.096 | 0.123 | 0.102 | 0.134 | 0.141 | |||
| Na2O | 0.189 | 0.13 | 0.173 | 0.171 | 0.168 | 0.145 | 0.083 | 0.121 | 0.088 | 0.082 | 0.079 | 0.061 | 0.054 | 0.042 | 0.056 | 0.04 | 0.07 | 0.082 | 0.072 | 0.053 | 0.014 | 0.139 |
| K2O | 11.513 | 11.665 | 11.654 | 11.521 | 11.346 | 11.47 | 11.491 | 11.355 | 8.591 | 9.037 | 8.939 | 8.219 | 8.931 | 7.072 | 8.933 | 9.389 | 9.161 | 9.474 | 8.885 | 8.665 | 8.48 | 9.057 |
| Total | 95.146 | 96.66 | 94.833 | 94.832 | 94.013 | 95.54 | 96.567 | 97.55 | 89.122 | 91.325 | 93.229 | 91.736 | 90.96 | 90.774 | 93.886 | 94.41 | 94.393 | 94.48 | 93.807 | 91.799 | 91.74 | 93.683 |
| Number of cation on basis of 22 oxygens | ||||||||||||||||||||||
| Si | 3.183 | 3.229 | 3.152 | 3.187 | 3.165 | 3.179 | 3.209 | 3.169 | 2.920 | 2.950 | 2.985 | 3.046 | 3.039 | 3.036 | 2.947 | 2.899 | 2.901 | 2.966 | 2.967 | 2.984 | 2.944 | 2.938 |
| AlⅣ | 0.817 | 0.771 | 0.848 | 0.813 | 0.835 | 0.821 | 0.791 | 0.831 | 1.080 | 1.050 | 1.015 | 0.954 | 0.961 | 0.964 | 1.053 | 1.101 | 1.099 | 1.034 | 1.033 | 1.016 | 1.056 | 1.062 |
| AlⅥ | 1.574 | 1.541 | 1.567 | 1.567 | 1.540 | 1.555 | 1.597 | 1.604 | 0.316 | 0.354 | 0.372 | 0.556 | 0.456 | 0.568 | 0.484 | 0.310 | 0.318 | 0.375 | 0.356 | 0.447 | 0.433 | 0.370 |
| Ti | 0.057 | 0.052 | 0.056 | 0.051 | 0.075 | 0.037 | 0.022 | 0.021 | 0.157 | 0.155 | 0.154 | 0.140 | 0.151 | 0.157 | 0.143 | 0.208 | 0.167 | 0.193 | 0.208 | 0.164 | 0.223 | 0.221 |
| Fe3+ | 0.254 | 0.284 | 0.285 | 0.288 | 0.283 | 0.322 | 0.296 | 0.308 | 0.323 | 0.345 | 0.387 | 0.534 | 0.448 | 0.608 | 0.420 | 0.350 | 0.321 | 0.399 | 0.431 | 0.446 | 0.491 | 0.422 |
| Fe2+ | 0.000 | 0.000 | 0.000 | 0.000 | 0.000 | 0.000 | 0.000 | 0.000 | 0.923 | 0.891 | 0.837 | 0.558 | 0.691 | 0.513 | 0.764 | 0.901 | 0.997 | 0.733 | 0.755 | 0.691 | 0.622 | 0.772 |
| Mn | 0.003 | 0.001 | 0.004 | 0.002 | 0.002 | 0.003 | 0.001 | 0.004 | 0.021 | 0.021 | 0.015 | 0.015 | 0.020 | 0.015 | 0.019 | 0.020 | 0.018 | 0.017 | 0.019 | 0.016 | 0.013 | 0.014 |
| Mg | 0.162 | 0.175 | 0.145 | 0.145 | 0.157 | 0.169 | 0.159 | 0.165 | 1.024 | 0.954 | 0.951 | 0.839 | 0.880 | 0.818 | 0.863 | 0.929 | 0.931 | 0.947 | 0.914 | 0.917 | 0.875 | 0.860 |
| Ca | 0.000 | 0.001 | 0.002 | 0.001 | 0.000 | 0.000 | 0.000 | 0.000 | 0.011 | 0.011 | 0.007 | 0.009 | 0.006 | 0.011 | 0.010 | 0.007 | 0.014 | 0.008 | 0.010 | 0.008 | 0.011 | 0.012 |
| Na | 0.025 | 0.017 | 0.023 | 0.023 | 0.023 | 0.019 | 0.011 | 0.016 | 0.014 | 0.013 | 0.012 | 0.009 | 0.008 | 0.006 | 0.008 | 0.006 | 0.010 | 0.012 | 0.011 | 0.008 | 0.002 | 0.021 |
| K | 1.004 | 1.003 | 1.025 | 1.011 | 1.005 | 1.002 | 0.988 | 0.967 | 0.889 | 0.912 | 0.879 | 0.805 | 0.893 | 0.697 | 0.868 | 0.919 | 0.900 | 0.916 | 0.866 | 0.857 | 0.838 | 0.886 |
| No. | La | Ce | Pr | Nd | Sm | Eu | Gd | Tb | Dy | Ho | Er | Tm | Yb | Lu | Y | Ti | t/℃ [42] | (Ce/Ce*)D [43] | logfO2 [45] | △FMQ [45] |
|---|---|---|---|---|---|---|---|---|---|---|---|---|---|---|---|---|---|---|---|---|
| BR0101Grt1-05 | 0.01 | 10.39 | 0.04 | 0.87 | 2.66 | 0.24 | 15.51 | 6.08 | 77.30 | 32.03 | 150.74 | 32.78 | 307.81 | 63.94 | 957.16 | 4.49 | 675.1 | 383.1 | −9.6 | 7.9 |
| BR0101Grt1-06 | 0.22 | 49.94 | 0.21 | 2.13 | 5.36 | 1.27 | 32.86 | 11.94 | 146.11 | 55.28 | 240.64 | 46.74 | 413.50 | 84.28 | 1513.41 | 3.63 | 659.0 | 560.7 | −9.1 | 8.9 |
| BR0101Grt1-07 | 0.13 | 27.75 | 0.29 | 3.99 | 7.62 | 3.49 | 40.70 | 13.41 | 163.41 | 64.89 | 299.34 | 64.48 | 615.10 | 132.45 | 1890.88 | 21.77 | 814.2 | 190.1 | −5.2 | 9.0 |
| BR0101Grt1-15 | 0.63 | 88.37 | 0.94 | 10.03 | 13.87 | 4.47 | 62.97 | 20.56 | 239.48 | 89.35 | 382.39 | 74.31 | 658.28 | 135.13 | 2380.80 | 8.13 | 723.0 | 177.5 | −9.8 | 6.4 |
| BR0101Grt1-17 | 0.26 | 161.18 | 0.39 | 4.73 | 9.97 | 2.61 | 71.27 | 26.37 | 336.42 | 132.64 | 588.23 | 115.67 | 1005.19 | 199.90 | 3637.32 | 3.06 | 646.3 | 971.1 | −7.8 | 10.5 |
| BR0101Grt1-26 | 0.41 | 184.47 | 0.69 | 6.19 | 11.69 | 3.74 | 66.89 | 25.61 | 325.23 | 134.75 | 609.07 | 121.47 | 1079.09 | 217.81 | 3838.12 | 5.38 | 689.1 | 874.7 | −5.7 | 11.5 |
| BR0101Grt1-32 | 0.20 | 17.83 | 0.27 | 2.20 | 3.99 | 0.80 | 20.21 | 7.06 | 86.07 | 34.79 | 161.39 | 33.70 | 315.24 | 68.03 | 1017.32 | 8.03 | 721.8 | 224.5 | −9.0 | 7.3 |
| BR0101Grt1-35 | 0.00 | 7.49 | 0.09 | 1.79 | 3.76 | 0.53 | 25.91 | 8.91 | 110.30 | 42.79 | 192.76 | 39.88 | 359.63 | 74.73 | 1224.30 | 7.90 | 720.5 | 116.6 | −11.5 | 4.8 |
| BR0101Grt1-39 | 0.80 | 93.02 | 0.58 | 6.05 | 13.51 | 3.77 | 77.29 | 26.39 | 298.01 | 108.37 | 448.54 | 84.63 | 703.25 | 137.54 | 2797.50 | 5.60 | 692.3 | 284.1 | −9.7 | 7.3 |
Disclaimer/Publisher’s Note: The statements, opinions and data contained in all publications are solely those of the individual author(s) and contributor(s) and not of MDPI and/or the editor(s). MDPI and/or the editor(s) disclaim responsibility for any injury to people or property resulting from any ideas, methods, instructions or products referred to in the content. |
© 2024 by the authors. Licensee MDPI, Basel, Switzerland. This article is an open access article distributed under the terms and conditions of the Creative Commons Attribution (CC BY) license (https://creativecommons.org/licenses/by/4.0/).
Share and Cite
Jiang, J.; Xiang, W.; Hu, P.; Li, Y.; Wu, F.; Zeng, G.; Guo, X.; Zhang, Z.; Bai, Y. Petrogenesis of the Newly Discovered Neoproterozoic Adakitic Rock in Bure Area, Western Ethiopia Shield: Implication for the Pan-African Tectonic Evolution. Minerals 2024, 14, 408. https://doi.org/10.3390/min14040408
Jiang J, Xiang W, Hu P, Li Y, Wu F, Zeng G, Guo X, Zhang Z, Bai Y. Petrogenesis of the Newly Discovered Neoproterozoic Adakitic Rock in Bure Area, Western Ethiopia Shield: Implication for the Pan-African Tectonic Evolution. Minerals. 2024; 14(4):408. https://doi.org/10.3390/min14040408
Chicago/Turabian StyleJiang, Junsheng, Wenshuai Xiang, Peng Hu, Yulin Li, Fafu Wu, Guoping Zeng, Xinran Guo, Zicheng Zhang, and Yang Bai. 2024. "Petrogenesis of the Newly Discovered Neoproterozoic Adakitic Rock in Bure Area, Western Ethiopia Shield: Implication for the Pan-African Tectonic Evolution" Minerals 14, no. 4: 408. https://doi.org/10.3390/min14040408
APA StyleJiang, J., Xiang, W., Hu, P., Li, Y., Wu, F., Zeng, G., Guo, X., Zhang, Z., & Bai, Y. (2024). Petrogenesis of the Newly Discovered Neoproterozoic Adakitic Rock in Bure Area, Western Ethiopia Shield: Implication for the Pan-African Tectonic Evolution. Minerals, 14(4), 408. https://doi.org/10.3390/min14040408