Article

Hydrothermal Alteration Processes of Xincheng Gold Deposit Jiaodong Peninsula, China: Constraints from Composition of Hydrothermal Rutile

1
State Key Laboratory of Geological Processes and Mineral Resources, Frontiers Science Center for Deep Time Digital Earth, China University of Geosciences, Beijing 100083, China
2
Ministry of Natural Resources Key Laboratory of Gold Mineralization Processes and Resources Utilization, Key Laboratory of Metallogenic-Geologic Processes and Comprehensive Utilization of Minerals Resources in Shandong Province, Shandong Institute of Geological Sciences, Jinan 250013, China
3
Institute of Geological Research, Shandong Gold Group Co., Ltd., Jinan 250101, China
*
Author to whom correspondence should be addressed.
Minerals 2024, 14(4), 417; https://doi.org/10.3390/min14040417
Submission received: 21 March 2024 / Revised: 10 April 2024 / Accepted: 16 April 2024 / Published: 18 April 2024
(This article belongs to the Special Issue The Formation and Evolution of Gold Deposits in China)

Abstract

:
Delineating the process of hydrothermal alteration is crucial for effectively enhancing exploration strategies and better understanding the gold mineralization process. Rutile, with its capacity to accommodate a wide range of trace elements including high-field-strength elements and base metals, serves as a reliable fluid tracer in ore systems. As one of the most significant gold ore concentrations globally, Jiaodong boasts a gold reserve exceeding 5500 t. The Xincheng gold deposit is a world-class high-grade mine, boasting a proven gold reserve exceeding 200 t, and stands as one of the largest altered-type gold deposits in the vast gold province of the Jiaodong Peninsula, Eastern China. In this study, rutile (Rt1,2,3) was identified in the K-feldspar alteration, sericitization, and pyrite–sericite–quartz alteration stages of the Xincheng gold deposit in Jiaodong based on petrographic characteristics. Rt1 coexists with hydrothermal K-feldspar and quartz, while Rt2 coexists with minerals such as sericite, quartz, muscovite, and pyrite. Rt3 is widely distributed in hydrothermal veins and is primarily associated with minerals including quartz, pyrite, chalcopyrite, and sericite. Raman spectroscopy, EPMA, and LA-ICP-MS analysis were conducted to investigate the characteristics and evolution of altered hydrothermal fluids. This study indicates that the Zr vs. W and Nb/V vs. W diagrams suggest that Rt1 is of magmatic–hydrothermal origin, while Rt2 and Rt3 are of metamorphic–hydrothermal origin. Notably, the W content in Rt2 and Rt3 is significantly higher than in Rt1 (<100 ppm), suggesting a close relationship between the W content in rutile and mineralization. The three types of rutile exhibit significantly different concentrations of trace elements such as W, V, Nb, Zr, Sn, and Fe, displaying distinct bright spots and elemental zoning characteristics in backscattered electron images and surface scans. These features arise from the isomorphic substitution of Ti4+. While Rt1 exhibits no significant element exchange with the hydrothermal fluids, Rt2 and Rt3 show a stronger substitution of W, Nb, V, and Fe, indicating a gradual enrichment of F and Cl in the fluids. This process activates and transports these elements into the fluids, leading to their continuous accumulation within the system. From Rt1 to Rt3, the increasing concentrations of Fe and W, along with the negative Eu anomaly, suggest a decrease in fluid temperature and oxygen fugacity during the alteration and mineralization process. The gradual increase in the contents of REEs and high-field-strength elements such as W, V, Nb, and Sn indicates that the hydrothermal fluids are enriched in F and Cl, exhibiting weak acidity. The nature of the fluids during hydrothermal alteration is closely related to the composition of rutile, making it a promising tool for studying hydrothermal alteration and related mineralization processes.

1. Introduction

The Jiaodong gold province is the only known giant late Mesozoic gold ore concentration area globally that is located within Precambrian terranes, making it China’s most significant gold metallogenic province and a world-renowned producer of gold resources. The currently proven gold resources in this area have exceeded 5500 t [1], all of which are located within hydrothermal alteration zones, indicating a clear genetic link between gold mineralization and hydrothermal alteration. The essence of hydrothermal alteration is the water–rock reaction between fluids and surrounding rocks. The study of fluid–rock reaction processes is crucial for revealing element migration patterns during hydrothermal alteration, analyzing the mechanisms of hydrothermal alteration, and exploring the evolution of hydrothermal fluids, the activation, migration, and precipitation mechanisms of ore-forming elements [2]. Despite previous studies on the hydrothermal alteration of gold deposits in Jiaodong, which primarily focused on the major and trace element composition of different altered rocks to reveal the patterns of element migration between various alteration zones [2,3,4,5,6,7], it has been found that the hydrothermal alteration in Jiaodong gold deposits exhibits multi-stage superposition characteristics with complex mineral microstructures. However, the use of bulk mineral analysis to obtain results such as major and trace elements, isotopes are average values for different stages, which may differ from their actual geological significance, cannot accurately constrain the hydrothermal alteration process or mineralization process [8,9,10,11,12,13]. Therefore, it is necessary to conduct detailed studies on the hydrothermal alteration process of typical gold deposits in the Jiaodong area, aiming to provide insights into the mineralization system theory and effective exploration of gold deposits.
Rutile is ubiquitously found in various types of rocks [14,15,16,17,18,19] and also forms in numerous hydrothermal deposits, such as orogenic gold deposits [20,21,22,23,24,25,26,27]. Due to its unique crystal structure, Ti ions often undergo isomorphic substitution with various trace elements of different valences [28,29,30,31], enriching rutile with trace elements and HFSEs such as W, Sn, Ta, Hf, Sb, Nb, and U [16,32,33,34,35,36]. The content of these trace elements, especially HFSEs, and their relationship with Ti substitution in rutile can provide insights into geological evolution and alteration–mineralization processes [17,21,28,37,38,39,40,41]. Furthermore, trace elements such as Mg, Al, Nb, Cr, Ta, U, Pb, Sb, W, V, Sn, Fe, Zr, REEs, and Mn can reveal information about the origin of rutile, chronology, mineralization processes, fluid characteristics, properties of surrounding rocks, and mineralization systems [24,26,30,31,35,36,42,43,44,45].
Addressing the aforementioned issues, this study focuses on the Xincheng gold deposit in the Jiaodong Peninsula as the research subject. Previous research has explored various aspects of the Xincheng gold deposit, including alteration types, mineralization patterns, alteration–mineralization horizontal zoning characteristics, fluid evolution, and gold precipitation mechanisms [6,46,47,48,49], and has made significant progress. However, the study of hydrothermal alteration processes has primarily relied on the analysis of major and trace elements in rocks bulk in nature already to investigate element migration patterns during alteration. Based on detailed field geological surveys and petrographic observations, this study conducts an in situ micro-geochemical characterization of rutile from the main hydrothermal alteration stages. The aim is to gain a deeper understanding of the hydrothermal processes recorded by changes in rutile trace elements and to obtain more detailed geological information from different alteration stages. This information is expected to reveal the evolution patterns of alteration–mineralization processes, thereby supporting discussions on the transport and precipitation mechanisms of gold.

2. Geological Background

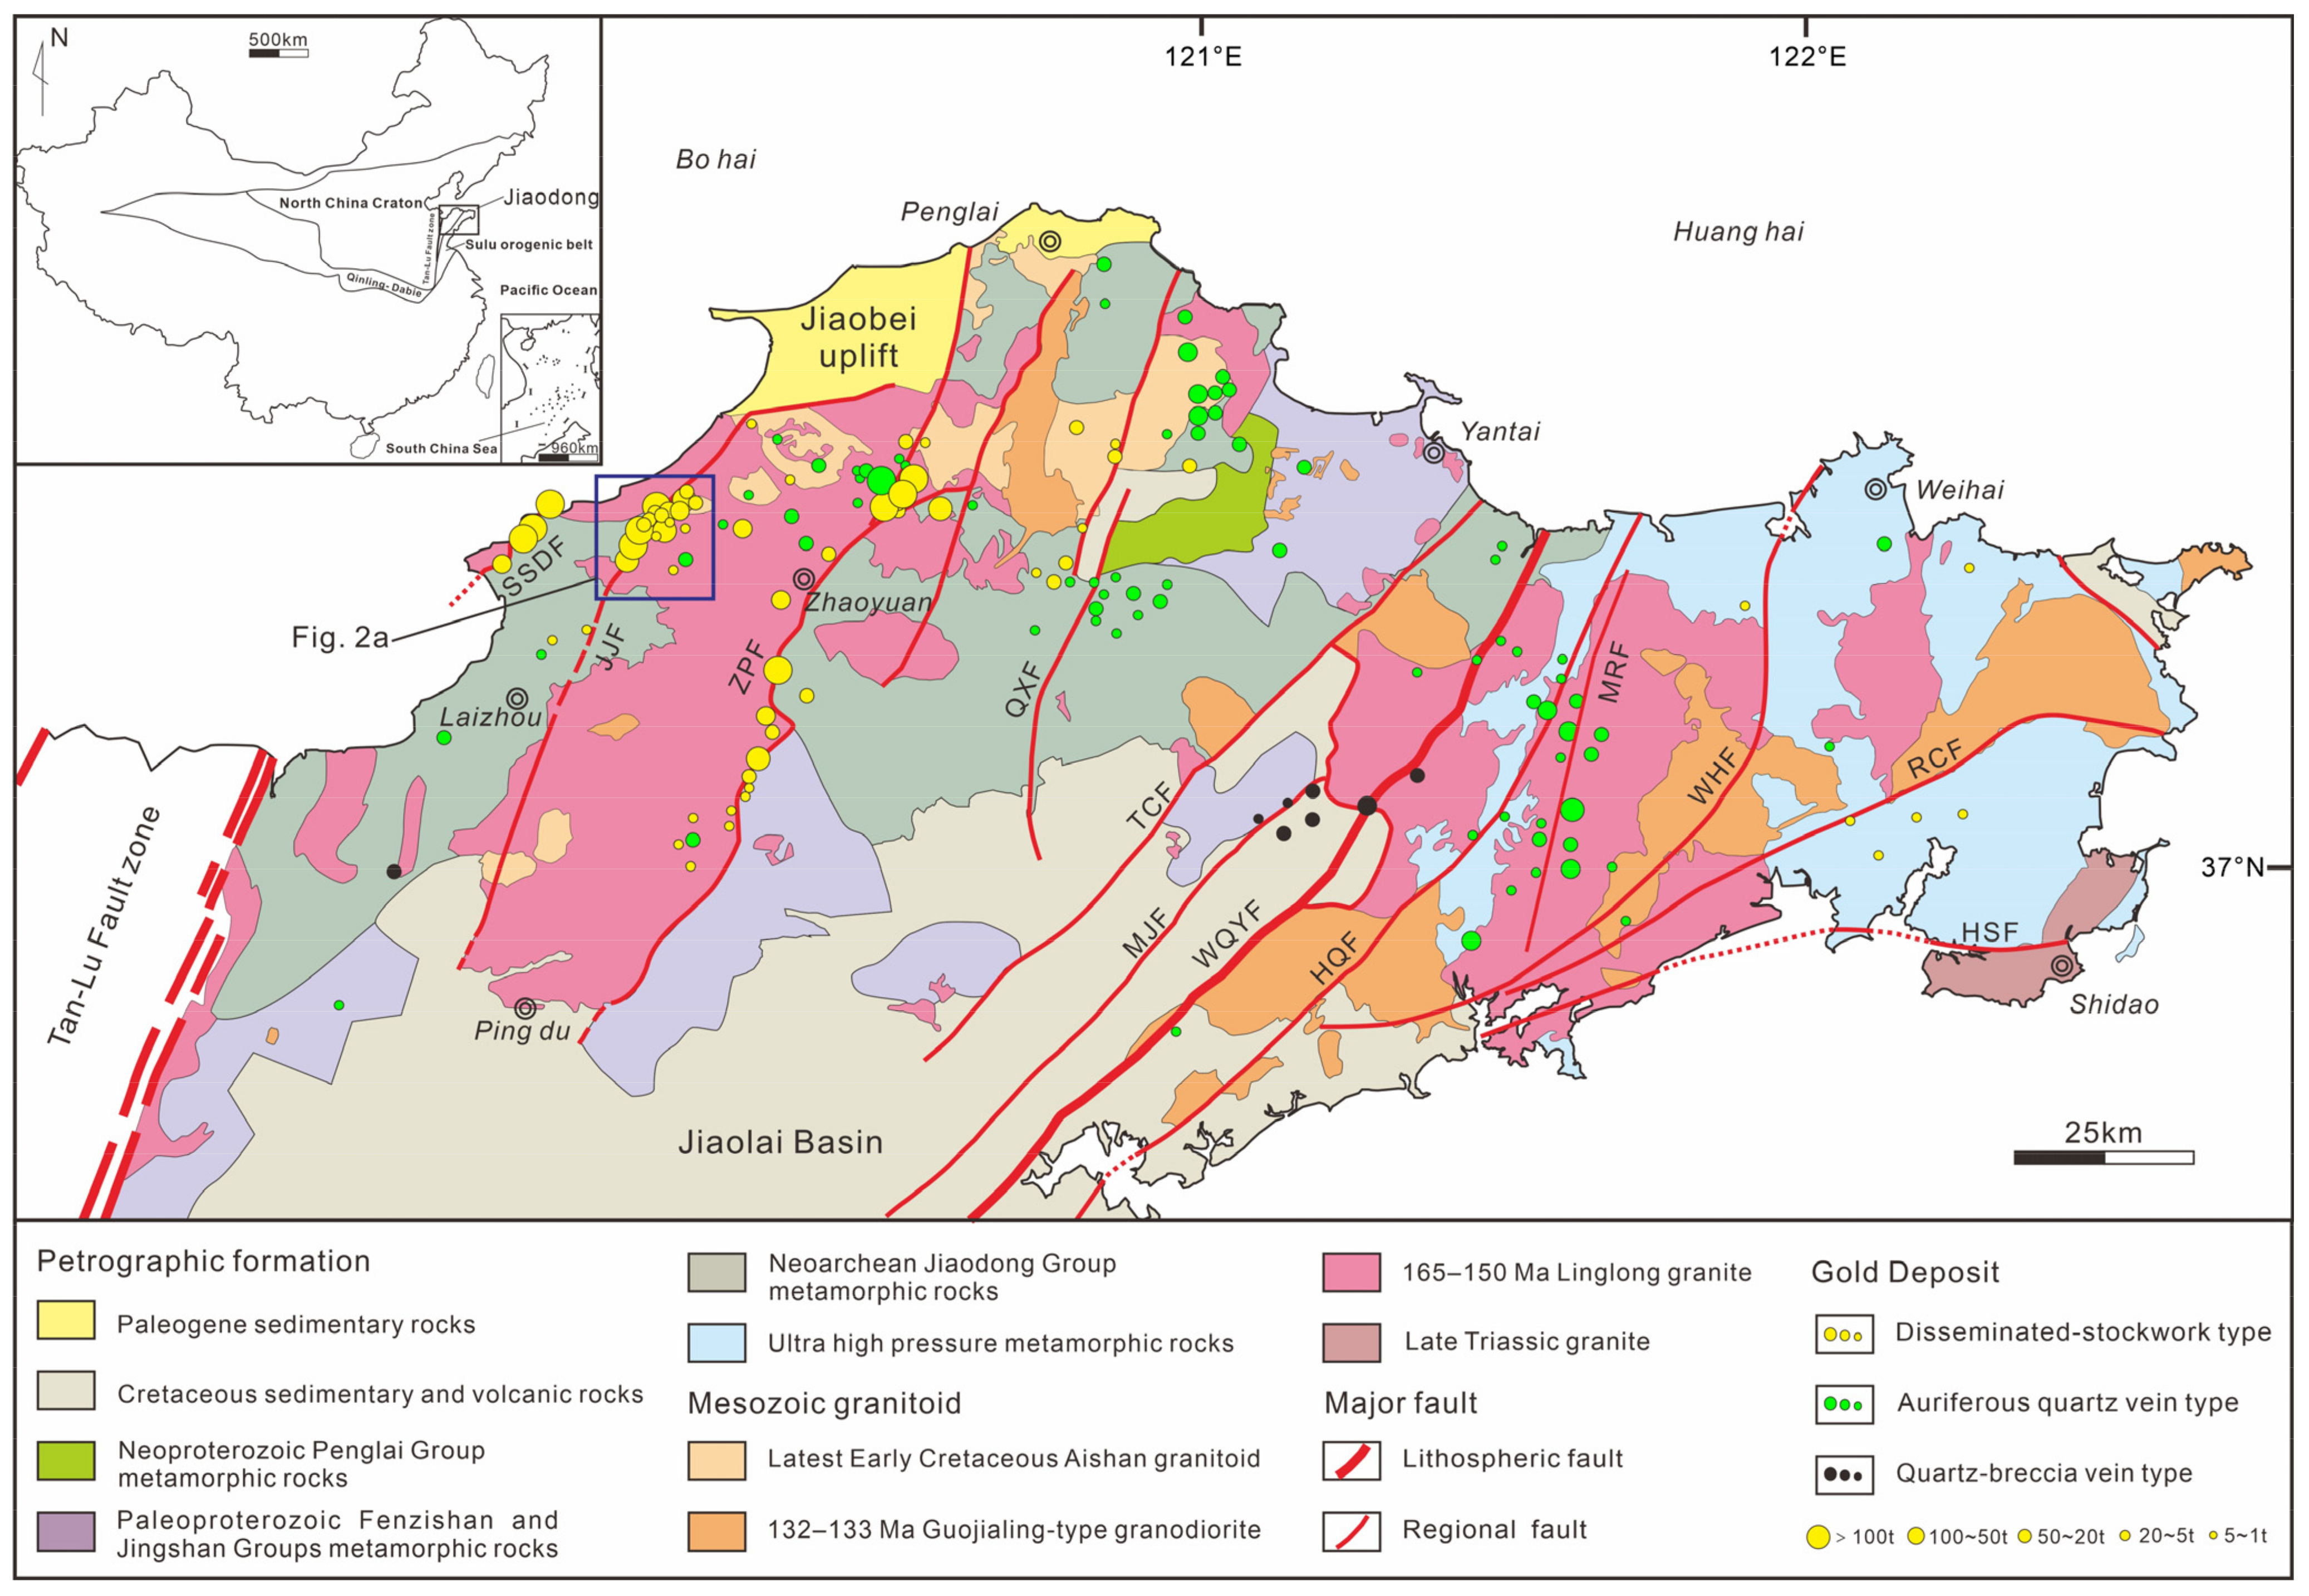
2.1. Regional Geology

The Jiaodong Peninsula, situated at the active intersection of the Pacific and Eurasian plates, lies on the southeastern margin of the North China Craton. It is bound by the Tan-lu Fault on the west and adjoins the ancient Pacific plate subduction zone on the east. It is divided into two tectonic units, the Jiaobei terrane and the Sulu terrane in the east, by the Wulian–Qingdao–Yantai Fault. The Jiaobei terrane can be further subdivided into the Jiaobei uplift and the Jiaolai basin [48,50,51,52]. The Zhaoyuan–Laizhou and Penglai–Qixia gold metallogenic belts, located within the Jiaobei uplift, account for approximately 85% of the gold resources in Jiaodong [53,54]. The Mouping–Rushan gold belt, situated within the Sulu ultrahigh-pressure terrane, contributes about 15% of the gold resources [55] (Figure 1).
The Jiaodong area consists mainly of Precambrian high-grade metamorphic rocks intruded by Mesozoic granite [56]. Precambrian metamorphic rocks are mainly found in the Jiaobei terrane, including the Neoarchean Jiaodong Group, the Paleoproterozoic Fenzishan Group, the Jingshan Group, and the Meso-Neoproterozoic Penglai Group [6,57], partially covered by Cretaceous continental sediments and volcanic rocks [58]. Neoarchean–Paleoproterozoic tonalite–trondhjemite (TTG) genes are widely developed and were formed at ~2.9 Ga, ~2.7 Ga, or ~2.5 Ga [56,59,60,61]. The Mesozoic intrusive rocks are well developed in the Jiaodong area, mainly consisting of the Late Jurassic and Early Cretaceous rock suites. The primary rock bodies are the Linglong granite suite (160–145 Ma) and the Guojialing granite suite (130–123 Ma), which are also the main ore-bearing host rocks in Jiaodong. More than 88% of the gold deposits are hosted within these two suites. Additionally, widespread Cretaceous (130–110 Ma) basic–intermediate dikes are present, though they are smaller in volume and mainly composed of lamprophyres and dolerites, intruded into both granite and metamorphic rocks [62].
Figure 1. Geological map of Jiaodong region. Modified from Yang et al., 2016 [58]. Abbreviations: HQF = Haiyange–Qingdao Fault; HSF = Haiyange–Shidao Fault; JJF = Jiaojia fault; MJF = Mupinge–Jimo Fault; MRF = Mupinge–Rushan Fault; QXF = Qixia Fault; RCF = Rongcheng Fault; SSDF = Sanshandao Fault; TCF = Taocun Fault; WQYF = Wulian–Qingdao–Yantai Fault; WHF = Weihai Fault; and ZPF = Zhaoping Fault.
Minerals 14 00417 g001
The distribution of gold deposits in the Jiaodong area is controlled by regionally NE-NNE trending and nearly parallel faults, such as the Jiaojia, Sanshandao, and Zhaoping faults [20]. Gold mineralization occurred in the process of tectonic system transformation around 120 Ma in the late Mesozoic, which is later than the regional metamorphism of basement rocks by approximately 1.9 billion years [48]. Among them, the Linglong biotite granite and the Guojialing granite, which were formed in the Mesozoic, contain 95% of the gold resources in Jiaodong and are the main ore-bearing wall rocks of gold deposits in the Jiaodong area [63].

2.2. Deposit Geology

The Xincheng gold deposit, situated on the Jiaobei uplift in the northwestern section of the Jiaodong Peninsula, stands out as a super-large gold deposit within the Jiaojia gold field (Figure 2a). With impressive gold resources totaling 200.7 t, reserves of 59.6 t, and a grade of 3.38 g/t, it ranks as the fourth largest gold mine in the Jiaodong region and the sixth in China, boasting a cumulative gold production exceeding 100 t [64]. Furthermore, the Xincheng gold deposit is also abundant in other important mineral resources such as silver, copper, sulfur, cobalt, and chromium, all of which have significant economic potential for exploitation and utilization [49,65].
The Xincheng gold deposit features extensive exposures of Late Jurassic–Early Cretaceous magmatic rocks. Prominent among these are the Linglong and Guojialing granite bodies, which serve as the primary host rocks for mineralization. The Linglong granite is situated at the footwall of the Jiaojia main fault, with fresh biotite granite visible in various middle sections. The Guojialing granite is primarily concentrated in the footwall of the Jiaojia fault in the deeper sections below −480 m of the Xincheng gold deposit, exhibiting a porphyritic texture. Its mineralogy is predominated by plagioclase, quartz, K-feldspar, hornblende, and minor biotite (Figure 3). Geological studies suggest a formation age of 132–123 Ma for this granite [66]. During field investigations, we discovered that the thick, reddish rocks developed on the hanging wall of the main fault in the mining area are not potassium-feldspathic granites as previously thought but maybe potassium-rich granites formed around 1.8 billion years ago. Further studies are required to confirm this. Additionally, a small number of felsic dike rocks and lamprophyres are also developed in the mining area, intruding into the host rocks in a vein-like manner.
The NE-NNE trending Jiaojia fault zone within the region serves as the primary controlling structure for the mineralization of the Xincheng gold deposit, with the alteration and mineralization patterns strictly influenced by its presence [6,67]. The Xincheng gold deposit is a typical example of “Jiaojia-type“ gold mineralization, with orebody I being the most significant within the mining area. This orebody comprises disseminated and stockwork-like ore types, primarily occurring within the pyrite–sericite alteration zone adjacent to the footwall of the main fault. The orebodies are hosted within hydrothermal alteration zones, and their distribution is tightly controlled by the Jiaojia fault. They are mainly located at changes in the attitude of the Jiaojia fault zone, trending northwest with relatively stable thickness. They exhibit a stratiform or layered structure with branching and merging phenomena (Figure 2b). The ore minerals are primarily pyrite, followed by chalcopyrite, sphalerite, and galena. Pyrite is the main gold-bearing mineral [47], and the gold minerals include electrum, native gold, and auricupride, which are present as fissure gold, intercrystalline gold, and inclusion gold [58]. The gangue minerals are mainly quartz, sericite, and feldspar. Petrographic studies of fluid inclusions indicate the presence of H2O–CO2 inclusions, aqueous inclusions, and pure CO2 inclusions in the Xincheng deposit. The homogenization temperatures of the H2O–CO2 inclusions range from 221 °C to approximately 304 °C [6,58].
The wall-rock alteration of the Xincheng gold deposit is wide, primarily as K-feldspar alteration, sericitization, silicification, pyrite–sericite–quartz alteration, and carbonatization [47]. These alterations are strictly controlled by the Jiaojia fault and its secondary faults. It exhibits a certain zoning in space and manifests as the superimposition and modification of late-stage alteration over early-stage alteration in time. Downward and along the main fault, the alterations occur in the following sequence: pyrite–sericite–quartz alteration, silicification, sericitization, K-feldspar alteration, and unaltered granite. K-feldspar alteration, which is recognized as a pre-mineralization stage [68,69], is characterized by the replacement of plagioclase by hydrothermal K-feldspar and the secondary enlargement of primary K-feldspar (Figure 4c). The replacement of plagioclase by K-feldspar forms a metasomatic residual structure (Figure 4a), in the form of a vein or plane by the later (pyrite) sericite–quartz alteration. Sericitization alteration is characterized by the partial or complete replacement of plagioclase, K-feldspar, or biotite with coarse-grained sericite, accompanied by the formation of fine-grained quartz and traces of pyrite (Figure 4d). In the process of pyrite–sericite–quartz alteration, plagioclase, K-feldspar, or biotite is nearly completely altered into fine-grained sericite and quartz, along with the precipitation of sulfide minerals forming quartz–pyrite and quartz–polymetallic sulfide veins. This type of alteration often overlays sericitization and is closely associated with gold mineralization events (Figure 4e,g–i). Carbonatization occurs as quartz–calcite veins, accompanied by minor pyrite, and cuts through the mineralization-stage pyrite–sericite–quartz alteration (Figure 4b,f), indicating that it is either a late-stage or post-mineralization product.
Based on the interlacing relationships and structural features of veins and minerals, the mineralization process is divided into four distinct stages: the quartz–sericite–pyrite, quartz–pyrite, quartz–polymetallic sulfide, and quartz–calcite–pyrite stage. Notably, the second and third stages are the primary gold mineralization stages.

3. Samples and Analytical Techniques

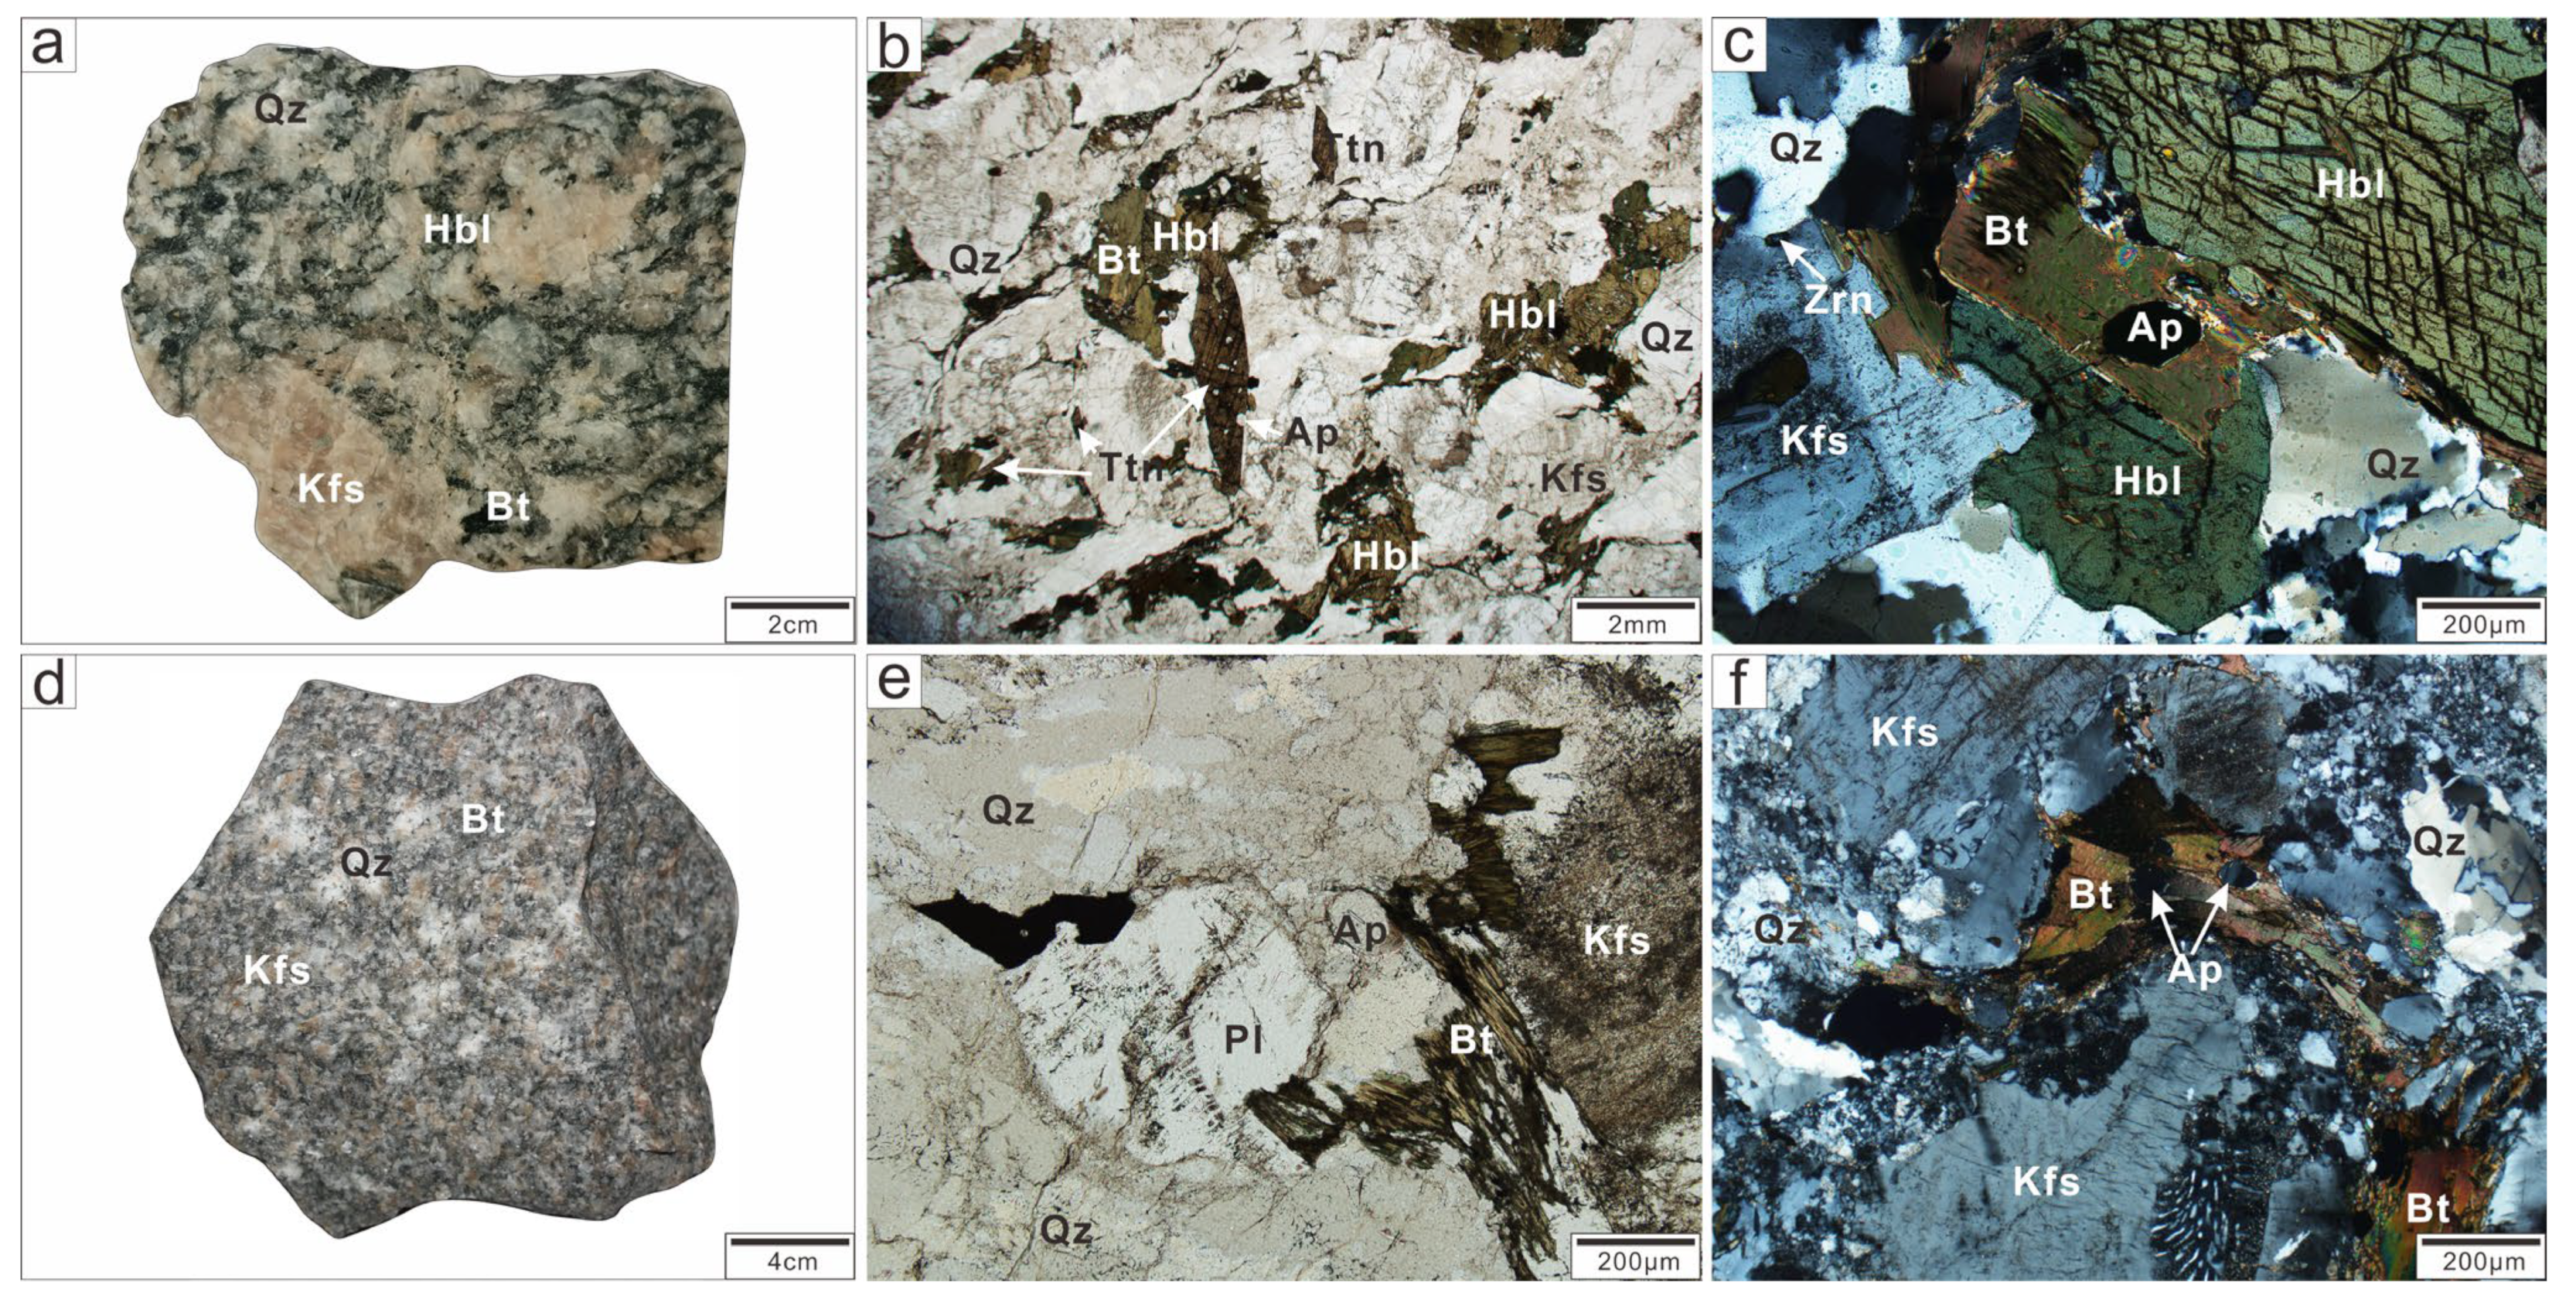
3.1. Sample Selection

This study focuses on samples collected from the 155 lines and the XCZK191’-12 borehole in the 530 m underground working area of the Xincheng gold deposit. Based on the alteration–mineralization characteristics and detailed field investigation of the deposit, a total of 10 samples were selected for detailed alteration–mineralization research experiments. The eight samples from the 155 line at the 530 m level are all located in the footwall of the Jiaojia fault, including two pyrite–sericite–quartz granite samples, one sericitized granite sample, three potassium feldspar granite samples, and two fresh granodiorite samples from the distal part of the fault. Additionally, two pyrite–sericite–quartz granite samples were selected from a depth of 1104.2 m in the XCZK191’-12 borehole. Some altered rocks exhibit superimposed features of multiple stages of hydrothermal alteration. Microscopic observations were conducted to identify the mineral assemblages of different alteration stages, and rutile (particle size ≥ 10μm) coexisting with minerals from different alteration stages was selected for Raman spectroscopy, electron probe microanalysis (EPMA), and laser ablation inductively coupled plasma mass spectrometry (LA-ICP-MS) experimental analysis.

3.2. Analytical Techniques

The distinction between polymorphs of TiO2 minerals in this study was achieved through Raman spectroscopy experiments conducted at the Raman laboratory of China University of Geosciences (Beijing). The instrument used was the Renishaw inVia model (Renishaw, Auburn Hills, MI, USA), with a laser excitation wavelength of 514 nm. The spectral count time was set to 15 s, and the diameter of the laser beam spot was 1 μm.
The EPMA analysis of rutile’s Ti and trace elements including Cr, Mn, Zr, Nb, Ca, Mg, Al, Hf, Fe, V, Sc, Si, Ta, and W was measured with a JEOL JXA-8320 electron probe microanalyzer (JEOL, Peabody, MA, USA), at the Shandong Institute of Geological Sciences. The operating conditions were 15 kV accelerating voltage, 50 nA beam current, and 1~10 μm beam spot. The testing utilized the following crystals: TAP crystal (Mg, Al, Si), PETJ crystal (Ca, Ti), PETH (Ta, W, Nb, Zr, Sc), and LiF crystal (Mn, Cr, Fe, Hf, V). Analytical lines included Kα (Mg, Al, Si, Ca, Ti, Sc, Fe, Mn, Cr), Kβ (V), Lα (Nb, Zr, Hf), and Mα (Ta, W). The standards used were SPI natural minerals, including jadeite (Si), almandine garnet (Al, Fe), diopside (Ca, Mg), rutile (Ti), rhodonite (Mn), chromium oxide (Cr), and zirconia (Zr), and pure metals were used for Nb, Hf, V, Sc, Ta, and W standards. Depending on the element analyzed, the beam current and counting time were adjusted and accordingly increased. The counting times for Ti, Cr, Mn, Zr, Nb, Ca, Mg, Al, Hf, Fe, V, Sc, Si, Ta, and W were 10, 40, 20, 60, 40, 20, 20, 20, 60, 20, 60, 40, 20, 20, 60, and 100 s, respectively, with detection limits of 242, 88, 143, 108, 103, 68, 43, 52, 343, 64, 280, 78, 68, 126, and 98 ppm. The matrix effects were corrected using the ZAF software provided by JEOL.
The elemental analysis of minerals in thin sections was conducted at the testing center of the Shandong Bureau of China Metallurgical Geology Bureau using LA-ICP-MS technology. For the experiments, a combination of the GeoLasPro 193 nm ArF excimer system, manufactured by Coherent (Saxonburg, PA, USA), and the ICP-MS was employed the ICAP Q quadrupole by Thermo Fisher (Waltham, MA, USA). The 193 nm ArF excimer laser, homogenized through an advanced beam delivery system, was precisely focused on the mineral surface, delivering a fluence of 10–12 J/cm2. Measured masses included 23Na, 24Mg, 27Al, 29Si, 31P, 39K, 44Ca, 49Ti, 55Mn, 57Fe, 7Li, 9Be, 11B, 45Sc, 51V, 52Cr, 59Co, 60Ni, 63Cu, 66Zn, 71Ga, 73Ge, 75As, 85Rb, 88Sr, 89Y, 91Zr, 93Nb, 95Mo, 111Cd, 118Sn, 133Cs, 137Ba, 139La, 140Ce, 141Pr, 146Nd, 147Sm, 153Eu, 157Gd, 159Tb, 163Dy, 165Ho, 166Er, 169Tm, 172Yb, 175Lu, 178Hf, 181Ta, 182W, 209Bi, 208Pb, 232Th, and 238U. Each acquisition process began with a 20 s background measurement to establish a baseline (gas blank), followed by a 60 s ablation period where a 30 μm spot diameter was used at a repetition rate of 6 Hz. To efficiently transport the aerosol out of the ablation cell, helium gas (750 ml/min) was used as the carrier gas. This helium stream was then merged with argon via a T-connector before entering the ICP torch.
As external calibration standards, synthetic standard glasses from the American National Bureau of Standards and Technology, including NIST610 and NIST612, as well as basaltic glasses from the United States Geological Survey, namely BIR-1G and BCR-2G, were utilized. The raw data reduction was performed offline using the ICPMSDataCal software, adopting a 100% normalization strategy without the need for an internal standard [70]. Additionally, Chinese Geological Standard Glasses CGSG-1 and CGSG-2, prepared by the National Research Center for Geoanalysis in Beijing, China, served as quality control samples. This meticulous approach ensures the accuracy and precision of the elemental analysis in mineral thin sections, providing valuable insights into the mineralogy and geochemistry of the samples.

4. Results

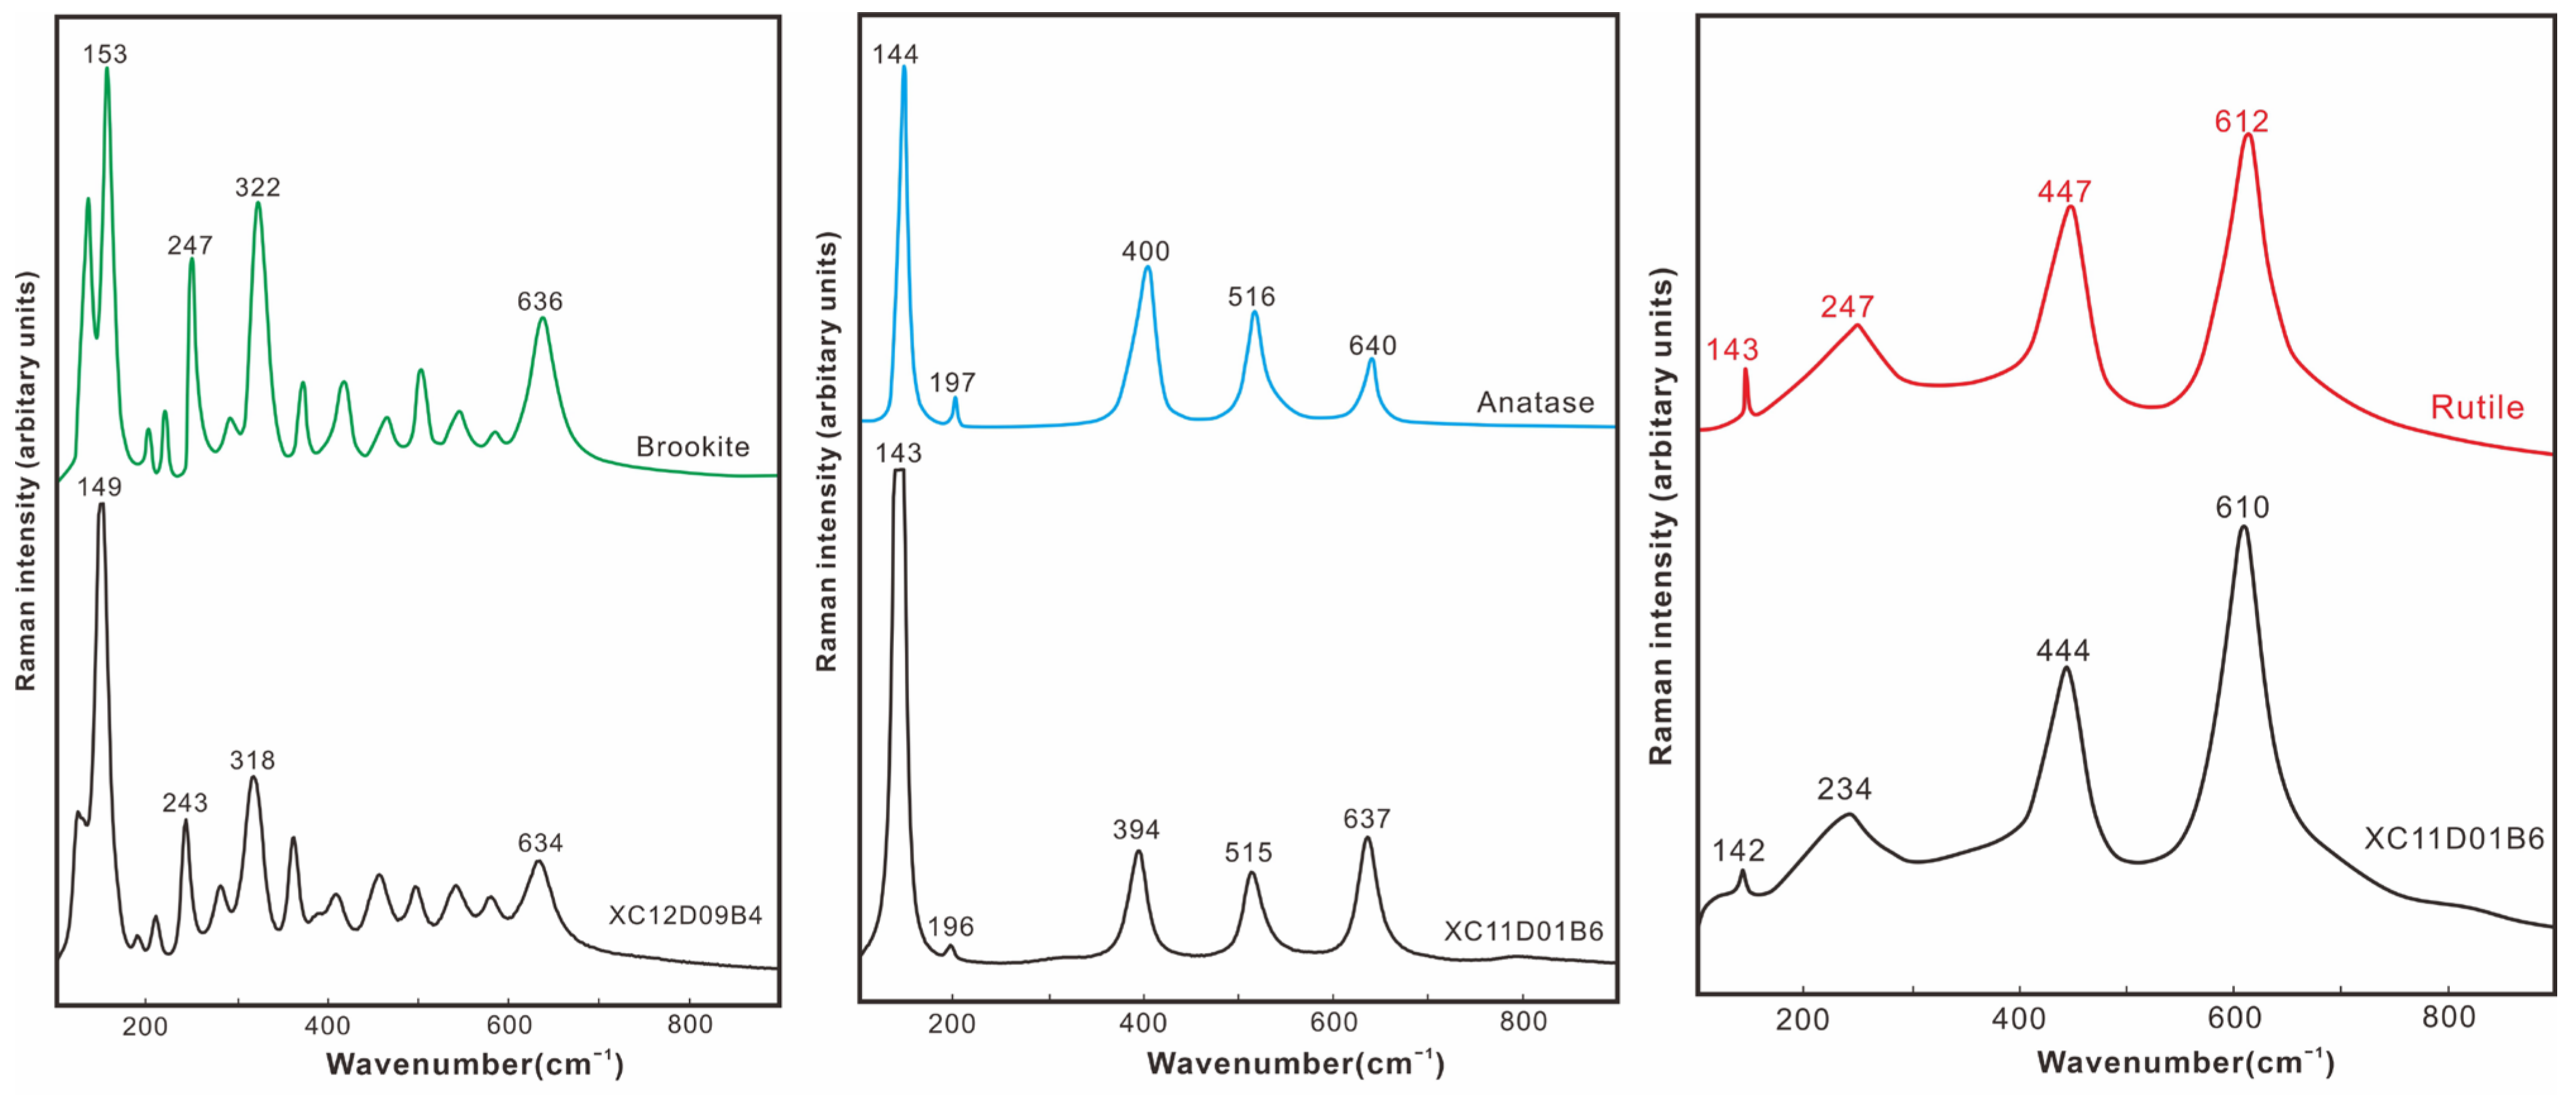
4.1. Raman Analysis of TiO2 Minerals in Different Stages of Hydrothermal Alteration

Previous studies have found that under certain conditions, anatase and brookite exhibit similar trace element compositions to rutile, such as their characteristic low W and Sn contents [17]. It is crucial to accurately distinguish rutile from the TiO2 polymorphs anatase and brookite using techniques like laser Raman spectroscopy or electron backscatter diffraction, to avoid obtaining false-positive research results.
Based on petrographic characteristics and Raman analysis, three polymorphs of TiO2 minerals were identified: brookite, anatase, and rutile (Figure 5). Among them, brookite and anatase exist only in small quantities, primarily within the skeletal crystals of titanite, resulting from metasomatic reactions of titanite. These minerals have particle sizes ranging from 20 to 100 μm and exhibit relatively smooth surfaces. Rutile, as the most prominent TiO2 mineral, is widely developed throughout various stages of hydrothermal alteration. It appears as euhedral to subhedral grains with sizes ranging from 10 to 400 μm, and some rutile crystals exhibit relatively well-developed internal fractures. The characteristic Raman peaks of rutile are primarily located at 142 cm−1, 234 cm−1, 444 cm−1, and 610 cm−1.
Based on petrographic features and mineral paragenesis, rutile in the Xincheng gold deposit is classified into three types: Rt1-type (K-feldspar alteration stage), which exhibits a semi-euhedral to allotriomorphic structure with a relatively clean surface, lacking zoning and bright spots, and coexisting with hydrothermal K-feldspar and quartz. Additionally, minor semi-euhedral granular brookite and anatase exist in the wedge-shaped pseudomorph of magmatic sphene, resulting from the hydrothermal alteration of the latter. During the alteration of biotite into muscovite, needle-like rutile precipitates along its joints (Figure 6a,d). Rt2-type (sericitization stage) rutile is semi-euhedral and exhibits distinct zoning and bright spots under the BSE detector. It occurs in hydrothermal veins and coexists with sericite, quartz, pyrite, and muscovite, with a few monazite grains distributed in fractures (Figure 6e,h). Rt3-type (pyrite–sericite–quartz alteration stage) rutile is mainly associated with minerals such as quartz, pyrite, chalcopyrite, and sericite, widely distributed in hydrothermal veins. The BSE images reveal distinct zoning and bright spots, which are typically distributed around the fractures of rutile (Figure 6i,l).

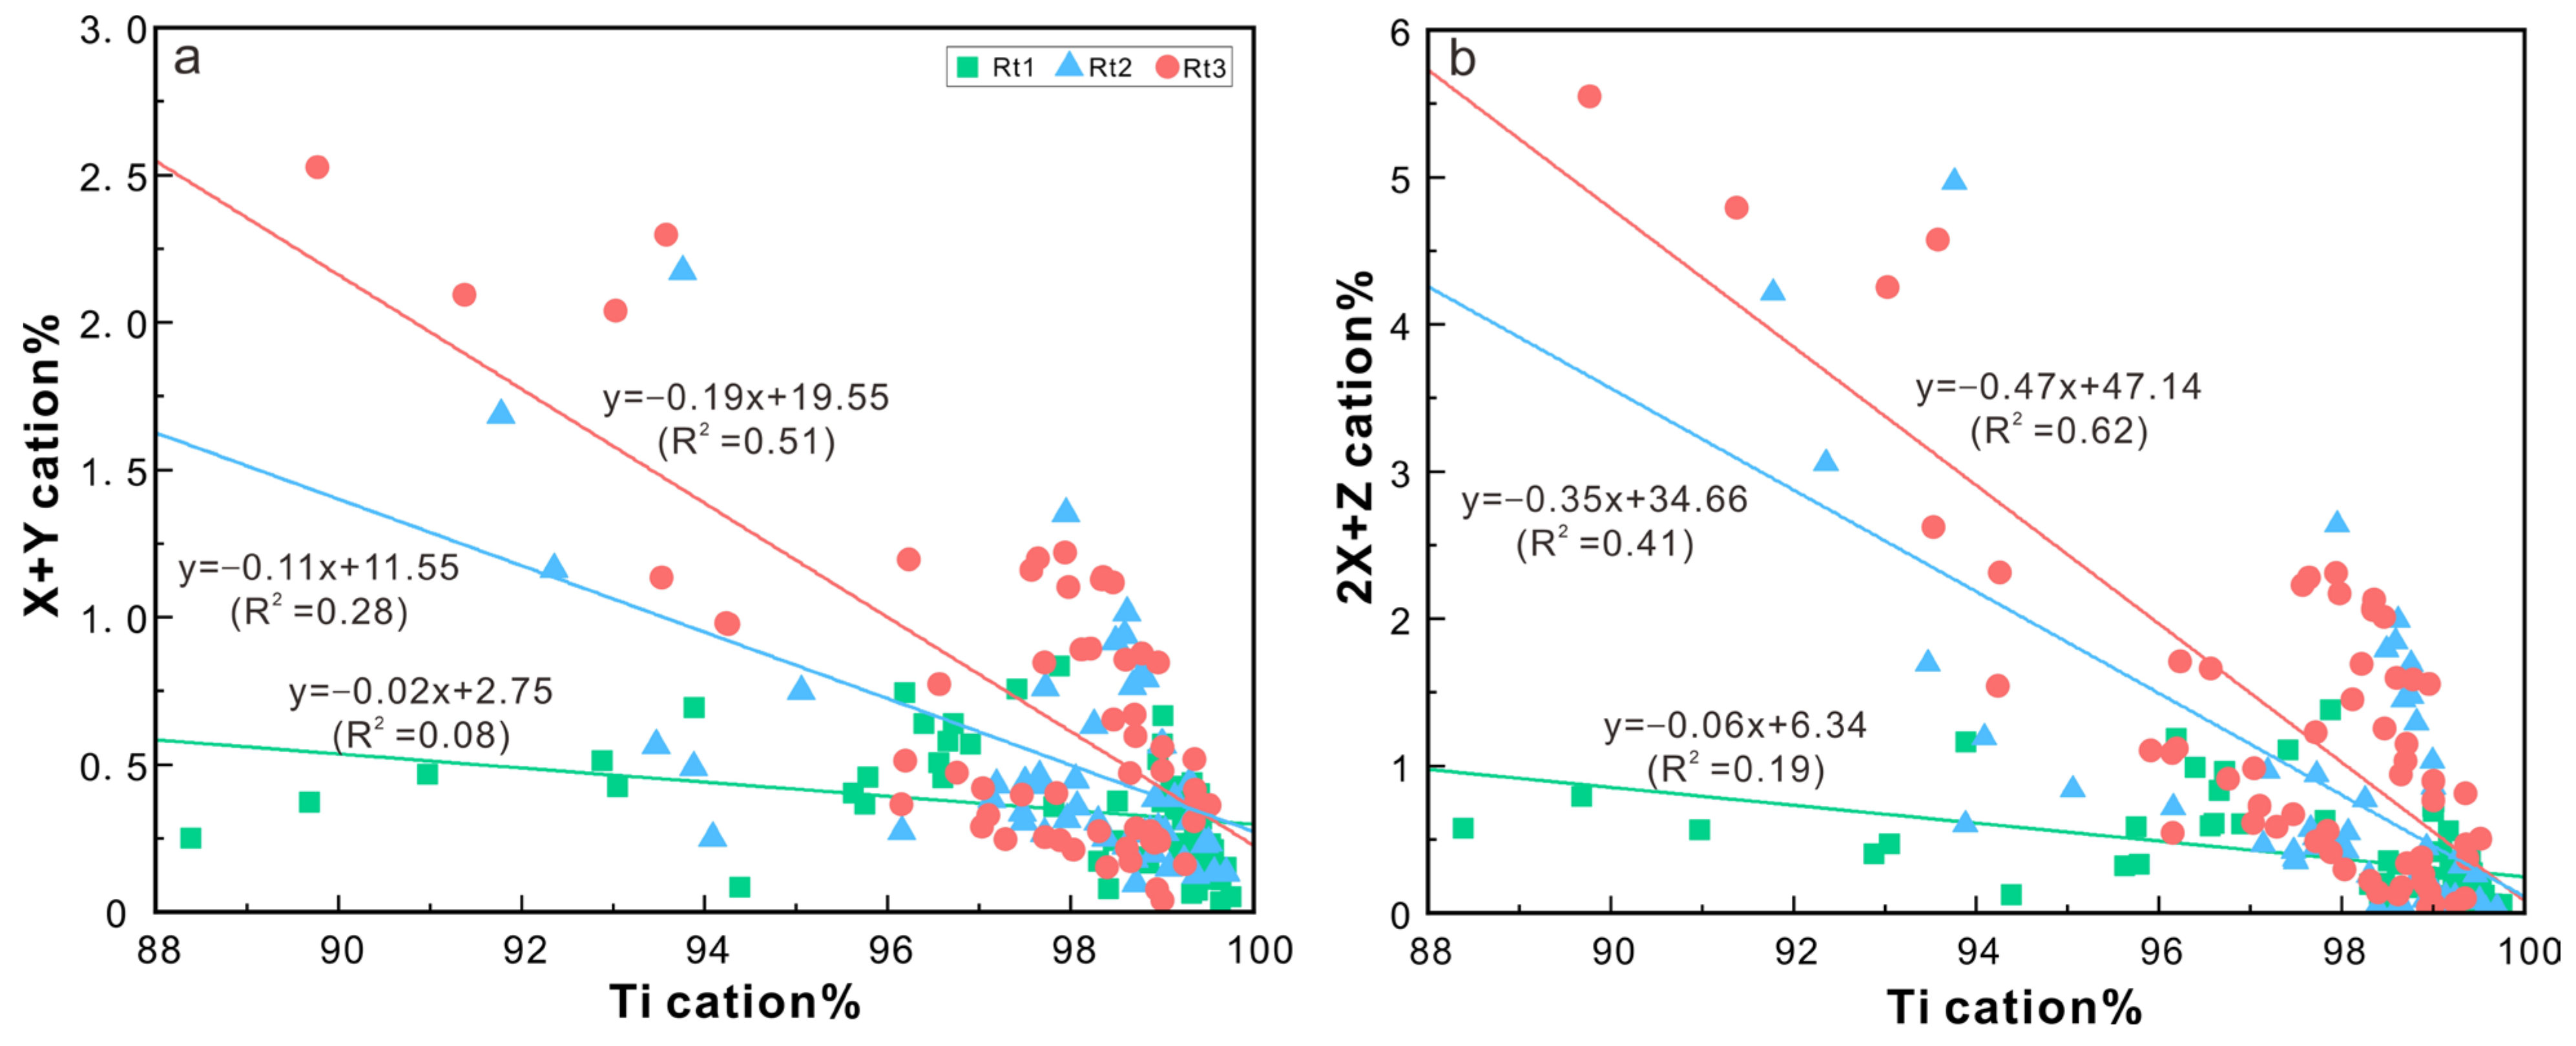
4.2. Major and Trace Elements of Rutile

The results of EPMA and LA-ICP-MS element content tests for rutile in different hydrothermal alteration stages are shown in Tables S1 and S2. Rutile from various hydrothermal alteration stages exhibits inhomogeneous major and trace element compositions: Rt1-type rutile is characterized by high contents of Si (>130,001.33 ppm), Hf (>38.24 ppm), and Zr (>427.16 ppm) and low contents of V (346.8–4277.2 ppm), Nb (167.82–4663.98 ppm), and W (2.2–26.98 ppm). Rt2-type rutile exhibits a higher content of V, W, Nb, Ta, and Sn and a lower content of Ca, Si, Hf, and Zr compared to the Rt1-type. Notably, the W content is significantly higher in Rt2, exceeding Rt1 by two orders of magnitude. The Rt3 type of rutile stands out with its high levels of W (>13,366.82 ppm), Sc (>626.09 ppm), Cr (>1301.17 ppm), Sn (>1301.17 ppm), and V (>6176.53 ppm), along with low Hf (<2.47 ppm) and Zr (<21.82 ppm) (Figure 7).
The total content of rare earth elements (REEs) in Rt1 rutile ranges from 8.97 to 165.62 ppm (average: 77.59), with (La/Yb)N = 1.32–14.77 (average: 6.05), δEu values of 0.32–1.04 (average: 0.73), and (La/Sm)N = 0.27–1.02 (average: 0.76). In Rt2 rutile, the ∑REE content is 107.76–756.32 ppm (average: 379.60), with (La/Yb)N = 0.88–6.55 (average: 3.45), δEu values of 0.32–0.84 (average: 0.63), and (La/Sm)N = 0.25–3.66 (average: 1.70). Finally, Rt3 rutile exhibits a ∑REE content of 90.13–691.68 ppm (average: 356.93), (La/Yb)N = 2.75–5.60 (average: 3.70), δEu values of 0.14–0.65 (average: 0.31), and (La/Sm)N = 0.66–1.46 (average: 1.08) (Figure 8).
The analysis of the element correlation diagrams of the three rutile types reveals patterns: Rt2 and Rt3 rutiles exhibit a distinct negative correlation between W, Nb, and Ti contents, whereas Rt1 rutile displays no such relationship (Figure 9a,c). Furthermore, a positive correlation is observed between the Nb and W contents of Rt2 and Rt3 rutiles, indicating the occurrence of Nb and W undergoing isomorphic substitution with Ti (Figure 9b). Notably, no obvious correlation is observed between the Nb, Ti, W, and V contents of the three rutile types (Figure 9d–f).
In recent years, EPMA trace element mapping has emerged as a technique that provides a more intuitive understanding of the spatial distribution of trace elements within minerals [73,74]. BSE analysis and semi-quantitative EPMA mapping were conducted on rutiles developed during two stages of alteration: sericitization (Rt2-type) and pyrite–sericite–quartz alteration (Rt3-type) (Figure 10 and Figure 11). The results of the EPMA mapping show that warm colors like red, yellow, and green represent high concentrations of trace elements, while cool colors like blue, purple, and black indicate lower concentrations. Both Rt2 and Rt3 rutiles exhibit distinct zoning and bright spot regions in the BSE images. These bright spots are primarily distributed along the edges of rutile grains and on both sides of internal fractures. The inhomogeneous distribution of certain trace elements, such as W, Fe, Nb, and V, is attributed to isomorphic substitution with Ti. Notably, the bright spots in the Rt2 rutile BSE images contain higher concentrations of W compared to the dark bands. Conversely, the bright spots in Rt3 rutile are enriched in W, Nb, Fe, and a small amount of V. Furthermore, there is a positive correlation between the variations in W and Nb concentrations, while Fe and V concentrations exhibit a positive correlation with W in certain regions.

5. Discussion

5.1. The Genesis of Rutile

Rutile is widely developed in hydrothermal deposits, often resulting from the metasomatic interaction between hydrothermal fluids and primary titanium-rich minerals such as biotite, titanite, ilmenite, and amphibole [21,37,75,76]. It frequently coexists with hydrothermal minerals like sericite, quartz, and sulfides in altered rocks [31,77]. Rutile is rich in trace elements such as high-field-strength elements and transition elements, and variations in these trace elements can be used to reconstruct fluid evolution processes and investigate the genesis types [24,28,29,30,31].
Previous studies have classified rutile into several types based on its genesis: magmatic rutile, hydrothermal rutile, metamorphic rutile, and clastic rutile [16,42,56,78]. In this study, we observed the extensive development of rutile at different stages of hydrothermal alteration in the Xincheng gold deposit. Rutile grains are mostly euhedral to subhedral and closely associated with hydrothermal minerals such as K-feldspar, pyrite, quartz, and sericite, along with other polymetallic sulfides (Figure 6). Petrographic features indicate that all of these rutile grains are of hydrothermal origin. Furthermore, research found that the contents of Zr and W in rutile can effectively discriminate between magmatic, metamorphic, and hydrothermal rutile [26]. Sciuba et al. (2021) [24] used trace element composition and binary diagrams to demonstrate that the Nb/V vs. W ratio can effectively distinguish rutile in metamorphic and hydrothermal deposits from that in magmatic hydrothermal deposits and magmatic environments. Additionally, the Sn vs. V diagram can be used to distinguish rutile in orogenic gold deposits from those in other deposit types and geological settings. Based on the binary diagrams of trace elements and petrographic characteristics of rutile from the alteration stages of K-feldspar alteration (Rt1-type) and pyrite–sericite–quartz alteration (Rt3-type), the Zr and W contents of rutile indicate that all rutile grains from these hydrothermal alteration stages are of hydrothermal origin (Figure 12a). However, Rt1-type rutile exhibits a distinctively low W characteristic, falling outside the range typical of hydrothermal rutile and differing from magmatic rutile. The Nb/V vs. W diagram reveals that this low-W rutile from the K-feldspar alteration stage exhibits characteristics of magmatic–hydrothermal fluids. In contrast, Rt2-type and Rt3-type rutile display characteristics of metamorphic hydrothermal fluids. In the Sn vs. V diagram, they share similar features with rutile in orogenic gold deposits, demonstrating a clear genetic distinction from Rt1-type rutile (Figure 12b,c). In the fresh granodiorite of the Xincheng gold deposit, titanium-rich minerals such as titanite, biotite, and amphibole are widely present (Figure 3b,c). During the process of hydrothermal alteration, these titanium-rich minerals are prone to instability, decomposition, and re-equilibration under the influence of oxidizing fluids with medium to low temperatures and high CO2 concentrations, releasing Ti and crystallizing to form rutile [30,37]. Additionally, the high Ti concentrations in titanite (32.86–36.33 wt.%, average: 35.26 wt.%) and biotite (0.55–2.46 wt.%, average: 1.50 wt.%) within the protolith granodiorite of the Xincheng gold deposit suggest them as potential Ti sources. It is believed that hydrothermal rutile originated from the transformation of Ti-rich minerals in the protolith through hydrothermal alteration (Figure 6c,d).
The substitution of Ti4+ in the rutile lattice is related to the ionic radius and charge of the substituted and replacing cations [16]. Previous studies have revealed that the substitution of Ti4+ in rutile primarily follows two mechanisms: (1) X3+ + Y5+ = 2Ti4+ and (2) 2X3+ + Z6+ = 3Ti4+. In these reactions, X represents trivalent cations such as Fe3+, V3+, Cr3+, and Al3+; Y represents pentavalent cations such as Nb5+, Sb5+, or Ta5+; and Z represents hexavalent cations, including W6+ [16,79,80]. Assuming an oxygen cation count of two and the primary existence of iron as Fe3+ [31,32,81], we calculated the cationic percentage of each element using EPMA data for rutile. Through binary diagrams analyzing the oxide content and cationic percentage of rutile at various stages, it was observed that Rt1-type rutile exhibits no linear correlation between Ti and W, Nb, Fe, or V nor does it adhere to the previously mentioned substitution mechanisms. Consequently, it is believed that Ti4+ in Rt1-type rutile has not undergone isomorphous substitution. This may be attributed to the nature and composition of the hydrothermal fluids that formed Rt1-type rutile, which are unfavorable for the isomorphous substitution of Ti, thereby preventing elements such as W, Nb, Fe, and V from entering the rutile lattice. In the following discussions, we will further explore the influence of fluid properties and composition on this process. In Rt2-type and Rt3-type rutile, there exists a strong linear correlation between Ti and W, Nb, and a linear relationship between Nb and W in Rt3-type rutile is also observed. It is believed that the possible substitution relationship in Rt2-type rutile is 2X3+ + Z6+ = 3Ti4+ (R2 = 0.41), but the linear correlation is relatively weak. On the other hand, the primary substitution relationship in Rt3-type rutile is 2X3+ + Z6+ = 3Ti4+ (R2 = 0.62), and an additional substitution relationship of X3+ + Y5+ = 2Ti4+ (R2 = 0.51) is also present (Figure 9 and Figure 13). The large variations in trace elements and the potential existence of cations with multiple valence states weaken the correlation of cation substitution relationships in Rt2-type and Rt3-type rutile. Research has found that combining backscattered electron (BSE) images with the elemental mapping of rutile grains can reveal complex zoning patterns and the distribution characteristics of trace elements in rutile [30,31]. In the BSE images and elemental mapping of Rt2-type and Rt3-type rutile grains, a positive correlation is observed between the W content and BSE brightness in Rt2-type rutile, while in Rt3-type rutile, W, Nb, and Fe also positively correlate with BSE brightness (Figure 10 and Figure 11) [29,30]. This further illustrates the substitution relationships between Ti4+ and other cations in Rt2-type and Rt3-type rutile. Additionally, it demonstrates that the W content positively correlates with BSE brightness, and the distribution of trace elements in rutile controls the distribution of bright spots and fan-shaped zoning [31,77].

5.2. Characteristics and Evolution of Hydrothermal Alteration Fluids

Rutile, a common accessory mineral, is widely distributed in mineralization zones and their proximal and distal alteration zones across numerous ore deposits [14,30,80,82]. It hosts various HFSEs and transition elements, such as W, Sn, Sb, Zr, Hf, Nb, and Ta. [16,24,28,30,31,37]. The trace element composition of rutile is typically controlled by conditions such as temperature, pressure, fluid composition, and oxygen fugacity [15,17,24,28,39,83,84,85,86]. Therefore, by interpreting the trace elements in rutile from different hydrothermal alteration stages of the Xincheng gold deposit, we can obtain important information about the characteristics and evolution of hydrothermal fluids.
In the Xincheng gold deposit, the Fe content gradually increases from Rt1-type rutile to Rt3-type rutile (Figure 7a) indicating that fluid fO2 decreases [86]. Additionally, the fluid’s fO2 and temperature conditions are related to Eu anomalies [87,88]. Rt1-type rutile exhibits higher concentrations of light rare earth elements with an insignificant Eu anomaly, resembling the rare earth element distribution pattern of the upper crust, suggesting crustal genesis characteristics (Figure 8a). Both Rt2-type and Rt3-type rutile show negative Eu anomalies, with Rt3-type rutile exhibiting a more pronounced anomaly (Figure 8b,c). Therefore, fluids associated with K-feldspar alteration occur in a relatively oxidizing environment with higher oxygen fugacity, while fluids related to sericitization and pyrite–sericite–quartz alteration occur in a more reducing environment with lower oxygen fugacity, leading to the reduction of Eu3+ to Eu2+ and resulting in a negative Eu anomaly. This is consistent with the results of fluid inclusions and isotopes from previous research (results in Table S4) [2,4,47].
The total amount of rare earth elements (REEs) in Rt2-type and Rt3-type rutiles are significantly higher than in Rt1-type rutile (mean for Rt1: 77.59 ppm; mean for Rt2: 379.60 ppm; mean for Rt3: 356.93 ppm), indicating the enrichment of REEs in the evolving alteration fluids. REEs migrate in hot aqueous solutions as Cl and SO42− complexes, and the content of REEs in the system increases with the increase in Cl and SO42− content. Low pH and high concentrations of ligand ions are favorable conditions for the migration of REEs in thermal fluids [89]. Alkaline fluids favor the alteration of plagioclase to form potash feldspar, while acidic fluids favor the alteration of plagioclase and potash feldspar to form sericite [90]. Therefore, the fluids associated with K-feldspar alteration are alkaline, whereas those involved in sericitization and pyrite–sericite–quartz alteration are weakly acidic. Under acidic pH conditions, rare earth elements migrate in the form of chloride complexes [91,92]. Consequently, during the transition from K-feldspar alteration to pyrite–sericite–quartz alteration, the altered hydrothermal fluids exhibit characteristics of decreasing pH and increasing anionic Cl content.
The Zr content in rutile exhibits a certain linear relationship with its formation temperature [15,34,93,94]. Therefore, the crystallization temperature of rutile at different alteration stages can be calculated based on its Zr content, allowing us to reconstruct the temperature changes during fluid evolution. Using the Zr-in-rutile thermometer formula proposed by Tomkins et al. (2007) (at a pressure of 1 kbar) [34] to calculate the temperatures of hydrothermal rutile at different alteration stages, Table S3, we obtained temperatures ranging from approximately 524 °C to 639 °C (mean: 584 °C) for Rt1-type rutile, 444 °C to 602 °C (mean: 533 °C) for Rt2-type rutile, and 447 °C to 558 °C (mean: 487 °C) for Rt3-type rutile. These temperatures far exceed those measured by the felspathic thermometer (392 °C~449 °C for K-feldspar alteration [2]) and fluid inclusions (130 °C~340 °C [47]). The potential overestimation of rutile Zr thermometer temperatures in gold deposits may be due to the rapid crystallization of rutile during fast hydrothermal events, leading to the incorporation of excessive Zr. Furthermore, the pulsing fluid flow and relatively low temperatures may result in an imbalance between rutile, zircon, and quartz [21,95]. Therefore, it is essential to conduct a thorough applicability assessment prior to its use to ensure accurate temperature measurements. Based on the Zr-in-rutile thermometer, the calculated temperature is elevated, whereas the hydrothermal temperature decreases from K-feldspar alteration to pyrite–sericite–quartz alteration (Figure 14). Additionally, previous studies have shown that the W element is more likely to be incorporated into rutile at lower temperatures [23]. The gradual increase in the W content from Rt1-type rutile to Rt3-type rutile suggests a decreasing crystallization temperature (Figure 7a), indicating a continuous decrease in temperature during the evolution of hydrothermal alteration fluids.
The major and trace element contents of rutile vary significantly during different hydrothermal alteration stages of the Xincheng gold deposit, with notable changes in the concentrations of W, V, Zr, Sn, Hf, and Nb (Figure 7). These variations indicate changes in the composition and nature of the altering hydrothermal fluids. Typically, HFSEs are relatively stable during metamorphism and alteration processes, making them resistant to mobilization. Previous studies have shown that F- and Cl-rich hydrothermal fluids can activate and carry HFSEs, such as W, Nb, Ti, and V. These elements tend to form complexes with F in the hydrothermal fluids [21,31,96]. Apatite, a F-bearing mineral, is widely developed during different hydrothermal alteration stages [97], suggesting the presence of F in the fluids. Furthermore, carbonate ions may also contribute to the mobilization of these elements [98]. Therefore, F-rich fluids activate HFSEs and form complexes, and the presence of Cl and CO32− further promotes their migration. Hydrothermal fluids are characterized by high concentrations of F and Cl. Previous studies have shown that rutile typically contains higher W concentrations in ore-forming and alteration zones compared to unaltered surrounding rocks [30,79]. In the Xincheng gold deposit, Rt2 and Rt3 types of rutile exhibit W contents two orders of magnitude higher than Rt1, with Rt3 showing an even higher W-rich signature (Figure 7a). The alteration of pyrite–sericite–quartz, which is closely associated with gold mineralization, is associated with rutile containing high W contents that are more closely related to mineralization. High-W rutile is an important characteristic of hydrothermal rutile during the mineralization stage (Figure 12d). The W content of rutile in the Rt1 stage is below the detection limit of 0.04 wt.%. This may be attributed to the Cl-poor and high-temperature nature of the altering hydrothermal fluids, which prevents the isomorphous substitution of W for Ti [21].
In summary, previous studies have suggested that K-feldspar alteration is a late-stage product of magmatic crystallization, with the altering fluids originating from granite [71,72,99,100]. Our research has found that rutile from the K-feldspar alteration stage exhibits magmatic–hydrothermal characteristics, which are distinctly different from those of rutile from the sericitization and pyrite–sericite–quartz alteration stages during ore formation. K-feldspar alteration is thus identified as a pre-mineralization hydrothermal alteration process. During the mineralization period, sericitization and pyrite–sericite–quartz alteration are formed based on K-feldspar alteration. Rutile from this period exhibits characteristics of metamorphic hydrothermal fluids, with its elemental composition, including W, Sn, Si, and Fe, consistent with that of rutile in orogenic gold deposits [30] (Figure 7). This suggests that the ore-forming fluids in this deposit share similarities with those in typical orogenic gold deposits. Gold migrates in the form of Au(HS)2− complexes in low- to moderate-temperature, low-salinity, CO2-rich, weakly acidic, and relatively low-fO2 hydrothermal fluids [6]. Changes in fluid temperature and pressure during the mineralization period lead to fluid immiscibility, resulting in the loss of a large amount of H2S from the hydrothermal fluids, which decreases the solubility of Au(HS)2− and causes the precipitation and concentration of gold [6,101]. From the pre-mineralization alteration stage to the mineralization alteration stage, the increase in Fe content and negative Eu anomaly in hydrothermal rutile indicate a decrease in the fO2 of the hydrothermal fluids over time. The increase in W content and decrease in Zr content suggest a continuous decrease in fluid temperature. The reduction in temperature and fO2 may be one of the factors controlling gold precipitation. Additionally, the gradual increase in the content of REEs and HFSEs such as W, V, Nb, and Sn indicates that the hydrothermal fluids are rich in F and Cl. High W content in rutile is a significant characteristic of hydrothermal rutile during the mineralization period and is closely related to gold mineralization. The geochemical composition of rutile can assist in discriminating mineralization types and makes it a highly potential indicator mineral for mineral exploration.

6. Conclusions

Rutile is extensively developed in various hydrothermal alteration stages and is associated with hydrothermal minerals such as K-feldspar, quartz, sericite, and sulfides. Based on petrographic features and trace element composition, the genesis of rutile in different alteration stages of the Xincheng gold deposit can be identified. Rutile in the K-feldspar alteration stage is of magmatic–hydrothermal origin and exhibits significantly low W characteristics. In contrast, rutile in the sericitization and pyrite–sericite–quartz alteration stages is of metamorphic hydrothermal origin, with its elemental content of W, Sn, Si, and Fe consistent with the elemental characteristics of rutile in orogenic gold deposits.
The increase in Fe and W content, as well as the negative Eu anomaly in hydrothermal rutile, indicate a decrease in both the temperature and oxygen fugacity of the altering fluids over time. Additionally, the gradual increase in the content of HFSEs such as REEs, W, V, Nb, and Sn suggests that the hydrothermal fluids are rich in F and Cl, exhibiting a weakly acidic nature. During the mineralization stage, F- and Cl-rich fluids activate and transport high-field-strength elements and base metals into the rutile lattice, resulting in changes to their chemical composition. The Zr-in-rutile thermometer has been widely used in metamorphic and magmatic environments. Noteworthily, the incorporation of Zr in hydrothermal rutile is influenced by various factors. Therefore, it is crucial to evaluate its applicability before employing the Zr-in-rutile thermometer. The variation in trace elements in hydrothermal rutile provides a means for a more comprehensive interpretation of the composition and evolution of hydrothermal fluids during the alteration–mineralization process.

Supplementary Materials

The following supporting information can be downloaded at https://www.mdpi.com/article/10.3390/min14040417/s1, Table S1: All the EPMA results of rutile. Table S2: All the LA-ICP-MS analytical results of rutile. Table S3: Results of Zr-in-rutile thermometer. Table S4: Previous research’s H-O isotopic and fluid inclusions data.

Author Contributions

Conceptualization, Z.-J.L. and L.-Q.Y.; methodology, L.-Q.Y. and D.-P.L.; software, Z.-J.L.; validation, Z.-J.L. and W.Y.; formal analysis, Z.-J.L., L.-Q.Y., T.F. and J.D.; investigation, Z.-J.L., L.-Q.Y. and T.F.; resources, Z.-J.L., L.-Q.Y. and D.-P.L.; data curation, Z.-J.L., D.X. and W.Y.; writing—original draft preparation, Z.-J.L.; writing—review and editing, Z.-J.L., L.-Q.Y. and D.X.; visualization, Z.-J.L.; supervision, L.-Q.Y.; project administration, L.-Q.Y.; funding acquisition, L.-Q.Y. All authors have read and agreed to the published version of the manuscript.

Funding

This research was funded by the Key Projects of the National Natural Science Foundation of China (42130801); the National Key R&D Program of China (2019YFA0708603); the Central Universities for the Frontiers Science Center for Deep-time Digital Earth, China University of Geosciences, Beijing, China (2652023001); the 111 Project of the Ministry of Science and Technology, China (BP0719021); the State Key Laboratory of Geological Processes and Mineral Resources at the China University of Geosciences (GPMR201812); and the Open Research Project from the State Key Laboratory of Geological Processes and Mineral Resources, China University of Geosciences (GPMR202309).

Data Availability Statement

Data are contained within the article.

Acknowledgments

Field investigation and data collection were generously supported by relevant staff from Shandong Gold Group Co., Ltd. and Liang Zhang. Thanks go to Shuang Xu from Shandong Zhengyuan Resources Survey and Research Institute and Zeng-Sheng Li from Shandong Institute of Geological Sciences for their invaluable support and assistance in the experimental phase. Additionally, I am grateful to graduate students such as Li-Gong Wang, Long Wang, Han-Tao Xu, and others for their assistance in fieldwork. My heartfelt thanks also extend to Lei Ju, Ji Liu, Shi-Yao Zhai, Cheng-Hua Tian, Hao-Shuai Wang, Jia Li, Long-Xiao Zhang, and other graduate students for their suggestions and assistance in experiments and writing. Finally, I would like to express my sincere gratitude to the reviewers for their precious comments and suggestions.

Conflicts of Interest

Li-Qiang Yang, Tao Feng, and Jun Deng are employees of the Institute of Geological Research, Shandong Gold Group Co., Ltd. The paper reflects the views of the scientists and not the company.

References

  1. Deng, J.; Wang, Q.F.; Zhang, L.; Xue, S.C.; Liu, X.F.; Yang, L.; Yang, L.Q.; Qiu, K.F.; Liang, Y.Y. Metallogenetic Model of Jiaodong-Type Gold Deposits, Eastern China. Sci. China Earth Sci. 2023, 66, 2287–2310. [Google Scholar] [CrossRef]
  2. Liu, X.D.; Deng, J.; Zhang, L.; Lin, S.Y.; Zhou, M.L.; Song, Y.Z.; Xu, X.L.; Lian, C.Q. Hydrothermal alteration of the Sizhuang gold deposit, northwestern Jiaodong Peninsula, eastern China. Acta Petrol. Sin. 2019, 35, 1551–1565. [Google Scholar] [CrossRef]
  3. Guo, L.N.; Zhang, C.; Song, Y.Z.; Chen, B.H.; Zhou, Z.; Zhang, B.L.; Xu, X.L.; Wang, Y.W. Hydrogen and oxygen isotopes geochemistry of the Wang’ershan gold deposit, Jiaodong. Acta Petrol. Sin. 2014, 30, 2481–2494. [Google Scholar]
  4. Zhang, C.; Huang, T.; Liu, X.D.; Liu, Y.; Zhao, H.; Wang, X.D. Hydrothermal alteration of the Xincheng gold deposit, northwestern Jiaodong, China. Acta Petrol. Sin. 2016, 32, 2433–2450. [Google Scholar]
  5. Zhang, B.L.; Shan, W.; Li, D.P.; Xiao, B.J.; Wang, Z.L.; Zhang, R.Z. Hydrothermal alteration in the Dayingezhuang gold deposit, Jiaodong, China. Acta Petrol Sin. 2017, 33, 2256–2272. [Google Scholar]
  6. Wang, Z.L.; Yang, L.Q.; Guo, L.N.; Marsh, E.; Wang, J.P.; Liu, Y.; Zhang, C.; Li, R.-H.; Zhang, L.; Zheng, X.-L.; et al. Fluid Immiscibility and Gold Deposition in the Xincheng Deposit, Jiaodong Peninsula, China: A Fluid Inclusion Study. Ore Geol. Rev. 2015, 65, 701–717. [Google Scholar] [CrossRef]
  7. Deng, J.; Wang, Q.F.; Liu, X.F.; Zhang, L.; Yang, L.Q.; Yang, L.; Qiu, K.F.; Guo, L.N.; Liang, Y.Y.; Ma, Y. The Formation of the Jiaodong Gold Province. Acta Geol. Sin. 2022, 96, 1801–1820. [Google Scholar] [CrossRef]
  8. Wilson, A.J.; Cooke, D.R.; Harper, B.J.; Deyell, C.L. Sulfur Isotopic Zonation in the Cadia District, Southeastern Australia: Exploration Significance and Implications for the Genesis of Alkalic Porphyry Gold–Copper Deposits. Miner. Deposita 2007, 42, 465–487. [Google Scholar] [CrossRef]
  9. Rusk, B.G.; Lowers, H.A.; Reed, M.H. Trace Elements in Hydrothermal Quartz: Relationships to Cathodoluminescent Textures and Insights into Vein Formation. Geology 2008, 36, 547–550. [Google Scholar] [CrossRef]
  10. Reed, M.; Rusk, B.; Palandri, J. The Butte Magmatic-Hydrothermal System: One Fluid Yields All Alteration and Veins. Econ. Geol. 2013, 108, 1379–1396. [Google Scholar] [CrossRef]
  11. Evans, K.A.; Tomkins, A.G.; Cliff, J.; Fiorentini, M.L. Insights into Subduction Zone Sulfur Recycling from Isotopic Analysis of Eclogite-Hosted Sulfides. Chem. Geol. 2014, 365, 1–19. [Google Scholar] [CrossRef]
  12. Peterson, E.C.; Mavrogenes, J.A. Linking High-Grade Gold Mineralization to Earthquake-Induced Fault-Valve Processes in the Porgera Gold Deposit, Papua New Guinea. Geology 2014, 42, 383–386. [Google Scholar] [CrossRef]
  13. Xing, Y.L.; Brugger, J.; Tomkins, A.; Shvarov, Y. Arsenic Evolution as a Tool for Understanding Formation of Pyritic Gold Ores. Geology 2019, 47, 335–338. [Google Scholar] [CrossRef]
  14. Clark, J.R.; Williams-Jones, A.E. Rutile as a Potential Indicator Mineral for Metamorphosed Metallic Ore Deposits; Rapport Final de DIVEX, Sous-Projet SC2; DIVEX: Montreal, QC, Canada, 2004; 17p. [Google Scholar]
  15. Zack, T.; von Eynatten, H.; Kronz, A. Rutile Geochemistry and Its Potential Use in Quantitative Provenance Studies. Sediment. Geol. 2004, 171, 37–58. [Google Scholar] [CrossRef]
  16. Meinhold, G. Rutile and Its Applications in Earth Sciences. Earth-Sci. Rev. 2010, 102, 1–28. [Google Scholar] [CrossRef]
  17. Plavsa, D.; Reddy, S.M.; Agangi, A.; Clark, C.; Kylander-Clark, A.; Tiddy, C.J. Microstructural, Trace Element and Geochronological Characterization of TiO2 Polymorphs and Implications for Mineral Exploration. Chem. Geol. 2018, 476, 130–149. [Google Scholar] [CrossRef]
  18. Pe-Piper, G.; Nagle, J.; Piper, D.J.W.; McFarlane, C.R.M. Geochronology and Trace Element Mobility in Rutile from a Carboniferous Syenite Pegmatite and the Role of Halogens. Am. Mineral. 2019, 104, 501–513. [Google Scholar] [CrossRef]
  19. Zaccarini, F.; Garuti, G.; Luvizotto, G.L.; de Melo Portella, Y.; Singh, A.K. Testing Trace-Element Distribution and the Zr-Based Thermometry of Accessory Rutile from Chromitite. Minerals 2021, 11, 661. [Google Scholar] [CrossRef]
  20. Yang, B.; Xiang, Y.H.; Gu, X.P. Tungsten-Bearing Rutile from the Jiaodong Gold Province, Shandong, China and Its Implication for Gold Mineralization. Eur. J. Mineral. 2018, 30, 975–980. [Google Scholar] [CrossRef]
  21. Agangi, A.; Reddy, S.M.; Plavsa, D.; Fougerouse, D.; Clark, C.; Roberts, M.; Johnson, T.E. Antimony in Rutile as a Pathfinder for Orogenic Gold Deposits. Ore Geol. Rev. 2019, 106, 1–11. [Google Scholar] [CrossRef]
  22. Feng, H.X.; Shen, P.; Zhu, R.X.; Ma, G.; Li, C.H.; Li, J.P. SIMS U-Pb Dating of Vein-Hosted Hydrothermal Rutile and Carbon Isotope of Fluids in the Wulong Lode Gold Deposit, NE China: Linking Gold Mineralization with Craton Destruction. Ore Geol. Rev. 2020, 127, 103838. [Google Scholar] [CrossRef]
  23. Porter, J.K.; McNaughton, N.J.; Evans, N.J.; McDonald, B.J. Rutile as a Pathfinder for Metals Exploration. Ore Geol. Rev. 2020, 120, 103406. [Google Scholar] [CrossRef]
  24. Sciuba, M.; Beaudoin, G. Texture and Trace Element Composition of Rutile in Orogenic Gold Deposits. Econ. Geol. 2021, 116, 1865–1892. [Google Scholar] [CrossRef]
  25. Wu, S.H.; Mao, J.W.; Yu, H.; Tan, D.R.; Geng, X.X. Upper Temperature Limits of Orogenic Gold Deposit Formation: Constraints from TiO2 Polymorphs in the Dongyuan Au Deposit, Jiangnan Orogen, China. Am. Mineral. 2021, 106, 1809–1817. [Google Scholar] [CrossRef]
  26. Zheng, J.H.; Chen, B.; Liu, S.J.; Bao, C. A Triassic Orogenic Gold Mineralization Event In The Paleoproterozoic Metamorphic Rocks: Evidence From Two Types Of Rutile In The Baiyun Gold Deposit, Liaodong Peninsula, North China Craton. Econ. Geol. 2022, 117, 1657–1673. [Google Scholar] [CrossRef]
  27. Shi, K.T.; Duan, X.Z.; Wang, R.; Xiao, W.Z.; Tang, Z.P.; Zhao, C.F.; Li, N. In Situ U-Pb Dating of Rutile and Titanite from the Chaihulanzi Lode Gold Deposit, Northern North China Craton and Its Geological Significance. Ore Geol. Rev. 2023, 163, 105737. [Google Scholar] [CrossRef]
  28. Zack, T.; Kronz, A.; Foley, S.F.; Rivers, T. Trace Element Abundances in Rutiles from Eclogites and Associated Garnet Mica Schists. Chem. Geol. 2002, 184, 97–122. [Google Scholar] [CrossRef]
  29. Baur, W.H. The Rutile Type and Its Derivatives†. Crystallogr. Rev. 2007, 13, 65–113. [Google Scholar] [CrossRef]
  30. Sciuba, M.; Beaudoin, G.; Makvandi, S. Chemical Composition of Tourmaline in Orogenic Gold Deposits. Miner. Deposita 2021, 56, 537–560. [Google Scholar] [CrossRef]
  31. Chen, Q.; Wang, C.M.; Bagas, L.; Du, B.; Shi, K.X.; Zhu, J.X. Hydrothermal Fluid Signatures of the Yulong Porphyry Cu-Mo Deposit: Clues from the Composition and U-Pb Dating of W-Bearing Rutile. Am. Mineral. 2023, 108, 1092–1108. [Google Scholar] [CrossRef]
  32. Bromiley, G.; Hilaret, N.; McCammon, C. Solubility of Hydrogen and Ferric Iron in Rutile and TiO2 (II): Implications for Phase Assemblages during Ultrahigh-Pressure Metamorphism and for the Stability of Silica Polymorphs in the Lower Mantle. Geophys. Res. Lett. 2004, 31, L04610. [Google Scholar] [CrossRef]
  33. Carruzzo, S.; Clarke, D.B.; Pelrine, K.M.; MacDonald, M.A. Texture, Composition, And Origin Of Rutile In The South Mountain Batholith, Nova Scotia. Can. Mineral. 2006, 44, 715–729. [Google Scholar] [CrossRef]
  34. Tomkins, H.S.; Powell, R.; Ellis, D.J. The Pressure Dependence of the Zirconium-in-Rutile Thermometer. J. Metamorph. Geol. 2007, 25, 703–713. [Google Scholar] [CrossRef]
  35. Pereira, I.; Storey, C.; Darling, J.; Lana, C.; Alkmim, A.R. Two Billion Years of Evolution Enclosed in Hydrothermal Rutile: Recycling of the São Francisco Craton Crust and Constraints on Gold Remobilisation Processes. Gondwana Res. 2019, 68, 69–92. [Google Scholar] [CrossRef]
  36. Verberne, R.; Reddy, S.M.; Saxey, D.W.; Fougerouse, D.; Rickard, W.D.A.; Plavsa, D.; Agangi, A.; Kylander-Clark, A.R.C. The Geochemical and Geochronological Implications of Nanoscale Trace-Element Clusters in Rutile. Geology 2020, 48, 1126–1130. [Google Scholar] [CrossRef]
  37. Scott, K.M. Rutile Geochemistry as a Guide to Porphyry Cu–Au Mineralization, Northparkes, New South Wales, Australia. Geochem. Explor. Environ. Anal. 2005, 5, 247–253. [Google Scholar] [CrossRef]
  38. Smythe, D.; Schulze, D.; Brenan, J. Rutile as a Kimberlite Indicator Mineral: Minor and Trace Element Geochemistry. In International Kimberlite Conference Extended Abstracts; University of Alberta Library: Edmonton, AB, Canada, 2008; Volume 9. [Google Scholar] [CrossRef]
  39. Luvizotto, G.L.; Zack, T.; Triebold, S.; von Eynatten, H. Rutile Occurrence and Trace Element Behavior in Medium-Grade Metasedimentary Rocks: Example from the Erzgebirge, Germany. Mineral. Petrol. 2009, 97, 233. [Google Scholar] [CrossRef]
  40. Agangi, A.; Plavsa, D.; Reddy, S.M.; Olierook, H.; Kylander-Clark, A. Compositional Modification and Trace Element Decoupling in Rutile: Insight from the Capricorn Orogen, Western Australia. Precambrian Res. 2020, 345, 105772. [Google Scholar] [CrossRef]
  41. Verberne, R.; van Schrojenstein Lantman, H.W.; Reddy, S.M.; Alvaro, M.; Wallis, D.; Fougerouse, D.; Langone, A.; Saxey, D.W.; Rickard, W.D.A. Trace-Element Heterogeneity in Rutile Linked to Dislocation Structures: Implications for Zr-in-Rutile Geothermometry. J. Metamorph. Geol. 2023, 41, 3–24. [Google Scholar] [CrossRef]
  42. Zack, T.; Kooijman, E. Petrology and Geochronology of Rutile. Rev. Mineral. Geochem. 2017, 83, 443–467. [Google Scholar] [CrossRef]
  43. Carocci, E.; Marignac, C.; Cathelineau, M.; Truche, L.; Poujol, M.; Boiron, M.-C.; Pinto, F. Incipient Wolframite Deposition at Panasqueira (Portugal): W-Rich Rutile and Tourmaline Compositions as Proxies for the Early Fluid Composition. Econ. Geol. 2020, 116, 123–146. [Google Scholar] [CrossRef]
  44. Liu, J.C.; Wang, Y.T.; Mao, J.W.; Jian, W.; Huang, S.K.; Hu, Q.Q.; Wei, R.; Hao, J.L. Precise Ages for Lode Gold Mineralization in the Xiaoqinling Gold Field, Southern Margin of the North China Craton: New Constraints from In Situ U-Pb Dating of Hydrothermal Monazite and Rutile. Econ. Geol. 2021, 116, 773–786. [Google Scholar] [CrossRef]
  45. Yang, F.; Mao, J.W.; Ren, W.D.; Tu, J.R.; Jepson, G.; Meng, S.Y.; Wang, Z.M. In Situ U-Pb Dating and Trace Elements of Magmatic Rutile from Mujicun Cu-Mo Deposit, North China Craton: Insights into Porphyry Mineralization. China Geol. 2023, 6, 1–18. [Google Scholar] [CrossRef]
  46. Ma, X.D. Structural Alteration Mineralization Network Structure of the Xincheng Gold Deposit. Master’s Thesis, China University of Geosciences (Beijing), Beijing, China, 2011. (In Chinese). [Google Scholar]
  47. Wang, Z.L. Jiaojia Gold Orefield Metallogenic System. Ph.D. Thesis, China University of Geosciences (Beijing), Beijing, China, 2012. (In Chinese). [Google Scholar]
  48. Yang, L.Q.; Deng, J.; Wang, Z.L.; Zhang, L.; Guo, L.N.; Song, M.C.; Zheng, X.L. Mesozoic gold metallogenic system of the Jiaodong gold province, eastern China. Acta Petrol. Sin. 2014, 30, 2447–2467. [Google Scholar]
  49. Yang, L.Q.; Deng, J.; Guo, R.P.; Guo, L.N.; Wang, Z.L.; Chen, B.H.; Wang, X.D. World-Class Xincheng Gold Deposit: An Example from the Giant Jiaodong Gold Province. Geosci. Front. 2016, 7, 419–430. [Google Scholar] [CrossRef]
  50. Goldfarb, R.J.; Santosh, M. The Dilemma of the Jiaodong Gold Deposits: Are They Unique? Geosci. Front. 2014, 5, 139–153. [Google Scholar] [CrossRef]
  51. Phillips, G.N.; Powell, R. A Practical Classification of Gold Deposits, with a Theoretical Basis. Ore Geol. Rev. 2015, 65, 568–573. [Google Scholar] [CrossRef]
  52. Deng, J.; Wang, C.M.; Bagas, L.; Santosh, M.; Yao, E.Y. Crustal Architecture and Metallogenesis in the South-Eastern North China Craton. Earth-Sci. Rev. 2018, 182, 251–272. [Google Scholar] [CrossRef]
  53. Deng, J.; Yang, L.Q.; Groves, D.I.; Zhang, L.; Qiu, K.F.; Wang, Q.F. An Integrated Mineral System Model for the Gold Deposits of the Giant Jiaodong Province, Eastern China. Earth-Sci. Rev. 2020, 208, 103274. [Google Scholar] [CrossRef]
  54. Zhang, L.; Weinberg, R.F.; Yang, L.Q.; Groves, D.I.; Sai, S.X.; Matchan, E.; Phillips, D.; Kohn, B.P.; Miggins, D.P.; Liu, Y.; et al. Mesozoic Orogenic Gold Mineralization in the Jiaodong Peninsula, China: A Focused Event at 120 ± 2 Ma During Cooling of Pregold Granite Intrusions. Econ. Geol. 2020, 115, 415–441. [Google Scholar] [CrossRef]
  55. Qiu, K.F.; Deng, J.; Sai, S.X.; Yu, H.C.; Tamer, M.T.; Ding, Z.J.; Yu, X.F.; Goldfarb, R. Low-Temperature Thermochronology for Defining the Tectonic Controls on Heterogeneous Gold Endowment Across the Jiaodong Peninsula, Eastern China. Tectonics 2023, 42, e2022TC007669. [Google Scholar] [CrossRef]
  56. Tang, J.; Zheng, Y.F.; Wu, Y.B.; Gong, B.; Zha, X.; Liu, X. Zircon U–Pb Age and Geochemical Constraints on the Tectonic Affinity of the Jiaodong Terrane in the Sulu Orogen, China. Precambrian Res. 2008, 161, 389–418. [Google Scholar] [CrossRef]
  57. Zhai, M.G.; Santosh, M. The Early Precambrian Odyssey of the North China Craton: A Synoptic Overview. Gondwana Res. 2011, 20, 6–25. [Google Scholar] [CrossRef]
  58. Yang, L.Q.; Deng, J.; Wang, Z.L.; Guo, L.N.; Li, R.H.; Groves, D.I.; Danyushevsky, L.V.; Zhang, C.; Zheng, X.-L.; Zhao, H. Relationships Between Gold and Pyrite at the Xincheng Gold Deposit, Jiaodong Peninsula, China: Implications for Gold Source and Deposition in a Brittle Epizonal Environment. Econ. Geol. 2016, 111, 105–126. [Google Scholar] [CrossRef]
  59. Tang, J.; Zheng, Y.F.; Wu, Y.B.; Gong, B.; Liu, X. Geochronology and Geochemistry of Metamorphic Rocks in the Jiaobei Terrane: Constraints on Its Tectonic Affinity in the Sulu Orogen. Precambrian Res. 2007, 152, 48–82. [Google Scholar] [CrossRef]
  60. Jahn, B.M.; Liu, D.; Wan, Y.; Song, B.; Wu, J. Archean Crustal Evolution of the Jiaodong Peninsula, China, as Revealed by Zircon SHRIMP Geochronology, Elemental and Nd-Isotope Geochemistry. Am. J. Sci. 2008, 308, 232–269. [Google Scholar] [CrossRef]
  61. Feng, Y.C.; Qiu, K.F.; Wang, D.Z.; Sha, W.J.; Li, S. Forming conditions of tellurides and their constraints on gold enrichment in Linglong gold district, Jiaodong gold province. Acta Petrol. Sin. 2022, 38, 63–77. [Google Scholar] [CrossRef]
  62. Deng, J.; Liu, X.F.; Wang, Q.F.; Dilek, Y.; Liang, Y.Y. Isotopic Characterization and Petrogenetic Modeling of Early Cretaceous Mafic Diking-Lithospheric Extension in the North China Craton, Eastern Asia. GSA Bulletin. 2017, 129, 1379–1407. [Google Scholar] [CrossRef]
  63. Yang, L.Q.; Deng, J.; Goldfarb, R.J.; Zhang, J.; Gao, B.F.; Wang, Z.L. 40Ar/39Ar Geochronological Constraints on the Formation of the Dayingezhuang Gold Deposit: New Implications for Timing and Duration of Hydrothermal Activity in the Jiaodong Gold Province, China. Gondwana Res. 2014, 25, 1469–1483. [Google Scholar] [CrossRef]
  64. Shandong Gold Mining Co., Ltd. 2022 Annual Report. Shandong Gold Mining Co., Ltd.: Jinan, China, 2022. [Google Scholar]
  65. Yang, L.Q.; Wei, Y.J.; Wang, S.R.; Zhang, L.; Ju, L.; Li, R.H.; Gao, X.; Qiu, K.F. A preliminary study of reserve estimate and resource potential assessment of critical elements in the Jiaodong gold deposits, China. Acta Petrol. Sin. 2022, 38, 9–22. [Google Scholar] [CrossRef]
  66. Wang, Z.L.; Yang, L.Q.; Deng, J.; Santosh, M.; Zhang, H.F.; Liu, Y.; Li, R.H.; Huang, T.; Zheng, X.L.; Zhao, H. Gold-Hosting High Ba-Sr Granitoids in the Xincheng Gold Deposit, Jiaodong Peninsula, East China: Petrogenesis and Tectonic Setting. J. Asian Earth Sci. 2014, 95, 274–299. [Google Scholar] [CrossRef]
  67. Liu, Y.; Yang, L.Q.; Wang, Z.L.; Zhang, L.; Zhang, C.; Wang, X.D. Petrogeochemistry and Geochronology of Gold-Hosting Monzogranites in the Xincheng Gold Deposit, Jiaodong Peninsula, China: Implication for Gold Mineralization. Acta Geol. Sin. 2014, 88, 1646–1647. [Google Scholar] [CrossRef]
  68. Wen, B.J.; Fan, H.R.; Hu, F.F.; Liu, X.; Yang, K.F.; Sun, Z.F.; Sun, Z.F. Fluid Evolution and Ore Genesis of the Giant Sanshandao Gold Deposit, Jiaodong Gold Province, China: Constrains from Geology, Fluid Inclusions and H–O–S–He–Ar Isotopic Compositions. J. Geochem. Explor. 2016, 171, 96–112. [Google Scholar] [CrossRef]
  69. Wang, H.; Yang, L.Q.; Wang, S.R.; Zhang, L.; Wei, Y.J.; Lü, G.Y. The process of rubefication and its relationship with gold mineralization of Sizhuang gold deposit, northwestern Jiaodong Peninsula, eastern China. Acta Petrol. Sin. 2020, 36, 1515–1528. [Google Scholar] [CrossRef]
  70. Liu, Y.S.; Hu, Z.C.; Gao, S.; Günther, D.; Xu, J.; Gao, C.G.; Chen, H.H. In Situ Analysis of Major and Trace Elements of Anhydrous Minerals by LA-ICP-MS without Applying an Internal Standard. Chem. Geol. 2008, 257, 34–43. [Google Scholar] [CrossRef]
  71. Taylor, S.R.; McLennan, S.M. The Geochemical Evolution of the Continental Crust. Rev. Geophys. 1995, 33, 241–265. [Google Scholar] [CrossRef]
  72. McDonough, W.F.; Sun, S. -s. The Composition of the Earth. Chem. Geol. 1995, 120, 223–253. [Google Scholar] [CrossRef]
  73. Zhu, Z.Y.; Cook, N.J.; Yang, T.; Ciobanu, C.L.; Zhao, K.D.; Jiang, S.Y. Mapping of Sulfur Isotopes and Trace Elements in Sulfides by LA-(MC)-ICP-MS: Potential Analytical Problems, Improvements and Implications. Minerals 2016, 6, 110. [Google Scholar] [CrossRef]
  74. Fan, H.R.; Li, X.H.; Zuo, Y.B.; Chen, L.; Liu, S.; Hu, F.F.; Feng, K. In-situ LA-(MC)-ICPMS and (Nano)SIMS trace elements and sulfur isotope analyses on sulfides and application to confine metallogenic process of ore deposit. Acta Petrol. Sin. 2018, 34, 3479–3496. [Google Scholar]
  75. Pi, Q.H.; Hu, R.Z.; Xiong, B.; Li, Q.L.; Zhong, R.C. In Situ SIMS U-Pb Dating of Hydrothermal Rutile: Reliable Age for the Zhesang Carlin-Type Gold Deposit in the Golden Triangle Region, SW China. Miner. Deposita 2017, 52, 1179–1190. [Google Scholar] [CrossRef]
  76. Doyle, M.G.; Fletcher, I.R.; Foster, J.; Large, R.R.; Mathur, R.; McNaughton, N.J.; Meffre, S.; Muhling, J.R.; Phillips, D.; Rasmussen, B. Geochronological Constraints on the Tropicana Gold Deposit and Albany-Fraser Orogen, Western Australia. Econ. Geol. 2015, 110, 355–386. [Google Scholar] [CrossRef]
  77. Ye, G.L.; Yang, L.Q.; Zhang, L.; Wang, S.R.; Wei, Y.J.; Xie, D.; Yang, W.; Liu, Y.Q. 2023. Characteristics and in situ U-Pb dating of rutile in Xiadian, Jiaong gold provience, eastern China. Acta Petrol Sin. 2023, 39, 340–356. [Google Scholar] [CrossRef]
  78. Scott, K.M.; Radford, N.W. Rutile Compositions at the Big Bell Au Deposit as a Guide for Exploration. Geochem. Explor. Environ. Anal. 2007, 7, 353–361. [Google Scholar] [CrossRef] [PubMed]
  79. Scott, K.M.; Radford, N.W.; Hough, R.M.; Reddy, S.M. Rutile Compositions in the Kalgoorlie Goldfields and Their Implications for Exploration. Aust. J. Earth Sci. 2011, 58, 803–812. [Google Scholar] [CrossRef]
  80. Schirra, M.; Laurent, O. Petrochronology of Hydrothermal Rutile in Mineralized Porphyry Cu Systems. Chem. Geol. 2021, 581, 120407. [Google Scholar] [CrossRef]
  81. Win, M.M.; Enami, M.; Kato, T.; Thu, Y.K. A Mechanism for Nb Incorporation in Rutile and Application of Zr-in-Rutile Thermometry: A Case Study from Granulite Facies Paragneisses of the Mogok Metamorphic Belt, Myanmar. Mineral. Mag. 2017, 81, 1503–1521. [Google Scholar] [CrossRef]
  82. Eilu, P.K.; Mathison, C.; Groves, D.; Allardyce, W. Atlas of Alteration Assemblages, Styles and Zoning in Orogenic Lode-Gold Deposits in a Variety of Host Rock and Metamorphic Settings; University of Western Australia, Geology Department and Extension Service: Perth, Australia, 1999; Volume 30, ISBN 978-0-86422-902-1. [Google Scholar]
  83. Liu, L.; Xiao, Y.L.; Wörner, G.; Kronz, A.; Simon, K.; Hou, Z.H. Detrital Rutile Geochemistry and Thermometry from the Dabie Orogen: Implications for Source–Sediment Links in a UHPM Terrane. J. Asian Earth Sci. 2014, 89, 123–140. [Google Scholar] [CrossRef]
  84. Klemme, S.; Prowatke, S.; Hametner, K.; Günther, D. Partitioning of Trace Elements between Rutile and Silicate Melts: Implications for Subduction Zones. Geochim. Cosmochim. Acta 2005, 69, 2361–2371. [Google Scholar] [CrossRef]
  85. Majzlan, J.; Bolanz, R.; Göttlicher, J.; Mikuš, T.; Milovská, S.; Čaplovičová, M.; Števko, M.; Rössler, C.; Matthes, C. Incorporation Mechanism of Tungsten in W-Fe-Cr-V-Bearing Rutile. Am. Mineral. 2021, 106, 609–619. [Google Scholar] [CrossRef]
  86. Li, X.L.; Zhang, L.F.; Wei, C.J.; Zhang, G.B. Application of Zr-in-rutile thermometry and its interpretation on the Archean eclogite from Belomorian province, Russia. Acta Petrol. Sin. 2017, 33, 3263–3277. [Google Scholar]
  87. Ward, C.D.; Mcarthur, J.M.; Walsh, J.N. Rare Earth Element Behaviour During Evolution and Alteration of the Dartmoor Granite, SW England. J. Petrol. 1992, 33, 785–815. [Google Scholar] [CrossRef]
  88. Zheng, F.S.; Song, G.X. Application of Eu anomaly in Geology. Acta Petrol. Sin. 2023, 39, 2832–2856. [Google Scholar] [CrossRef]
  89. She, H.D.; Fan, H.R.; Hu, F.F.; Yang, K.F.; Yang, Z.F.; Wang, Q.W. Migration and precipitation of rare earth elements in the hydrothermal fluids. Acta Petrol. Sin. 2018, 34, 3567–3581. [Google Scholar]
  90. Wang, Y.R.; Hu, S.X. Experimental study on gold activation and transfer in the process of potassium metasomatic alteration—Taking gold deposits in North China platform as an example. Sci. China Earth Sci. 2000, 30, 499–509. [Google Scholar] [CrossRef]
  91. Migdisov, A.; Williams-Jones, A.E.; Brugger, J.; Caporuscio, F.A. Hydrothermal Transport, Deposition, and Fractionation of the REE: Experimental Data and Thermodynamic Calculations. Chem. Geol. 2016, 439, 13–42. [Google Scholar] [CrossRef]
  92. Liu, Y.; Chao, C.; Xiao, C.S.; Guo, D.X.; Zi, J.L.; Hai, X.Z.; Yu, H.J. The Formation Model of the Carbonatite-Syenite Complex REE Deposits in the East to of Tibetan Plateau: A Case Study of Dalucao REE Deposits. Acta Petrol. Sin. 2017, 33, 1978–2000. [Google Scholar]
  93. Ferry, J.M.; Watson, E.B. New Thermodynamic Models and Revised Calibrations for the Ti-in-Zircon and Zr-in-Rutile Thermometers. Contrib. Mineral. Petrol. 2007, 154, 429–437. [Google Scholar] [CrossRef]
  94. Kohn, M.J. A Refined Zirconium-in-Rutile Thermometer. Am. Mineral. 2020, 105, 963–971. [Google Scholar] [CrossRef]
  95. Jiang, Z.; Oliver, N.H.S.; Barr, T.D.; Power, W.L.; Ord, A. Numerical Modeling of Fault-Controlled Fluid Flow in the Genesis of Tin Deposits of the Malage Ore Field, Gejiu Mining District, China. Econ. Geol. 1997, 92, 228–247. [Google Scholar] [CrossRef]
  96. Chevychelov, V.Y.; Zaraisky, G.P.; Borisovskii, S.E.; Borkov, D.A. Effect of Melt Composition and Temperature on the Partitioning of Ta, Nb, Mn, and F between Granitic (Alkaline) Melt and Fluorine-Bearing Aqueous Fluid: Fractionation of Ta and Nb and Conditions of Ore Formation in Rare-Metal Granites. Petrol. C/C Petrol. 2005, 13, 305. [Google Scholar]
  97. Zhang, Q.B.; Ding, Z.J.; Qiu, K.F.; Qu, P.; Zhao, X. Hydrothermal origin of the Jiaojia altered rock type gold deposit: Constrains from mineralogy, geochronology and geochemistry of apatite. Acta Petrol. Sin. 2023, 39, 411–431. [Google Scholar] [CrossRef]
  98. Pokrovski, G.S.; Akinfiev, N.N.; Borisova, A.Y.; Zotov, A.V.; Kouzmanov, K. Gold Speciation and Transport in Geological Fluids: Insights from Experiments and Physical-Chemical Modelling. Geol. Soc. Lond. Spec. Publ. 2014, 402, 9–70. [Google Scholar] [CrossRef]
  99. Ling, H.F.; Hu, S.X.; Sun, J.G.; Ni, P.; Shen, K. Geochemical Study of Granitic wall-rock Alteration in Dayingezhuang Gold Deposit of Alteration Rock Type and Jinqingding Gold Deposit of Quartz-vein Type. Min Miner. Depos. 2002, 21, 187–199. [Google Scholar] [CrossRef]
  100. Wei, Q.; Fan, H.R.; Lan, T.G.; Liu, X.; Jiang, X.H.; Wen, B.J. Genesis of Sizhuang gold deposit, Jiaodong Peninsula: Evidences from fluid inclusion and quartz solubility modeling. Acta Petrol. Sin. 2015, 31, 1049–1062. [Google Scholar]
  101. Li, X.H.; Klyukin, Y.I.; Steele-MacInnis, M.; Fan, H.R.; Yang, K.F.; Zoheir, B. Phase Equilibria, Thermodynamic Properties, and Solubility of Quartz in Saline-Aqueous-Carbonic Fluids: Application to Orogenic and Intrusion-Related Gold Deposits. Geochim. Cosmochim. Acta 2020, 283, 201–221. [Google Scholar] [CrossRef]
Figure 2. (a) A simplified geological map of the Jiaojia gold belt. Modified from Yang et al., 2016 [49]. The Xincheng gold deposit is located at the northern segment of the Jiaojia fault. (b) A 191’ exploration line vertical cross-section view of the Xincheng gold deposit.
Minerals 14 00417 g002
Figure 3. (a) Guojialing granite with K-feldspar phenocrysts. (b,c) Optical microscopy microphotographs of Guojialing granite: (b) The dark minerals are mainly hornblende with minor or traces of biotite, and magmatic titanite. (c) Zircon and apatite are associated with magmatic K-feldspar and biotite. (d) Unaltered Linglong granite. (e,f) Optical microscopy microphotographs of Linglong granite, including quartz, plagioclase, biotite, K-feldspar, and minor or traces of apatite and zircon. Abbreviations: Ap = apatite; Bt = biotite; Hbl = hornblende; Kfs = K-feldspar; Pl = plagioclase; Qz = quartz; Ttn = titanite; and Zrn = zircon.
Minerals 14 00417 g003
Figure 4. (a) Within the K-feldspar alteration zone, vein-like (pyrite) sericite–quartz alteration is developed. (b) Quartz–calcite veins intersect and traverse the mineralization-stage sericitization. (c) Hydrothermal K-feldspar after plagioclase. (d) The partial alteration of plagioclase, accompanied by the formation of quartz and scaly sericite. (e) Pyrite–sericite–quartz alteration with pyrite coexisting with fine-grained quartz and sericite. (f) Late-stage calcite veins intersect plagioclase, quartz, muscovite, and sericite, containing minor pyrite. (g) Gold inclusions within euhedral to subhedral pyrite. (h) Gold coexisting with sulfide minerals such as sphalerite, chalcopyrite, and galena. (i) Fractured pyrite filled by galena and sphalerite. (cf) Photomicrographs were taken under orthogonal polarization. (gi) Photomicrographs were taken under reflected light. Abbreviations: Ap = apatite; Bt = biotite; Cal = calcite; Ccp = chalcopyrite; Au = gold; Gn = galena; Kfs = K-feldspar; Mus = muscovite; Pl = plagioclase; Py = pyrite; Qz = quartz; Ser = sericite; Sp = sphalerite; and Ttn = titanite.
Minerals 14 00417 g004
Figure 5. Raman analysis results of TiO2 minerals from the Xincheng gold deposit. Comparison of standard Raman spectra of TiO2 polymorphs (brookite, anatase, and rutile; Meinhold, 2010 [16]) with Raman spectra of samples from this study.
Minerals 14 00417 g005
Figure 6. Micrographs and BSE images of rutile in different hydrothermal alteration stages: (a,b) Rt1-type rutile occurs in the K-feldspar alteration stage, coexisting with hydrothermal K-feldspar and quartz; and (c) anatase, rutile, and quartz that formed within the pseudomorph of sphene are in coexistence with hydrothermal K-feldspar. (d) Altered biotite with needle-like rutile precipitating along its joints; (eh) Rt2-type rutile coexisting with sericite and quartz; (ik) Rt3-type rutile in the pyrite–sericite–quartz alteration, coexisting with metal sulfides such as pyrite, fine-grained sericite, and quartz, showing distinct zoning and bright spots in the BSE image; (l) fine-grained rutile coexisting with polymetallic sulfides such as chalcopyrite, sphalerite, and pyrite. (b,f,h) Photomicrographs were taken under orthogonal polarization; (a,c,e,i,j,l) photomicrographs were taken under reflected light; (d,g,k) BSE images. Abbreviations: Ant = anatase; Ccp = chalcopyrite; Kfs = K-feldspar; Mus = muscovite; Pl = plagioclase; Py = pyrite; Qz = quartz; Rt = rutile; Ser = sericite; and Sp = sphalerite.
Minerals 14 00417 g006
Figure 7. The elements’ box-and-whisker diagram in rutile from the Xincheng gold deposit. (a,b) LA-ICP-MS data; (c,d) EPMA data.
Minerals 14 00417 g007
Figure 8. Chondrite-normalized REE patterns of different types of rutile. (a) The rutile at K-feldspar alteration stage; (b) The rutile at sericitization stage; (c) The rutile at pyrite–sericite–quartz alteration stage. The geochemical data of the upper crust are from [71], and chondrite is derived from [72].
Minerals 14 00417 g008
Figure 9. Correlation diagrams of rutile elements in the Xincheng gold deposit. (a) TiO2 vs. WO3; (b) Nb2O5 vs. WO3; (c) TiO2 vs. Nb2O5; (d) Nb2O5 vs. V2O3; (e) TiO2 vs. V2O3; (f) V2O3 vs. WO3.
Minerals 14 00417 g009
Figure 10. EPMA semi-quantitative element mapping results of Rt2-type rutile in the Xincheng gold deposit. (a) Under backscattered electron and element EPMA maps in (b) Ti, (c) W, (d) Fe, (e) Nb, (f) V, (g) Ca, (h) Al, and (i) Cr. Red, yellow, and green indicate high concentrations of trace elements, and blue, purple, and black represent lower concentrations of trace elements.
Minerals 14 00417 g010
Figure 11. EPMA semi-quantitative element mapping results of Rt3-type rutile in the Xincheng gold deposit. The explanations of sub-figures (ai) and color scheme used is consistent with Figure 10.
Minerals 14 00417 g011
Figure 12. Trace element diagram of rutile in Xincheng gold deposit: (a) discrimination of rutile genesis by Zr vs. W content (modified from [26]); (b) Nb/V vs. W; (c) V vs. Sn; and (d) changes in W content of rutile during different alteration stages, with dashed lines representing detection limit of 0.04 wt% for WO3 (modified from [23]). (b,c) Constructed areas or dot lines modified based on original work of [24]. (ad) Data are derived from LA-ICP-MS analysis.
Minerals 14 00417 g012
Figure 13. A binary diagram of the cation percentage abundance in rutile: (a) Ti and X3+ + Y5+ and (b) Ti and 2X3 + + Z6 +. Data are from EPMA analysis. X3 + represents the sum of trivalent cations, such as Fe3 +, Cr3 +, and V3+; Y5 + represents the sum of pentavalent cations, such as Nb5 +and Ta5 +; Z6 + represents the sum of hexavalent cations, such as W6 +.
Minerals 14 00417 g013
Figure 14. The frequency percent of Zr-in-rutile temperatures (in degrees Celsius) in the alteration stages of the Xincheng gold deposit.
Minerals 14 00417 g014
Disclaimer/Publisher’s Note: The statements, opinions and data contained in all publications are solely those of the individual author(s) and contributor(s) and not of MDPI and/or the editor(s). MDPI and/or the editor(s) disclaim responsibility for any injury to people or property resulting from any ideas, methods, instructions or products referred to in the content.

