
Study on the Performance of Recycled Cement-Stabilized Macadam Mixture Improved Using Alkali-Activated Lithium Slag–Fly Ash Composite

Abstract
1. Introduction
2. Materials and Methods
2.1. Materials
2.2. Mixture Ratio
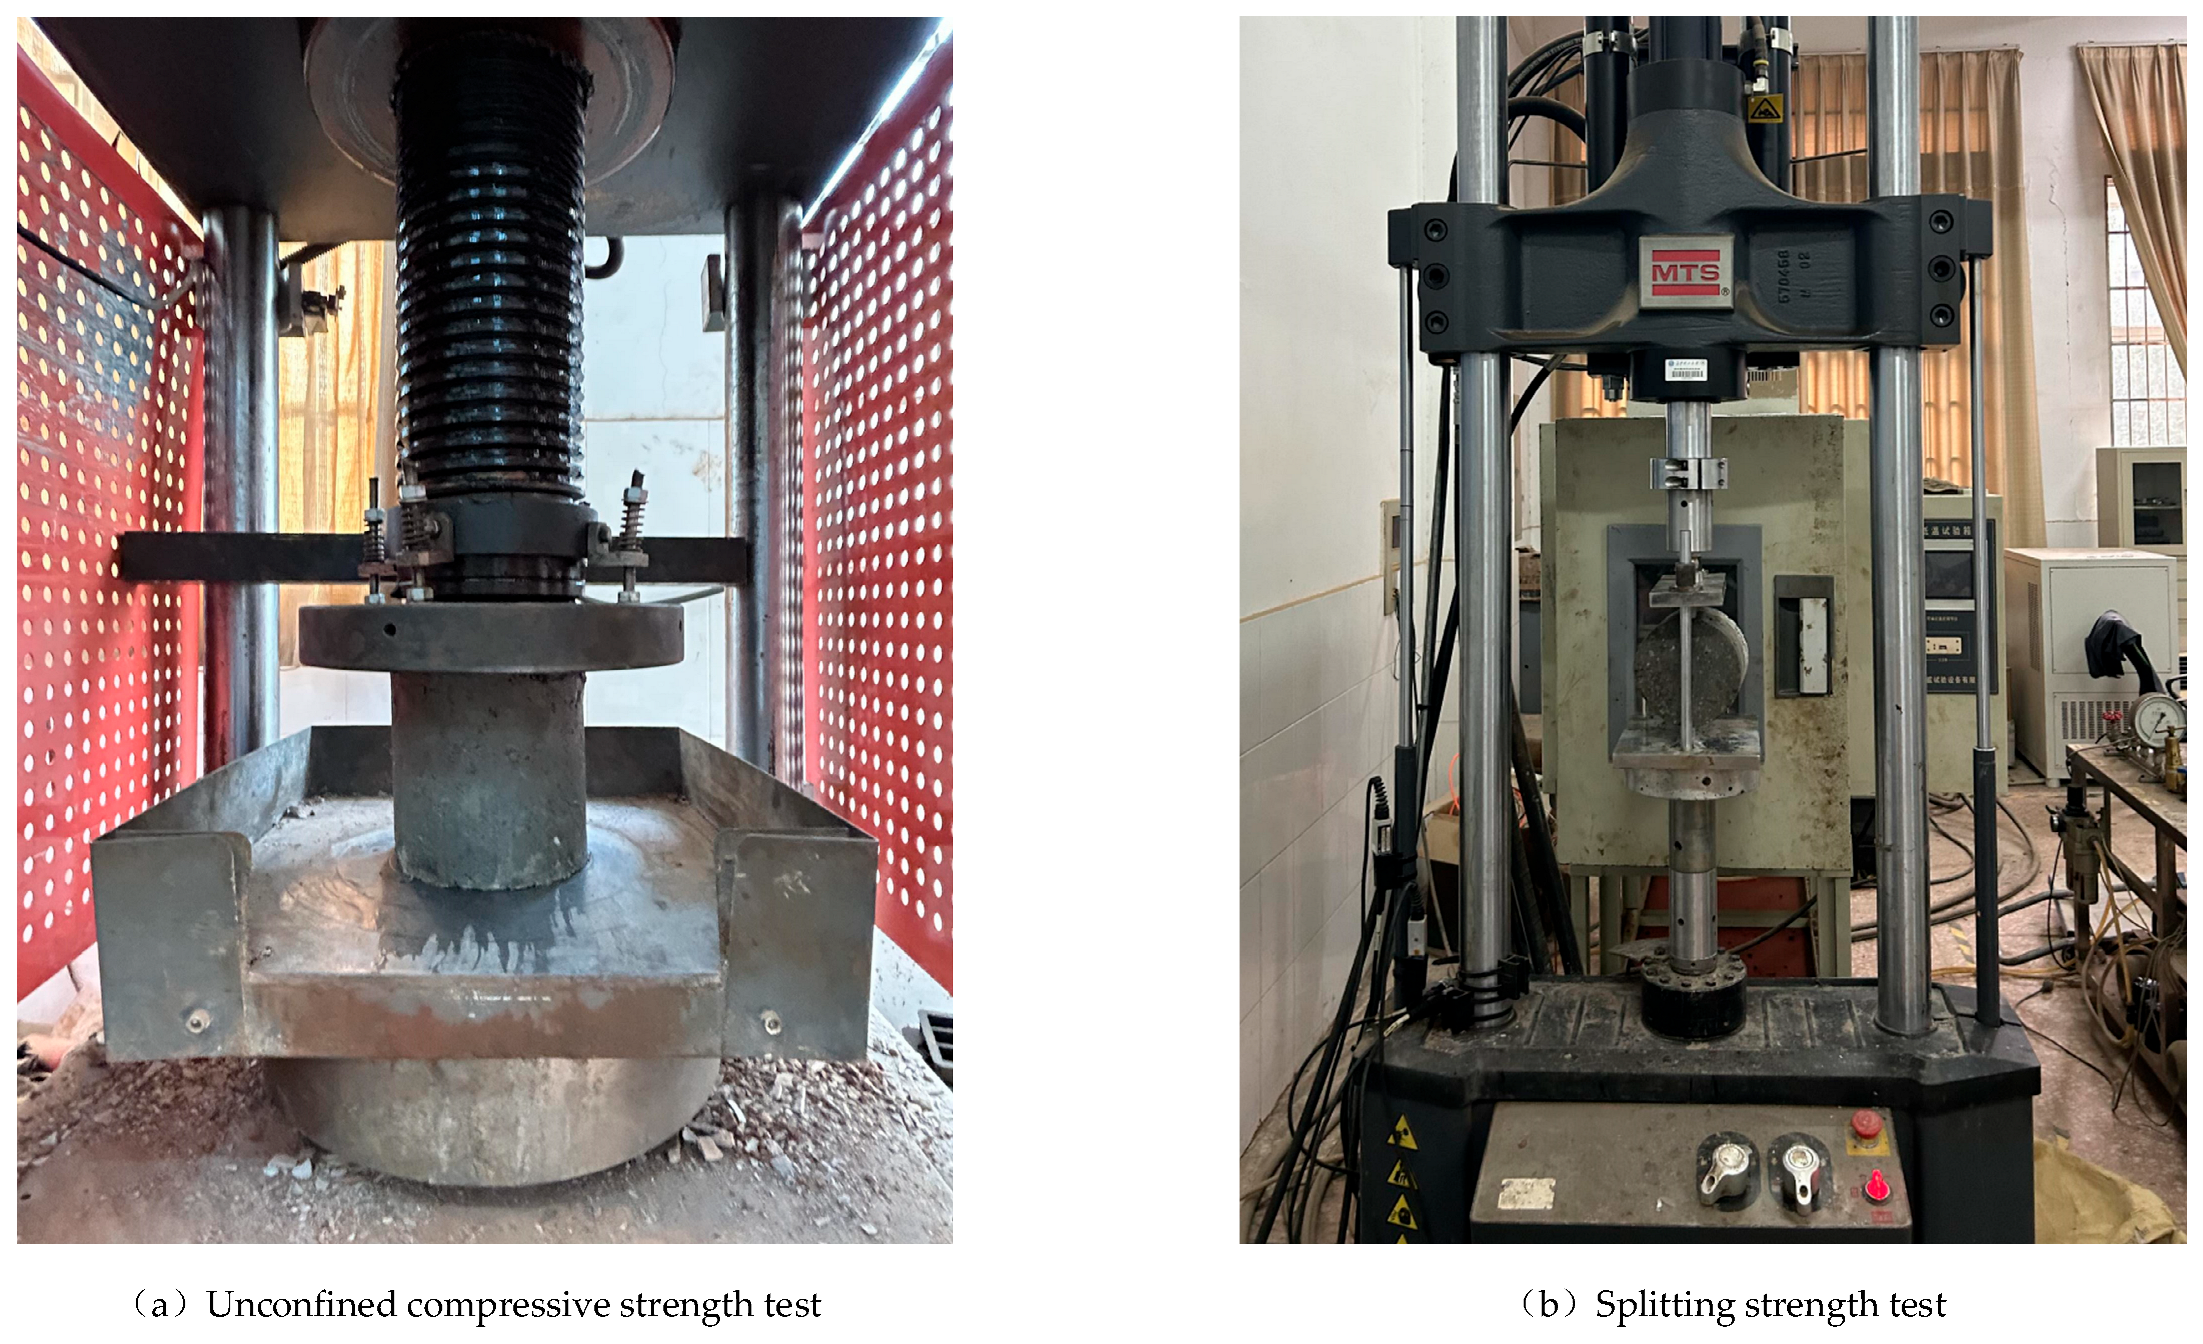
2.3. Strength Test
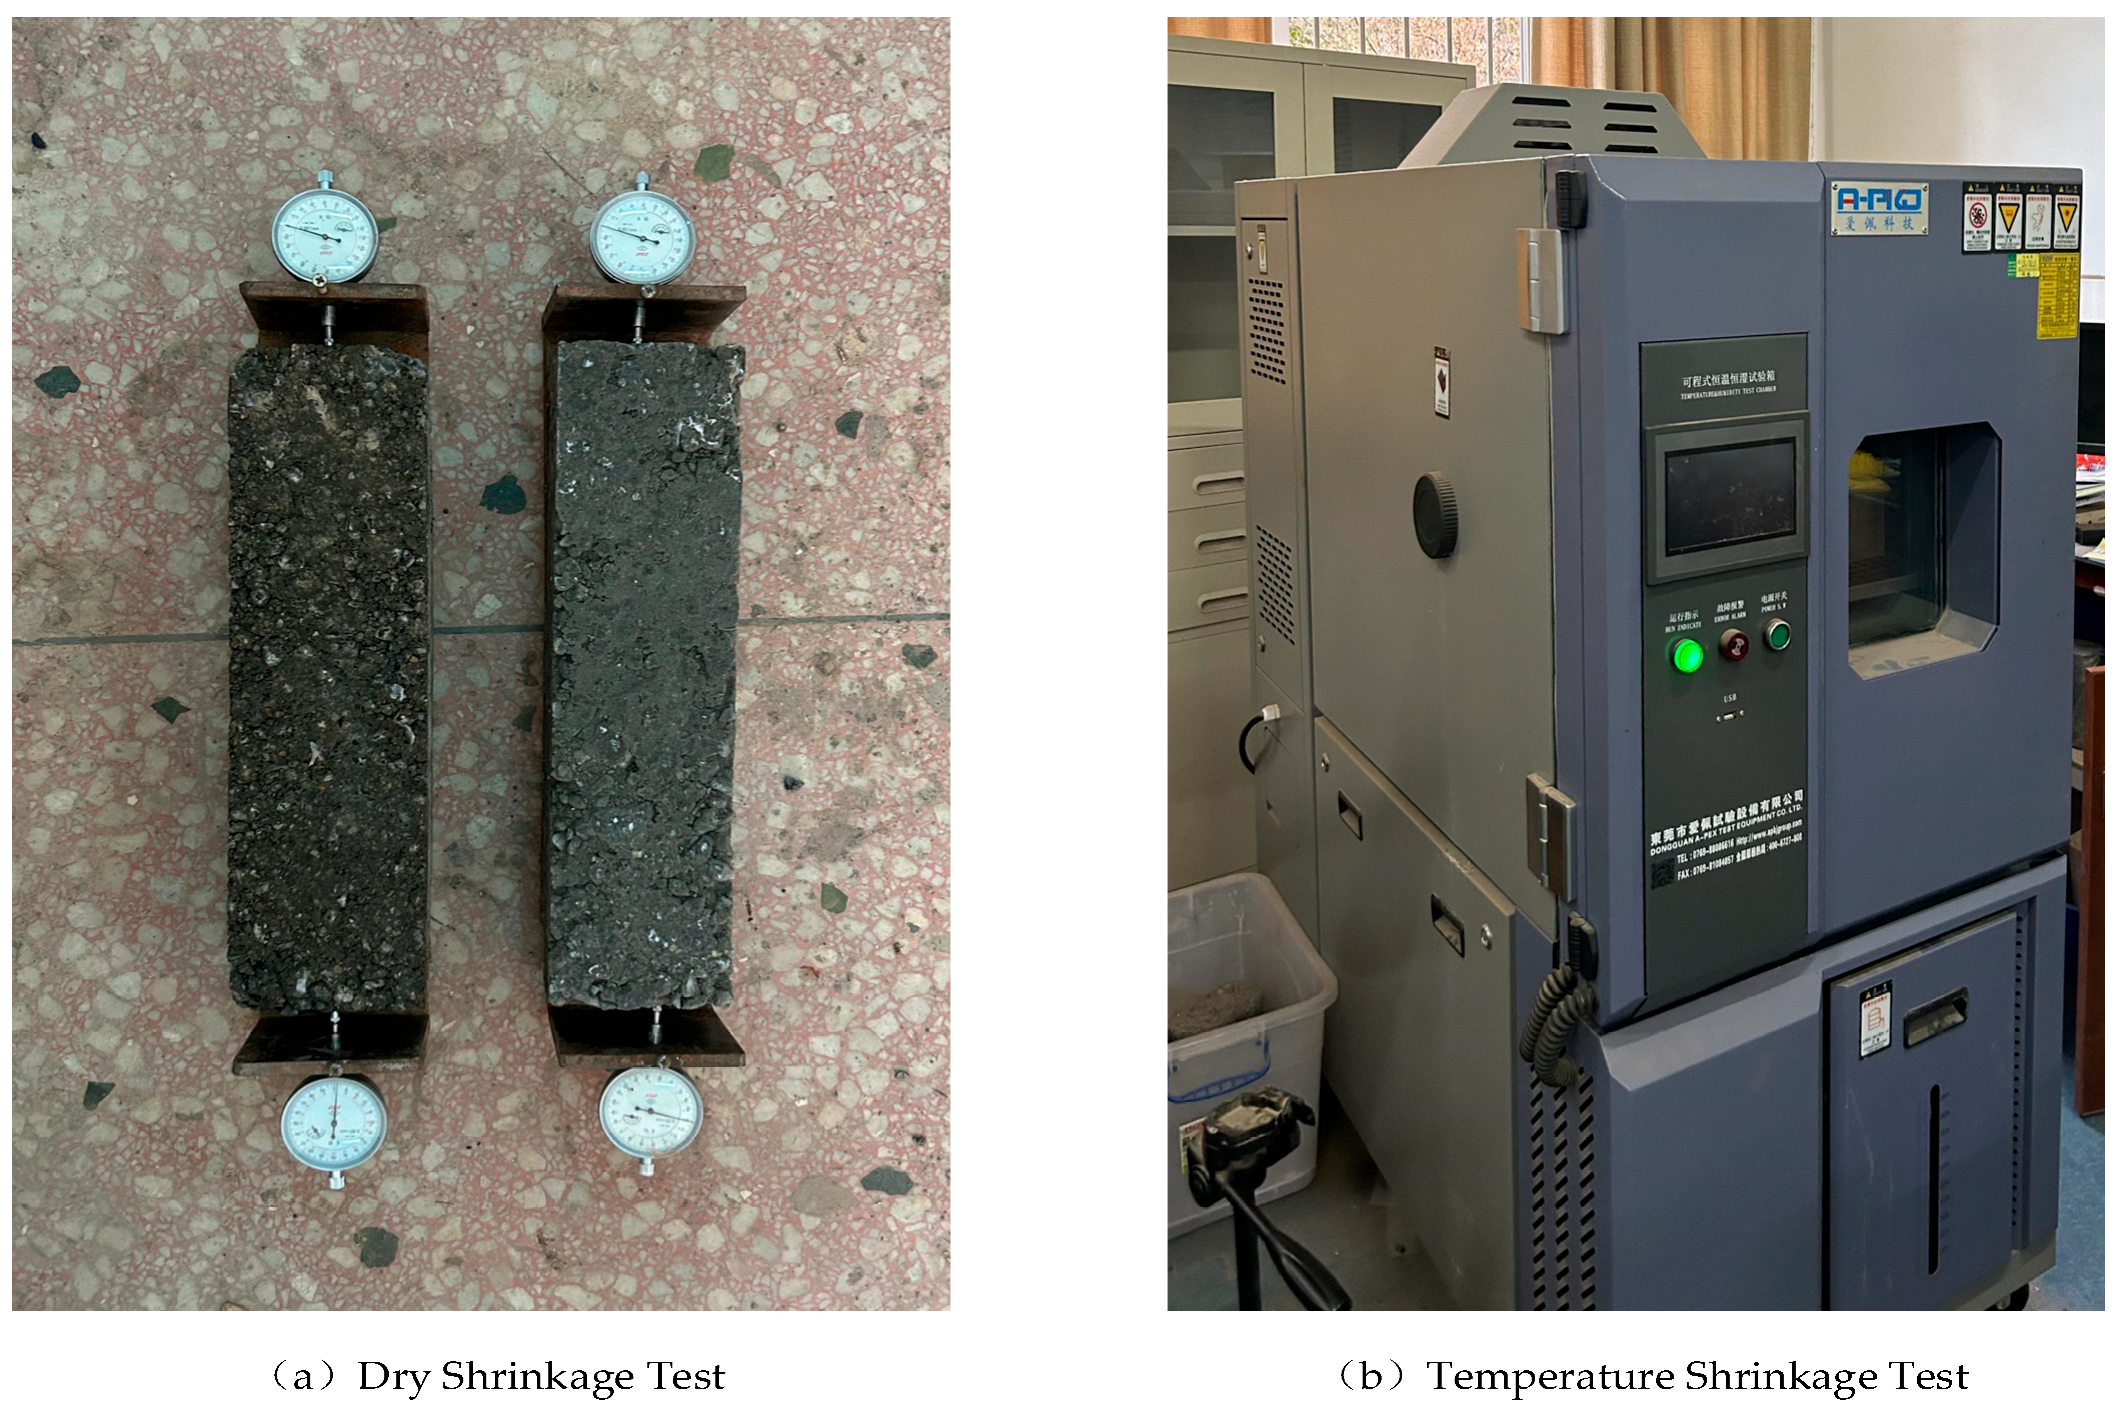
2.4. Dry Shrinkage/Temperature Shrinkage Test
2.5. Microscopic Tests
3. Results and Discussion
3.1. Performance Test
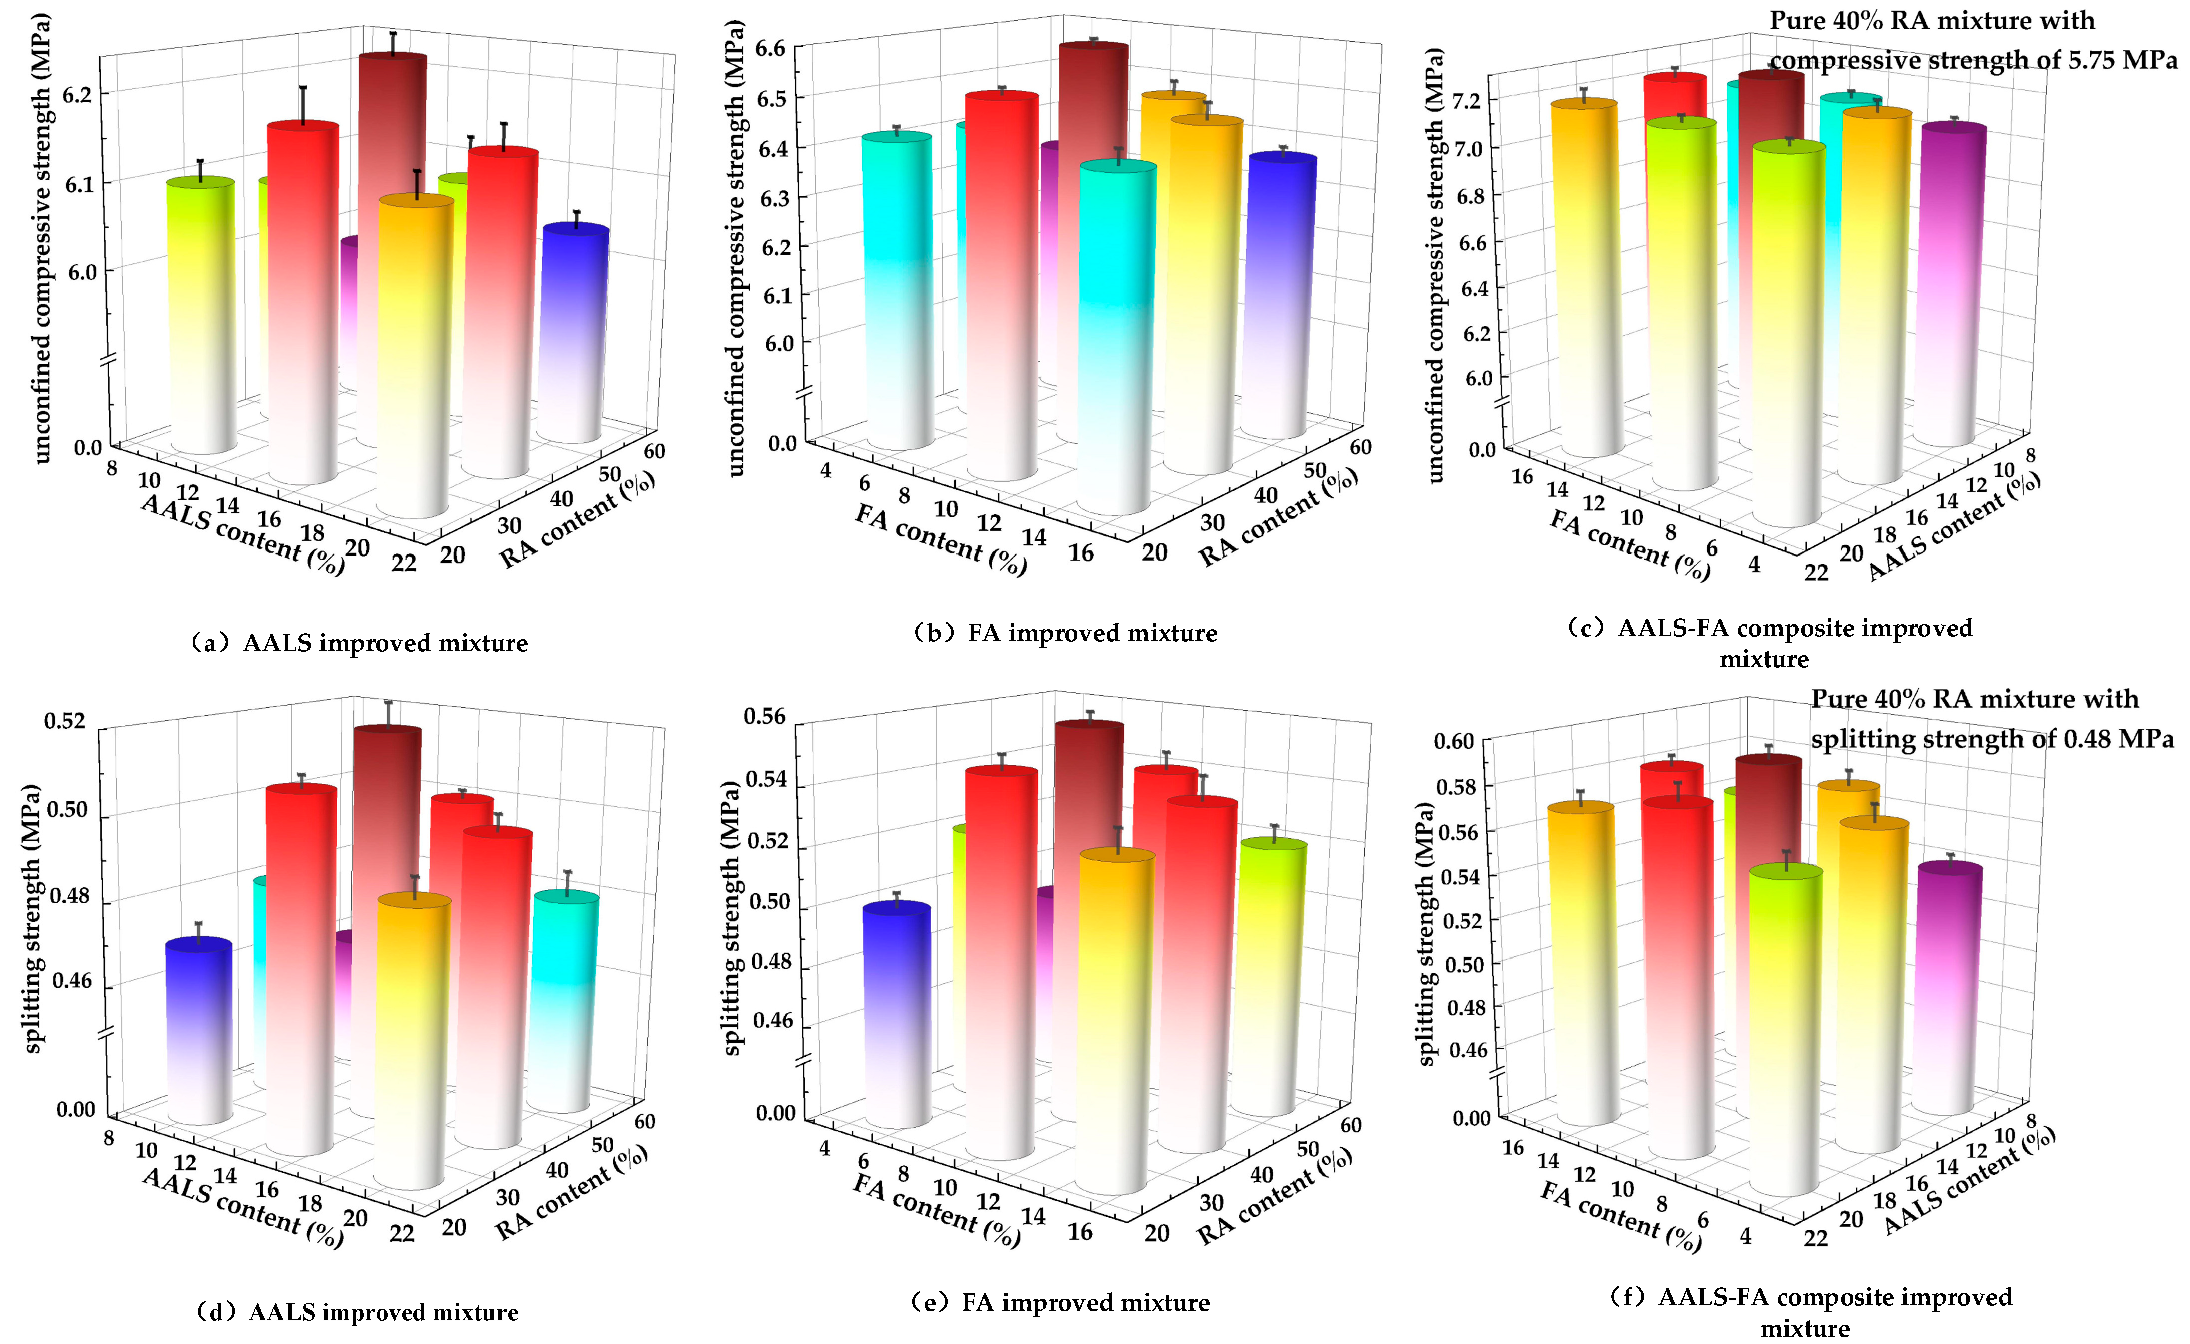
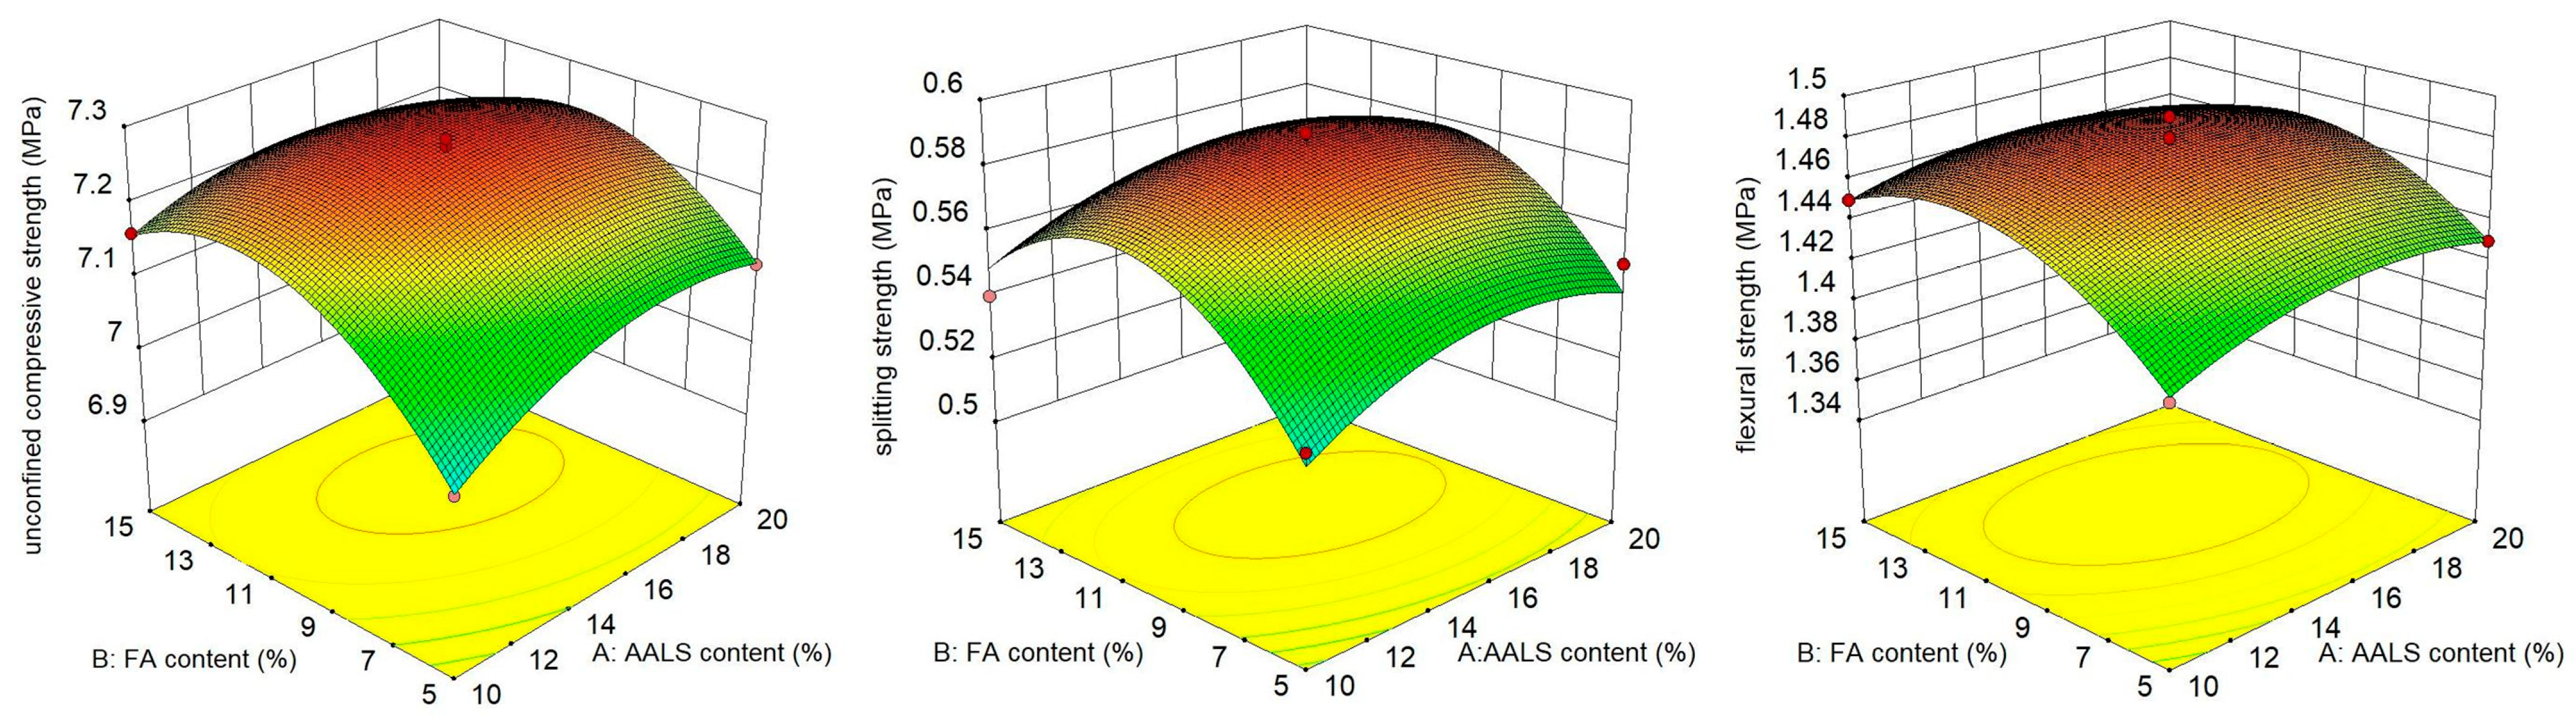
3.1.1. Strength Test
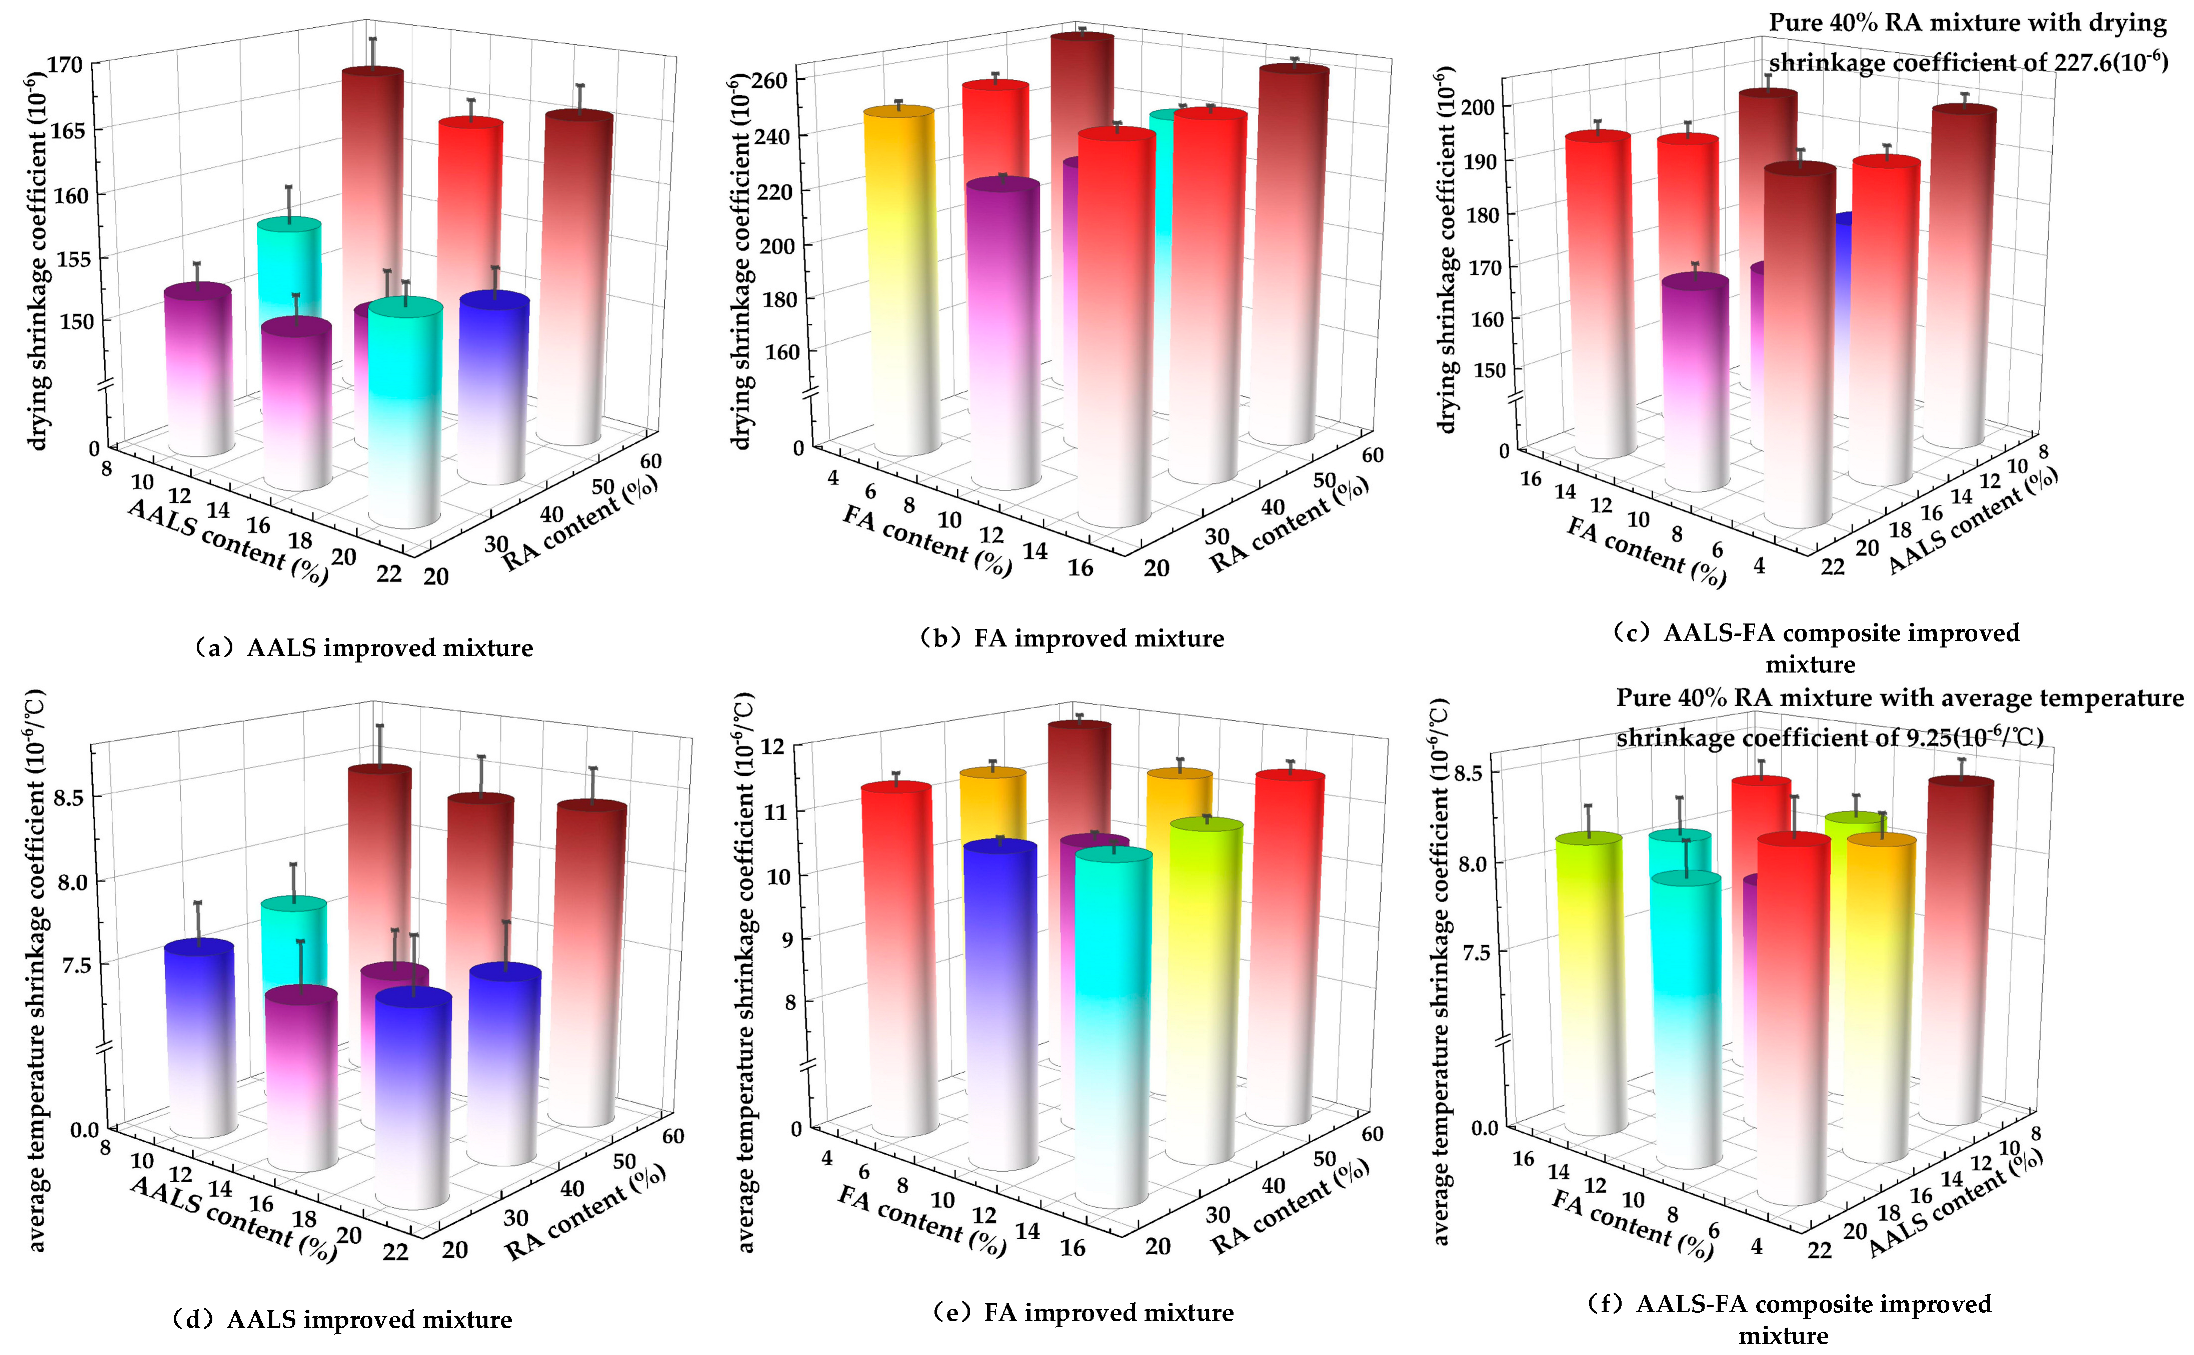
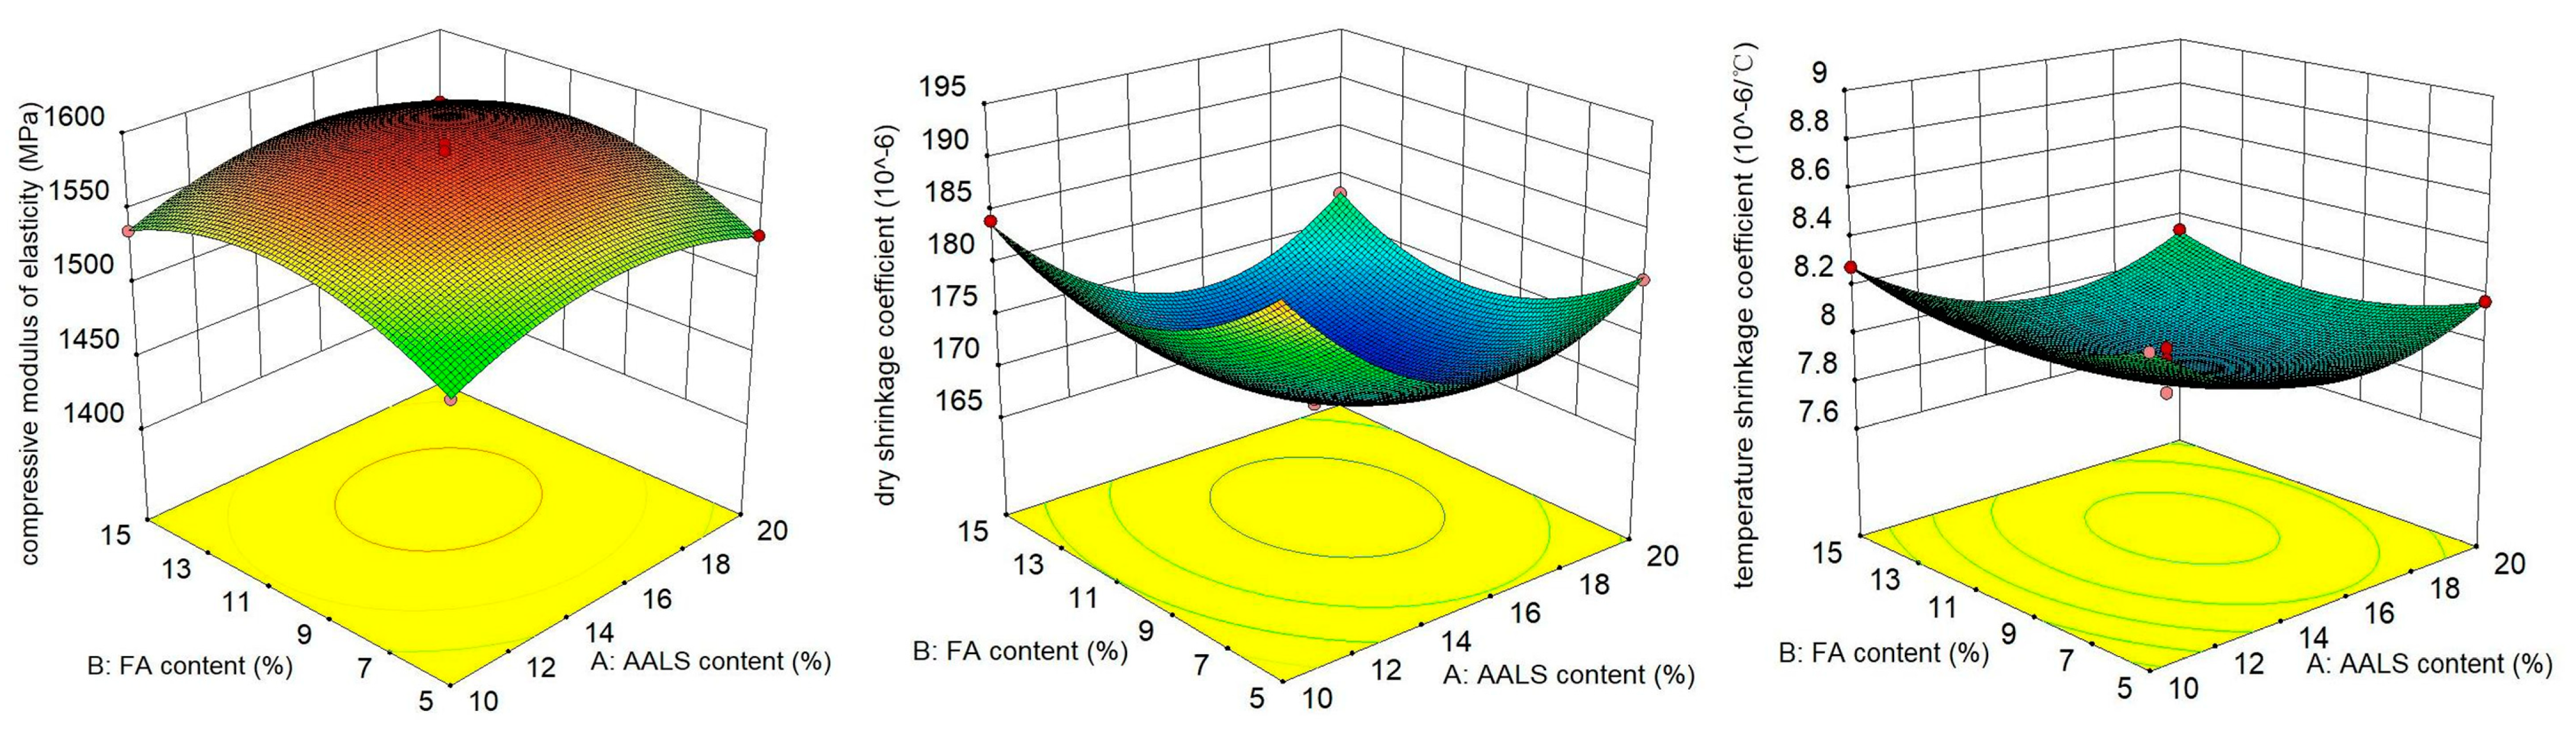
3.1.2. Drying/Temperature Shrinkage Test
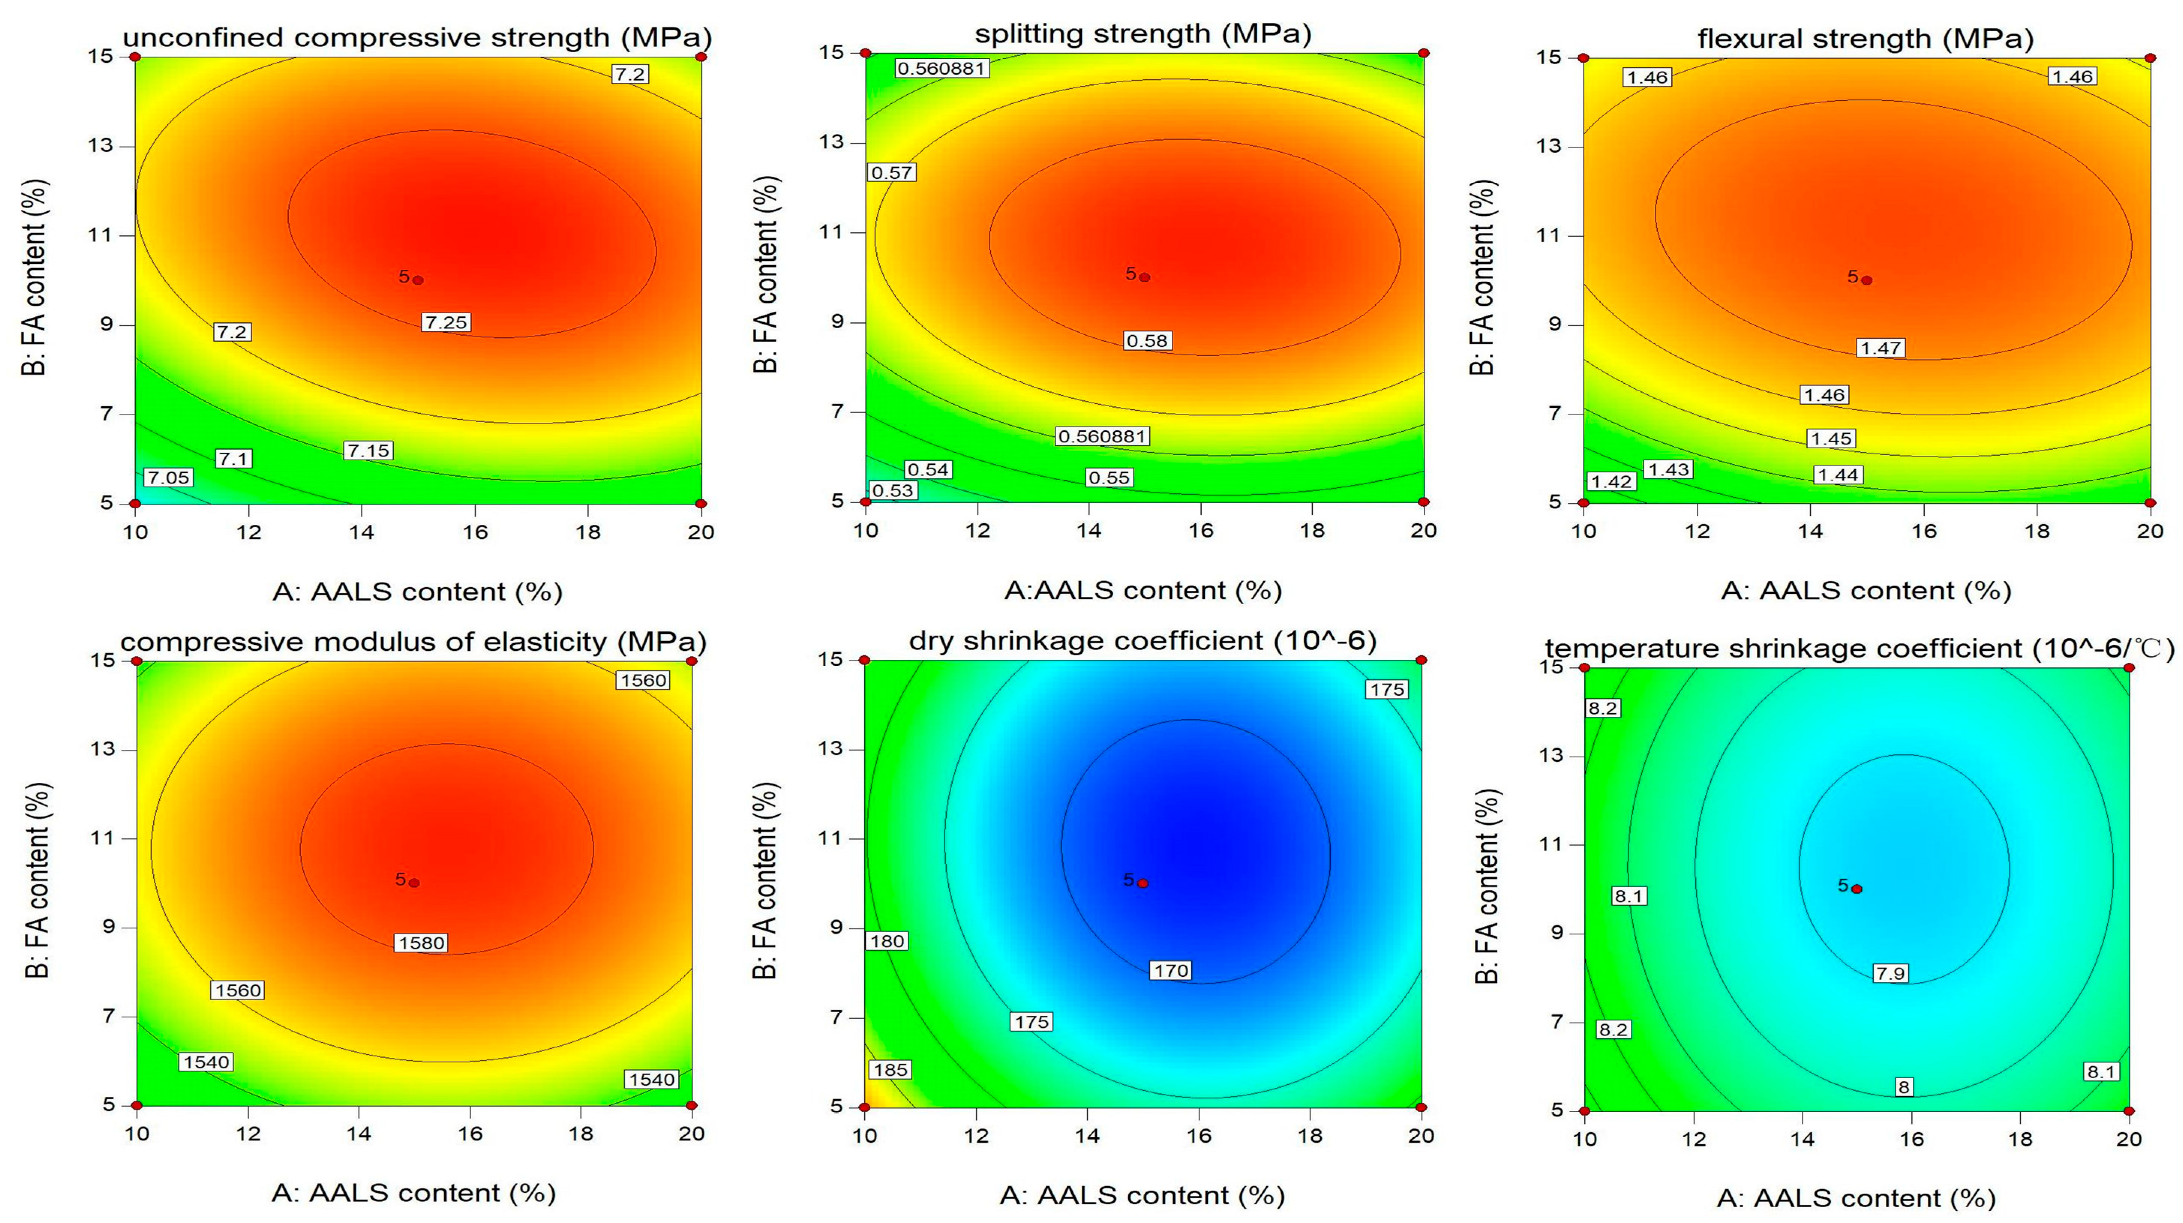
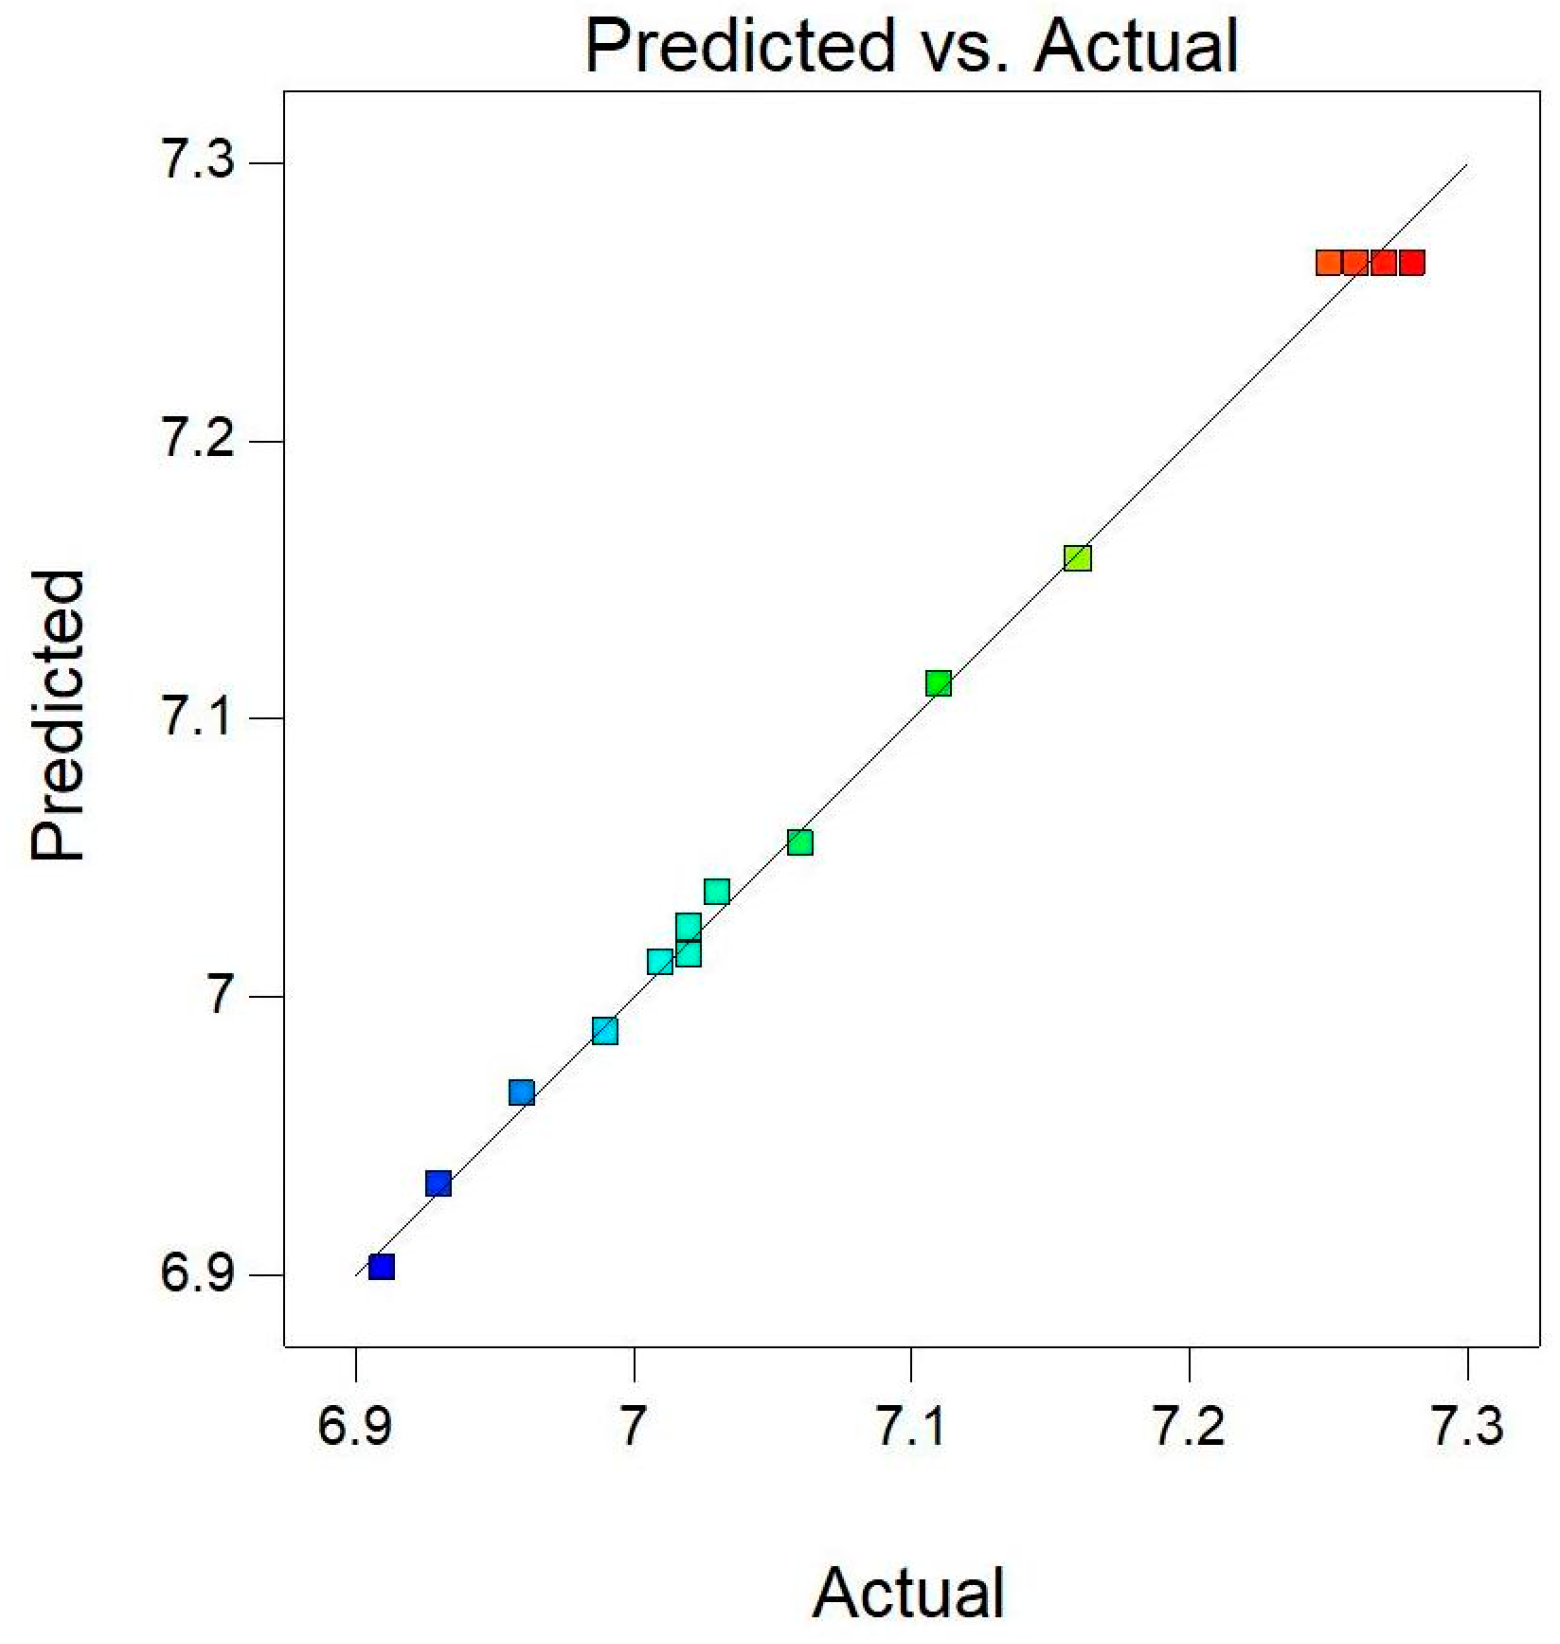
3.2. Optimization Design Based on Response Surface Methodology
3.3. Microscopic Mechanism Analysis
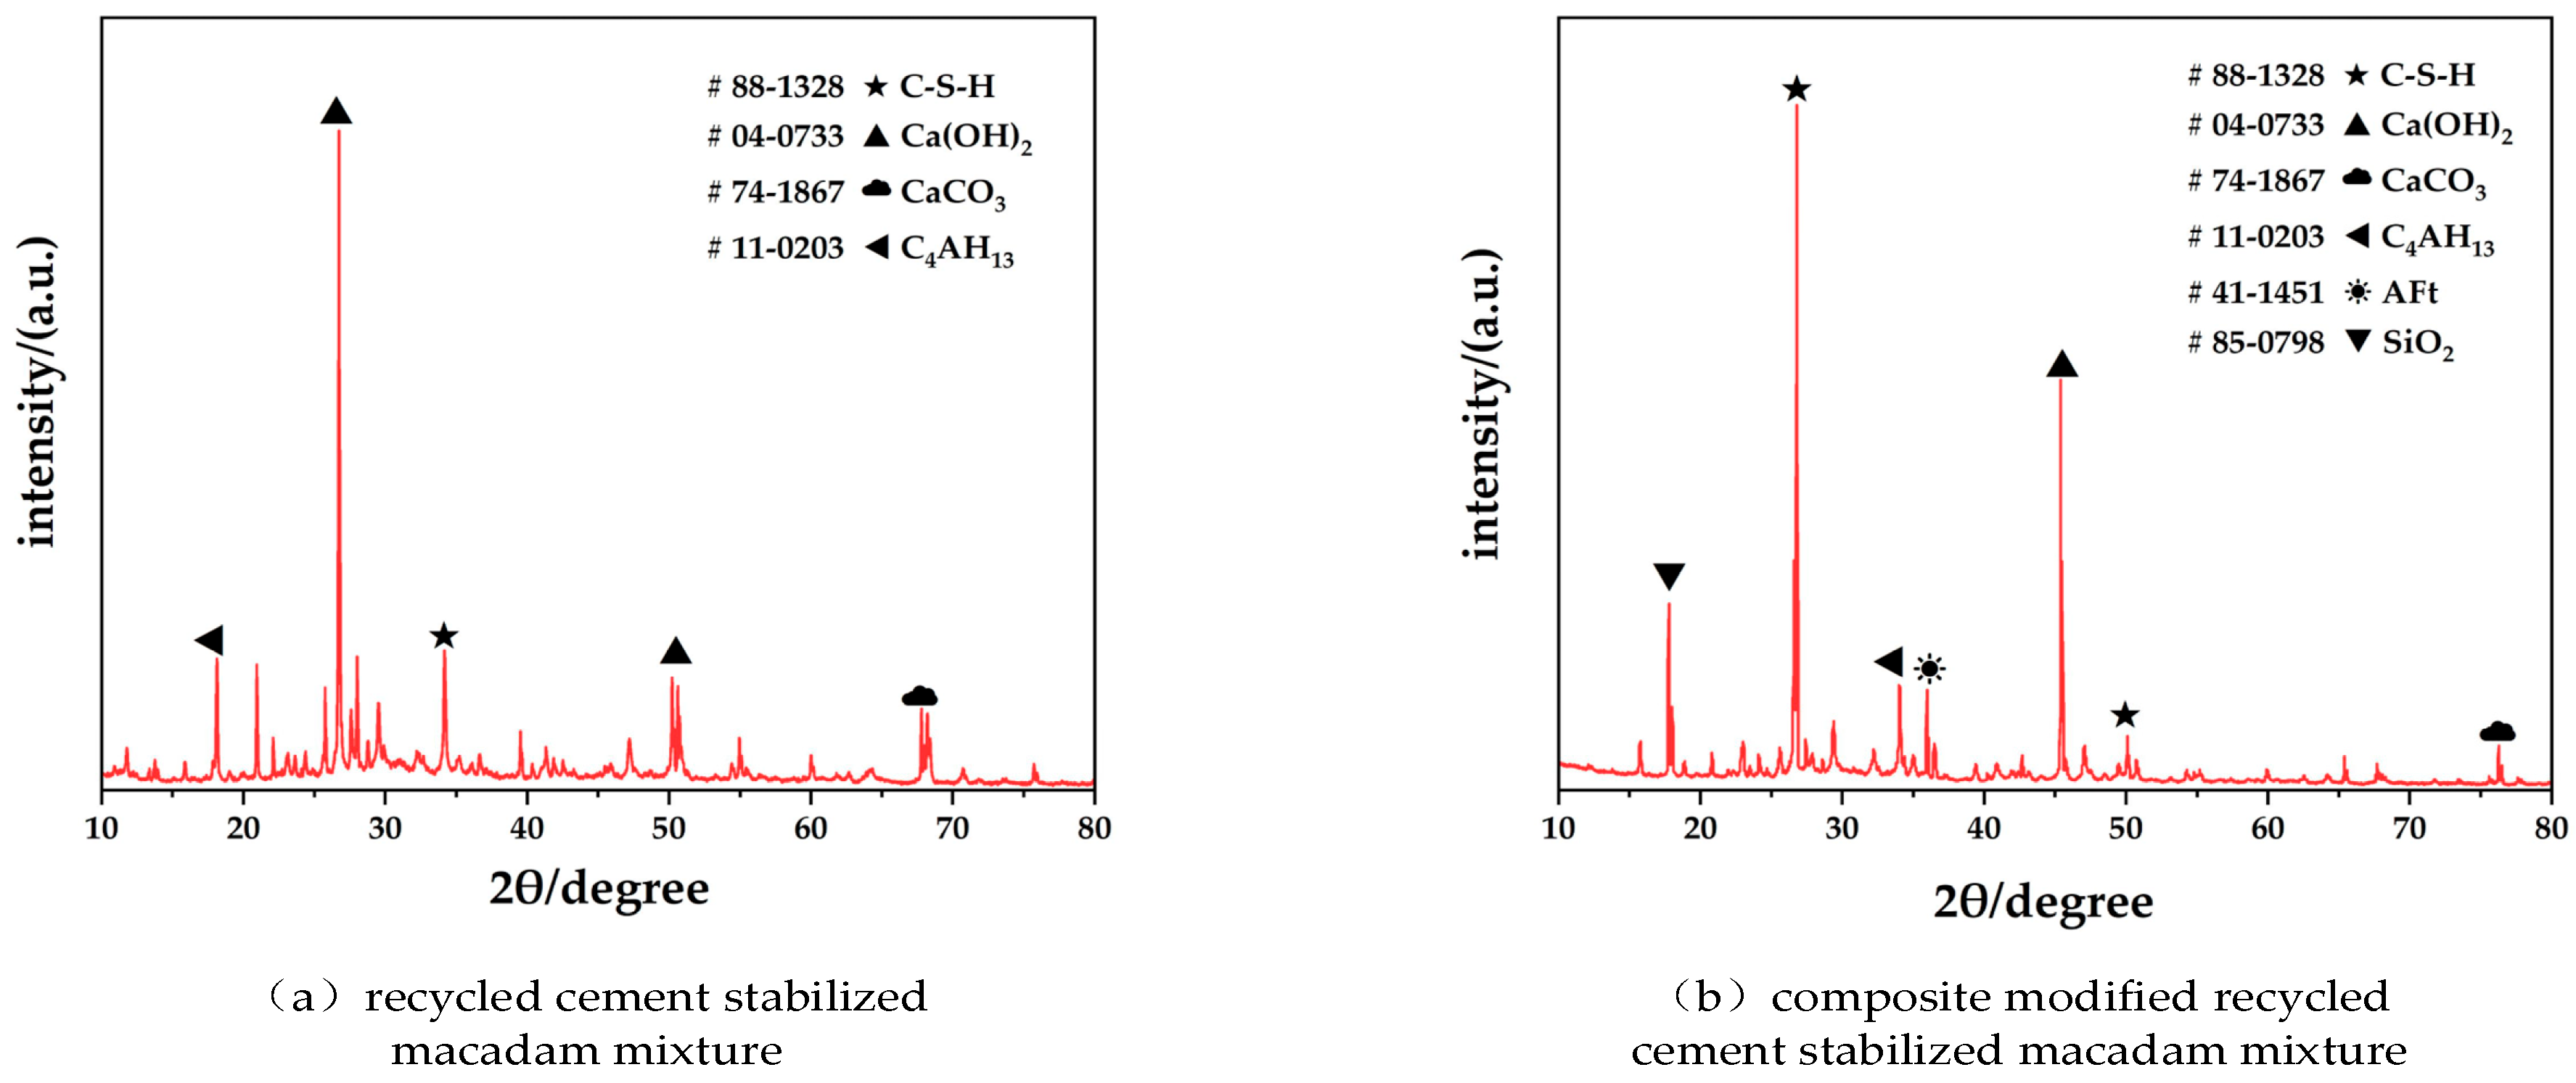
3.3.1. X-ray Diffraction
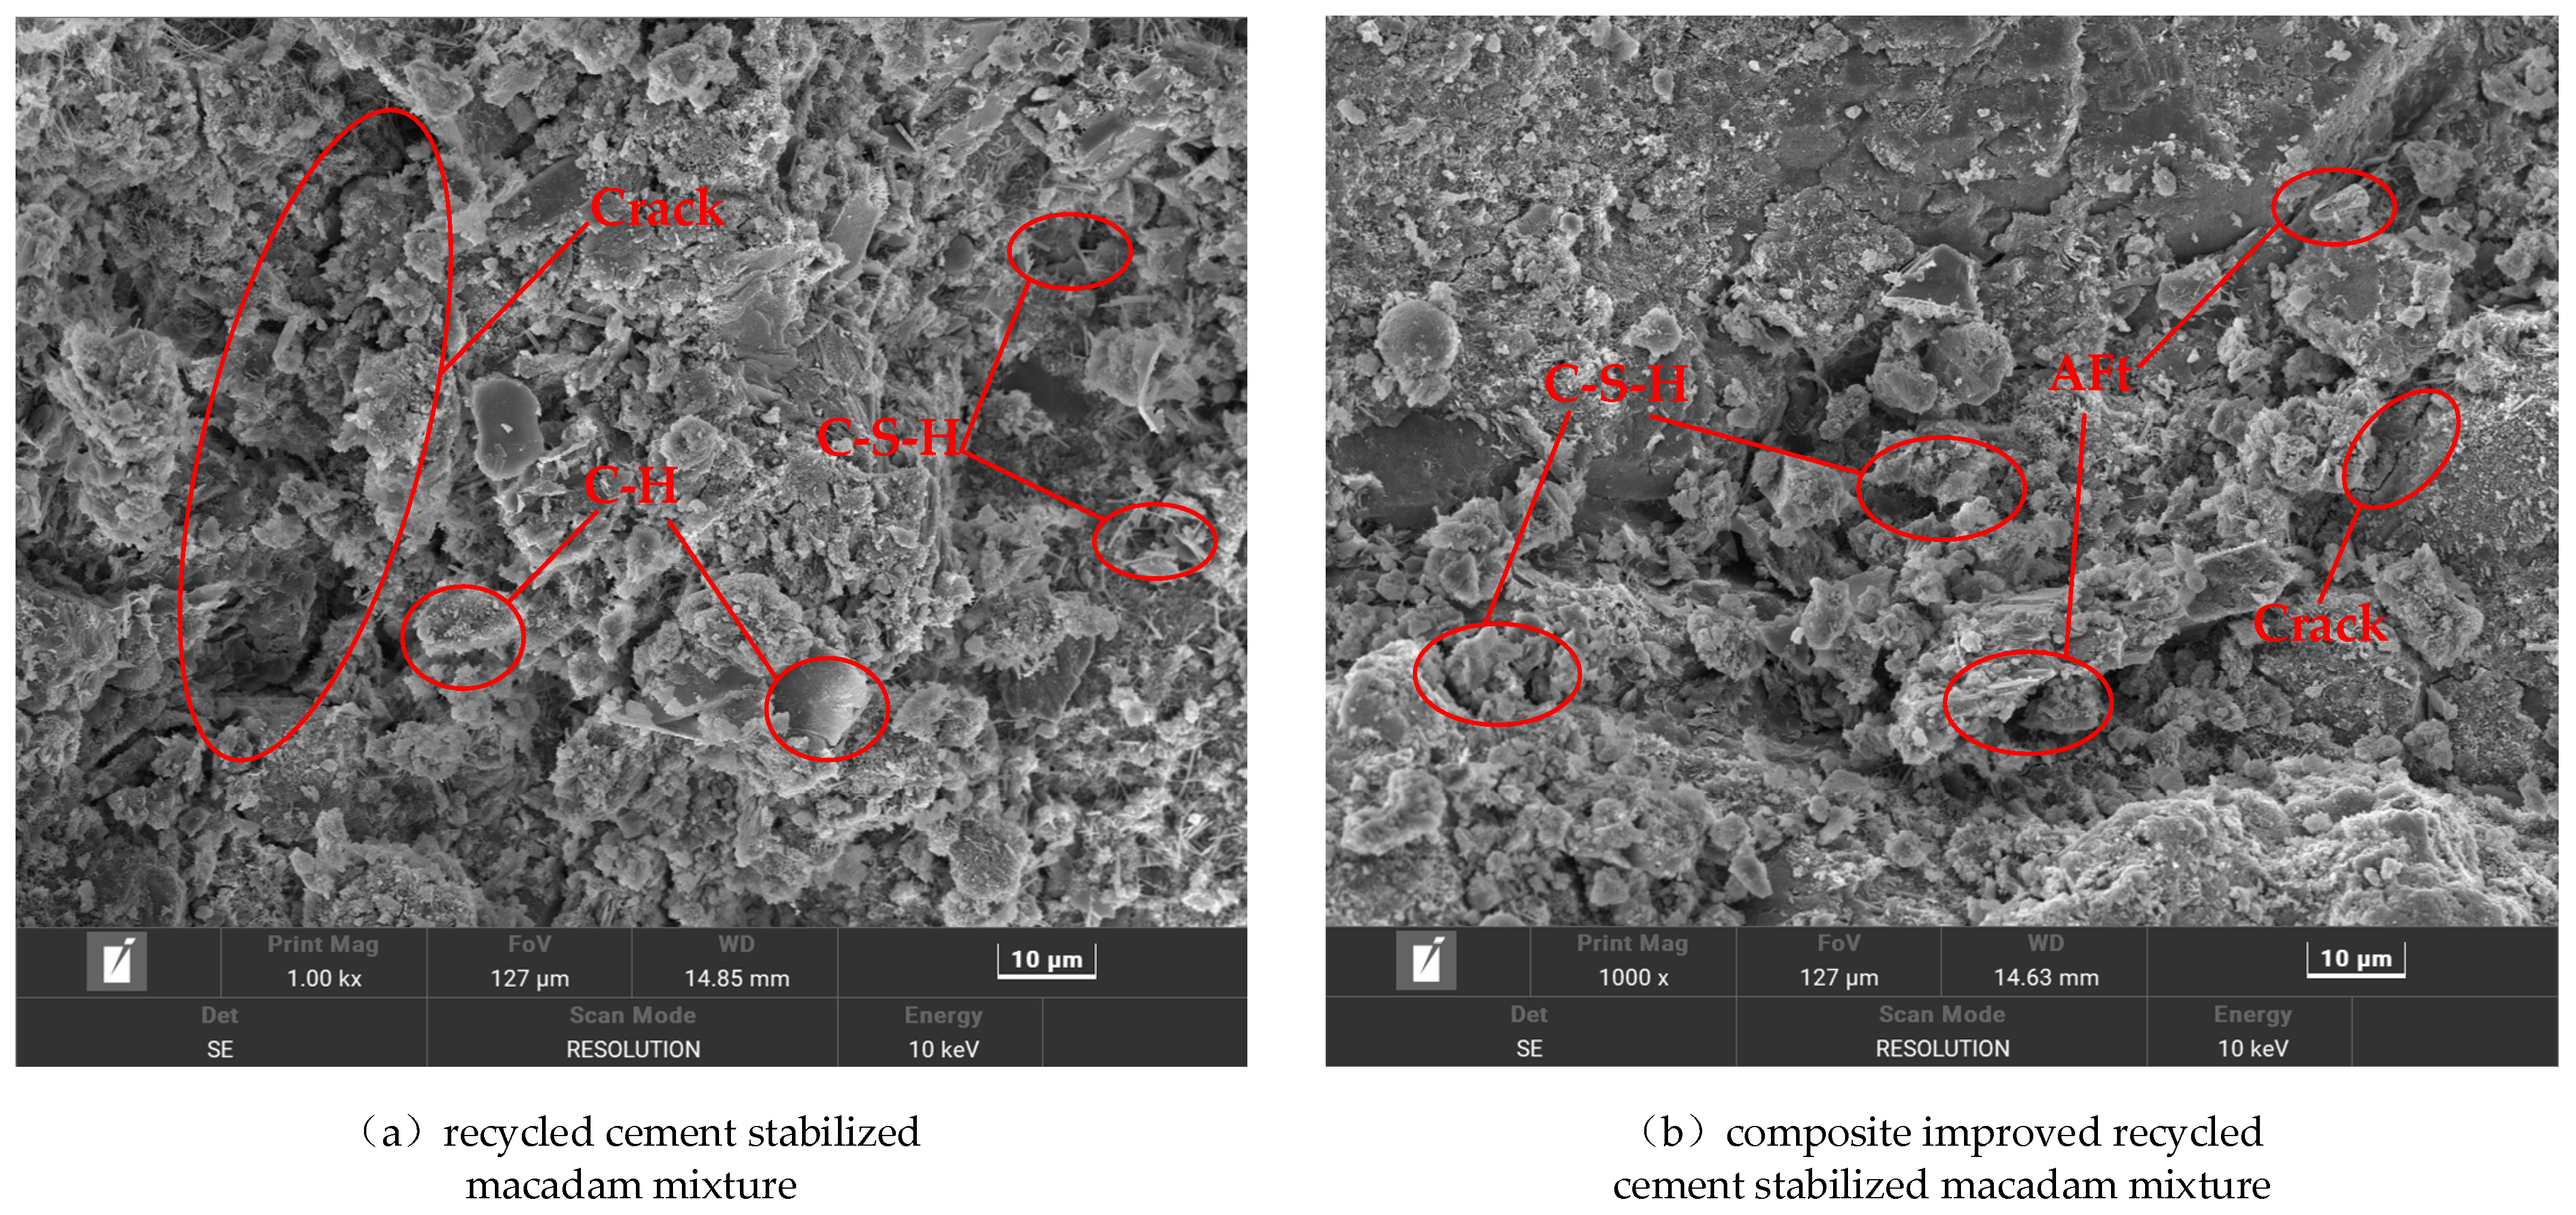
3.3.2. SEM Test
4. Conclusions
- (1)
- The AALS and FA were used to improve the RCSM, which significantly improved its mechanical properties and shrinkage properties. The incorporation of AALS can effectively improve the shrinkage performance of the mixture, and FA can improve the strength of the mixture more significantly.
- (2)
- With the increase in RA content, the strength of RCSM increases first and then decreases. When the RA is less than 40%, the shrinkage performance of the mixture decreases slightly.
- (3)
- The response surface method was used to optimize the design of the conventional performance test, and the optimum content of AALS, FA and RA in the composite-improved RCSM was optimized. The optimum content was AALS 15%, FA 10%, and RA 40%.
- (4)
- Through microscopic experiments, it was found that the main hydration products of AALS–FA-composite-improved RCSM are C-S-H, C-H and AFt. AALS and FA play a pozzolanic activity. The generated C-S-H and AFt fill the gap, effectively improve the performance of the internal interface transition zone of the RCSM, and enhance the strength and shrinkage performance of the mixture.
- (5)
- The composite-improved RCSM proposed in this paper not only makes full use of RA, but also further exerts the potential application value of lithium slag and fly ash, which provides technical support for the sustainable development of resource reuse and road construction. The next step will be a comprehensive assessment of the fatigue, frost resistance and erosion resistance of the mixture, and laying test sections in actual road projects. It is expected that under reasonable maintenance, the mixture will show sufficient durability and stability to meet long-term use needs. In addition, the cost will be reduced by optimizing the ratio, and attention will be paid to its maintenance needs, such as crack repair.
Author Contributions
Funding
Data Availability Statement
Conflicts of Interest
References
- Yan, P.; Ma, Z.; Li, H.; Gong, P.; Liu, Z.; Han, J.; Xu, M.; Hua, S. Evaluation of the shrinkage properties and crack resistance performance of cement-stabilized pure coal-based solid wastes as pavement base materials. Constr. Build. Mater. 2024, 421, 135680. [Google Scholar] [CrossRef]
- Chiranjeevi, K.; Yatish, R.G.; Kumar, D.H.; Mulangi, R.H.; Ravi Shankar, A.U. Utilization of recycled concrete aggregates for pavement base courses—A detailed laboratory study. Constr. Build. Mater. 2024, 411, 134122. [Google Scholar] [CrossRef]
- Mohammadinia, A.; Arulrajah, A.; Sanjayan, J.; Disfani, M.M.; Bo, M.W.; Darmawan, S. Strength Development and Microfabric Structure of Construction and Demolition Aggregates Stabilized with Fly Ash–Based Geopolymers. J. Mater. Civ. Eng. 2016, 28, 04016141. [Google Scholar] [CrossRef]
- Hou, Y.; Ji, X.; Zou, L.; Liu, S.; Su, X. Performance of cement-stabilized crushed brick aggregates in asphalt pavement base and subbase applications. Road Mater. Pavement Des. 2016, 17, 120–135. [Google Scholar] [CrossRef]
- Gu, Z.; Zhang, Y.; Luo, X.; Li, H.; Liu, G. Systematical calibration and validation of discrete element models for fiber reinforced cement treated aggregates. Constr. Build. Mater. 2023, 392, 131832. [Google Scholar] [CrossRef]
- Tang, Q.; Tian, A.; Ling, C.; Huang, Y.; Gu, F. Physical and mechanical properties of recycled aggregates modified by microbially induced calcium carbonate precipitation. J. Clean. Prod. 2023, 382, 135409. [Google Scholar] [CrossRef]
- Hoy, M.; Nhieu, D.V.; Horpibulsuk, S.; Suddeepong, A.; Chinkulkijniwat, A.; Buritatum, A.; Arulrajah, A. Effect of wetting and drying cycles on mechanical strength of cement-natural rubber latex stabilized recycled concrete aggregate. Constr. Build. Mater. 2023, 394, 132301. [Google Scholar] [CrossRef]
- He, Z.; Du, S.; Chen, D. Microstructure of ultra high performance concrete containing lithium slag. J. Hazard. Mater. 2018, 353, 35–43. [Google Scholar] [CrossRef]
- Wang, L.; Zhou, S.; Shi, Y.; Huang, Y.; Zhao, F.; Huo, T.; Tang, S. The Influence of Fly Ash Dosages on the Permeability, Pore Structure and Fractal Features of Face Slab Concrete. Fractal Fract. 2022, 6, 476. [Google Scholar] [CrossRef]
- Wang, L.; Jin, M.; Guo, F.; Wang, Y.; Tang, S. Pore structural and fractal analysis of the influence of fly ash and silica fume on the mechanical property and abrasion resistance of concrete. Fractals 2021, 29, 2140003. [Google Scholar] [CrossRef]
- Disfani, M.M.; Arulrajah, A.; Haghighi, H.; Mohammadinia, A.; Horpibulsuk, S. Flexural beam fatigue strength evaluation of crushed brick as a supplementary material in cement stabilized recycled concrete aggregates. Constr. Build. Mater. 2014, 68, 667–676. [Google Scholar] [CrossRef]
- Lan, X.; Zhang, X.; Hao, Z.; Wang, Y. Strength and shrinkage properties of cement stabilized macadam bases incorporating 0–2.36 millimetre recycled fine aggregate. Case Stud. Constr. Mater. 2022, 16, e00984. [Google Scholar] [CrossRef]
- Zhang, J.; Li, C.; Ding, L.; Li, J. Performance evaluation of cement stabilized recycled mixture with recycled concrete aggregate and crushed brick. Constr. Build. Mater. 2021, 296, 123596. [Google Scholar] [CrossRef]
- Yan, K.; Li, G.; You, L.; Zhou, Y.; Wu, S. Performance assessments of open-graded cement stabilized macadam containing recycled aggregate. Constr. Build. Mater. 2020, 233, 117326. [Google Scholar] [CrossRef]
- Li, Q.; Hu, J. Mechanical and Durability Properties of Cement-Stabilized Recycled Concrete Aggregate. Sustainability 2020, 12, 7380. [Google Scholar] [CrossRef]
- You, L.; Yue, Y.; Yan, H.; Zhou, Y. Characteristics of Cement-stabilized Macadam Containing Surface-treated Recycled Aggregates. Road Mater. Pavement Des. 2020, 25, 291–307. [Google Scholar] [CrossRef]
- Katz, A. Treatments for the Improvement of Recycled Aggregate. J. Mater. Civ. Eng. 2004, 16, 597–603. [Google Scholar] [CrossRef]
- Deng, C.; Jiang, Y.; Tian, T.; Yi, Y. Laboratory mechanical properties and frost resistance of vibration-compacted cement–fly ash slurry and cement–fly ash-treated macadam mixtures. Constr. Build. Mater. 2024, 419, 135555. [Google Scholar] [CrossRef]
- Shi, S.; Wang, N.; Chen, C.; Ma, T.; Chen, F.; Gu, G. Multiscale study of the effect of fly ash geopolymer on the fatigue cracking of cement stabilized macadam. Constr. Build. Mater. 2023, 369, 130464. [Google Scholar] [CrossRef]
- Arulrajah, A.; Mohammadinia, A.; D’Amico, A.; Horpibulsuk, S. Cement kiln dust and fly ash blends as an alternative binder for the stabilization of demolition aggregates. Constr. Build. Mater. 2017, 145, 218–225. [Google Scholar] [CrossRef]
- Zhang, X.; Li, H.; Wang, H.; Yan, P.; Shan, L.; Hua, S. Properties of RCA stabilized with alkali-activated steel slag based materials in pavement base: Laboratory tests, field application and carbon emissions. Constr. Build. Mater. 2024, 411, 134547. [Google Scholar] [CrossRef]
- He, Z.; Li, L.; Du, S. Mechanical properties, drying shrinkage, and creep of concrete containing lithium slag. Constr. Build. Mater. 2017, 147, 296–304. [Google Scholar] [CrossRef]
- Qin, Y.; Chen, J.; Li, Z.; Zhang, Y. The Mechanical Properties of Recycled Coarse Aggregate Concrete with Lithium Slag. Adv. Mater. Sci. Eng. 2019, 2019, 8974625. [Google Scholar] [CrossRef]
- JTG 3432-2024; In Test Methods of Aggregates for Highway Engineering. Ministry of Transport of the People’s Republic of China: Beijing, China, 2024.
- Yang, S.; Yang, Z.; Chen, K.; Zhang, L.; Chu, J. Using case study on the performance of rural cement stabilizing construction waste recycling road base. Constr. Build. Mater. 2023, 405, 133351. [Google Scholar] [CrossRef]
- JTG/T F20-2015; In Technical Guidelines for Construction of Highway Roadbases. Ministry of Transport of the People’s Republic of China: Beijing, China, 2015.
- JTG E51-2009; In Test Methods of Materials Stabilized with Inorganic Binders for Highway Engineering. Ministry of Transport of the People’s Republic of China: Beijing, China, 2009.
- Zhou, M.; Liu, X.; Chen, X.; Gao, P. Study on Strength, Water Stability, Shrinkage, and Microstructure of CFB Slag Modified Cement Stabilized Clay. Materials 2021, 14, 7460. [Google Scholar] [CrossRef] [PubMed]
- Chen, Z.; Chen, S.; Liu, L.; Zhou, Y. Effects of Lithium Slag on the Frost Resistance of Cement-Soil. Materials 2022, 15, 5531. [Google Scholar] [CrossRef] [PubMed]
- Tan, H.; Li, X.; He, C.; Ma, B.; Bai, Y.; Luo, Z. Utilization of lithium slag as an admixture in blended cements: Physico-mechanical and hydration characteristics. J. Wuhan Univ. Technol.-Mat. Sci. Edit. 2015, 30, 129–133. [Google Scholar] [CrossRef]
- Wang, L.; Shen, A.; Lyu, Z.; Guo, Y.; He, Z.; Mou, G.; Wei, Z. Rapid regeneration cement-stabilized macadam: Preparation, mechanical properties, and dry shrinkage performance. Constr. Build. Mater. 2022, 341, 127901. [Google Scholar] [CrossRef]


| Test Items | Technical Indicators | Specification Requirements |
|---|---|---|
| Specific surface area/m2·kg−1 | 362 | ≥300 |
| Initial setting time/min | 82 | ≥45 |
| Final setting time/min | 183 | ≤600 |
| Compressive strength (28 d)/MPa | 49.3 | ≥42.5 |
| Flexural strength (28 d)/MPa | 8.3 | ≥6.5 |
| SiO2 | Fe2O3 | Al2O3 | SO3 | MgO | CaO |
|---|---|---|---|---|---|
| 22.1% | 3.7% | 6.6% | 3.6% | 1.1% | 56.9% |
| Test Items | Natural Coarse Aggregate | Recycled Coarse Aggregate | Test Method | Specification Requirements |
|---|---|---|---|---|
| Apparent relative density/(g·cm−3) | 2.689 | 2.681 | T 0308—2005 | ≥2.50 |
| Water absorption/% | 0.93 | 3.75 | T 0308—2005 | ≤3.0 |
| Silt content/% | 0.8 | 1.3 | T 0310—2005 | ≤1.5 |
| Needle-like particle content/% | 6.8 | 14.2 | T 0312—2005 | ≤18 |
| Ruggedness/% | 5.1 | 9.6 | T 0314—2024 | ≤12 |
| Crushing value/% | 19.5 | 23.2 | T 0316—2024 | ≤26 |
| Los Angeles abrasion loss/% | 14.8 | 26.5 | T 0317—2005 | ≤30 |
| Test Items | Natural Fine Aggregate | Recycled Fine Aggregate | Test Method | Specification Requirements |
|---|---|---|---|---|
| Apparent relative density/(g·cm−3) | 2.793 | 2.569 | T 0330—2005 | ≥2.50 |
| Water absorption/% | 13.3 | 24.2 | T 0330—2005 | — |
| SiO2 | Fe2O3 | Al2O3 | SO3 | MgO | CaO |
|---|---|---|---|---|---|
| 39.0% | 2.6% | 18.0% | 9.2% | 1.0% | 8.4% |
| SiO2 | Al2O3 | CaO | Fe2O3 | MgO | SO3 |
|---|---|---|---|---|---|
| 50.5% | 25.6% | 9.8% | 6.9% | 1.1% | 1.1% |
| Gradation | Mass Percentage Passing the Following Sieve/% | ||||||
|---|---|---|---|---|---|---|---|
| 31.5 mm | 19 mm | 9.5 mm | 4.75 mm | 2.36 mm | 0.6 mm | 0.075 mm | |
| Upper limit of grading | 100 | 86.0 | 58.0 | 32.0 | 28.0 | 15.0 | 3.0 |
| Lower limit of grading | 93.0 | 68.0 | 38.0 | 22.0 | 16.0 | 8.0 | 0 |
| Design gradation | 100 | 77.0 | 48.0 | 27.0 | 22.0 | 11.5 | 1.5 |
| AALS-Improved Mixture | FA-Improved Mixture | Composite-Improved Mixture * | |||||||||
|---|---|---|---|---|---|---|---|---|---|---|---|
| AALS/% | RA/% | OMC/% | MDD/g·cm−3 | FA/% | RA/% | OMC/% | MDD/g·cm−3 | AALS/% | FA/% | OMC/% | MDD/g·cm−3 |
| 10 | 25 | 5.8 | 2.305 | 5 | 25 | 5.8 | 2.301 | 10 | 5 | 6.6 | 2.283 |
| 10 | 40 | 6.4 | 2.287 | 5 | 40 | 6.5 | 2.275 | 15 | 5 | 6.7 | 2.278 |
| 10 | 55 | 6.8 | 2.271 | 5 | 55 | 7.1 | 2.238 | 20 | 5 | 6.8 | 2.273 |
| 15 | 25 | 5.9 | 2.298 | 10 | 25 | 6.1 | 2.291 | 10 | 10 | 6.8 | 2.271 |
| 15 | 40 | 6.4 | 2.285 | 10 | 40 | 6.7 | 2.275 | 15 | 10 | 6.8 | 2.265 |
| 15 | 55 | 6.8 | 2.268 | 10 | 55 | 7.2 | 2.235 | 20 | 10 | 6.9 | 2.255 |
| 20 | 25 | 6.0 | 2.293 | 15 | 25 | 6.2 | 2.289 | 10 | 15 | 6.9 | 2.258 |
| 20 | 40 | 6.5 | 2.279 | 15 | 40 | 6.8 | 2.273 | 15 | 15 | 7.0 | 2.243 |
| 20 | 55 | 6.9 | 2.247 | 15 | 55 | 7.4 | 2.226 | 20 | 15 | 7.0 | 2.241 |
| Factor | Code | Level | ||
|---|---|---|---|---|
| −1 | 0 | 1 | ||
| AALS/% | A | 10 | 15 | 20 |
| FA/% | B | 5 | 10 | 15 |
| RA/% | C | 25 | 40 | 55 |
| No. | A | B | C | 28 d Unconfined Compressive Strength (MPa) | 28 d Splitting Strength (MPa) | 28 d Flexural Strength (MPa) | 28 d Compressive Modulus of Elasticity (MPa) | 28 d Dry Shrinkage Coefficient (10−6) | Average Temperature Shrinkage (10−6/°C) |
|---|---|---|---|---|---|---|---|---|---|
| 1 | 20 | 5 | 40 | 7.11 | 0.55 | 1.43 | 1530.2 | 180.4 | 8.17 |
| 2 | 15 | 10 | 40 | 7.28 | 0.59 | 1.47 | 1583.2 | 168.5 | 7.89 |
| 3 | 10 | 10 | 55 | 7.02 | 0.53 | 1.36 | 1492.3 | 193.2 | 8.85 |
| 4 | 15 | 15 | 25 | 6.99 | 0.55 | 1.4 | 1471.2 | 177.8 | 7.61 |
| 5 | 15 | 10 | 40 | 7.26 | 0.58 | 1.48 | 1591.4 | 169.6 | 7.77 |
| 6 | 20 | 10 | 55 | 7.06 | 0.55 | 1.36 | 1501.8 | 187.3 | 8.74 |
| 7 | 15 | 10 | 40 | 7.26 | 0.59 | 1.49 | 1586.6 | 168.8 | 7.91 |
| 8 | 10 | 15 | 40 | 7.16 | 0.54 | 1.45 | 1536.1 | 184.1 | 8.28 |
| 9 | 20 | 15 | 40 | 7.16 | 0.55 | 1.45 | 1548.3 | 178.1 | 8.13 |
| 10 | 20 | 10 | 25 | 7.02 | 0.55 | 1.41 | 1468.5 | 179.2 | 7.64 |
| 11 | 15 | 5 | 25 | 6.91 | 0.53 | 1.37 | 1448.9 | 181.5 | 7.68 |
| 12 | 15 | 15 | 55 | 7.03 | 0.54 | 1.36 | 1495.8 | 185.6 | 8.68 |
| 13 | 15 | 10 | 40 | 7.27 | 0.58 | 1.47 | 1581.7 | 167.9 | 7.96 |
| 14 | 10 | 10 | 25 | 6.96 | 0.56 | 1.4 | 1458.6 | 185.8 | 7.85 |
| 15 | 10 | 5 | 40 | 7.01 | 0.53 | 1.41 | 1518.3 | 188.7 | 8.33 |
| 16 | 15 | 5 | 55 | 6.93 | 0.5 | 1.34 | 1482.9 | 189.3 | 8.71 |
| 17 | 15 | 10 | 40 | 7.25 | 0.59 | 1.48 | 1584.7 | 167.4 | 7.84 |
| Variance Source | Sum of Squared Deviations | Degrees of Freedom | Variance | F Value | p Value | Significance |
|---|---|---|---|---|---|---|
| Model | 0.27 | 9 | 0.03 | 268.29 | <0.0001 | Significant |
| A-Alkali-activated lithium slag | 5 × 10⁻³ | 1 | 5 × 10⁻³ | 45.45 | 0.0003 | |
| B-Fly ash | 0.018 | 1 | 0.018 | 164.09 | <0.0001 | |
| C-Recycled aggregates | 3.2 × 10⁻³ | 1 | 3.2 × 10⁻³ | 29.09 | 0.0010 | |
| AB | 2.5 × 10⁻³ | 1 | 2.5 × 10⁻³ | 22.73 | ||
| AC | 1 × 10⁻⁴ | 1 | 1 × 10⁻⁴ | 0.91 | ||
| BC | 1 × 10⁻⁴ | 1 | 1 × 10⁻⁴ | 0.91 | ||
| A2 | 0.011 | 1 | 0.011 | 103.50 | <0.0001 | |
| B2 | 0.044 | 1 | 0.044 | 398.24 | <0.0001 | |
| C2 | 0.16 | 1 | 0.16 | 1485.51 | <0.0001 | |
| Residual | 7.7 × 10⁻⁴ | 7 | 1.1 × 10⁻⁴ | |||
| Lack of Fit | 2.5 × 10⁻⁴ | 3 | 8.3 × 10⁻⁵ | 0.64 | 0.6276 | not significant |
| Pure Error | 5.2 × 10⁻⁴ | 4 | 1.3 × 10⁻⁴ | |||
| Total | 0.27 | 16 | ||||
| R2 | 0.9971 | C.V. % | 0.15 |
| Test Indicators | Fitting Equation | R2 |
|---|---|---|
| 28 d unconfined compressive strength | 28 d unconfined compressive strength = 7.26 + 0.025A + 0.048B + 0.02C − 0.025AB − 0.005AC + 0.005BC − 0.052A2 − 0.1B2 − 0.2C2 | 0.9971 |
| 28 d splitting strength | 28 d splitting strength = 0.59 + 0.005A + 0.00875B − 0.00875C − 0.0025AB + 0.0075AC + 0.005BC − 0.013A2 − 0.03B2 − 0.026C2 | 0.9523 |
| 28 d flexural strength | 28 d flexural strength = 1.48 + 0.0038A + 0.014B − 0.02C − 0.005AB − 0.0025AC − 0.0025BC − 0.014A2 − 0.029B2 − 0.082C2 | 0.9911 |
| 28 d compressive modulus of elasticity | 28 d compressive modulus of elasticity = 1585.52 + 5.444A + 8.89B + 15.7C + 0.075AB − 0.1AC − 2.35BC − 23.35A2 − 28.95B2 − 81.87C2 | 0.99.83 |
| 28 d dry shrinkage coefficient | 28 d dry shrinkage coefficient = 168.44 − 3.35A − 1.79B + 3.89C + 0.57AB + 0.18AC + 8.6A2 + 5.78B2 + 9.33C2 | 0.9935 |
| average temperature shrinkage | average temperature shrinkage coefficient = 7.87 − 0.079A − 0.024B + 0.52C + 0.0025AB + 0.025AC + 0.01BC + 0.23A2 + 0.13B2 + 0.17C2 | 0.9923 |
| Indicators | 28 d Unconfined Compressive Strength (MPa) | 28 d Splitting Strength (MPa) | 28 d Flexural Strength (MPa) | 28 d Compressive Modulus of Elasticity (MPa) | 28 d Dry Shrinkage Coefficient (10−6) | Average Temperature Shrinkage (10−6/°C) |
|---|---|---|---|---|---|---|
| projected value | 7.26 | 0.58 | 1.45 | 1585.5 | 167.6 | 7.68 |
| measured value | 7.29 | 0.59 | 1.48 | 1586.6 | 168.8 | 7.88 |
Disclaimer/Publisher’s Note: The statements, opinions and data contained in all publications are solely those of the individual author(s) and contributor(s) and not of MDPI and/or the editor(s). MDPI and/or the editor(s) disclaim responsibility for any injury to people or property resulting from any ideas, methods, instructions or products referred to in the content. |
© 2024 by the authors. Licensee MDPI, Basel, Switzerland. This article is an open access article distributed under the terms and conditions of the Creative Commons Attribution (CC BY) license (https://creativecommons.org/licenses/by/4.0/).
Share and Cite
Yang, W.; Jin, Z.; Yang, J.; He, J.; Huang, X.; Ye, X.; Li, G.; Wang, C. Study on the Performance of Recycled Cement-Stabilized Macadam Mixture Improved Using Alkali-Activated Lithium Slag–Fly Ash Composite. Minerals 2024, 14, 418. https://doi.org/10.3390/min14040418
Yang W, Jin Z, Yang J, He J, Huang X, Ye X, Li G, Wang C. Study on the Performance of Recycled Cement-Stabilized Macadam Mixture Improved Using Alkali-Activated Lithium Slag–Fly Ash Composite. Minerals. 2024; 14(4):418. https://doi.org/10.3390/min14040418
Chicago/Turabian StyleYang, Weijun, Zhenzhou Jin, Jianyu Yang, Jiangang He, Xuemei Huang, Xin Ye, Guangyao Li, and Chao Wang. 2024. "Study on the Performance of Recycled Cement-Stabilized Macadam Mixture Improved Using Alkali-Activated Lithium Slag–Fly Ash Composite" Minerals 14, no. 4: 418. https://doi.org/10.3390/min14040418
APA StyleYang, W., Jin, Z., Yang, J., He, J., Huang, X., Ye, X., Li, G., & Wang, C. (2024). Study on the Performance of Recycled Cement-Stabilized Macadam Mixture Improved Using Alkali-Activated Lithium Slag–Fly Ash Composite. Minerals, 14(4), 418. https://doi.org/10.3390/min14040418