Abstract
Chilean mining faces challenges associated with the depletion of oxidized copper ore and the environmental complexity of treating concentrates with high arsenic content. Given this, hydrometallurgy emerges as an alternative for the treatment of these concentrates. This research analyzes the interaction of sulfuric acid (0, 70, 140, and 210 kg/t), sodium chloride (0, 25, 50, and 100 kg/t), curing time (1, 5, 10, and 15 days), and temperature (25, 35, 50, and 75 °C) in the pretreatment of a copper concentrate with 35.57% total copper and 5.91% arsenic (enargite, 35.93%). In the pretreatment, a maximum copper extraction of 26.71% is achieved using 210 kg/t sulfuric acid at 50 °C over 15 days of curing. The experimental results are analyzed through an empirical model, where the interaction between sulfuric acid and curing time is identified as beneficial when the sulfuric acid addition is above 70 kg/t, leading to higher moisture content in the sample. In the absence of sulfuric acid, sodium chloride significantly influences the achievement of higher copper extractions. During curing at higher temperatures, the importance of maintaining a moisture level is emphasized to prevent solution evaporation and hinder diffusion through the particles, thereby ensuring reactivity in the sample.
1. Introduction
The Chilean mining industry leads global copper production, primarily through flotation concentration processes. In the year 2022, copper production obtained through flotation concentration accounted for 53.4% of the total, and it is projected to increase to 69.9% by 2034 [1]. However, a significant percentage of concentrate production is exported, with only a minor portion being processed domestically through pyrometallurgical methods. One of the main reasons is the increasing challenge of capturing a higher amount of environmentally harmful gases, such as sulfur dioxide (SO2) and arsenic trioxide (As2O3) [2].
Arsenic can be found in tennantite (Cu12As4S13) or enargite (Cu3AsS4), and through flotation concentration, the presence of these species in copper concentrates can lead to the presence of arsenic. In northern Chile, it has been documented that excessive exposure to arsenic is associated with skin lesions and an increase in mortality from bladder and lung cancer [3]. As a consequence, metallurgical plants are penalized due to impurities that the copper concentrate may carry. Arsenic is an impurity that is mostly penalized when its content exceeds 0.2%, and when its concentration is above 0.5%, the concentrate is referred to as “complex” [4].
Due to the aforementioned factors, it becomes necessary to explore new alternatives that allow for sustainable and environmentally friendly treatments. Researchers Olvera and Dixon [5] propose hydrometallurgy as a treatment alternative since it keeps arsenic species stable in solution. Additionally, authors such as Cerda et al. [6], Hernández et al. [7], Taboada et al. [8], Liu et al. [9], and Vargas et al. [10] suggest that hydrometallurgical plants could harness new capabilities to process sulfide minerals as a result of the depletion of oxidized minerals. According to the Chilean Copper Commission (Cochilco), copper production through hydrometallurgical processes represented 25.1% of the total in the year 2021, and this figure is projected to decrease to 6.3% by the year 2033 [2].
However, the treatment of copper sulfide minerals through hydrometallurgical processes poses a challenge for both researchers and the Chilean mining industry. This is due to the formation of a layer on the mineral surface that inhibits the reaction and thus prevents the dissolution of the mineral. In response to this, several authors are studying the dissolution of sulfide minerals in ammoniacal media (Aracena et al. [11]), acids with the presence of chloride (Phuong et al. [12]), activated carbon (Fazel et al. [13]), oxygen (Yang et al. [14]), and pyrite (Ruiz et al. [15]), among others. On an industrial scale, the primary alternatives focus on pressure leaching (utilized in Chile by Codelco) and chloride media methods (such as Cuprochlor, Outotec Hydrocopper, and the Intex Process). The pressure leaching process yields rapid results but comes with the disadvantage of high costs associated with autoclave development. On the other hand, chloride media forms a porous product layer and enhances reduction–oxidation properties [6,13].
Authors such as Cerda et al. [6], Hernández et al. [7], Taboada et al. [8], and Quezada et al. [16,17] propose a pretreatment (acid curing) before the leaching stage. This pretreatment involves the sulfation of the mineral through the addition of sulfuric acid and other agents under investigation, such as sodium chloride and ferric salts. Neira et al. [18] mention that pretreatment of copper minerals or concentrates through hydrometallurgical means shortens leaching times and leads to an increase in copper extraction. While the compiled studies suggest a benefit to copper extraction through pretreatment, there are no published documents evaluating this effect on complex concentrates (enargite, as a contributor of copper and arsenic).
Cerda et al. [6] highlight that curing time and temperature are the most relevant variables in the pretreatment, while the addition of chloride seems not to exert a significant effect on copper extraction. Cerda et al. [5] indicate that with a pretreatment involving the addition of 90 kg/t of chloride, 40 days of curing, and a temperature of 20 °C, a copper extraction of 84.76% is achieved from a mineral primarily composed of chalcopyrite. However, it is essential to mention that copper extraction varies according to the method used, achieving an extraction of 84.76% when carried out in reactors and 49% when using mini-columns.
Hernández et al. [7] conducted a pretreatment on a mineral primarily composed of chalcopyrite, achieving a copper extraction of 58.6% through the addition of 23.3 kg/t of sodium nitrate, 19.8 kg/t of sodium chloride, and a curing period of 30 days. The study reveals that the addition of sodium chloride increases copper extraction, in contrast to the findings presented by Cerda et al. [6], where it is mentioned that this additive does not have a significant impact. On the other hand, the addition of sodium nitrate contributes to the incorporation of oxidizing ions during the curing stage, which, in turn, facilitates the subsequent dissolution of copper. Furthermore, an increase in the curing time leads to an increment in copper extraction, highlighting the positive effect of this variable in the process.
Taboada et al. [7] increased copper extraction from a mixed mineral from 62.5% to 67.9% by adding ferric ions (Fe2(SO4)3·9.2H2O) and ferrous ions (FeSO4·7H2O) during the pretreatment, using 25 kg/t of H2SO4, 50 kg/t of NaCl, and a curing period of 30 days. In this context, it is important to highlight that the addition of sulfuric acid did not show a significant impact, as it only resulted in a 3% improvement in copper extraction. In contrast, a proportional relationship was observed between the increase in sodium chloride addition and curing days, with the increase in copper extraction. Quezada et al. [16,17] demonstrated that the curing time, in combination with the temperature during leaching, increases copper extraction. In these studies [15,16], the studied pretreatment conditions included 15 kg/t of H2SO4, 25 kg/t of NaCl, and a curing period of 15 days. Following the pretreatment, leaching at 70 °C achieved a copper extraction of 92%, compared to the 87% extraction obtained in the sample without pretreatment [16]. At a temperature of 90 °C, a copper extraction of 94% was achieved with pretreatment, while without pretreatment, the copper extraction was 90% [17]. In both studies, a copper extraction difference of 4.0% to 5.0% was achieved by conducting a pretreatment on the sample.
This document evaluates the effects of sulfuric acid, sodium chloride, curing time, and temperature in the pretreatment of a copper concentrate with a high arsenic content prior to leaching. The copper concentrate was characterized using various techniques. The pretreatment’s effect was assessed by measuring the copper in solution (copper extraction) resulting from tests with and without pretreatment. All experiments were conducted in duplicate. The obtained results were analyzed through statistical analysis, which generates an empirical model that enables the determination of the interaction between variables, predicting copper extraction.
2. Materials and Methods
2.1. Copper Concentrate Sample
The copper concentrate used comes from a mining company in the Antofagasta Region, Chile. It was characterized using a micro-rotary separator (Quantachrome instruments, Boynton Beach, FL, USA), and a representative sample of 5 g was obtained. The chemical composition of the concentrate was determined through atomic absorption spectrometry (SpectrAA-50/55, Varian, Santa Clara, CA, USA). The mineralogical characterization was carried out using 3 techniques: Qemscan using a Model Zeiss EVO 50 (Zeiss, Oberkochen, Germany) with Bruker AXS XFlash 4010 detectors (Bruker, Billerica, MA, USA) and iDiscover 5.3.2.501 software (FEI Company, Brisbane, Australia); a scanning electron microscope (SEM) (JEOL J-7100F, Tokyo, Japan) operating at 20 kV under high vacuum conditions (Emitech K-950X, Lohmar, Germany) coupled with an energy-dispersive X-ray spectroscopy (EDS) microanalysis system (Oxford Instruments INCA, Oxfordshire, UK); and X-ray diffraction (XRD) analysis using a diffractometer (PANalytical, X’Pert PRO MPD Alpha1, Malvern, UK) operating from 4° to 100° (2θ), 45 kV, 40 mA, and Kα 1.54 Å, with a step size 0.017° and a time per step of 150 s. X-ray diffractograms were interpreted using the X’pert HighScore Plus v.3.0e software (PANalytical, Almelo, The Netherlands). And finally, the particle size distribution was determined using a Microtrac S3500 (Microtrac Inc., York, PA, USA).
2.2. Experimental Design
In this study, an experimental design using the Taguchi methodology is employed for the combination of controllable factor levels. This methodology is a statistical approach used in the design of experiments that aims to optimize the quality of processes. It employs orthogonal arrays, which are structured matrices that ensure experiments are balanced and efficient. This balance is achieved because the factor levels are weighted equally, allowing for a fair assessment of each factor’s impact on the outcome. The use of orthogonal arrays in the Taguchi method allows for a significant reduction in the number of experimental runs needed compared to full factorial designs, which is both cost-effective and time-saving [19]. The parameters under analysis, along with their respective levels, are listed in Table 1. The response variable in all tests is copper extraction (copper in solution). The construction of this Taguchi orthogonal design was carried out using the Minitab software (17.1.0, LLC, State College, PA, USA). Among the different interfaces to develop the Taguchi method, the present study used Minitab due to its comprehensive suite of tools that facilitate the design, modification, analysis, and prediction of experiments using Taguchi’s approach. Through this methodology, an L16 (44) matrix is generated that incorporates 4 parameters and 4 levels for each of them (see Table 2).

Table 1.
Parameters and levels of experimental design in pretreatment tests.
Table 2.
Taguchi experimental matrix.
For the results analysis, the response surface methodology (RSM) is employed, allowing the assessment of the influence of these variables on copper extraction. In this case, RSM is a statistical technique used to model and analyze the relationships between the parameters and the copper extraction by fitting polynomial equations to experimental data. This methodology allows the identification of optimum process conditions for maximum copper extraction efficiency. RSM also facilitates the assessment of interactions between different variables, providing insights into complex system behavior. To do this, the experimentally calculated copper extractions based on the parameters and specific levels in Table 1 must be considered. Then, using the experimental combinations defined through the Taguchi design, as specified in Table 2, an empirical polynomial model is fitted using the Matlab software (ver. R2022a, MathWorks Inc., Natick, MA, USA). This model is a second-order polynomial (Equation (1)), which considers the 4 input variables detailed above that influence copper extraction.
Equation (1) represents a polynomial function describing the copper extraction process in terms of various parameters. In this equation, Xn denotes each parameter (Table 1), and βn represents the coefficients determined through response surface methodology (RSM). This second-order equation accounts for both individual coefficients for each parameter and the interactions among different parameters. The coefficients derived from the fitted empirical model serve to formulate a prediction function, which estimates the percentage of copper extraction in experimental tests. The obtained coefficients from the fitted empirical model are used to formulate the prediction function, which estimates copper extraction in the experimental tests. The model’s confidence level is determined by calculating the coefficient of determination R2 and the root mean square error (RMSE) using Matlab. The R2 coefficient indicates the proportion of the total variance of the variable explained by the regression. However, RMSE is calculated by using the average square root of the square absolute error between the obtained copper extraction and the predicted copper extraction.
The closer this value is to 1, the better the fit of the model for predicting copper extraction; otherwise, values far from 1 indicate a higher error. Minimizing the error is crucial to accurately predicting copper extraction and generating the response surface graph, which is based on independent parameters, and provides a true visualization of the effect of the variables under investigation on copper extraction. The visual representation of the response surface is generated from prediction points and is subject to evaluation in the predictor model.
2.3. Curing Experiments
In this research, 16 curing experiments were conducted, all in duplicate. The tests were carried out with the addition of sulfuric acid and sodium chloride, as well as different curing times and temperature conditions (Table 1). For the curing experiments, a representative sample of 5 g of the concentrate was used, which was placed in a watch glass. Then, separately, sodium chloride and sulfuric acid were added (in the corresponding amounts for each experiment). Subsequently, water was added to achieve gradual adhesion between particles until the formation of stable agglomerates was achieved. Once the agglomerates were formed, the samples were covered with another watch glass to prevent evaporation, and they were subjected to specific temperature and time conditions in an oven (Memmert GmbH, H110N230/115, Schwabach, Germany).
Once the curing time was completed, the samples were washed with a diluted solution of sulfuric acid at a concentration of 0.5 g/L (for the dissolution of any sulfates or soluble phases formed in the pretreatment). The washing was carried out using mechanical agitation, using an RW 20 digital overhead stirrer (IKA, Staufen im Breisgau, Germany) at 200 min−1. The solid/liquid ratio was maintained at 1/100 and at room temperature for a period of 5 min. Sample solutions (50 mL aliquots) were periodically withdrawn for chemical analysis of copper in solution. The samples were filtered (0.2 µm), and the copper concentrations in the filtrate were determined by atomic absorption spectrometry (SpectrAA-50/55, Varian, Santa Clara, CA, USA).
3. Results and Discussion
3.1. Copper Concentrate Characterization
The chemical composition of the sample can be found in Table 3. Due to the presence of sulfide minerals, the solubility ratio (% soluble Cu/% total Cu) is 4.4%, which is low compared to when copper oxides predominate. This indicates that only 4.4% of the copper present in the sample will be soluble in conventional conditions. Arsenic, on the other hand, represents 5.91% of the sample, classifying it as a complex concentrate. Finally, the presence of iron is eventually associated with chalcopyrite and/or pyrite.
Table 3.
Chemical analysis of feed sample using atomic absorption spectrometry.
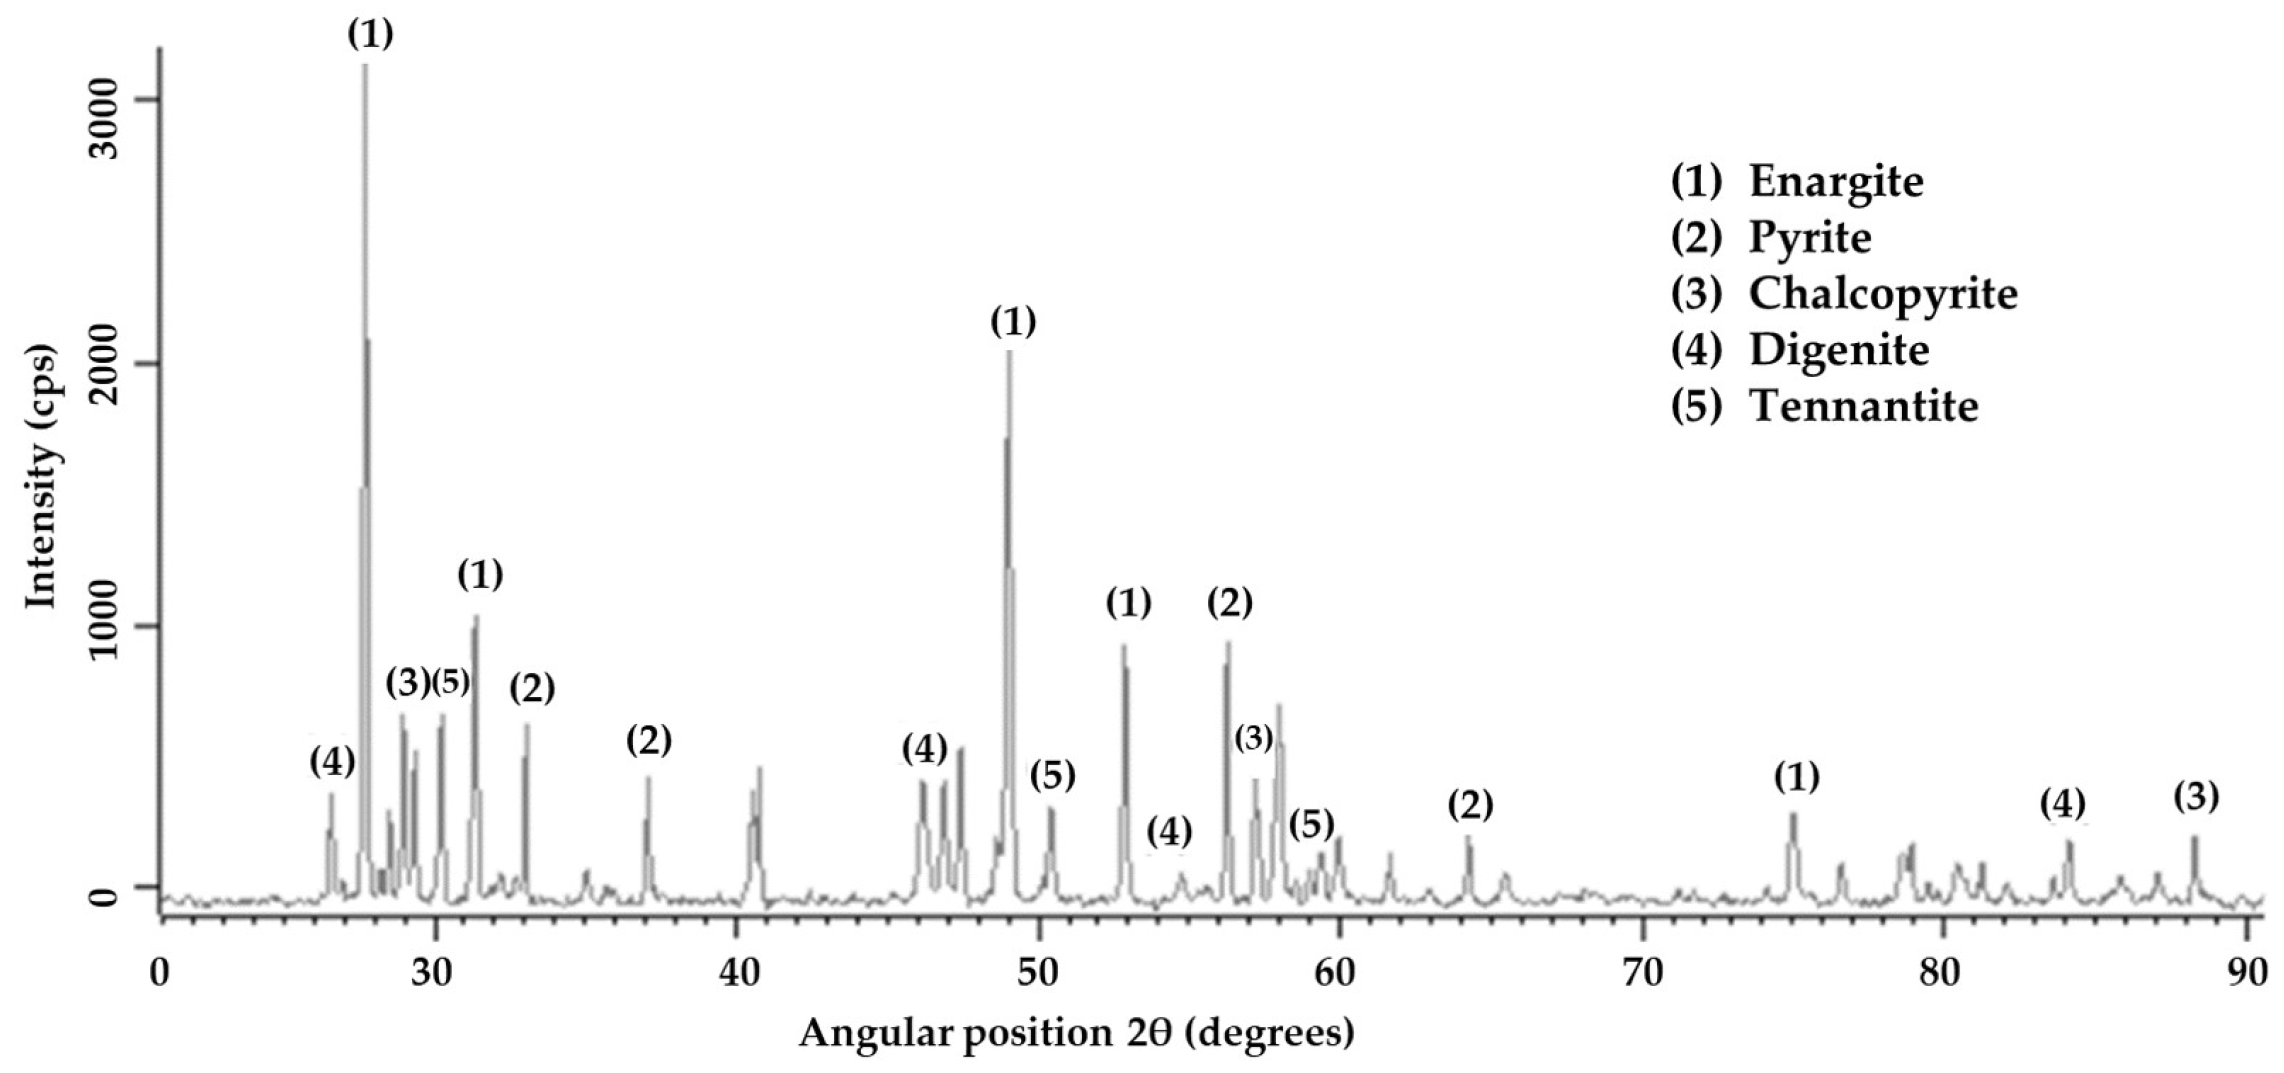
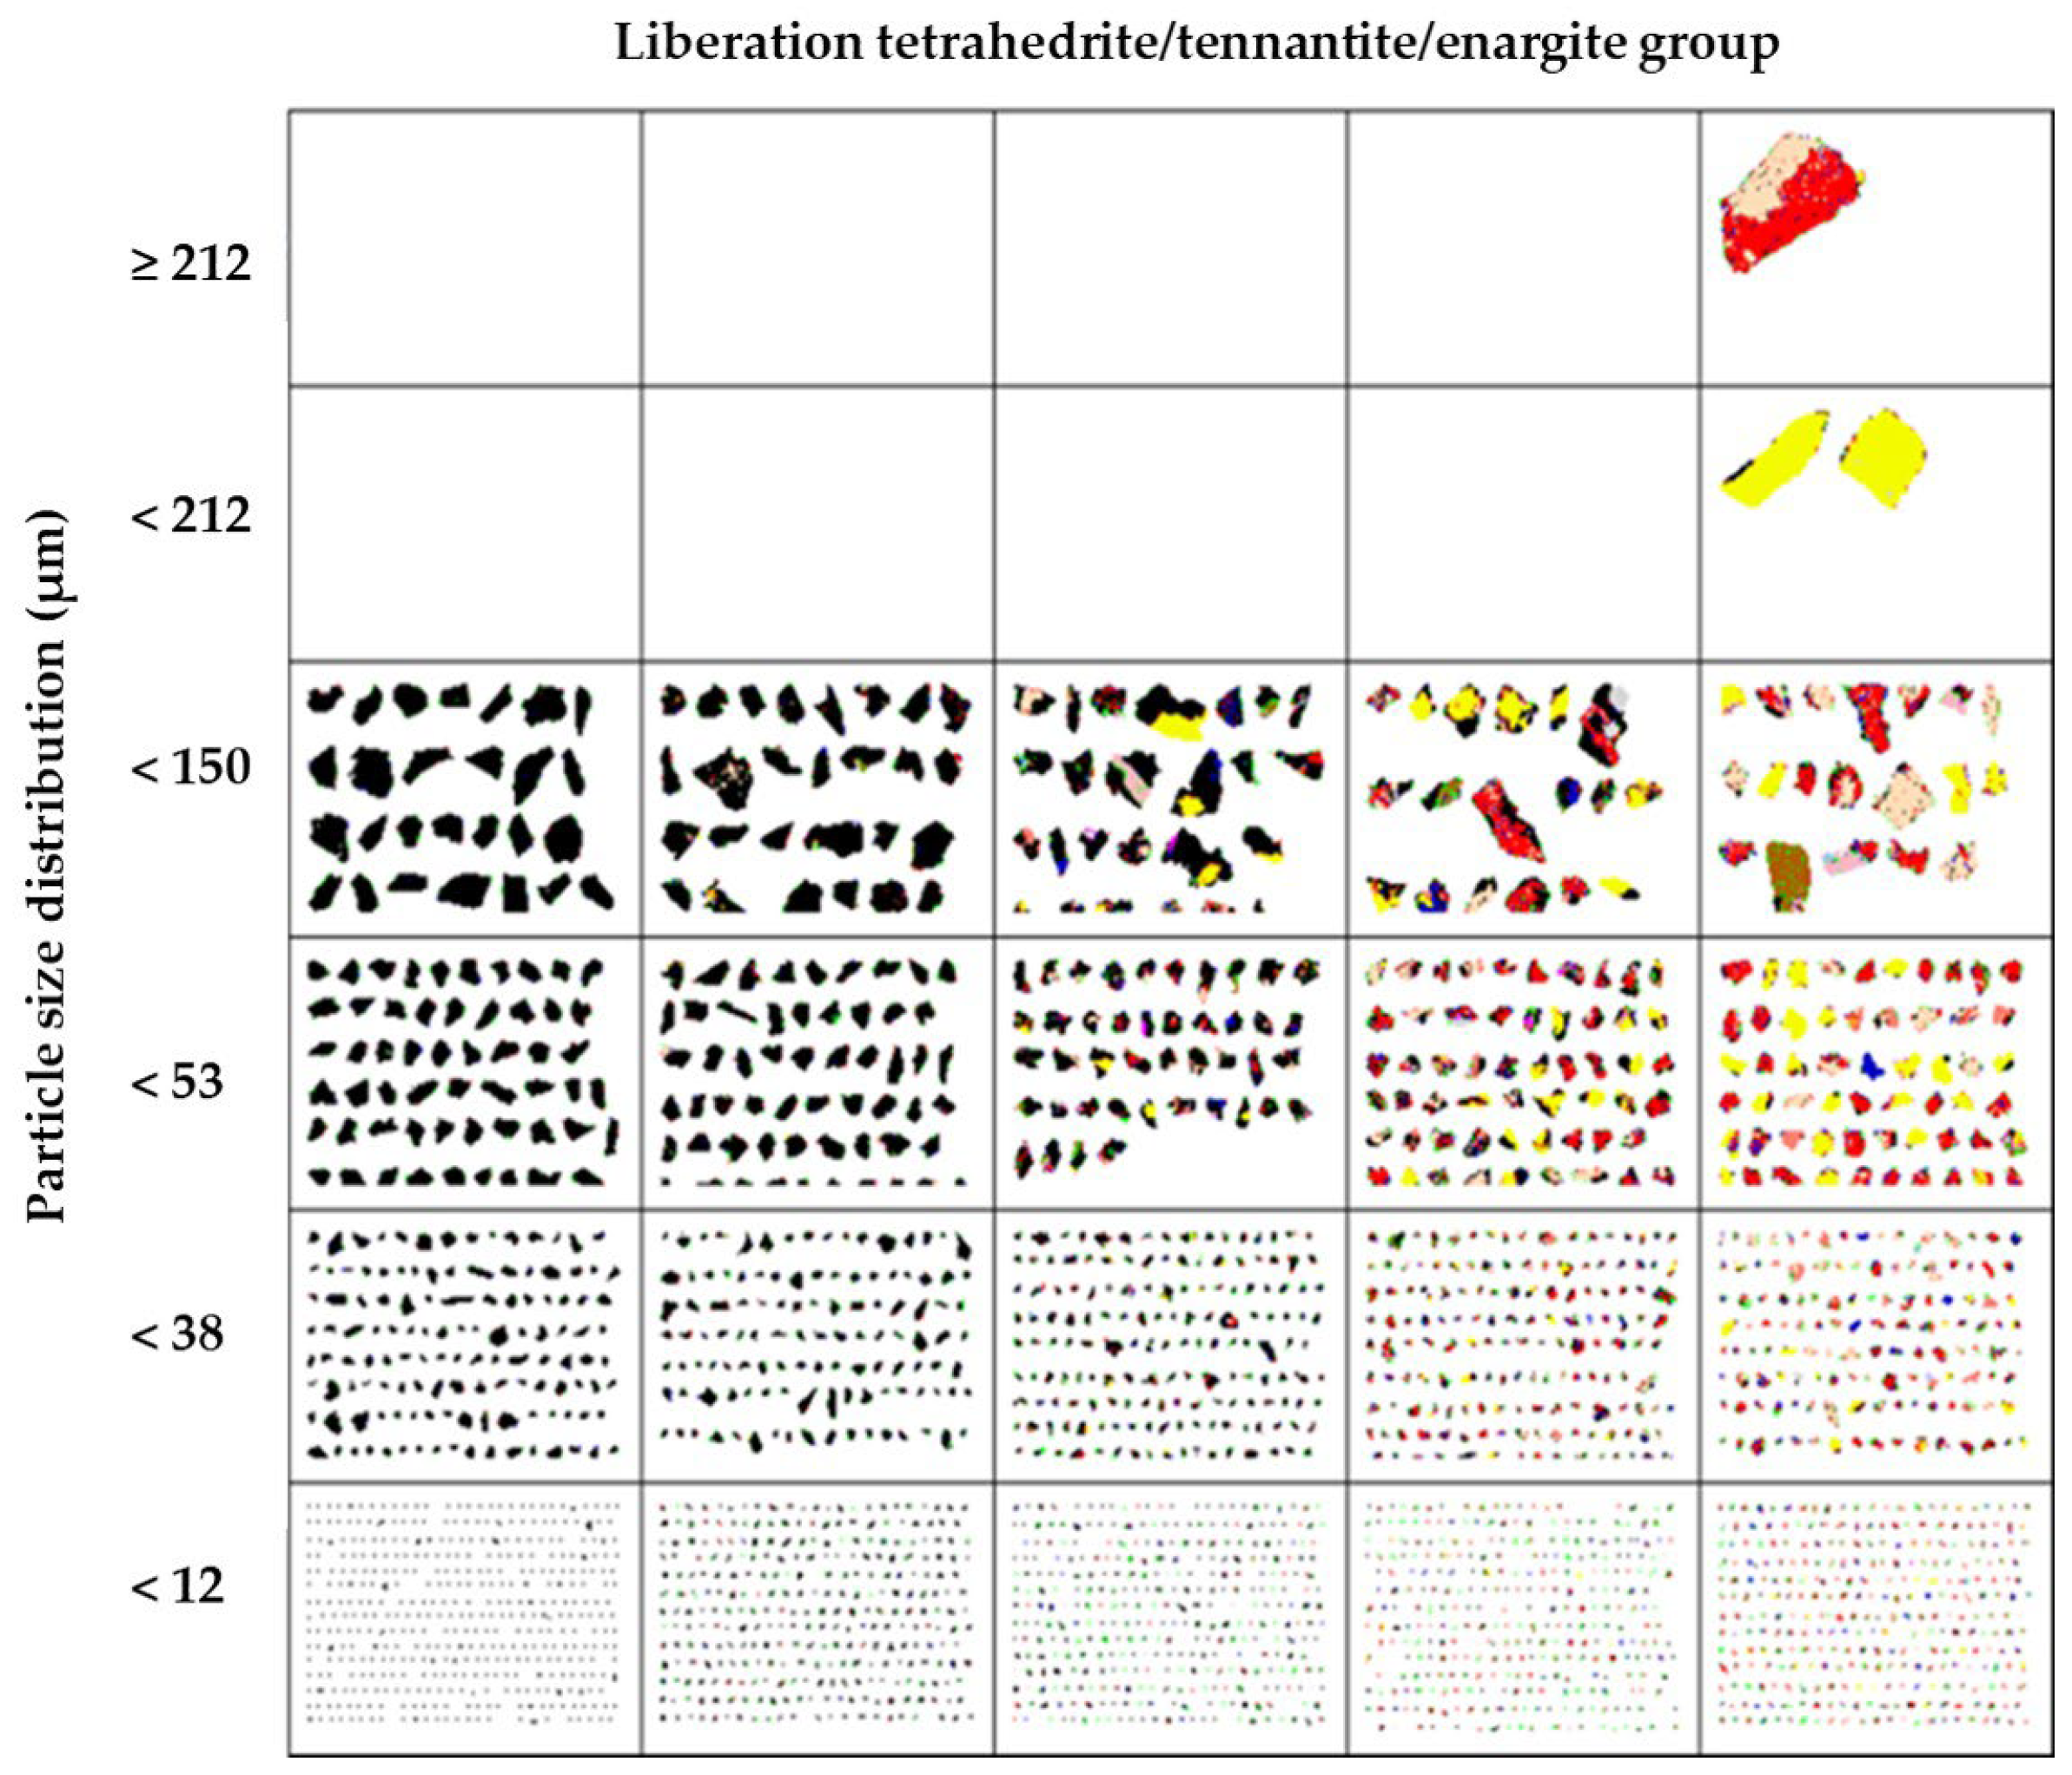
X-ray diffraction analysis (Figure 1) detected the predominant presence of enargite, followed by pyrite, chalcopyrite, digenite, and tennantite. The presence of arsenic in the sample is associated with minerals such as enargite and tennantite. Details about the mineralogical composition and the degree of mineral liberation in the sample were obtained through Qemscan analysis. Table 4 shows that the sample was predominantly composed of tetrahedrite/tennantite/enargite (35.93%), followed by pyrite (22.35%) and chalcocite/digenite (16.55%). These results align with the analysis conducted through X-ray diffraction. The analysis of mineral liberation (Figure 2) indicates that in the case of enargite, particles > 150 µm have a liberation of 20%. This indicates that these >150 µm particles are in direct surface contact with minerals such as pyrite, chalcocite/digenite, and bornite. Therefore, achieving dissolution depends on initially dissolving these associated minerals. Conversely, enargite particles ranging from 150 to 53 µm exhibit liberation levels of 95%–80%. As particle size decreases, the liberation degree is expected to increase. However, particles smaller than 12 µm are mostly found within the liberation range of 80%–50%.

Figure 1.
X-ray diffractometer patterns of the feed sample.
Table 4.
Mineralogical composition using Qemscan.
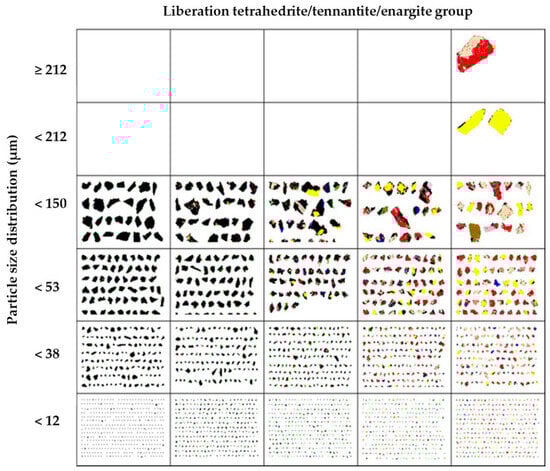
Figure 2.
Liberation degree analysis using Qemscan for the tetrahedrite/tennantite/enargite group.
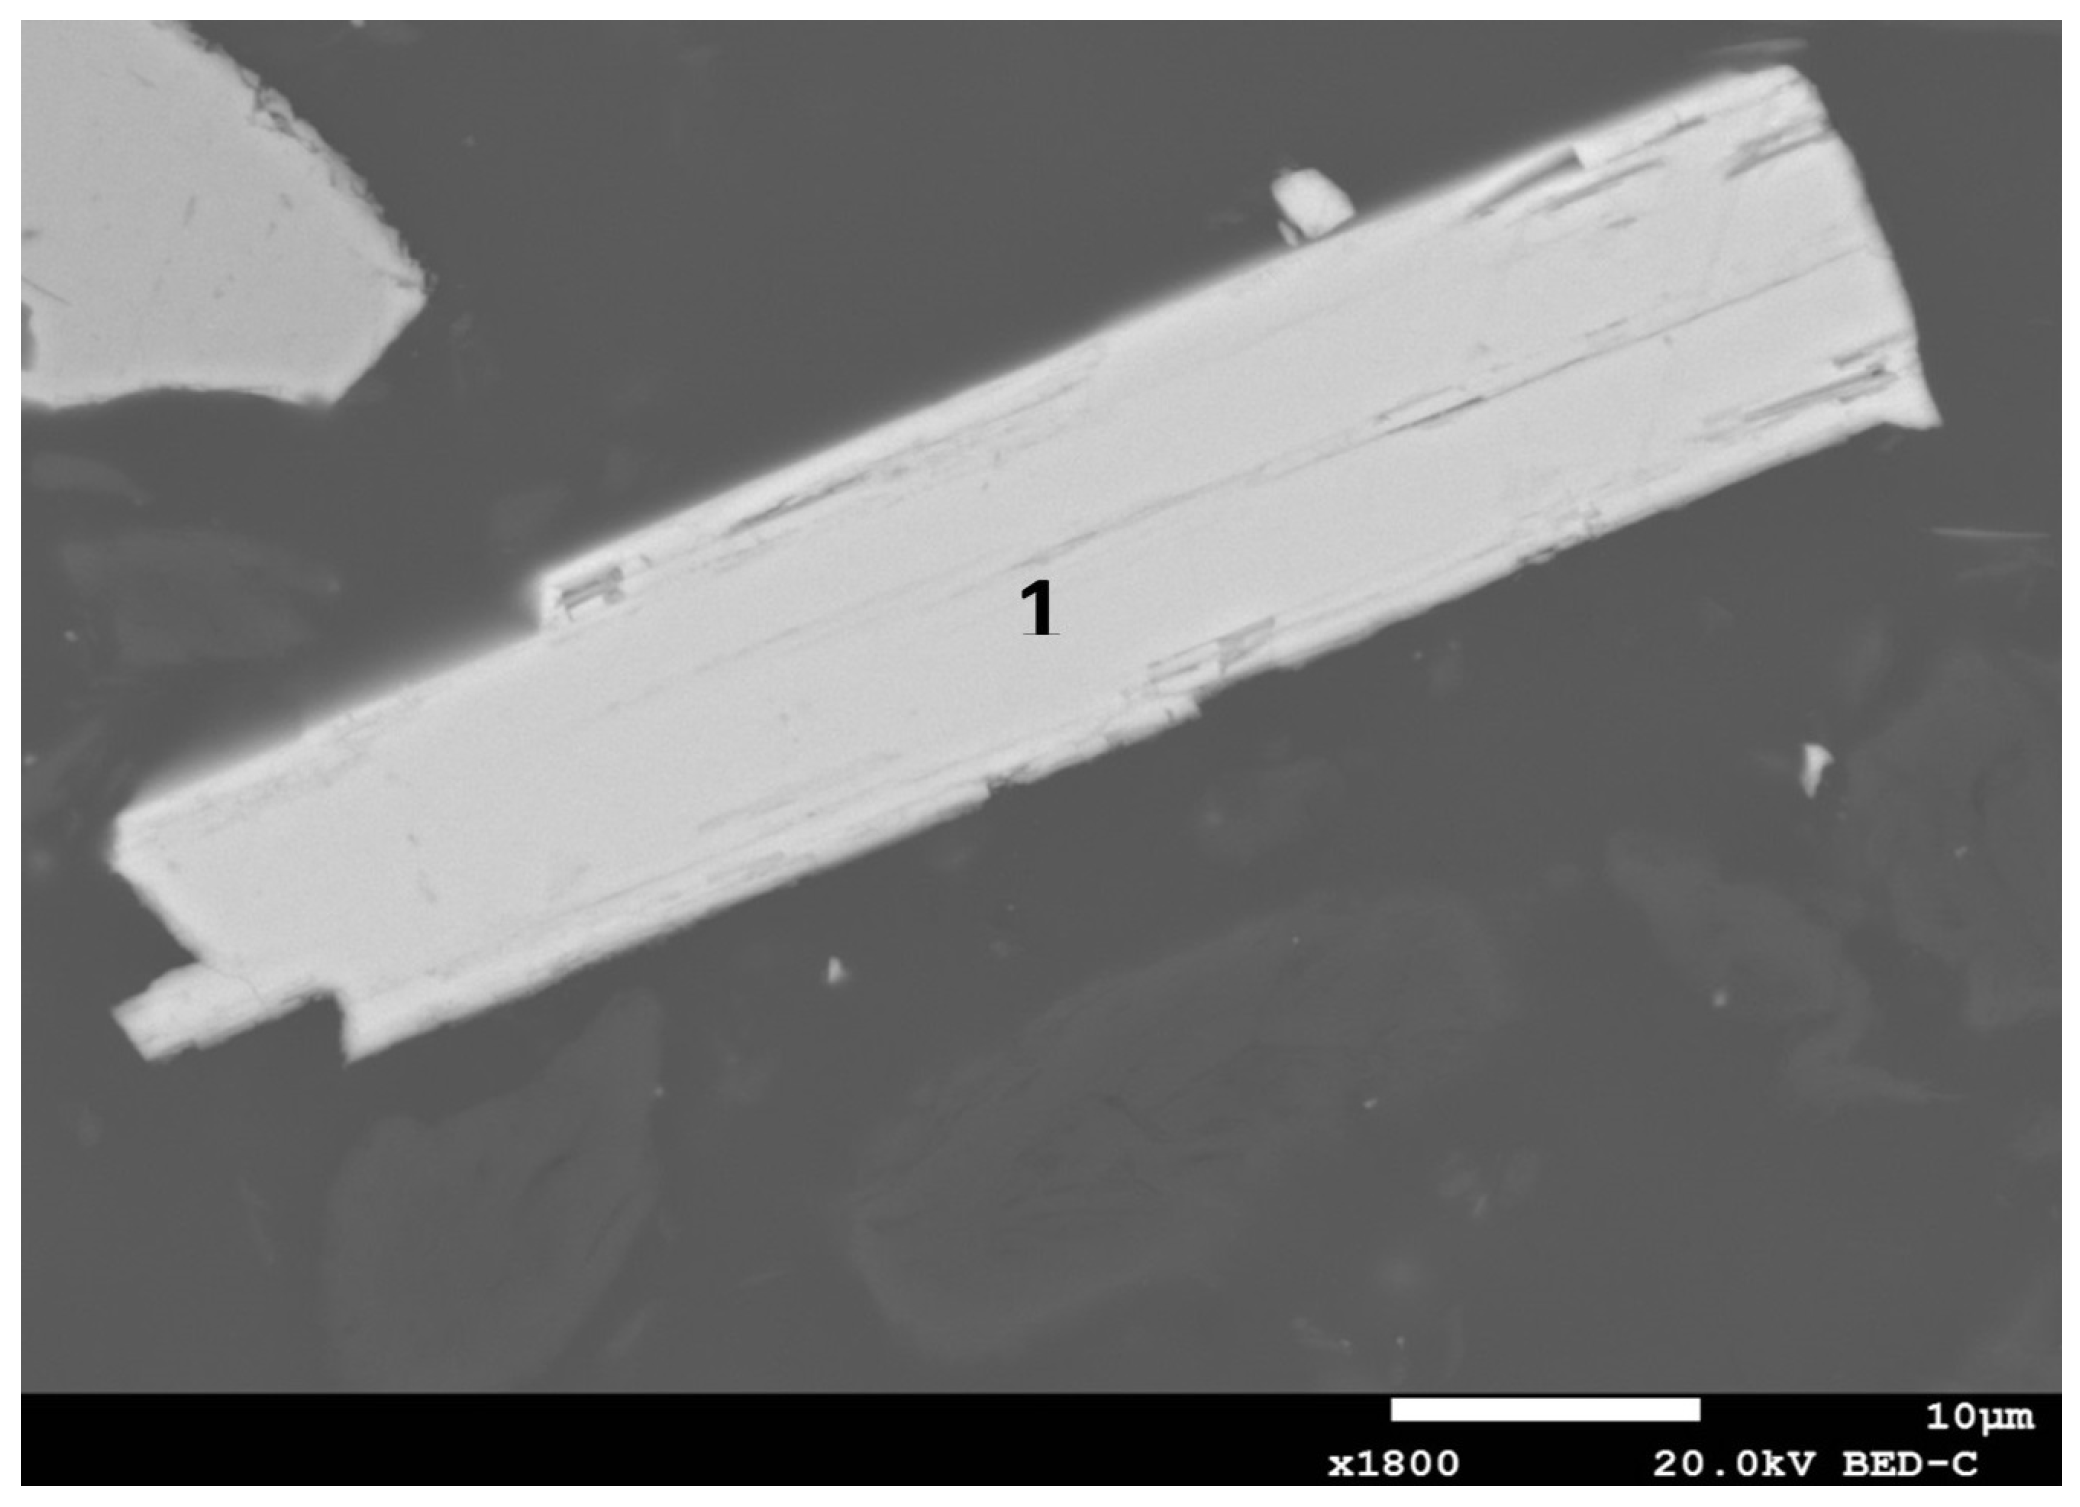
The analysis using scanning electron microscopy revealed the structural morphology of the sample. At a scale of 10 µm, Figure 3 shows a particle mainly associated with enargite, which is liberated as it is not associated with other minerals. In Figure 4, at an increased scale of 100 µm, a particle of enargite can be observed, occluded by silicate minerals.

Figure 3.
Morphological analysis of feed sample using scanning electron microscope (1: enargite).
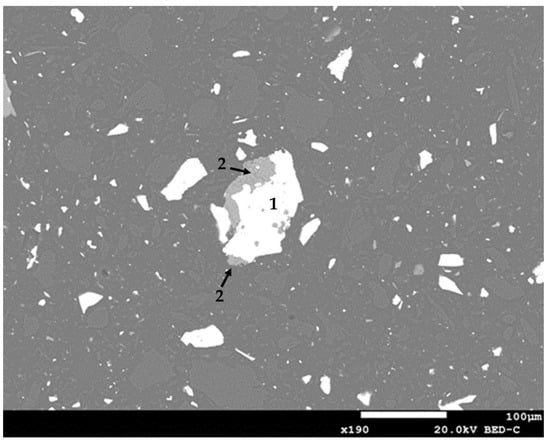
Figure 4.
Morphological analysis of feed sample using scanning electron microscope (1: enargite; 2: silicates).
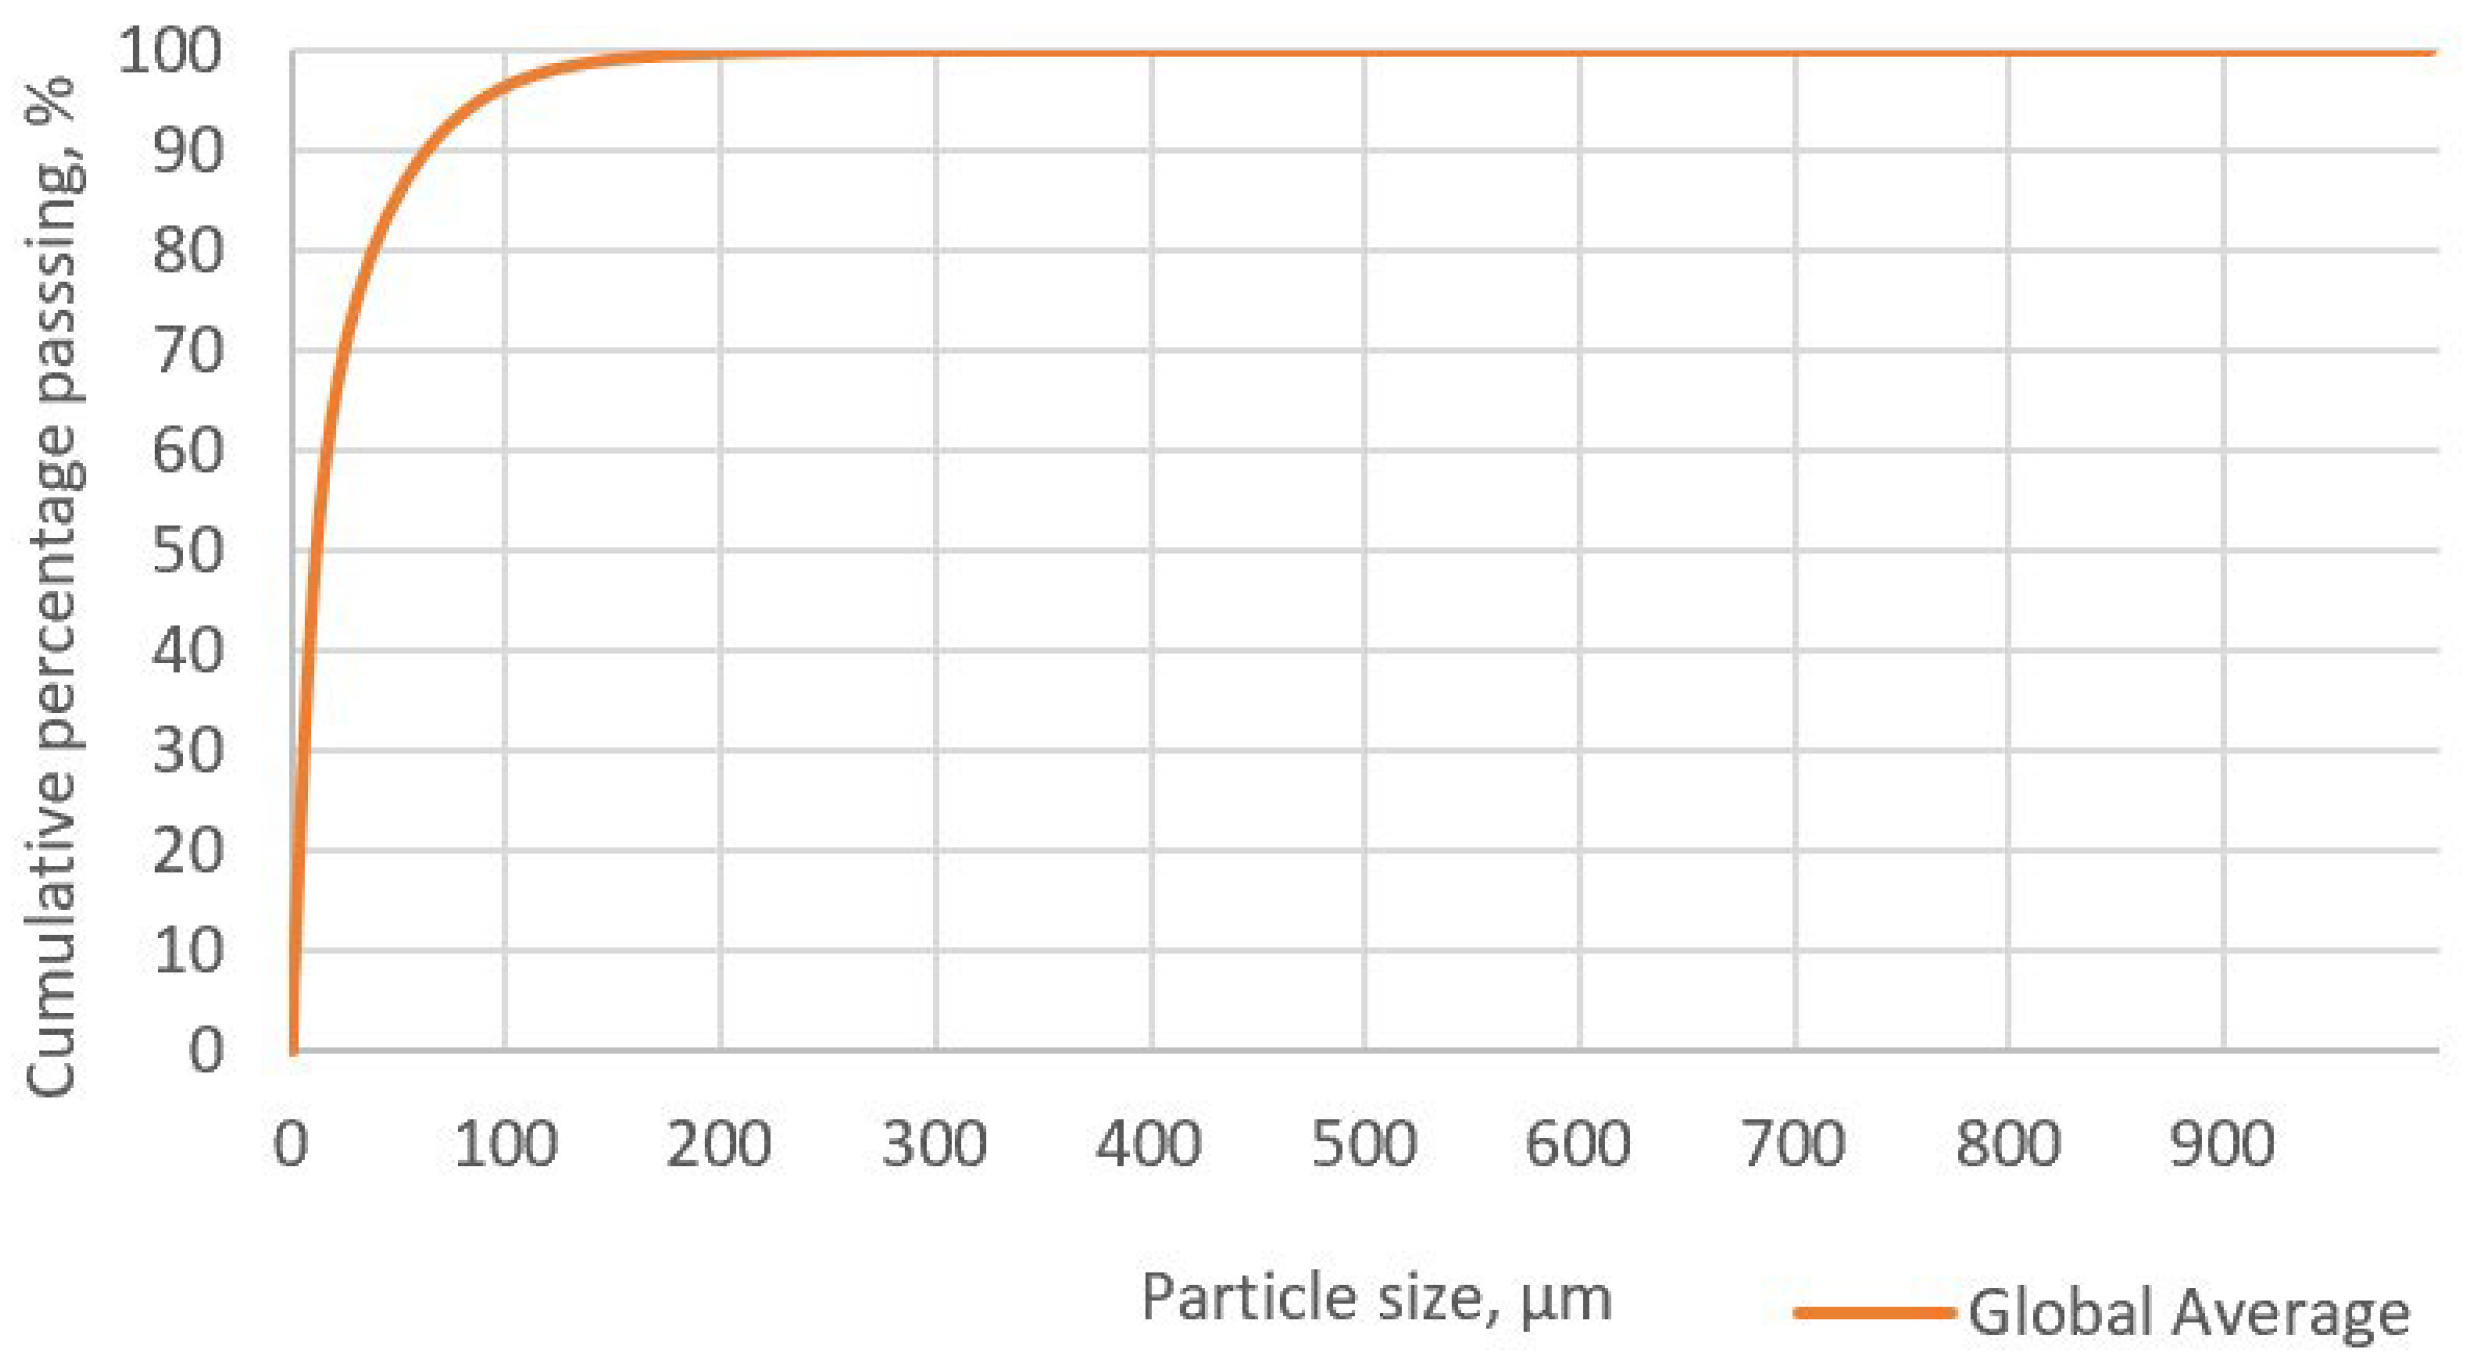
Figure 5 presents the particle size distribution curve in the concentrate. In this graph, the P80 value, which indicates that 80% of the concentrate particles are smaller, is 37.63 µm. Comparing this value with the liberation grade determined through Qemscan, it can be observed that, for the specific case of enargite, the liberation grade of the particle ranges between 80 and 95%. This suggests that enargite particles are not likely occluded or associated with other minerals.
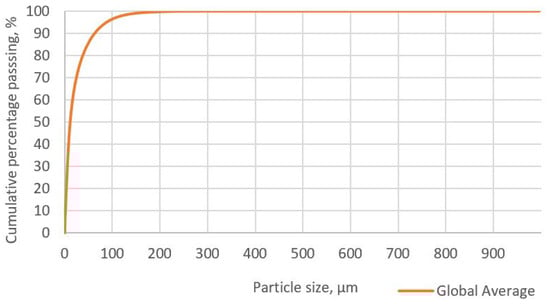
Figure 5.
Particle size distribution of the initial sample.
3.2. Curing Test
The results of the curing tests are presented in Table 5. Copper extraction values are calculated as the average of duplicate tests. It is important to note that test 1, performed without the addition of sulfuric acid and sodium chloride at an ambient temperature of 25 °C, achieves a copper extraction of 2.73%. This result is associated with the dissolution of soluble minerals present in the sample, such as atacamite and brochantite, identified through Qemscan. Furthermore, according to the chemical characterization, the sample is 4.44% soluble, correlating with the extraction observed in test 1.
Table 5.
Average copper extraction obtained experimentally.
In tests 5, 9, and 13, a slight increase in copper extraction is observed, from 3.37% to 3.88%. This increase in extraction is attributed to the shared characteristic of these tests, which is the absence of sulfuric acid as an additive. Additionally, the increase in copper extraction is related to the progressive increase in curing time and the amount of sodium chloride added. Although there is variation in temperature between these tests, it is inferred that this factor did not have a significant influence on the specific observed results.
Tests 6, 11, and 16 share the absence of sodium chloride addition but show an increase in curing time and in the amount of sulfuric acid. This leads to a successive rise in copper extraction, starting from 10.69%, progressing to 14.45%, and finally peaking at 26.71%. Similar to the findings in tests 5, 9, and 13, the variability in temperature suggests that it does not exert a significant influence on these specific results.
The highest copper extraction was obtained in test 16, which had a curing time of 15 days, sulfuric acid addition of 210 kg/t, and a temperature of 50 °C, achieving a copper extraction of 26.71% in the pretreatment. This extraction is associated with the dissolution of minerals such as chalcocite/digenite since the dissolution kinetics of these minerals are faster than those of enargite/tennantite/tetrahedrite.
Comparing these results with other studies is complicated, given that the majority of existing studies are centered around chalcopyrite [6,7,10]. However, considering that both enargite and chalcopyrite are refractory minerals, the results could be compared with those presented by Herreros et al. [20] in their investigation of the pretreatment of a sample containing 0.22% soluble copper and 2.01% total copper. This sample was pretreated with sulfuric acid and sodium chloride at room temperature (20 °C) for 8 days of curing, and then subjected to a dissolution stage with sulfuric acid and oxygen.
According to Herreros et al. [20], complete dissolution occurred for copper sulfide minerals such as djurleite and digenite. However, in the case of chalcopyrite, traces were detected, suggesting it remained unattacked, attributed to the refractoriness of chalcopyrite compared to digenite. In a separate study, Quezada et al. [17] achieved a copper extraction of 22.66% in the pretreatment, utilizing a chalcopyrite sample as the primary copper contributor. This pretreatment process involved the addition of 15 kg/t of sulfuric acid, 25 kg/t of sodium chloride, and a curing period of 15 days.
In the study by Quezada et al. [17], 9% of the copper extraction was attributed to chalcanthite, while the remaining percentage was assigned to the dissolution of new species such as CuSO4 and CuCl(OH). It is important to note that not all chalcopyrite reacted to give rise to new species. Consequently, it is inferred that copper extraction in the present study initially occurred in soluble minerals like atacamite, followed by a chemical attack on minerals based on their refractoriness, namely, chalcocite/digenite, then covellite, chalcopyrite, and finally enargite.
3.3. Response Surface Methodology
3.3.1. Predictor Model
The coefficients required for formulating the model, which estimates copper extraction, are presented in Table 6. These coefficients serve in constructing the predictor model, as defined by Equation (2). The equation calculates estimated extraction values, facilitating subsequent comparisons with experimental results to validate the model.
Table 6.
Predictor model coefficients.
Table 6.
Predictor model coefficients.
| b0 | 1.9176 |
| b1 | −1.0282 |
| b2 | 0.0892 |
| b3 | 0.0465 |
| b4 | 0.0949 |
| b11 | 0.0110 |
| b22 | −0.0002 |
| b33 | 0.0002 |
| b44 | 0.0004 |
| b12 | 0.0096 |
| b13 | 0.0043 |
| b14 | −0.0051 |
| b23 | −0.0005 |
| b24 | −0.0050 |
| b34 | 0.0001 |
- Y: Response variable.
- X1, X2, X3, X4: Factors (curing time, H2SO4 concentration, NaCl concentration, and temperature, respectively).
- b1, b2, b3, b4: Linear coefficients for each factor.
- c11, c22, c33, c44: Quadratic coefficients for each factor squared.
- c12, c13, c14, c23, c24, c34: Interaction coefficients between pairs of factors.
- E: Error.
To precisely evaluate the predictive model for copper extraction, the R2, value is calculated, obtaining an error value of 0.9895. A value close to 1 indicates a better fit of the model to the variable under study (copper extraction). This variable is influenced by factors such as curing time, temperature, and the concentrations of sulfuric acid and sodium chloride.
Consequently, the root mean square error (RMSE) is calculated, resulting in an error value of 0.6742. This finding suggests a high degree of reliability for the prediction model, with an error of 0.6742%.
3.3.2. Response Surfaces
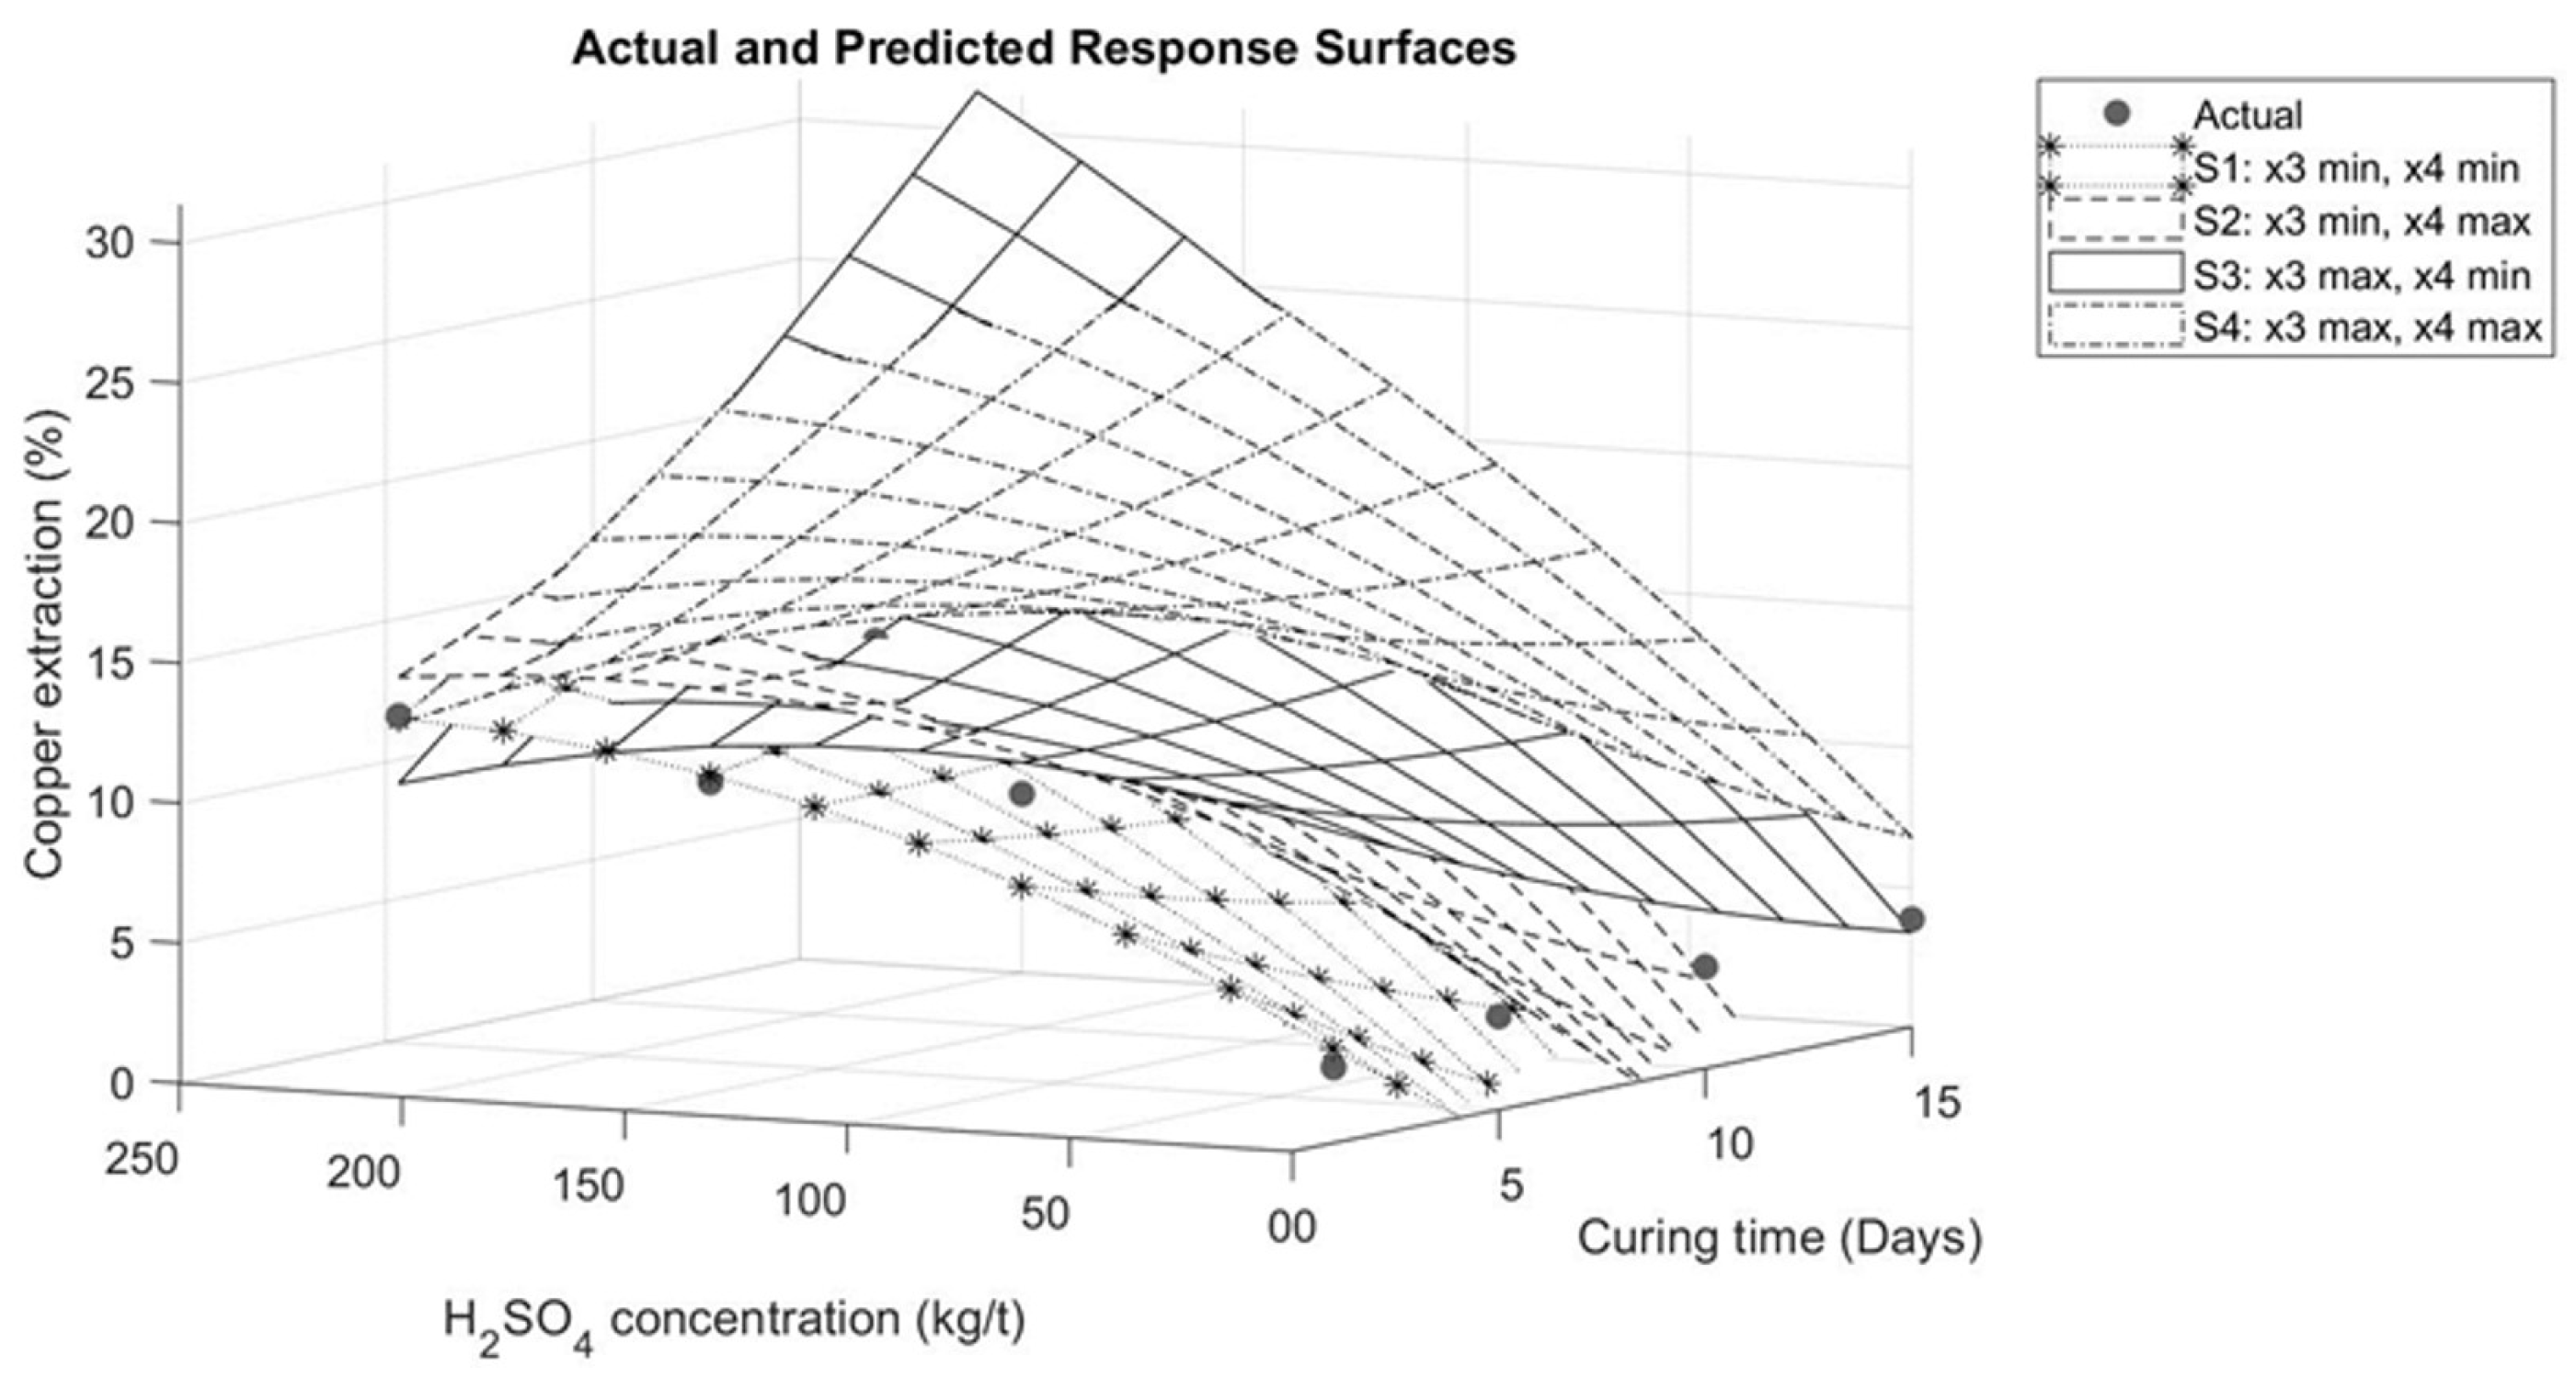
The graphical representations describing the interaction between the variables are presented in Figure 6, Figure 7, Figure 8 and Figure 9. Figure 6 illustrates the interaction between sulfuric acid (H2SO4) and curing time, keeping constant both the maximum and minimum of the variables of sodium chloride (NaCl) addition and temperature, as applicable. In Figure 6, it is observed for the specific case of these tests that an increase in curing time has a positive influence on copper extraction only when the sulfuric acid addition exceeds 70 kg/t. Conversely, if the sulfuric acid addition is less than 70 kg/t, a negative impact on extraction is evident, as shown in Figure 7. This effect is associated with the moisture in the agglomerates. With less sulfuric acid added, there will be less moisture, leading to faster evaporation of the solution.

Figure 6.
Response surface for interaction between sulfuric acid and curing time.
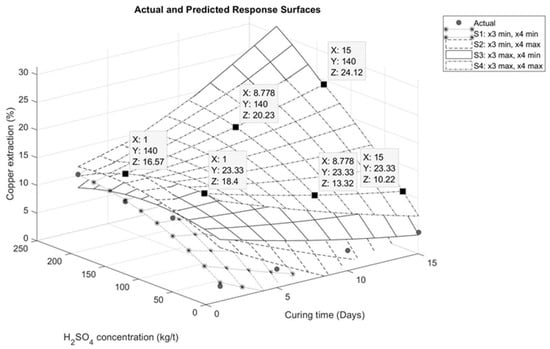
Figure 7.
Effect of sulfuric acid addition on response surface for interaction between sulfuric acid and curing time.
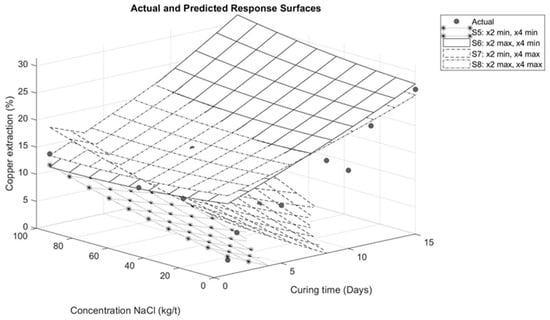
Figure 8.
Response surface for interaction between sodium chloride and curing time.
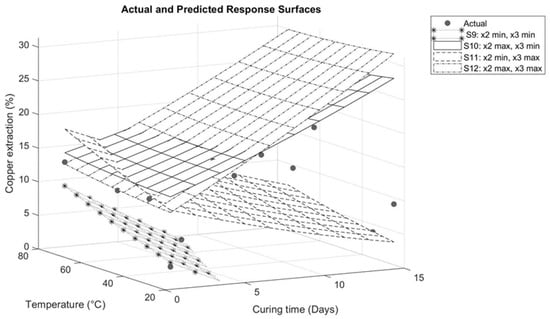
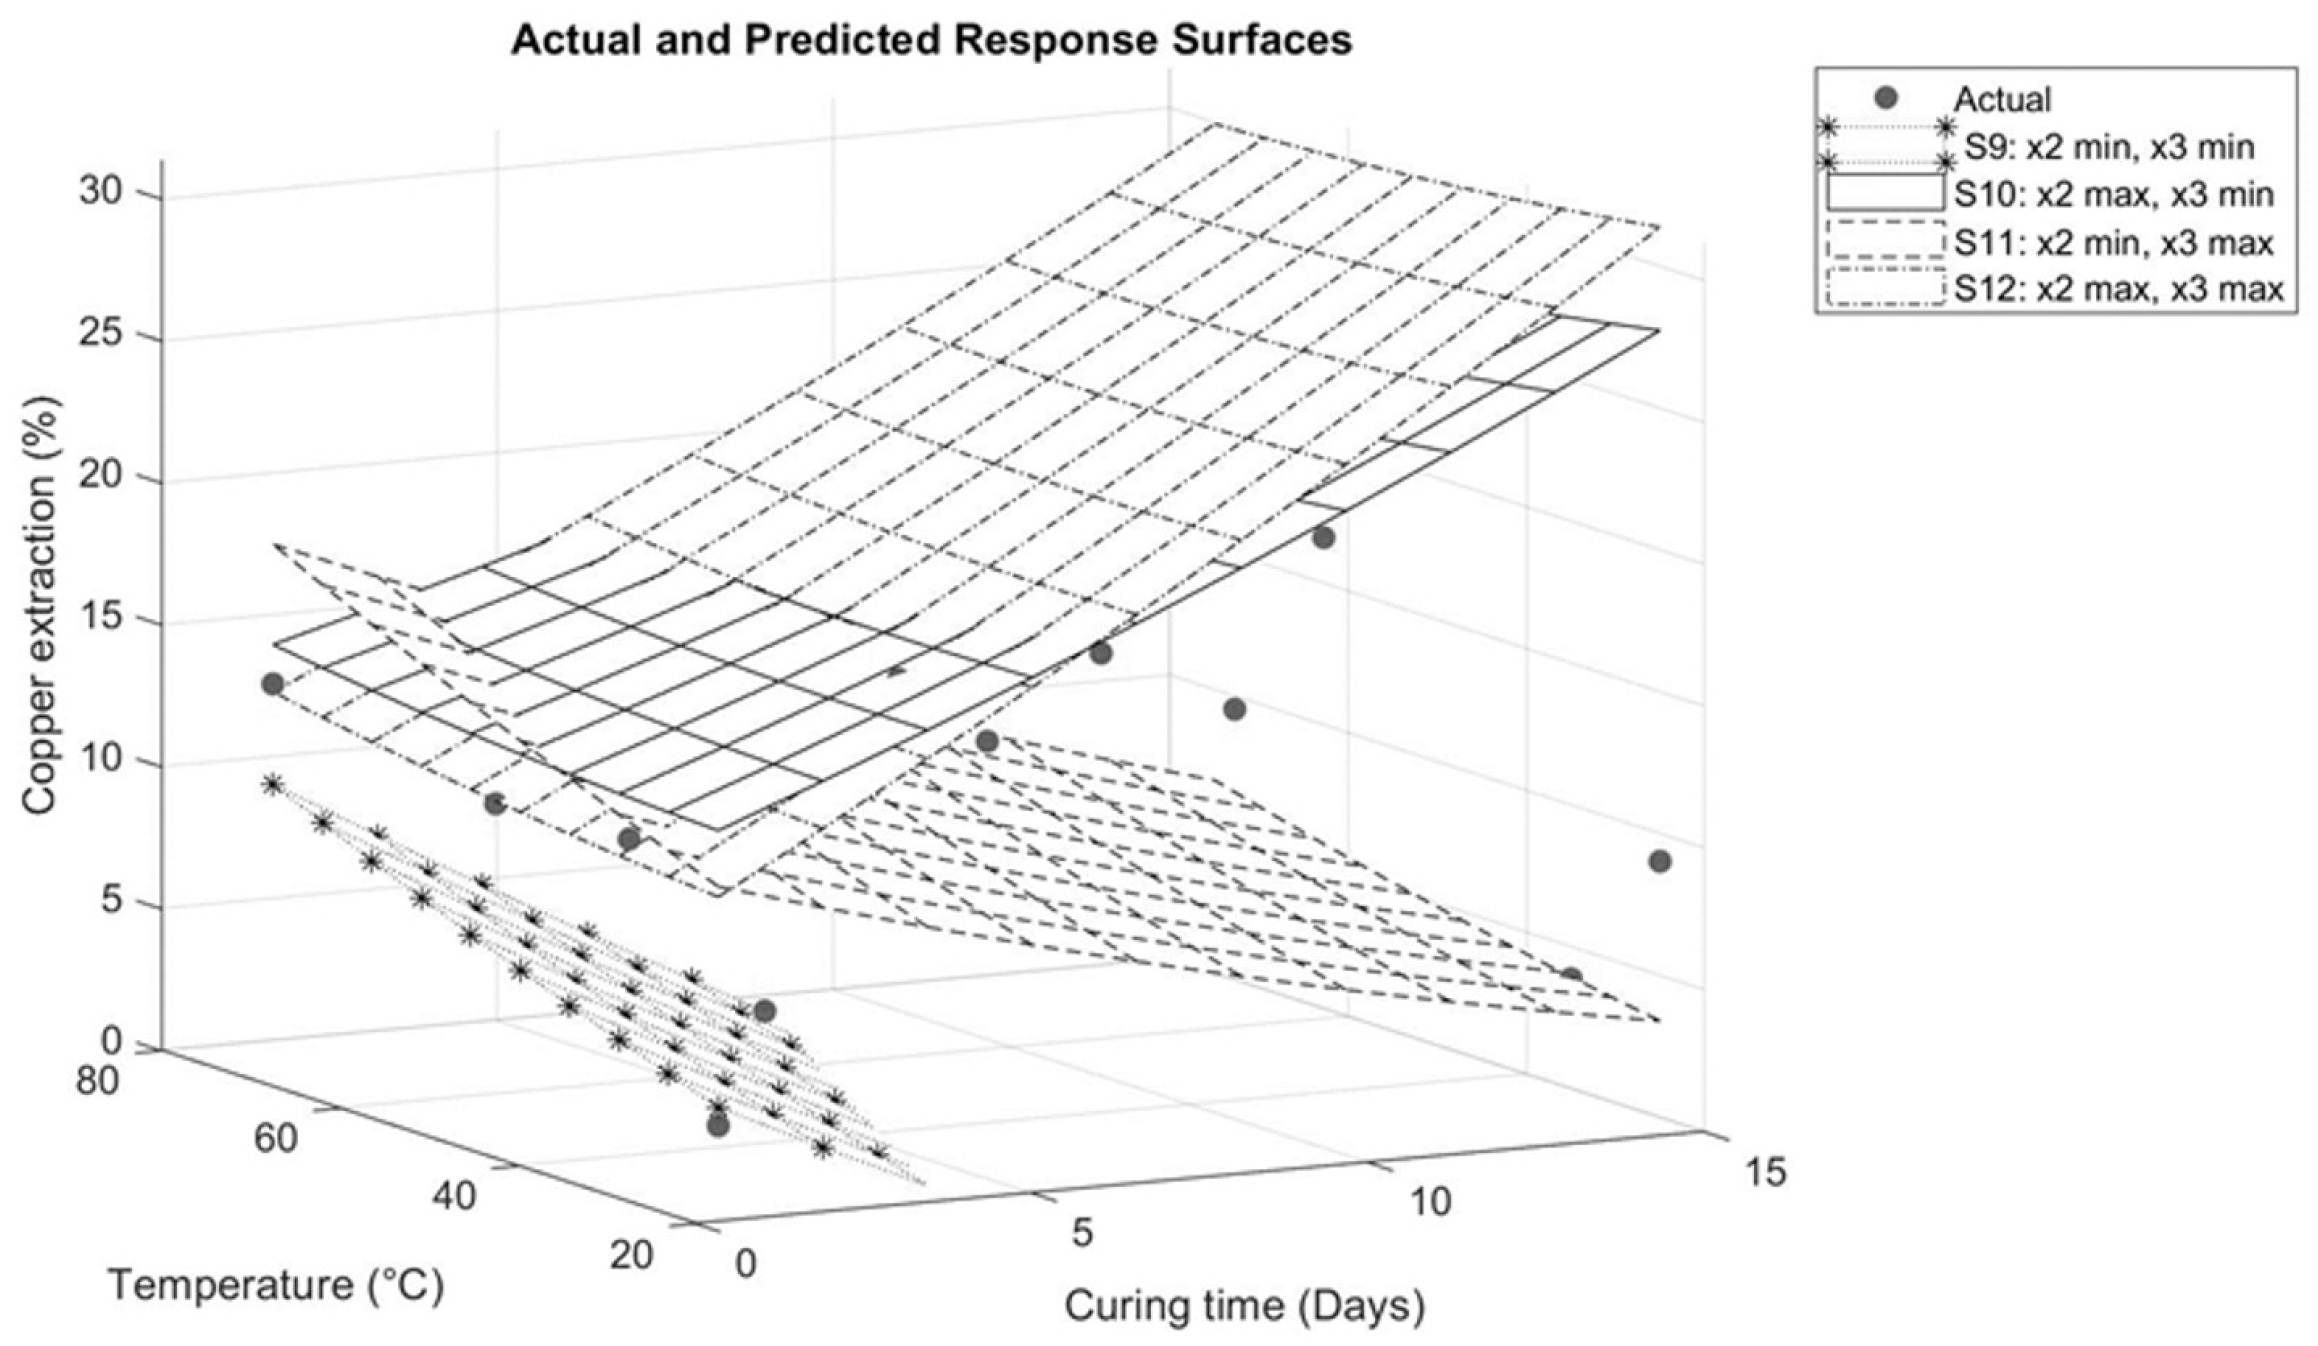
Figure 9.
Response surface for interaction between temperature and curing time.
Figure 8 illustrates the interaction between sodium chloride addition and curing time. When analyzing curing times shorter than 7 days and increasing the amount of sodium chloride at response surfaces S6 and S8, it is observed that sodium chloride has a minor influence on copper extraction compared to times longer than 7 days. Therefore, in the case of these tests, adding a high amount of sulfuric acid (210 kg/t) and prolonging the curing time (more than 7 days) has a greater impact on copper extraction than adding sodium chloride. This is associated with the contact time between the solution and the mineral, as the curing time allows for the homogeneous distribution of chloride ions present in the solution. This distribution leads to a higher degree of porosity in the agglomerates, which helps to retain moisture [21]. However, increasing the addition of chloride ions does not necessarily increase copper extraction [7,22]. These results are consistent with those presented by Quezada et al. [23], where curing time was a greater contributor to copper extraction than sodium chloride. Similarly, the findings reported by Cerda et al. [6] indicate that temperature and curing time have a more significant effect than the addition of sodium chloride.
In the case of response surfaces S5 and S7, the effect of sulfuric acid addition is evident. By maintaining a constant minimum sulfuric acid level of 0 kg/t on these surfaces, a reduction in copper extractions is observed compared to surfaces S6 and S8. This highlights the significant influence of sodium chloride in achieving higher copper extractions, particularly when the sulfuric acid addition is insufficient to satisfy sulfation reactions. These results are difficult to compare with other published studies [7,8,23], as most studies focus on the effect of chloride ion addition under specific pretreatment conditions, without considering the synergy with acid levels. However, this influence is related to proton activity. The sodium in sodium chloride (NaCl) associates with the sulfate in sulfuric acid (H2SO4), releasing Cl− and H+ ions. The latter helps to create more acidic conditions in the system [24].
Conversely, the effect of curing time is less pronounced when compared to the addition of sulfuric acid. This is evident in surfaces S6 and S8 where, despite the longer curing time, a factor that typically increases copper extraction, as noted by Quezada et al. [23], the absence of sulfuric acid prevents the formation of soluble species that are crucial for increasing copper extraction.
Figure 9 illustrates the interaction between temperature and curing time. On response surfaces S12 and S10, the maximum sulfuric acid addition studied (210 kg/t) is kept constant. As shown on surfaces S5, S7, S10, and S12, sulfuric acid has a significant influence on copper extraction when studied in synergy with other variables. Under these conditions, increasing the temperature from 25 to 75 °C during 1 day of curing results in a significant increase in copper extraction (from 13.13% to 18.13%). However, when the curing time is extended to 15 days, copper extraction is slightly affected (31.37% to 29.92%). This is attributed to the increase in evaporation, as the simultaneous rise in time and temperature causes the drying of the agglomerates, impacting the diffusion of the solution and, consequently, its reactivity.
Salinas and Neethling [25] suggest that lower evaporation during curing can increase leaching performance. This is attributed to the correlation between reaction time and the duration of contact between the solution and the ore. As temperature increases, evaporation intensifies, resulting in the drying of the agglomerates, a reduction in the contact time between the solution and the ore, and an increase in solution saturation. This favors the precipitation of species.
Therefore, it is important to maintain a level of moisture in the agglomerates. According to research by Liu et al. [9], an agglomerate without water does not achieve full consumption of the acid as it is not evenly distributed. However, an increase in the moisture content results in a more efficient distribution of the additives and, as a result, higher copper extractions.
On the contrary, for surfaces S9 and S11, where the minimum sulfuric acid addition studied is kept constant, the temperature increase achieves a greater influence on copper extraction. Increasing the temperature from 25 to 75 °C for 1 day of curing in response surface S9 results in an increase in copper extraction from 3.37% to 9.68%. Similarly, in response surface S11, the extraction increases from 11.15% to 18.13%. The difference in extractions between the two surfaces is due to the fact that response surface S11 includes the addition of sodium chloride.
4. Conclusions
The sample under study is a complex copper concentrate with a content of 35.57% total copper, 1.58% soluble copper, and 5.91% arsenic. It is composed of 35.93% enargite and 16.55% digenite as the main copper contributors. Scanning electron microscopy analysis identifies that enargite particles are both liberated and occluded by silicate minerals.
The highest copper extraction in the pretreatment is achieved by adding 210 kg/t of sulfuric acid and maintaining a temperature of 50 °C for 15 days of curing, achieving a copper extraction of 26.71%. Eventually, the dissolution of copper is associated with the chalcocite/digenite present.
The interaction between the increased addition of sulfuric acid and the curing time is beneficial for copper extraction, especially when the addition of sulfuric acid exceeds 70 kg/t. This is associated with the moisture content of the agglomerate; if the amount of sulfuric acid is less than 70 kg/t, it will have lower moisture. Consequently, the solution tends to evaporate faster, limiting the contact between the solution and the mineral.
The influence of sodium chloride is conditioned by the addition of sulfuric acid. For elevated concentrations of sulfuric acid (210 kg/t), an increase in the addition of sodium chloride will not have a significant impact on copper extraction. However, in the absence of sulfuric acid, sodium chloride will have a significant impact on achieving higher copper extractions. This is due to its ability to increase the acidity of the system and satisfy sulfation reactions.
When carrying out the curing of the mineral at a higher temperature, it is important to maintain an adequate level of moisture to ensure the uniform distribution of the solution. The increase in temperature leads to greater evaporation of the solution, causing the agglomerate to dry, thereby hindering its reactivity (generation of copper sulfate or other more soluble phases).
This study uses response surface methodology (RSM) to model copper extraction based on factors such as curing time, temperature, and sulfuric acid and sodium chloride concentrations. The predictive model shows high reliability with an R2 of 0.9895 and a low root mean square error (RMSE) of 0.6742, confirming its precision in predicting copper extraction under different conditions. RSM serves as a valuable complement to the Taguchi method, offering a robust statistical representation of experimental assays. The fitting of the model with RSM yields a reliable estimation of copper extraction rates. Notably, the high R-squared value provides valuable insight into the behavior of copper extraction with respect to the parameters under investigation.
Author Contributions
Conceptualization, V.Q.; methodology, V.Q., G.V. and N.M.; software, D.C.-A., G.V. and N.M.; validation, V.Q. and D.C.-A.; formal analysis, V.Q.; investigation, V.Q.; resources, V.Q.; data curation, G.V. and N.M.; writing—original draft preparation, G.V.; writing—review and editing, V.Q.; visualization, V.Q.; supervision, V.Q.; project administration, V.Q.; funding acquisition, V.Q. All authors have read and agreed to the published version of the manuscript.
Funding
This research and the APC was funded by Agencia Nacional de Investigación y Desarrollo (ANID), Proyecto Fondecyt de Iniciación 2023, grant number 11230963.
Institutional Review Board Statement
Not applicable.
Informed Consent Statement
Not applicable.
Data Availability Statement
Data are contained within the article.
Conflicts of Interest
The authors declare no conflicts of interest. The funders had no role in the design of the study; in the collection, analyses, or interpretation of data; in the writing of the manuscript; or in the decision to publish the results.
References
- Cochilco RPI. Proyección de la Producción de Cobre en Chile 2023–2034. 2024. Available online: https://www.cochilco.cl/Mercado%20de%20Metales/Proyecci%C3%B3n%20de%20la%20producci%C3%B3n%20esperada%20de%20cobre%202023-2034_Vfinal2.pdf (accessed on 27 December 2023).
- Cochilco RPI. Proyección de la Producción de Cobre en Chile 2022–2033. 2022. Available online: https://www.cochilco.cl/Mercado%20de%20Metales/Proyecci%C3%B3n%20de%20la%20producci%C3%B3n%20esperada%20de%20cobre%202022-2033.pdf (accessed on 2 October 2023).
- Mandal, B.K.; Suzuki, K.T. Arsenic Round the World: A Review. Talanta 2002, 58, 201–235. [Google Scholar] [CrossRef] [PubMed]
- Cochlco RPI. Exportación de Concentrados de Cobre: Caracterización de Condiciones Comerciales. 2021. Available online: https://www.cochilco.cl/Mercado%20de%20Metales/2021%2006%2002%20Exportaci%C3%B3n%20de%20concentrados%20de%20cobre%20-%20Caracterizaci%C3%B3n%20de%20condiciones%20comerciales.pdf (accessed on 22 March 2023).
- Olvera, O.G.; Dixon, D.G.; Asselin, E. Electrochemical study of the dissolution of enargite (Cu3AsS4) in contact with activated carbon. Electrochim. Acta 2013, 107, 525–536. [Google Scholar] [CrossRef]
- Cerda, C.P.; Taboada, E.; Jamett, N.E.; Ghorbani, Y. Effect of Pretreatment on Leaching Primary Copper Sulfide in Acid-Chloride Media. Minerals 2018, 8, 1. [Google Scholar] [CrossRef]
- Hernández, P.C.; Dupont, J.; Herreros, O.; Jimenez, Y.P.; Torres, C.M. Accelerating copper leaching from sulfide ores in acid-nitrate-chloride media using agglomeration and curing as pretreatment. Minerals 2019, 9, 250. [Google Scholar] [CrossRef]
- Taboada, M.E.; Hernández, P.C.; Padilla, A.P.; Jamett, N.E.; Graber, T.A. Effects of Fe+2 and Fe+3 in Pretreatment and Leaching on a Mixed Copper Ore in Chloride Media. Metals 2021, 11, 866. [Google Scholar] [CrossRef]
- Liu, Q.; Liao, Y.; Wu, Y.; Xi, J.; Ji, G. Research progress on enhancing leaching efficiency of chalcopyrite. Huagong Jinzhan/Chem. Ind. Eng. Prog. 2022, 41, 6099–6110. [Google Scholar] [CrossRef]
- Vargas, T.; Estay, H.; Arancibia, E.; Díaz-Quezada, S. In situ recovery of copper sulfide ores: Alternative process schemes for bioleaching application. Hydrometallurgy 2020, 196, 105442. [Google Scholar] [CrossRef]
- Aracena, A.; Rodríguez, E.; Jerez, O. Enargite leaching under ammoniacal media with sodium persulfate and consecutive precipitation of As/Cu with Na2S/NaHS. Hydrometallurgy 2020, 192, 105290. [Google Scholar] [CrossRef]
- Phuong Thao, N.T.; Tsuji, S.; Jeon, S.; Park, I.; Tabelin, C.B.; Ito, M.; Hiroyoshi, N. Redox potential-dependent chalcopyrite leaching in acidic ferric chloride solutions: Leaching experiments. Hydrometallurgy 2020, 194, 105299. [Google Scholar] [CrossRef]
- Jahromi, F.G.; Cowan, D.H.; Ghahreman, A. Lanxess Lewatit® AF 5 and activated carbon catalysis of enargite leaching in chloride media; a parameters study. Hydrometallurgy 2017, 174, 184–194. [Google Scholar] [CrossRef]
- Yang, W.; Qian, L.; Jin, B.; Feng, Q.; Li, L.; He, K.; Yang, J. Leaching behaviors of copper and arsenic from high-arsenic copper sulfide concentrates by oxygen-rich sulfuric acid leaching at atmospheric pressure. J. Environ. Chem. Eng. 2022, 10, 107358. [Google Scholar] [CrossRef]
- Ruiz, M.C.; Vera, M.V.; Padilla, R. Mechanism of enargite pressure leaching in the presence of pyrite. Hydrometallurgy 2011, 105, 290–295. [Google Scholar] [CrossRef]
- Quezada, V.; Roca, A.; Benavente, O.; Cruells, M. Effect of curing time on copper leaching from chalcopyrite. In Proceedings of the COM Hosting Copp 2019, Vancouver, BC, Canada, 18–21 August 2019; p. 11. [Google Scholar]
- Quezada, V.; Roca, A.; Benavente, O.; Cruells, M.; Melo, E. The effects of sulphuric acid and sodium chloride agglomeration and curing on chalcopyrite leaching. Metals 2021, 11, 873. [Google Scholar] [CrossRef]
- Neira, A.; Pizarro, D.; Quezada, V.; Velásquez-Yévenes, L. Pretreatment of copper sulphide ores prior to heap leaching: A review. Metals 2021, 11, 1067. [Google Scholar] [CrossRef]
- Gutierrez, H.; de la Vara, R. Análisis y Diseño de Experimentos; McGraw-Hill Interamericana: New York, NY, USA, 2008; Volume 2, ISBN 978-970-10-6526-6. [Google Scholar]
- Herreros, O.; Viñals, J. Leaching of sulfide copper ore in a NaCl-H2SO4-O2 media with acid pre-treatment. Hydrometallurgy 2007, 89, 260–268. [Google Scholar] [CrossRef]
- Carneiro, M.F.C.; Leão, V.A. The Role of Sodium Chloride on Surface Properties of Chalcopyrite Leached with Ferric Sulphate. Hydrometallurgy 2007, 87, 73–82. [Google Scholar] [CrossRef]
- Yévenes, L.V.; Miki, H.; Nicol, M. The dissolution of chalcopyrite in chloride solutions: Part 2: Effect of various parameters on the rate. Hydrometallurgy 2010, 103, 80–85. [Google Scholar] [CrossRef]
- Quezada, V.; Roca, A.; Benavente, O.; Keith, B.; Melo, E. Effect of pretreatment prior to leaching on a chalcopyrite mineral in acid media using NaCl and KNO3. J. Mater. Res. Technol. 2020, 9, 10316–10324. [Google Scholar] [CrossRef]
- Senanayake, G. Review of theory and practice of measuring proton activity and pH in concentrated chloride solutions and application to oxide leaching. Miner. Eng. 2007, 20, 634–645. [Google Scholar] [CrossRef]
- Salinas-Farran, L.; Neethling, S.J. Modelling the curing of agglomerated ores with comparison to micro-CT. Miner. Eng. 2023, 202, 108240. [Google Scholar] [CrossRef]


Disclaimer/Publisher’s Note: The statements, opinions and data contained in all publications are solely those of the individual author(s) and contributor(s) and not of MDPI and/or the editor(s). MDPI and/or the editor(s) disclaim responsibility for any injury to people or property resulting from any ideas, methods, instructions or products referred to in the content. |
© 2024 by the authors. Licensee MDPI, Basel, Switzerland. This article is an open access article distributed under the terms and conditions of the Creative Commons Attribution (CC BY) license (https://creativecommons.org/licenses/by/4.0/).