


Application and Mechanism of Mixed Anionic/Cationic Collectors on Reverse Flotation of Hematite


Abstract
1. Introduction
2. Materials and Methods
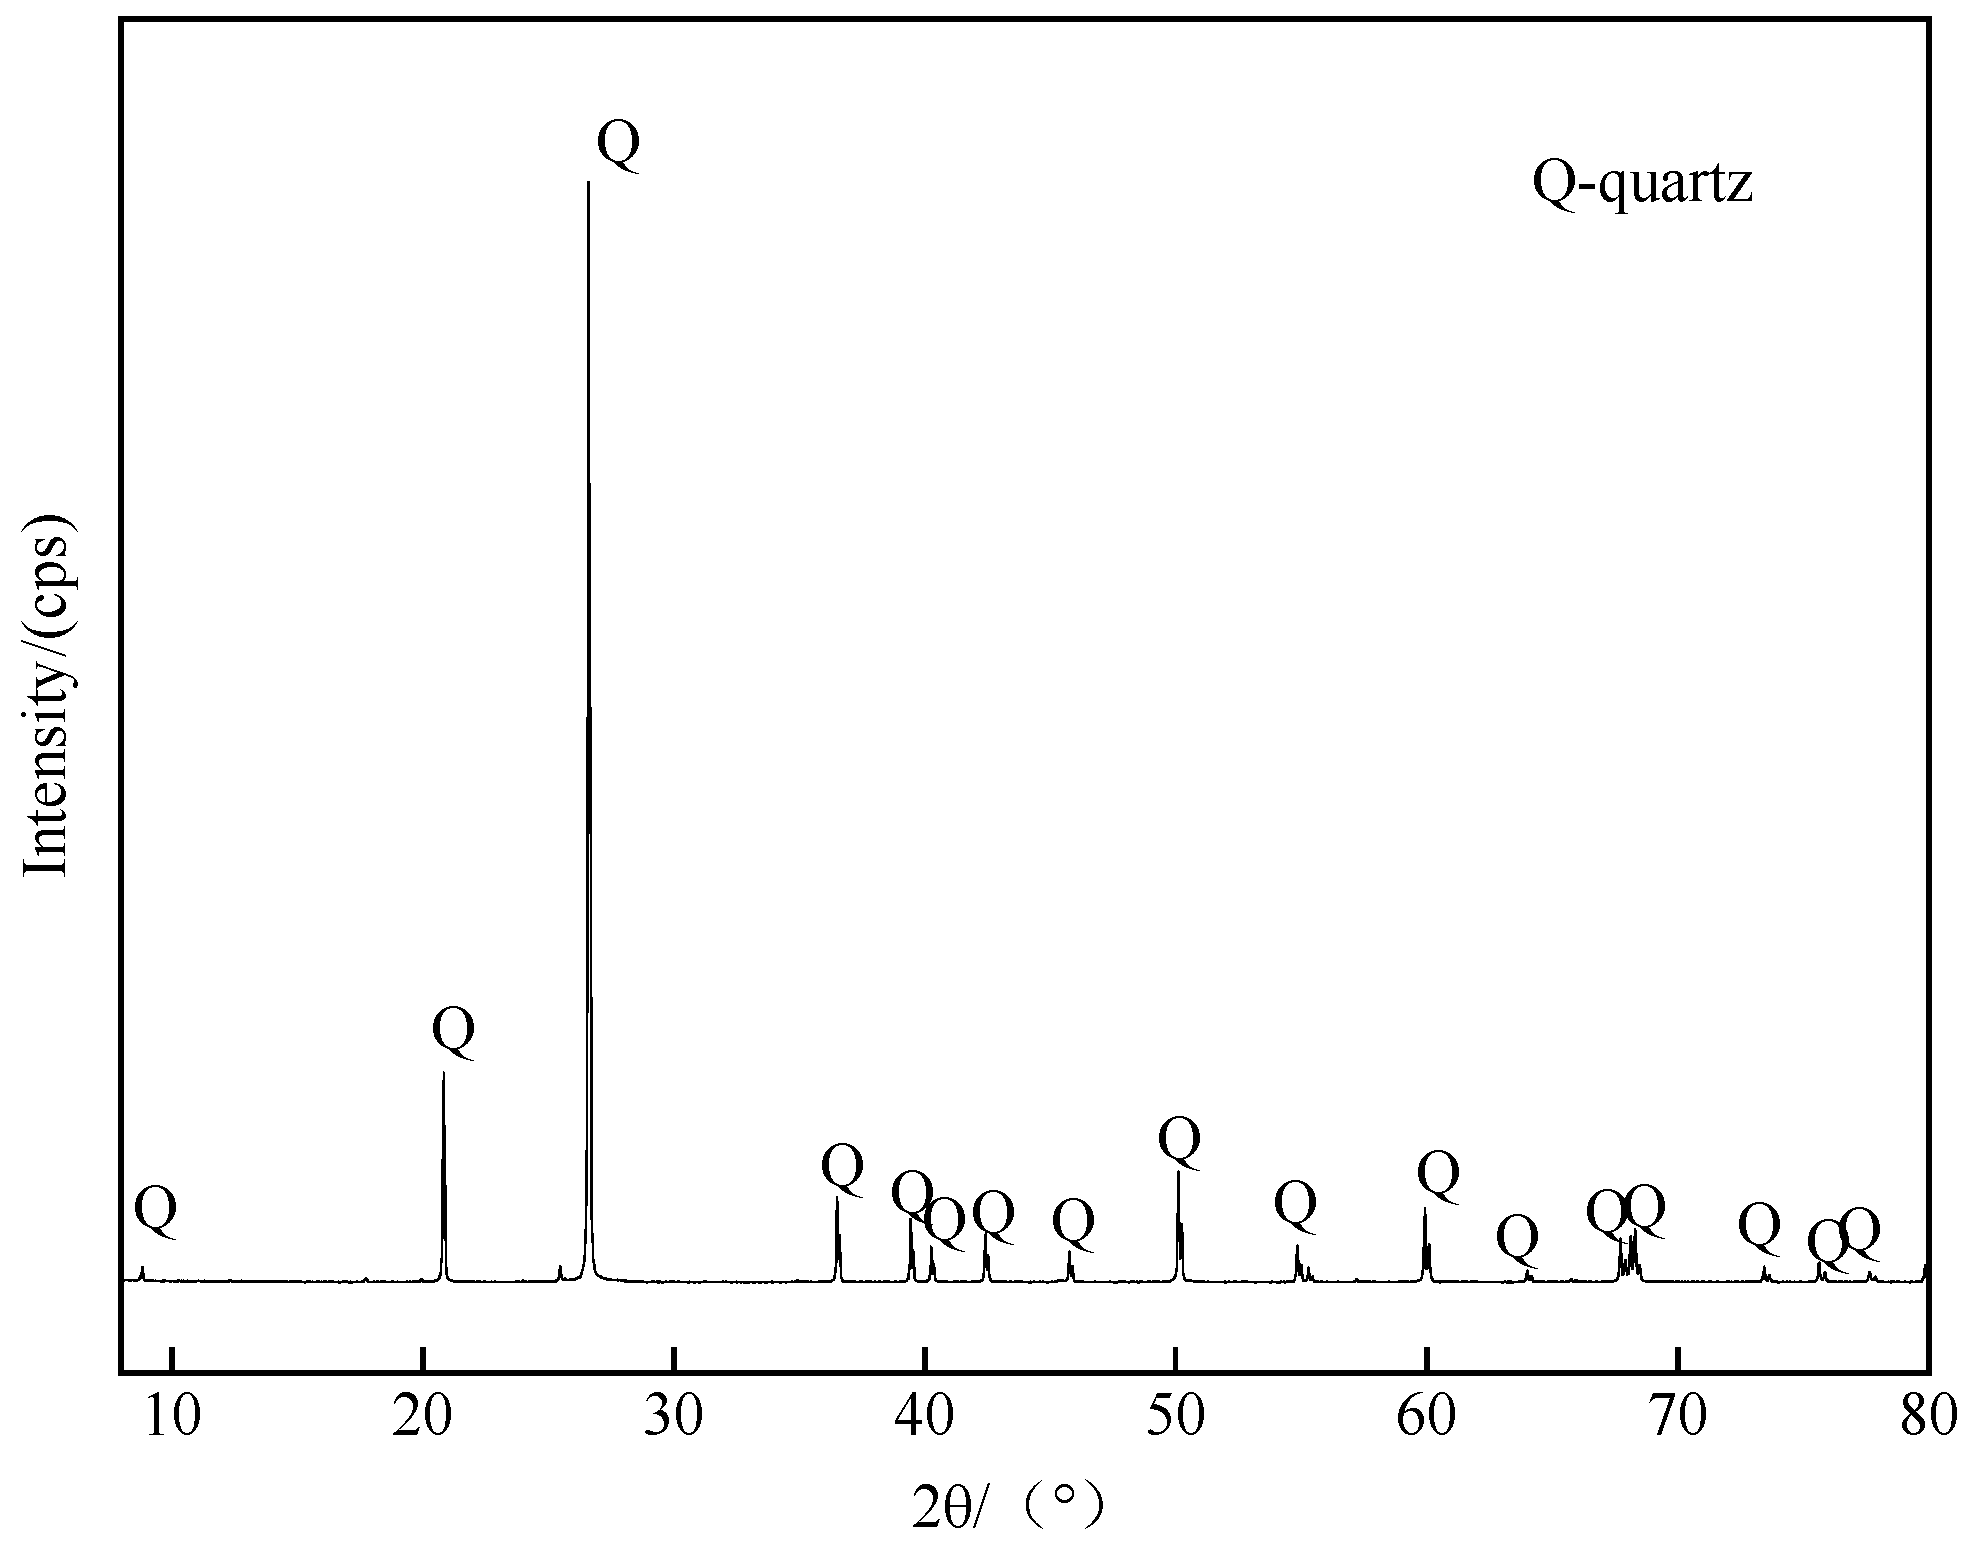
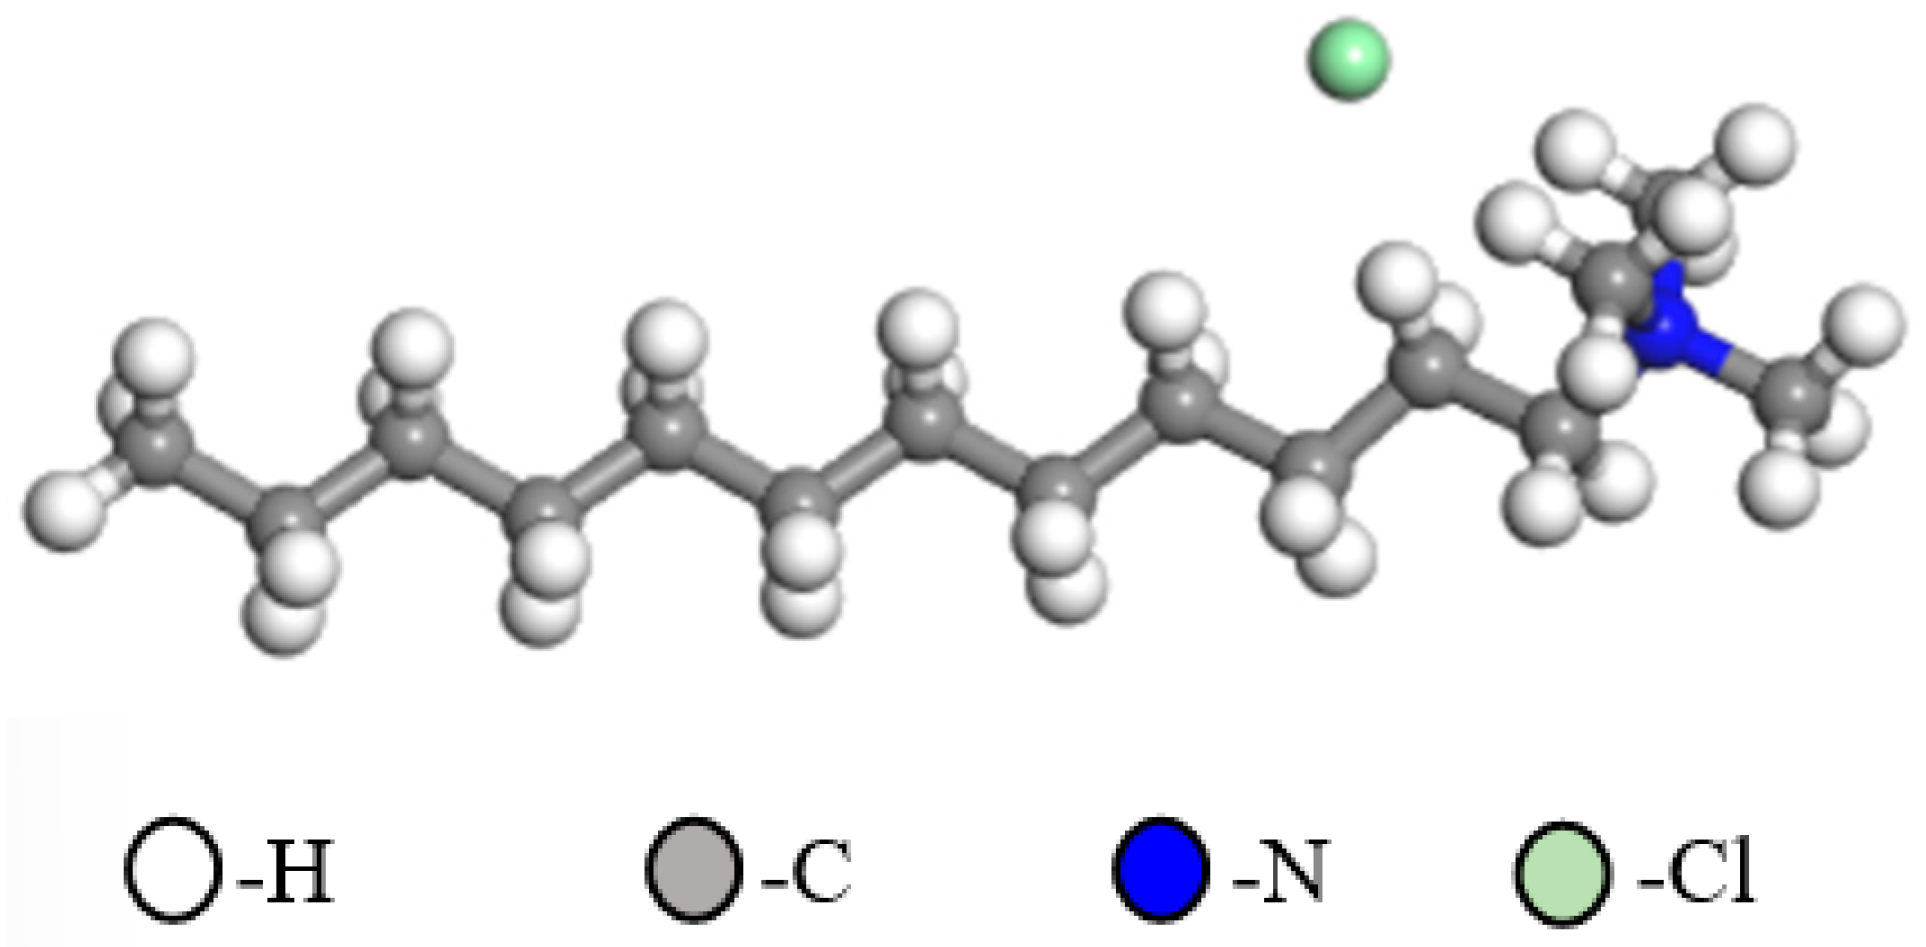
2.1. Mineral Samples and Reagents
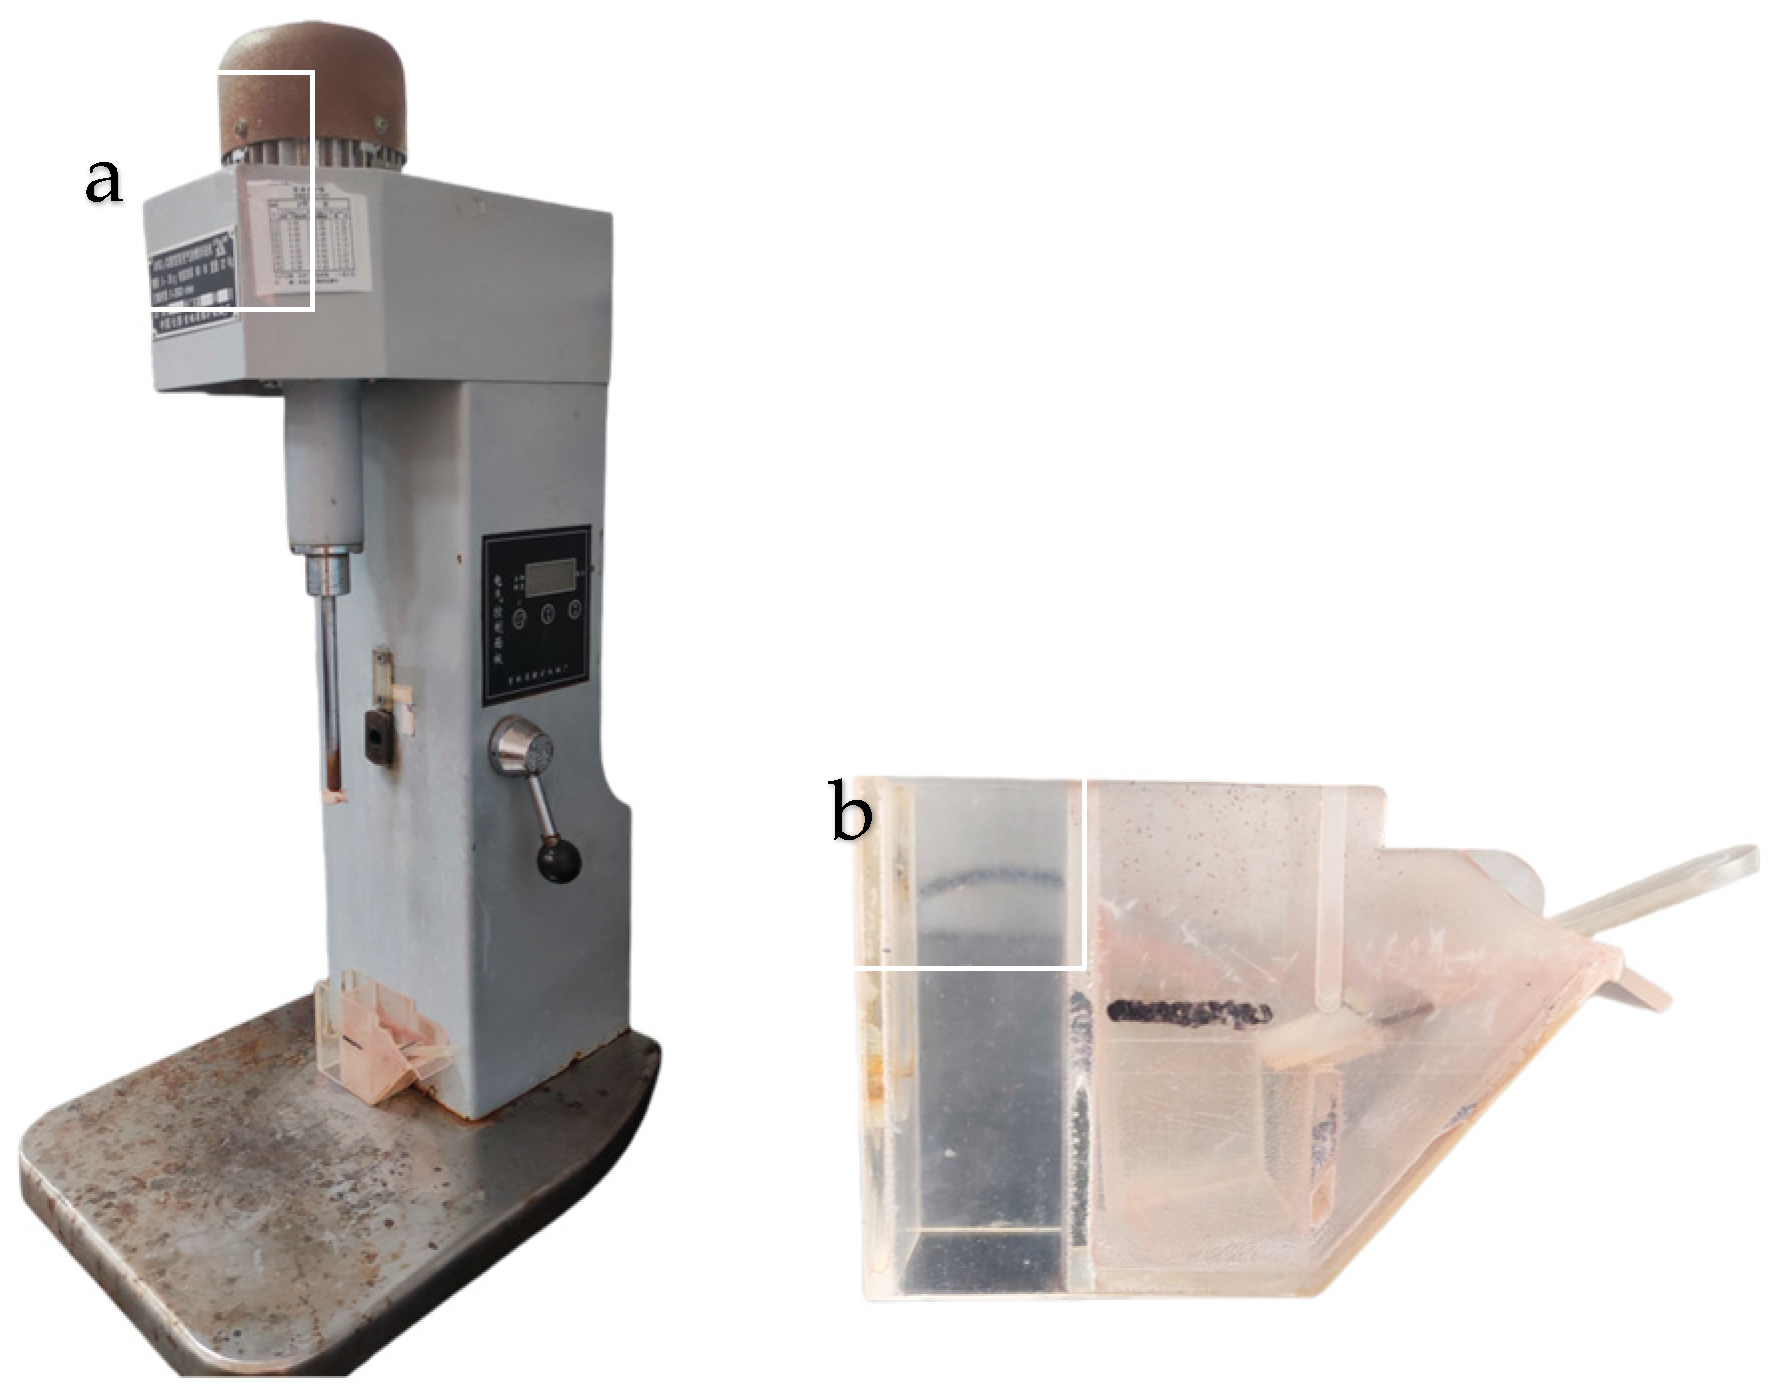
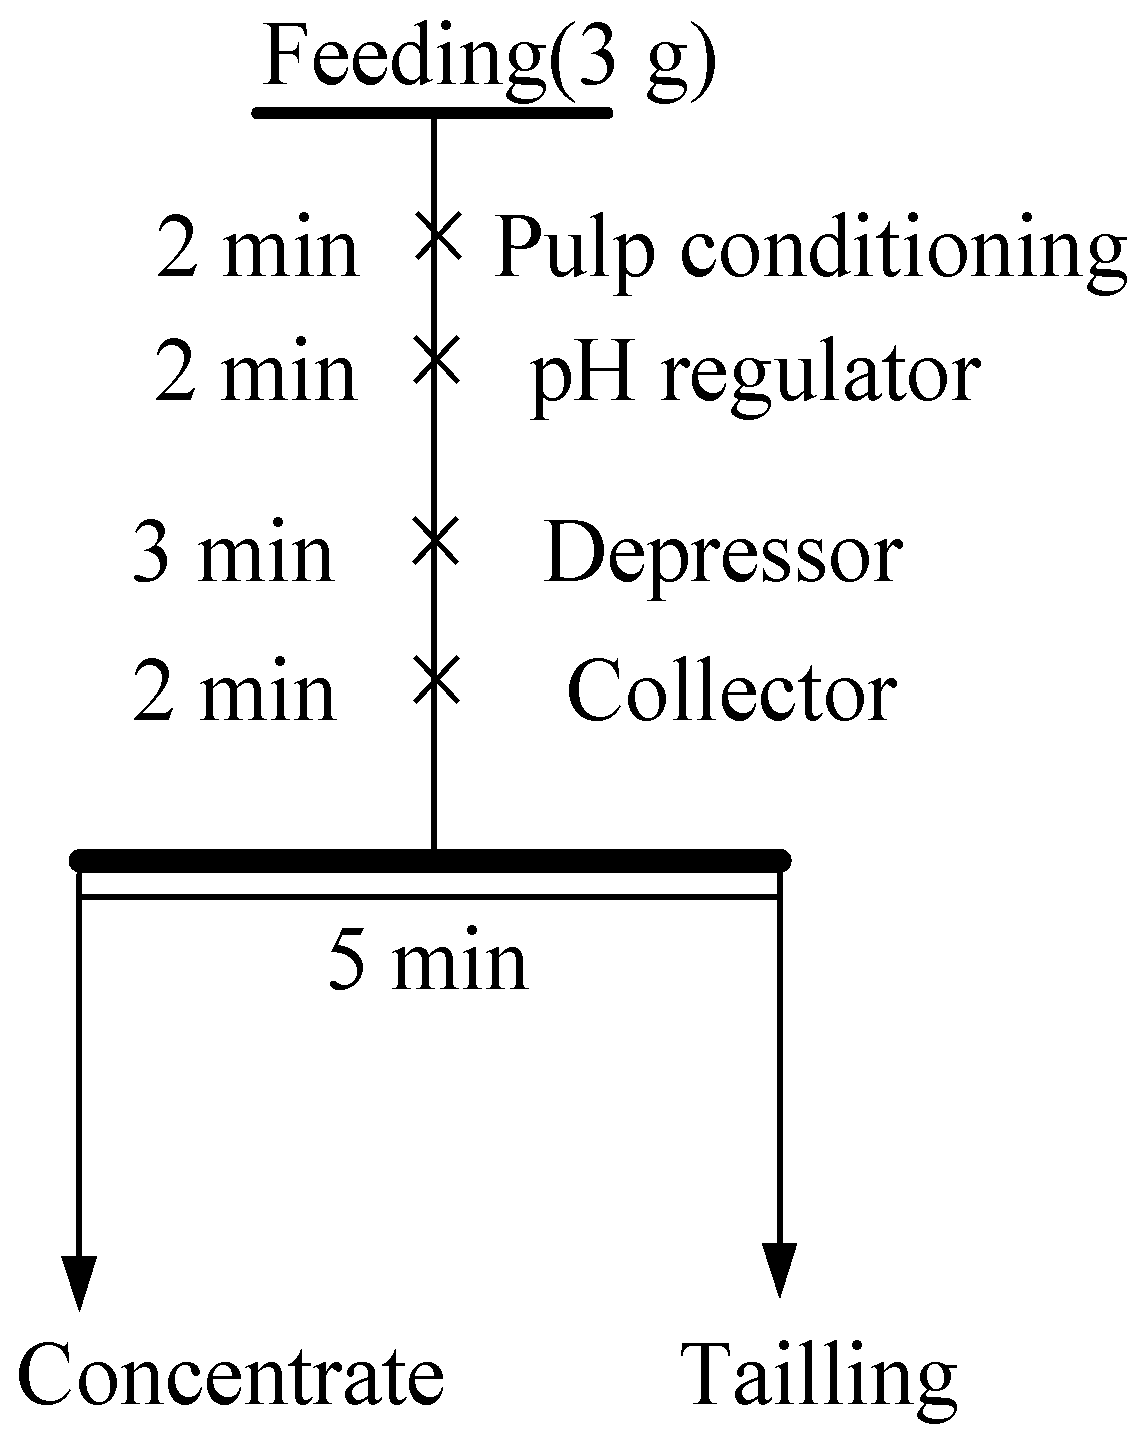
2.2. Micro-Flotation Tests
2.3. Flotation Experiments of Artificially Mixed Minerals
2.4. Surface Tension Test
2.5. Fourier Transform Infrared Spectroscopy Measurements
2.6. X-ray Photoelectron Spectroscopy (XPS) Measurements
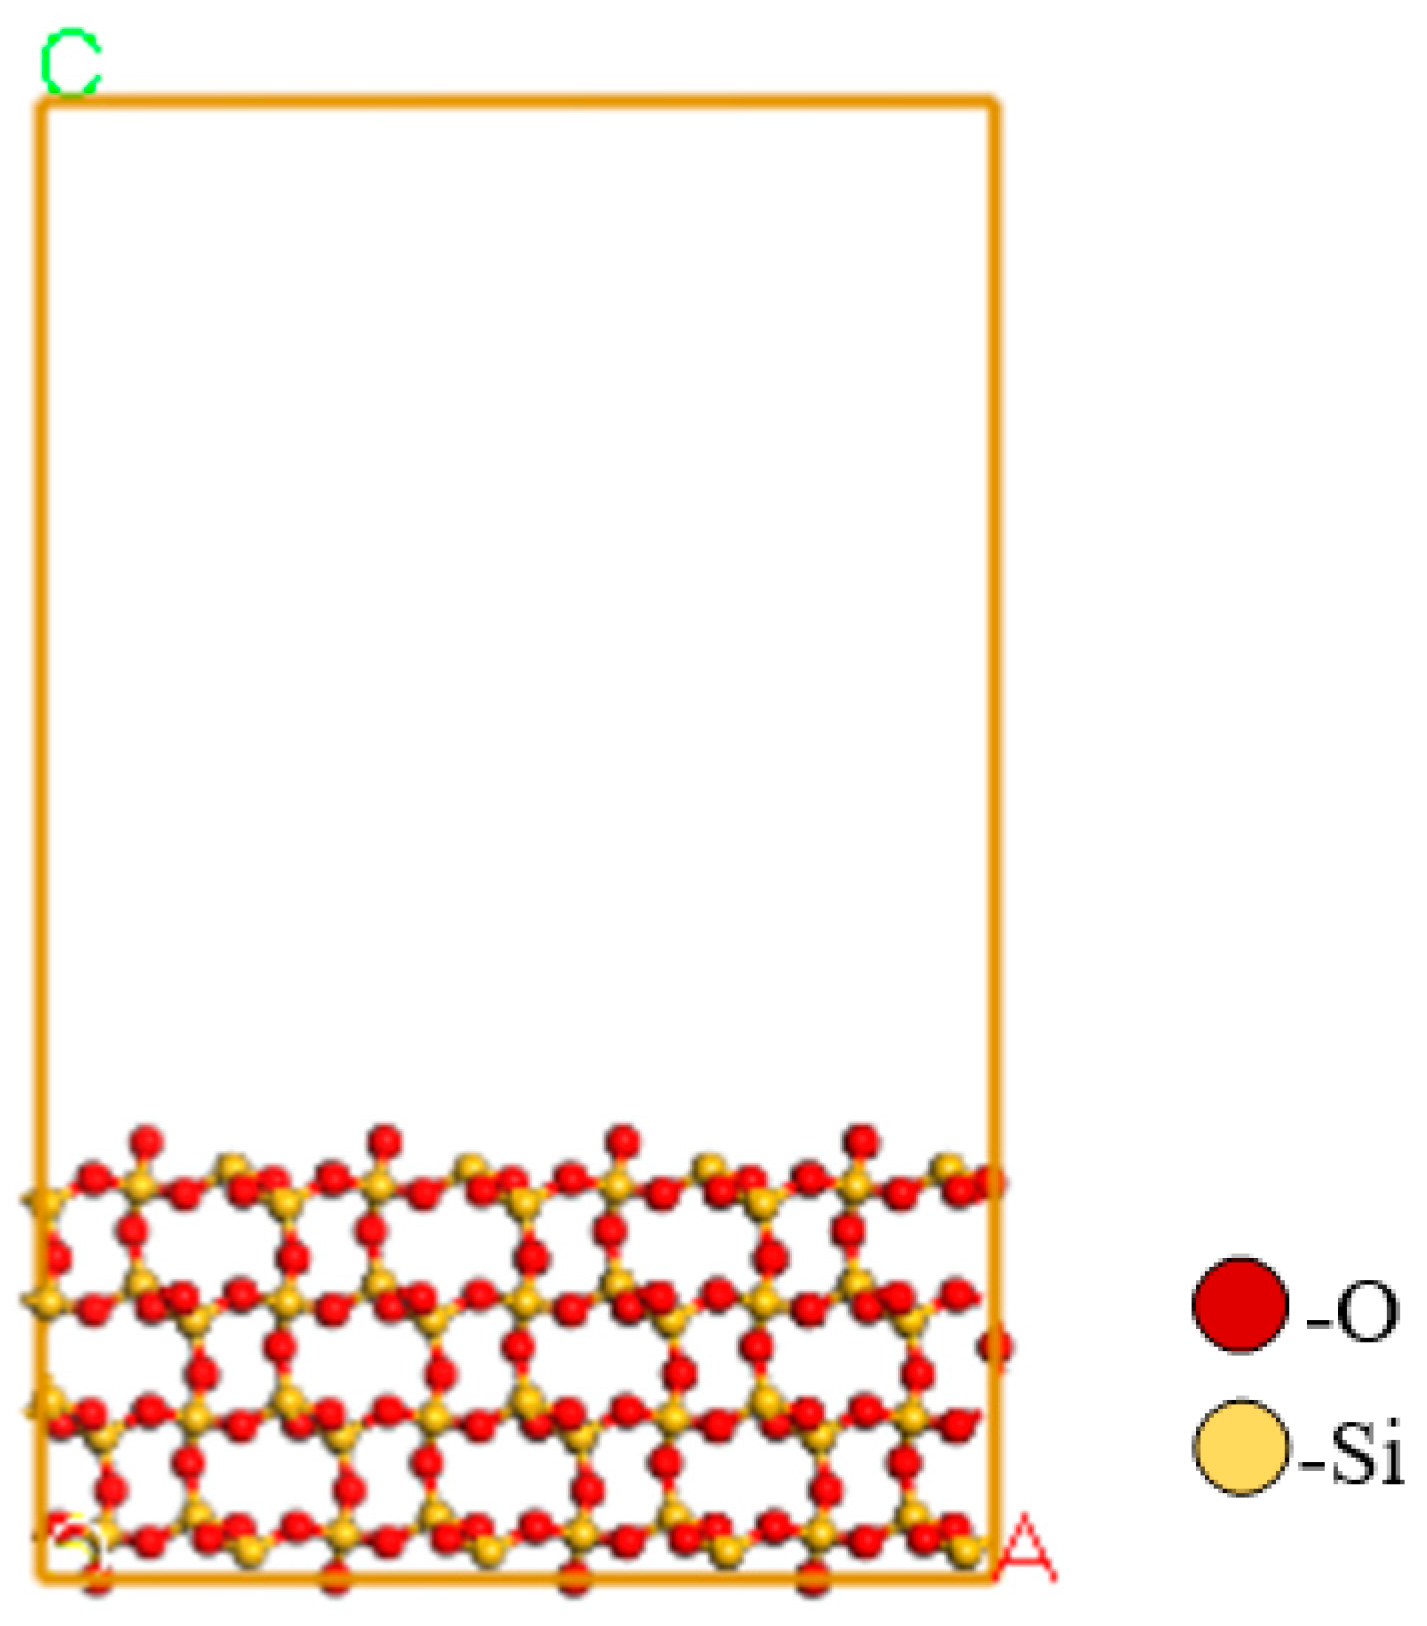
2.7. Molecular Dynamics Simulation
3. Results
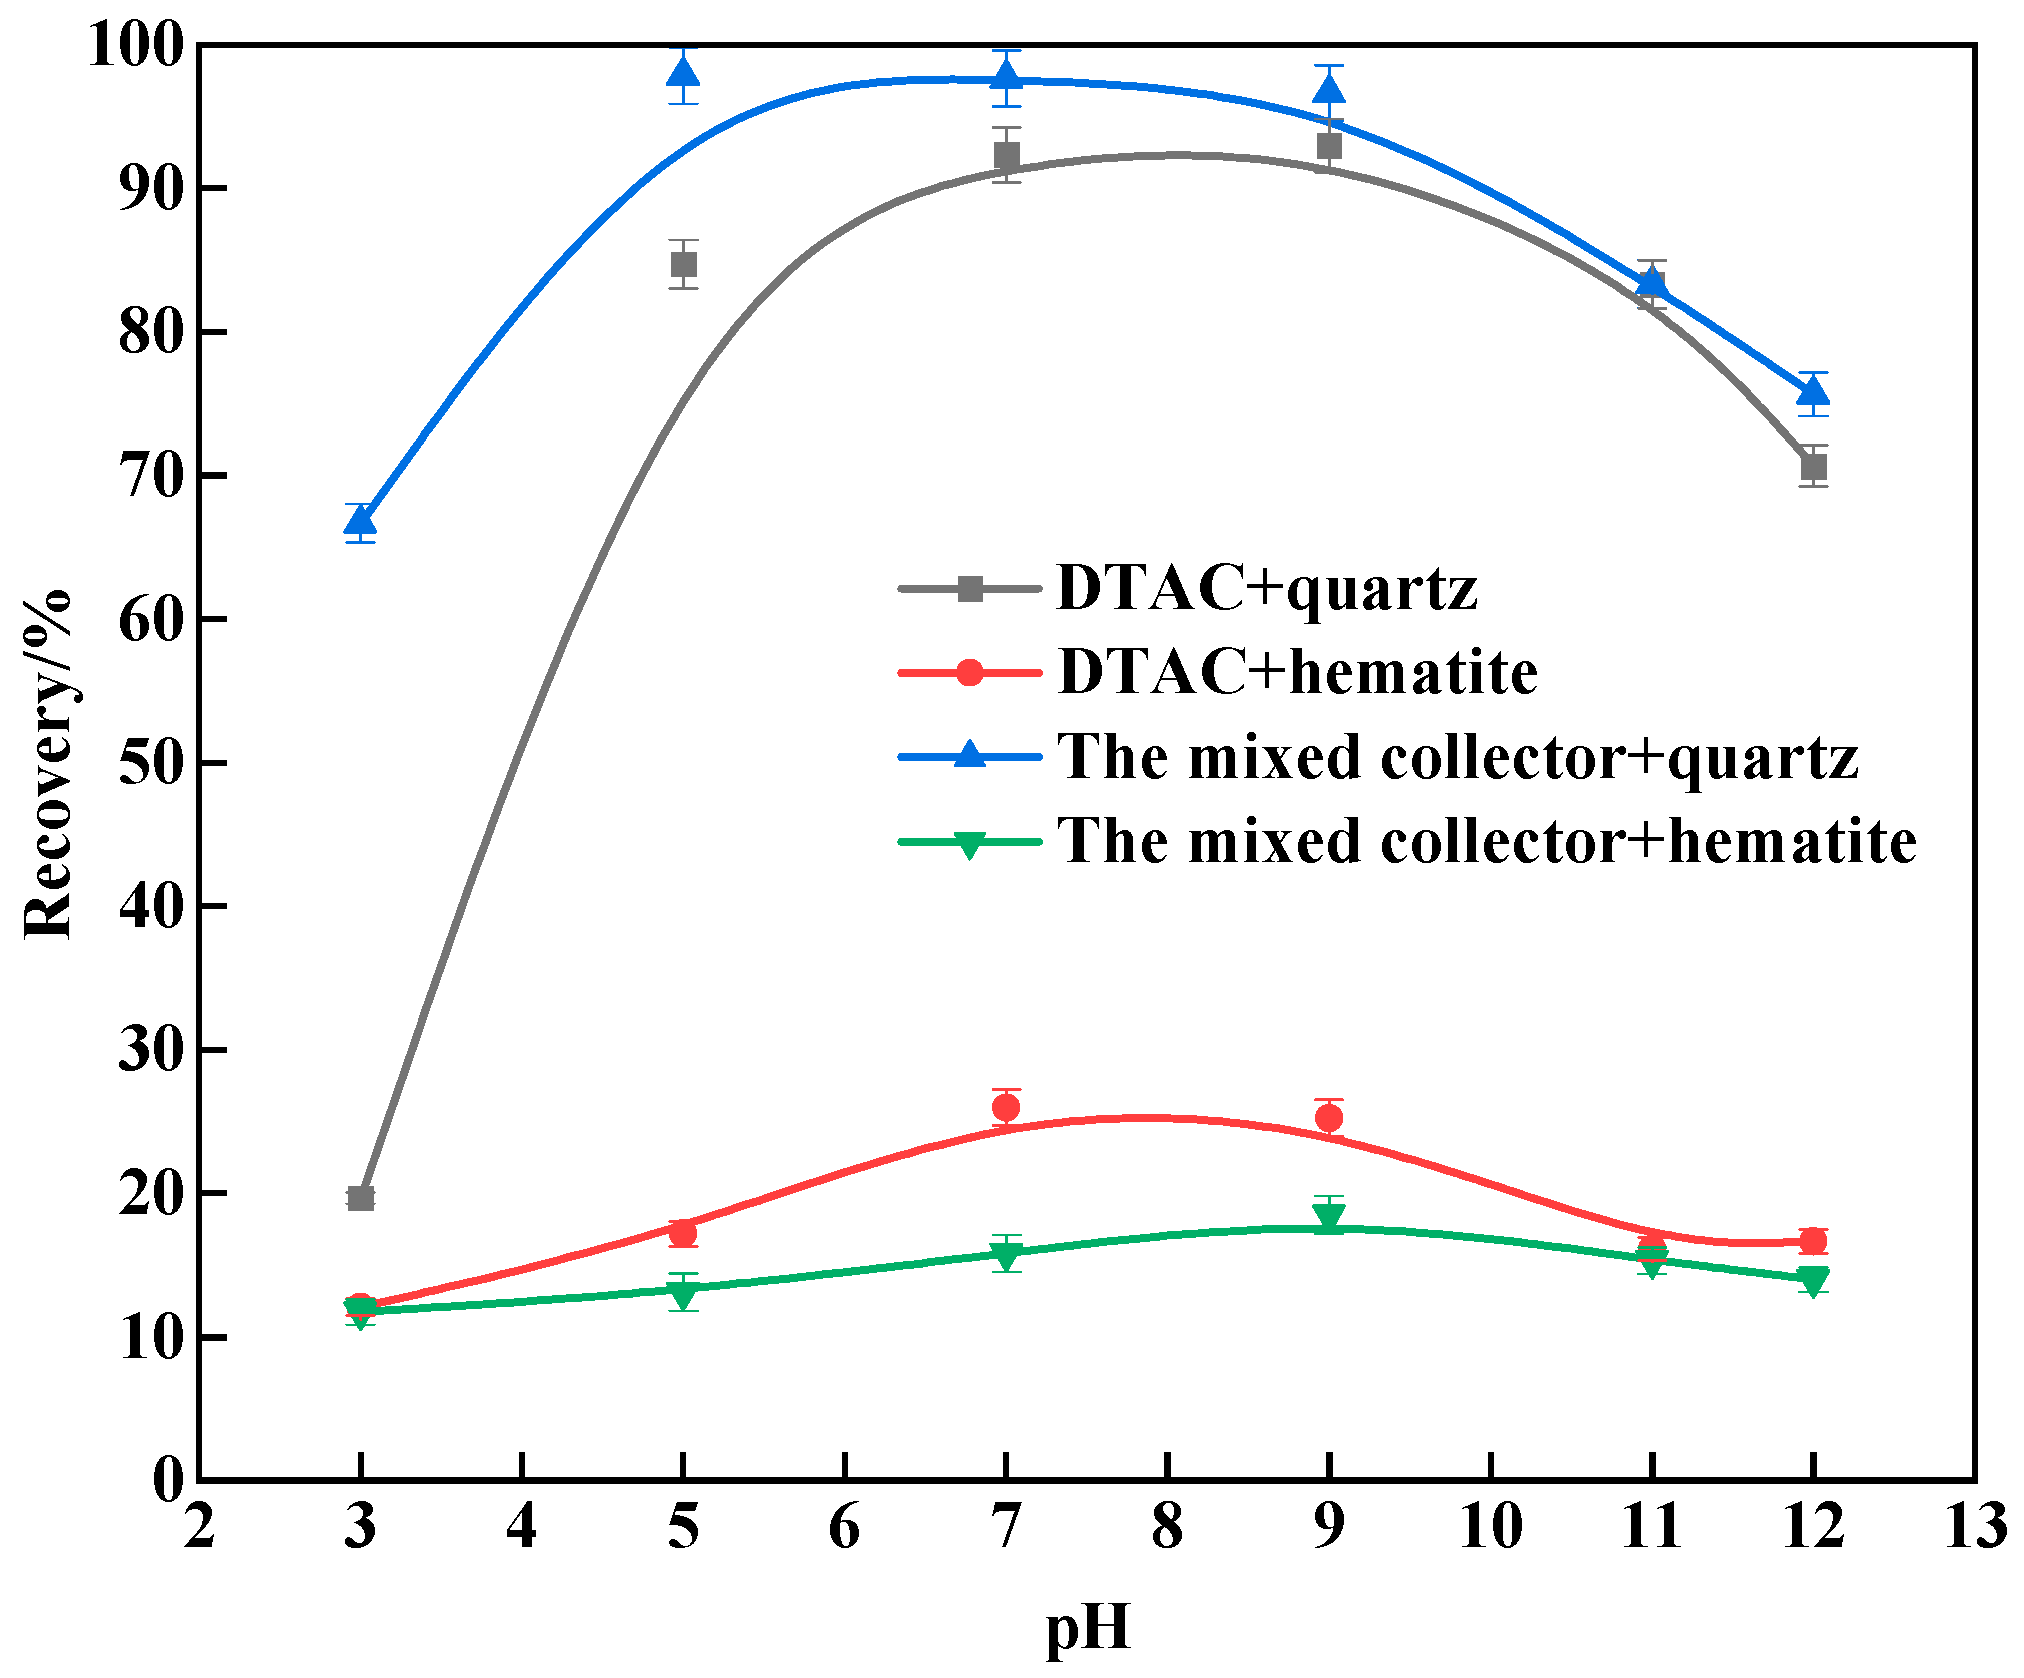
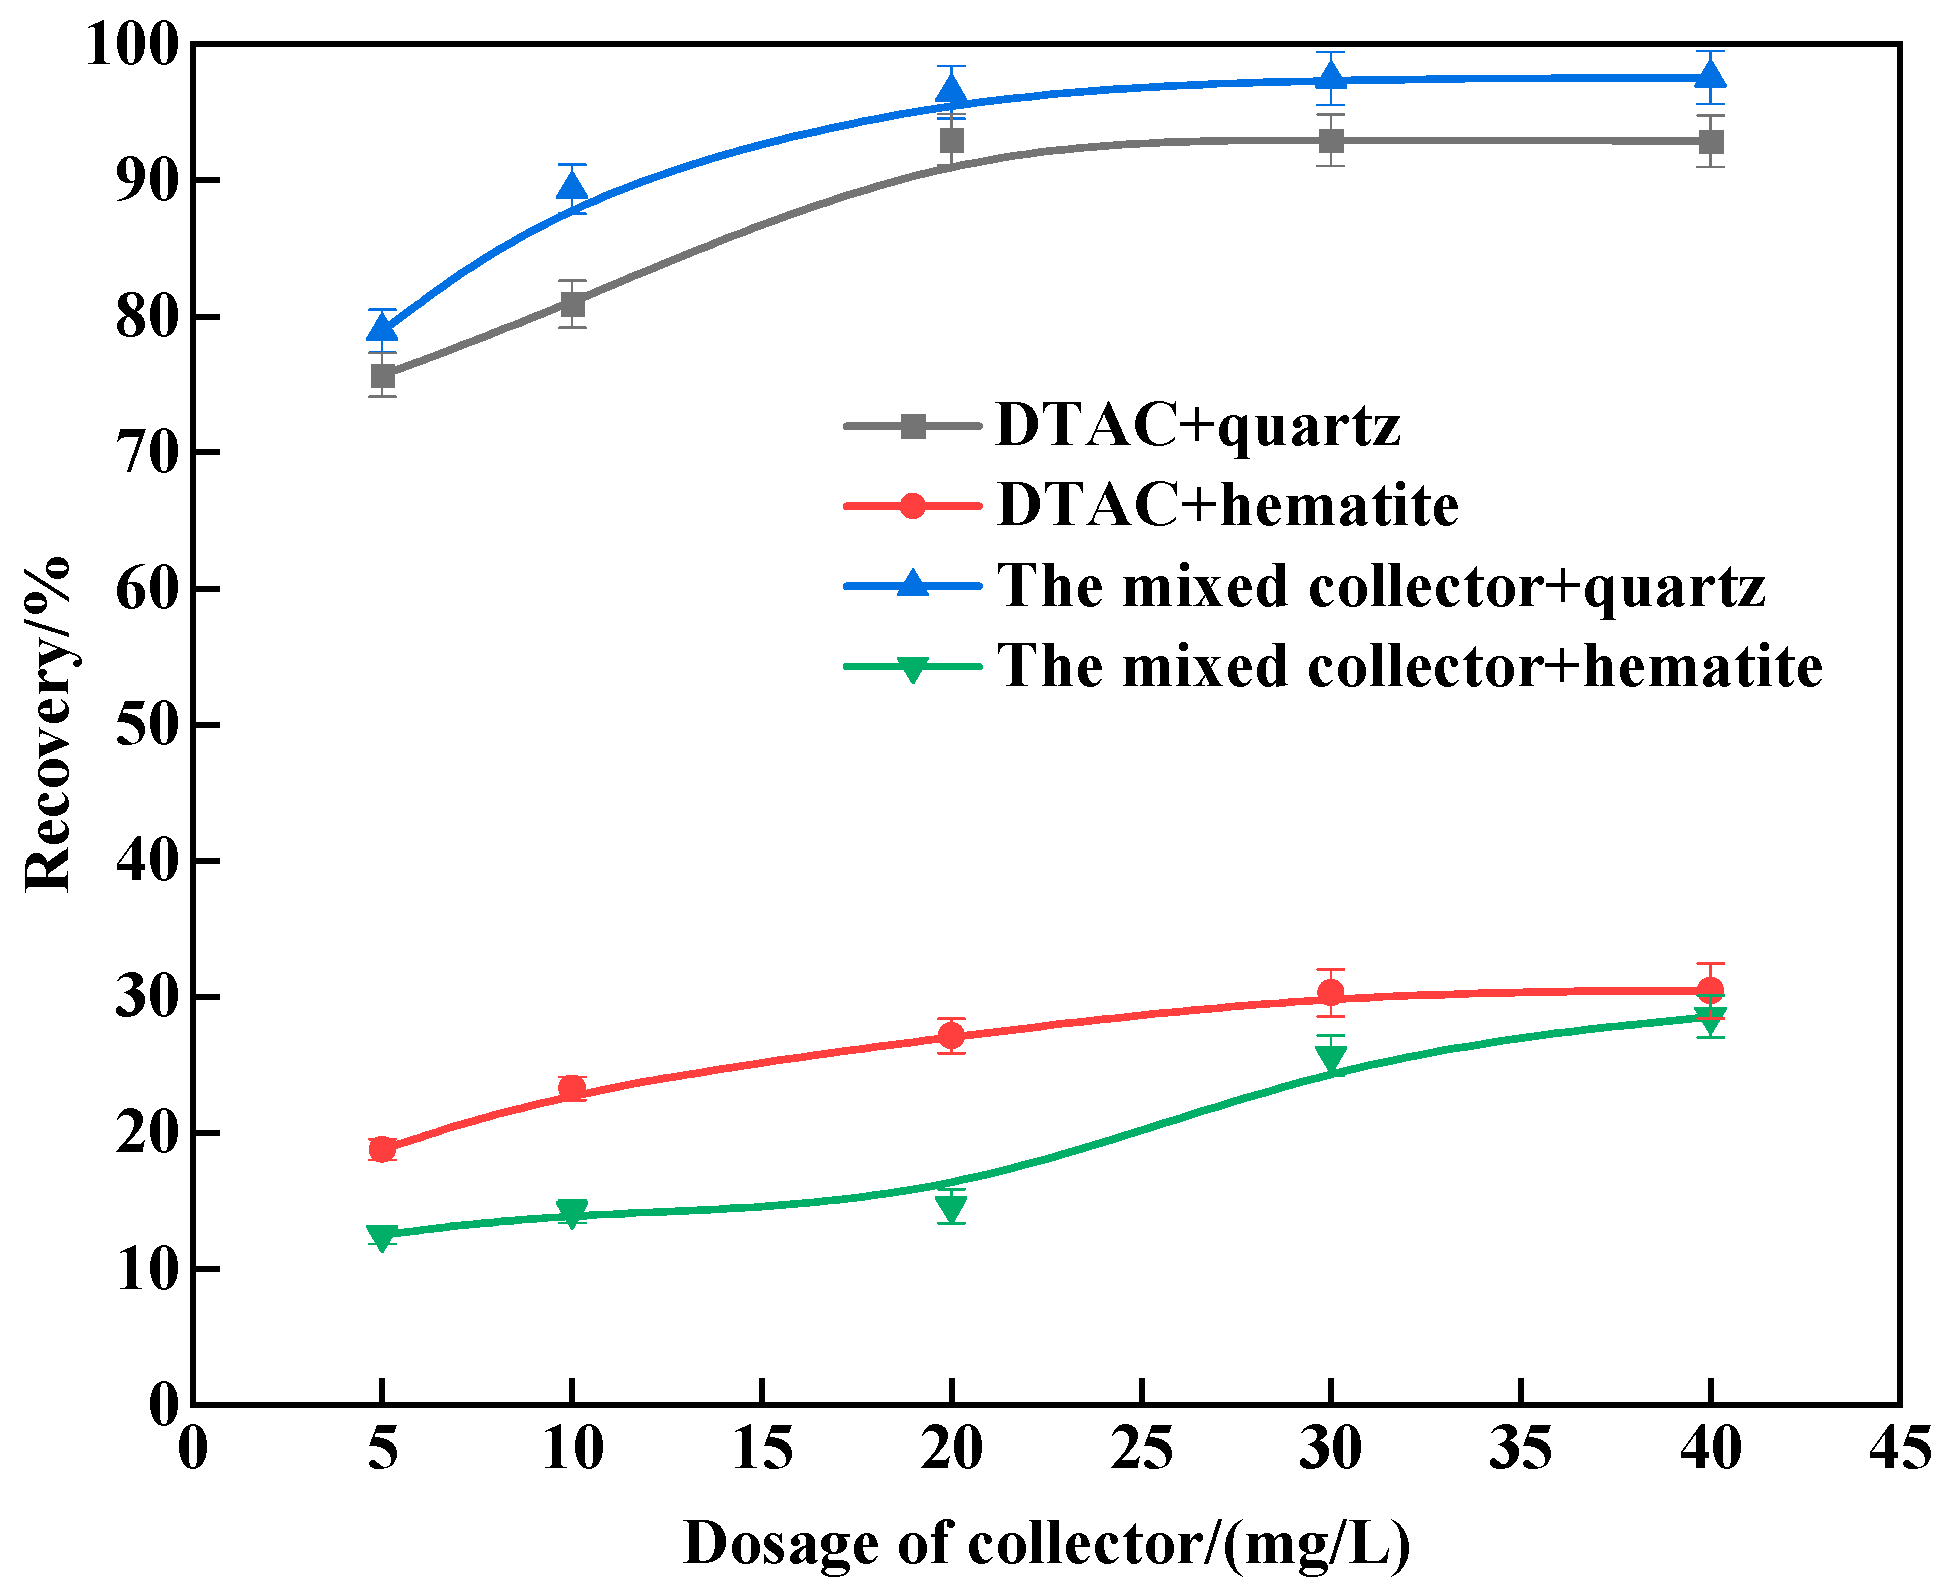
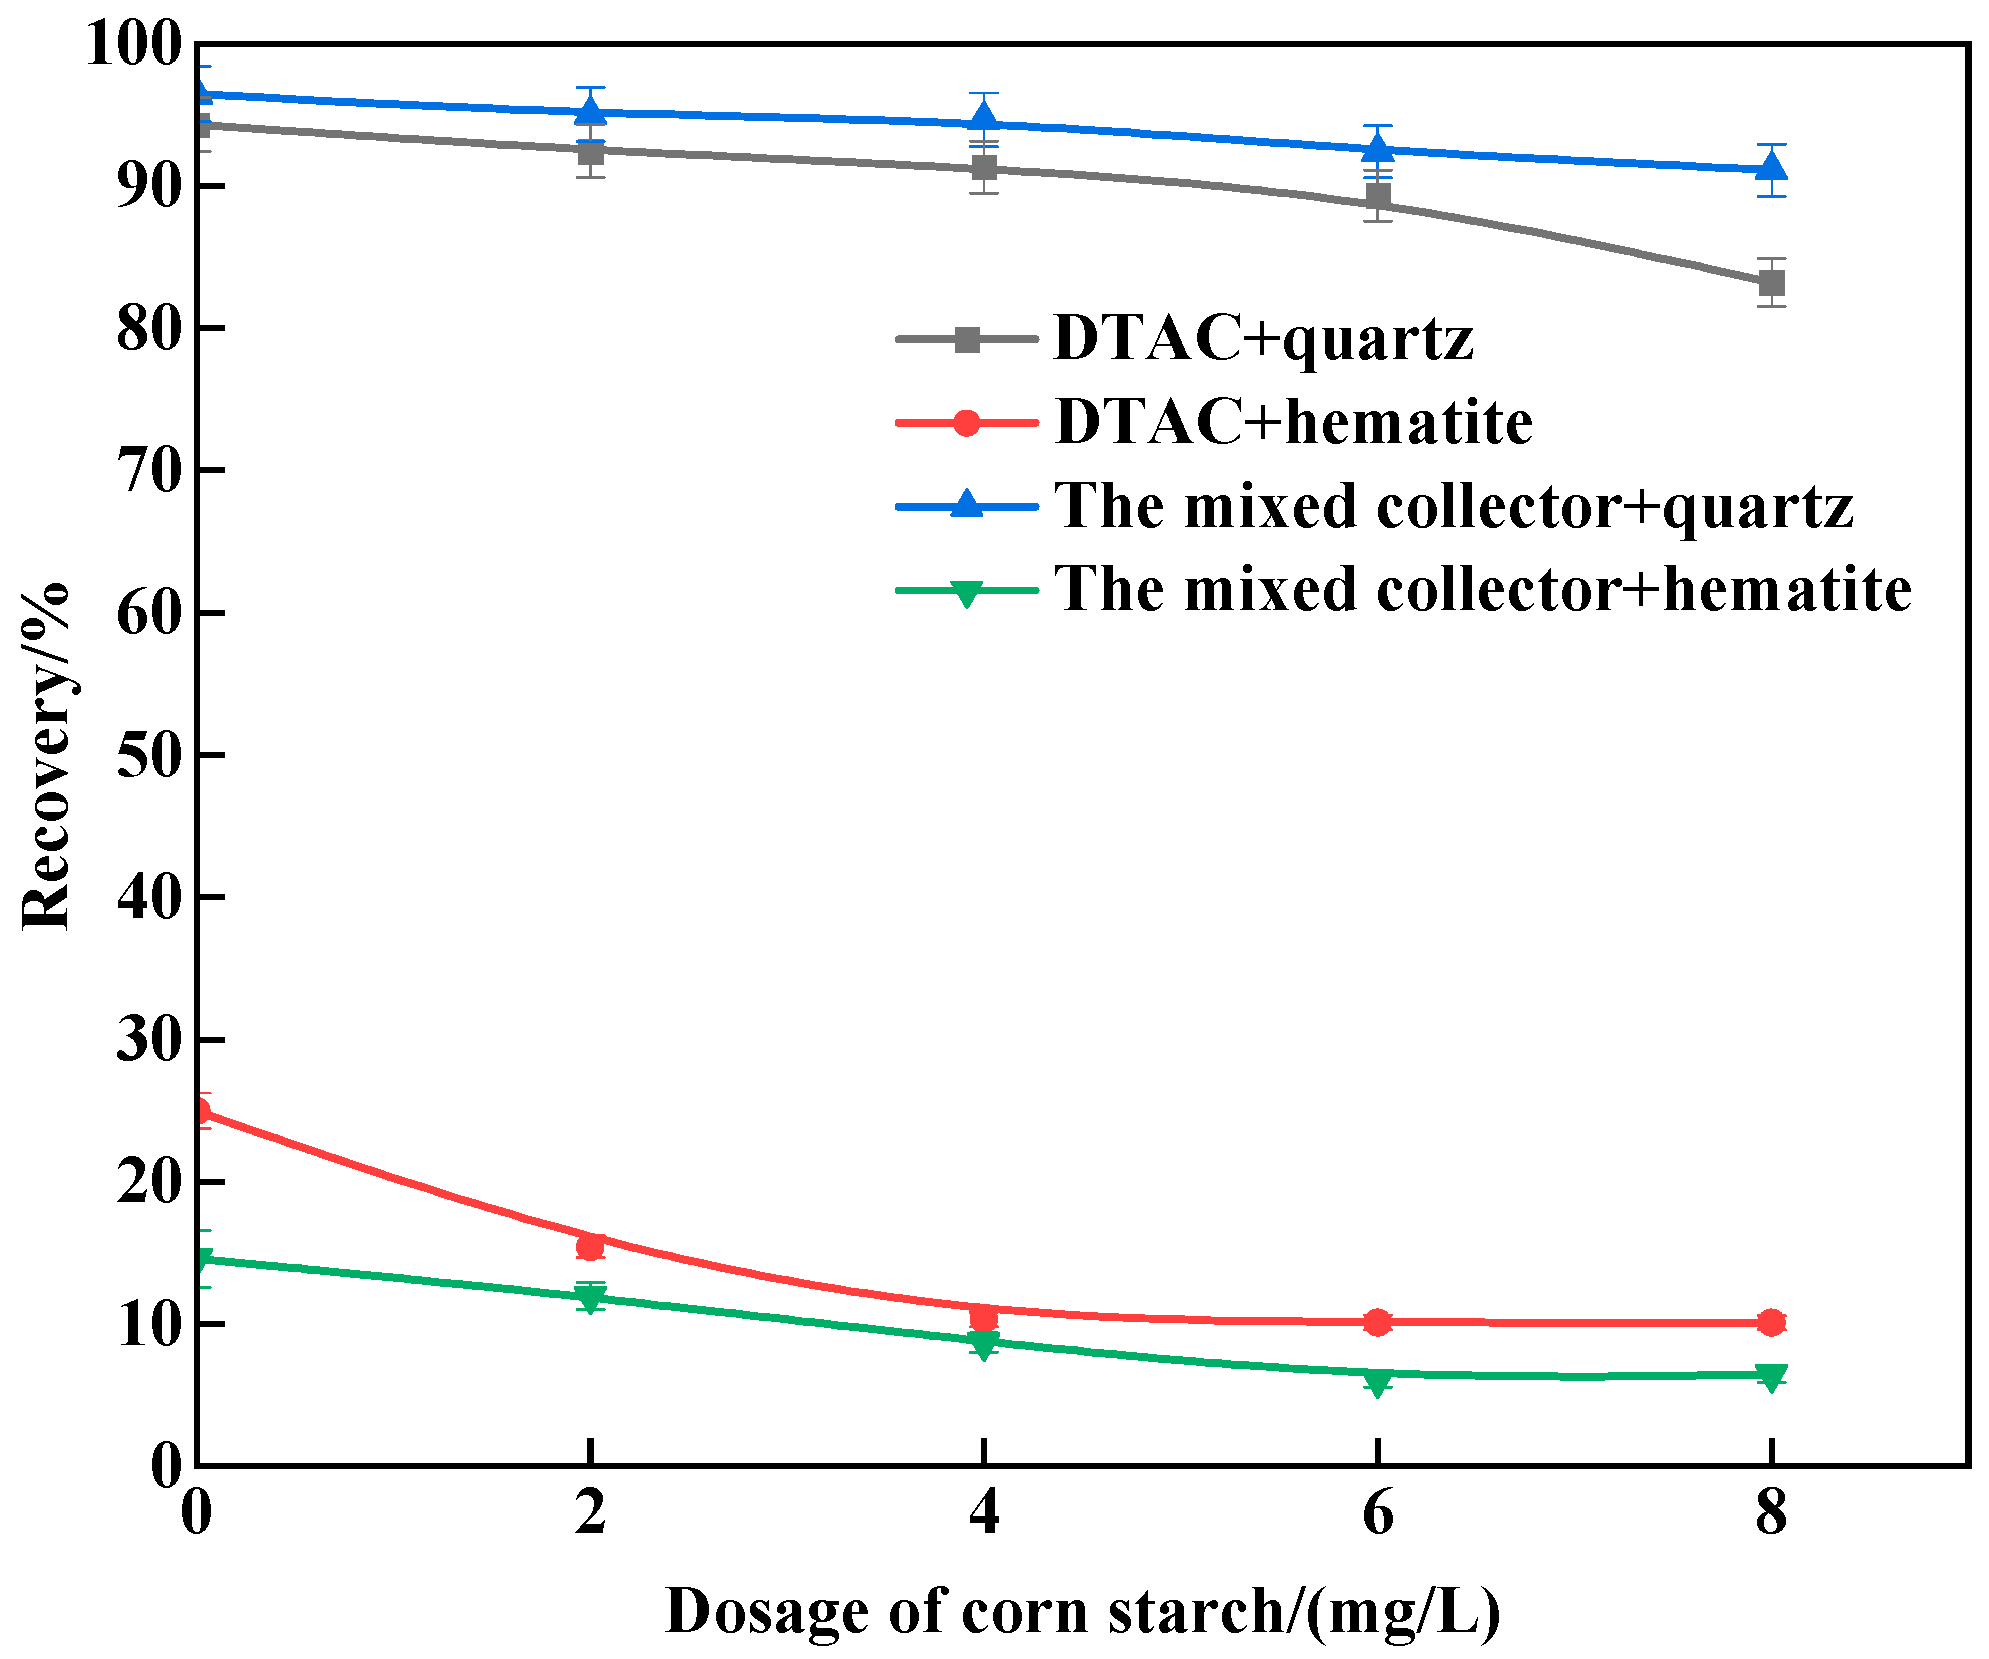
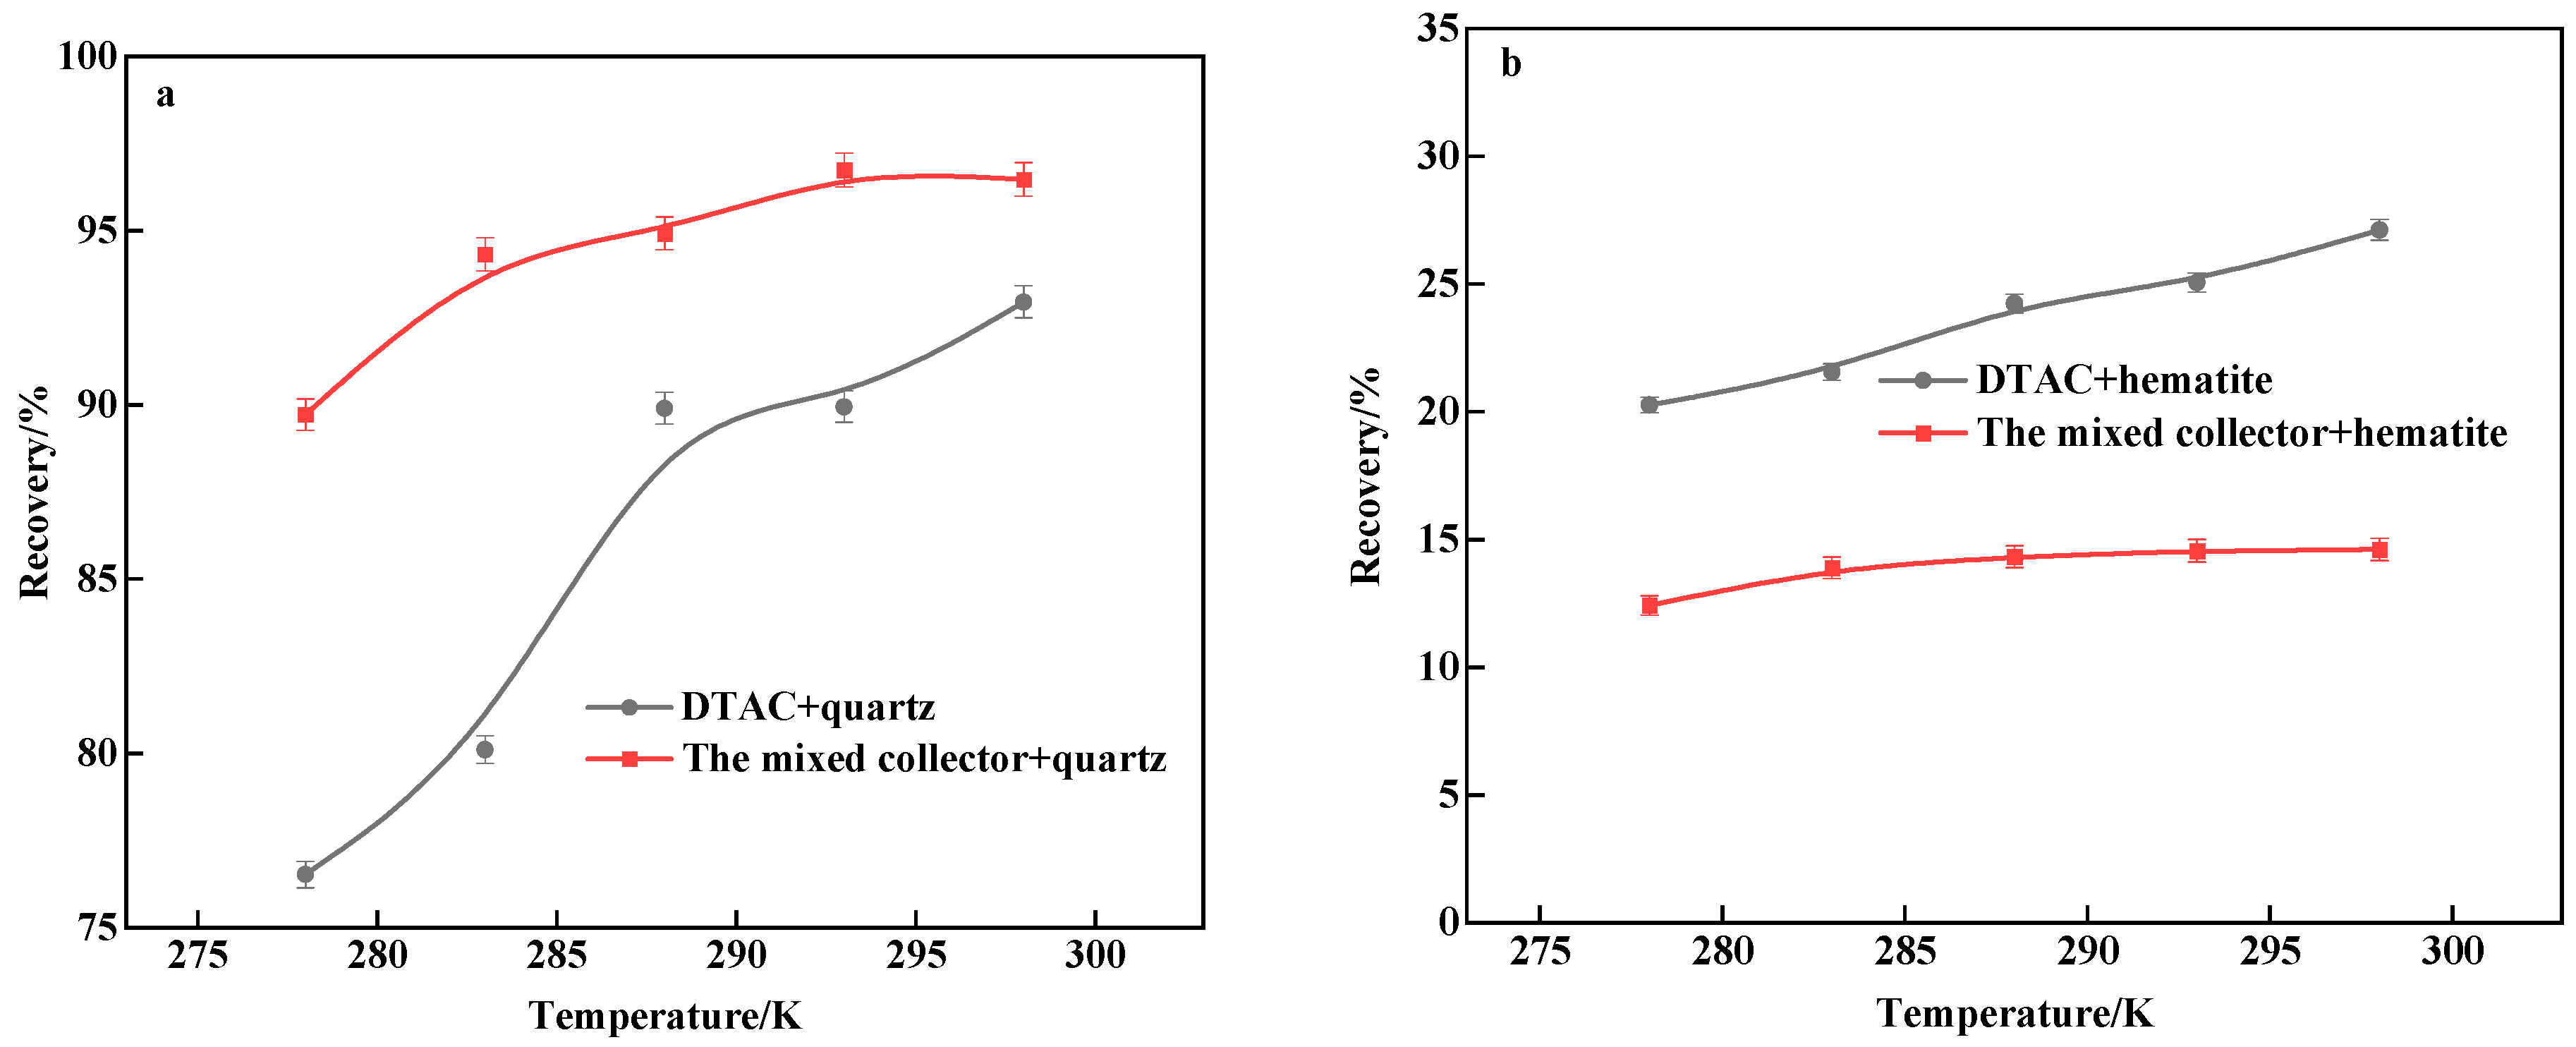
3.1. Micro-Flotation Tests
3.2. Flotation Test of Artificially Mixed Minerals
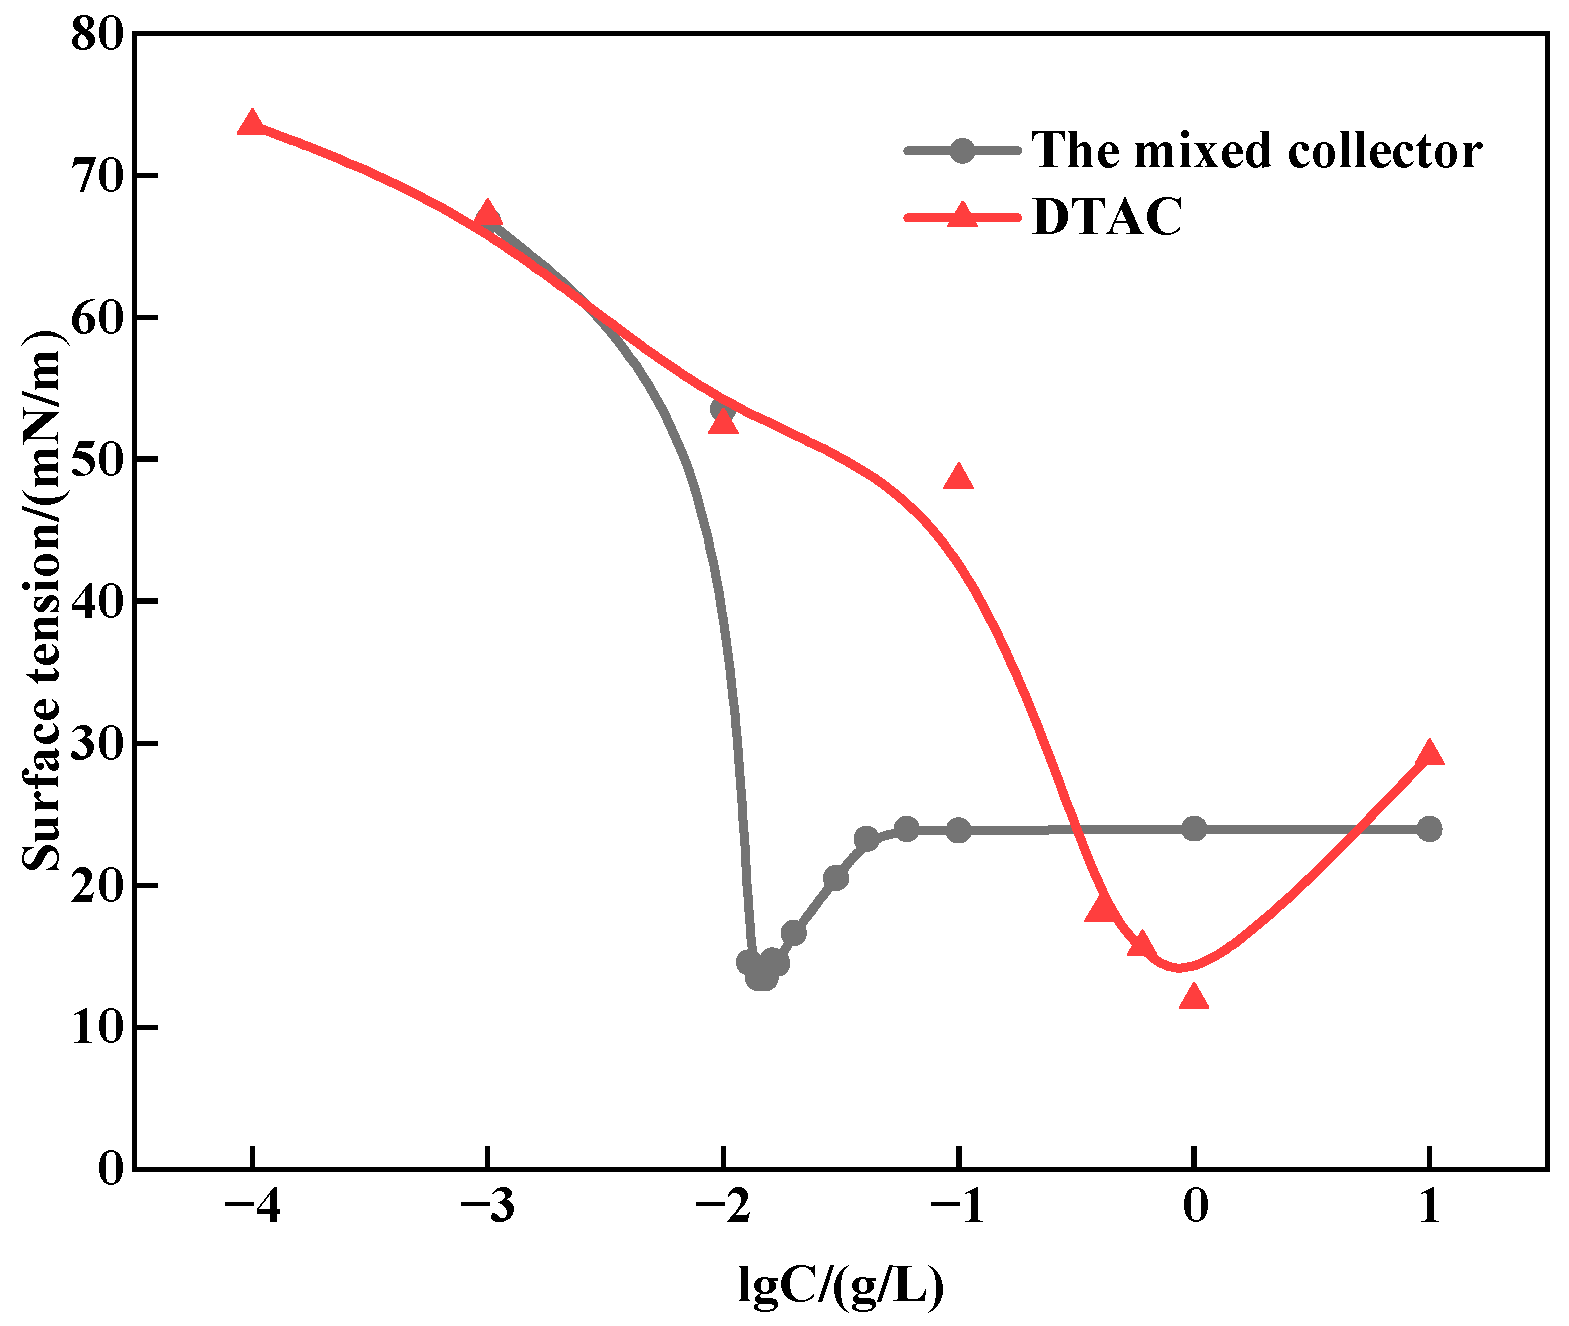
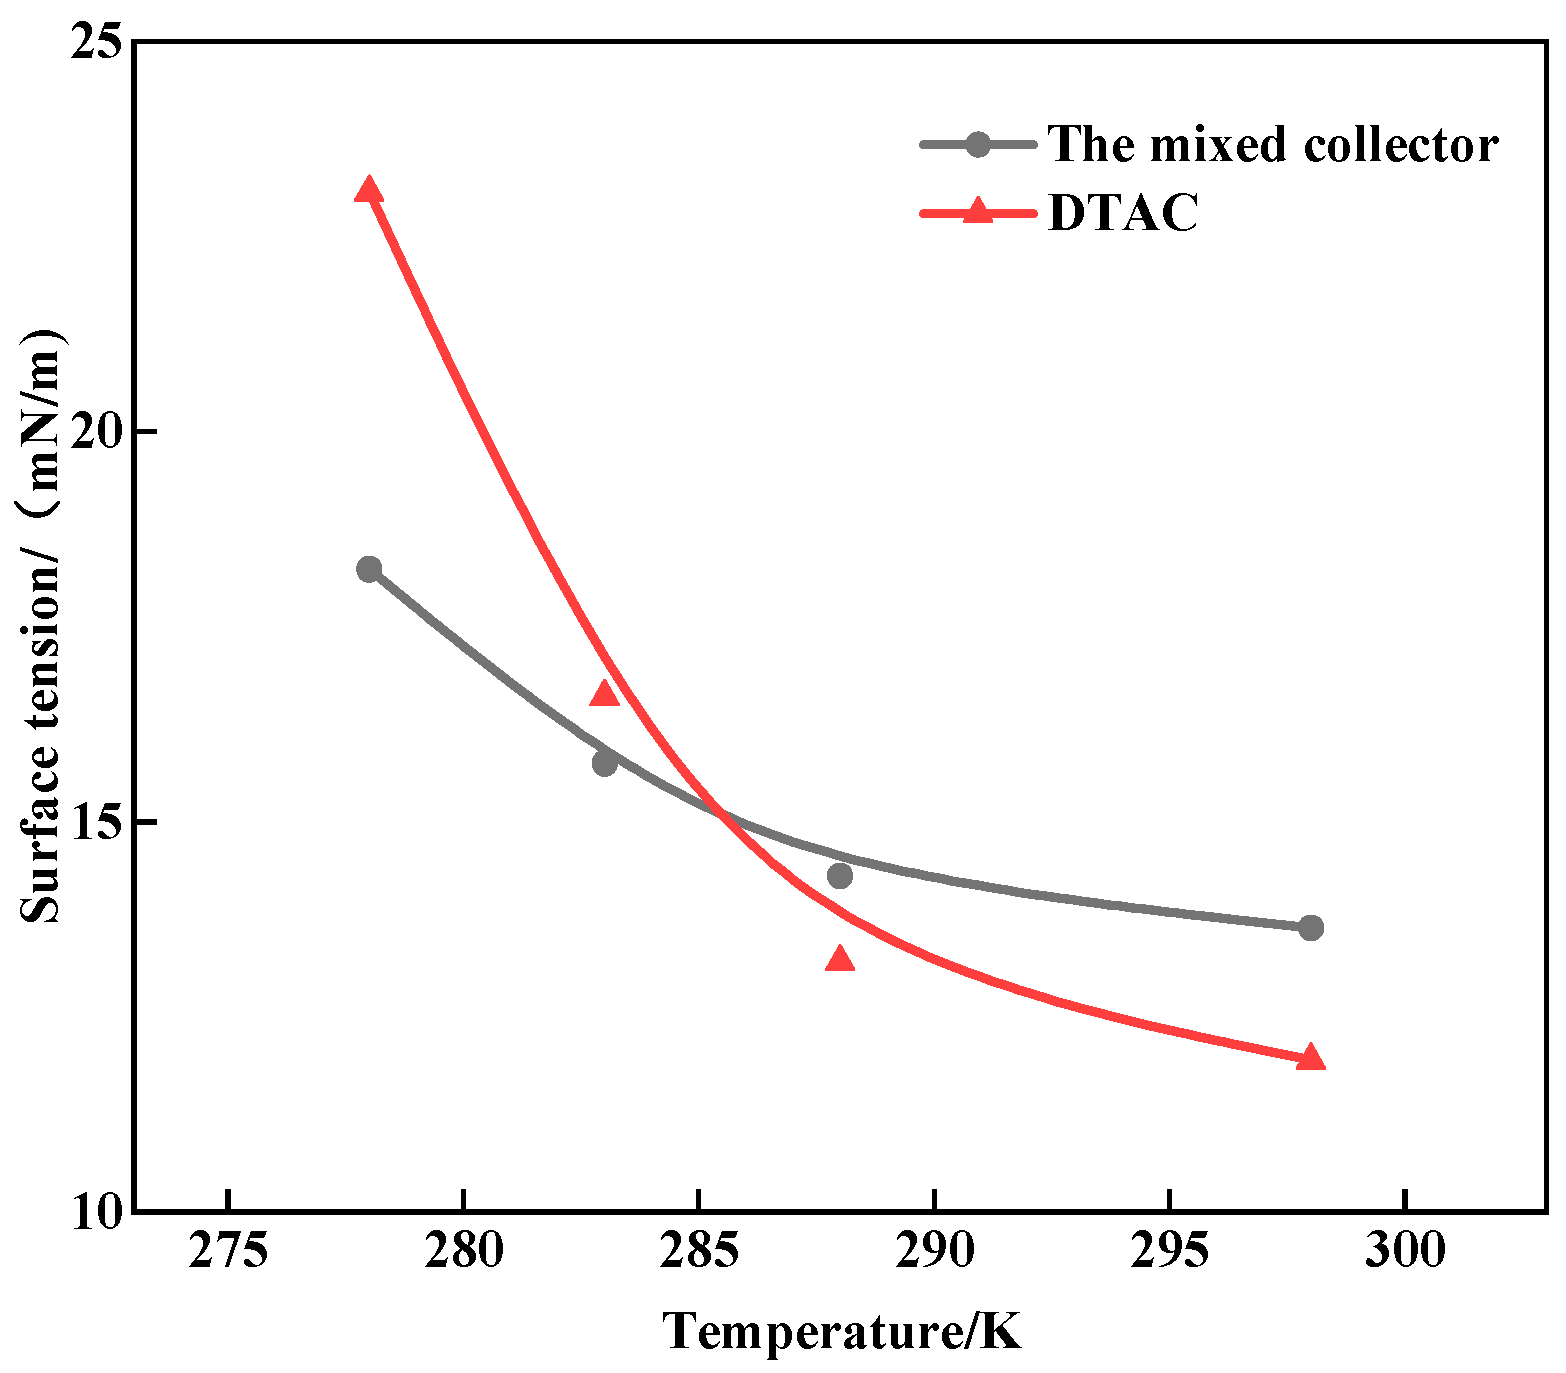
3.3. The Effect of Temperature on the Surface Tension of the Collector
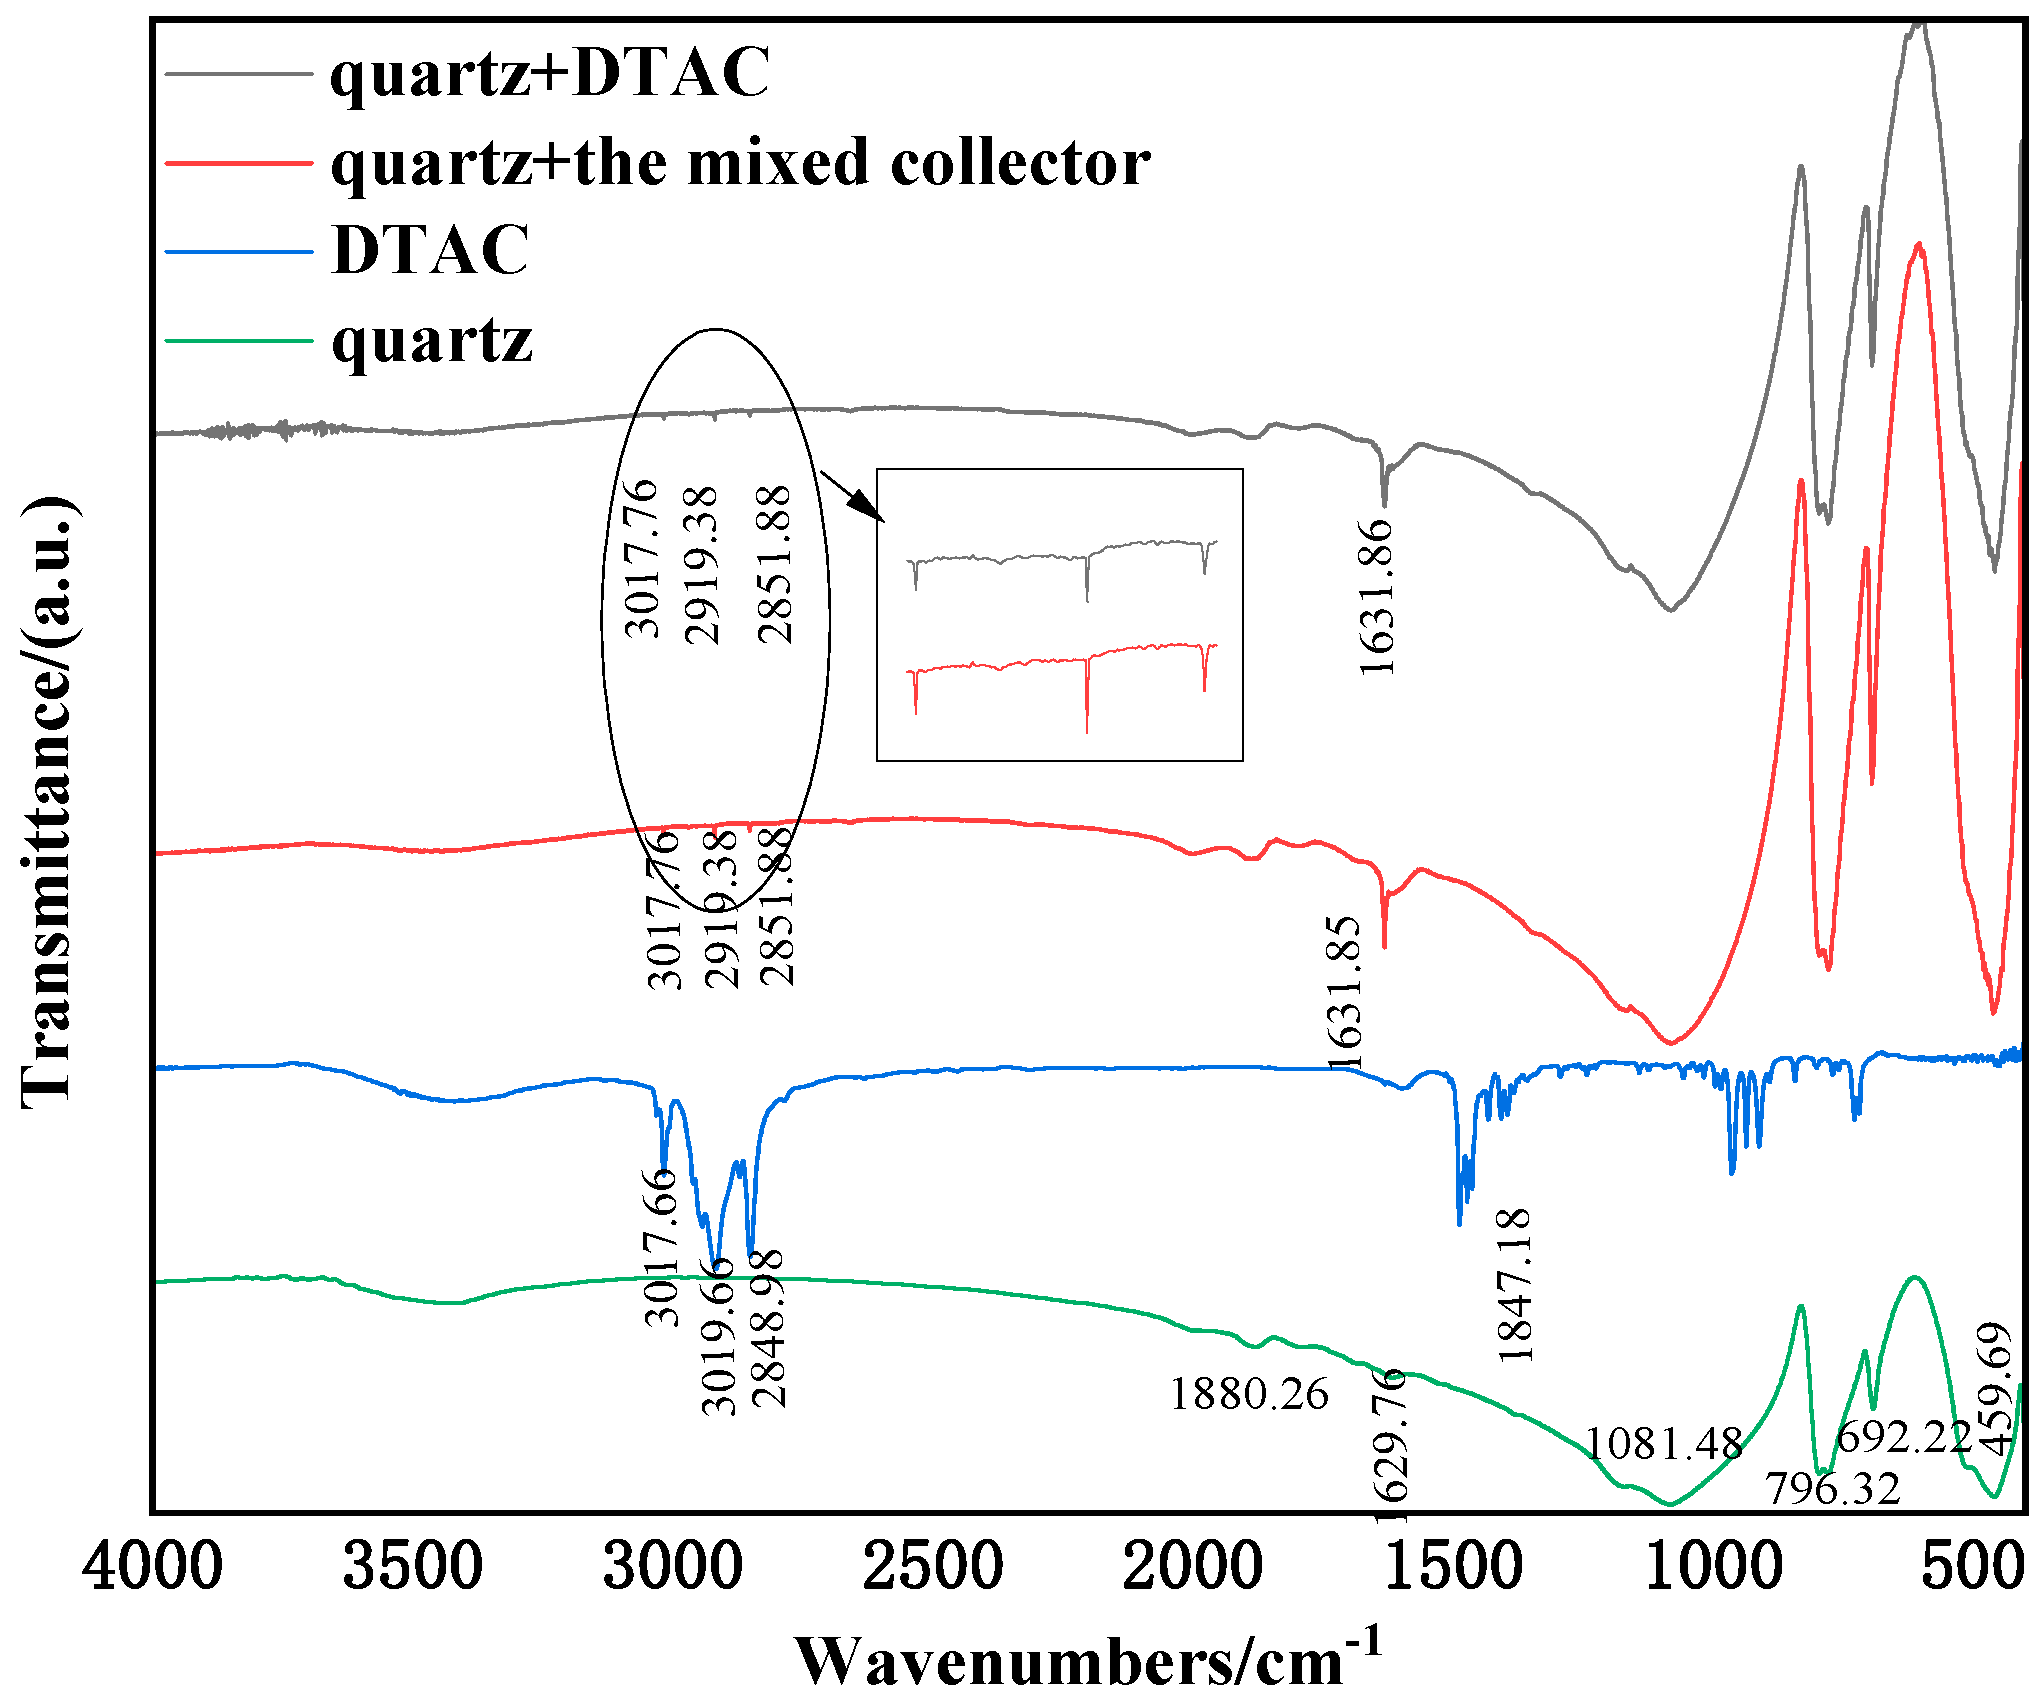
3.4. FT-IR Analyses
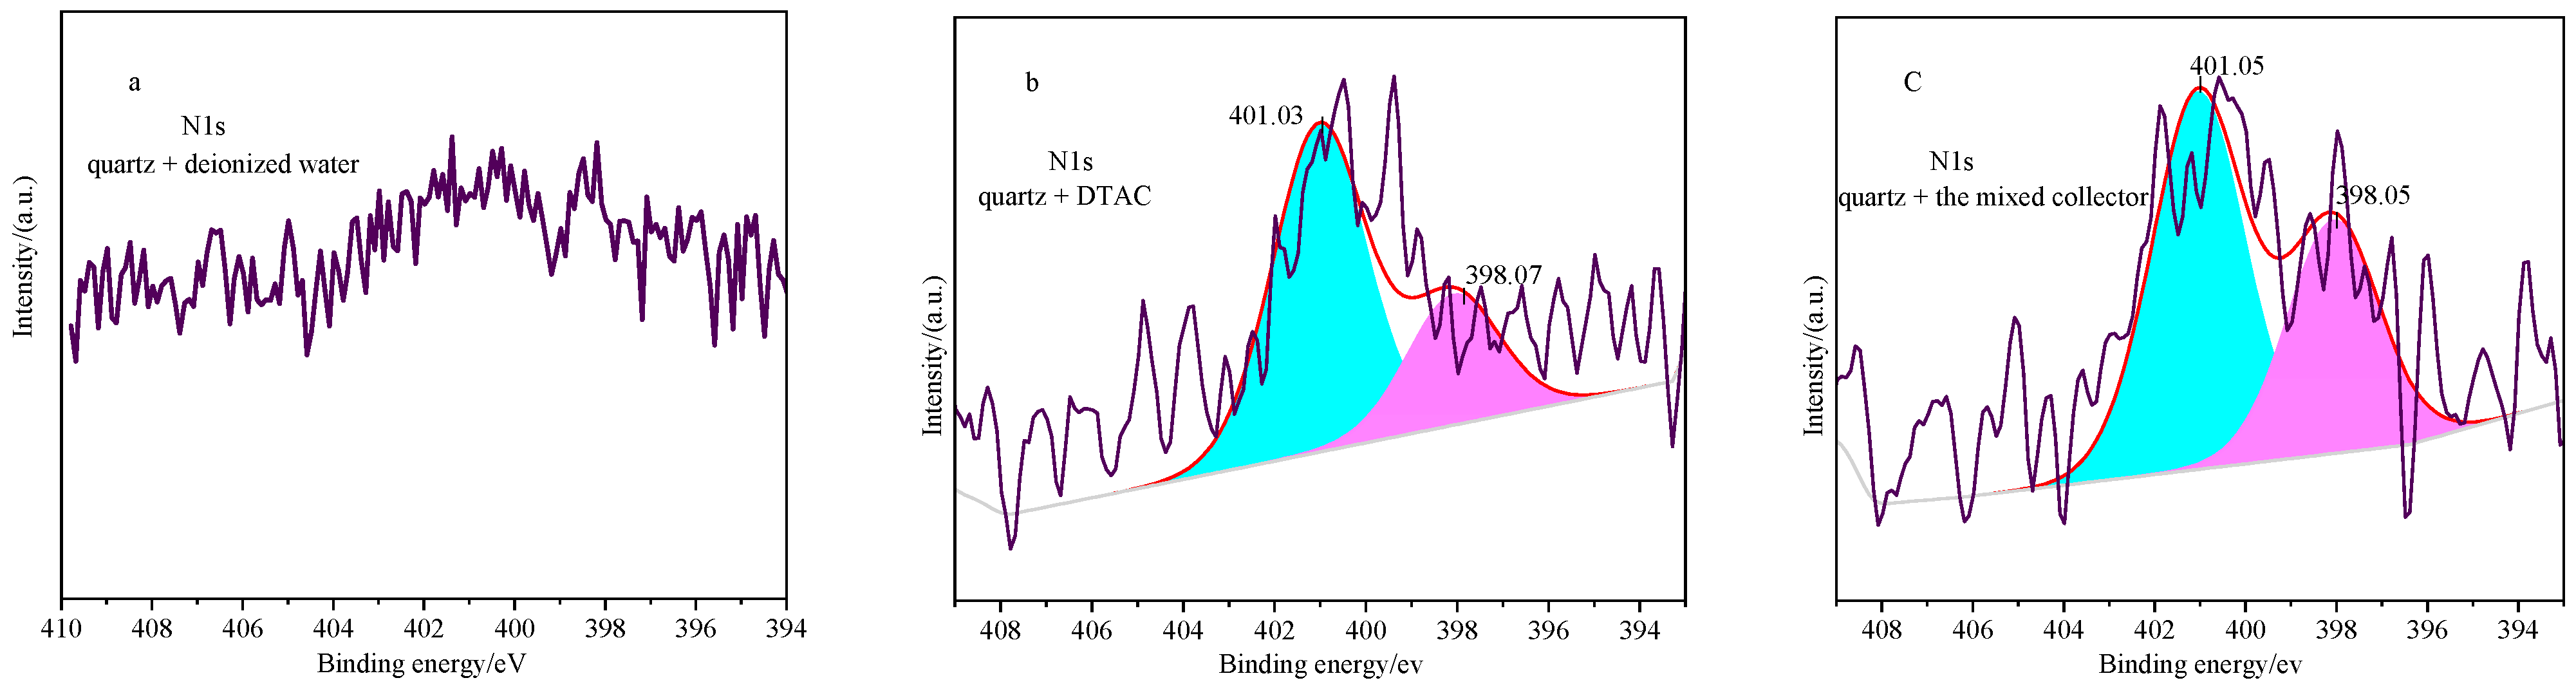
3.5. XPS Analysis
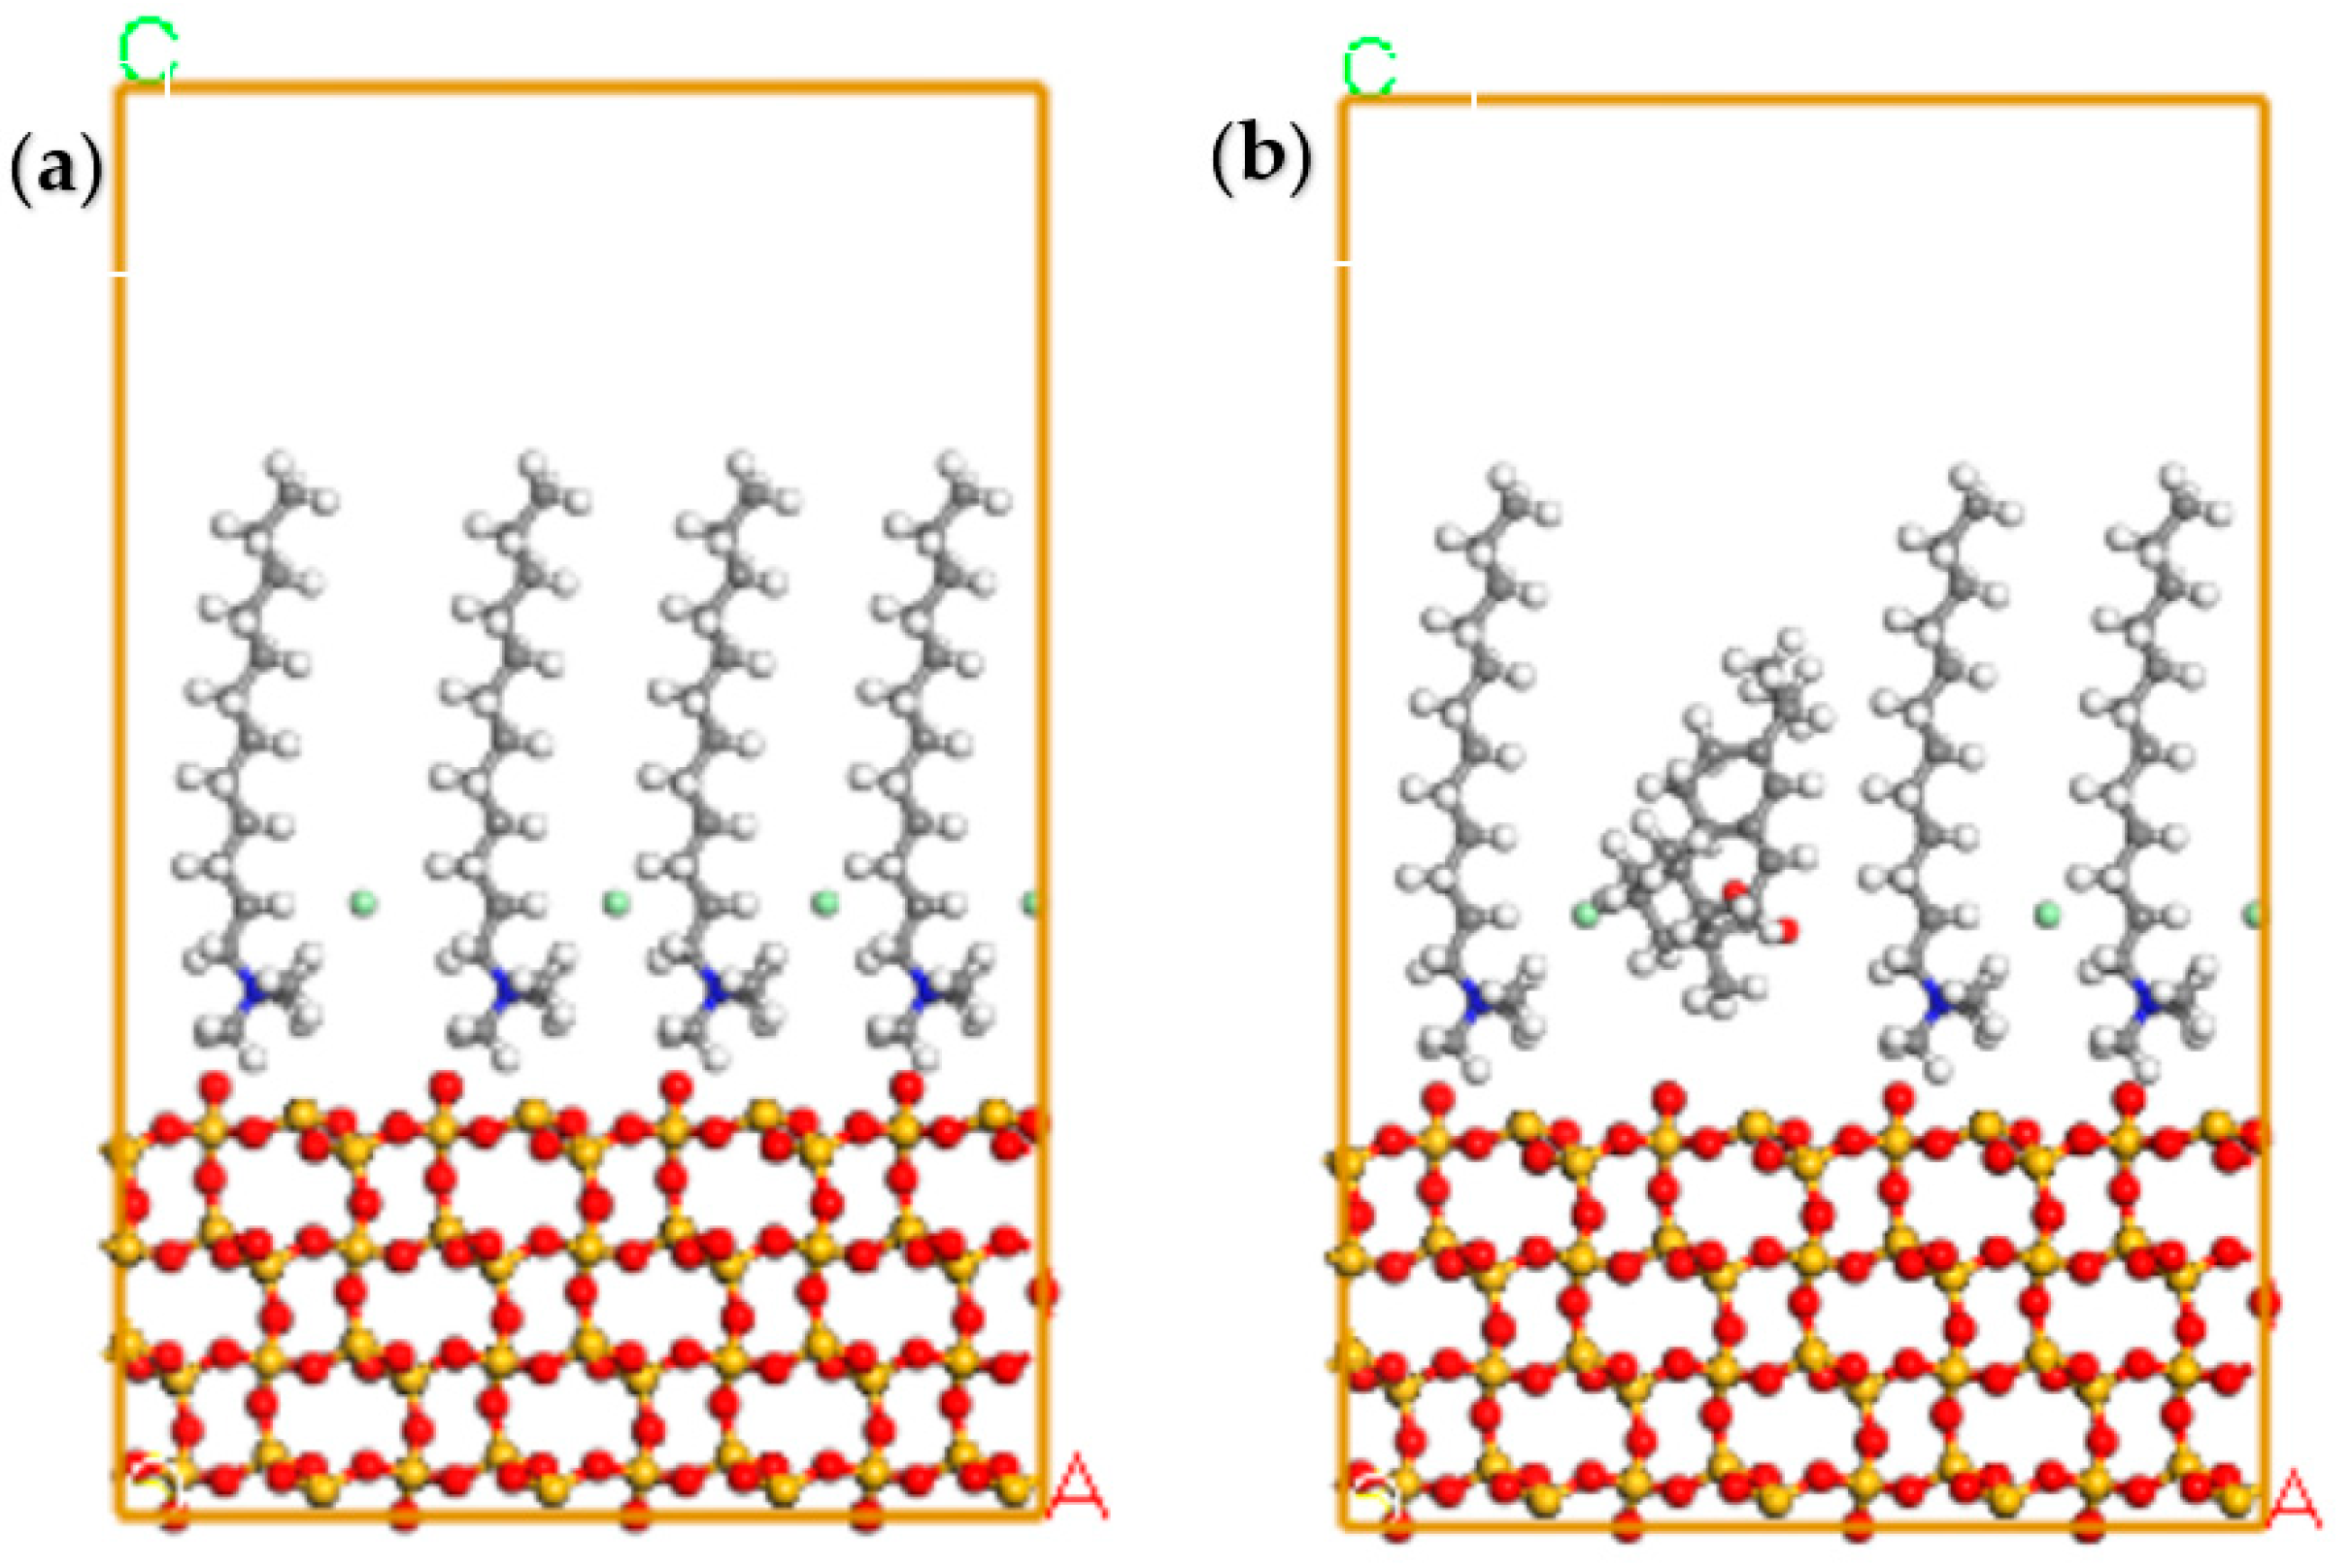
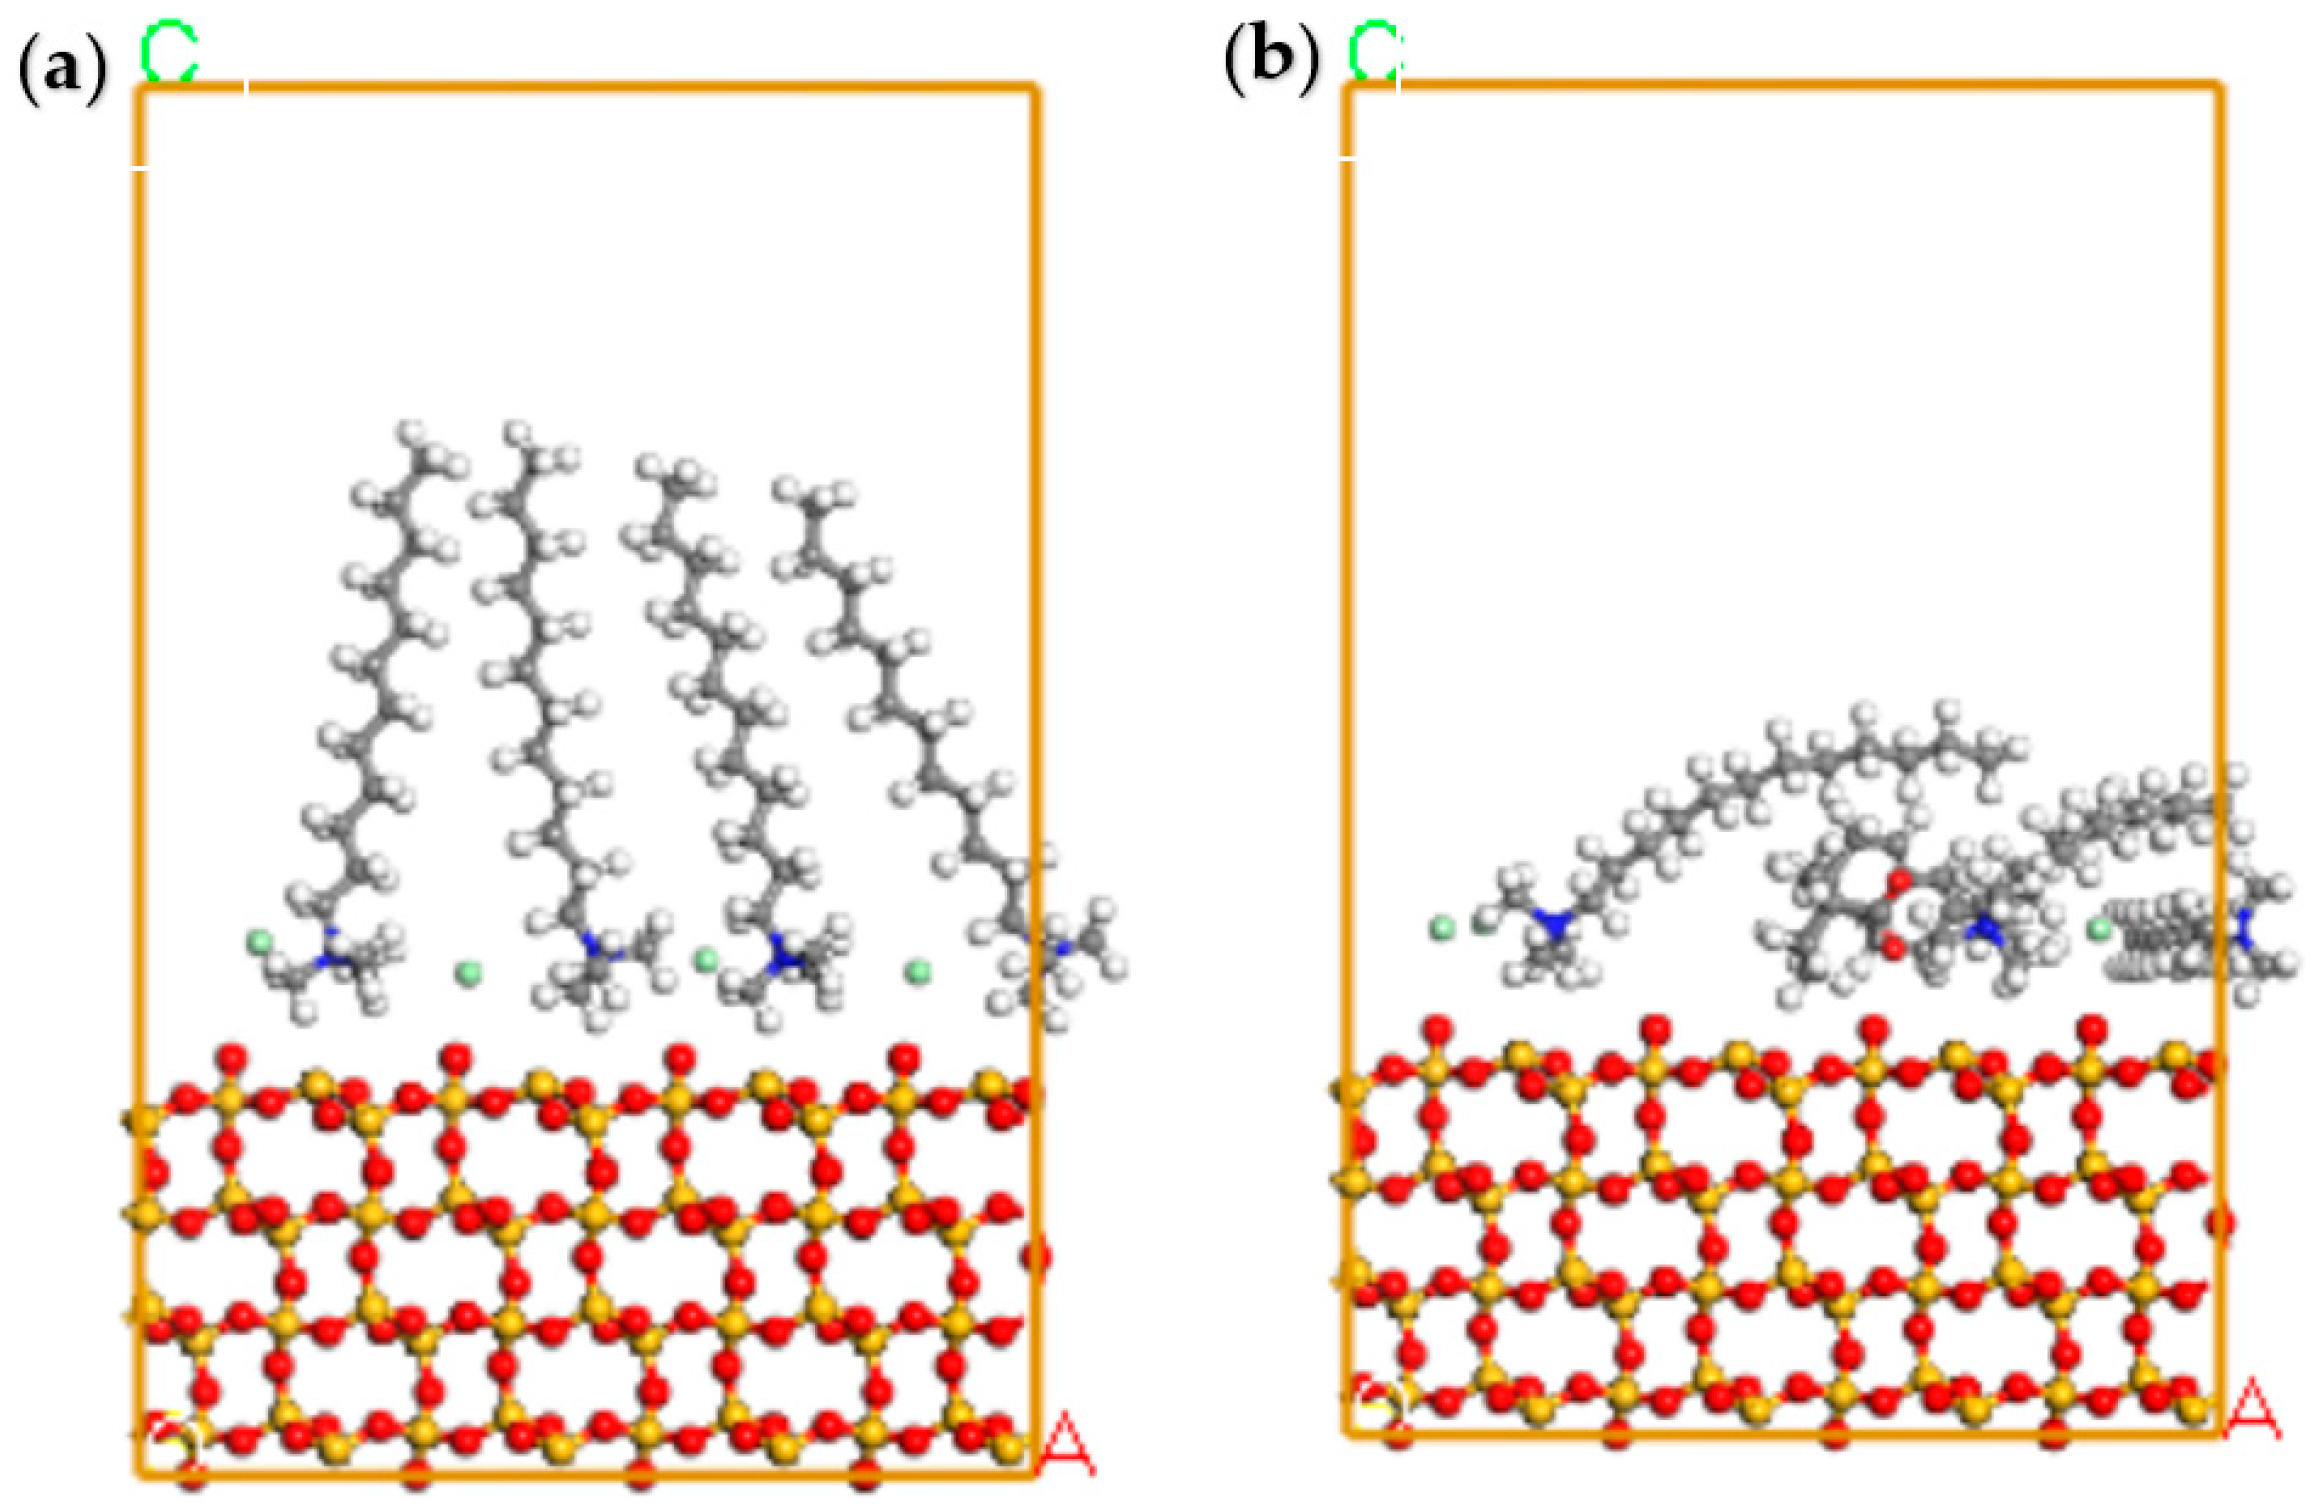
3.6. DFT Analyses
4. Conclusions
- The results of the monomineral flotation test revealed that, under the same conditions, the mixed collector surpassed the single DTAC. Quartz achieved a recovery rate of 94.67%, while hematite reached 8.69%, at a natural pH of around 7.0 and 298 K, indicating potential for the successful reverse flotation of hematite. In the comparative test, with artificially mixed minerals, the mixed collector exhibited strong selectivity compared to the single DTAC and displayed good temperature adaptability.
- The surface tension tests confirmed the mixed collector’s superior harvesting performance and low-temperature resistance, as well as the physical adsorption and hydrogen bonding of both single DTAC and mixed collector on quartz. It was observed that the adsorption of the mixed collector on the mineral surface was stronger when compared to that of the single DTAC.
- MD simulations demonstrated that the mixed collector demonstrated more negative adsorption energy on the quartz surface than the single DTAC, leading to a firmer adsorption configuration conducive to flotation.
Author Contributions
Funding
Data Availability Statement
Acknowledgments
Conflicts of Interest
References
- Iron Ore Statistics and Information|U.S. Geological Survey. Available online: https://www.usgs.gov/centers/national-minerals-information-center/iron-ore-statistics-and-information (accessed on 7 May 2024).
- Liu, W.; Liu, W.; Dai, S.; Wang, B. Adsorption of bis(2-hydroxy-3-chloropropyl) dodecylamine on quartz surface and its implication on flotation. Results Phys. 2018, 9, 1096–1101. [Google Scholar] [CrossRef]
- Yuan, S.; Xiao, H.; Wang, R.; Li, Y.; Gao, P. Improved iron recovery from low-grade iron ore by efficient suspension magnetization roasting and magnetic separation. Miner. Eng. 2022, 186, 107761. [Google Scholar] [CrossRef]
- Li, W.; Liu, W.; Tong, K.; Liu, W.; Zhao, P.; Ding, R. Synthesis and flotation performance of a novel low-viscous cationic collector based on hematite reverse flotation desilication system. Miner. Eng. 2023, 201, 108190. [Google Scholar] [CrossRef]
- Pattanaik, A.; Venugopal, R. Investigation of Adsorption Mechanism of Reagents (Surfactants) System and its Applicability in Iron Ore Flotation—An Overview. Colloid Interface Sci. Commun. 2018, 25, 41–65. [Google Scholar] [CrossRef]
- Zhang, S.; Huang, Z.; Wang, H.; Liu, R.; Cheng, C.; Shuai, S.; Hu, Y.; Guo, Z.; Yu, X.; He, G.; et al. Flotation performance of a novel Gemini collector for kaolinite at low temperature. Int. J. Min. Sci. Technol. 2021, 31, 1145–1152. [Google Scholar] [CrossRef]
- Zhang, X.; Gu, X.; Han, Y.; Parra-Álvarez, N.; Claremboux, V.; Kawatra, S.K. Flotation of Iron Ores: A Review. Miner. Process. Extr. Metall. Rev. 2021, 42, 184–212. [Google Scholar] [CrossRef]
- Araujo, A.; Viana, P.; Peres, A. Reagents in iron ores flotation. Miner. Eng. 2005, 18, 219–224. [Google Scholar] [CrossRef]
- Ding, Z.; Li, J.; Yuan, J.; Yu, A.; Wen, S.; Bai, S. Insights into the influence of calcium ions on the adsorption behavior of sodium oleate and its response to flotation of quartz: FT-IR, XPS and AMF studies. Miner. Eng. 2023, 204, 108437. [Google Scholar] [CrossRef]
- Nakhaei, F.; Irannajad, M. Reagents types in flotation of iron oxide minerals: A review. Miner. Process. Extr. Metall. Rev. 2018, 39, 89–124. [Google Scholar] [CrossRef]
- Filippov, L.; Severov, V.; Filippova, I. An overview of the beneficiation of iron ores via reverse cationic flotation. Miner. Process. 2014, 127, 62–69. [Google Scholar] [CrossRef]
- Zhang, C.; Dai, H. Current Situation and Future Development of the Collector for Reverse Flotation of Iron Ore. Multipurp. Util. Miner. Resour. 2012, 2, 3–6. [Google Scholar]
- Liu, W.; Tong, K.; Ding, R.; Liu, W.; Zhao, P.; Sun, W.; Zhao, Q.; Zhao, S. Synthesis of a novel hydroxyl quaternary ammonium collector and its selective flotation separation of quartz from hematite. Miner. Eng. 2023, 200, 108109. [Google Scholar] [CrossRef]
- A, Vidyadhar; N, Kumari; R, P, Bhagat; Adsorption mechanism of mixed collector systems on hematite flotation. Miner. Eng. 2012, 26, 102–104. [CrossRef]
- El Kadi, N.; Martins, F.; Clausse, D.; Schulz, P. Critical micelle concentrations of aqueous hexadecytrimethylammonium bromide-sodium oleate mixtures. Colloid Polym. 2003, 281, 353–362. [Google Scholar] [CrossRef]
- Özün, S.; Ulutaş, Ş. Interfacial Behavior of Anionic/Cationic Flotation Collectors in Mixed Aqueous Solutions and Their Effect on Flotation Recovery of Quartz. J. Surfactants Deterg. 2019, 22, 61–71. [Google Scholar] [CrossRef]
- Yan, W.; Liu, C.; Feng, Q.; Zhang, W. Flotation separation of scheelite from calcite using mixed collectors. Int. J. Miner. Process. 2017, 169, 106–110. [Google Scholar] [CrossRef]
- Tian, J.; Xu, L.; Deng, W.; Jiang, H.; Gao, Z.; Hu, Y. Adsorption mechanism of new mixed anionic/cationic collectors in a spodumene-feldspar flotation system. Chem. Eng. Sci. 2017, 164, 99–107. [Google Scholar] [CrossRef]
- Bai, S.; Li, J.; Bi, Y.; Yuan, J.; Wen, S.; Zhan, D. Adsorption of sodium oleate at the microfine hematite/aqueous solution interface and its consequences for flotation. Int. J. Min. Sci. Technol. 2023, 33, 105–113. [Google Scholar] [CrossRef]
- Ozun, S.; Atalay, M.U. A comparative study on interactions of ionic collectors with orthoclase. Physicochem. Probl. Miner. Process. 2016, 52, 955–972. [Google Scholar]
- Cheng, Z.; Zhu, Y.; Li, Y.; Butt, S. Experimental and MD simulation of 3-dodecyloxypropanamine and 3-tetradecyloxypropylamine adsorbed onto quartz (1 0 1) surface. Int. J. Min. Sci. Technol. 2021, 31, 1033–1042. [Google Scholar] [CrossRef]
- Liu, A.; Fan, J.; Fan, M. Quantum chemical calculations and molecular dynamics simulations of amine collector adsorption on quartz (0 0 1) surface in the aqueous solution. Int. J. Miner. Process. 2015, 134, 1–10. [Google Scholar] [CrossRef]
- Li, L.; Hao, H.; Yuan, Z.; Liu, J. Molecular dynamics simulation of siderite-hematite-quartz flotation with sodium oleate. Appl. Surf. Sci. 2017, 419, 557–563. [Google Scholar] [CrossRef]
- Wang, X.; Liu, W.; Duan, H.; Wang, B.; Han, C.; Wei, D. The adsorption mechanism of calcium ion on quartz (1 0 1) surface: A DFT study. Powder Technol. 2018, 329, 158–166. [Google Scholar] [CrossRef]
- Zhu, Y.; Luo, B.; Sun, C.; Lun, J.; Sun, H.; Li, Y.; Han, Y. Density functional theory study of α-Bromolauric acid adsorption on the α-quartz (1 0 1) surface. Miner. Eng. 2016, 92, 72–77. [Google Scholar] [CrossRef]
- Quezada, G.; Piceros, E.; Saavedra, J.; Pedro, R.; Ricardo, I. Polymer affinity with quartz (1 0 1) surface in saline solutions: A molecular dynamics study. Miner. Eng. 2022, 186, 107750. [Google Scholar] [CrossRef]
- Zhang, S.; Ren, J.; Wen, Y.; Shao, X. Flotation separation of diaspore and kaolinite by using dodecanamide and cetyltrimethylammonium bromide as an effective mixed collector. Miner. Eng. 2022, 179, 107434. [Google Scholar] [CrossRef]
- Zhou, Y.; Zhang, Y.; Li, P.; Li, G.; Jiang, T. Comparative study on the adsorption interactions of humic acid onto natural magnetite, hematite and quartz: Effect of initial HA concentration. Powder Technol. 2014, 251, 1–8. [Google Scholar] [CrossRef]


| Minerals | TFe | FeO | Al2O3 | SiO2 | K2O | Na2O | Fe2O3 | CaO | MgO |
|---|---|---|---|---|---|---|---|---|---|
| hematite | 68.43 | 0.75 | 0.59 | 3.54 | 0.05 | - | 97.84 | 0.03 | 0.13 |
| quartz | - | - | 1.21 | 98.36 | 0.18 | 0.036 | 0.02 | 0.04 | 0.03 |
| Collector | Temperature, K | Product | Yield (%) | Grade, TFe (%) | Recovery (%) |
|---|---|---|---|---|---|
| The mixed collector | 298 | Concentrate | 88.72 | 66.49 | 97.23 |
| Tailing | 11.28 | 14.90 | 2.77 | ||
| Feed | 100.00 | 60.67 | 100.00 | ||
| 288 | Concentrate | 88.98 | 66.27 | 97.19 | |
| Tailing | 11.02 | 15.47 | 2.81 | ||
| Feed | 100.00 | 60.67 | 100.00 | ||
| DTAC | 298 | Concentrate | 90.00 | 65.21 | 96.73 |
| Tailing | 10.00 | 19.84 | 3.27 | ||
| Feed | 100.00 | 60.67 | 100.00 | ||
| 288 | Concentrate | 91.12 | 63.04 | 94.68 | |
| Tailing | 8.88 | 36.35 | 5.32 | ||
| Feed | 100.00 | 60.67 | 100.00 |
| Sample | Atomic Concentration (%) | |||
|---|---|---|---|---|
| C1s | O1s | Si2p | N1s | |
| Quartz + deionized water | 13.39 | 56.45 | 29.62 | - |
| Quartz + the mixed collector | 14.46 | 56.87 | 28.01 | 0.66 |
| Quartz + DTAC | 14.08 | 56.45 | 28.91 | 0.26 |
| Collector | Eads (kJ/mol) | Esurf /dep (kJ/mol) | Esurf (kJ/mol) | Edep (kJ/mol) |
|---|---|---|---|---|
| The mixed collector | −52.16 | −7093.30 | −6787.48 | −253.66 |
| DTAC | −35.10 | −7110.72 | −6787.66 | −287.96 |
Disclaimer/Publisher’s Note: The statements, opinions and data contained in all publications are solely those of the individual author(s) and contributor(s) and not of MDPI and/or the editor(s). MDPI and/or the editor(s) disclaim responsibility for any injury to people or property resulting from any ideas, methods, instructions or products referred to in the content. |
© 2024 by the authors. Licensee MDPI, Basel, Switzerland. This article is an open access article distributed under the terms and conditions of the Creative Commons Attribution (CC BY) license (https://creativecommons.org/licenses/by/4.0/).
Share and Cite
Wang, J.; Lu, D.; Han, X. Application and Mechanism of Mixed Anionic/Cationic Collectors on Reverse Flotation of Hematite. Minerals 2024, 14, 550. https://doi.org/10.3390/min14060550
Wang J, Lu D, Han X. Application and Mechanism of Mixed Anionic/Cationic Collectors on Reverse Flotation of Hematite. Minerals. 2024; 14(6):550. https://doi.org/10.3390/min14060550
Chicago/Turabian StyleWang, Juanjuan, Dongfang Lu, and Xue Han. 2024. "Application and Mechanism of Mixed Anionic/Cationic Collectors on Reverse Flotation of Hematite" Minerals 14, no. 6: 550. https://doi.org/10.3390/min14060550
APA StyleWang, J., Lu, D., & Han, X. (2024). Application and Mechanism of Mixed Anionic/Cationic Collectors on Reverse Flotation of Hematite. Minerals, 14(6), 550. https://doi.org/10.3390/min14060550