
Inhibiting Mechanism of High pH on Molybdenite Flotation. An Experimental and DFT Study


Abstract
:1. Introduction
2. Materials and Methods
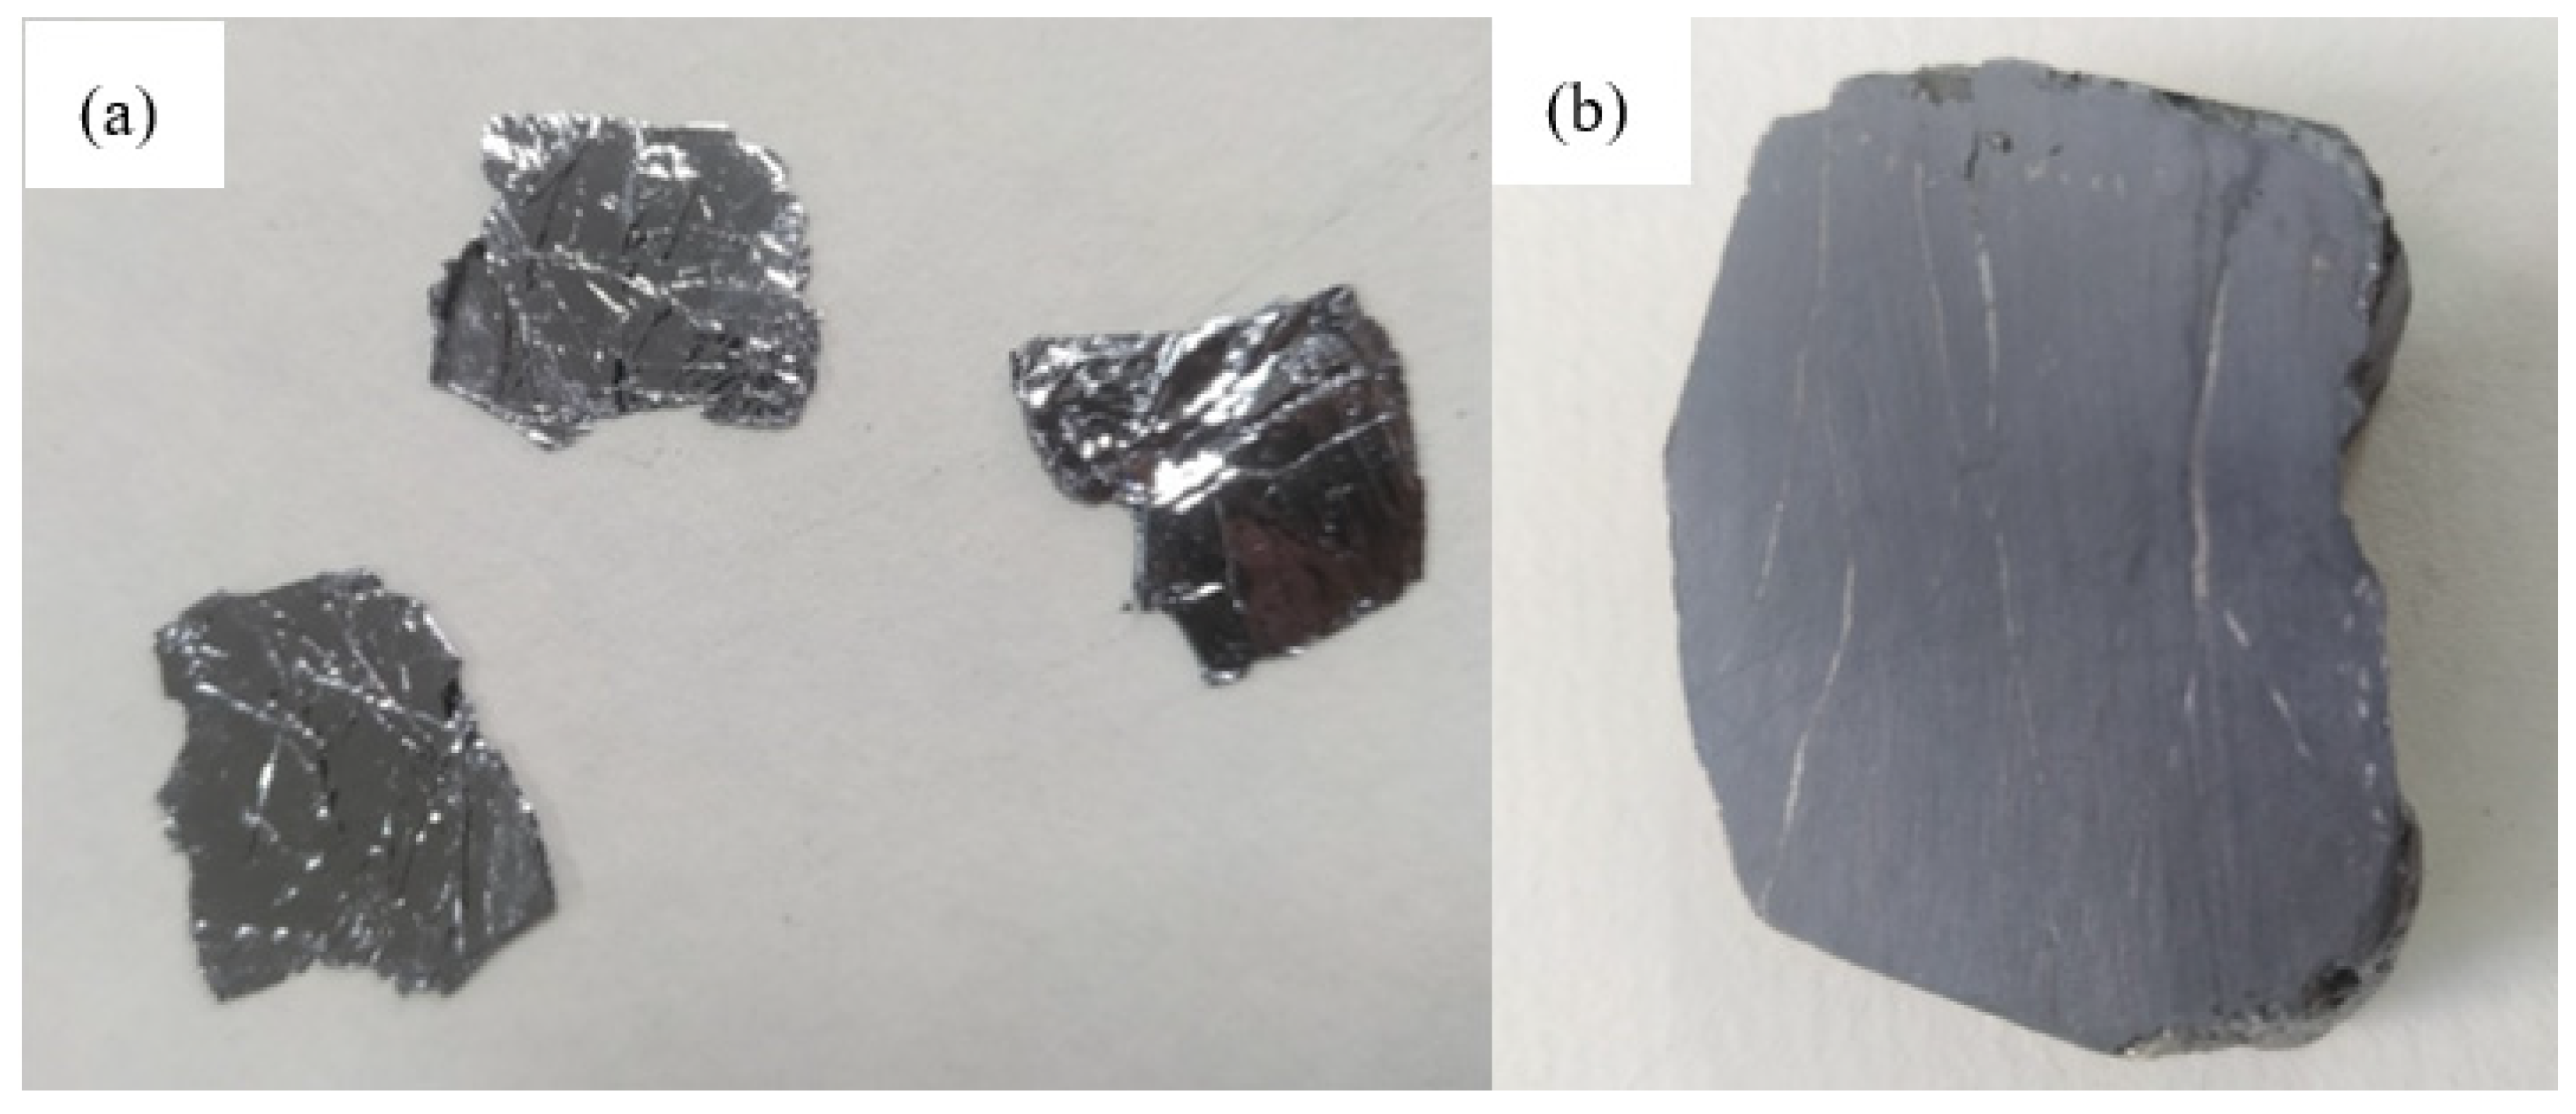
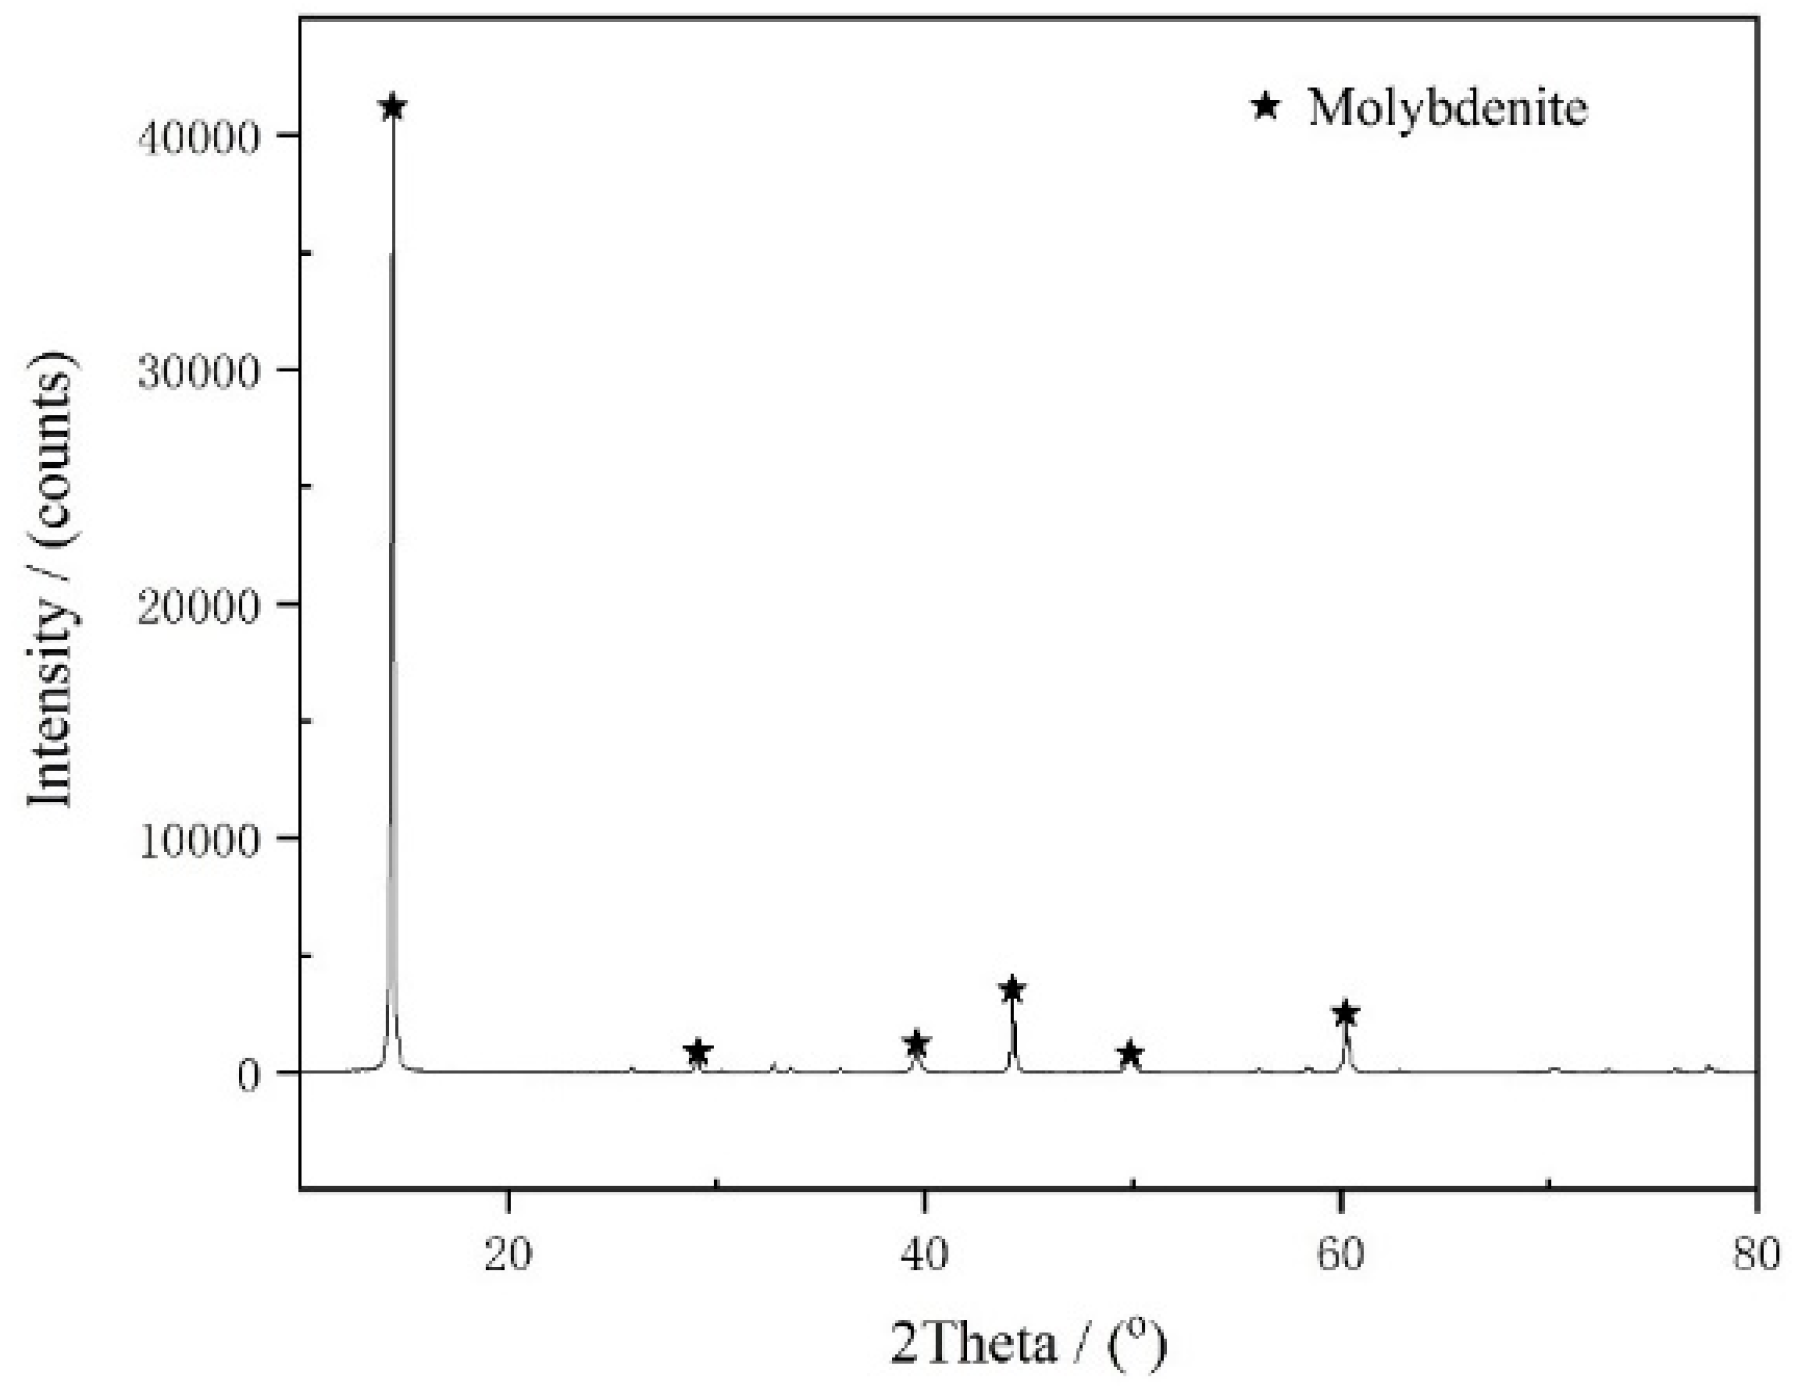
2.1. Materials and Reagents
2.2. Flotation Tests
2.3. Zeta Potential Measurements
2.4. Contact Angle Measurements
2.5. Simulation Details
3. Results and Discussion
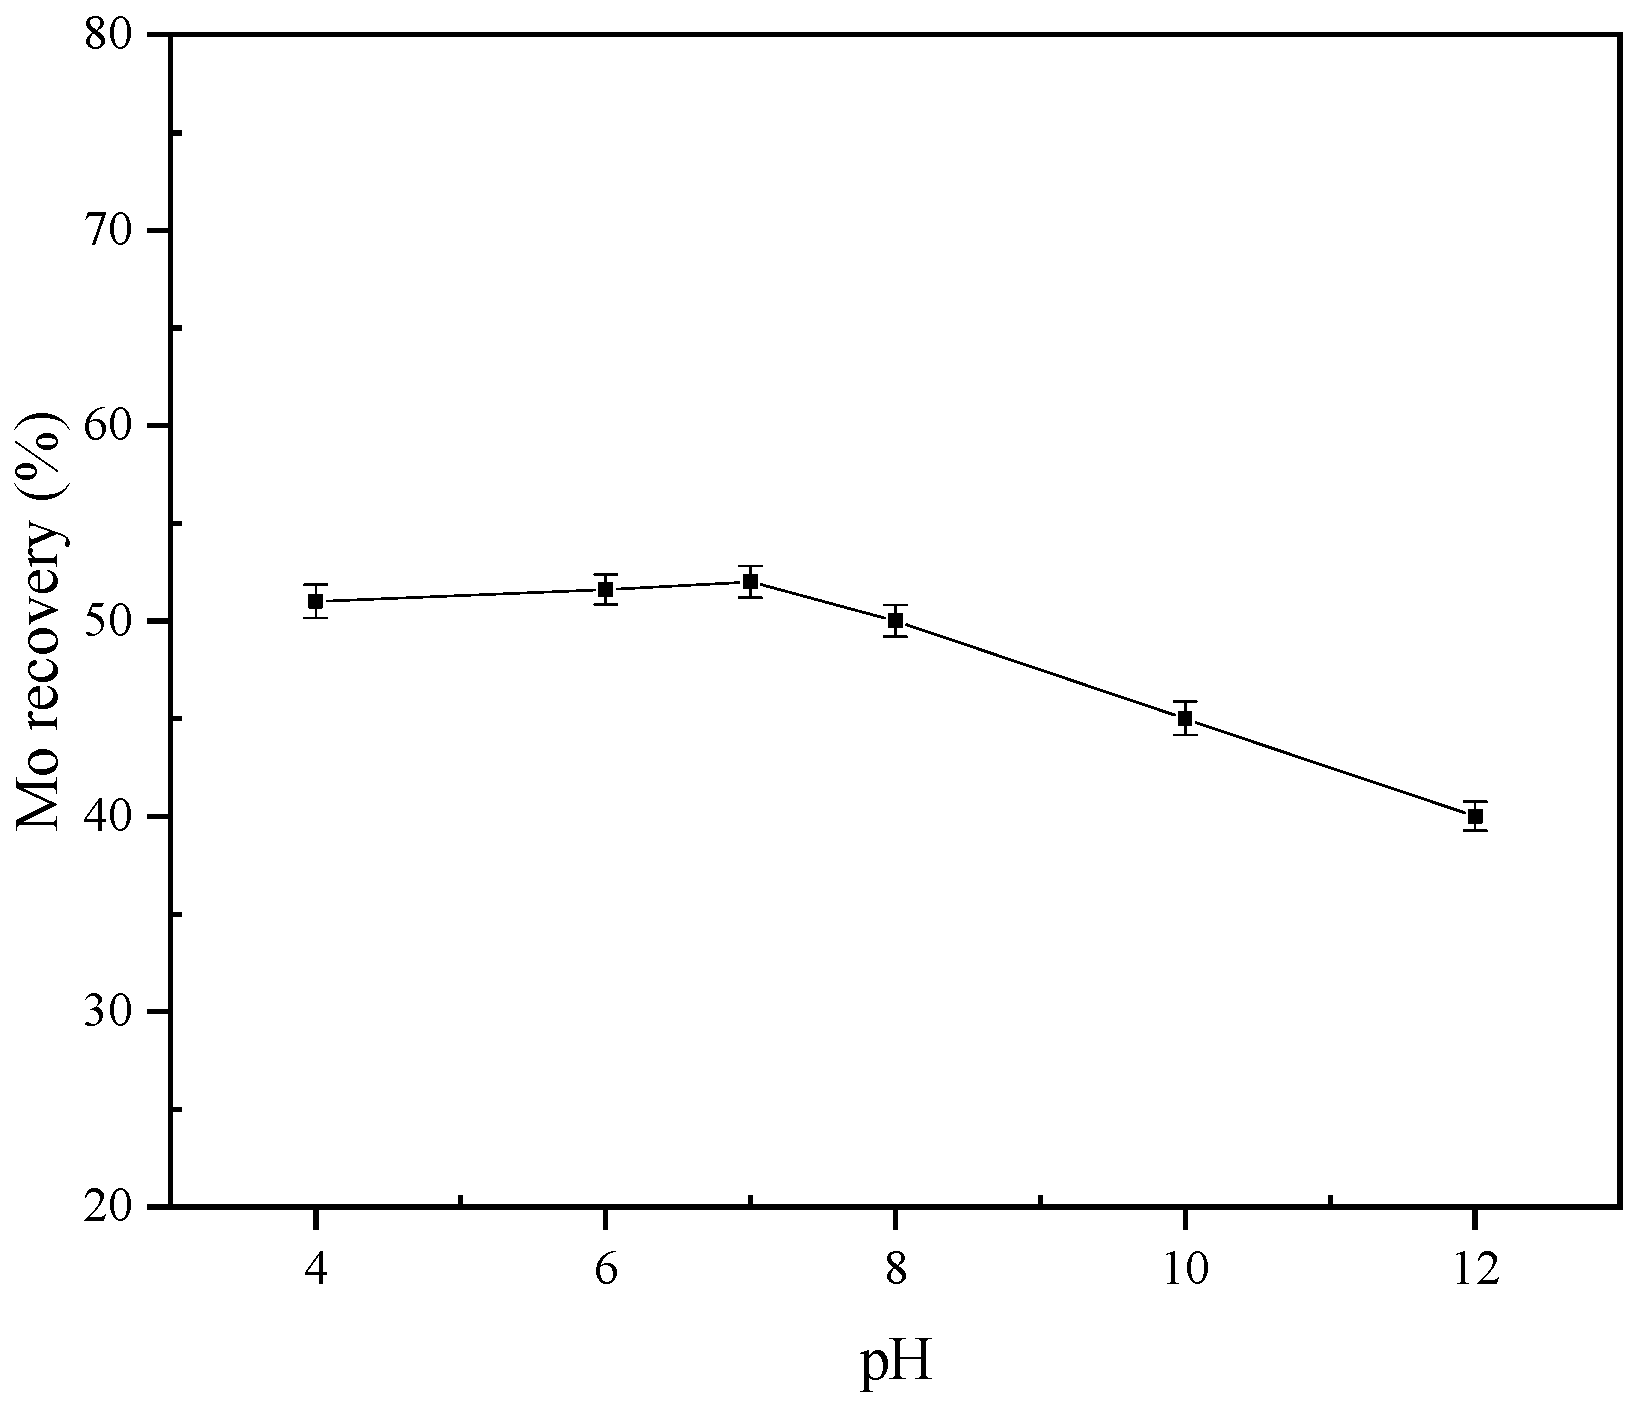
3.1. Flotation Test
3.2. Zeta Potential Measurements
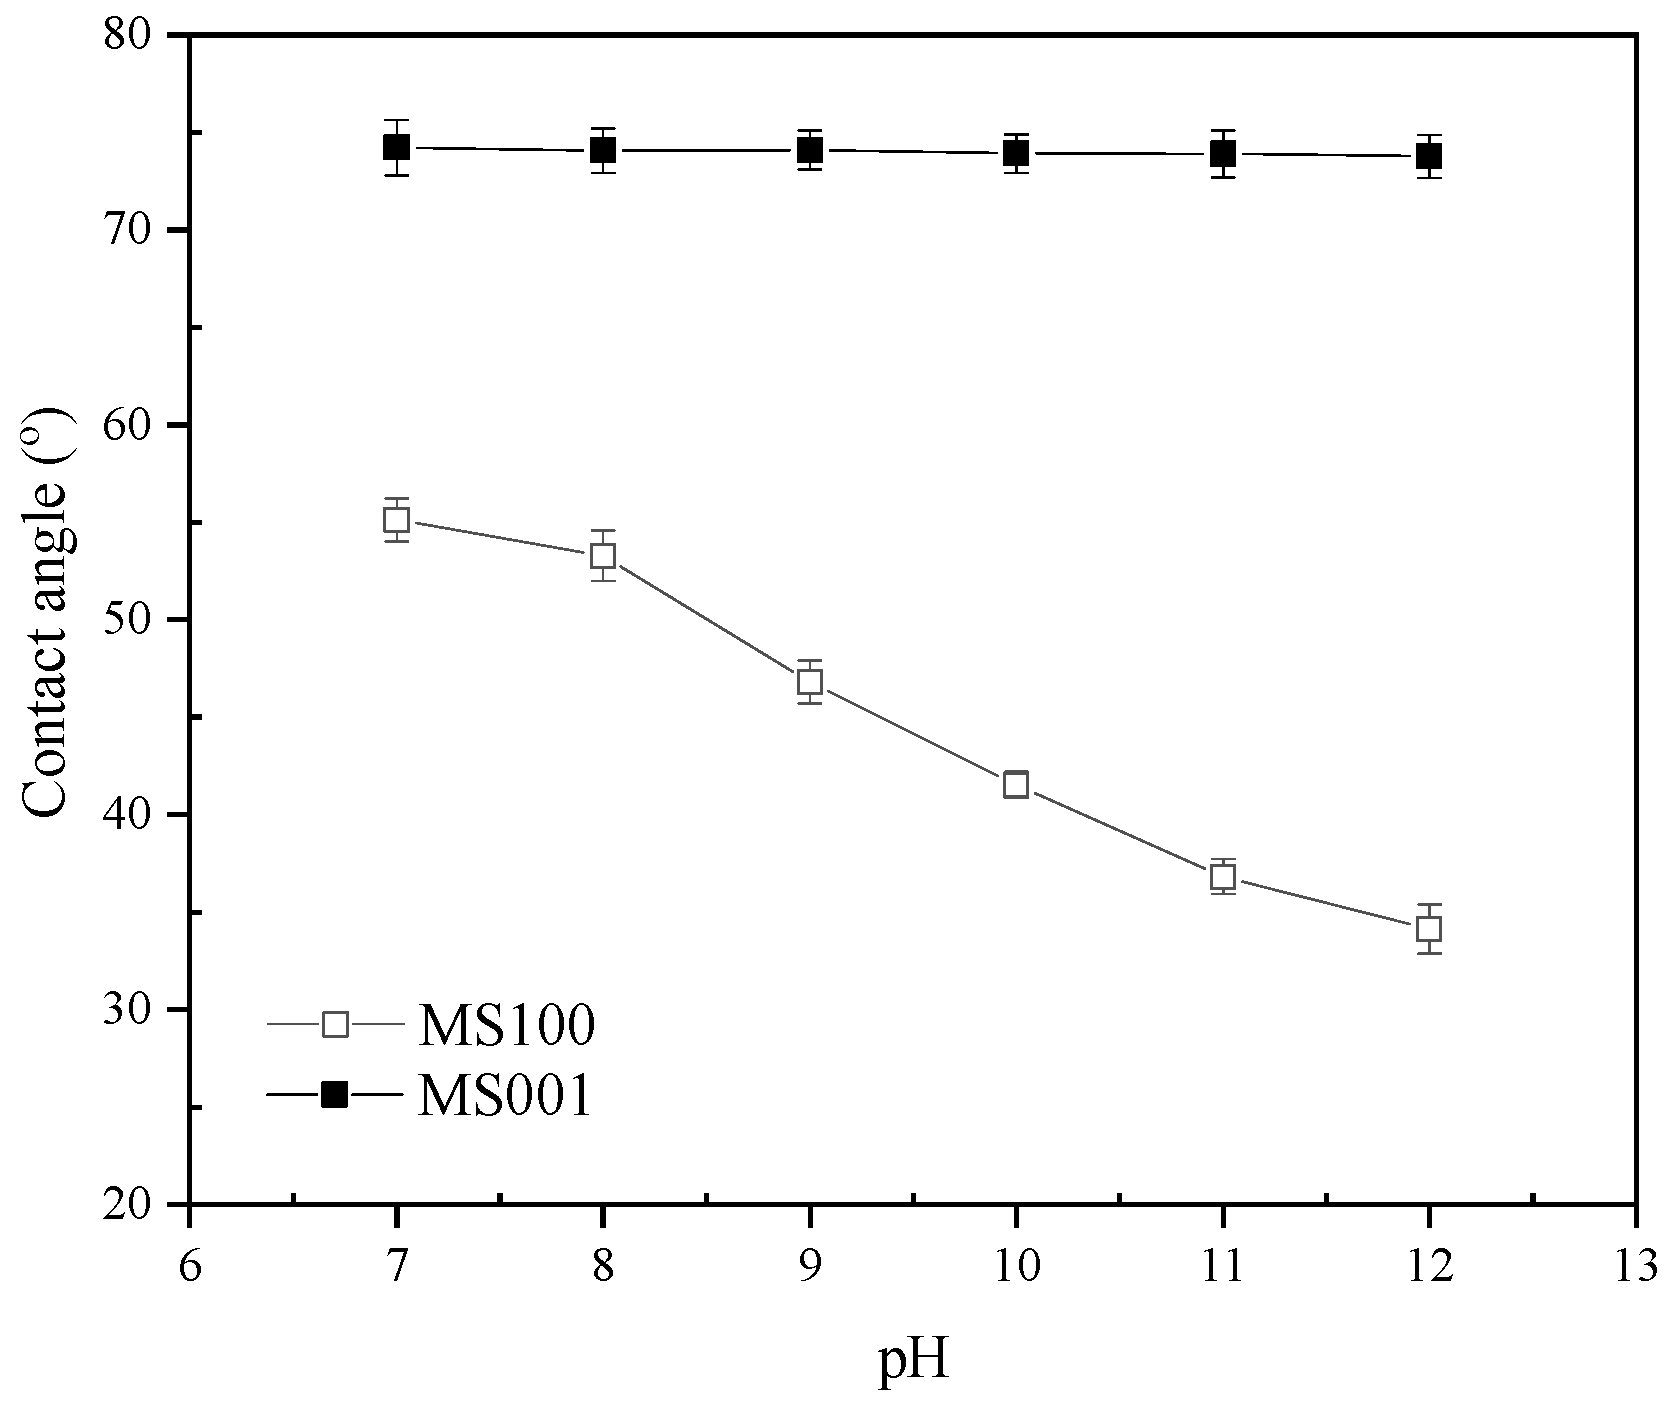
3.3. Contact Angle Measurements
3.4. Inhibiting Mechanism of High pH on Molybdenite Flotation
3.4.1. Adsorption Energy of H2O and OH−/H+ on MS001/ MS100
3.4.2. Electronic Properties of H2O and OH−/H+ at MS001/MS100
- (1)
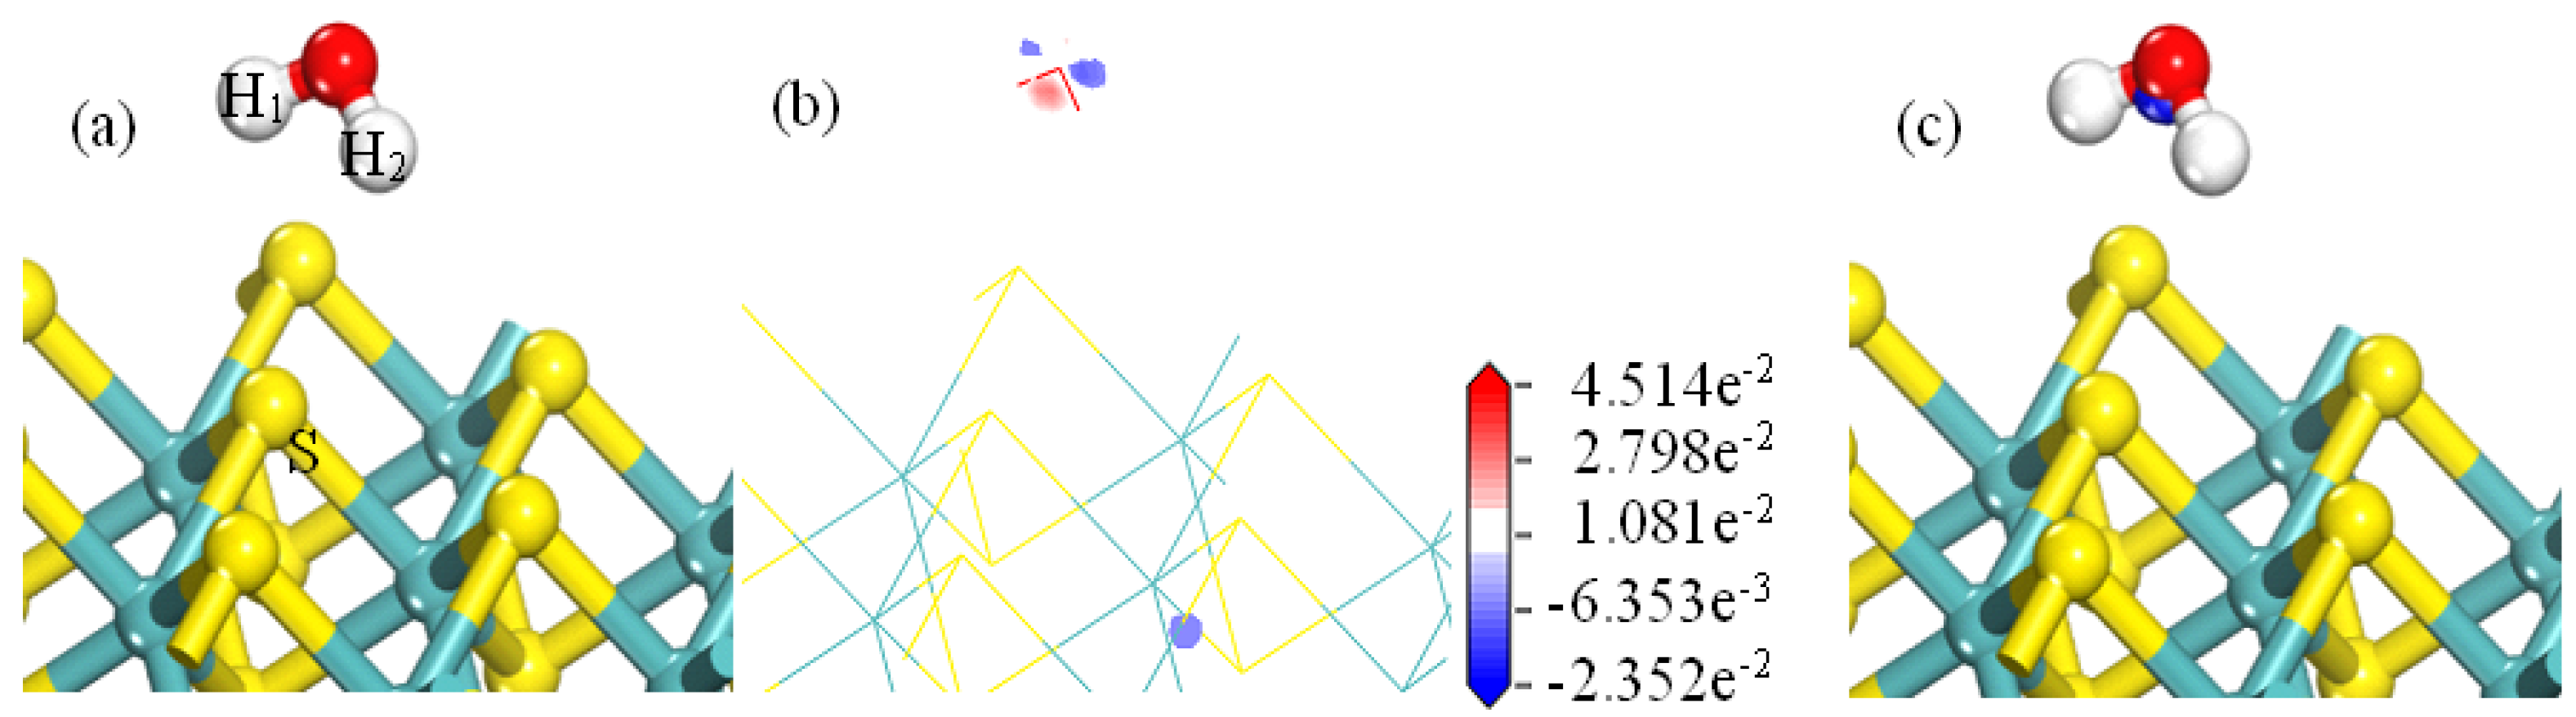
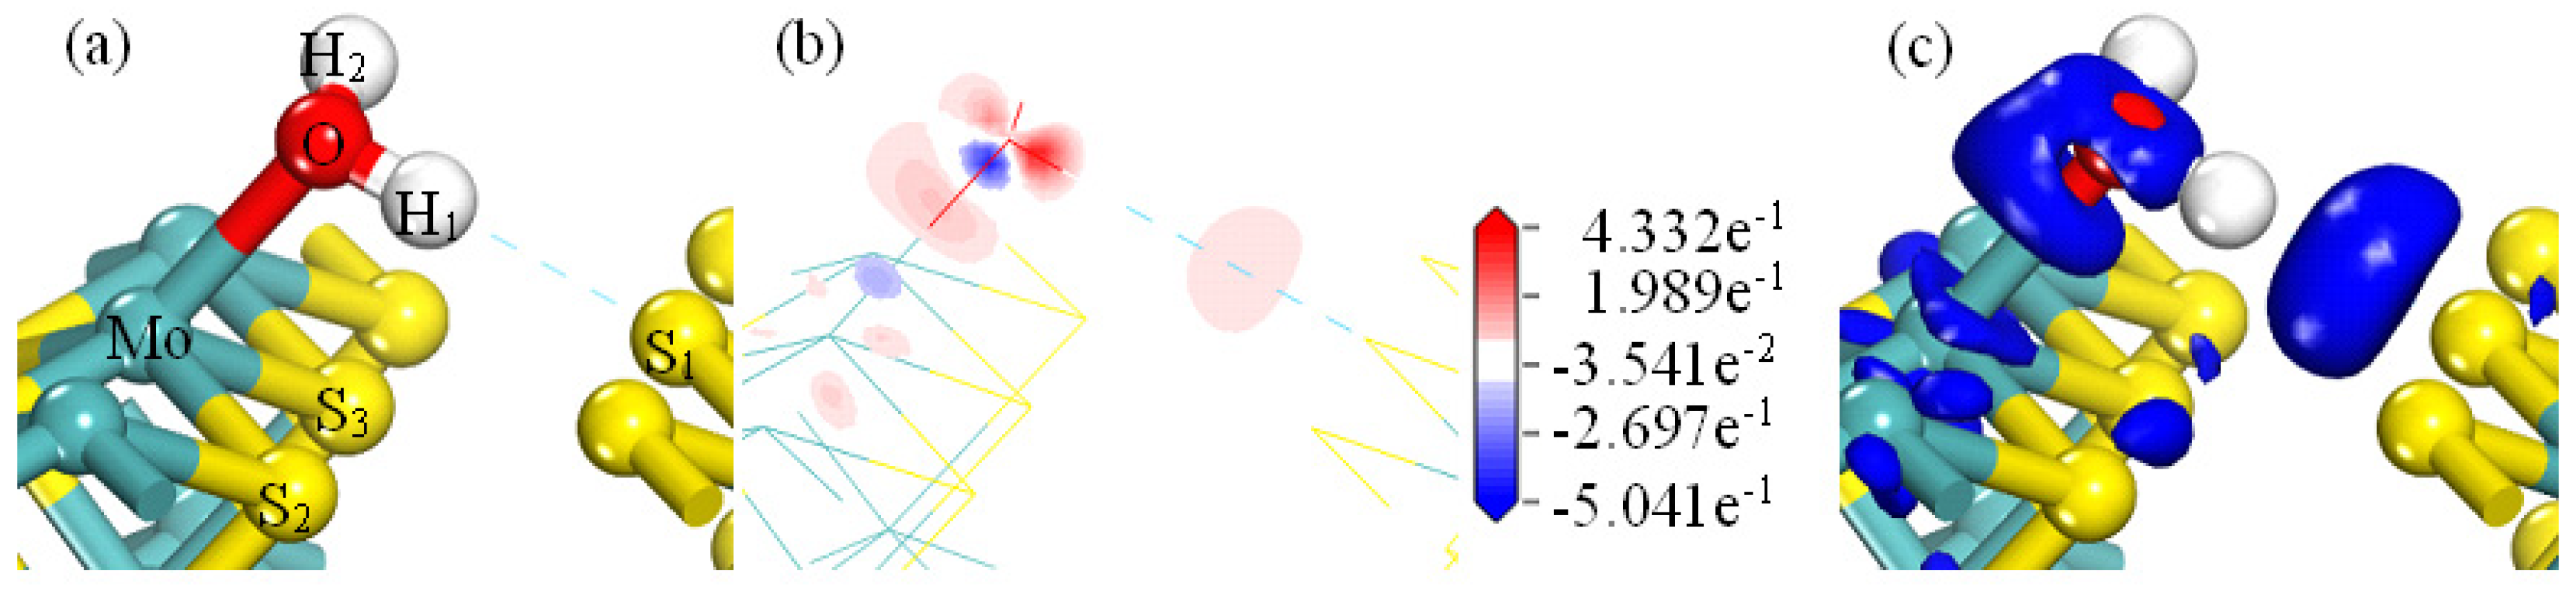
- Analysis of Water Bonding on the Surface of Molybdenite
- (2)
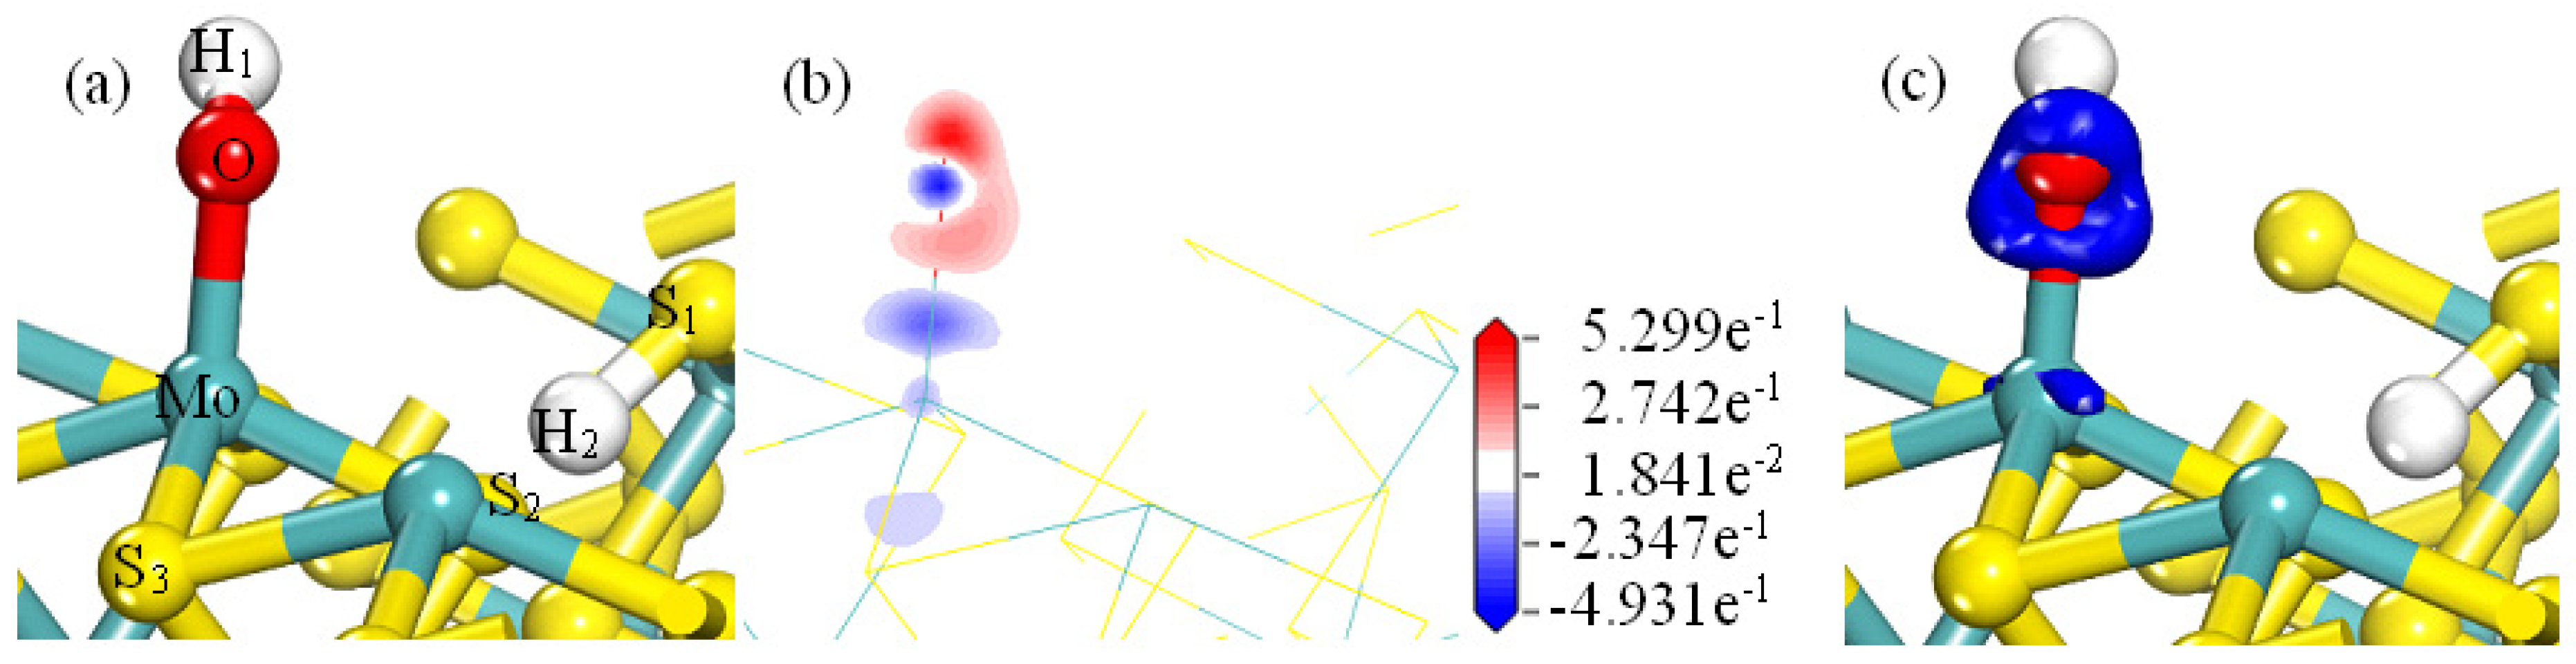
- Analysis of OH−/H+ Bonding on the MS100
- (3)
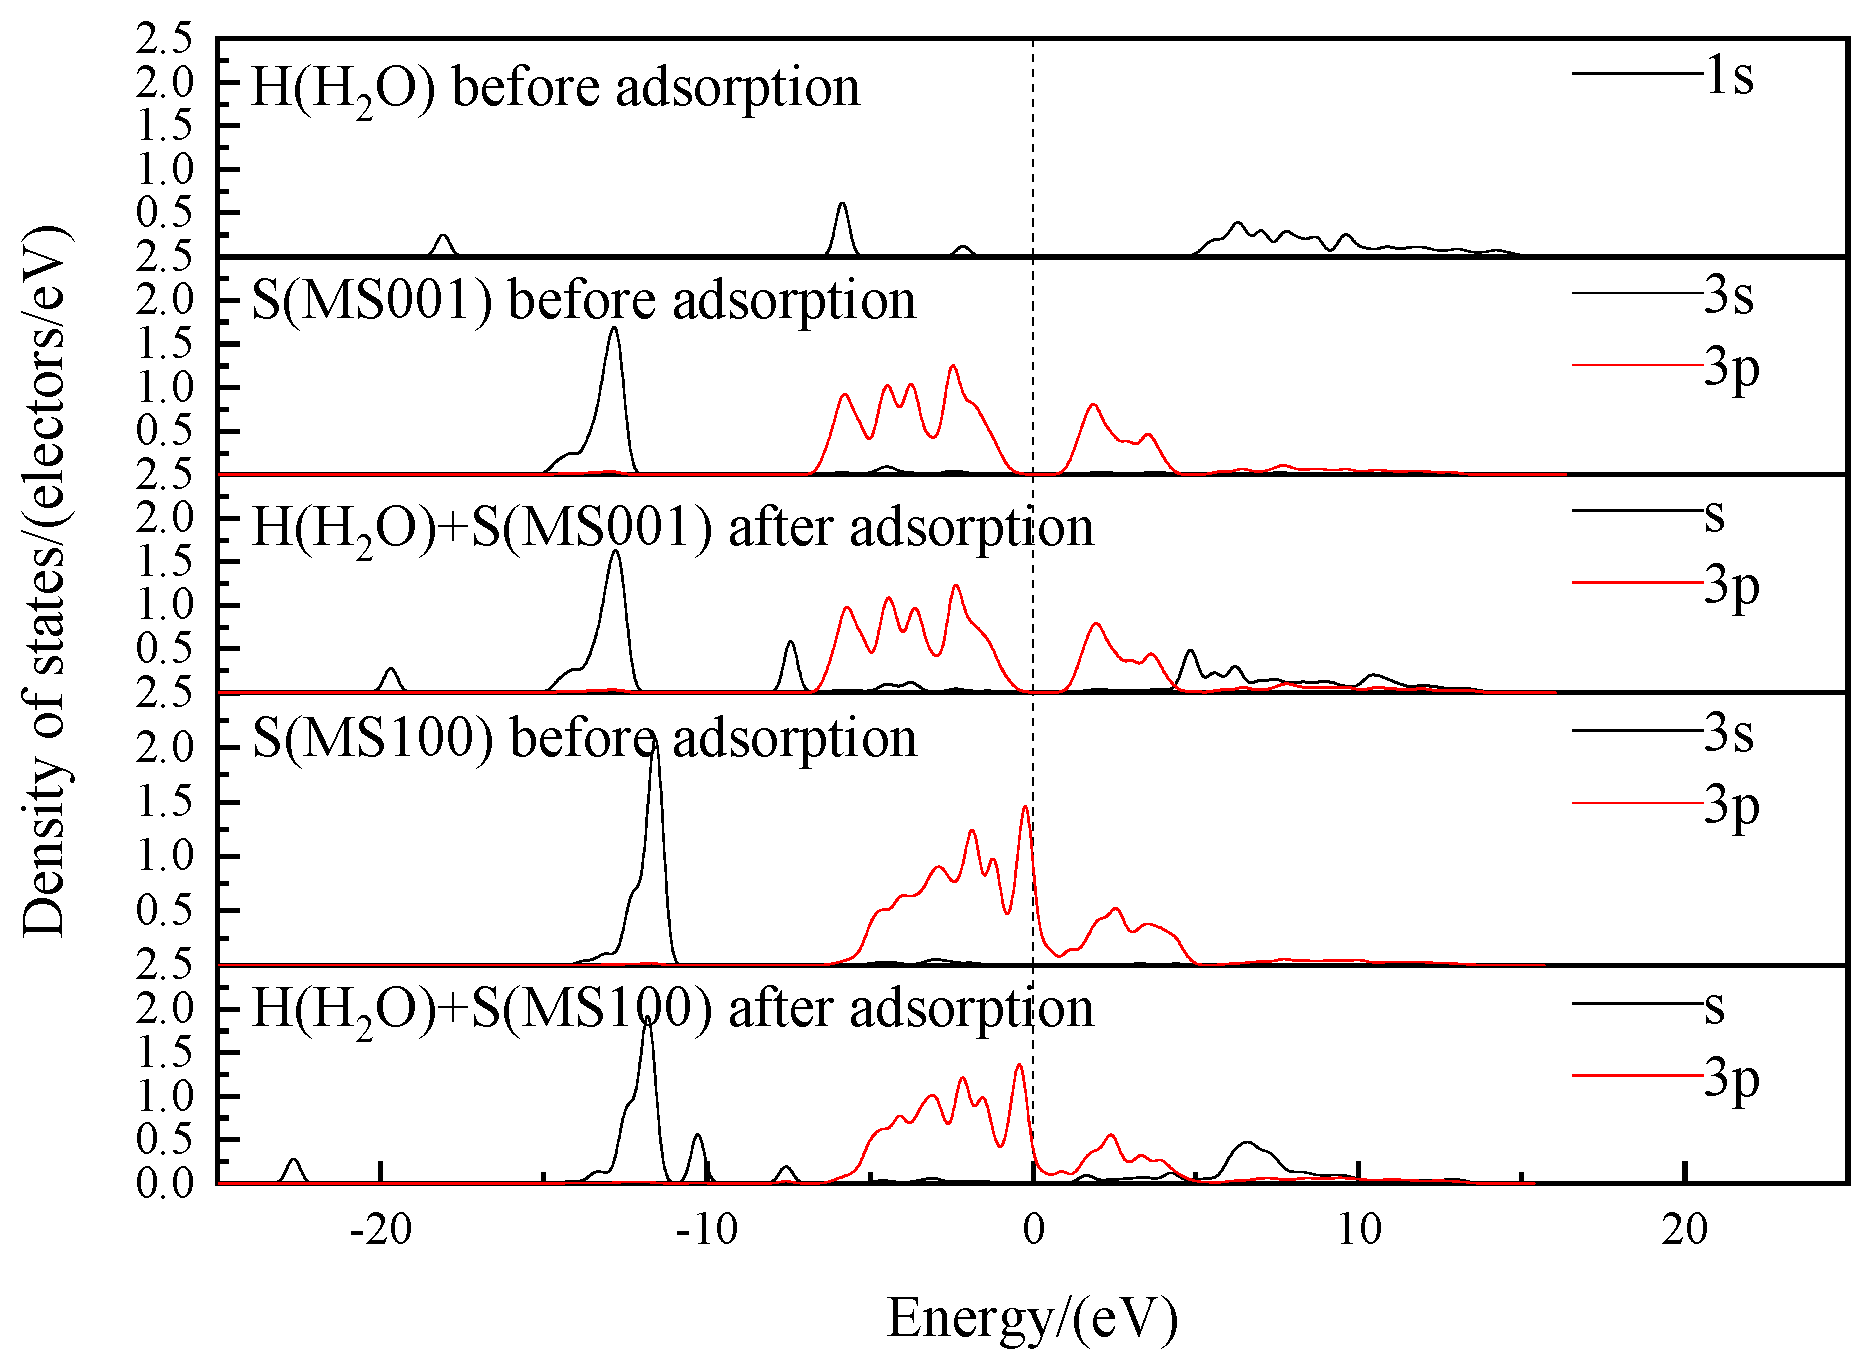
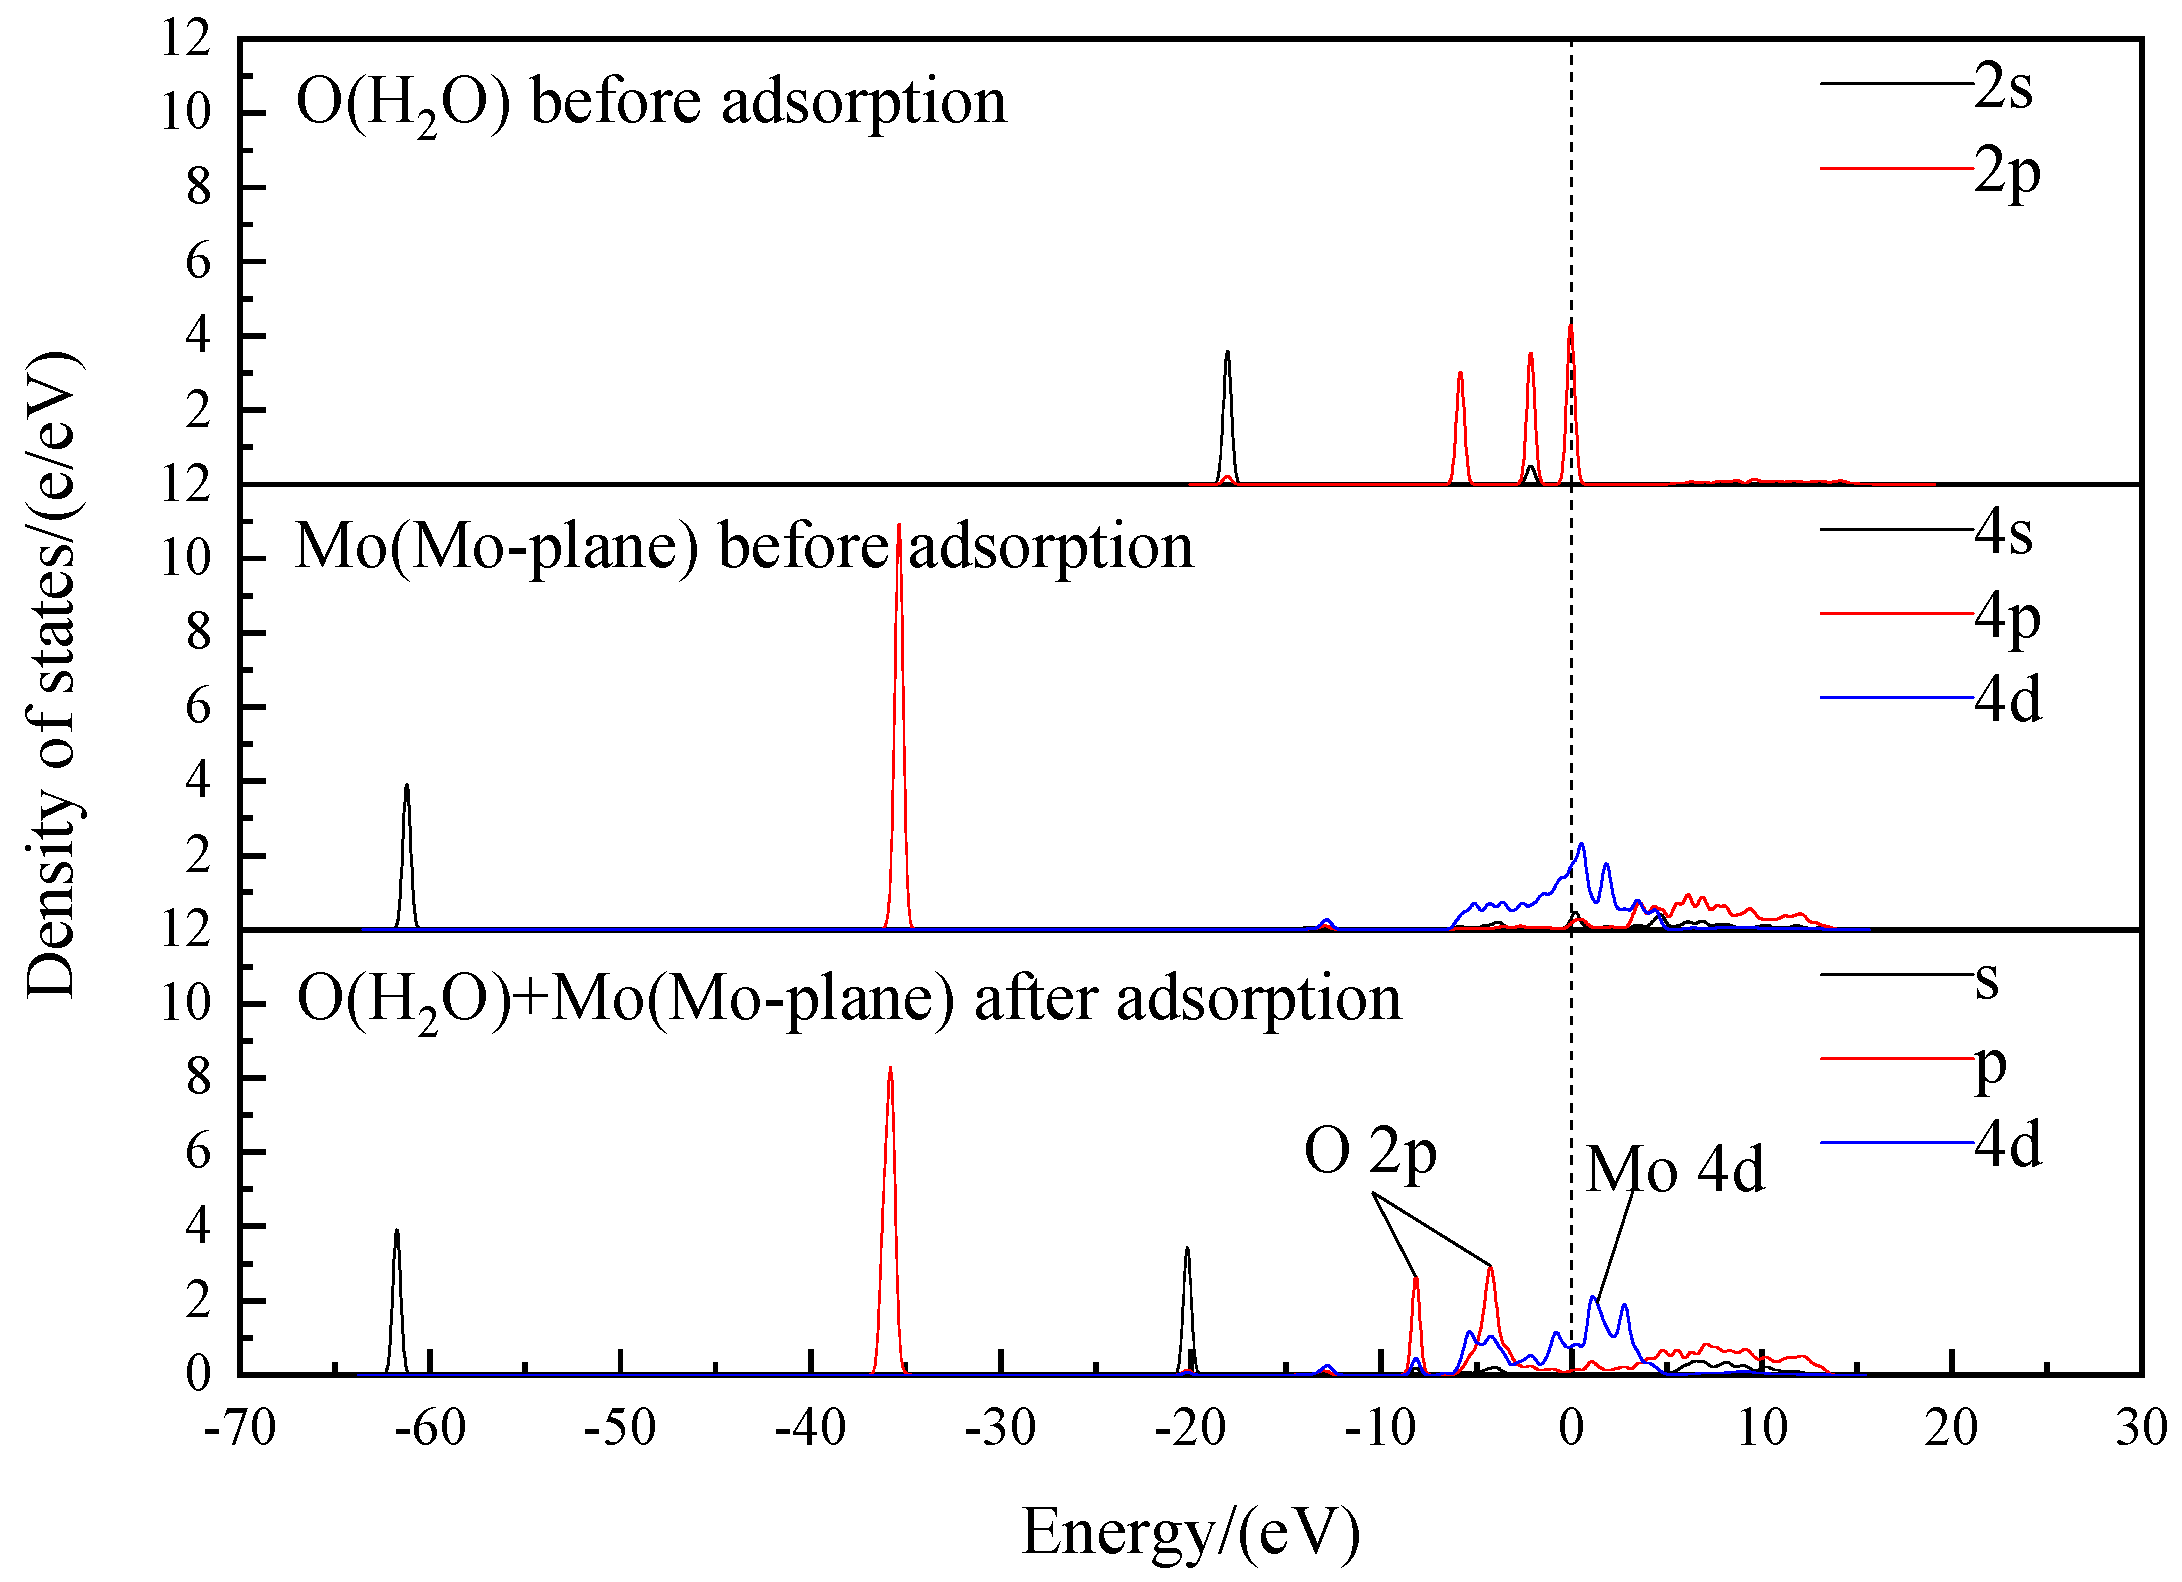
- State Density and Charge Transfer of H2O Adsorption Process
- (4)
- State Density and Charge Transfer of OH− Adsorption Process
4. Conclusions
- (1)
- With increasing pH of the pulp, the curve of molybdenite flotation recovery first tends to flatten out and then gradually decreases after pH above 7, the curve of the zeta potential of the molybdenite surface tends to decrease continuously, and the contact angle of MS100 tends to increase and then decrease. These indicate that the effect of pH on molybdenite flotation should be attributed to the adsorption behavior of the OH− on MS100. Both H2O and OH− can be adsorbed onto the MS100.
- (2)
- The adsorption energy of the H2O/OH− to the MS001 and MS100 is −8.61/288.30 kJ·mol−1 and −226.81/−302.44 kJ·mol−1. This indicates that H2O is weakly adsorbed on the MS001, while OH− is not. The adsorption energy of the OH− to the MS100 is much stronger than that of H2O.
- (3)
- The adsorption of H2O on MS100 is through electrostatic interaction/hydrogen bond between the O/H atom of H2O and the Mo/S atom of MS100. However, the adsorption of OH− on MS100 is achieved in two steps: the OH− ion is physically adsorbed on the MS100 by electrostatic interaction/hydrogen bonding between the O/H atom of OH− and the Mo/S atom of MS100; then, the OH− ion is further chemically adsorbed on the MS100 through the bonding of the O atom of OH− and the Mo atom of MS100, and reacts to form a hydroxy-molybdenum compound. This causes a significant reduction in the MS100 hydrophobicity and deteriorates the fine molybdenite flotation.
Supplementary Materials
Author Contributions
Funding
Data Availability Statement
Acknowledgments
Conflicts of Interest
References
- Liu, W.; Moran, C.J.; Vink, S. A review of the effect of water quality on flotation. Miner. Eng. 2013, 53, 91–100. [Google Scholar] [CrossRef]
- Park, C.H.; Jeon, H.S. The effect of sodium silicate as pH modifier and depressant in the froth flotation of molybdenite ores. Mater. Trans. 2010, 51, 1367–1369. [Google Scholar] [CrossRef]
- Qin, W.; Wu, J.; Jiao, F.; Zeng, J. Mechanism study on flotation separation of molybdenite from chalcocite using thioglycollic acid as depressant. Int. J. Min. Sci. Technol. 2017, 27, 1043–1049. [Google Scholar] [CrossRef]
- You, X.; Li, L.; Lyu, X. Flotation of molybdenite in the presence of microemulsified collector. Physicochem. Probl. Miner. Process. 2017, 53, 333–341. [Google Scholar]
- Zhang, W.; Tao, L.; Xun, L.; Qi, Z.; Pooley, S.; Sun, W.; Gao, Z. Improved flotation of molybdenite from talc using a selective reagent scheme. Miner. Eng. 2022, 176, 107324. [Google Scholar] [CrossRef]
- Lin, S.; Wang, C.; Liu, R.; Sun, W.; Jing, G. Surface characterization of molybdenite, bismuthinite, and pyrite to identify the influence of pH on the mineral floatability. Appl. Surf. Sci. 2022, 577, 151756. [Google Scholar] [CrossRef]
- Hao, J.; Liu, J.; Yu, Y.; Gao, H.; Qin, X.; Bai, X. Depressants for separation of chalcopyrite and molybdenite: Review and prospects. Miner. Eng. 2023, 201, 108209. [Google Scholar] [CrossRef]
- McClung, C.R. Molybdenite polytypism and its implications for processing and recovery: A geometallurgical-based case study from Bingham Canyon Mine, Utah. Miner. Metall. Process. 2016, 33, 149–154. [Google Scholar] [CrossRef]
- Dickinson, R.G.; Pauling, L. The crystal structure of molybdenite. J. Am. Chem. Soc. 1923, 45, 1466–1471. [Google Scholar] [CrossRef]
- Lu, Z.; Liu, Q.; Xu, Z.; Zeng, H. Probing Anisotropic Surface Properties of Molybdenite by Direct Force Measurements. Langmuir 2015, 31, 11409–11418. [Google Scholar] [CrossRef] [PubMed]
- Bentley, C.L.; Kang, M.; Maddar, F.M.; Li, F.; Walker, M.; Zhang, J.; Unwin, P.R. Electrochemical maps and movies of the hydrogen evolution reaction on natural crystals of molybdenite (MoS2): Basal vs. edge plane activity. Chem. Sci. 2017, 8, 6583–6593. [Google Scholar] [CrossRef] [PubMed]
- Castro, S.; Lopez-Valdivieso, A.; Laskowski, J.S. Review of the flotation of molybdenite. Part I: Surface properties and floatability. Int. J. Miner. Process. 2016, 148, 48–58. [Google Scholar] [CrossRef]
- Yang, B.; Song, S.; Lopez-Valdivieso, A. Effect of particle size on the contact angle of molybdenite powders. Min. Proc. Ext. Met. Rev. 2014, 35, 208–215. [Google Scholar] [CrossRef]
- Wan, H.; Yi, P.; Song, X.; Luukkanen, S.; Qu, J.; Yang, W.; Bu, X. Role of improving molybdenite flotation by using aromatic hydrocarbon collector in high-calcium water: A multiscale investigation. Miner. Eng. 2023, 191, 107984. [Google Scholar] [CrossRef]
- Chander, S.; Hogg, R.; Fuerstenau, D.W. Characterization of the wetting and dewetting behavior of powders. KONA Powder Part. J. 2007, 25, 56–75. [Google Scholar] [CrossRef]
- Ochs, M.; Vielle-Petit, L.; Wang, L.; Mallants, D.; Leterme, B. Additional Sorption Parameters for the Cementitious Barriers of a Near-surface Repository; ONDRAF/NIRAS: Brussels, Belgium, 2010. [Google Scholar]
- Krishnaswamy, P. Kinetics of the Aqueous Oxidation of Molybdenite and the Role of Crystal Anisotropy on the Electrochemical Mechanisms of the Process. Ph.D. Dissertation, University of California, Berkeley, CA, USA, 1981; pp. 11–12. [Google Scholar]


| Adsorbate | Surface | E surface + ion/kJ·mol−1 | E ion/kJ·mol−1 | E surface/kJ·mol−1 | ∆E/kJ·mol−1 |
|---|---|---|---|---|---|
| H2O | 001 | 46,312.59 | 471.93 | 5093.40 | −8.61 |
| 100 | 46,286.81 | 471.93 | 15,270.84 | −226.81 | |
| OH−/H+ | 001 | 46,309.51 | 471.93 | 5093.40 | 288.30 |
| 100 | 46,287.59 | 471.93 | 15,270.84 | −302.44 |
| The Adsorption Configuration | Bond | Population | Length/(nm) |
|---|---|---|---|
| H2O–MS001 | H1-S | 0.00 | 2.94672 |
| H2-S | 0.00 | 2.93816 | |
| H2O–MS100 | O-Mo | 0.10 | 2.25993 |
| H1-Mo | 0.16 | 2.70418 | |
| H2-Mo | 0.17 | 2.78119 | |
| H1-S1 | 0.09 | 2.34405 | |
| H1-S2 | 0.02 | 2.76602 | |
| H1-S3 | 0.01 | 2.98579 |
| The Adsorption Configuration | Bond | Population | Length/(nm) |
|---|---|---|---|
| OH−/H+–MS100 | O-Mo | 0.44 | 1.90191 |
| H1-Mo | 0.27 | 2.62442 | |
| H2-S1 | 0.72 | 1.36465 | |
| H2-S2 | 0.01 | 2.60470 | |
| H2-S3 | 0.00 | 2.59003 |
| Atomic | State | s | p | d | Population | Charge/(e) |
|---|---|---|---|---|---|---|
| H1 | Before | 0.47 | 0.00 | 0.00 | 0.47 | 0.53 |
| After | 0.51 | 0.00 | 0.00 | 0.51 | 0.49 | |
| H2 | Before | 0.47 | 0.00 | 0.00 | 0.47 | 0.53 |
| After | 0.51 | 0.00 | 0.00 | 0.51 | 0.49 | |
| S | Before | 1.86 | 4.16 | 0.00 | 6.02 | 0.02 |
| After | 1.85 | 4.18 | 0.00 | 6.03 | 0.03 |
| Atomic | State | s | p | d | Population | Charge/(e) |
|---|---|---|---|---|---|---|
| O | Before | 1.89 | 5.18 | 0.00 | 7.07 | 1.07 |
| After | 1.85 | 4.99 | 0.00 | 6.83 | 0.83 | |
| H1 | Before | 0.47 | 0.00 | 0.00 | 0.47 | 0.53 |
| After | 0.57 | 0.00 | 0.00 | 0.57 | 0.43 | |
| H2 | Before | 0.47 | 0.00 | 0.00 | 0.47 | 0.53 |
| After | 0.54 | 0.00 | 0.00 | 0.54 | 0.46 | |
| S1 | Before | 1.88 | 4.32 | 0.00 | 6.20 | 0.20 |
| After | 1.86 | 4.42 | 0.00 | 6.28 | 0.28 | |
| S2 | Before | 1.86 | 4.17 | 0.00 | 6.03 | 0.03 |
| After | 1.85 | 4.17 | 0.00 | 6.03 | 0.03 | |
| S3 | Before | 1.86 | 4.17 | 0.00 | 6.03 | 0.03 |
| After | 1.85 | 4.15 | 0.00 | 6.00 | 0.00 | |
| Mo | Before | 2.44 | 6.26 | 5.12 | 13.82 | 0.18 |
| After | 2.43 | 6.29 | 5.04 | 13.76 | 0.24 |
| Atomic | State | s | p | d | Population | Charge/(e) |
|---|---|---|---|---|---|---|
| O | Before | 1.89 | 5.18 | 0.00 | 7.07 | 1.07 |
| After | 1.86 | 4.93 | 0.00 | 6.78 | 0.78 | |
| H1 | Before | 0.47 | 0.00 | 0.00 | 0.47 | 0.53 |
| After | 0.57 | 0.00 | 0.00 | 0.57 | 0.43 | |
| H2 | Before | 0.47 | 0.00 | 0.00 | 0.47 | 0.53 |
| After | 0.95 | 0.00 | 0.00 | 0.95 | 0.05 | |
| S1 | Before | 1.89 | 4.32 | 0.00 | 6.20 | 0.20 |
| After | 1.85 | 4.22 | 0.00 | 6.08 | 0.08 | |
| S2 | Before | 1.86 | 4.17 | 0.00 | 6.03 | 0.03 |
| After | 1.86 | 4.20 | 0.00 | 6.05 | 0.05 | |
| S3 | Before | 1.86 | 4.17 | 0.00 | 6.03 | 0.03 |
| After | 1.85 | 4.23 | 0.00 | 6.09 | 0.09 | |
| Mo | Before | 2.44 | 6.26 | 5.12 | 13.82 | 0.18 |
| After | 2.43 | 6.32 | 4.82 | 13.57 | 0.43 |
Disclaimer/Publisher’s Note: The statements, opinions and data contained in all publications are solely those of the individual author(s) and contributor(s) and not of MDPI and/or the editor(s). MDPI and/or the editor(s) disclaim responsibility for any injury to people or property resulting from any ideas, methods, instructions or products referred to in the content. |
© 2024 by the authors. Licensee MDPI, Basel, Switzerland. This article is an open access article distributed under the terms and conditions of the Creative Commons Attribution (CC BY) license (https://creativecommons.org/licenses/by/4.0/).
Share and Cite
Wang, E.; Wan, H.; Qu, J.; Yi, P.; Bu, X. Inhibiting Mechanism of High pH on Molybdenite Flotation. An Experimental and DFT Study. Minerals 2024, 14, 663. https://doi.org/10.3390/min14070663
Wang E, Wan H, Qu J, Yi P, Bu X. Inhibiting Mechanism of High pH on Molybdenite Flotation. An Experimental and DFT Study. Minerals. 2024; 14(7):663. https://doi.org/10.3390/min14070663
Chicago/Turabian StyleWang, Enxiang, He Wan, Juanping Qu, Peng Yi, and Xianzhong Bu. 2024. "Inhibiting Mechanism of High pH on Molybdenite Flotation. An Experimental and DFT Study" Minerals 14, no. 7: 663. https://doi.org/10.3390/min14070663
APA StyleWang, E., Wan, H., Qu, J., Yi, P., & Bu, X. (2024). Inhibiting Mechanism of High pH on Molybdenite Flotation. An Experimental and DFT Study. Minerals, 14(7), 663. https://doi.org/10.3390/min14070663