Article

Soil Geochemistry Combined with Particulate Gold Microchemistry Provides Evidence of Eluvial Gold Genesis and Anthropogenic Hg Use in Eastern Cameroon Goldfields

by
Akumbom Vishiti
1,2,*,
Cheo Emmanuel Suh
3,4,
Ralain Bryan Ngatcha
4,5,
Erik B. Melchiorre
6,
Elisha Mutum Shemang
7,
Benjamin Odey Omang
8,
Terence Cho Ngang
4,
Fernando Castro Valdez
6 and
Sharila Gillian Sekem
4
1
Department of Civil Engineering, The University Institute of Technology (IUT), University of Douala, Douala P.O. Box 8698, Littoral Region, Cameroon
2
Laboratory of Geosciences, Natural Resources and Environment, Department of Earth Sciences, Faculty of Science, University of Douala, Douala P.O. Box 24157, Littoral Region, Cameroon
3
Economic Geology Unit, Department of Geology, University of Buea, Buea P.O. Box 63, South West Region, Cameroon
4
Department of Geology, Mining and Environmental Science, The University of Bamenda, Bambili P.O. Box 39, North West Region, Cameroon
5
Department of Geology, Life and Earth Sciences Institute (PAULESI), Pan African University, Ibadan 200132, Oyo State, Nigeria
6
Department of Geological Sciences, California State University, 5500 University Parkway, San Bernardino, CA 92407, USA
7
Department of Earth and Environmental Sciences, Botswana International University of Science and Technology, Private Bag 16, Palapye 10071, Botswana
8
Department of Geology, University of Calabar, Calabar PMB 1115, Cross River State, Nigeria
*
Author to whom correspondence should be addressed.
Minerals 2024, 14(6), 567; https://doi.org/10.3390/min14060567
Submission received: 16 April 2024 / Revised: 22 May 2024 / Accepted: 22 May 2024 / Published: 29 May 2024

Abstract

:
The identification of trace element anomalies in soils has been proven to assist semi-mechanized small-scale gold operations. This study employs soil geochemistry combined with the microchemical signature of particulate gold from the Batouri goldfield to (1) vector possible gold-endowed lithologies introducing particulate gold into the overlying regolith, and (2) assess anthropogenic Hg used in purification of both primary and alluvial/eluvial gold by artisans. The soil geochemistry shows irregularly distributed anomalies of elevated Cu especially in the saprolite soil layer. Whereas in the lateritic soil layer, a Au-Ag-Hg metal association is reported for the first time in this gold district and could be linked to anthropogenic Hg used in gold recovery. Particulate gold recovered from the soil varies in shape from euhedral and irregular to sub-rounded, indicating a proximal lode source. The gold grains range in size from nano-particles to >300 µm and are Au-Ag alloys. The gold particles reveal inclusions such as quartz, silicate, zircon and ilmenite suggesting that the grains were dislodged from quartz veins within the granitic basement. Systematic variation in the microchemical signature of the gold grains is suggestive of spatial and temporal evolution of the mineralizing fluid. These results are consistent with investigations from similar geologic settings worldwide and validate the combined utility of gold fingerprinting and pathfinder elements in soil to examine deposit genesis in other gold districts globally.

Graphical Abstract

1. Introduction

Historically, many small scale and artisanal gold mining regions have produced significant negative environmental impacts [1,2]. In fact, soil contamination represents a major environmental problem in gold mining sites [3]. Contaminants such as metals and metalloids in soils typically originate from geogenic sources. However, they could also result from anthropogenic activities especially with the occurrence of Acid Mine Drainage (AMD) phenomenon [4] and the use of hazardous products in the gold extraction process such as sulfuric acids mercury and arsenic by gold miners [2,5,6]. In some regions, these impacts continue to the present day. This is exacerbated in jurisdictions where the regulatory framework governing toxic metal use in gold processing is weak. Such is the case of the eastern Cameroon goldfield, where new small scale gold mining pits are being opened almost every year. This has raised the area’s worth and potential for gold exploration. In the south eastern region of Cameroon where the Batouri goldfield is located, gold production began in 1934 [7]. Primary gold mineralization in the Batouri goldfield is inferred to be hosted in quartz veins in wide brittle/ductile shear zones and Neoproterozoic granites, and it is likely to be buried in deeper crustal levels [8,9,10]. However, uplift, weathering and erosion may have brought the mineralization close to the surface [8,9,10]. Moreover, supergene processes such as weathering, erosion and sedimentation can modify primary gold resources [11,12]. Secondary gold resources in particular result primarily from the physical weathering of gold from primary lode sources [13,14]. Deep chemical weathering and laterite formation may further mobilize and concentrate these physically weathered gold particles [15]. This chemical weathering includes a combination of remobilization through dissolution–re-precipitation, grain coarsening and differential chemical weathering that produces gold-rich grain rims through the depletion of silver from the gold alloy [16,17,18]. According to [12], gold resources in the weathering blanket are often economically profitable as they present easily accessible targets since they are composed of poorly consolidated material that is readily mineable. Several models postulate that one or two mushroom-shaped dispersion zones from the mineralized vein may be present in deep weathering profiles where gold is redistributed. In lateritic residuum and the upper part of the mottled zone in humid and tropical rainforest environments, a gold mineralization halo is often observed (e.g., [19]). Gold dissolution by acidic and saline groundwater and re-precipitation farther in the saprolite layer can be related to post laterite remobilization in semi-arid environments [20]. The liberated gold from the primary sources migrates along various pathways as gold chloride and thiosulfate complexes and are dispersed by complex mechanisms into the soil horizons [21].
In areas such as Batouri, which is characterized by a thick weathering cover developed over a range of granitic basement rock lithologies truncated by quartz veins, understanding the resulting secondary dispersion trend in the soil is vital in the search for primary sources concealed by the overburden. The determination of element associations and distribution trends can be performed through integrated geochemical data analysis and interpretation of textural properties of the hypogene mineralization. However, soil geochemistry applied to gold exploration can be challenging owing to the fact that native gold is chemically and physically resistant, suggesting that gold dispersion in the surficial environment occurs mainly in the particulate form [22] or in localized microbial biofilms as nanoparticulate gold [23]. New mineral leases are legally accessible in the eastern part of the Batouri gold district, necessitating the need for identification of gold-rich horizons in the regolith through data collection and deposit genesis models.
In this geochemical study, trace elements in the soils are measured to identify abnormally elevated values which can guide exploration and provide environmental geochemical assessment. Furthermore, gold particles from various soil horizons were investigated physically and chemically to identify differences in primary gold particle composition and composition of gold particles tainted by anthropogenic activities.

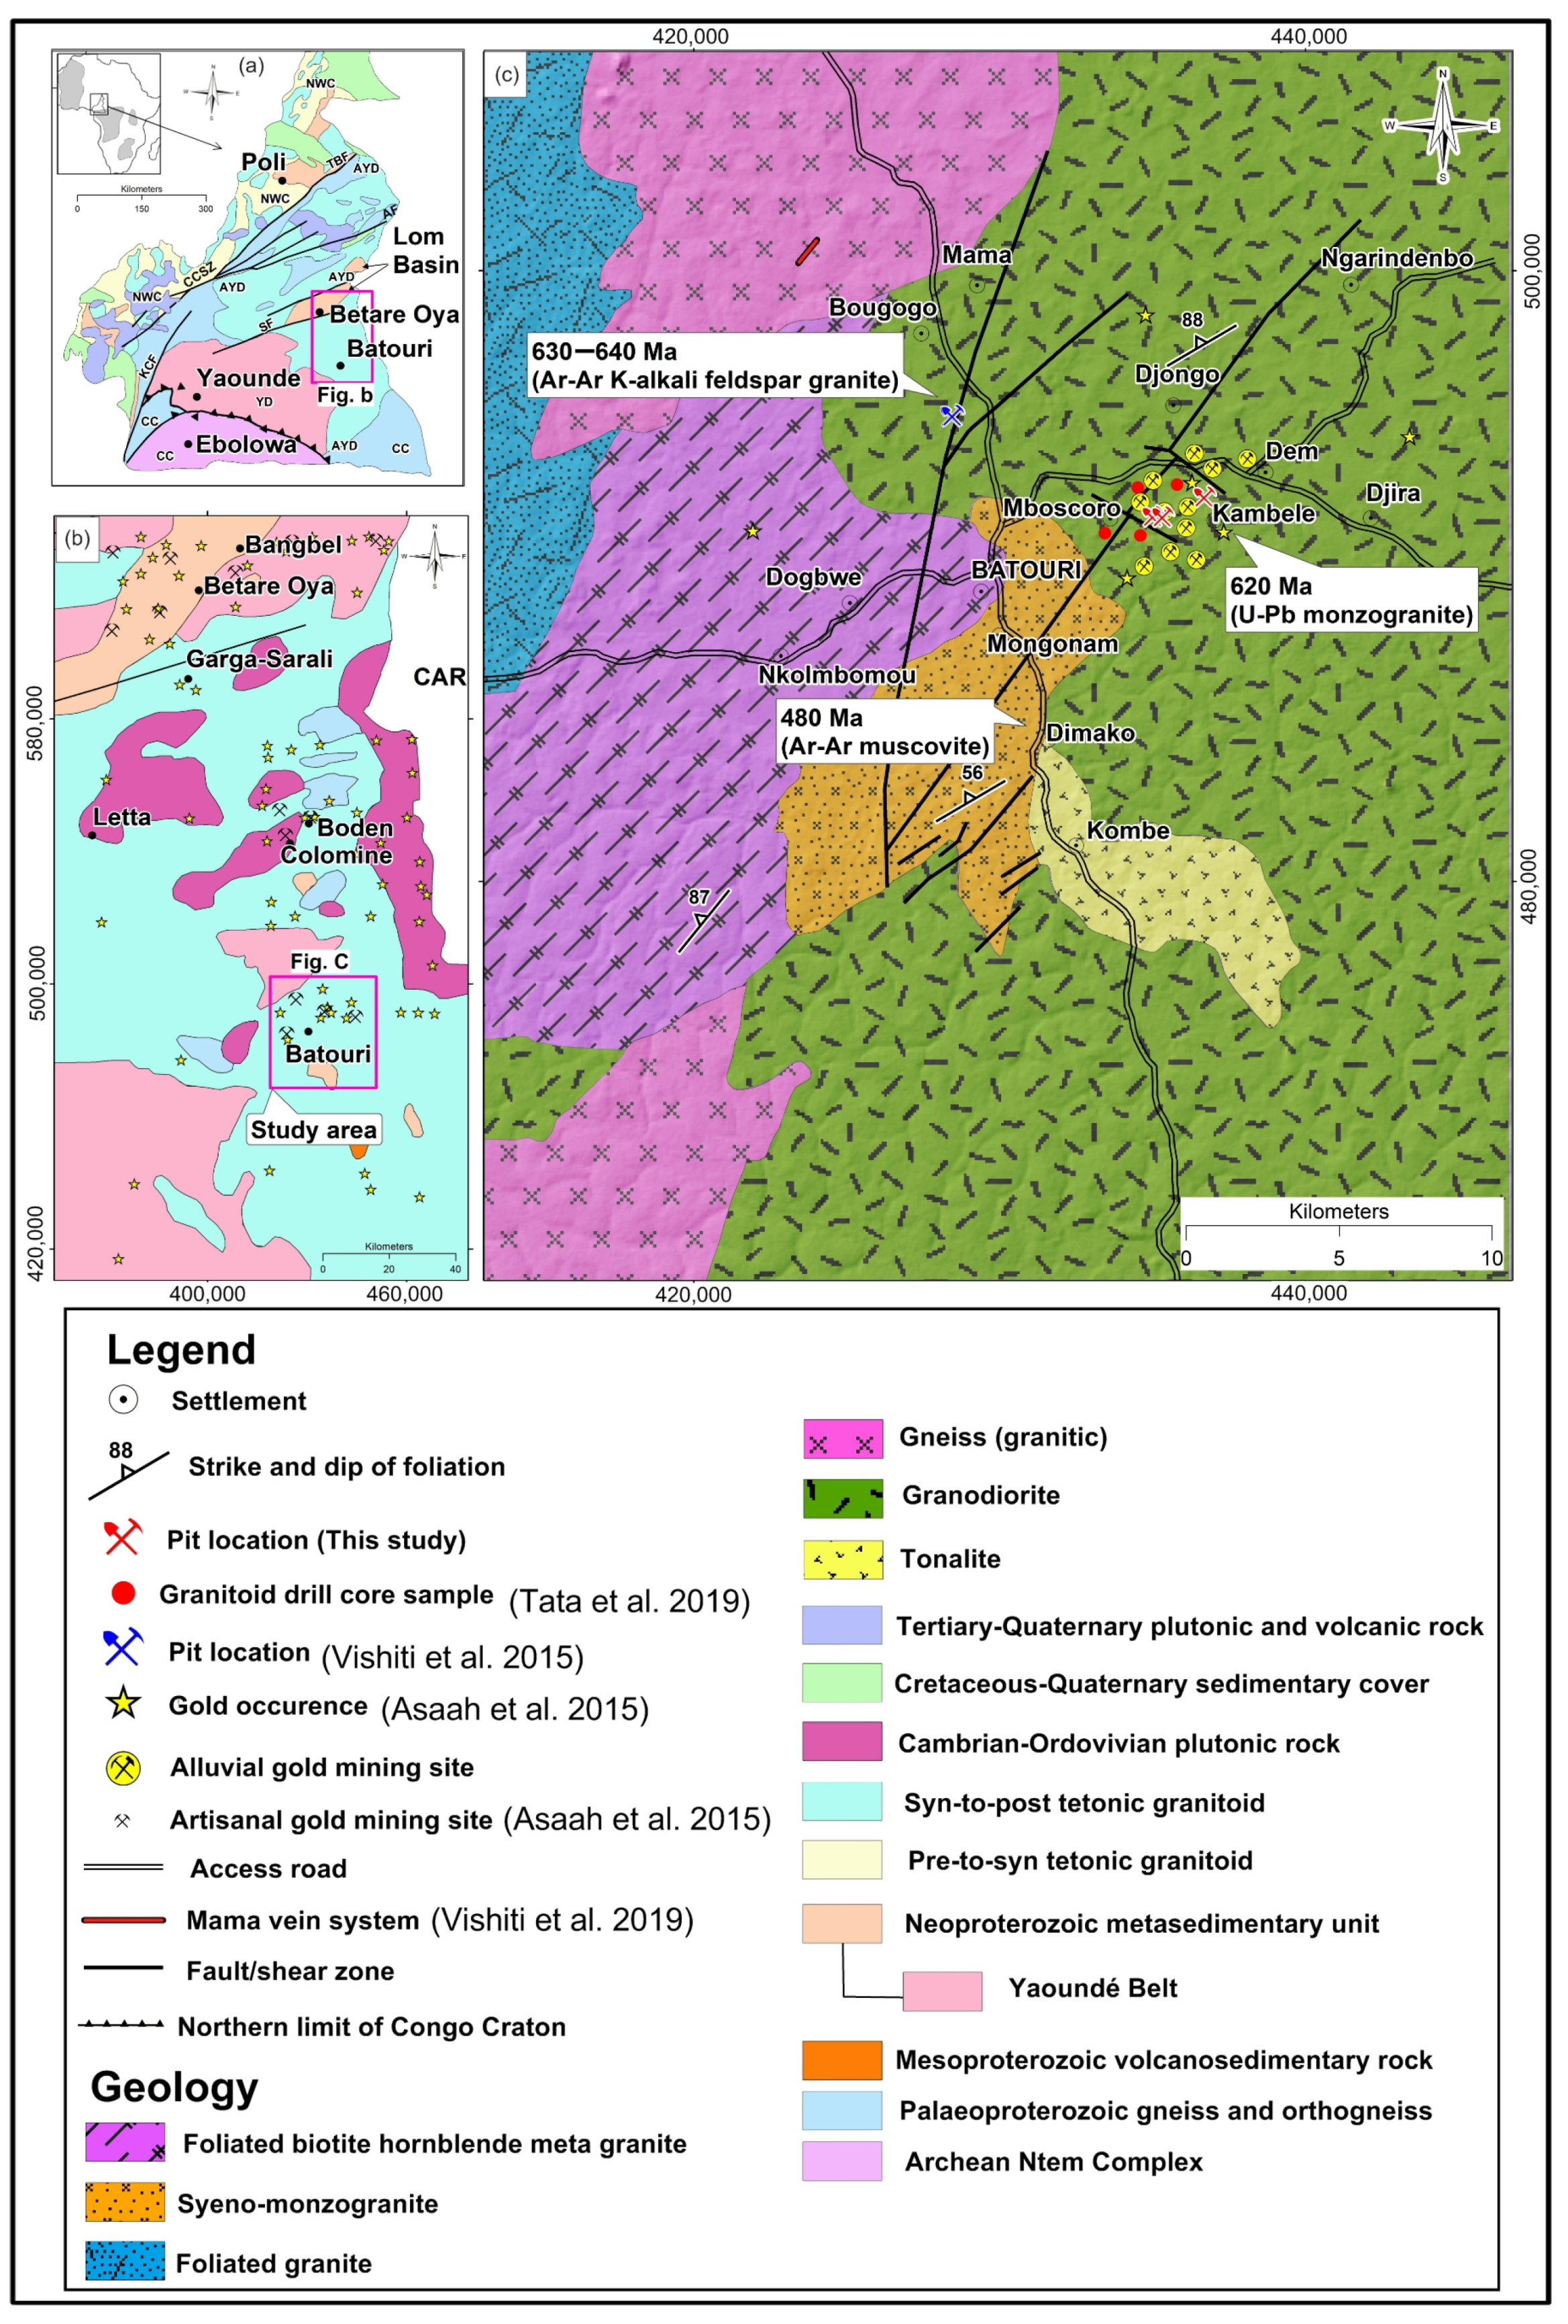
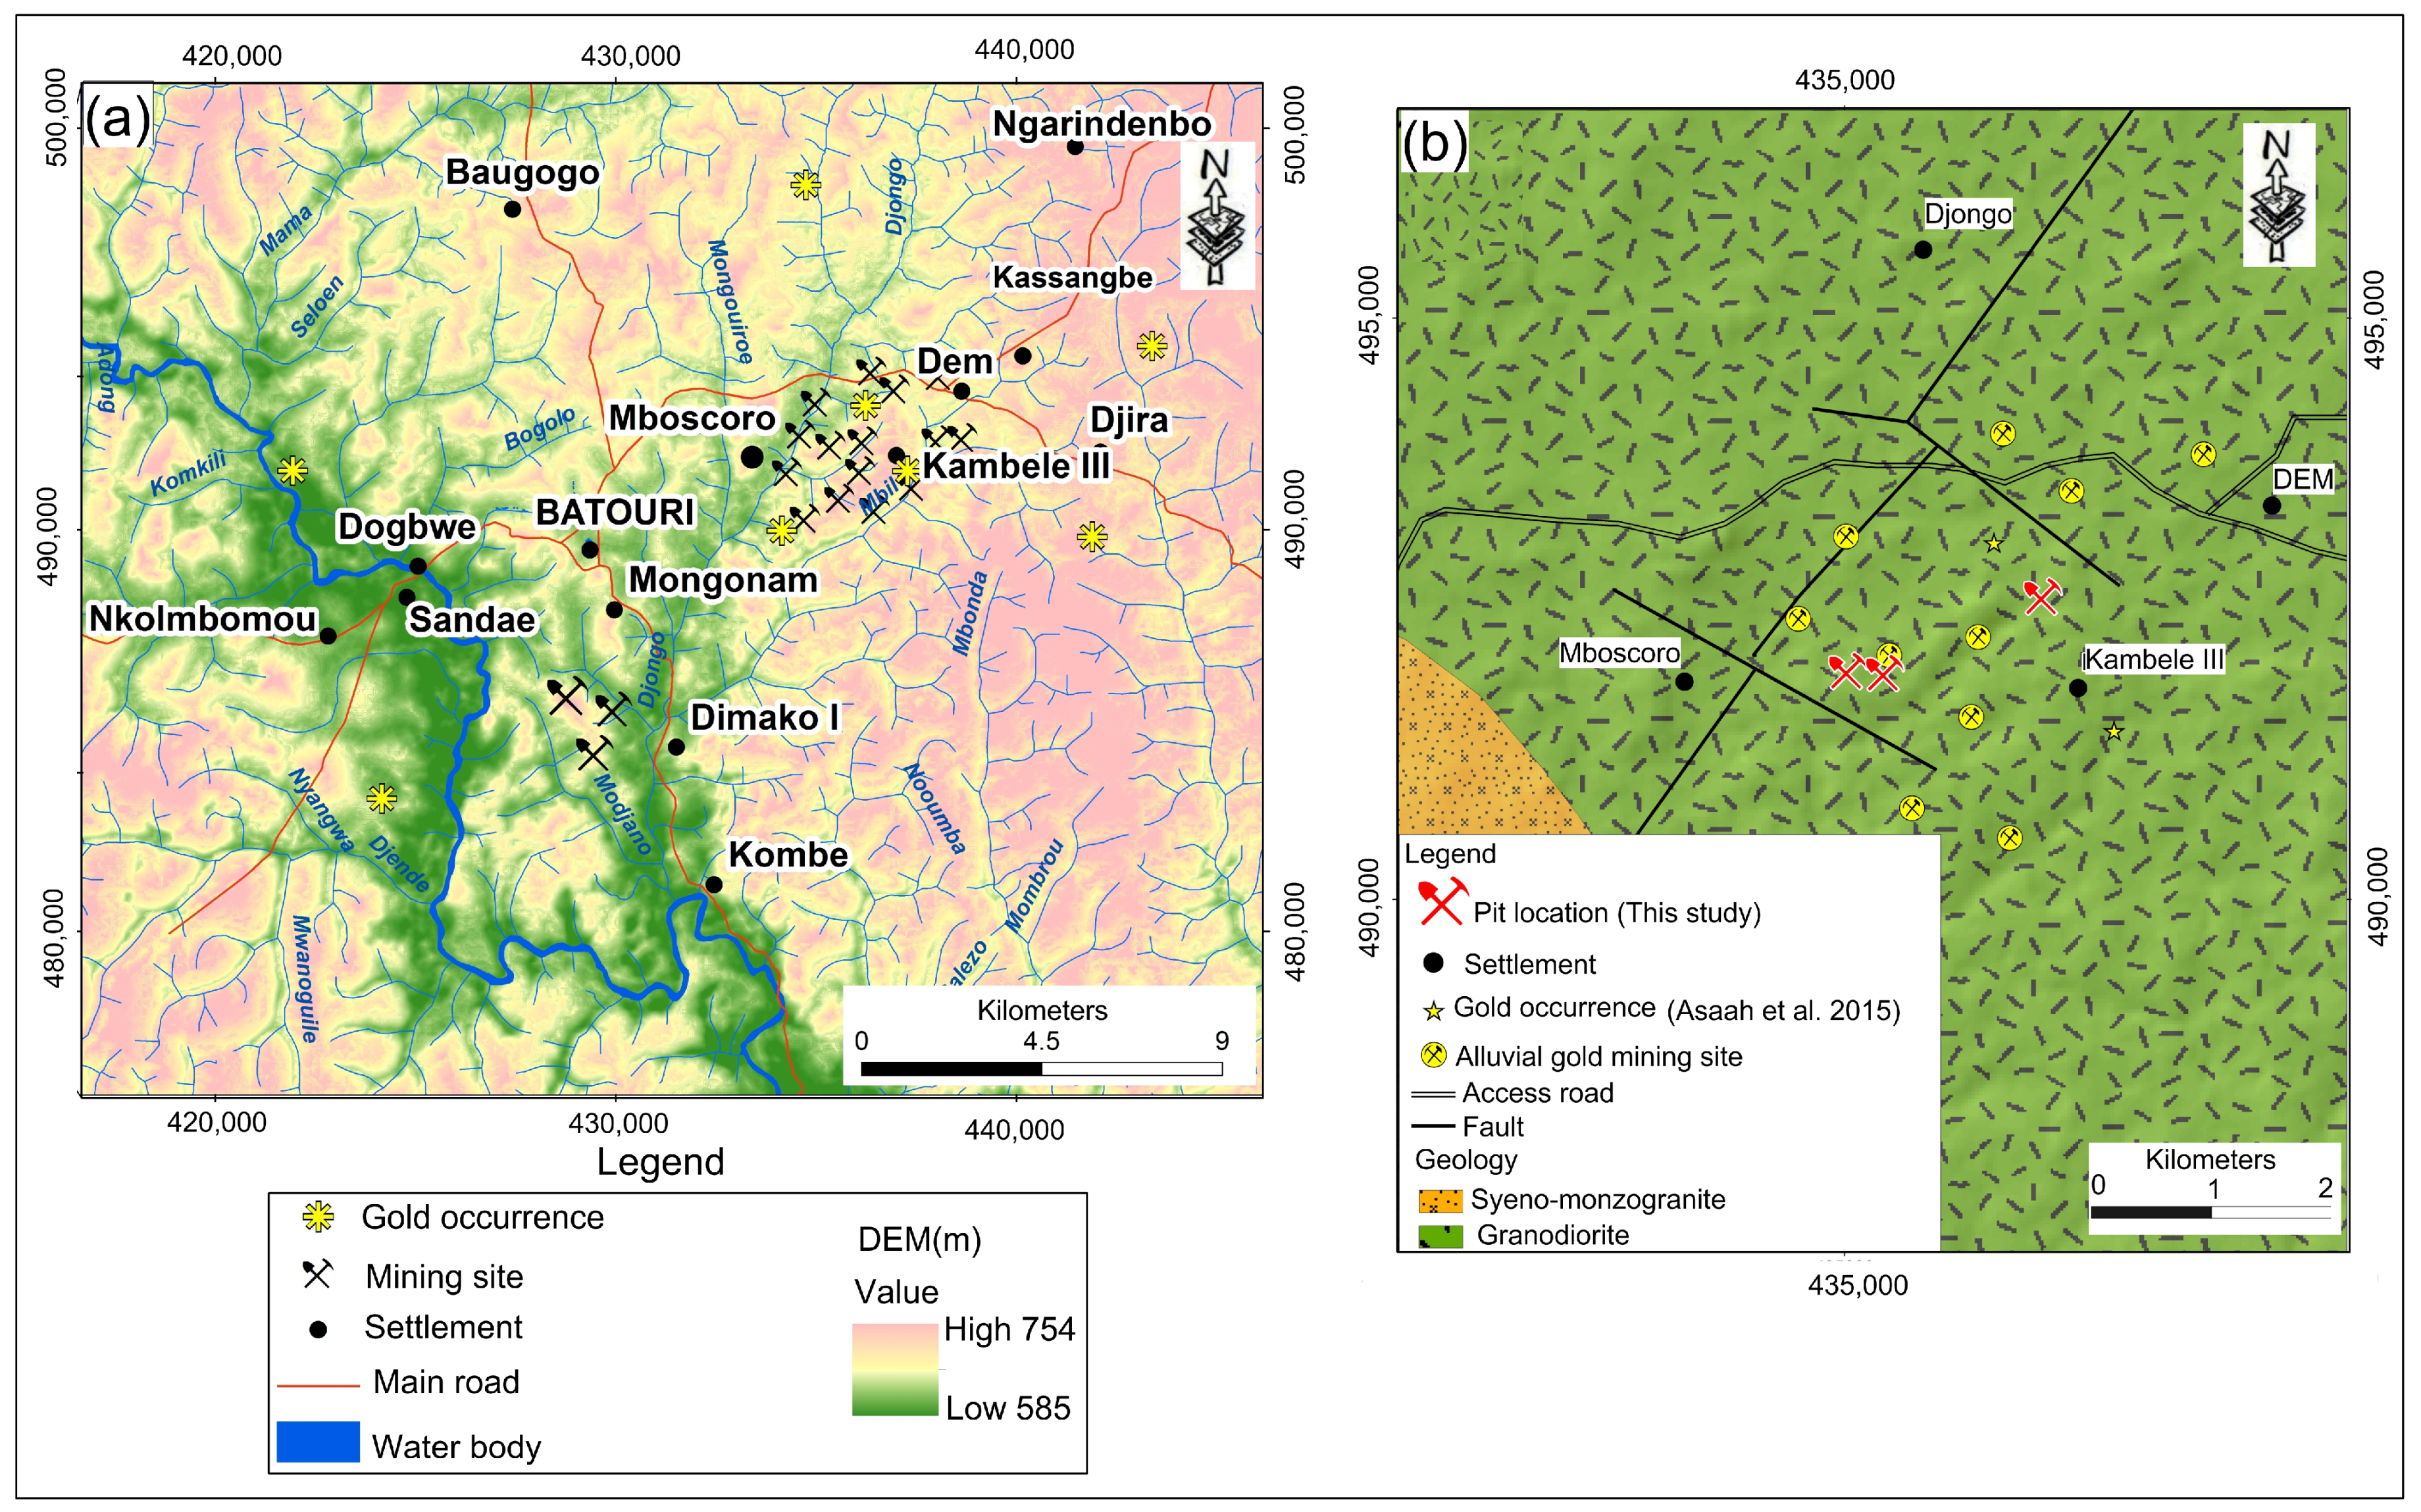
2. Regional and Local Geology

Batouri is a segment of the Adamawa-Yadé geological domain (AYD; Figure 1), which in itself is an integral part of the Neoproterozoic Fold Belt of Cameroon (NFBC) [24,25]. The NFBC developed due to the convergence and eventual collision of three crustally stable blocks: the Congo–São Francisco Craton, the West African Craton [24] and the Sahara metacraton.
The region is therefore dominated by translational tectonics evidenced by strike-slip shear zones defining a zone of sub-horizontal deformation termed the Central Cameroon Shear Zone (CCSZ). Most of the shear zones have NNE-SSW to ENE-WSW strike patterns. The CCSZ splays into a number of anastomosing networks of faults that include the Adamawa fault and associated brittle structures depicted in Figure 1a [26,28]. According to [24,25,29], the AYD experienced polyphase deformation through to the Pan African event. Consequently, lithologic units within the domain bear pre-tectonic, syn-tectonic and post-tectonic imprints. These are largely high-K, calc-alkaline rocks [9,10,30,31] interspersed with low- to medium-grade metamorphic rocks of volcano–sedimentary protoliths [32,33,34].
Hypogene gold in the Batouri area is linked to quartz veins hosted by various granitic facies [9,10] that show evidence of pervasive alteration by crustal fluid circulation [8,9,10,35]. Gold is either dispersed in the quartz matrix or confined as stringers along foliations in the granites [8,9,10]. The gold grades within the granite alteration halo vary from 2 ppm to 103 ppm [8,9,13,14,35,36]. The granites are subduction-related and 640–620 Ma old [10], similar to those farther afield in the AYD [30,31,34,35,37] and southern Chad [38]. This class of granite-related gold deposits contributes to about 32% of the world’s gold reserve [39,40,41,42,43]. Artisanal gold mining has been ongoing in the Batouri goldfield (Figure 1b) since the 1930s [7]. At the moment, the indigenous people and multinational companies mine gold using artisanal and semi-mechanical techniques. Typically, mining for gold is performed right on river banks, in quartz veins and on the weathering blanket, resulting in diverse environmental consequences (Figure 2).

3. Materials and Methods

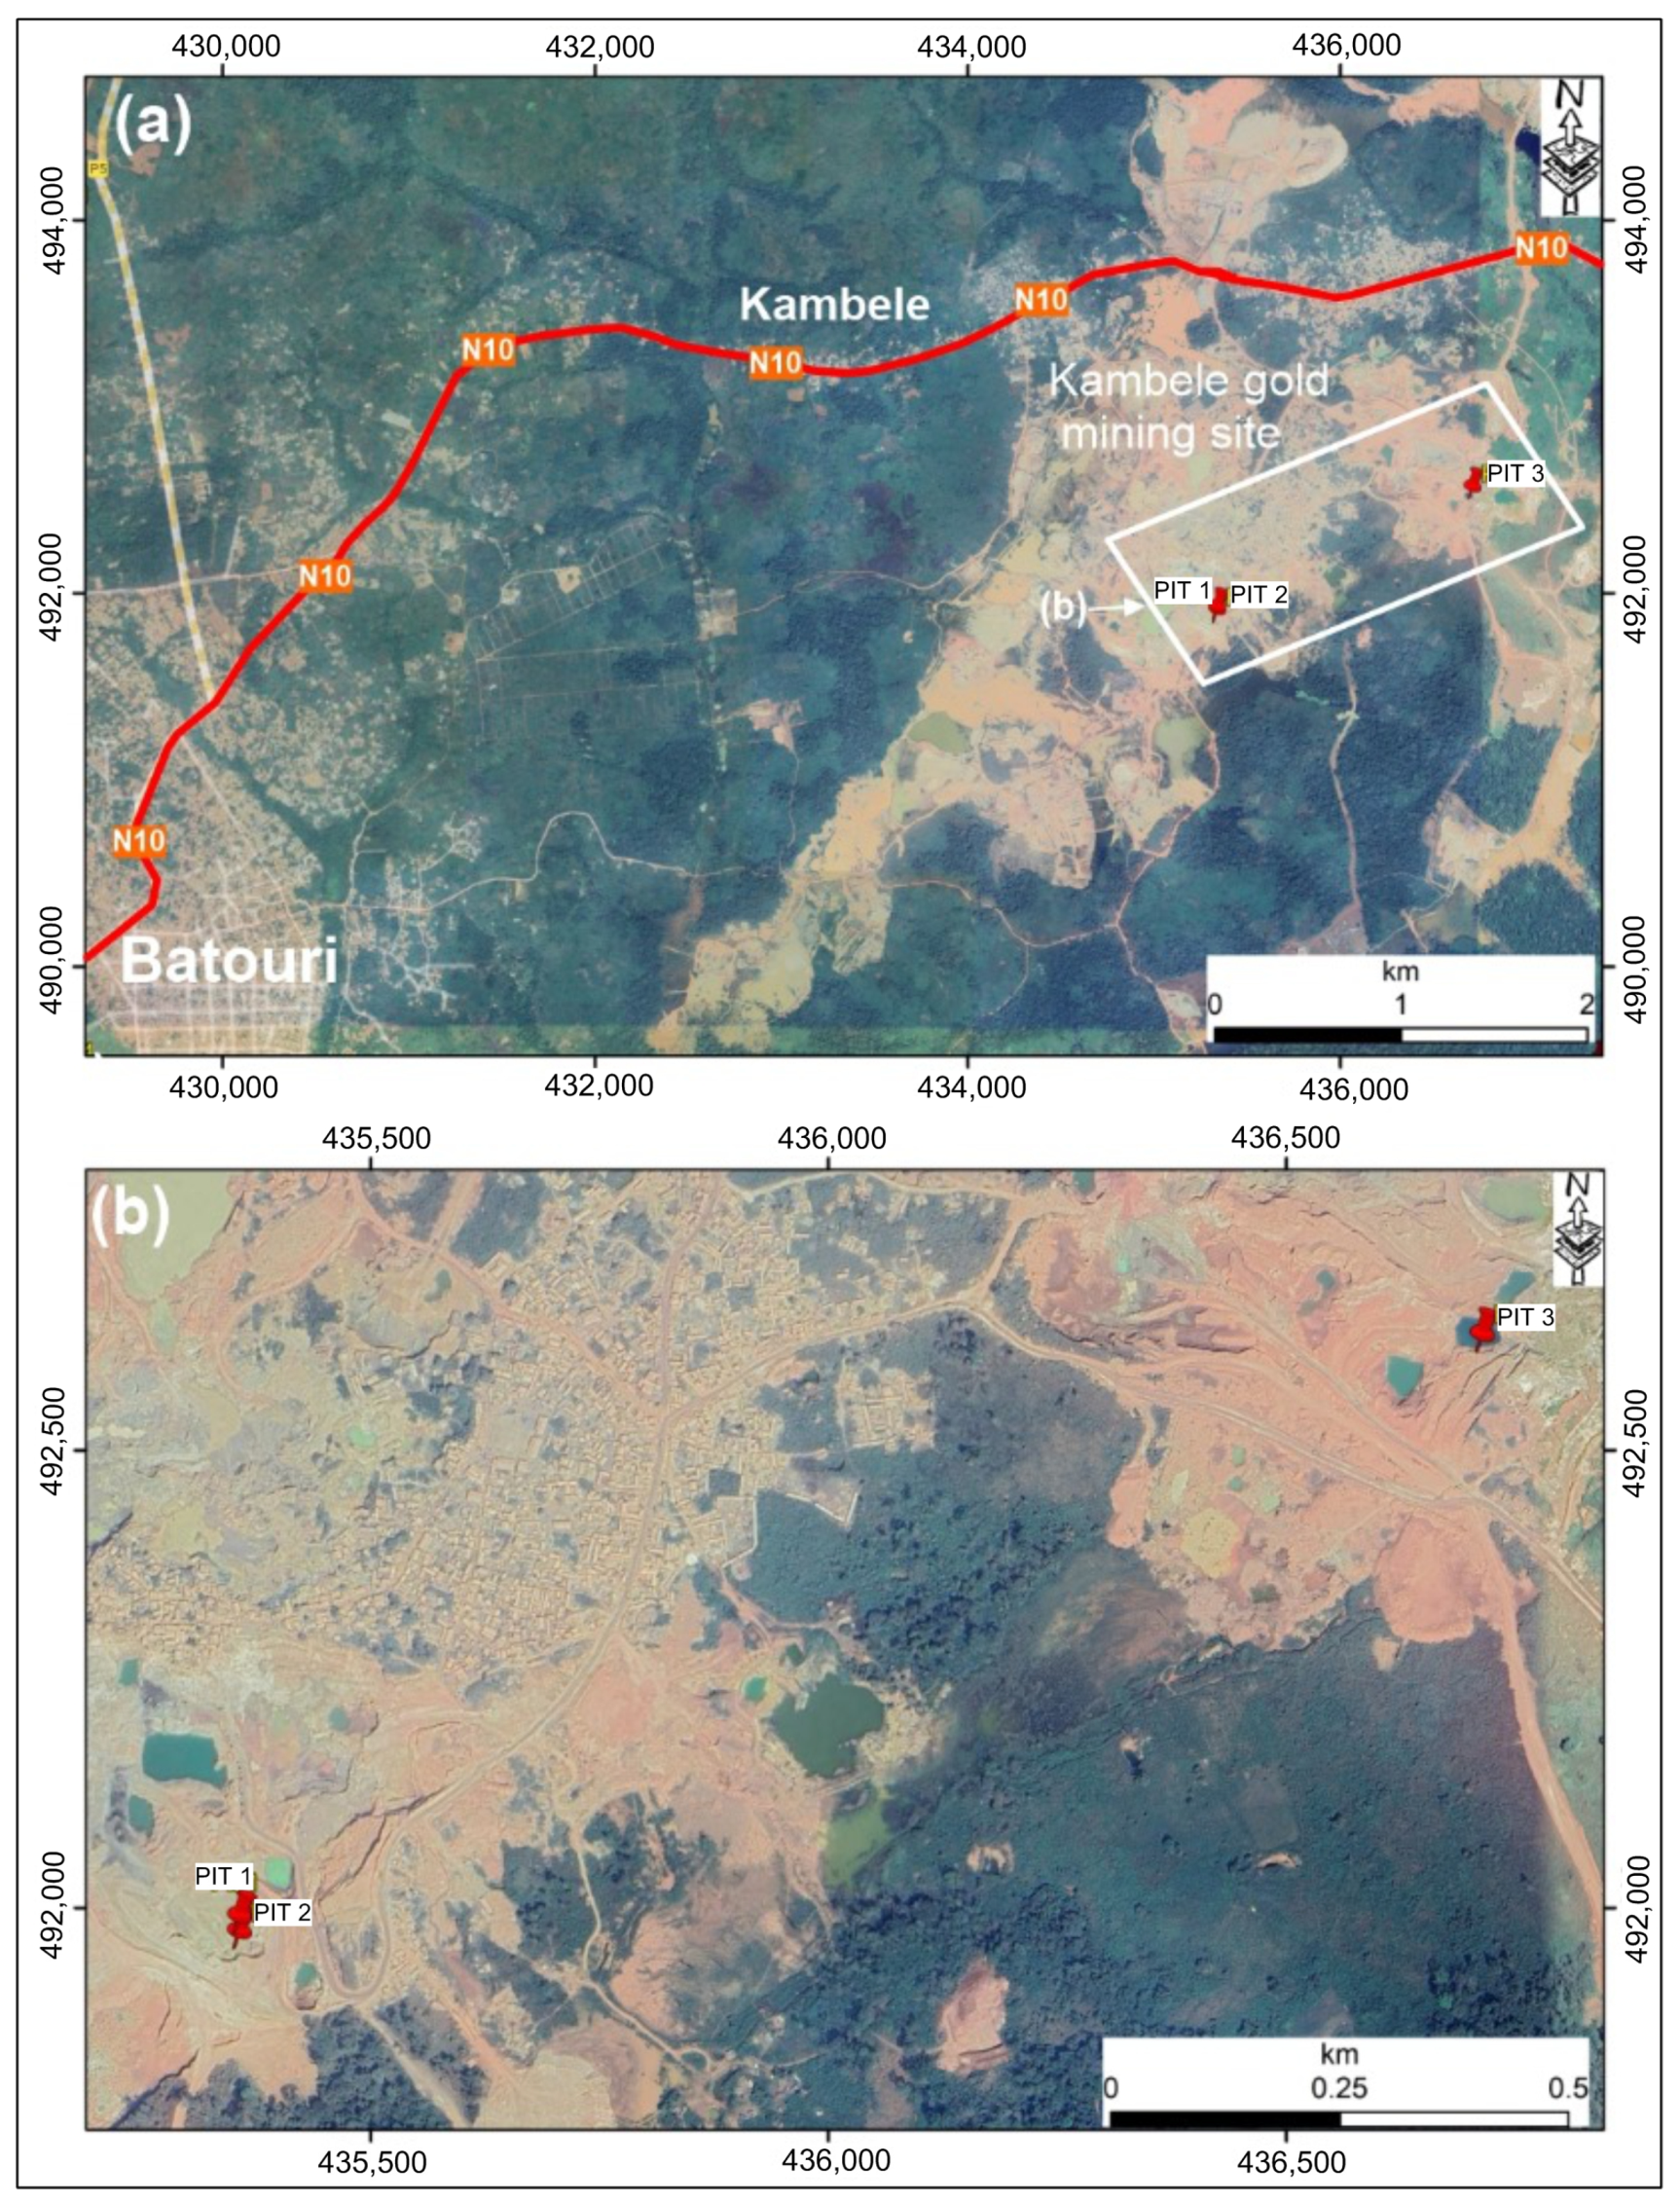
3.1. Sample Collection

The Batouri goldfield has experienced a flurry of gold exploration and exploitation activities by artisans in the past two decades (Figure 3a). At its eastern limit, new artisanal mining sites and mineral leases are becoming available each year. Samples used in this study are principally soils obtained from three (03) exploration pits (Figure 3b and Figure 4) sunk down to the bedrock and the deepest pit was 21 m deep. This exposed soil horizons that were subsequently carefully logged and sampled (Figure 4). Pit logging involved identifying the various soil layers using features such as layer thickness, color, texture and structure. Each layer was then sampled separately by chipping along the walls of the pit in order to obtain a representative sample (Figure 4d). Each sample collected through this channel chip sampling method was thoroughly mixed, made into a cone and quartered for a microchemical analysis and geochemistry.

3.2. Panning, Gold Grain Morphology and Microchemical Characterization

Subsamples of 25% by weight from the pits were processed by panning to obtain a heavy mineral concentrate containing particulate gold. Gold particles (50) from the overburden examined in this study were recovered from the saprock in PIT01 at a depth between 13 and 20 m, the saprolite layer of PIT03 at a depth from 13 to 21 m and the lateritic layer of the same pit at depths less than 4 m (Figure 5). The individual gold particles were then handpicked under a binocular microscope. Panning of the other horizons did not yield gold particles.
Gold grains mounted in epoxy resin were polished down to a 0.3 µm grit to expose grain interiors, following the method described in [44]. For grain morphological study, a Fisher-Phenom XL scanning electron microprobe (SEM) was used to generate secondary electron (SE) and backscatter electron (BSE) images at the California State University, San Bernardino, USA. The instrument was operated with an acceleration voltage of 15 kV. Furthermore, scanning electron microprobe (SEM) imaging, mapping and an energy dispersive spectroscopy (EDS) analysis of the gold particles were performed with the same instrument as documented in [44]. The composition of the gold grains from the concentrates was determined using an additional electron microprobe analyzer equipped with wavelength dispersive spectrometry (WDS). The WDS was calibrated against a set of purchased house standards of gold–silver–copper alloy metals prior to gold grain analysis. The error associated with the trace element analyses is less than ±0.2 wt.%. A laboratory standard was run after every 10 analyses to ensure quality control on the data. The gold fineness was calculated using the formula Au × 1000/Ag + Au [45].

3.3. Bulk Geochemistry

The second quarter of the soil sample was manually mixed thoroughly to yield a homogenous sample (~4 kg each). The homogenized samples were then quartered. For each 1 kg of sample, 250 g were pulverized and about 50 g of the powder reserved for geochemical analysis. The stream sediment and soil samples for geochemical analysis were shipped to the ACME analytical Laboratories, Vancouver, BC, Canada. A 0.5 g sample of powder quartered from the samples collected from the various layers in the pits was analyzed for Au +53 elements using the inductively coupled plasma mass spectrometry (ICP-MS) technique. The analytical technique permits a detection limit of 0.2 ppb for Au. Randomly selected samples were analyzed twice for quality control, while blanks and in-house (SAND-VAN) blanks were used to correct for any aliquot impurity. The DSII and OREAS International Standards were used in calibrating the equipment. While the major elements show detection limits that range from 0.001 to 0.02 wt.%, the trace element reveals limits of detection that vary between 0.0002 and 20 ppm. The geochemical trends during weathering were determined as a function of the degree of chemical weathering using the chemical index of alteration (CIA). The CIA was calculated using the method proposed by [46] (Al2O3/(Al2O3 + CaO + Na2O + K2O) × 100). The mass balance method was used to further demonstrate chemical changes between the various layers. Element gains and losses were calculated using the immobile element method of [47] with TiO2 as the least mobile element. The mass change for a given element in an altered rock is calculated using the following equation:
∆CTiO2.J = 100 × [(CJ.A/CJ.F)/(CTiO2.A/CTiO2.F)] − 1
where CJ.A is the concentration of the element in the altered rock, CJ.F is the concentration of the element in the fresh/parent rock. Chemical variations in the average concentration of elements in the regolith were determined using the Isocon plot of [48]. The composition of the average fresh granite from [9] was used as a reference for the mass balance calculation.

4. Results

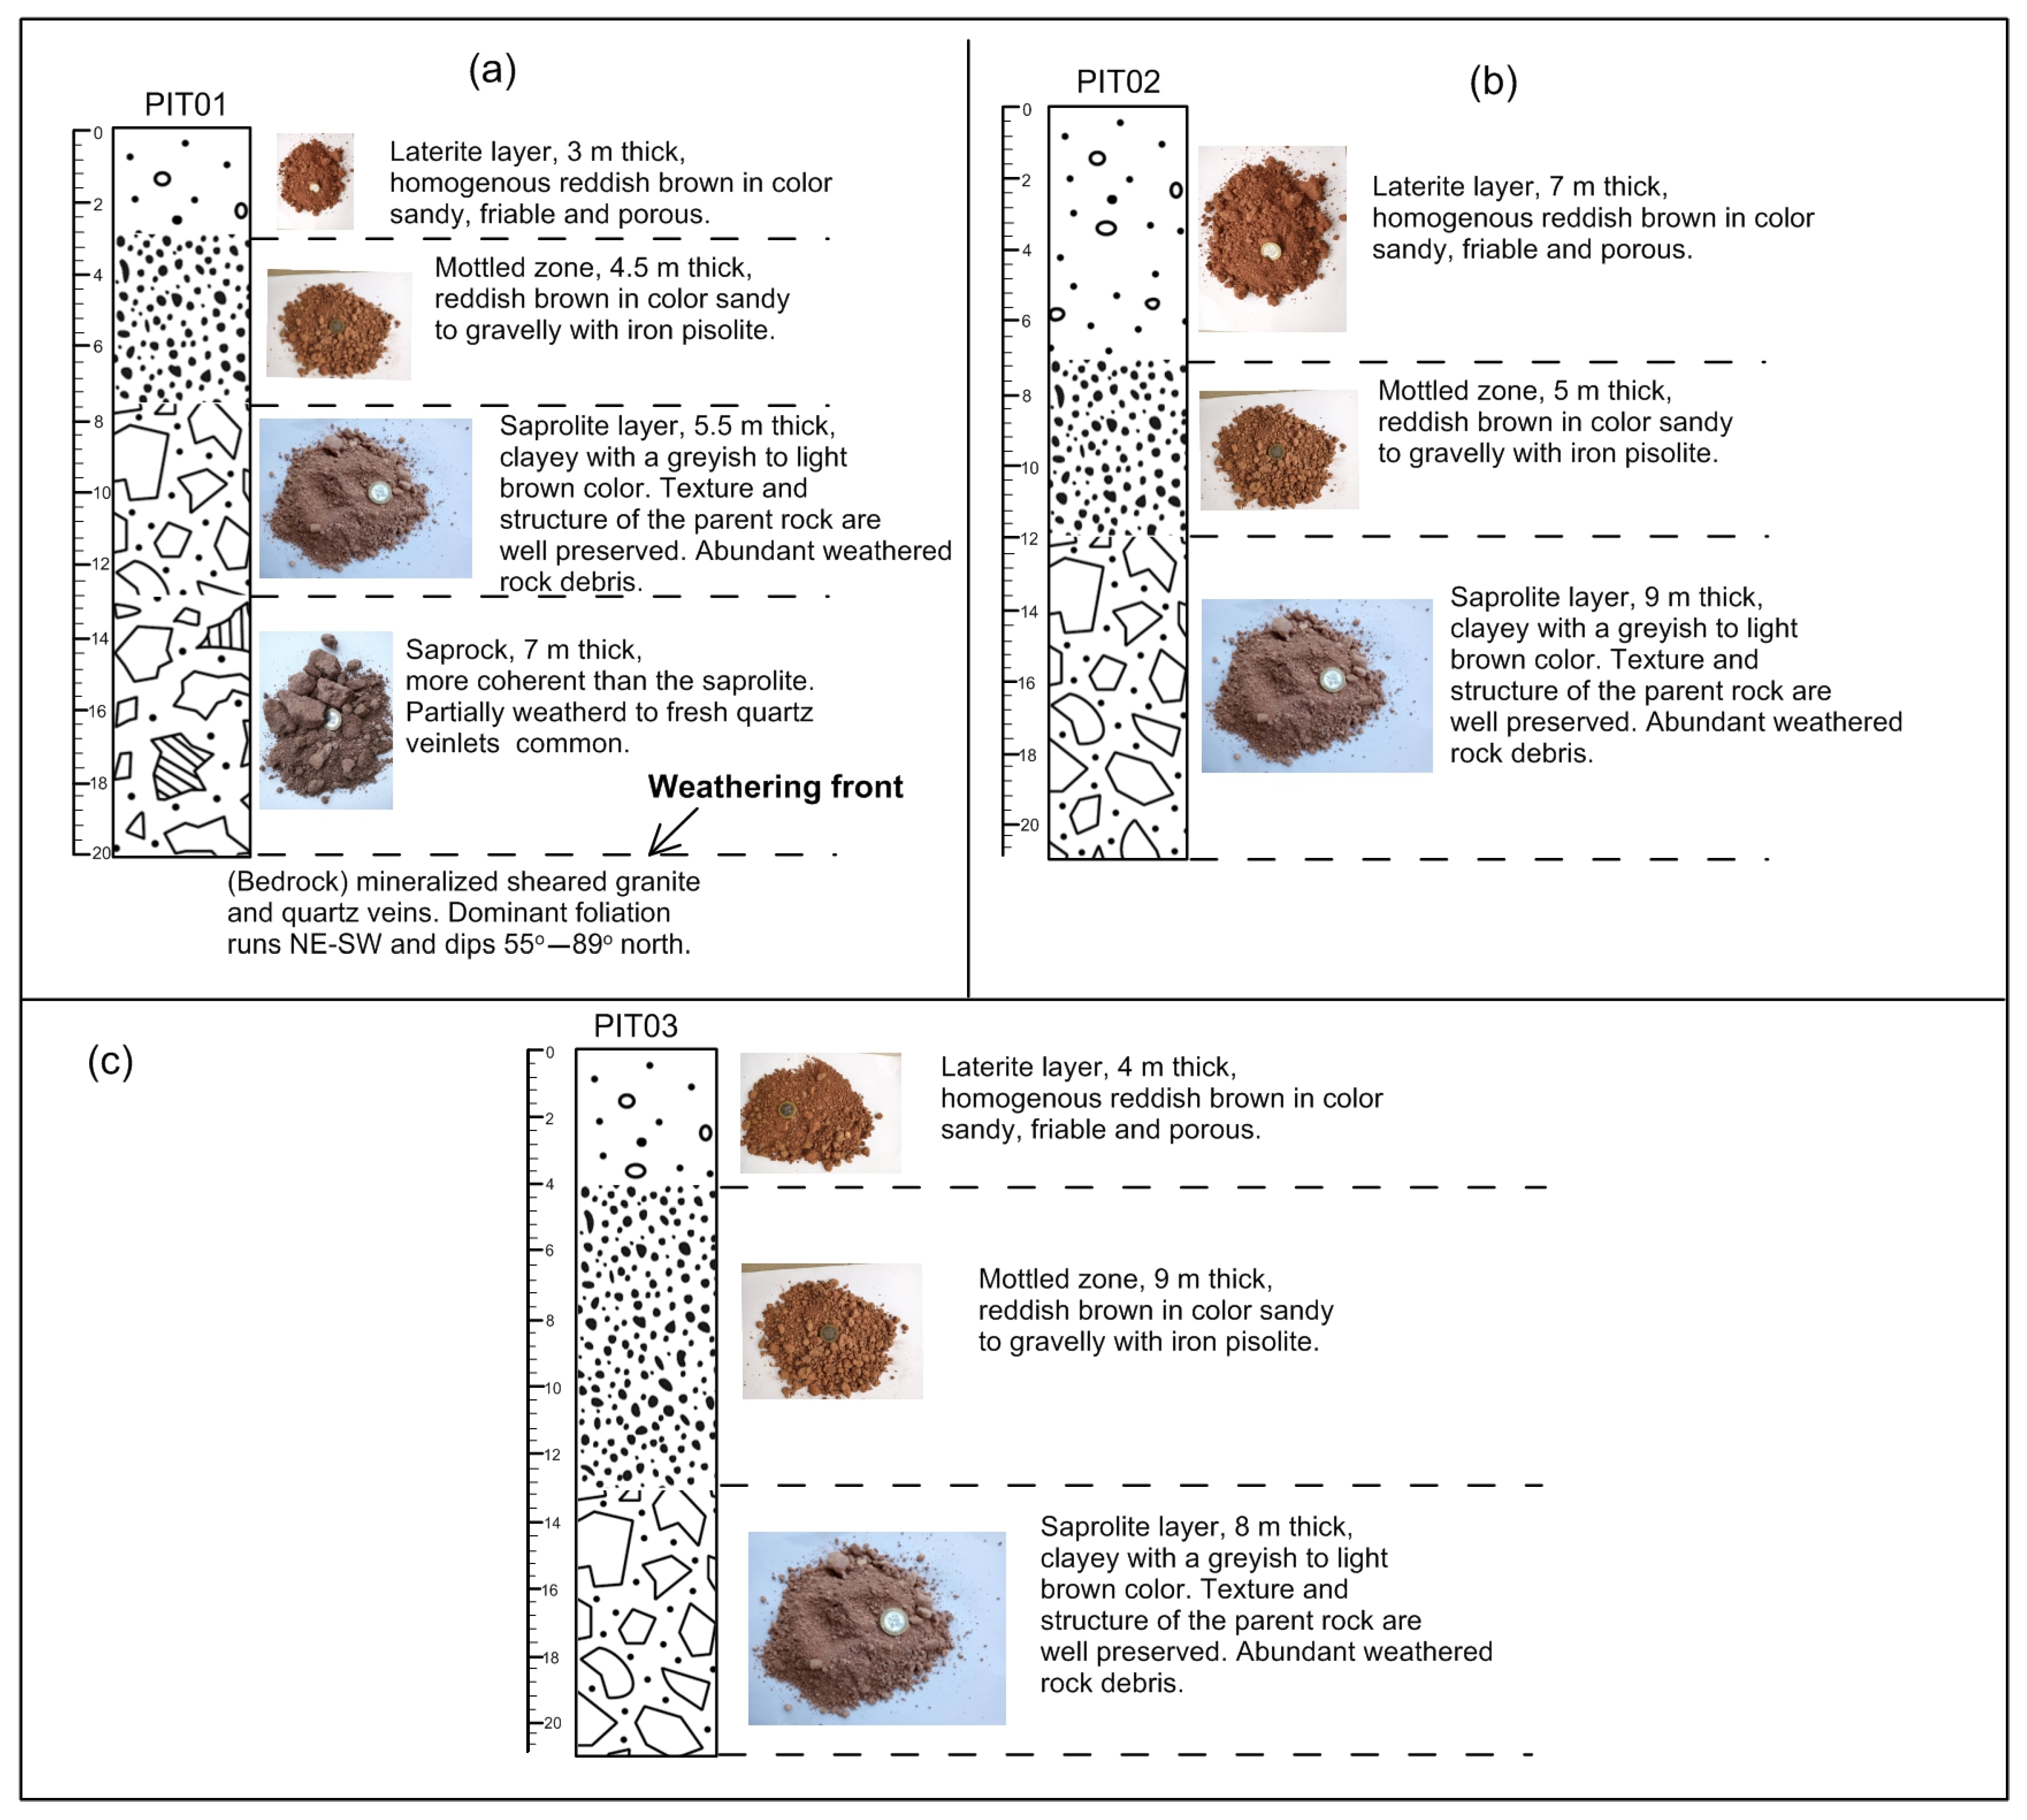
4.1. Description of the Soil Profile

The weathering profile in the Batouri goldfield presents an undisturbed succession of weathering horizons (Figure 5). From the bedrock to the surface, the weathering blanket reaches a thickness of 21 m. It varies upwards from the saprock at the bottom through the saprolite, mottled zone to the lateritic layer at the top; although, the saprock layer is absent in PIT02 and PIT03. The main characteristics of the profiles in Batouri are illustrated in Figure 5. The lateritic layer varies in thickness from 3 to 7 m. It is friable, porous, homogenous and reddish brown in color and reveals a characteristic ferralitic soil matrix. This layer grades downwards to the mottled zone which varies in thickness from 4.5 to 9 m. It is composed of iron-rich pisoliths scattered in a sparse sandy-clayey matrix. It ranges in color from brown to reddish brown. This layer progressively changes into the saprolite layer. The saprolite layer at the base of the profile varies from 5.5 to 9 m in thickness. It ranges in color from grayish to light brown and consists essentially of clay, rock fragments, quartz debris and mica. The primary fabric of the parent rock is only partially preserved, but its mineralogy is essentially the same as that of the saprock layer, although with more clay content in the matrix. Partially weathered quartz veinlets are common. This horizon gradually changes at its lower limit into the saprock. The saprock, which is 7 m thick as exposed, characterizes the base of PIT01. It is pale cream in color and preserves the structure and texture of the parent rock. Within this horizon, quartz and muscovite survive towards the top while feldspar totally disappears. This layer is more coherent than the saprolite layer. Quartz veins exposed in this horizon show a characteristic stock work texture with a general NE-SW trend. The quartz veins are weakly to moderately brecciated and locally contain late Fe-Mn oxide, clay infill and visible millimeter size gold flakes.

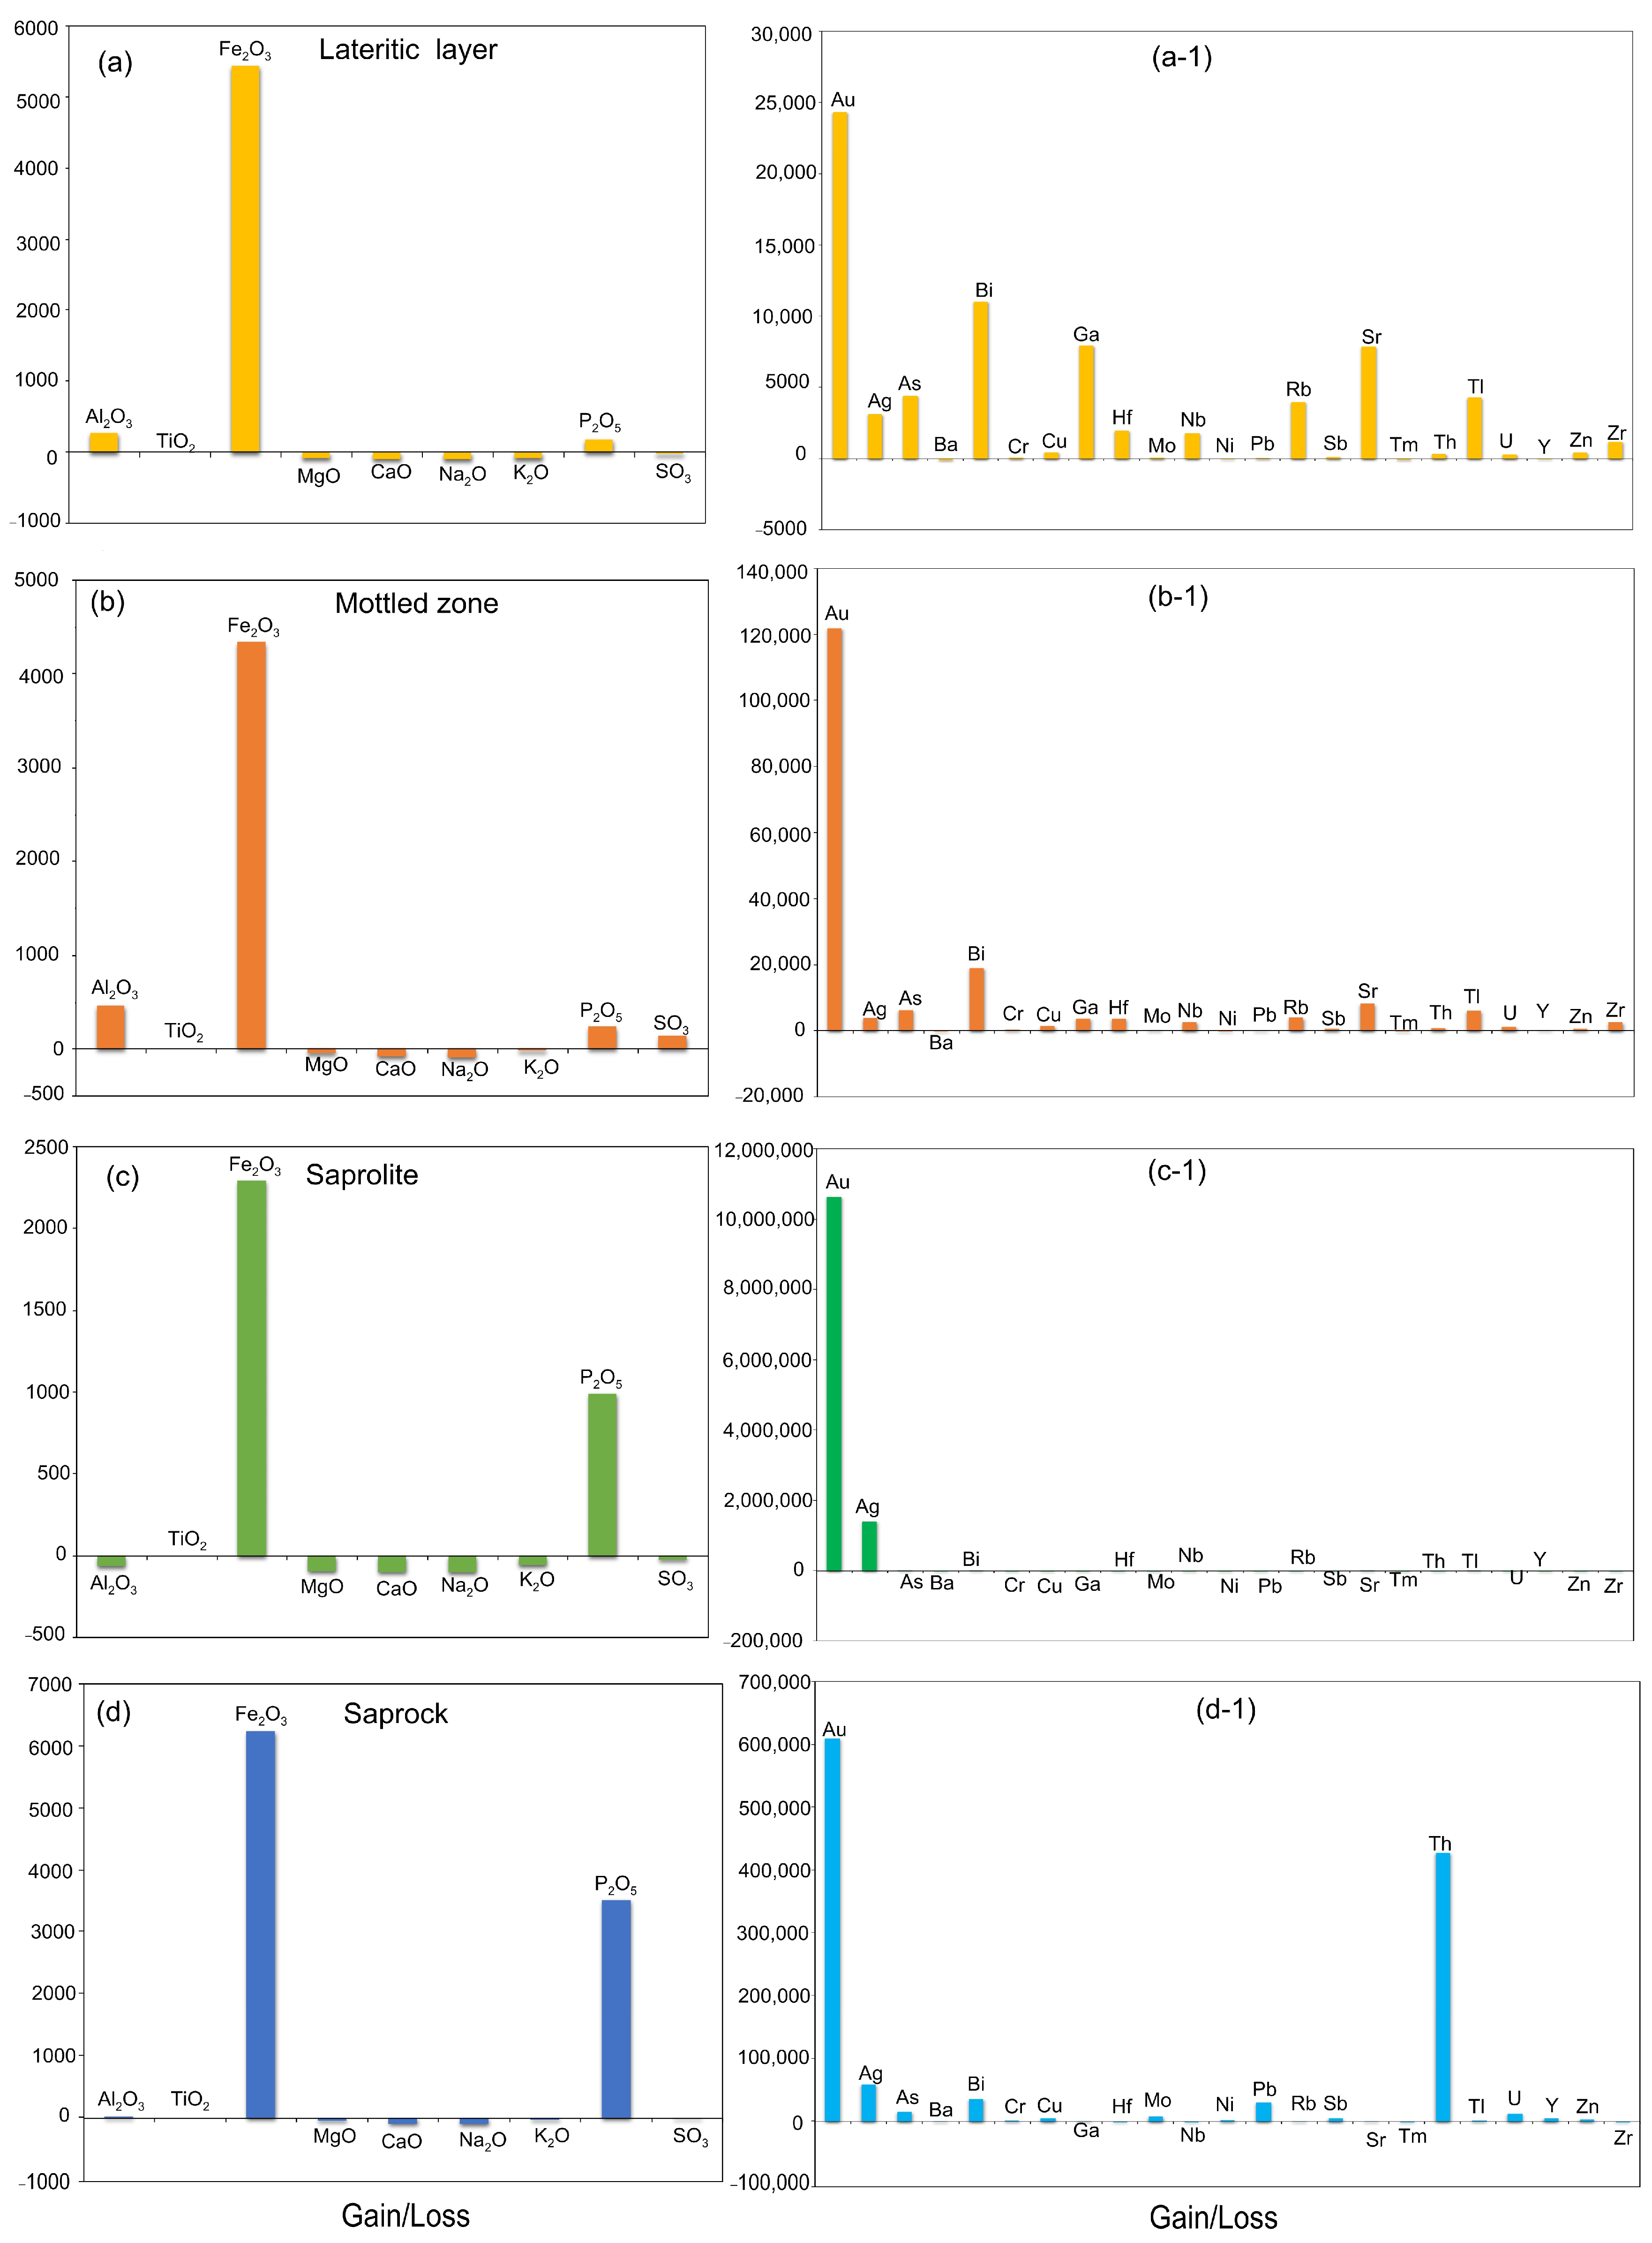
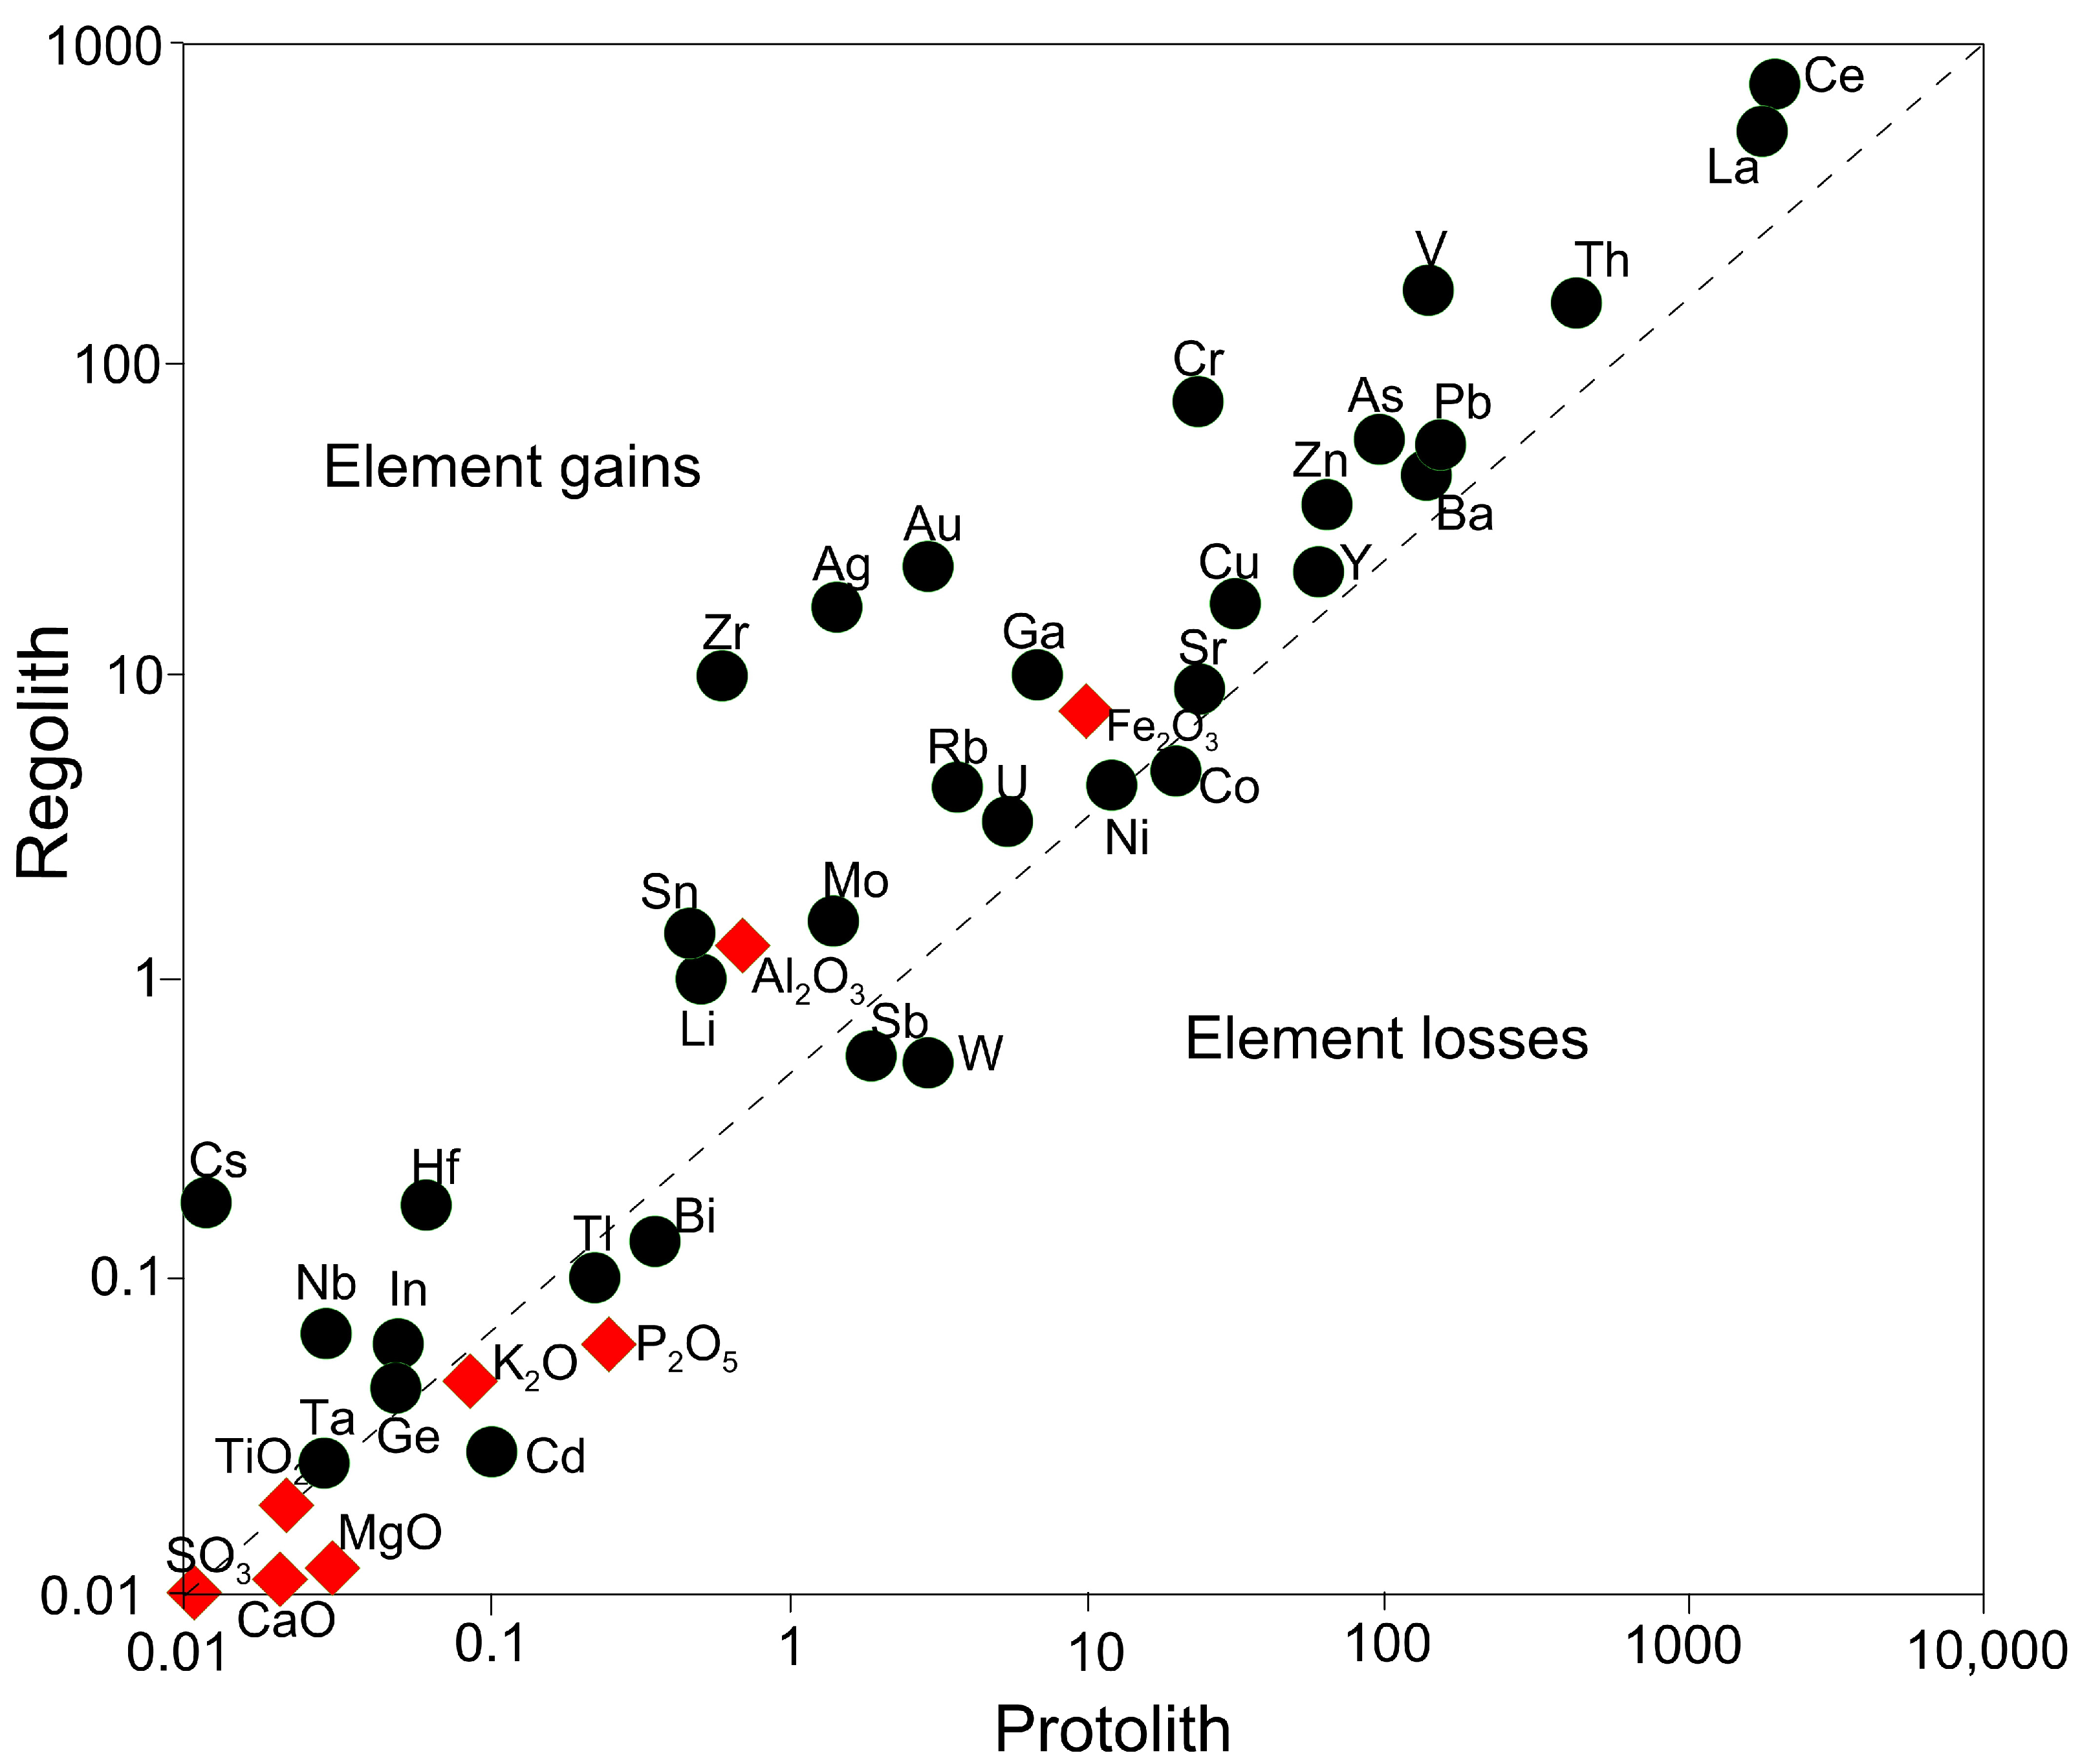
4.2. Chemical Trends and Element Mobility in the Weathering Blanket

The major and trace element composition of soil from the weathering horizons is presented in Table 1. The samples were not analyzed for SiO2 since its ubiquitous abundance and distribution in stream sediment and granite-derived soils do not define haloes. The weathering profiles show CIA values that range from 72 to 99. In the (Al2O3 − (CaO + Na2O) − K2O) diagram ([49]; Figure 6), a single weathering trend parallel to the A-K line is identified: from an intermediate weathering state towards a pure kaolinitic pole (Al2O3). This is coupled with a consistent gain in Fe2O3 (Figure 7 and Figure 8). Lateralization in the regolith is marked by enrichment in Fe2O3 with a concentration of 17.15 wt.% in the lateritic layer of PIT01. It is accompanied by a slight increase in Al2O3, SO3 and P2O5, and a remarkable depletion in MgO, CaO, Na2O and K2O as expected from the replacement of plagioclase and K-feldspar (Figure 7). Along with the addition of Au, other metal elements (e.g., Cu, Pb, Zn and Ba) are also enriched. It is worth nothing that Ba is only enriched in the saprolite and saprock horizons in PIT01. Besides slight enrichment in U, Rb and Sr within the profile, the concentrations of LILE are low. Most HFSEs such as Ga, Th, Hf and Zr show enrichments in the regolith (Figure 8). Lateralization is also marked by slight enrichments in Ag, As, Mo and Y (Figure 8, Table 1).
In the regolith, gold also shows a strong positive correlation with Ag (r = 0.97) and a moderate correlation (r = 0.51–0.73) with As, Sb, Sr, Th, Y and Zn (Table 2).

4.3. Gold Concentrations along the Weathering Profile

Gold distribution in the various layers of each pit varies considerably (Table 1 and Figure 9). All the weathering blanket layers are gold-bearing; although, no systematic gold enrichment is recorded (Figure 9). The saprock in PIT01 was measured to have a gold content of 3 ppm. The quartz vein itself identified within the saprock was not analyzed to avoid the nugget effect as millimeter size gold flakes were observed within the veins. The highest gold concentration (100 ppm) is recorded in the saprolite layers of PIT01 and PIT03. The mottled zone shows a maximum gold content of 1 ppm in PIT02, greater than that recorded in the saprolite horizon within the same pit. The opposite is true for PIT01 and PIT03. The lateritic layer shows a gold content that reaches a maximum concentration of <1 ppm.

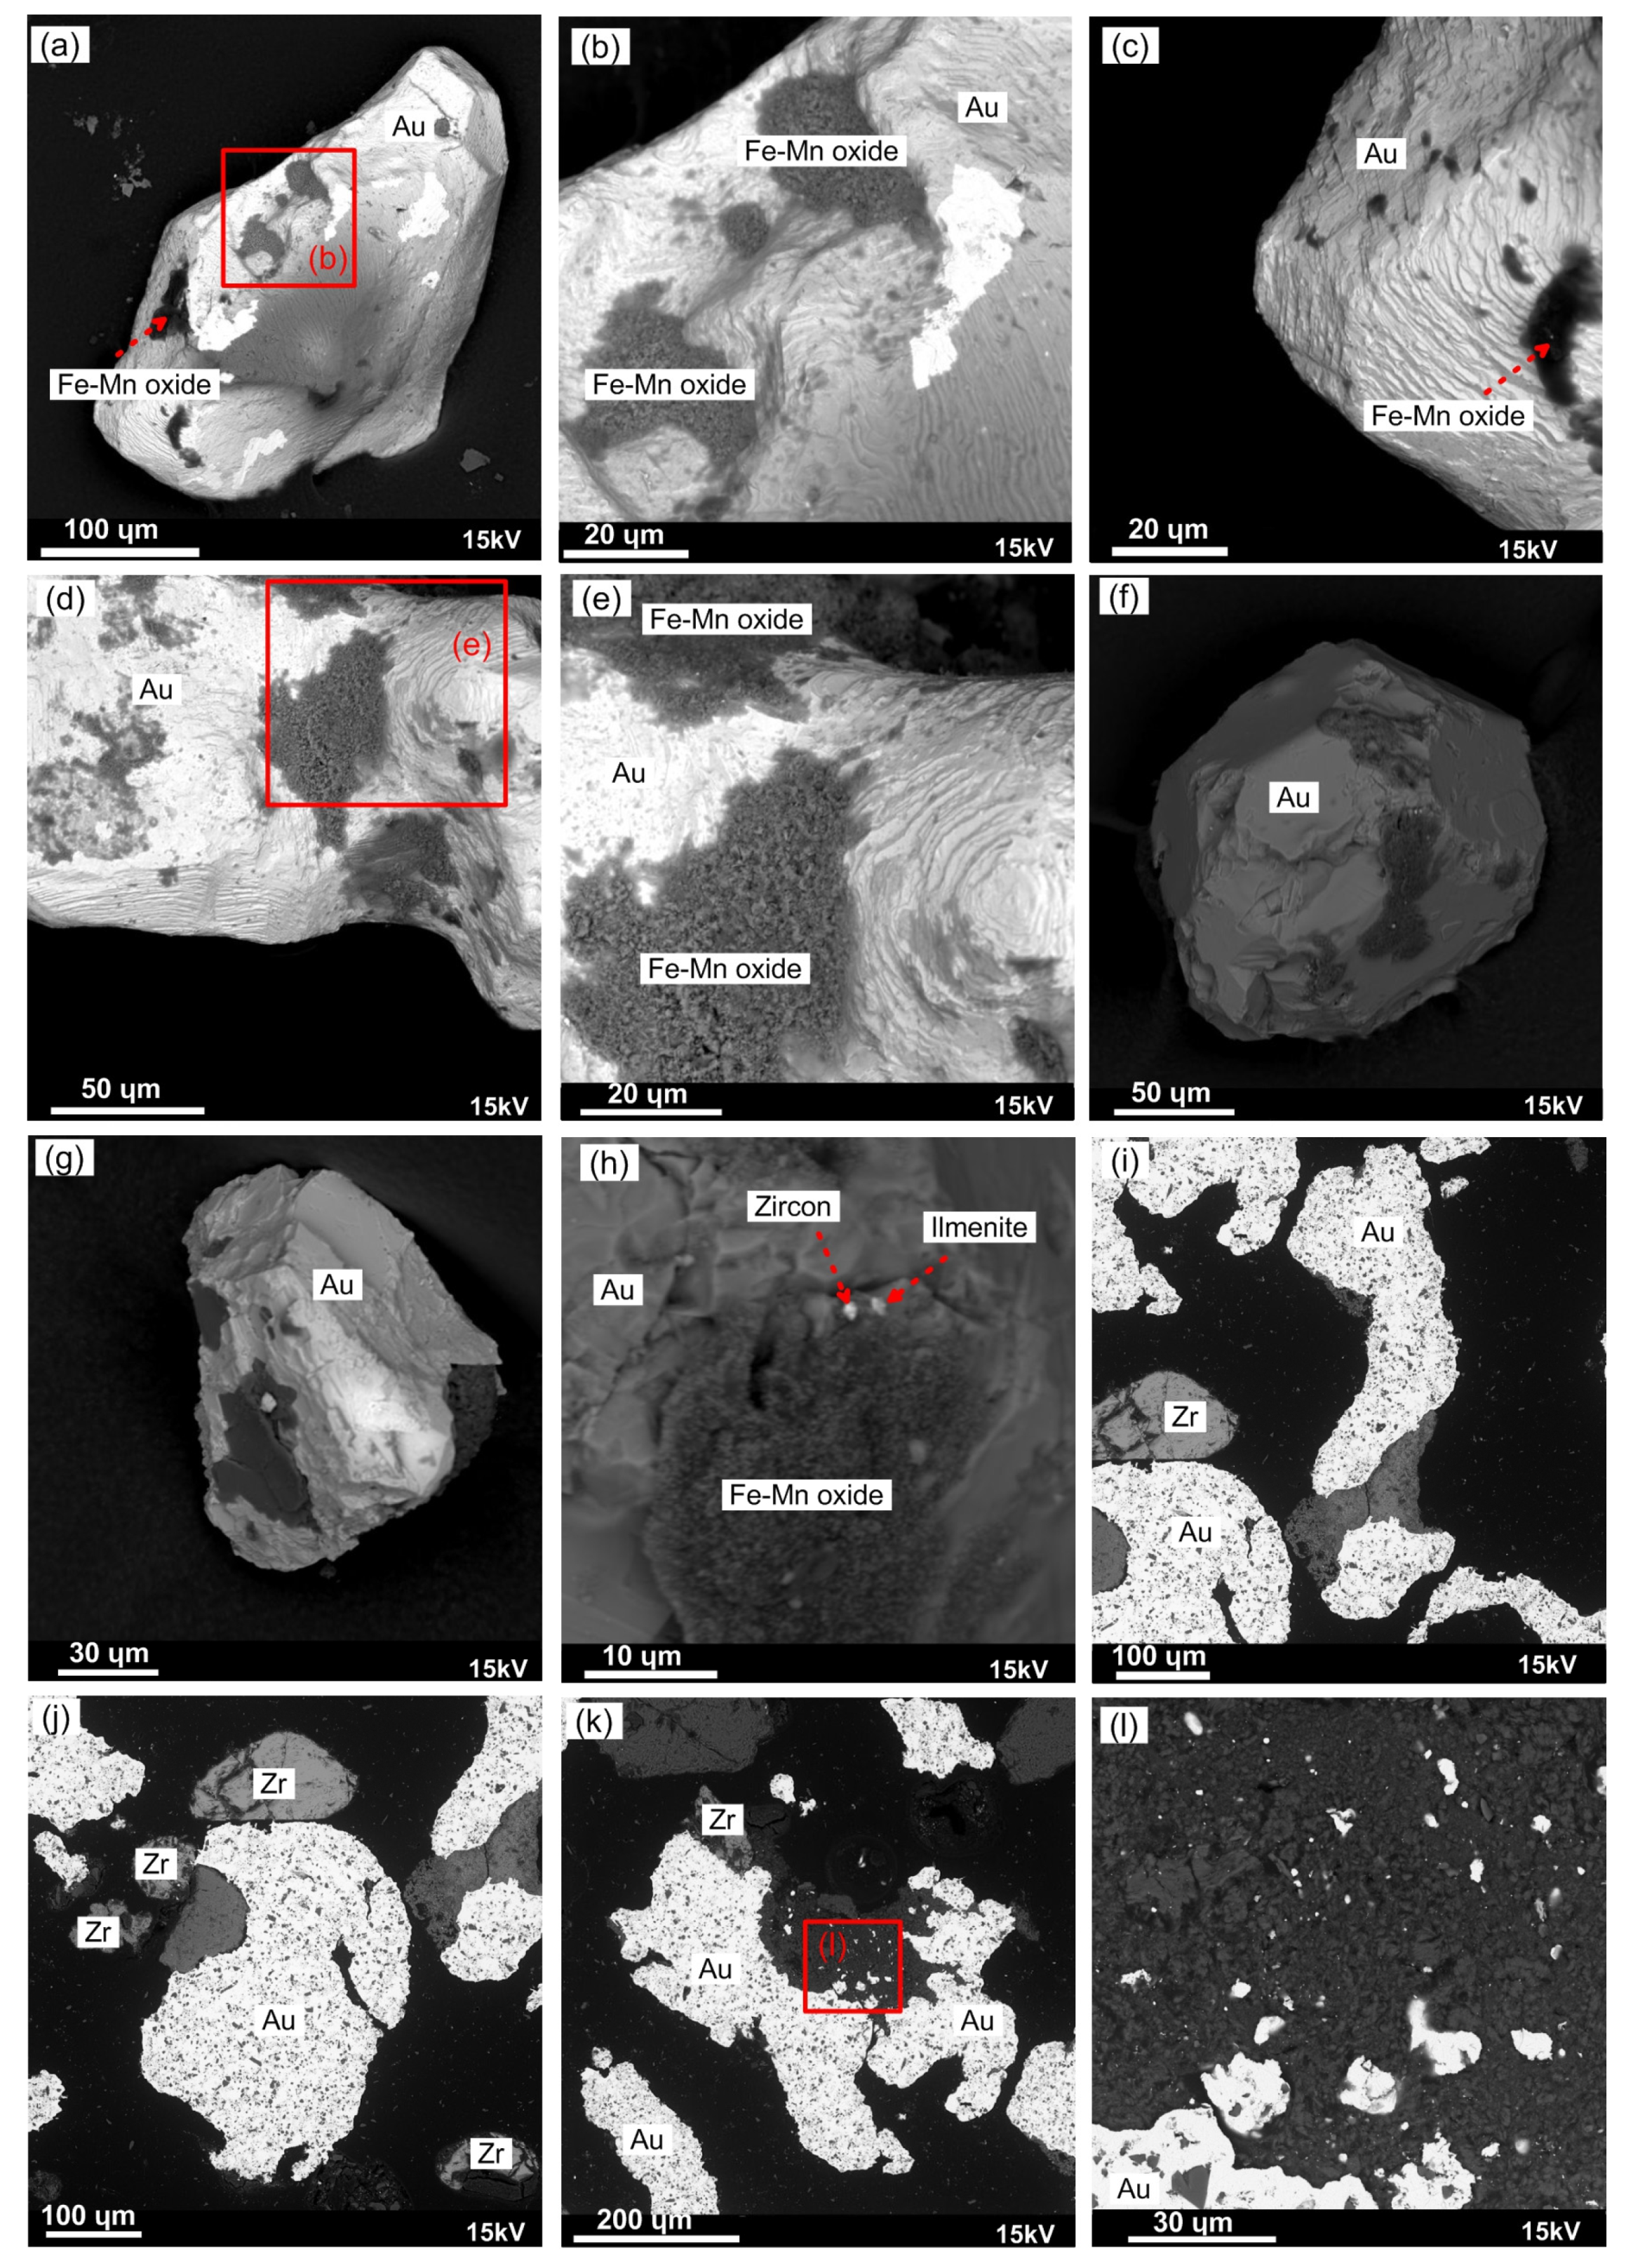
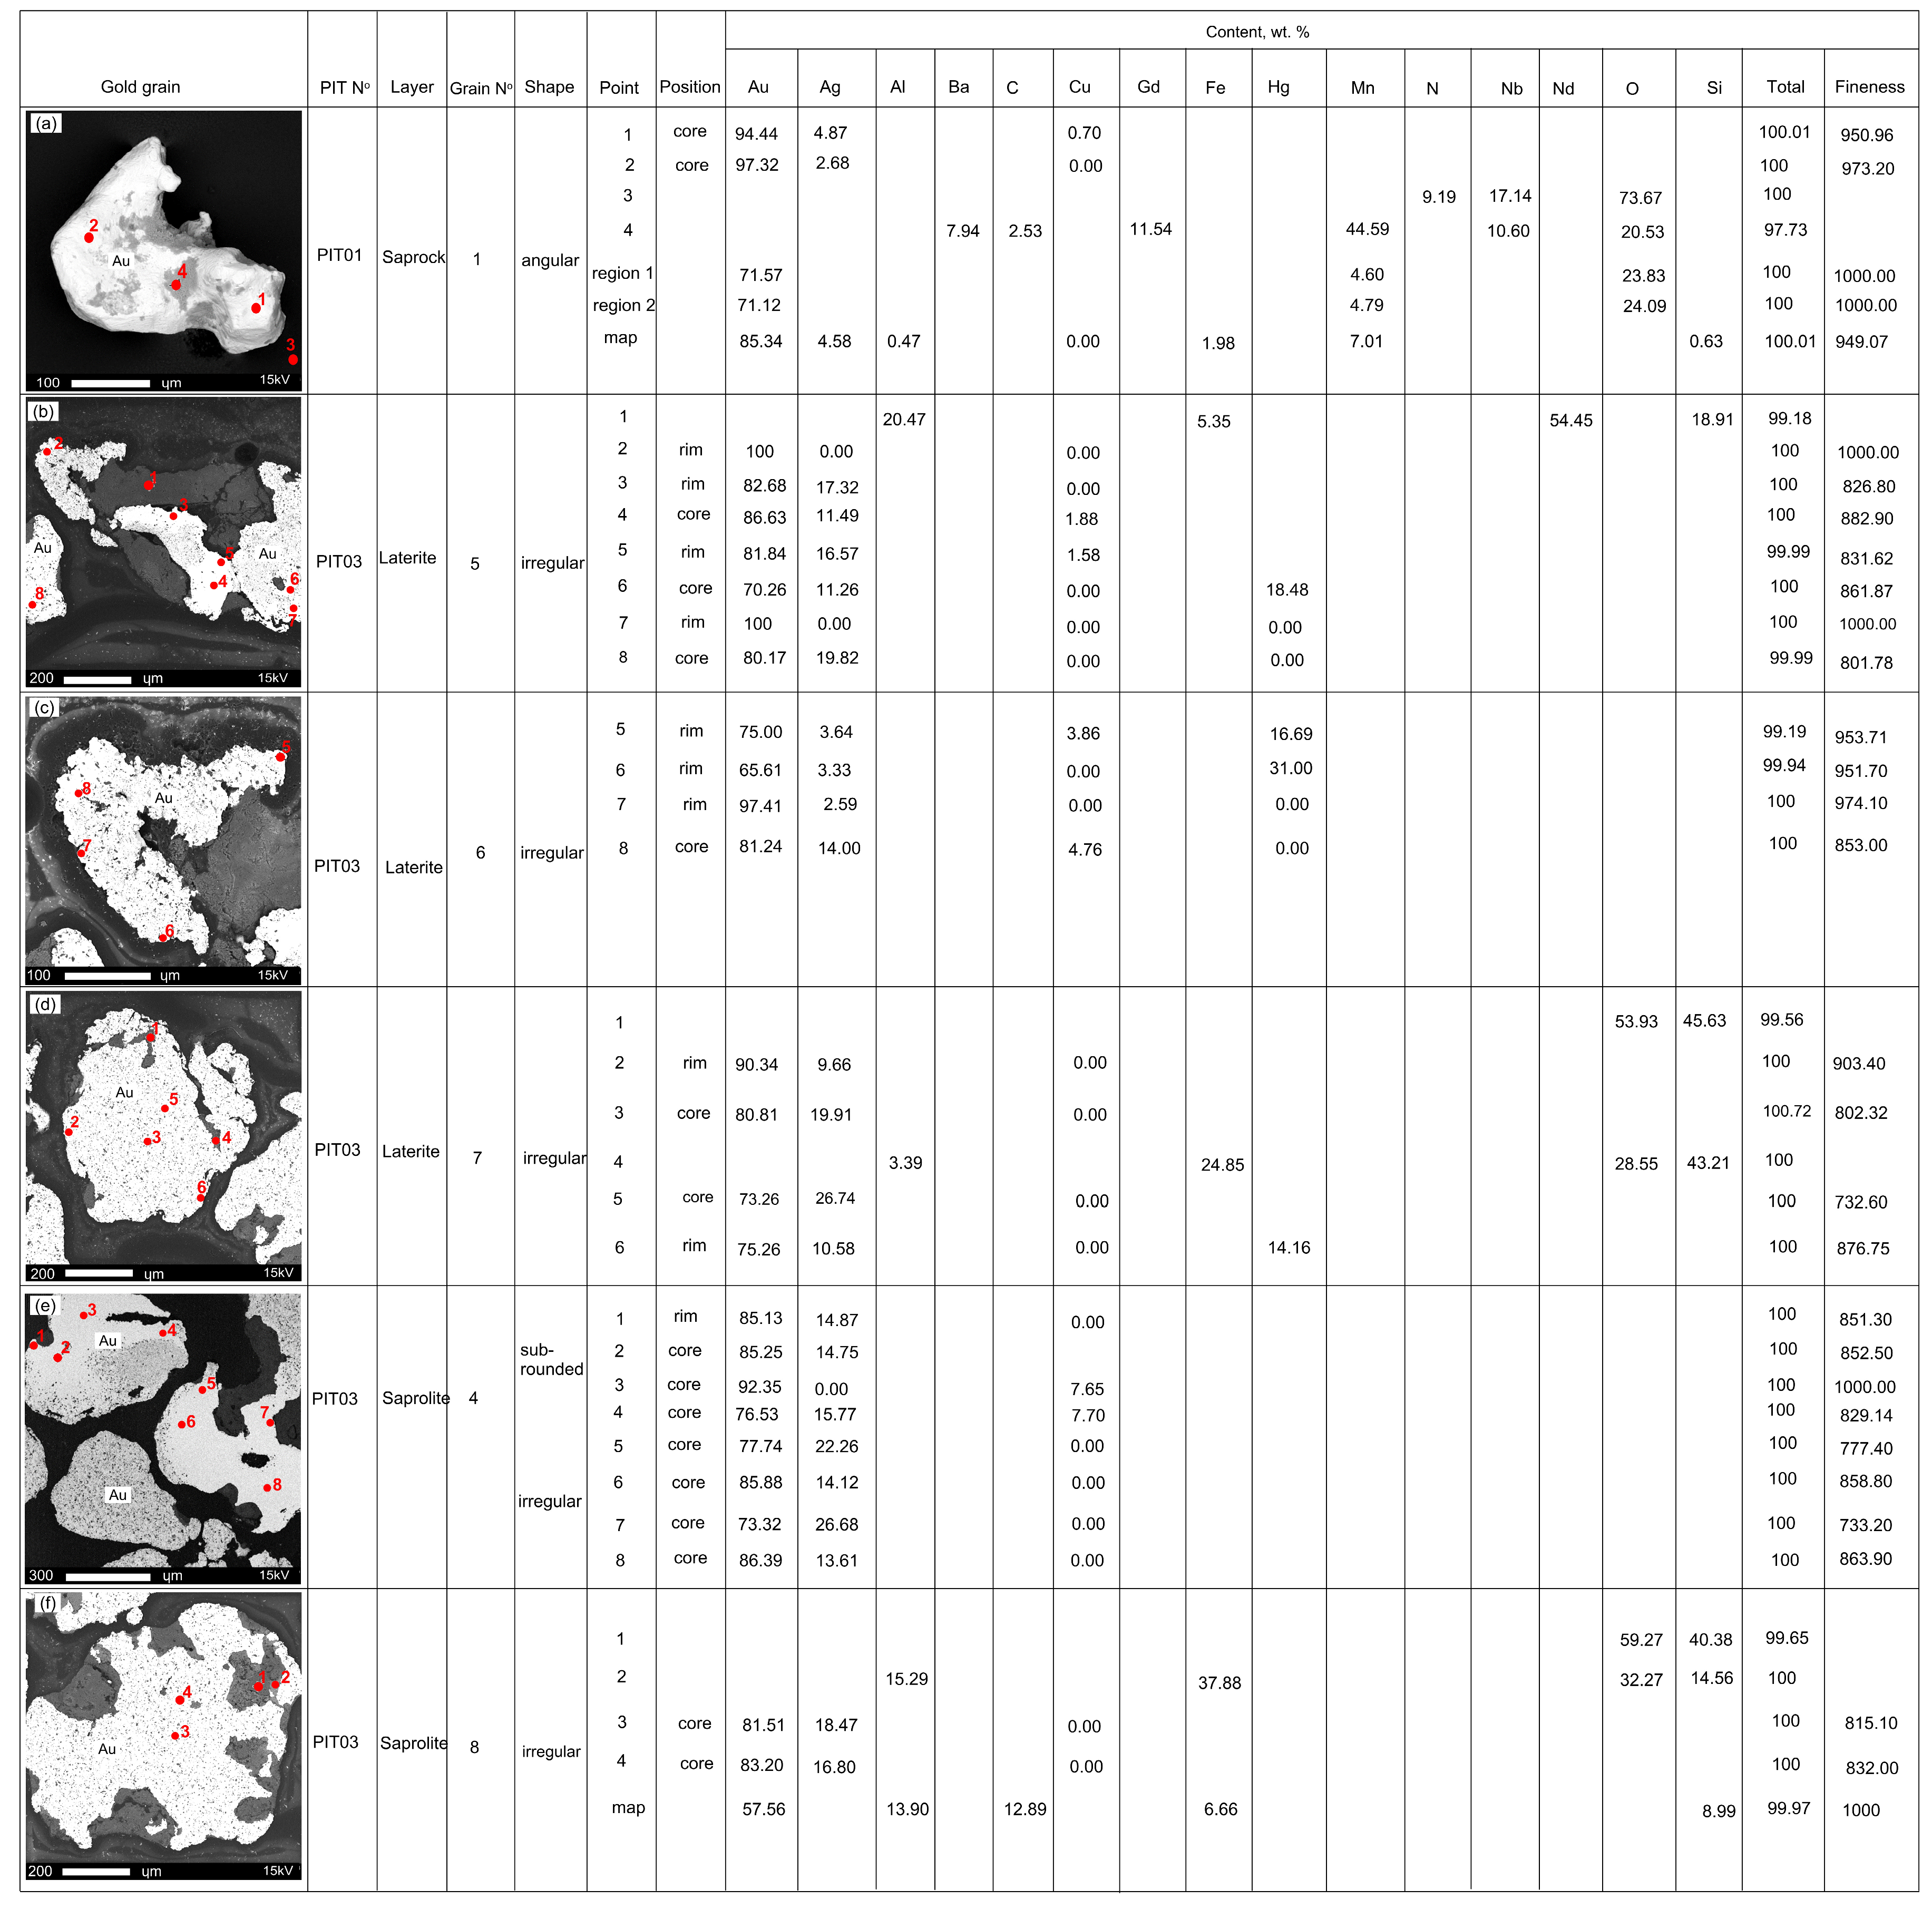
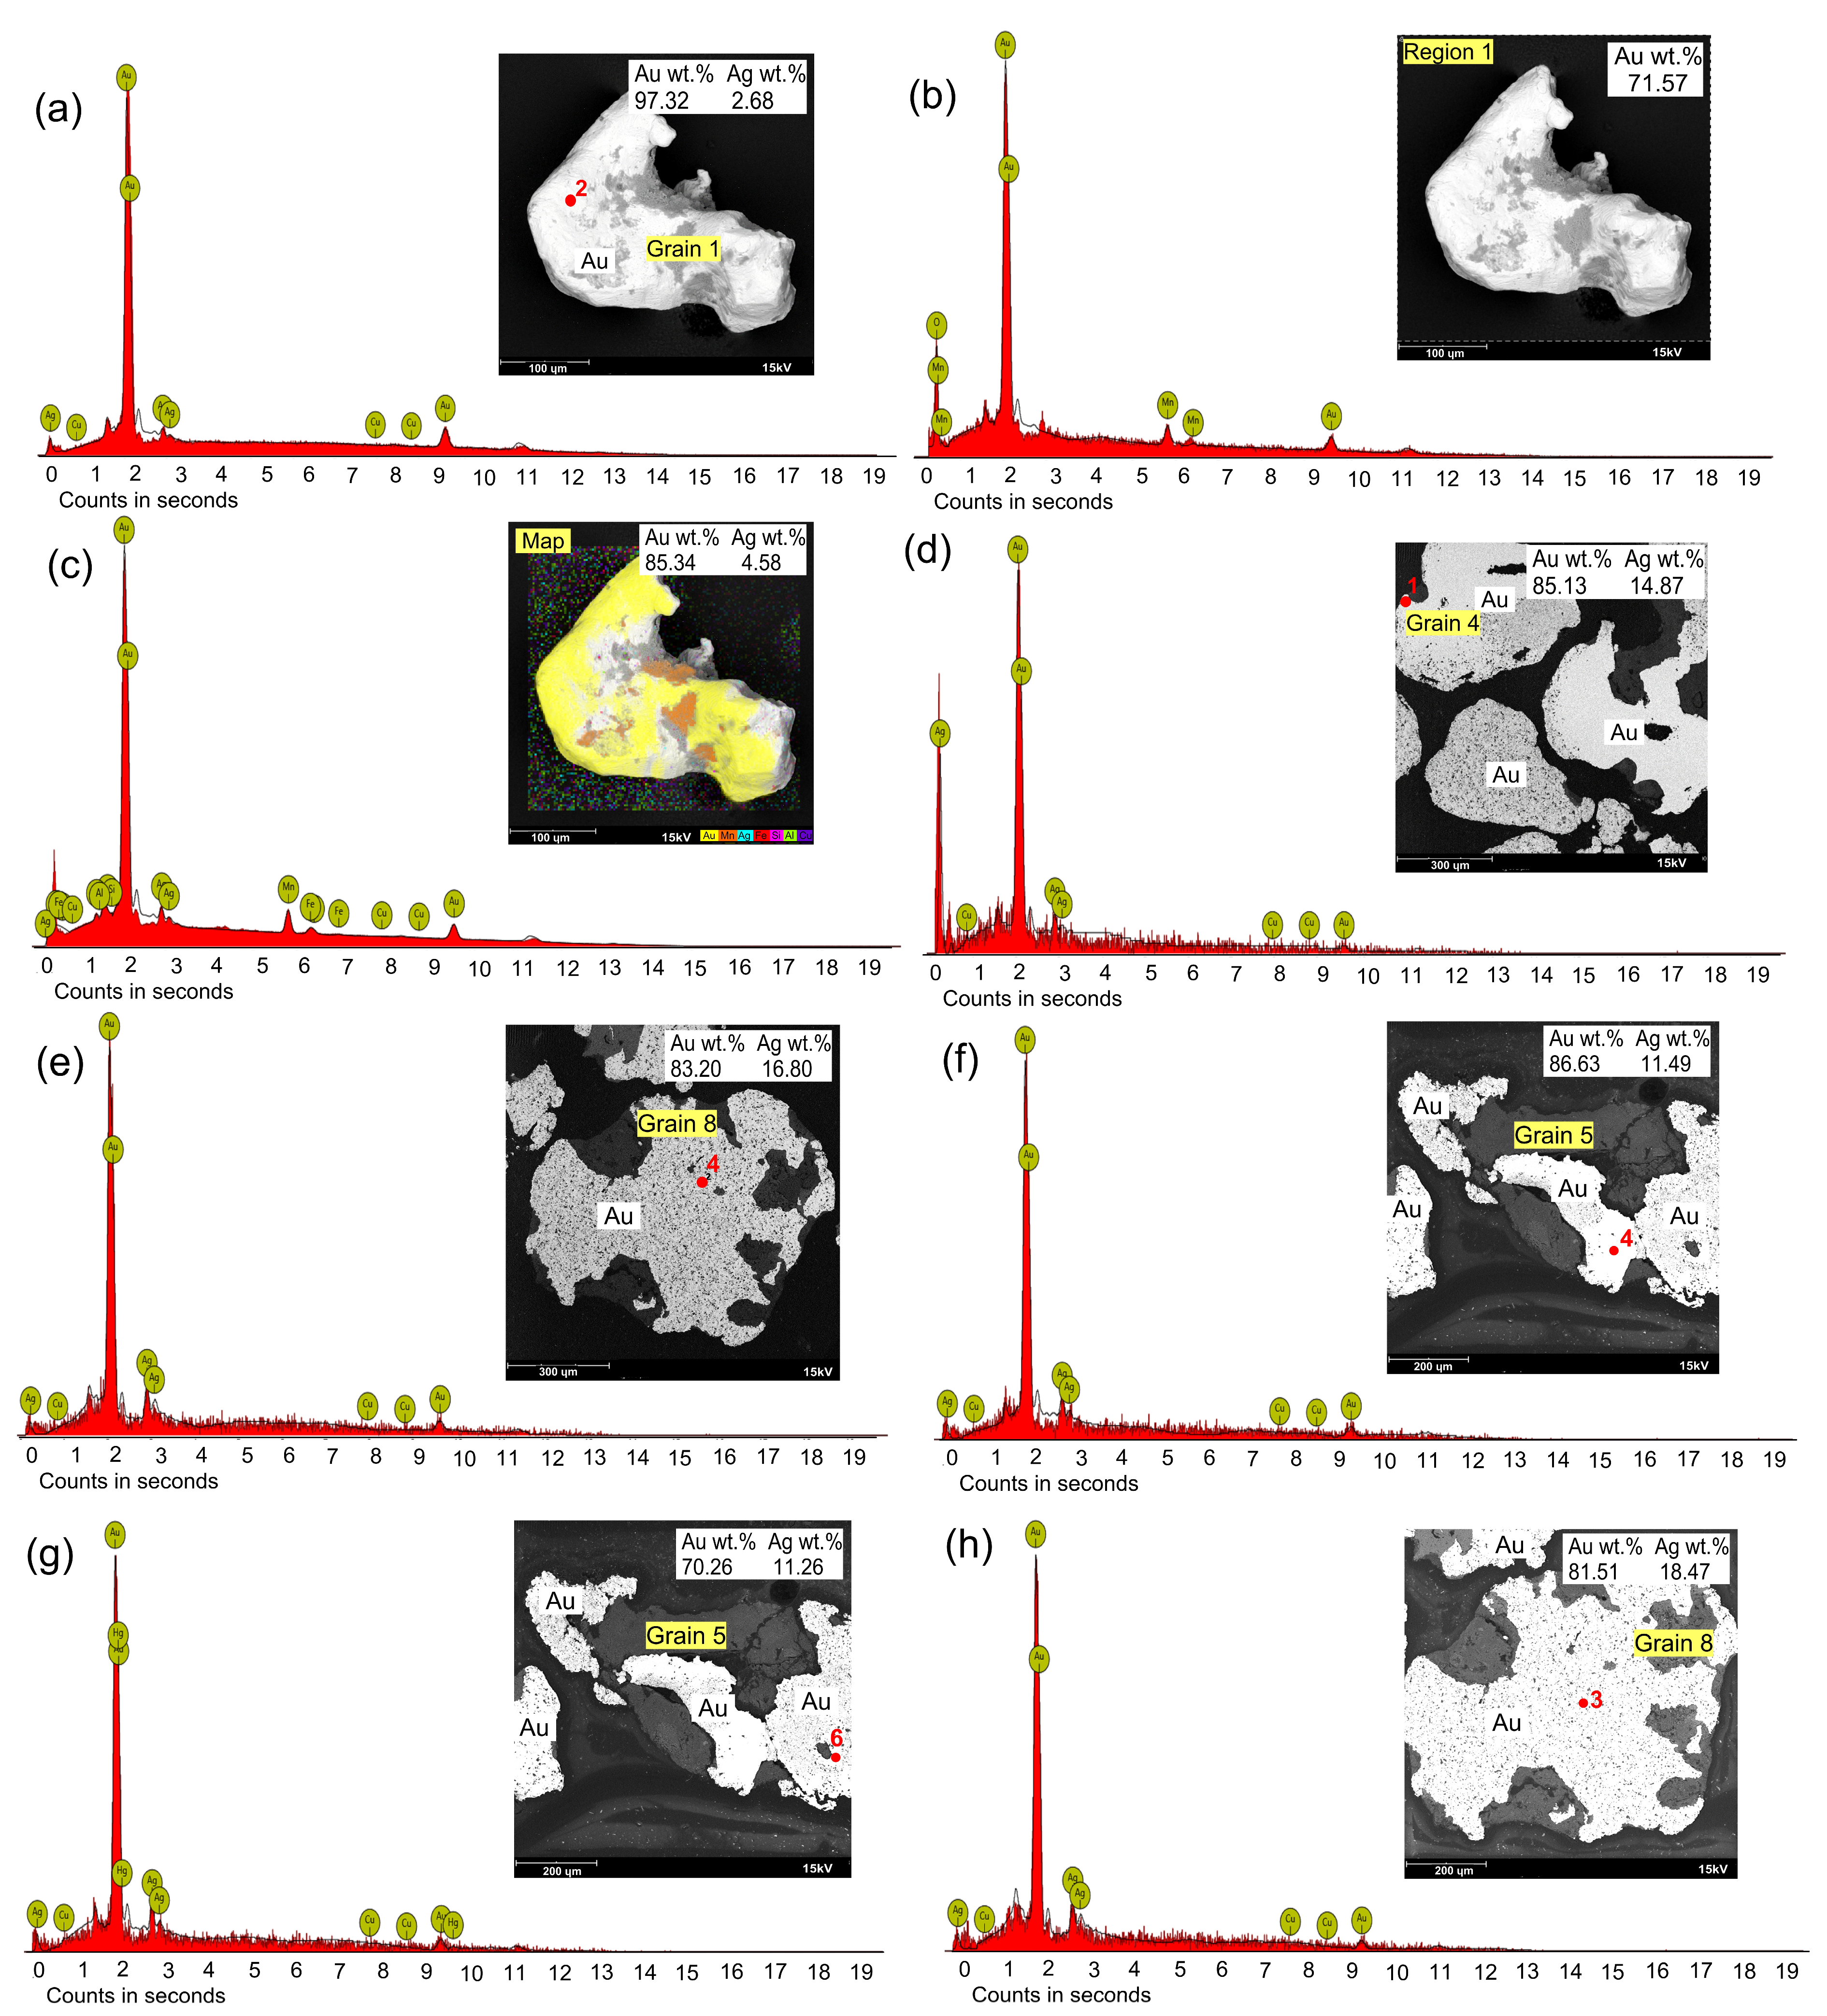
4.4. Gold Grain Morphology, Surface Characteristics and Microchemistry

Gold grains from the saprock, saprolite and laterite layers display a variation in their shapes and sizes. Backscatter electron (BSE) images of the gold grains and gold microchemistry are presented in Figure 10 and Figure 11. Grains from the saprock layer are generally crystalline to angular in shape (Figure 10a–g). The grains vary from irregular and euhedral with clear crystal faces to sub-rounded with rough edges. Their surfaces have grooves and ridges and are often coated by iron-manganese-oxide clays in association with zircon, ilmenite and quartz (Figure 10a–j and Figure 11a). The saprock gold particles are >20 µm in the longest dimension. The gold grains (Figure 11a) show a Ag concentration that ranges from 2.68 to 4.87 wt.% and Au values that reach a maximum of 97.32 wt.%. A single analysis identified Cu with a concentration of 0.70 wt.%.
Gold grains from the saprolite layer vary from sub-rounded to elongated to irregular and range in size from nanoparticulate to >300 µm (Figure 10i–l and Figure 11e,f). They exhibit irregular and pitted surfaces expressed as cavities, most of which are filled with clay (silicates) minerals and quartz. Heavy mineral associations include zircon (Figure 10i–k).
Backscatter electron (BSE) images of gold particles with representative analytical points are presented in Figure 11e,f. The concentration of Au and Ag varies from the cores to the rims of the gold grains analyzed, with copper detectable in few analytical spots (Figure 11e,f). The rims show Au contents as high as 85.13 wt.% and Ag contents of 14.87 wt.%. The cores show Ag contents as high as 26.68 wt.% and Au contents that range from 73.32 to 92.35 wt.%. This is coupled with Cu contents that reach a maximum of 7.70 wt.% (Figure 11e,f).
Gold grains recovered from the lateritic horizon vary from irregular and elongated to sub-rounded in shape (Figure 11b–d). They are generally <200 µm. They show characteristic pitted surfaces and a “brain-like” look due to abundant microcavities and pores (Figure 11b,c). The concentration of gold in the rim ranges from 65.61 to 100 wt.%, while the Ag content varies between 0.00 and 17.32 wt.%. In the core, the concentration of Au reaches a maximum of 86.63 wt.%, while the Ag content varies between 11.26 and 26.74 wt.%. It is observed that the concentration of gold increases towards the rims, while the Ag content increases towards the core. Sporadic high contents of Hg (maximum of 31 wt.%) have been identified in some of the grains (Figure 11). Energy-dispersive spectroscopy (EDS) patterns and EMPA maps of gold grains recovered from the regolith are presented in (Figure 12).

4.5. Characterization of Inclusion Signatures

Inclusions within the gold grains are illustrated in Figure 10, Figure 11 and Figure 13. The inclusions are generally irregular in shape with a maximum size less than ~200 µm. Compositionally, the mineral inclusions are composed of quartz, zircon, ilmenite, silicate and clay minerals (Figure 10, Figure 11 and Figure 13).

5. Discussion

5.1. Geochemical Characterization of the Weathering Blanket

The succession of the weathering horizons exposed in the Batouri goldfield results from weathering related to the regolith landform regime in which they are situated [11,12,13]. The soil cover consists of four horizons, namely, from the bottom to the top, saprock, saprolite, mottled zone and the lateritic layer (Figure 5). The soil profile here is similar to that described by [19] in the Dimako area, [13] in the Batouri north goldfield, [12] in Couriège French Guiana developed on amphibolites but varies significantly from profiles described by [50] in the Bétaré Oya goldfield, which is developed upon the schistose parent rock. The saprock and saprolite horizons that preserve textures of the granitic basement rock point towards a purely residual inheritance [12]; although, selected biogenic concentrations of elements such as Au and Mn have been noted in similar environments [51]. The nature of the mottled zone and the lateritic layer is more difficult to apprehend as primary textures are almost destroyed. The lateritic layer has been reworked. According to [12], the upwards evolution from the saprolite to the mottled zone is primarily typical of in situ deep weathering. Thus, such textures are produced by the leaching of primary lithostructure and local segregation of Fe [52].
The transformation of protolith to the regolith (Figure 8) does not generally lead to large changes in element concentrations. Elements close to the isocon correspond to small gains and losses [48]. However, Fe2O3 was consistently enriched during intermediate to intensely weathered activities in the Batouri area. This marks the process of lateritization in the regolith (Figure 7 and Figure 8). According to [10,35], the basement rocks in this area have high magnetic susceptibility values and are magnetite series granitic rocks. This explains the elevated Fe2O3 concentration in the soil. The intermediate to intense weathering conditions revealed by the soil is marked by clay minerals (Figure 6, kaolinite, gibbsite, chlorite, illite). The soil show similarities in mineral composition (as determined by the X–ray diffraction technique) with lateritic soil developed on granite in the eastern region of Cameroon [53,54]. It is worth noting that the formation of the regolith seems to be accompanied by the segregation of elements such as Au-As-Ce-Cu-Pb-Rb-Sr-Y-Zn indicating contribution from felsic bedrock, while the Cr-V content can be attributed to subordinate mafic lithologies (Figure 8; [9,55]). The in situ character of the saprock/saprolite and mottled zone studied is further supported by enrichments in high field strength elements (HFSE) such as Ga, Th, Hf and Zr representing the least mobile element derived from the chemically homogenous basement rock (Table 1). Fresh granitic samples reported by [9] yield similar HFSE. Such enrichment in the regolith is produced by the leaching and loss of most highly mobile cations such as Si, Mg, Na, Ca, K and Ba during intense chemical weathering typical in tropical environments [12]. Since barium is chemically unstable in the surface environment, elevated barium in the weathering blanket (e.g., PIT01) suggests a close proximity to the source [56]. The weathering blanket’s abundance of P, Zr and Ba is a reflection of the accessory minerals monazite, apatite and zircon found in the underlying granites. Therefore, it can be suggested that the weathering profile exposed in the Batouri goldfield is derived from a protolith that is chemically homogeneous.

5.2. Gold Grain Distribution along the Weathering Blanket

Gold redistribution in the supergene environment is primarily mediated by residual enrichments, chemical and biological dissolution/reprecipitation and physical transport [19]. Climate, bedrock composition and geomorphological factors all influence the style and intensity of gold mobilization [57]. As a result, the variation in gold grades in the studied profiles, along with the compositional and morphological features of gold, enable the mobility of gold during weathering to be assessed. It has been noted that within weathering profiles developed in equatorial environments, chemical dispersion of gold only occurs in the lateritic horizon and the upper portion of the mottled zone, while dispersion in the saprolite stays quite limited [58]. The reverse is true in the studied profiles which show a variation in the concentration of gold. The saprolite horizons in PIT01 and PIT03 reveals the highest concentration of gold at 100 ppm, while the saprock reveals a gold content of 3 ppm, the mottled zone in PIT02 shows a maximum gold content of 1 ppm and the lateritic horizon of the same pit reveals a gold content of <1 ppm. Thus, there is no discernable systematic enrichment in the concentration of gold from the bottom to the top of the pits. The high gold content in the saprock and saprolite layers coupled with the occurrence of gold in all the soil layers argues against any significant Au dissolution, remobilization and precipitation within the weathering cycle. Rather, the redistribution of gold in the particulate form is evident. This is similar to results by [13] in the Batouri north goldfield and [14] in the Kambélé gold mining area but significantly differs from profiles described by [50] developed on the schist basement in the Bétaré Oya gold district. In soil profiles where Au remobilization and chemical precipitation of authigenic gold is evident, Au is usually dissolved from the higher horizons and reprecipitated from unstable complexes to form mottled zone and saprolite haloes at depth (e.g., [19,59]). The fact that the saprock and the saprolite horizons with high gold contents and the lateritic horizon also recovered particulate gold with the nano size fraction goes further to support the dispersion of gold in the particulate form in the Batouri goldfield. This is also affirmed by the absence of circular pits on surfaces or irregular gold grain shapes following gold dissolution after exposure to weathering solutions and the absence of secondary gold spherolites on surfaces of primary gold [16,17].
It is also possible that gold microbiology plays a role in the gold distribution in these profiles. It is well known that bacterioform gold is linked with high-purity gold overgrowths and nanoparticulate gold in association with Fe-and Mn-rich biomats (e.g., [60]). These same features associated with biogenic gold are also noted in the samples from this study. The magnitude of any biological contribution to gold enrichment is not clear and remains to be examined. Regardless of the exact contribution and timing of biological precipitation or overprinting on pre-existing native gold, bacterioform nano-particulate gold similar to that of other localities [51] is present in these samples.

5.3. Gold Microchemical Signature and Grain Transportation

The microchemical signature of detrital gold has been widely used to link its features to possible hypogene sources in regional exploration schemes [61,62], similar to those documented in this study. The criteria used in such studies include grain morphology, alloy elements and the diversity of inclusion minerals in the gold particles (e.g., [63,64,65,66,67,68]). The morphology of gold grains can also aid in identifying proximity to the primary mineralization [69].
Gold particles recovered in this study vary in terms of texture from one soil horizon to the other. We have shown that gold particles from the saprock are generally crystalline to angular with clear crystal faces, rough edges, grooves and ridges (Figure 10 and Figure 11). Gold particles from the saprolite horizon are generally irregular and elongated to sub-rounded (Figure 10 and Figure 11). Such observations point to either a limited dispersion of gold from the primary source or restricted exposure to chemical weathering time since being dislodged from the hypogene source (Figure 10a–g and Figure 11a; [70]). The grains’ principal inclusions, surface features such as ridges, cavities and rough and etched pits, indicate that they were likely recently derived from the primary source. Mechanical weathering influences are also minimal. The sub-rounded nature of the gold grains recovered from the soil profile implies that gold grain roundness can also develop in soil profiles and not only in alluvial systems. Gold grains forming the laterite horizon show vermiform microtextures and pitted surfaces with microcavities (Figure 11b–d). This is similar to secondary particulate gold reported [6] in the Inagli Pt-Au placer deposit in Russia, where in this study, the gold grains show no evidence of intricate secondary growth features such as dendrites and filaments, which are pervasive in authigenic gold (e.g., [71]). The microfabrics observed in the gold particles do not indicate any supergene contributions; thus, the gold grains are detrital and not authigenic in origin.
Mineral inclusion suites have been widely used to link gold to their possible primary sources for the purpose of exploration [65]. In the Batouri goldfield, ore mineral inclusions were scarce; nevertheless, gangue minerals provide an avenue for this study (Figure 10, Figure 11 and Figure 13). Gold grains from the saprock layer are coated with Fe-Mn oxides, while ilmenite and zircon are common heavy minerals in the horizon. This is associated with elevated contents of Ba, Cu, C, Gd, Nb, O, Mn, Fe Al, Si and W which can be attributed to minerals such as silicates, oxides and REE minerals (Figure 11 and Figure 13). The saprolite layer shows an intimate association with silicates, clay and quartz. Weathering of the granite hosting lode mineralization released gold into the regolith. This is in agreement with the bulk geochemical data discussed above, which pointed to the redistribution of gold in the solid state in the soil. Iron oxide inclusions containing Cr and V reported for the first time in the Essabikoula area within the Ntem complex have been attributed to the interaction between hot reducing hydrothermal fluid and local mafic lithologies [55].
The Au alloy composition as indicated in the gold grains is mainly binary (Au-Ag, Figure 14a); although, few analytical spots reveal a ternary Au-Ag-Cu composition in the saprolite and laterite horizons with Cu contents that reach a maximum of 7.70 wt.% (Figure 11 and Figure 14b). In the Cameroon goldfields, such high Cu content is reported for the first time. Systematic changes in alloy composition in gold detrital particles within a single hydrothermal system point to the evolution of the hydrothermal fluids in space and time [72]. It is possible that the lode source had multiple mineralizing events that produced a range of native gold generations. Some of the gold grains on the lode were more Cu-rich than others. This assertion is supported by Cu contents as high as 874 ppm in the hydrothermally altered basement granitoids [9,67].The composition of gold grains from this study is here compared with gold mineralization in the quartz vein and bedrock of the eastern Cameroon goldfield and granite hosted gold mineralization in Bigorne, Iberian Variscan belt, western Europe (Figure 14a,b). The detrital grains have core compositions consistent with their derivation directly from hypogene mineralization and support the interpretation of the grains in the weathering blanket as inherited relic grains from the primary mineralization [13,68]. The gold grains have a fineness value that varies from 732 to 1000 (Figure 14c) with an average value of 888.
A majority of the values cluster within the lower limit (Figure 14c). High Ag content recorded in the core (Figure 11) and rim portions of the grains suggests limited rates of physical and chemical weathering resulting in negligible Ag leaching and point to the presence of electrum, a natural alloy of gold with >20 wt.% Ag sourced from a Ag-enriched primary deposit.

5.4. Impact of Anthropogenic Activities

Anthropogenic activity in artisanal and small scale gold mining sites is an important source of contamination to the environment. In the eastern Cameroon goldfield, mining sites such as Bétaré Oya and Kambélé are noted for soil, stream sediment and surface water contamination mainly resulting from anthropogenic activities [2,73]. While the soil and sediment show elevated contents of Co, Cd, Cu, As, Cr, Pb and Zn [2], surface waters show metallic elements in the following descending order Fe > Mn > Pb > Cr > Cd [73]. In this study, the Au-Ag alloy grains from the lateritic horizon show high Hg content (Figure 11 and Figure 12g). The Hg contents identified in the gold grains vary from 18.48 in the core to between 16.69 and 31 wt.% in the rims of the grains. This high Hg content is reported for the first time in the gold district. The Au-Ag-Hg compound has been reported in the hypogene environment [72]. Orogenic gold with high Hg content have also been reported by [61,62]. According to [61,62], Hg high in gold grains is indicative of an orogenic setting/low-temperature hydrothermal activity emplaced at high structural levels. The Au-Ag-Hg alloy has also been reported in supergene conditions as a result of the introduction of anthropogenic Hg during mining operations [5,6]. The earliest records of Hg use in amalgamation were from Egypt and China more than 3000 years ago [74]. Mercury has been used in inexpensive, easy and rapid approaches for extracting gold from its ore and soil [75]. Notably, owing to weak legislation, poor engagement, contribution of artisanal miners and easily accessible and robust black market for Hg usage in the artisanal and semi mechanized gold miming (ASGM) will continue to persist [76,77]. The high content of Hg identified in samples from this study is considered to be from anthropogenic sources; although, some of the measurements were performed in the core of the grains and as amalgam coatings on the grain exteriors.
The abundance of Hg within the lateritic horizon and not within lower stratigraphic horizons, in conjunction with an abundant source from mining operations, strongly suggests that this Hg has anthropogenic origins. However, naturally occurring Hg from the upper geochemical halo of orogenic deposits is well documented [61,62]. Furthermore, the presence of Hg alloys and Hg minerals within the interior of gold grains without clear internal migratory pathways can support the case for a natural source (e.g., [78]). The implications of natural Hg towards understanding ore deposit type, genesis and evolution warrant further investigation at this site. Future work with measurements of Hg isotopes may provide insights on the relative contributions of these two potential sources. Regardless of origin, the abundance of Hg in these deposits remains an environmental concern for both the health of miners and the regional ecosystem.

5.5. Implication to Gold Exploration in the Regolith

The exploration for gold in weathered and covered terrains commonly relies on sampling and analyzing in situ material [12]. A detailed characterization of the regolith is required in order to better comprehend the physico-chemical changes along the profile and distinguish remobilized material from that developed in place [13,50,79,80]. The data presented in this study suggest that gold remained in the solid form during its dispersion, owing to its chemical stability. The results also show that the horizons with visible and recoverable gold grains also have high gold assay values, indicating the detrital nature of the particles. From the bulk geochemical data, the distribution of Au in all the horizons and the fact that the saprock and the saprolite horizons are enriched in gold, as well as the occurrence of quartz inclusions in the gold grains, these indicate quartz-vein-related hypogene mineralization within the granitic basement. It is also worth noting the usefulness of pathfinder elements such as Pb, Cu, As, Bi, Te and Ag as they may positively correlate with Au [81]. In the Batouri goldfield, Ag shows a strong positive correlation with Au and thus can be identified as the pathfinder element for gold in the area. Bulk assay data combined with gold microchemical features in regolith material deliver a potent exploration technique in tropical terrains.

6. Conclusions

The following conclusions can be drawn from this study:
  • Pits dug in the Batouri goldfield exposed an in situ profile comprising various layers from the bottom to top as follows: saprock layer, saprolite, mottled zone and the laterite layer. It is clear that the lateritic layer has been reworked. The saprock layer in PIT01 is characterized by quartz veins that show gold flakes.
  • The soil samples define a single weathering array corresponding to intermediate weathering evolving towards the kaolinitic end.
  • Regolith evolution involved the development of laterite with elevated Fe content and enriched in Au-As-Ba-Ce-Cu-Pb-Rb-Sr-Y-Zn, pointing to inputs from the felsic basement, while Cr-V are related to mafic lithologies. High concentrations of chemically unstable Ba in the weathering blanket (e.g., PIT01) also affirm the proximity to the primary source.
  • Gold grains show surface features that attest to their derivation from proximal sources. They are associated with inclusions of gangue minerals such as quartz, silicates, zircon and ilmenite inferred to be inherited from the underlying granitic basement rock.
  • All horizons identified show the presence of gold; however, the concentration varies from top to bottom in a non-systematic manner. Gold essentially survived the rigors of the weathering cycle in the particulate form as explained by the 3 ppm Au in the saprock and 100 ppm Au in the saprolite. All the soil layers should therefore be taken into account during succinct regolith exploration efforts in this area.
  • The gold grains are not authigenic in origin, and the concentration of Au is uniform along the core, solution fissures and rims, while that of Ag increases towards the core. These grains are alloyed with Ag and define a single compositional population similar to grains from the bedrock.
  • Gold grains from the lateritic horizon show a Au-Ag-Hg assemblage. The Hg high is identified for the first time in the Batouri goldfield. Such elevated contents of Hg indicate modification due to human activities especially with the use of hazardous Hg-based products in the gold extraction process.

Author Contributions

Conceptualization, C.E.S.; Data curation, F.C.V.; Funding acquisition, C.E.S., E.B.M. and E.M.S.; Field Investigation, A.V., R.B.N., B.O.O., T.C.N. and S.G.S.; Methodology, A.V., C.E.S. and E.B.M.; Resources, C.E.S.; Supervision, C.E.S.; Validation, C.E.S. and E.B.M.; Writing—original draft, A.V.; Writing—review and editing, A.V., C.E.S., R.B.N., E.B.M., E.M.S., B.O.O., T.C.N., F.C.V. and S.G.S. All authors have read and agreed to the published version of the manuscript.

Funding

Research Modernization Allowance scheme of the Ministry of Higher Education, Cameroon.

Data Availability Statement

The data presented in this study are available in the article. Additional data are not available.

Acknowledgments

A.V. and C.E.S. acknowledge support from the Cameroon Government through the Research Modernization Allowance scheme of the Ministry of Higher Education that enabled them to fund the M.Sc. dissertation of S.G.S., whose data form part of this contribution. C.E.S., E.M.S. and E.B.M. acknowledge the collaboration framework through which some of the data reported here were acquired. Comprehensive reviews by three anonymous reviewers contributed immensely to the improvement of this contribution.

Conflicts of Interest

The authors declare no conflicts of interest.

References

  1. Orji, O.U.; Ibiam, U.A.; Awoke, J.N.; Obasi, O.D.; Uraku, A.J.; Alum, E.U.; Eze, A.G. Assessment of levels and health risks of trace metals in soils and food crops cultivated on farm lands near enyigba mining sites, Ebonyi state, Nigeria. J. Food Protect. 2021, 84, 1288–1294. [Google Scholar] [CrossRef] [PubMed]
  2. Elvine Paternie, E.D.; Hakkou, R.; Ekengele Nga, L.; Bitom Oyono, L.D.; Ekoa Bessa, A.Z.; Oubaha, S.; Khalil, A. Geochemistry and geostatistics for the assessment of trace elements contamination in soil and stream sediments in abandoned artisanal small-scale gold mining (Bétaré-Oya, Cameroon). Appl. Geochem. 2023, 150, 105592. [Google Scholar] [CrossRef]
  3. Bailey, A.S.; Jamieson, H.E.; Radkova, A.B. Geochemical characterization of dust from arsenic-bearing tailings, Giant Mine, Canada. Appl. Geochem. 2021, 135, 105119. [Google Scholar] [CrossRef]
  4. Reyes, A.; Cuevas, J.; Fuentes, B.; Fernandez, E.; Arce, W.; Guerrero, M.; Letelier, M.V. Distribution of potentially toxic elements in soils surrounding abandoned mining waste located in Taltal, Northern Chile. J. Geochem. Explor. 2021, 220, 106653. [Google Scholar] [CrossRef]
  5. Falconer, D.M.; Craw, D.; Youngson, J.H.; Faure, K. Gold and sulphide minerals in tertiary quartz pebble conglomerate gold placers, Southland, New Zealand. Ore Geol. Rev. 2006, 28, 525–545. [Google Scholar] [CrossRef]
  6. Svetlitskaya, T.V.; Nevolko, P.A.; Kolpakov, V.V.; Tolstykh, N.D. Native gold from the Inagli Pt–Au placer deposit (the Aldan Shield, Russia): Geochemical characteristics and implications for possible bedrock sources. Miner. Depos. 2018, 53, 323–338. [Google Scholar] [CrossRef]
  7. Gazel, J.; Gérard, G. Carte Géologique de Reconnaissance du Cameroun au 1/500,000, Feuille Batouri-Est avec Notice Explicative; Mémoire Direction des Mines et de la Géologie, Yaoundé, Cameroon; Science and Education Publishing: Newark, DE, USA, 1954. [Google Scholar]
  8. Vishiti, A.; Etame, J.; Suh, C.E. Features of gold-bearing quartz veins in an artisanal mining dominated terrain, Batouri Gold District, Eastern region of Cameroon. Episodes 2019, 42, 199–212. [Google Scholar] [CrossRef]
  9. Tata, E.; Suh, C.E.; Vishiti, A.; Shemang, E.M.; Fon, A.N.; Ateh, K.I.; Chombong, N.N. Wallrock alteration categories and theirgeochemical signatures in gold-bearing Neoproterozoic granitoids, Batouri Gold District, southeastern Cameroon. Geochem. Explor. Environ. Anal. 2019, 19, 269–288. [Google Scholar] [CrossRef]
  10. Asaah, A.V.; Zoheir, B.; Lehmann, B.; Frei, D.; Burgess, R.; Suh, C.E. Geochemistry and geochronology of the ~620 Magold-associated Batouri granitoids, Cameroon. Inter. Geol. Rev. 2015, 57, 1485–1509. [Google Scholar] [CrossRef]
  11. Anand, R.R.; Hough, R.M.; Salama, W.; Aspandiar, M.F.; Butt, C.R.M.; Gonzalez-Alvarez, I.; Metelka, V. Gold and pathfinder elements in ferricrete gold deposits of the Yilgarn Craton of Western Australia: A review with new concepts. Ore Geol. Rev. 2019, 104, 294–355. [Google Scholar] [CrossRef]
  12. Combes, V.; Teitler, Y.; Eglinger, A.; André-Mayer, A.-S.; Heuret, A.; Pochon, A.; Cathelineau, M.; Gibert, P. Diversity of supergene gold expressions and implications for gold targeting in an equatorial regolith (AMG’s Couriège Exploration Prospect, French Guiana). The Geological Society of London Recent Advances in Understanding Gold Deposits: From Orogeny to Alluvium. Geol. Soc. Lond. Spec. Publ. 2022, 516, SP516-2021-40. [Google Scholar]
  13. Vishiti, A.; Suh, C.E.; Lehmann, B.; Egbe, J.A.; Shemang, E.M. Gold grade variation and particle microchemistry in exploration pits of the Batouri Gold District, SE Cameroon. J. Afr. Earth Sci. 2015, 111, 1–13. [Google Scholar] [CrossRef]
  14. Etutu, M.E.M.; Mafany, G.T.; Suh, C.E. Application of multi-element soil geochemistry and particulate gold exploration in the Kambele plain, Batouri Gold District, Southeast Cameroon. In Recent Research on Geomorphology, Sedimentology, Marine Geosciences and Geochemistry, Advances in Science, Technology & Innovation; Springer: Cham, Switzerland, 2022. [Google Scholar]
  15. Craw, D.; Kerr, G. Geochemistry and mineralogy of contrasting supergene gold alteration zones, southern New Zealand. J. Appl. Geochem. 2017, 5, 19–34. [Google Scholar] [CrossRef]
  16. Bamba, O.; Parisot, J.C.; Grandin, G.; Beauvais, G. Ferricrete genesis and supergene gold behavior in Burkina Faso, West Africa. Geochem. Explor. Environ. Anal. 2002, 2, 3–14. [Google Scholar] [CrossRef]
  17. Larizzatti, H.; Oliveria, S.M.B.; Butt, C.R.M. Morphology and composition of gold in a lateritic profile, Fazenda Pison Garimpo, Amazon, Brazil. J. South Am. Earth Sci. 2008, 25, 359–376. [Google Scholar] [CrossRef]
  18. Falconer, D.M.; Craw, D. Supergene gold mobility: A textural and geochemical study from gold placers in southern New Zealand. Econ. Geol. Spec. Publ. 2009, 14, 77–93. [Google Scholar]
  19. Suh, C.E.; Lehmann, B. Morphology and electron-probe micro analysis of residual gold-grains at Dimako, southeast Cameroon. Neues Jahrb. Für Mineral. Monatshefte 2003, 6, 225–275. [Google Scholar]
  20. Freyssinet, P.H.; Butt, C.R.M.; Morris, R.C.; Piantone, P. Ore-forming processes related to lateritic weathering. In Economic Geology 100th Anniversary Volume; Hedenquist, J.W., Thomson, J.F.H., Goldfarb, R.J., Richards, J.P., Eds.; Society of Economic Geologists Inc.: Littleton, CO, USA, 2005; pp. 681–722. [Google Scholar]
  21. Zotov, A.; Kuzmin, N.; Reukov, V.; Tagirov, B. Stability of AuCl2—From 25 to 1000 °C at pressures to 5000 bar and consequences for hydrothermal gold mobilization. Minerals 2018, 8, 286. [Google Scholar] [CrossRef]
  22. Reis, A.P.; Silva, E.F.; Sousa, A.J.; Patinha, C.; Martins, E.; Guimaraes, C.; Azevedo, M.R.; Nogueira, P. Geochemical associations and their spatial patterns of variation in soil tungsten deposit: A pilot analysis data from the Marrancos gold. Geochem. Explor. Environ. Anal. 2009, 9, 319–340. [Google Scholar] [CrossRef]
  23. Shuster, J.; Reith, F.; Cornelis, G.; Parsons, J.E.; Parsons, J.M.; Southam, G. Secondary gold structures: Relics of past biogeochemical transformations and implications for colloidal gold dispersion in sub tropical environments. Chem. Geol. 2017, 450, 154–164. [Google Scholar] [CrossRef]
  24. Toteu, S.F.; Penaye, J.; Djomani, Y.P. Geodynamic evolution of the Pan-African belt in central Africa with special reference toCameroon. Can. J. Earth Sci. 2004, 41, 73–85. [Google Scholar] [CrossRef]
  25. Van Schmus, W.R.; Oliveira, E.P.; Da Silva Filho, A.F.; Toteu, S.F.; Penaye, J.; Guimaraes, I.P. Proterozoic links between the Borborema Province, NE Brazil, and the Central African Fold Belt. Geol. Soc. Lond. Spec. Publ. 2008, 294, 69–99. [Google Scholar] [CrossRef]
  26. Toteu, S.F.; Van Schmus, R.W.; Penaye, J.; Michard, A. New U-Pb and Sm-Nd data from north central Cameroon and its bearing on the Pre-Pan-African history of Central Africa. Precambrian Res. 2001, 108, 45–73. [Google Scholar] [CrossRef]
  27. Milesi, J.P.; Toteu, S.F.; Deschamps, Y.; Feybesse, J.L.; Lerouge, C.; Cocherie, A.; Penaye, J.; Tchameni, R.; Moloto-A-Kenguemb, G.; Kampunzu, H.A.B.; et al. An overview of the geology and major ore deposits of Central Africa: Explanatory note for the 1:4,000,000 map “geology and major ore deposits of Central Africa”. J. Afr. Earth Sci. 2006, 44, 571–595. [Google Scholar] [CrossRef]
  28. Njiekak, G.; Dorr, W.; Tchouankoue, J.-P.; Zulauf, G. U–Pb zircon and microfabric data of (meta) granitoids of western Cameroon: Constraints on the timing of pluton emplacement and deformation in the Pan-African belt of central Africa. Lithos 2008, 102, 460–477. [Google Scholar] [CrossRef]
  29. Tchameni, R.; Pouclet, A.; Penaye, J.; Ganwa, A.A.; Toteu, S.F. Petrography and geochemistry of the Ngaoundéré Pan-African granitoids in Central North Cameroon: Implications for their sources and geological setting. J. Afr. Earth Sci. 2006, 44, 511–529. [Google Scholar] [CrossRef]
  30. Ateh, K.I.; Suh, C.E.; Shemang, E.M.; Vishiti, A.; Tata, E.; Chombong, N.N. New LA-ICP MS U-Pb Ages, Lu-Hf Systematics and REE Characterization of Zircons from a Granitic Pluton in the Betare Oya Gold District, SE Cameroon. J. Geosci. Geomat. 2017, 5, 267–283. [Google Scholar]
  31. Ngatcha, R.B.; Okunlola, O.A.; Suh, C.E.; Ateh, K.I.; Hofmann, A. Petrochemical characterization of Neoproterozoic Colomine granitoids, SE Cameroon: Implications for gold mineralization. Lithos 2019, 344–345, 175–192. [Google Scholar] [CrossRef]
  32. Ganwa, A.A.; Siebel, W.; Frisch, W.; Shang, K.C.; Ekodeck, E.G. Geochemistry and geochronology of the Meiganga metadiorite: Implication on the timing of D2 deformational phase in Adamawa-Yade Domain in Cameroon. Int. J. Biol. Chem. Sci. 2011, 5, 1754–1767. [Google Scholar] [CrossRef]
  33. Tchakounte, J.N.; Eglinger, A.; Toteu, S.F.; Zeh, A.; Nkoumbou, C.; Mvondo-Ondoa, J.; Penaye, J.; Wit, M.; Barbey, P. The Adamawa-Yade domain, a piece of Archaean crust in the Neoproterozoic Central African Orogenic belt (Bafia area, Cameroon). Precambrian Res. 2017, 299, 210–229. [Google Scholar] [CrossRef]
  34. Ngatcha, R.B.; Suh, C.E.; Okunlola, O.A.; Nunoo, S.; Ateh, K.I.; Elburg, M.; Hofmann, A. Crustal modeling from Pan-African granites of the Colomine Gold District, SE Cameroon: Insights from zircon U-Pb dating and Lu-Hf isotope systematic. J. Afr. Earth Sci. 2022, 187, 104441. [Google Scholar] [CrossRef]
  35. Suh, C.E.; Lehmann, B.; Mafany, G.T. Geology and geochemical aspects of lode gold mineralization at Dimako-Mboscorro, SE Cameroon. Geochem. Explor. Environ. Anal. 2006, 6, 295–309. [Google Scholar] [CrossRef]
  36. Asaah, A.V. Lode Gold Mineralization in the Neoproterozoic Granitoids of Batouri. Ph.D. Dissertation, Southeastern Cameroon, Technische Universität Clausthal, Clausthal-Zellerfeld, Germany, 2010; 187p. [Google Scholar]
  37. Ndonfack, K.I.A.; Xie, Y.; Zhong, R.; Yomeun, B.S.; Cui, K.; Shan, X. Tectonic evolution of Neoproterozoic rocks, eastern Cameroon: Implication for gold mineralization in the Bétaré Oya and Woumbou-Colomine-Kette districts. Precambrian Res. 2022, 368, 106475. [Google Scholar] [CrossRef]
  38. Tchameni, R.; Doumnang, J.C.; Deudibaye, M.; Branquet, Y. On the occurrence of gold mineralization in the Pala Neoproterozoic formations, South-Western Chad. J. Afr. Earth Sci. 2013, 84, 36–46. [Google Scholar] [CrossRef]
  39. Large, R.R.; Allen, R.L.; Blake, M.D.; Herrmann, W. Hydrothermal alteration and volatile element halos for the Rosebery Klens volcanic-hosted massive sulfide deposit, western Tasmania. Econ. Geol. 2001, 96, 1055–1072. [Google Scholar] [CrossRef]
  40. Salvi, S.; Amponsah, P.O.; Siebenaller, L.; Béziat, D.; Baratoux, L.; Jessell, M. Shear related gold mineralization in Northwest Ghana: The Julie deposit. Ore Geol. Rev. 2016, 78, 712–717. [Google Scholar] [CrossRef]
  41. ElMonsef, M.A.; Slobodník, M.; Salem, I.A. Hydrothermal evolution of granitoid hosted gold mineralization in gidami area: An example for orogenic-gold deposits in Egypt. J. Afr. Earth Sci. 2018, 146, 132–149. [Google Scholar]
  42. Frimmel, H.E. Earth’s continental crustal gold endowment. Earth Plan. Sci. Lett. 2008, 267, 45–55. [Google Scholar] [CrossRef]
  43. Lipson, R. The promise and perils of porphyry deposits in the future of gold production. SEG Discov. 2014, 98, 1–21. [Google Scholar] [CrossRef]
  44. Melchiorre, E.B.; Henderson, J. Topographic gradients and lode gold sourcing recorded by placer gold morphology, geochemistry, and mineral inclusions in the east fork San Gabriel River, California, USA. Ore Geol. Rev. 2019, 109, 348–357. [Google Scholar] [CrossRef]
  45. Hallbaer, D.K.; Utter, T. Geochemical and morphological characteristics of gold particles from recent river deposits and the fossil placer of the Witwatersrand. Miner. Depos. 1977, 12, 293–306. [Google Scholar] [CrossRef]
  46. Nesbitt, H.W.; Young, G.M. Formation and diagenesis of weathering profiles. J. Geol. 1989, 97, 129–147. [Google Scholar] [CrossRef]
  47. MacLean, W.H.; Kranidiotis, P. Immobile elements as monitors of mass transfer in hydrothermal alteration: Phelps Dodge massive sulfide deposit, Matagami, Quebec. Econ. Geol. 1987, 82, 951–962. [Google Scholar] [CrossRef]
  48. Grant, J.A. Isocon analysis: A brief review of the method and applications. Phys. Chem. Earth Parts A/B/C 2005, 30, 997–1004. [Google Scholar] [CrossRef]
  49. Rollinson, H.R. Using Geochemical Data: Evaluation, Presentation, Interpretation; Routledge: London, UK, 2014. [Google Scholar]
  50. Fon, A.N.; Suh, C.E.; Vishiti, A.; Ngatcha, R.B.; Ngang, T.C.; Shemang, E.M.; Egbe, J.A.; Lehmann, B. Gold dispersion in tropical weathering profiles at the Belikombone gold anomaly(Bétaré Oya gold district), east Cameroon. Geochemistry 2021, 81, 125770. [Google Scholar] [CrossRef]
  51. Melchiorre, E.B.; Orwin, P.M.; Reith, F.; Rea, M.A.D.; Yahn, J.; Allison, R. Biological and geochemical development of placergold deposits at Rich Hill, Arizona, USA. Minerals 2018, 8, 56. [Google Scholar] [CrossRef]
  52. Ghosh, S.; Guchhait, S. Characterization and evolution of primary and secondary laterites in north western Bengal Basin, West Bengal, India. J. Palaeogeogr. 2015, 4, 203–230. [Google Scholar] [CrossRef]
  53. Nzabakurikiza, A.; Onana, V.L.; ZeA, N.; Mvindi, A.T.Z.; Ekodeck, G.E. Geological, geotechnical, and mechanical characterization of lateritic gravels from Eastern Cameroon for road construction purposes. Bull. Eng. Geol. Environ. 2016, 76, 1549–1562. [Google Scholar] [CrossRef]
  54. Doum, J.M.; Fuh, G.C.; Fadil-Djenabou, S.; Onana, V.L.; Ndjigui, P.D.; Armstrong-Altrin, J.S. Characterization and potential application of gley sols and feral sols for ceramic industry: A case study from Dimako (Eastern Cameroon). Arab. J. Geosci. 2020, 13, 1074. [Google Scholar] [CrossRef]
  55. Dongmo, F.W.N.; Chapman, R.J.; Bolarinwa, A.T.; Yongue, R.F.; Banks, D.A.; Olajide-Kayodea, J.O. Microchemical characterization of placer gold grains from the Meyos Essabikoula area, Ntem complex, southern Cameroon. J. Afr. Earth Sci. 2019, 151, 189–201. [Google Scholar] [CrossRef]
  56. Moles, N.R.; Chapman, R.J. Integration of detrital gold microchemistry, heavy mineral distribution, and sediment geochemistry to clarify regional metallogeny in glaciated terrains: Application in the Caledonides of southeast Ireland. Econ. Geol. 2019, 114, 207–232. [Google Scholar] [CrossRef]
  57. Webster, J.G.; Mann, A.W. The influence of climate, geomorphology and primary geology on the supergene migration of gold and silver. J. Geochem. Explor. 1984, 22, 21–42. [Google Scholar] [CrossRef]
  58. Butt, C.R.M. The development of regolith exploration geochemistry in the tropics and sub-tropics. Ore Geol. Rev. 2015, 73, 380–393. [Google Scholar] [CrossRef]
  59. Freyssinet, P. Gold dispersion related to ferricrete pedogenesis in South Mali: Application to geochemical exploration. Chron. Miner. Res. Explor. 1993, 510, 25–40. [Google Scholar]
  60. Reith, F.; Fairbrother, L.; Nolze, G.; Wilhelmi, O.; Clode, P.L.; Gregg, A.; Parsons, J.E.; Wakelin, S.A.; Pring, A.; Hough, R.; et al. Nano particle factories: Biofilms hold key to gold dispersion and nugget formation. Geology 2010, 38, 843–846. [Google Scholar] [CrossRef]
  61. Chapman, R.J.; Leake, R.C.; Moles, N.R.; Earls, G.; Cooper, C.; Harrington, K.; Berzins, R. The application of microchemical analysis of gold grains to the understanding of complex local and regional gold mineralization: A case study in Ireland and Scotland. Econ. Geol. 2000, 95, 1753–1773. [Google Scholar]
  62. Chapman, R.J.; Leake, R.C.; Moles, N.R. The use of microchemical analysis of alluvial gold grains in mineral exploration: Experiences in Britain and Ireland. J. Geochem. Explor. 2000, 71, 241–268. [Google Scholar] [CrossRef]
  63. Townley, B.K.; Hérail, G.; Maksaev, V.; Palacios, C.; de Parseval, P.; Sepulveda, F.; Orellana, R.; Rivas, P.; Ulloa, C. Gold grain morphology and composition as an exploration tool: Application to gold exploration in covered areas. Geochem. Explor. Environ. Anal. 2003, 3, 29–38. [Google Scholar] [CrossRef]
  64. Chapman, R.J.; Moles, N.R.; Bluemel, B.; Walshaw, R.D. Detrital gold as an indicator mineral. In Recent Advances in Understanding Gold Deposits: From Orogeny to Alluvium; Torvela, T., Lambert-Smith, J.S., Chapman, R.J., Eds.; Geological Society, London, Special Publications; Geological Society of London: London, UK, 2022; p. 516. [Google Scholar]
  65. Chapman, R.J.; Mortensen, J.K.; Allan, M.M.; Walshaw, R.D.; Bond, J.; MacWilliam, K.A. New approach to characterizing deposit type using mineral inclusion assemblages in gold particles. Econ. Geol. 2022, 117, 361–381. [Google Scholar] [CrossRef]
  66. Chapman, R.J.; Mortensen, J.K. Application of microchemical characterization of placer gold grains to exploration for epithermal gold mineralization in regions of poor exposure. J. Geochem. Explor. 2006, 91, 1–26. [Google Scholar] [CrossRef]
  67. Moles, N.R.; Chapman, R.J.; Warner, R.B. The significance of copper concentrations in natural gold alloy for reconnaissance exploration and understanding gold-depositing hydrothermal systems. Geochem. Explor. Environ. Anal. 2013, 13, 115–130. [Google Scholar] [CrossRef]
  68. Leal, S.; Lima, A.; Noronha, F. Characterization of heavy mineral concentrates and detrital gold particles from the Bigorne granite-hosted gold deposit in the Iberian Variscan Belt. Geol. Soc. Lond. Spec. Publ. 2021, 516, 202–217. [Google Scholar] [CrossRef]
  69. Grant, A.H.; Lavin, O.P.; Nicol, I. The morphology and chemistry of transported grains as an exploration tool. J. Geochem. Explor. 1991, 40, 73–94. [Google Scholar] [CrossRef]
  70. Dubé, B.; Gosselin, P. Greenstone-hosted quartz carbonate vein deposits. In Mineral Deposits of Canada: A Synthesis of Major Deposit-Types, District Metallogeny, the Evolution of Geological Provinces, and Exploration Methods; Good fellow, W.D., Ed.; Geological Association of Canada, Mineral Deposits Division, Special Publication; Geological Association of Canada: St. John’s, NL, Canada, 2007; Volume 5, pp. 49–73. [Google Scholar]
  71. Lange, I.M.; Gignoux, T. Distribution, characteristics, and genesis of high fineness gold placers, Nine mile Valley, Central-Western Montana. Econ. Geol. 1999, 94, 375–386. [Google Scholar] [CrossRef]
  72. Goldfarb, R.J.; Pitcairn, I. Orogenic gold: Is a genetic association with magmatism realistic? Miner. Depost. 2023, 58, 5–35. [Google Scholar] [CrossRef]
  73. Elisabeth Sylvie, N.M.; Ekoa Bessa, A.Z.; Ayissi Mbomo, R.E.; Akono, J.V.; Dairou, B.; Pierre, K. Evaluation of surface water contamination and its impacts on health in the mining districts of Kambélé and Bétaré-Oya (Eastern-Cameroon). Heliyon 2024, 10, 29189. [Google Scholar] [CrossRef] [PubMed]
  74. Hylander, L.D.; Meili, M. 500 years of mercury production: Global annual inventory by region until 2000 and associate demissions. Sci. Total Environ. 2003, 304, 13–27. [Google Scholar] [CrossRef]
  75. UNEP Reducing Mercury Use in Artisanal and Small Scale; United Nations Environmental Program, United Nations: New York, NY, USA, 2012; p. 76.
  76. Sousa, R.; Veiga, V.; Zyl, V.D.; Telmer, K.; Spiegel, S.; Selder, J. Policies and regulations for Brazil’s artisanal gold mining sector: Analysis and recommendations. J. Clean Prod. 2011, 19, 742–750. [Google Scholar] [CrossRef]
  77. Clifford, M.J. Future strategies for tackling mercury pollution in artisanal gold mining sector: Making the Minamata convention work. Futures 2014, 62, 106–112. [Google Scholar] [CrossRef]
  78. Melchiorre, E.B.; Mathur, R.; Kamenov, G.; Paredes, J. Geochemical Overprinting and Secondary Placer Crystal Formation in the La Cholla District, Quartzsite, Arizona, USA: Evidence from Copper Isotopes, Morphology, and Trace Elements. Minerals 2023, 13, 1444. [Google Scholar] [CrossRef]
  79. Butt, C.R.M.; Lintern, M.; Anand, R.R. Evolution of regoliths and landscapes in deeply weathered terrain—Implications for geochemical exploration. Ore Geol. Rev. 2000, 16, 167–183. [Google Scholar] [CrossRef]
  80. Sawadogo, B.; Bamba, O.; Chardon, D. Landform-regolith mapping in the West African context. Ore Geol. Rev. 2020, 126, 103782. [Google Scholar] [CrossRef]
  81. Sunkari, E.D.; Appiah-Twum, M.; Lermi, A. Spatial distribution and trace element geochemistry of laterites in Kunche area: Implication for gold exploration targets in NW, Ghana. J. Afr. Earth Sci. 2019, 158, 103519. [Google Scholar] [CrossRef]
Figure 1. (a) Geological map of Cameroon (modified after [10,26]). The Central Cameroon Shear Zone (CCSZ) is defined by a system of NE trending faults comprising Tchollire-Banyo Fault (TBF), Adamawa Fault (AF), Sanaga Fault (SF) and Kribi-Campo Fault (KCF). (b) Regional geological map of south eastern Cameroon showing artisanal gold mining sites and other reported gold indications (modified after [27]). (c) Geology of the Batouri goldfield. The area is characterized by a predominant NE-SW trending shear zone. It is composed predominantly of Pan African granitoids and has a thick lateritic cover. CC = Congo Craton, YD = Yaoundé Domain, NWC = North West Cameroon Domain. Granitoid drill core samples [9], pit location [13], gold occurrence and artisanal gold mining site [10], Mama vein system [8].
Minerals 14 00567 g001
Figure 2. (a,b) Satellite image of the Batouri goldfield indicating the position of the pits sampled. The area is highly deforested, and the color of surface water is now pale yellow.
Minerals 14 00567 g002
Figure 3. (a) Map of the Batouri area showing a dendritic drainage pattern and artisanal mining sites. (b) Map of the study area showing the position of studied pits. Gold occurrence [10].
Minerals 14 00567 g003
Figure 4. (ac) Exploration and mining pits in the Batouri goldfield. (d) Channel sampling method along the pit wall. (e) Procedure of measuring the thickness of the mottled zone.
Minerals 14 00567 g004
Figure 5. Soil horizons exposed within the three studied exploration pits in the eastern Batouri goldfield. The vertical scale represents depths in meters. From the top to the bottom, the profiles vary from the lateritic layer through the mottled zone, the saprolite and the saprock layers. Note that the size of the coin used for scale in the photograph is 24 mm. (a) Profile of pit 1, (b) Profile of pit 2, (c) Profile of pit 3.
Minerals 14 00567 g005
Figure 6. Ternary A-CN-K diagram used as a proxy to the alteration state of the regolith in the Batouri area. The regolith goes from a weak weathering state to an intermediate weathering state towards a theoretical kaolinite pole (Al2O3). Note that the samples investigated reveal a weathering trend that follows the A-K line.
Minerals 14 00567 g006
Figure 7. Histograms showing the gain/loss of major oxides and trace elements in the different layers of the pits dug in the Batouri goldfield [47]. Calculations are based on the immobile element method with TiO2 as the least mobile element. The average concentration of major oxides and trace elements of the three pits were used. (ad) represent the major element data for the layers, while (a-1d-1) represent their trace element counterparts.
Minerals 14 00567 g007
Figure 8. Isocon diagrams [48] of the Batouri weathering blanket. The concentrations of major elements are in wt.% (oxides) and ppm (trace elements) and scaled to fit on the plot. The dashed lines = constant mass reference. Isocon diagram shows the average composition of protolith against the average composition of the regolith.
Minerals 14 00567 g008
Figure 9. Profiles exposed in the Batouri goldfield, indicating the variation of Au concentration with depth. Note that the saprolite layer of PIT01 and PIT03 reveal a gold high of 100 ppm.
Minerals 14 00567 g009
Figure 10. Scanning Electron Microscope (SEM) images (ag) and Backscattered Electron (BSE) images (il) of gold grains from the saprock and saprolite layers indicating their morphology and surface features. (ag) Gold grains from the saprock are generally crystalline to angular in shape and are greater than 20 µm in size. Notice the ridges, channels and Fe-Mn-O coatings on the grains. The brighter areas on the surface of the gold grains indicate areas where the iron-manganese-oxide coating has flaked. (h) Inclusions of ilmenite and zircon in gold grains from the saprock. (il) Gold grains from the saprolite layer are generally irregular; although, elongated and sub-rounded grains are present. They are characterized by pitted surfaces and vary in size from nano-particles to 200 µm. Abbreviations: Au = gold, Zr = zircon, Fe-Mn oxide = iron manganese oxide.
Minerals 14 00567 g010
Figure 11. Scanning electron microscope (SEM) and backscattered electron (BSE) images of gold grains from the saprock, saprolite and lateritic layers of the Batouri goldfield. The composition of the respective gold grains and associated inclusion entombed in them is also presented. Gold grains from the saprolite and lateritic horizons are zoned and show characteristic pitted surfaces. The gold grains are alloyed mainly with Ag; although, a few analyses have identified Cu. Grains from the lateritic horizon show Hg with concentrations as high as 31 wt.%. (a) Representative gold grain from the saprock layer. (bd) Representative gold grains from the laterite horizon. (e,f) Representative gold grains from the saprolite horizon.
Minerals 14 00567 g011
Figure 12. Energy-dispersive spectroscopy (EDS), scanning electron microscope (SEM) map and backscattered electron (BSE) images of gold grains from the saprock layer in PIT01 (ac), saprolite layers (d,e,h) in PIT03, (f,g) laterite layer in PIT03 of the Batouri goldfield showing the typical alloy composition. (a) Au-Ag-Cu alloy. (b) Mn-O-Au. (c) Au-Ag-Mn-Fe-Si-Al-Cu. (d) Au-Ag-Cu alloy. (e) Au-Ag alloy. (f) Au-Ag-Cu alloy. (g) Au-Ag-Hg alloy. (h) Au-Ag alloy.
Minerals 14 00567 g012
Figure 13. Energy-dispersive spectroscopy (EDS), scanning electron microscope (SEM) and backscattered electron (BSE) images of the polished sections of gold grains from the saprock and saprolite layers from the Batouri goldfield indicating coating material and inclusions in the gold grains. (a) C, Mn, O, Ba, Nb, W, Gd. (b) Fe, Ag, Al, Si, O. (c) Si, O, Ag. (d) Fe, O, Si, Al. (e) Si, Ti, O. (f) Fe, Al, Si, O. Grains 1, 5, 7 and 8 represents the gold grains analyzed and the numbers in them indicate analytical points.
Minerals 14 00567 g013
Figure 14. (a) Co-variance of Ag and Au for gold particles from the Batouri goldfield compared with primary gold grains from the eastern region and gold particles from Bigorne deposits [67]. Gold grains from Batouri are characterized by low Ag and high gold contents. (b) Variation in the concentration of Ag and Cu in gold grains from the Batouri goldfield. Note a Cu content as high as 7.7 wt%. (c) Purity of the gold grains from the saprock and saprolite layers as represented by gold grain finesses in the cores and rims.
Minerals 14 00567 g014
Table 1. Geochemical composition of soil horizons from exploration pits in the Batouri goldfield.
SOIL
DLPIT01PIT02PIT03
LATMOTSAPSAPROCKLATMOTSAPLATMOTSAP
Elements
Al2O3wt%0.012.761.700.180.602.151.000.332.790.820.22
Fe2O30.0117.154.061.389.7110.041.960.328.972.9212.88
MgO0.010.010.02bdl0.030.020.01bdl0.01bdlbdl
CaO0.010.010.010.010.020.020.02bdl0.01bdlbdl
Na2O0.001<0.01<0.01<0.010.01bdl0.01bdlbdlbdl<0.01
K2O0.010.020.020.060.090.040.050.110.020.050.05
TiO20.0010.040.020.060.020.02<0.01bdl0.040.010.03
P2O50.0010.040.010.190.250.030.010.010.020.010.12
SO30.02bdlbdlbdlbdlbdlbdlbdlbdlbdlbdl
CIA 99988572979374999480
ppm
Au0.0002 <1<1>1003<11<1<1<1>100
Ag0.002<1<1531<1<1<1<1<185
As0.1194bdl100402196730253
Ba0.57101651511415227919
Be0.11<113<1<1<1<1<11
Bi0.02<1<1<1<1<1<1<1<1<1<1
B20bdlbdlbdlbdlbdlbdlbdlbdlbdlbdl
Co0.111142011<11<17
Cs0.02<1<1<1<1<1<1<11<1<1
Cr0.525023122513217310632112
Cu0.016893127171022622
Cd0.01bdlbdl<1<1<1bdlbdlbdlbdl<1
Ga0.12313bdl816712073
Ge0.1bdlbdlbdlbdlbdlbdlbdlbdlbdlbdl
Hf0.02<1<1<1bdl<1<1<11<1<1
Hg0.005<1<1410<1<1<1<1<13
In0.02<1<1<1<1<1<1bdl<1<1<1
Li0.1121112121<1
Mo0.0121<1221<1214
Mn110011069576294351310440242
Nb0.02<1<1bdl<1<1<1bdl<1<1bdl
Ni0.1333123214110
Pb0.0147221361573615815639
Pd0.01bdlbdlbdlbdlbdlbdlbdlbdlbdlbdl
Pt0.002bdlbdl<1bdlbdlbdlbdlbdlbdl<1
Rb0.13324754442
Re0.001bdlbdlbdlbdlbdlbdlbdlbdlbdlbdl
Sb0.02<1<112<1<1<1<1<12
Sc0.11381317105113412
Se0.11bdlbdl11bdlbdl<1<1bdl
Sn0.1221121<1213
Sr0.52328253213112
Ta0.05bdlbdlbdlbdlbdlbdlbdlbdlbdlbdl
Te0.02<1bdlbdl<1<1bdlbdl<1bdlbdl
Th0.1381362643121972113265
Tl0.02<1<11<1<1<1<1<1<1bdl
U0.1327621<1317
V1537883014525941523274227
W0.1<1bdlbdl31<1bdlbdlbdl1
Y0.013782593546422
Zn0.11010154662414515321
Zr0.12273114522493
La0.510382438196820415622261288
Ce0.170136>2000>20007582885767>2000
Abbreviations: LAT = laterite, MOT = mottled zone, SAP = saprolite, SAPROCK = saprock layer, DL = detection limit, bdl = below detection limit.
Table 2. Pearson’s linear correlation coefficient (r) matrix for gold and other elements from the weathering profile in the Batouri goldfield (elements with strong correlation to Au are marked in bold). The 0.5 threshold was used as a ‘marker’ for Au.
AuAgAsBaCeCoCrCuMoMnPbRbSbSrThVWZnZr
Au1.00
Ag0.971.00
As0.510.691.00
Ba0.440.28−0.021.00
Ce0.780.750.570.781.00
Co0.460.390.310.920.901.00
Cr−0.070.020.20−0.38−0.20−0.261.00
Cu0.000.080.540.230.360.440.041.00
Mo0.340.520.87−0.270.290.050.640.431.00
Mn0.490.370.180.970.870.98−0.250.34−0.051.00
Pb0.400.270.090.950.800.95−0.130.34−0.060.981.00
Rb−0.64−0.64−0.34−0.28−0.55−0.35−0.040.41−0.26−0.36−0.281.00
Sb0.530.570.690.670.920.89−0.050.600.460.800.77−0.371.00
Sr0.620.500.220.960.910.96−0.280.30−0.030.980.95−0.410.801.00
Th0.730.600.230.930.920.91−0.250.200.000.950.90−0.490.760.991.00
V−0.12−0.040.21−0.29−0.14−0.140.980.100.63−0.14−0.02−0.070.05−0.20−0.191.00
W−0.010.040.450.540.600.78−0.090.720.250.650.670.030.830.570.460.061.00
Zn0.640.44−0.090.900.720.75−0.280.06−0.260.850.83−0.320.480.900.92−0.260.201.00
Zr−0.39−0.37−0.18−0.50−0.57−0.520.74−0.060.26−0.44−0.370.20−0.47−0.50−0.490.71−0.38−0.351.00
Disclaimer/Publisher’s Note: The statements, opinions and data contained in all publications are solely those of the individual author(s) and contributor(s) and not of MDPI and/or the editor(s). MDPI and/or the editor(s) disclaim responsibility for any injury to people or property resulting from any ideas, methods, instructions or products referred to in the content.

